Lower Murrumbidgee Groundwater Sources Summary Report … · Lower Murrumbidgee Groundwater Sources...
15
Lower Murrumbidgee Groundwater Sources Summary Report 2006-2014 Water sharing plan The Lower Murrumbidgee groundwater sources have been managed under the Water Management Act 2000 (WMA2000) since the commencement of the Water Sharing Plan for the Lower Murrumbidgee Groundwater Sources 2003 (hereafter referred to as the Plan) on 1 st October 2006. The Plan sets the framework for managing these groundwater sources until the end of June 2017. A copy of the Plan can be viewed and downloaded from the NSW legislation website or from the following link: http://www.water.nsw.gov.au/Water-management/Water-sharing-plans/Plans-commenced/Water- source/Lower-Murrumbidgee-Groundwater-Sources Location and description of water sources The Lower Murrumbidgee groundwater sources includes all water contained in the Shepparton Formation, Calivil Formation and Renmark Group unconsolidated alluvial aquifers within the areas shown on Figure 1. The two groundwater sources referred to in the Plan are described below: • Lower Murrumbidgee Shallow Groundwater Source (hereafter the Shallow groundwater source). The groundwater source extends to a depth of 40 metres, or the bottom of the Shepparton Formation, whichever is the deeper. The Shepparton Formation, which is generally yellow and brown poorly sorted sand and clay sediments, extends to a depth of between 50 and 70 metres below the ground surface. • Lower Murrumbidgee Deep Groundwater Source (hereafter the Deep groundwater source). This groundwater source extends from the base of the Shallow groundwater source down to the bedrock. This is generally represented by the Calivil Formation and the Renmark Group, which are characterised by pale grey to white quartz sand layers with lenses of grey to white clay. It has a typical thickness of 100 to 300 metres. Access licences Four categories of groundwater access licenses are held in the Lower Murrumbidgee groundwater sources. These are: • local water utility access licences, • domestic and stock (sub category “stock”) access licences, • aquifer (sub category “town water supply”) access licences, • aquifer (sub category “community and education”) access licences, • aquifer access licences, and • supplementary water access licences. The Local Water Utility Licences are held by local governments for town water supply purposes. The share component of these and domestic and stock licences is for a specified volume of groundwater. The share components of aquifer access licences and supplementary water access licences are issued for a specified number of unit shares. These are summarised in Table 1.
-
Upload
nguyendiep -
Category
Documents
-
view
225 -
download
2
Transcript of Lower Murrumbidgee Groundwater Sources Summary Report … · Lower Murrumbidgee Groundwater Sources...

Lower Murrumbidgee Groundwater Sources Summary Report 2006-2014Water sharing plan The Lower Murrumbidgee groundwater sources have been managed under the Water Management Act 2000 (WMA2000) since the commencement of the Water Sharing Plan for the Lower Murrumbidgee Groundwater Sources 2003 (hereafter referred to as the Plan) on 1st October 2006. The Plan sets the framework for managing these groundwater sources until the end of June 2017.
A copy of the Plan can be viewed and downloaded from the NSW legislation website or from the following link:
http://www.water.nsw.gov.au/Water-management/Water-sharing-plans/Plans-commenced/Water-source/Lower-Murrumbidgee-Groundwater-Sources
Location and description of water sources The Lower Murrumbidgee groundwater sources includes all water contained in the Shepparton Formation, Calivil Formation and Renmark Group unconsolidated alluvial aquifers within the areas shown on Figure 1.
The two groundwater sources referred to in the Plan are described below:
• Lower Murrumbidgee Shallow Groundwater Source (hereafter the Shallow groundwater source). The groundwater source extends to a depth of 40 metres, or the bottom of the Shepparton Formation, whichever is the deeper. The Shepparton Formation, which is generally yellow and brown poorly sorted sand and clay sediments, extends to a depth of between 50 and 70 metres below the ground surface.
• Lower Murrumbidgee Deep Groundwater Source (hereafter the Deep groundwater source). This groundwater source extends from the base of the Shallow groundwater source down to the bedrock. This is generally represented by the Calivil Formation and the Renmark Group, which are characterised by pale grey to white quartz sand layers with lenses of grey to white clay. It has a typical thickness of 100 to 300 metres.
Access licences Four categories of groundwater access licenses are held in the Lower Murrumbidgee groundwater sources. These are: • local water utility access licences, • domestic and stock (sub category “stock”) access licences, • aquifer (sub category “town water supply”) access licences, • aquifer (sub category “community and education”) access licences, • aquifer access licences, and • supplementary water access licences. The Local Water Utility Licences are held by local governments for town water supply purposes. The share component of these and domestic and stock licences is for a specified volume of groundwater. The share components of aquifer access licences and supplementary water access licences are issued for a specified number of unit shares. These are summarised in Table 1.

Lower Murrumbidgee Groundwater Sources Summary Report 2006-2014
2 NSW Office of Water, March 2015
Figure 1 Map of the Lower Murrumbidgee groundwater sources
Lower Murrumbidgee Groundwater Sources Summary Report 2006-2014
3 NSW Office of Water, March 2015
Table 1 Total share component of existing access licences
Shallow Source Deep Source
Local Water Utility Access Licences (ML) 0 2,210
Domestic and Stock Access Licences (ML) 0 324
Aquifer Access Licences (shares) Community and Education Licences 0 23
Town Water Supply Licences 0 20
Aquifer Access Licences 5,201 267,777
Supplementary Water Access Licences (shares) 0 41,196
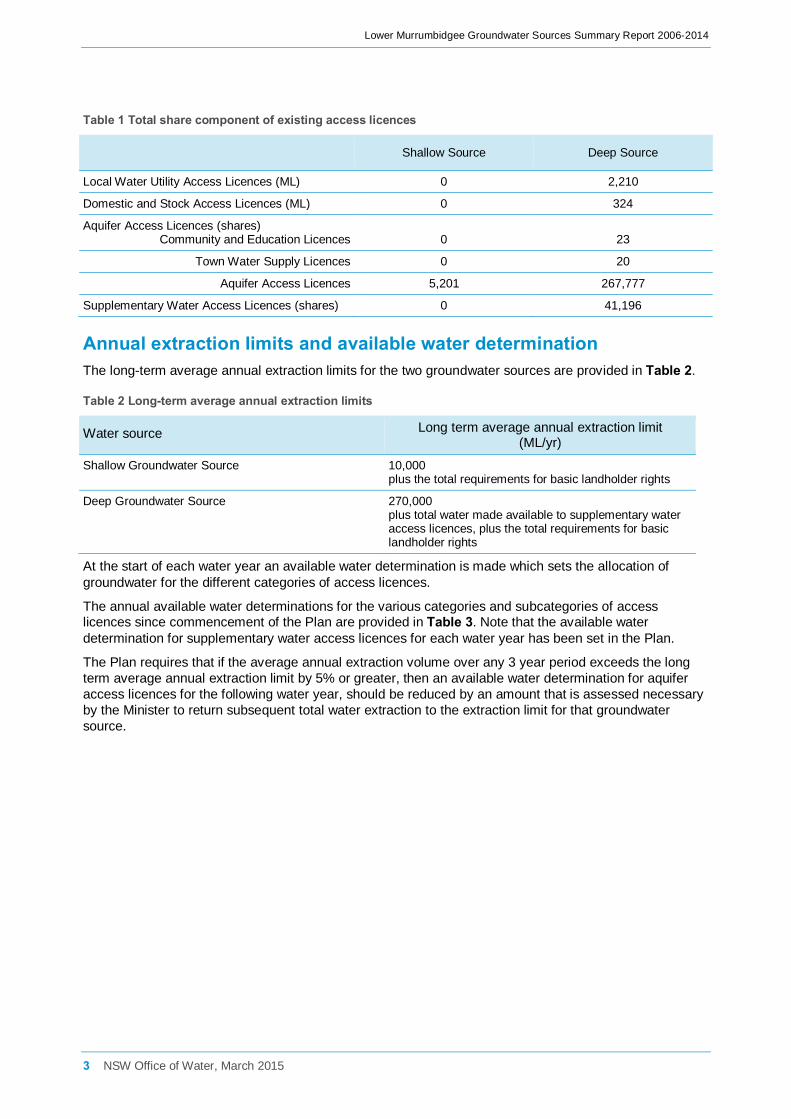
Annual extraction limits and available water determination The long-term average annual extraction limits for the two groundwater sources are provided in Table 2.
Table 2 Long-term average annual extraction limits
Water source Long term average annual extraction limit (ML/yr)
Shallow Groundwater Source 10,000 plus the total requirements for basic landholder rights
Deep Groundwater Source 270,000 plus total water made available to supplementary water access licences, plus the total requirements for basic landholder rights
At the start of each water year an available water determination is made which sets the allocation of groundwater for the different categories of access licences.
The annual available water determinations for the various categories and subcategories of access licences since commencement of the Plan are provided in Table 3. Note that the available water determination for supplementary water access licences for each water year has been set in the Plan.
The Plan requires that if the average annual extraction volume over any 3 year period exceeds the long term average annual extraction limit by 5% or greater, then an available water determination for aquifer access licences for the following water year, should be reduced by an amount that is assessed necessary by the Minister to return subsequent total water extraction to the extraction limit for that groundwater source.

Lower Murrumbidgee Groundwater Sources Summary Report 2006-2014
4 NSW Office of Water, March 2015
Table 3 Available water determinations for access licence categories
Year of Plan Water Year Deep Groundwater Source Shallow
Groundwater Source
Supplementary Water
(ML per unit share)
Aquifer (ML per unit
share)
Local Water Utility ( %)
Domestic & Stock
(%)
Aquifer (ML per unit
share)
1 2006-2007 0.9 1 100 100 1
2 2007-2008 0.8 1 100 100 1
3 2008-2009 0.7 1 100 100 1
4 2009-2010 0.6 1 100 100 1
5 2010-2011 0.5 1 100 100 1
6 2011-2012 0.4 1 100 100 1
7 2012-2013 0.3 1 100 100 1
8 2013-2014 0.2 1 100 100 1
9 2014-2015 0.1 1 100 100 1
Access licence account management rules The water sharing plan allows for accrual of unused allocation in aquifer access licence accounts. This includes the yearly allocations for the aquifer access licences made through available water determinations plus any carryover of unused allocation up to a maximum of 2 ML per unit of share component.
The maximum amount of water permitted to be debited from an account in any one water year (i.e. account take limit) cannot exceed 2 ML per unit share component plus any allocation transferred in, and minus any allocation transferred out. This means that metered extraction plus allocation transferred out cannot exceed twice the share component, unless allocation is transferred into the account.
Local water utility and domestic and stock access licences do not have any provisions for carryover.
Groundwater dealings (trades) Under the WMA 2000 dealings are permitted in access licences, shares, account water and the nomination of supply works.
All trades in the Lower Murrumbidgee groundwater sources require a hydrogeological assessment of the potential impact to neighbouring water supply works (bores) and the water source prior to being approved. Trades also need to be consistent with local management area rules. The following rules apply:
• Trades into local management areas are not permitted nor is trade from local management area 2 to local management area 1 (Figure 2).
• Additional drawdown due to the trade at the nearest bore screened in the same aquifer should not exceed 5% of available head above the target aquifer up to a maximum of 3 m.
The most common dealings are assignment of allocation (sale or purchase of account water – s71T), and assignment of rights (sale or purchase of share component – s71Q). A summary of these dealings since the commencement of the Plan are provided in Table 4. This information can be obtained from http://registers.water.nsw.gov.au (go to the Register of water allocation assignments or transfer and share assignment statistics).

Lower Murrumbidgee Groundwater Sources Summary Report 2006-2014
5 NSW Office of Water, March 2015
Figure 2 Local management areas
Lower Murrumbidgee Groundwater Sources Summary Report 2006-2014
6 NSW Office of Water, March 2015
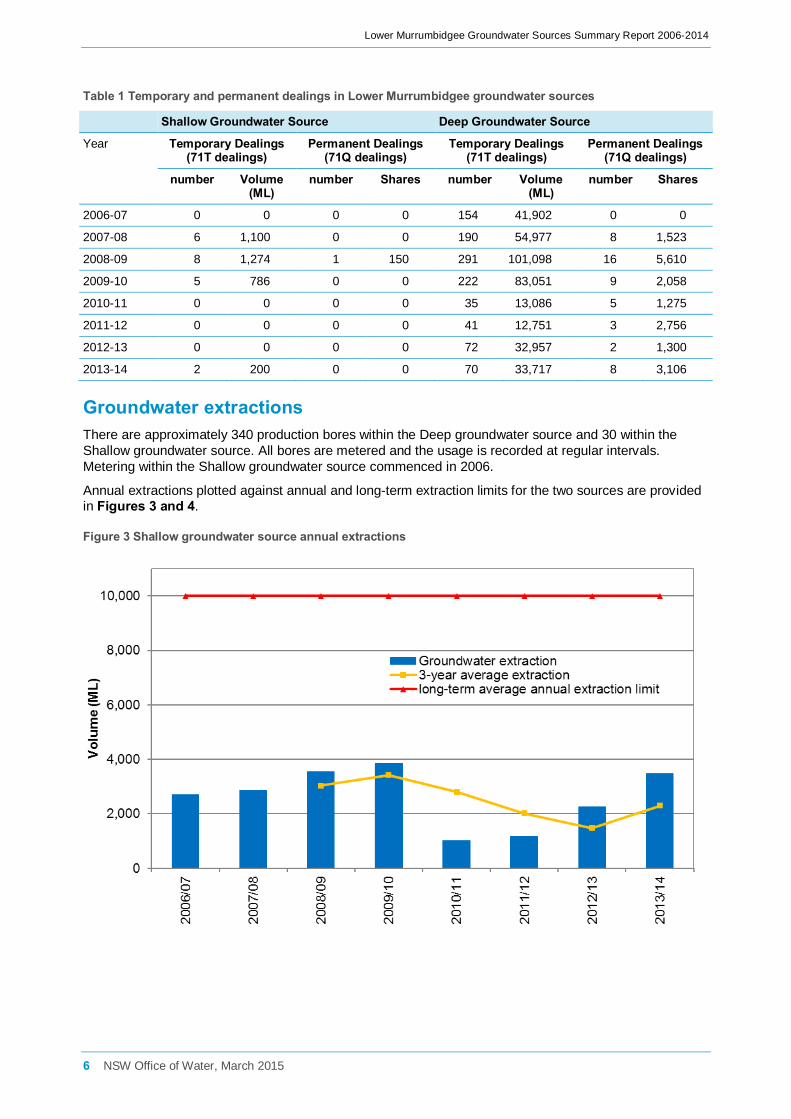
Table 1 Temporary and permanent dealings in Lower Murrumbidgee groundwater sources
Shallow Groundwater Source Deep Groundwater Source
Year Temporary Dealings (71T dealings)
Permanent Dealings (71Q dealings)
Temporary Dealings (71T dealings)
Permanent Dealings (71Q dealings)
number Volume (ML)
number Shares number Volume (ML)
number Shares
2006-07 0 0 0 0 154 41,902 0 0
2007-08 6 1,100 0 0 190 54,977 8 1,523
2008-09 8 1,274 1 150 291 101,098 16 5,610
2009-10 5 786 0 0 222 83,051 9 2,058
2010-11 0 0 0 0 35 13,086 5 1,275
2011-12 0 0 0 0 41 12,751 3 2,756
2012-13 0 0 0 0 72 32,957 2 1,300
2013-14 2 200 0 0 70 33,717 8 3,106
Groundwater extractions There are approximately 340 production bores within the Deep groundwater source and 30 within the Shallow groundwater source. All bores are metered and the usage is recorded at regular intervals. Metering within the Shallow groundwater source commenced in 2006.
Annual extractions plotted against annual and long-term extraction limits for the two sources are provided in Figures 3 and 4.
Figure 3 Shallow groundwater source annual extractions

Lower Murrumbidgee Groundwater Sources Summary Report 2006-2014
7 NSW Office of Water, March 2015
Figure 4 Deep groundwater source annual extractions
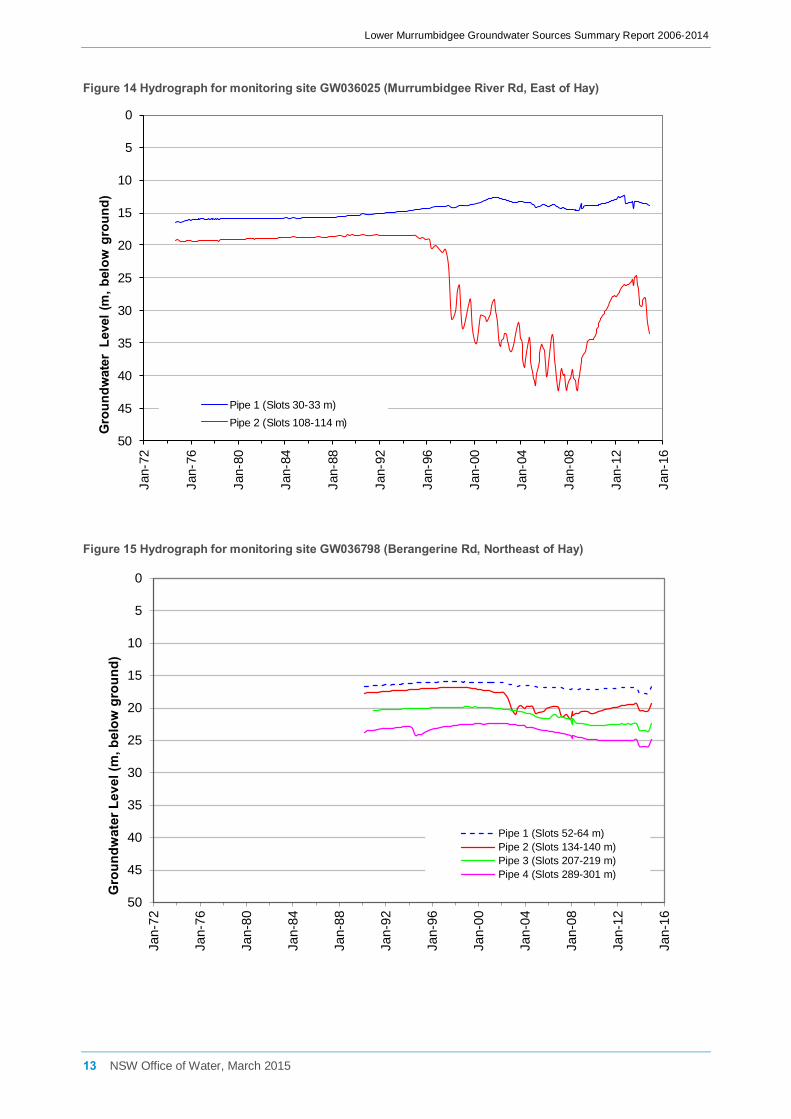
Groundwater Levels The NSW Office of Water monitors groundwater levels in 260 bores at 139 sites throughout the Lower Murrumbidgee (Figure 5). At most monitoring sites there are two or more pipes monitoring different depths. The pipes at each site are identified by a common work number with each pipe numbered from shallowest to deepest (e.g. GW040863/1 is the shallow and GW040863/2 is the deeper pipe). The depth monitored by each pipe corresponds to the depth at which the casing is slotted to allow groundwater entry into the pipe. The hydrographs (Figures 6 to 16) illustrate the water level variations (natural or induced by pumping) over time from the depth indicated by the pipe’s slots. The water levels (or pressures) are expressed as metres below ground level. The locations of the monitoring sites for which the graphs have been constructed are also shown in Figure 5.
The monitoring network includes 36 bores equipped with data loggers that record water levels continuously. These are all telemetered so continuous real time data is available at http://www.water.nsw.gov.au/Real-time-data/hydro_index.

Lower Murrumbidgee Groundwater Sources Summary Report 2006-2014
8 NSW Office of Water, March 2015
Figure 5 Monitoring bore locations

Lower Murrumbidgee Groundwater Sources Summary Report 2006-2014
9 NSW Office of Water, March 2015
Figure 6 Hydrograph for monitoring site GW040862 (Belvedere)
0
5
10
15
20
25
30
35
40
45
50
Jan-
72
Jan-
76
Jan-
80
Jan-
84
Jan-
88
Jan-
92
Jan-
96
Jan-
00
Jan-
04
Jan-
08
Jan-
12
Jan-
16
Gro
undw
ater
Lev
el (m
, bel
ow g
roun
d)
GW030284 (Slots 36.2-39.5 m)GW030282 (Slots 100-117 m, abandoned)GW040862 (Slots 119-125 m) - replacement
Figure 7 Hydrograph for monitoring site GW036396 (Whitton)
0
5
10
15
20
25
30
35
40
45
50
Jan-
72
Jan-
76
Jan-
80
Jan-
84
Jan-
88
Jan-
92
Jan-
96
Jan-
00
Jan-
04
Jan-
08
Jan-
12
Jan-
16
Gro
undw
ater
Lev
el (m
, bel
ow g
roun
d)
Pipe 1 (Slots (139-145 m)

Lower Murrumbidgee Groundwater Sources Summary Report 2006-2014
10 NSW Office of Water, March 2015
Figure 8 Hydrograph for monitoring site GW040863 (Darlington Point) 0
5
10
15
20
25
30
35
40
45
50
Jan-
72
Jan-
76
Jan-
80
Jan-
84
Jan-
88
Jan-
92
Jan-
96
Jan-
00
Jan-
04
Jan-
08
Jan-
12
Jan-
16
Gro
undw
ater
Lev
el (m
, bel
ow g
roun
d)
GW030341 (Slots 122-127 m) - abandonedGW040863/1 (Slots 51-57 m)GW040863/2 (Slots 125-130 m) - replacement
Figure 9 Hydrograph for monitoring site GW036573 (Gilbert Rd, Southeast of Coleambally)
0
5
10
15
20
25
30
35
40
45
50
Jan-
72
Jan-
76
Jan-
80
Jan-
84
Jan-
88
Jan-
92
Jan-
96
Jan-
00
Jan-
04
Jan-
08
Jan-
12
Jan-
16
Gro
undw
ater
Lev
el (m
, bel
ow g
roun
d)
Pipe 1 (Slots 92-104 m)

Lower Murrumbidgee Groundwater Sources Summary Report 2006-2014
11 NSW Office of Water, March 2015
Figure10 Hydrograph for monitoring site GW036358 (Barber Rd, Benerembah)
0
5
10
15
20
25
30
35
40
45
50
Jan-
72
Jan-
76
Jan-
80
Jan-
84
Jan-
88
Jan-
92
Jan-
96
Jan-
00
Jan-
04
Jan-
08
Jan-
12
Jan-
16
Gro
undw
ater
Lev
el (m
, bel
ow g
roun
d)
Pipe 1 (Slots 63-69 m)Pipe 2 (Slots 104-110 m)Pipe 3 (Slots 140-146 m)
Figure 11 Hydrograph for monitoring site GW036275 (South of Tonganmein)
0
5
10
15
20
25
30
35
40
45
50
Jan-
72
Jan-
76
Jan-
80
Jan-
84
Jan-
88
Jan-
92
Jan-
96
Jan-
00
Jan-
04
Jan-
08
Jan-
12
Jan-
16
Gro
undw
ater
Lev
el (m
, bel
ow g
roun
d)
GW030350 (Slots 59-63 m)GW036275/1 (Slots 170-176 m)GW036275/2 (Slots 300-306 m)

Lower Murrumbidgee Groundwater Sources Summary Report 2006-2014
12 NSW Office of Water, March 2015
Figure 12 Hydrograph for monitoring site GW036040 (Four Corners Rd)
0
5
10
15
20
25
30
35
40
45
50
Jan-
72
Jan-
76
Jan-
80
Jan-
84
Jan-
88
Jan-
92
Jan-
96
Jan-
00
Jan-
04
Jan-
08
Jan-
12
Jan-
16
Gro
undw
ater
Lev
el (m
, bel
ow g
roun
d)
GW036040/1 (Slots 27.4-33.5 m)GW036040/2 (Slots 101-113 m) - abandonedGW273025 (Slots 102-108 m) - replacementGW036040/3 (Slots 162-172 m)
Figure 13 Hydrograph for monitoring site GW030325 (Carrathool Rd, Steam Plains)
0
5
10
15
20
25
30
35
40
45
50
Jan-
72
Jan-
76
Jan-
80
Jan-
84
Jan-
88
Jan-
92
Jan-
96
Jan-
00
Jan-
04
Jan-
08
Jan-
12
Jan-
16Gro
undw
ater
Lev
el (m
, bel
ow g
roun
d)
Pipe 1 (Slots 27.6-30.4 m)Pipe 2 (Slots 82.9-86.2 m)Pipe 3 (Slots 97.5-109.7)
Lower Murrumbidgee Groundwater Sources Summary Report 2006-2014
13 NSW Office of Water, March 2015
Figure 14 Hydrograph for monitoring site GW036025 (Murrumbidgee River Rd, East of Hay)
0
5
10
15
20
25
30
35
40
45
50
Jan-
72
Jan-
76
Jan-
80
Jan-
84
Jan-
88
Jan-
92
Jan-
96
Jan-
00
Jan-
04
Jan-
08
Jan-
12
Jan-
16
Gro
undw
ater
Lev
el (m
, bel
ow g
roun
d)
Pipe 1 (Slots 30-33 m)Pipe 2 (Slots 108-114 m)
Figure 15 Hydrograph for monitoring site GW036798 (Berangerine Rd, Northeast of Hay)
0
5
10
15
20
25
30
35
40
45
50
Jan-
72
Jan-
76
Jan-
80
Jan-
84
Jan-
88
Jan-
92
Jan-
96
Jan-
00
Jan-
04
Jan-
08
Jan-
12
Jan-
16
Gro
undw
ater
Lev
el (m
, bel
ow g
roun
d)
Pipe 1 (Slots 52-64 m)Pipe 2 (Slots 134-140 m)Pipe 3 (Slots 207-219 m)Pipe 4 (Slots 289-301 m)

Lower Murrumbidgee Groundwater Sources Summary Report 2006-2014
14 NSW Office of Water, March 2015
Figure 16 Hydrograph for monitoring site GW030435 (Cobb Highway, South of Hay)
0
5
10
15
20
25
30
35
40
45
50
Jan-
72
Jan-
76
Jan-
80
Jan-
84
Jan-
88
Jan-
92
Jan-
96
Jan-
00
Jan-
04
Jan-
08
Jan-
12
Jan-
16
Gro
undw
ater
Lev
el (m
, bel
ow g
roun
d)
Pipe 1 (Slots 94.8-100.5 m)
Figure 17 Hydrograph for monitoring site GW036799 (Moulamein Rd, Ravensworth)
0
5
10
15
20
25
30
35
40
45
50
Jan-
72
Jan-
76
Jan-
80
Jan-
84
Jan-
88
Jan-
92
Jan-
96
Jan-
00
Jan-
04
Jan-
08
Jan-
12
Jan-
16
Gro
undw
ater
Lev
el (m
, bel
ow g
roun
d)
Pipe 1 (Slots 59-71 m)Pipe 2 (Slots 225-231 m)Pipe 3 (Slots 322-334 m)
Lower Murrumbidgee Groundwater Sources Summary Report 2006-2014
15 NSW Office of Water, March 2015
More information NSW Office of Water
Wagga Wagga
Tel 69329100
www.water.nsw.gov.au
© State of New South Wales through the Department of Trade and Investment, Regional Infrastructure and Services 2015. You may copy, distribute and otherwise freely deal with this publication for any purpose, provided that you attribute the NSW Department of Primary Industries as the owner.
Disclaimer: The information contained in this publication is based on knowledge and understanding at the time of writing (March 2015). However, because of advances in knowledge, users are reminded of the need to ensure that information upon which they rely is up to date and to check currency of the information with the appropriate officer of the Department of Primary Industries or the user’s independent adviser.
Published by the Department of Primary Industries, a division of NSW Department of Trade and Investment, Regional Infrastructure and Services.
Jobtrack 13478