BCSSE Institute Report 2012 - sl-assessment.gatech.edu · Joe Ludlum Coordinator of ... (NSSE), a...
25
Beginning College Survey of Student Engagement: 2012 Institute Report Office of Assessment Joe Ludlum Coordinator of Survey Research February 2013
Transcript of BCSSE Institute Report 2012 - sl-assessment.gatech.edu · Joe Ludlum Coordinator of ... (NSSE), a...
Beginning College Survey of Student Engagement: 2012 Institute Report
Office of Assessment
Joe Ludlum Coordinator of Survey Research
February 2013


TABLE OF CONTENTS
Executive Summary …………………………………………………………………………. 1 Introduction ………………………………………………………………………………… 3 Survey Findings
Quality Assurance and Demographics ………………………………………………….. 4
High School Academics …………………………………………………………………. 6
Scale Scores
High School Academic Engagement …………………………………………………… 7
Expected Academic Engagement ……………………………………………………… 9
Perceived Academic Preparation ………………………………………………………. 13
Expected Academic Difficulty ………………………………………………………… 14
Expected Academic Perseverance ...…………………………………………………… 16
Importance of Campus Environment …………………………………………………… 17
Other Expectations
Finances ……………………………………………………………………………….......... 19
Social Integration ……………………………………………………………………………. 19 Summary …………………………………………………………………………………… 21


EXECUTIVE SUMMARY
In Summer 2012, the Georgia Tech (GT) Office of Assessment administered a new freshman survey—the Beginning College Survey of Student Engagement (BCSSE). BCSSE is related to the National Survey of Student Engagement (NSSE) and is similarly constructed to collect data about entering students’ high school academic and co-curricular experiences as well as their expectations for their college experience. Using BCSSE in conjunction with NSSE (which is regularly administered at GT) will permit a more robust analysis of the student experience at GT. Incoming 2012 Georgia Tech freshmen who participated in FASET activities were asked to complete the BCSSE student survey. Based on the 2,734 responses of those students (89.8 percent of the first-time, full-time class) who completed the 2012 survey, this report presents selected results. Complete results can be found at < http://www.adors.gatech.edu >. Highlights from the survey include:
Incoming freshman students expect to work harder at Georgia Tech than they did in high school. While 27.7 percent said they had spent at least 16 hours per week preparing for classes in high school, 66.8 percent plan to spend at least this much time per week in the coming year.
Incoming freshman students expect more frequent interaction with their instructors; considerably more than what students at GT reported having had in their first year. For example, in high school, 32.2 percent of incoming freshman students often discussed coursework with their teachers outside of class, while 46.6 percent expect to do this often in the coming year. However, based on recent NSSE results, only 16.1 percent of first-year students reported frequent engagement with faculty in this manner.
Women express more concern about their academic success, and plan accordingly. Over half the women (53.1 percent) thought they might have difficulty in learning course material, compared to 37.7 percent of men. However, women also plan to spend more time studying (71.8 percent plan to study 16 or more hours per week, compared to 63.9 percent of men).
Nearly everyone (94.5 percent) expects to have a B average in their first year. This is highly optimistic; historically only 65.9 percent of first-year students manage a 3.0 in their first year.
First-generation college students have many of the same expectations as their peers, but have significantly more financial concerns: First-generation students (47.3 percent) felt they might have difficulty paying their college expenses, as compared to 29.2 percent of non-first-generation students. Over half of the first-generation students include student loans in their finance plans, and 45.6 percent are on Pell grants.
International students come to GT with different experiences and expectations than domestic students. International students studied more, with 46.2 percent spending at least 16 hours per week preparing for classes, compared to 24.7 percent of domestic students. Also, 78.9 percent of international students expect to work with other students on projects during class, compared to 51.8 percent of domestic students.


INTRODUCTION
In Summer 2012, the Georgia Tech Office of Assessment administered a new freshman survey, the Beginning College Survey of Student Engagement (BCSSE). BCSSE is related to the National Survey of Student Engagement (NSSE), a survey Georgia Tech uses on a regular basis to explore student engagement in first-year and senior students. Constructed on similar lines, BCSSE is designed to collect data about entering students’ high school academic and co-curricular experiences as well as their expectations of their college experience. As such, BCSSE taps into likely student behaviors and into both experience and expectations regarding different facets of engagement. Because the BCSSE and NSSE are published by the same source, several topics and items are common to both surveys. This overlap allows comparisons to be made with available NSSE data, to see how incoming freshman students’ expectations match the actual first-year experiences of students at Georgia Tech. Moving forward, we will have an opportunity to connect BCSSE data to future NSSE responses and to see how students change over the first year and over the course of their undergraduate education. Incoming Georgia Tech freshmen were asked to complete BCSSE during a FASET orientation session. Of the 3,046 first-time, full-time students in the incoming 2012 class, 2,734 students completed the survey (89.8 percent of the incoming first-time, full-time class). This report summarizes the findings of the 2012 BCSSE for Georgia Tech incoming freshman students. As this is the first collection of this survey, this report will primarily focus on general descriptions and some internal comparisons of different student groups. Organization of this Report
BCSSE organizes the results of its survey around six scales, representing indicators for future academic engagement:
High School Academic Engagement (HSE)
Expected Academic Engagement (EAE)
Perceived Academic Preparation (PAP)
Expected Academic Difficulty (EAD)
Expected Academic Perseverance (EAP)
Importance of Campus Environment (ICE) These scales function as a heuristic device for understanding student expectations and engagement. The scales and their corresponding responses reflect the students that come to Georgia Tech and their college expectations. These scores can also point to areas where expectations might not match the reality of college life or areas where students may encounter difficulties. This report follows BCSSE’s format to present the results and concludes with some additional expectations outside of academics and engagement. Results for male and female respondents, as well as first-generation students, are presented throughout. Comparisons between international students and domestic students (i.e., U.S. citizens and resident aliens) are also presented where appropriate. Because of the large sample sizes within many groups in Georgia Tech, very small differences may show up as statistically significant. To address this issue, this report highlights effect size rather than statistical significance between values. Effect size is calculated by dividing the mean difference between two samples by the pooled standard deviation. The result, labeled “Cohen’s d” measures the “practical
Georgia Tech Office of Assessment
-4-
significance.” This report uses a relaxed interpretation of Cohen’s d, with a value of .1 to be a small notable effect, .3 a moderate effect, and .5 to be a large effect. These three values (.1, .3, and .5) are indicated by *, **, and *** designations in subsequent results tables.
SURVEY FINDINGS
Quality Assurance and Demographics
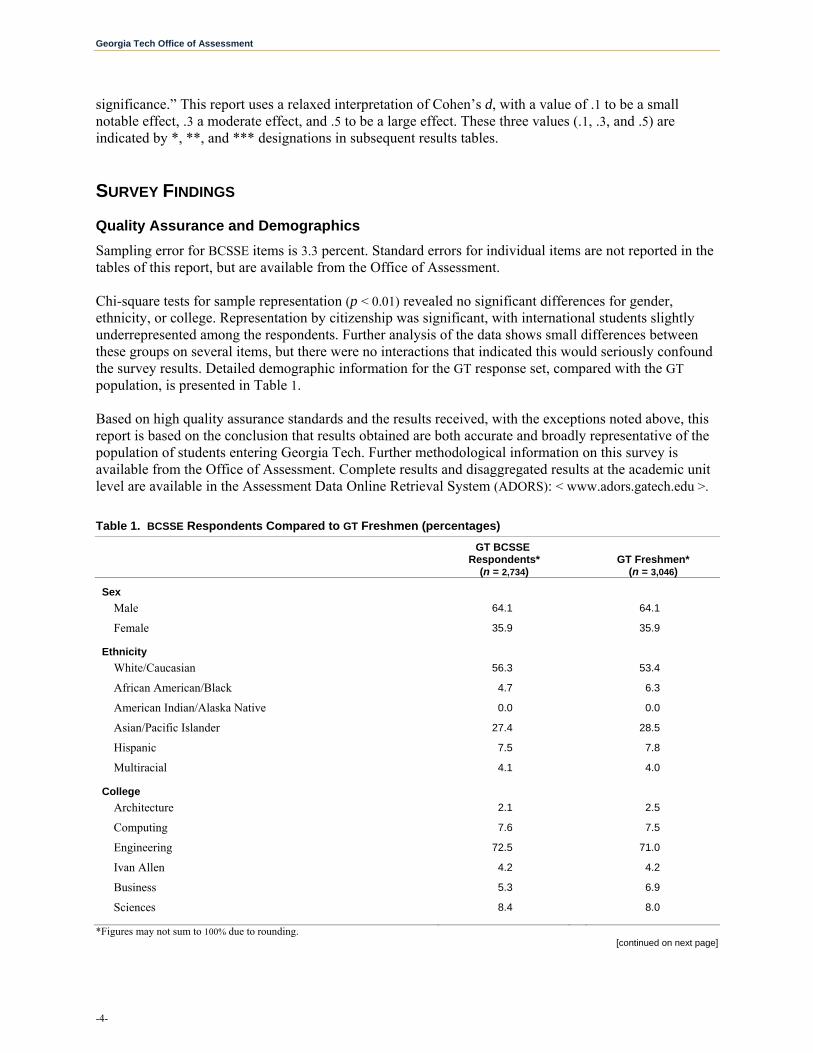
Sampling error for BCSSE items is 3.3 percent. Standard errors for individual items are not reported in the tables of this report, but are available from the Office of Assessment. Chi-square tests for sample representation (p < 0.01) revealed no significant differences for gender, ethnicity, or college. Representation by citizenship was significant, with international students slightly underrepresented among the respondents. Further analysis of the data shows small differences between these groups on several items, but there were no interactions that indicated this would seriously confound the survey results. Detailed demographic information for the GT response set, compared with the GT population, is presented in Table 1. Based on high quality assurance standards and the results received, with the exceptions noted above, this report is based on the conclusion that results obtained are both accurate and broadly representative of the population of students entering Georgia Tech. Further methodological information on this survey is available from the Office of Assessment. Complete results and disaggregated results at the academic unit level are available in the Assessment Data Online Retrieval System (ADORS): < www.adors.gatech.edu >.
Table 1. BCSSE Respondents Compared to GT Freshmen (percentages)
GT BCSSE Respondents*
(n = 2,734)
GT Freshmen* (n = 3,046)
Sex
Male 64.1 64.1
Female 35.9 35.9
Ethnicity
White/Caucasian 56.3 53.4
African American/Black 4.7 6.3
American Indian/Alaska Native 0.0 0.0
Asian/Pacific Islander 27.4 28.5
Hispanic 7.5 7.8
Multiracial 4.1 4.0
College
Architecture 2.1 2.5
Computing 7.6 7.5
Engineering 72.5 71.0
Ivan Allen 4.2 4.2
Business 5.3 6.9
Sciences 8.4 8.0
*Figures may not sum to 100% due to rounding. [continued on next page]

2012 BCSSE Freshman Survey
-5-
Table 1. BCSSE Respondents Compared to GT Freshmen (percentages) [continued from previous page]
GT BCSSE Respondents*
(n = 2,734)
GT Freshmen* (n = 3,046)
Residence
In-state 53.0 51.0
Out-of-state 47.0 49.0
Citizenship status
U.S. citizen 85.3 82.0
Permanent resident 4.2 4.2
International 10.6 13.8 .
*Figures may not sum to 100% due to rounding.
A large portion of incoming freshman students are local, with 42.0 percent of respondents living within 50 miles of campus. Georgia Tech women are significantly more likely to come from within 50 miles of campus (49.5 percent) than are their male classmates (37.9 percent). Among the respondents, 75.1 percent attended traditional public schools. Of the remaining respondents, 12.0 percent attended private college-prep schools and 12.1 percent attended private religious/parochial schools. Less than 1 percent of GT responders were homeschooled during high school (0.5 percent).
The majority of the incoming freshmen have college-educated parents, with 90.3 percent reporting at least one parent with a four-year college degree. A small portion of the incoming freshmen, 9.7 percent, are first-generation college students.1 These students are coming to Georgia Tech with similar ability and academic preparations, but may come with different expectations for college, and possibly different challenges in terms of their ability to succeed at Georgia Tech. A comparison of the demographics of first-generation and non-first-generation students is provided in Table 2. In terms of educational background, more of the first-generation students come from public schools (88.8 percent), compared to their peers with college-educated parents (73.3 percent). First-generation students are more likely to be local: not only are more from in-state, but the majority come from within 100 miles of the Atlanta area. Underrepresented minorities make up a larger portion of the first-generation students, with African American and Hispanic students having significantly higher representation in this group. In terms of majors, first-generation students are more likely to be enrolled in Architecture, Computing, and Sciences compared to their non-first-generation peers.
1 BCSSE defines first-generation students as not having a parent/guardian that completed a four-year college degree.

Georgia Tech Office of Assessment
-6-
Table 2. Demographic Traits of First-Generation Students
Non-First-Generation Students (n = 2,422)
First-Generation Students (n = 260)
Sex
Male 64.7 59.1
Female 35.3 40.9
Ethnicity*
White/Caucasian 57.7 47.3
African American/Black 4.0 10.2
American Indian/Alaska Native 0.0 0.0
Asian/Pacific Islander 27.7 23.0
Hispanic 6.7 14.5
Multiracial 3.8 5.1
Residence*
In-state 51.2 69.6
Out-of-state 48.8 30.4 Distance from home*
100 miles or less 46.0 55.8 101+ miles 54.0 44.2 High School*
Public 73.7 88.8
Private, religiously-affiliated 12.7 5.0
Private, independent 12.8 4.6
Homeschooled/Other 0.8 1.5
College*
Architecture 2.0 3.1
Computing 7.4 8.9
Engineering 73.1 66.5
Ivan Allen 4.2 3.5
Business 5.3 4.7
Sciences 7.9 13.2
* Difference significant (Chi Square p < .01)
High School Academics
Students had an opportunity to share some of their academic background, as presented in Table 3. Not surprisingly, GT students come with a strong technical grounding. Over 97 percent have four years of mathematics courses, with 94.9 percent having completed calculus, and 50.1 percent having completed a course in probability or statistics. Nearly three-quarters of incoming freshman students (73.5 percent) reported having taken multiple (five or more) Advanced Placement (AP) classes. Additionally, 31.9 percent of the incoming freshmen report having taken college courses for credit during their senior year. Compared to their male counterparts, women coming to GT have taken more AP and Honors courses, and typically have more foreign language coursework when they arrive. There is also a difference in the focus

2012 BCSSE Freshman Survey
-7-
of first-generation students, who are coming in with more history and social science classes, and fewer foreign language classes compared to non-first-generation students. Table 3. High School Coursework of Respondents
*d > .1; **d > .3; ***d > .5 GT Total Female Male
Eff. Size
First-Generation
Non-First- Generation
Eff. Size
During high school, how many years of the following subjects did you complete?
English (4 years) 97.1 97.4 97.0 96.9 97.2
Mathematics (4 years) 97.2 96.8 97.4 97.7 97.1
Science (4 years) 95.5 95.4 95.5 96.9 95.5
History/Social Sciences (4 years) 73.6 74.1 73.3 79.5 72.9 *
Foreign Language (3+ years) 76.7 81.6 74.0 * 71.0 77.5 *
During high school, how many of the following types of classes did you complete?
Advanced Placement (AP) classes (5 or more) 73.5 76.8 71.8 * 76.4 73.4
Honors classes (not AP) (5 or more) 72.9 75.7 71.5 * 76.1 72.7
College courses for credit (1 or more) 31.9 29.4 33.5 29.6 32.2
To date, in which of the following math classes did you earn a passing grade?
Pre-Calculus/Trigonometry 97.5 98.0 97.3 97.7 97.6
Calculus 94.9 93.5 95.7 * 94.6 95.1
Probability or Statistics 50.1 47.8 51.5 48.6 50.3
Scale Scores
The BCSSE presents its engagement related items as a series of six scales:
High School Academic Engagement (HSE)
Expected Academic Engagement (EAE)
Perceived Academic Preparation (PAP)
Expected Academic Difficulty (EAD)
Expected Academic Perseverance (EAP)
Importance of Campus Environment (ICE) These scales reflect students’ abilities, prior experiences, as well as expectations for academic and social engagement in college. Each scale represents the mean of several related items, rescaled on a 0−10 metric. It is important to note that these scales are based on self-assessment of students’ own ability, effort, or frequency of activities. A brief explanation of each score and results on the individual items are detailed below.
High School Academic Engagement
The High School Academic Engagement scale consists of items related to the students’ engagement in educationally relevant behaviors during the last year of high school. This scale provides a clearer picture of the types of school work in which students engage and a measure of the effort they put into their education.
Georgia Tech Office of Assessment
-8-
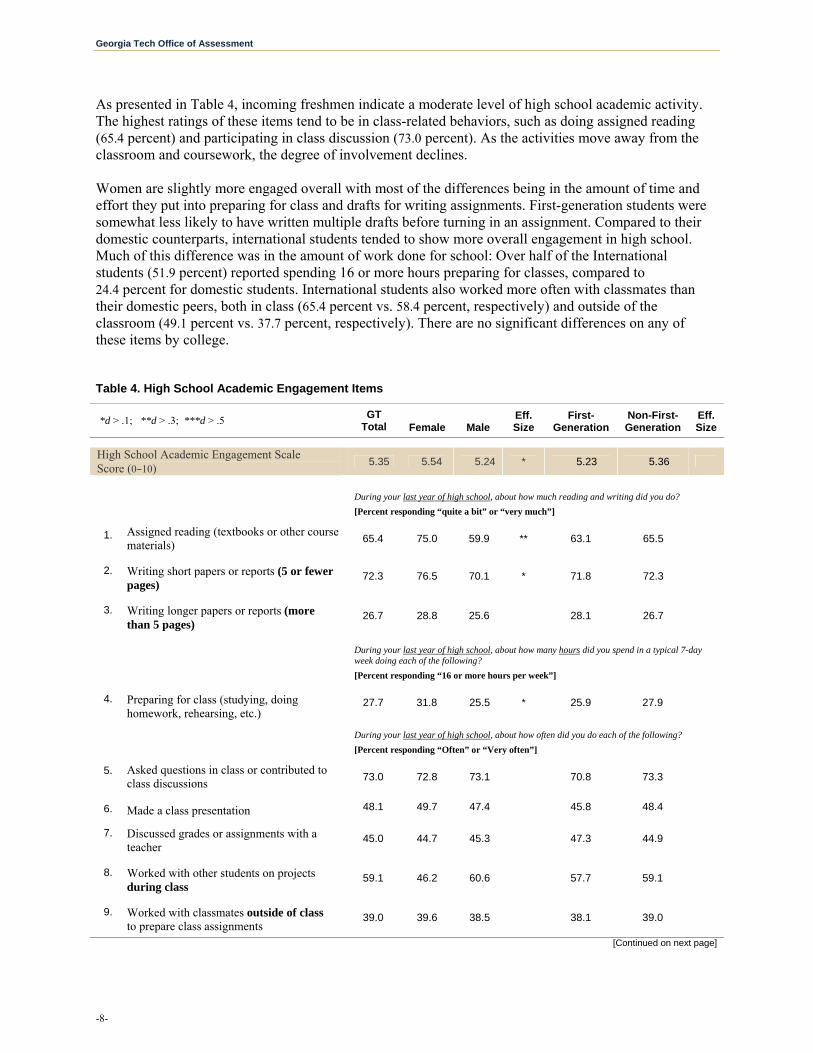
As presented in Table 4, incoming freshmen indicate a moderate level of high school academic activity. The highest ratings of these items tend to be in class-related behaviors, such as doing assigned reading (65.4 percent) and participating in class discussion (73.0 percent). As the activities move away from the classroom and coursework, the degree of involvement declines. Women are slightly more engaged overall with most of the differences being in the amount of time and effort they put into preparing for class and drafts for writing assignments. First-generation students were somewhat less likely to have written multiple drafts before turning in an assignment. Compared to their domestic counterparts, international students tended to show more overall engagement in high school. Much of this difference was in the amount of work done for school: Over half of the International students (51.9 percent) reported spending 16 or more hours preparing for classes, compared to 24.4 percent for domestic students. International students also worked more often with classmates than their domestic peers, both in class (65.4 percent vs. 58.4 percent, respectively) and outside of the classroom (49.1 percent vs. 37.7 percent, respectively). There are no significant differences on any of these items by college. Table 4. High School Academic Engagement Items
*d > .1; **d > .3; ***d > .5 GT
Total Female Male Eff. Size
First-Generation
Non-First- Generation
Eff. Size
High School Academic Engagement Scale Score (0−10)
5.35 5.54 5.24 * 5.23 5.36
During your last year of high school, about how much reading and writing did you do?
[Percent responding “quite a bit” or “very much”]
1. Assigned reading (textbooks or other course materials)
65.4 75.0 59.9 ** 63.1 65.5
2. Writing short papers or reports (5 or fewer pages)
72.3 76.5 70.1 * 71.8 72.3
3. Writing longer papers or reports (more than 5 pages)
26.7 28.8 25.6 28.1 26.7
During your last year of high school, about how many hours did you spend in a typical 7-day week doing each of the following?
[Percent responding “16 or more hours per week”]
4. Preparing for class (studying, doing homework, rehearsing, etc.)
27.7 31.8 25.5 * 25.9 27.9
During your last year of high school, about how often did you do each of the following?
[Percent responding “Often” or “Very often”]
5. Asked questions in class or contributed to class discussions
73.0 72.8 73.1 70.8 73.3
6. Made a class presentation 48.1 49.7 47.4 45.8 48.4
7. Discussed grades or assignments with a teacher
45.0 44.7 45.3 47.3 44.9
8. Worked with other students on projects during class
59.1 46.2 60.6 57.7 59.1
9. Worked with classmates outside of class to prepare class assignments
39.0 39.6 38.5 38.1 39.0
[Continued on next page]

2012 BCSSE Freshman Survey
-9-
Table 4. High School Academic Engagement Items [continued from previous page]
*d > .1; **d > .3; ***d > .5 GT
Total Female Male Eff. Size
First-Generation
Non-First- Generation
Eff. Size
High School Academic Engagement Scale Score (0−10)
5.35 5.54 5.24 * 5.23 5.36
During your last year of high school, about how often did you do each of the following?
[Percent responding “Often” or “Very often”]
10. Prepared two or more drafts of a paper or assignment before turning it in
31.9 36.6 29.4 * 29.6 32.3 *
11. Discussed ideas from your readings or classes with teachers outside of class
32.2 31.9 32.4 33.5 31.9
12. Discussed ideas from your readings or classes with others outside of class (students, family members, etc.)
51.2 54.6 49.2 * 45.8 51.8
Figure 1. High School Academic Engagement Items by International Status
* d > .1; ** d > .3; *** d > .5
Expected Academic Engagement
The Expected Academic Engagement scale parallels the High School Engagement items, shifting from the educationally relevant behaviors students have been engaged with to what they anticipate doing during the first year of college. Several of the items on this scale are also represented in the NSSE Benchmarks, specifically Active and Collaborative Learning and Student-Faculty Interaction.
0 20 40 60 80 100
International Students Domestic Students
Percent ‘Often’ or ‘Very Often’
Ask questions in class or contributed to class discussions
Worked with other students on projects during class*
Worked with classmates outside of class to prepare class assignments
Discussed grades or assignments with a teacher*
Discussed ideas from your readings or classes with teachers outside of class*
Discussed ideas from your readings or classes with others outside of class
Prepared two or more drafts of a paper or assignment before turning it in**
Made a class presentation

Georgia Tech Office of Assessment
-10-
The Expected Academic Engagement scale and items are presented in Table 5. While there are few differences between groups, the levels of expected engagement are fairly high. Women and men both expect to work on projects with other students, though men expect to do this more in the classroom, while women expect to work more outside the classroom. This may be related to why women expect to spend a little more time in preparing for classes. Similar to high school experiences, international students post higher ratings for expected academic engagement. The major differences come not in preparation but in interaction. For example, 82.2 percent of international students expect they will often ask questions or contribute to class discussions, compared to 69.8 percent of domestic students. Likewise, 67.6 percent of international students expect to discuss class-related issues with faculty quite often, compared to only 43.9 percent of domestic students. Table 5. Expected Academic Engagement Items
*d > .1; **d > .3; ***d > .5 GT Total Female Male
Eff. Size
First-Generation
Non-First- Generation
Eff. Size
Expected Academic Engagement Scale Score (0−10)
5.98 6.01 5.96 6.03 5.97
During the coming school year, about how many hours do you think you will spend in a typical 7-day week doing each of the following?
[Percent responding “16 or more hours per week”]
1. Preparing for class (studying, reading, writing, doing homework or lab work, analyzing data, rehearsing, and other academic activities)
66.8 71.8 63.9 * 69.4 66.5
During the coming school year, about how often do you expect to do each of the following?
[Percent responding “Often” or “Very often”]
2. Ask questions in class or contribute to class discussions
71.4 68.9 72.7 70.5 71.2
3. Make a class presentation 53.8 53.6 53.9 55.4 53.4
4. Work with other students on projects during class
54.9 50.4 57.3 * 48.2 55.6
5. Work with classmates outside of class to prepare class assignments
83.3 85.8 81.9 * 79.5 83.9
6. Discuss grades or assignments with an instructor
55.5 57.6 54.5 58.1 55.4
7. Discuss ideas from your readings or classes with faculty members outside of class
46.6 46.3 46.6 46.9 46.3
8. Discuss ideas from your readings or classes with others outside of class (students, family members, co-workers, etc.)
62.1 62.8 61.8 58.5 62.4

2012 BCSSE Freshman Survey
-11-
Figure 2. Expected Academic Engagement Items by International Status
* d > .1; ** d > .3; *** d > .5
Compared to their high school engagement, incoming respondents have higher expectations with how they will engage at GT. Figure 3 highlights the engagement areas measured by the High School Academic Engagement and Expected Academic Engagement scales, as well as a comparison to similar questions asked of GT students at the end of freshman year from the 2011 NSSE. The largest (meaningful) shifts in expectation from high school to college are towards more engagement outside the classroom, both with peers and instructors. Most notably, students’ expectations on how often they will be working with others go from an infrequent activity in high school to the most expected behavior at GT. Figure 3: High School Academic Engagement, Expected Academic Engagement, and Actual Engagement (NSSE 2011)
* d > .1; ** d > .3; *** d > .5
0 20 40 60 80 100
International Students Domestic Students
0 20 40 60 80 100
Percent 'Often' or 'Very often'
High School Academic Engagement Expected Academic Enagement NSSE 2011 First‐Year Engagement
Percent ‘Often’ or ‘Very Often’
Ask questions in class or contribute to class discussions*
Work with other students on projects during class***
Work with classmates outside of class to prepare class assignments
Discuss grades or assignments with an instructor*
Discuss ideas from your readings or classes with faculty members outside of class**
Discuss ideas from your readings or classes with others outside of class
Make a class presentation*
Ask questions in class or contribute to class discussions
Work with other students on projects during class
Work with classmates outside of class to prepare class assignments
Discuss grades or assignments with an instructor
Discuss ideas from your readings or classes with teachers/faculty members outside of class
Discuss ideas from your readings or classes with others outside of class
Make a class presentation

Georgia Tech Office of Assessment
-12-
In comparing these expectations to the experiences of previous students, some of the incoming freshman students’ expectations are in line with reality, but others fall well short. Of note, incoming freshmen expected to discuss ideas from readings or classes with instructors fairly often. However, student responses from the 2011 NSSE indicate that first-year students rarely discussed ideas with their instructors outside of classes, and in fact, reported they did so less often than in high school. Also contrary to their expectations, first-year students were less actively engaged in class. However, they did work and discuss their coursework more frequently outside the classroom. In addition to the scale items, BCSSE included several questions regarding student expectations for engagement that matched to NSSE, including items from the Student-Faculty Interaction and Enriching Educational Experience benchmarks. Figure 4 presents a comparison of these items. As with the scale items, there are some notable gaps between expectation and what others at GT actually experienced. Over 80 percent of incoming freshman students expect to integrate concepts in their coursework often. Looking at the experiences of first-year students from the recent NSSE survey, over half felt they did integrate concepts fairly often, but substantially less often than pre-college expectations. When it comes to out-of-class interactions with new people and ideas, student expectations are still high but fall closer to the actual experiences of first-year students.
Interaction with faculty on projects outside the classroom demonstrates another large expectation gap. First-year students do not often work with faculty: 13.1 percent of the 2011 NSSE first-year respondents said they interacted with faculty “often or very often.” Yet a much larger proportion of incoming freshmen, 48.7 percent, expect to engage with faculty in this manner.
Figure 4. Expectations vs. Experiences BCSSE 2012 and NSSE 2011
* d > .1; ** d > .3; *** d > .5
0 20 40 60 80 100
Percent 'Often' or 'Very often'
BCSSE 2012 Incoming NSSE 2011 First‐Year
Receive(d) prompt feedback from faculty on your academic performance (written or oral) **
Work(ed) with faculty members on activities other than coursework (committees, orientation, etc.) ***
Have/had serious conversations with students of a different race or ethnicity than your own*
Have/had serious conversations with students who are very different from you in terms of their religious
beliefs, political opinions, or personal values*
Work(ed) on a paper or project that requires integrating ideas or information from various sources ***
Put together ideas or concepts from different courses when completing assignments or during class discussions ***
Try/tried to better understand someone else's views by imagining how an issue looks from his or her perspective **
Learn(ed) something that changes the way you understand an issue or idea ***
2012 BCSSE Freshman Survey
-13-
Perceived Academic Preparation
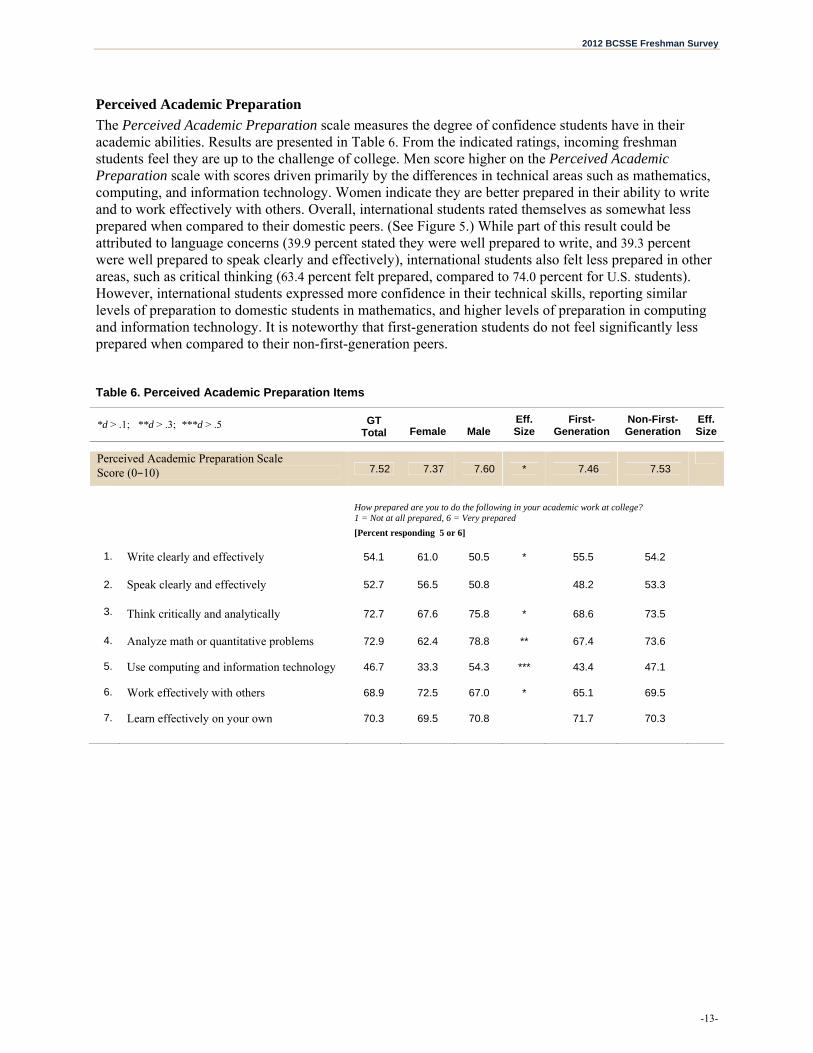
The Perceived Academic Preparation scale measures the degree of confidence students have in their academic abilities. Results are presented in Table 6. From the indicated ratings, incoming freshman students feel they are up to the challenge of college. Men score higher on the Perceived Academic Preparation scale with scores driven primarily by the differences in technical areas such as mathematics, computing, and information technology. Women indicate they are better prepared in their ability to write and to work effectively with others. Overall, international students rated themselves as somewhat less prepared when compared to their domestic peers. (See Figure 5.) While part of this result could be attributed to language concerns (39.9 percent stated they were well prepared to write, and 39.3 percent were well prepared to speak clearly and effectively), international students also felt less prepared in other areas, such as critical thinking (63.4 percent felt prepared, compared to 74.0 percent for U.S. students). However, international students expressed more confidence in their technical skills, reporting similar levels of preparation to domestic students in mathematics, and higher levels of preparation in computing and information technology. It is noteworthy that first-generation students do not feel significantly less prepared when compared to their non-first-generation peers. Table 6. Perceived Academic Preparation Items
*d > .1; **d > .3; ***d > .5 GT Total Female Male
Eff. Size
First-Generation
Non-First- Generation
Eff. Size
Perceived Academic Preparation Scale Score (0−10) 7.52 7.37 7.60 * 7.46 7.53
How prepared are you to do the following in your academic work at college? 1 = Not at all prepared, 6 = Very prepared
[Percent responding 5 or 6]
1. Write clearly and effectively 54.1 61.0 50.5 * 55.5 54.2
2. Speak clearly and effectively 52.7 56.5 50.8 48.2 53.3
3. Think critically and analytically 72.7 67.6 75.8 * 68.6 73.5
4. Analyze math or quantitative problems 72.9 62.4 78.8 ** 67.4 73.6
5. Use computing and information technology 46.7 33.3 54.3 *** 43.4 47.1
6. Work effectively with others 68.9 72.5 67.0 * 65.1 69.5
7. Learn effectively on your own 70.3 69.5 70.8 71.7 70.3

Georgia Tech Office of Assessment
-14-
Figure 5. Perceived Academic Preparation Items by International Status
* d > .1; ** d > .3; *** d > .5
Expected Academic Difficulty
Incoming freshman students rated the academic challenges they expect to encounter during their first year of college (Table 7). Interestingly, the responses split between four noted items, with self-focused items (ability to learn material, time management) considered commonly expected difficulties and environment-focused elements (getting help, interacting with faculty) considered relatively minor challenges for respondents. Women expect more academic difficulty, the difference driven heavily by over half of women respondents (53.1 percent) indicating learning course material would be difficult, compared to 37.7 percent of men. First-generation students anticipated greater academic difficulty in the overall scale score, but getting help with schoolwork was the only meaningful difference from non-first-generation students. International students expected the same amount of overall difficulty, though they anticipated fewer problems with learning the material than did domestic students (33.6 percent vs. 44.1 percent, respectively) and fewer problems in time management (48.1 percent for international students vs. 53.5 percent for domestic students).
Table 7. Expected Academic Difficulty Items
*d > .1; **d > .3; ***d > .5 GT Total Female Male
Eff. Size
First-Generation
Non-First- Generation
Eff. Size
Expected Academic Difficulty Scale (Mean) (0−10)
5.23 5.41 5.13 * 5.42 5.21 *
During the coming school year, how difficult do you expect the following to be? 1 = Not at all difficult, 6 = Very difficult
[Percent responding 5 or 6]
1. Learning course material 43.0 53.1 37.7 ** 43.8 43.3
2. Managing your time 52.8 52.7 52.8 56.6 52.3
3. Getting help with school work 7.0 7.9 6.7 8.6 6.9 *
4. Interacting with faculty 11.0 12.9 10.0 * 10.5 11.2
0 20 40 60 80 100Perceived Academic Preparation—Percent "Prepared"
International Students Domestic Students
Write clearly and effectively **
Speak clearly and effectively **
Think critically and analytically **
Analyze math or quantitative problems
Use computing and information technology *
Work effectively with others *
Learn effectively on your own *

2012 BCSSE Freshman Survey
-15-
Figure 6. Expected Academic Difficulty Items by International Status
* d > .1, ** d > .3, *** d > .5
An interesting finding regarding Expected Academic Difficulty is the way in which it relates to how challenging students felt their high school was. Looking at Figure 7, Expected Academic Difficulty ratings were higher for those who described their high school as having been more academically challenging. However, those who rated their high school as “extremely challenging” (the scale maximum) had a significantly lower Expected Academic Difficulty rating. This pattern holds true when controlling for SAT scores or high school grades. While there is no definitive cause for this shift, one possible explanation is in student attitude. It may be that after attending the “most challenging” of schools, these individuals feel extremely confident in their ability to succeed. It will be interesting to follow up with these groups and see how they perform at Georgia Tech. Figure 7. High School Academic Challenge and Expected Academic Difficulty
0 20 40 60 80 100
Expected Academic Difficulty—Percent "Difficult"
International Students Domestic Students
4.5
4.6
4.7
4.8
4.9
5.0
5.1
5.2
5.3
5.4
5.5
1 2 3 4 5 6
Expected Academic Difficulty Rating
Overall, how academically challenging was your high school?
Learning course material*
Managing your time*
Getting help with school work*
Interacting with faculty
Not at all challenging Extremely challenging

Georgia Tech Office of Assessment
-16-
Expected Academic Perseverance
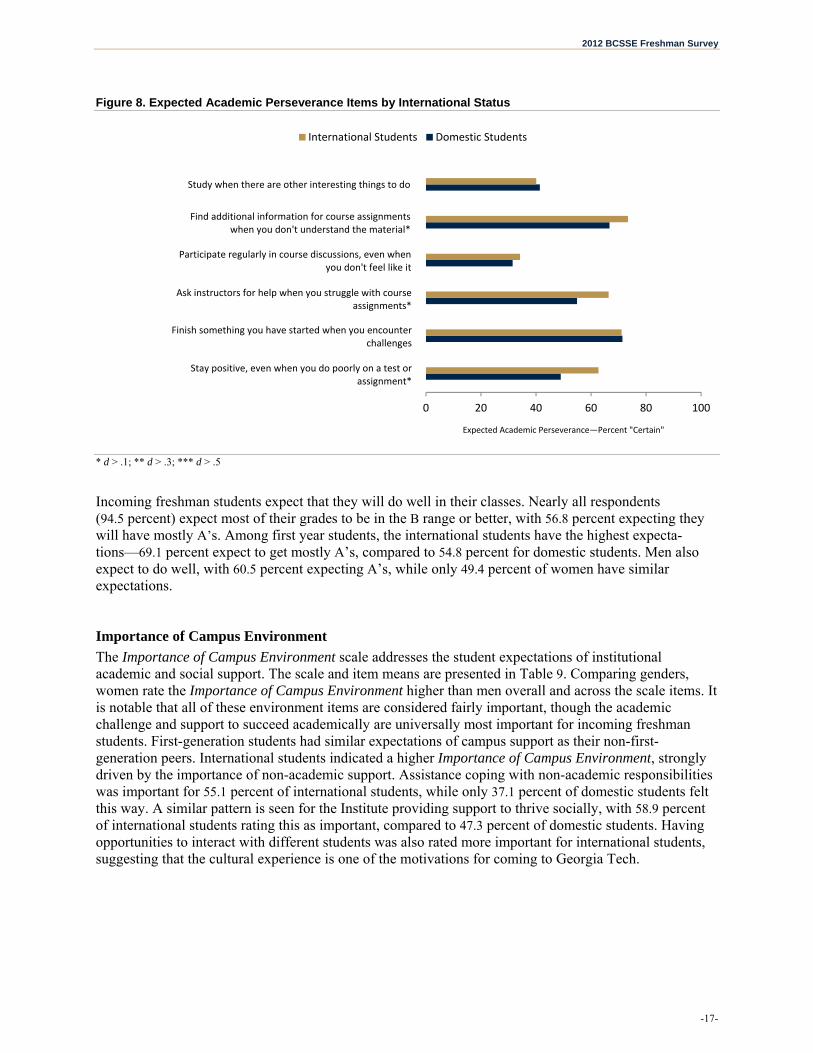
The Expected Academic Perseverance scale is a measure of the students’ certainty that they will persist in the face of academic adversity. This is not a self-rating of ability, but one of drive and attitude. Results are presented in Table 8. Overall, students expressed a fairly strong sense of perseverance. The strongest areas are in their intent to finish work in spite of challenges (71.6 percent). There are few differences between groups on this item, with men having a stronger inclination to stay positive when they perform poorly and women more likely to seek out additional information. Similarly, first-generation students are slightly more confident that they will ask for assistance from instructors. International students, while not as confident in their preparation, are more certain in their ability to persevere. The majority of international students (62.7 percent) were certain they could stay positive in spite of possible poor performance, while only 49.0 percent of domestic students felt this way. International students also expressed more confidence in their coping strategies than did domestic students, being more likely to ask instructors for help (66.4 percent vs. 54.9 percent, respectively) and find additional information when they have trouble with the course material (73.4 percent vs. 66.7 percent, respectively). Table 8. Expected Academic Perseverance Items
*d > .1; **d > .3; ***d > .5 GT Total Female Male
Eff. Size
First-Generation
Non-First- Generation
Eff. Size
Expected Academic Perseverance Scale Score (0-10)
7.08 7.13 7.05 7.21 7.07
During the coming school year, how certain are you that you will do the following? 1 = Not at all certain, 6 = Very certain
[Percent responding 5 or 6]
1. Study when there are other interesting things to do
41.6 43.8 40.4 40.9 41.8
2. Find additional information for course assignments when you don't understand the material
67.7 73.2 64.6 * 70.7 67.4
3. Participate regularly in course discussions, even when you don't feel like it
32.1 34.4 30.9 37.6 31.6
4. Ask instructors for help when you struggle with course assignments
56.8 59.4 55.4 65.1 56.0 *
5. Finish something you have started when you encounter challenges
71.6 71.2 71.8 72.1 71.7
6. Stay positive, even when you do poorly on a test or assignment
50.6 43.5 54.5 * 49.2 50.8
2012 BCSSE Freshman Survey
-17-
Figure 8. Expected Academic Perseverance Items by International Status
* d > .1; ** d > .3; *** d > .5
Incoming freshman students expect that they will do well in their classes. Nearly all respondents (94.5 percent) expect most of their grades to be in the B range or better, with 56.8 percent expecting they will have mostly A’s. Among first year students, the international students have the highest expecta-tions—69.1 percent expect to get mostly A’s, compared to 54.8 percent for domestic students. Men also expect to do well, with 60.5 percent expecting A’s, while only 49.4 percent of women have similar expectations. Importance of Campus Environment
The Importance of Campus Environment scale addresses the student expectations of institutional academic and social support. The scale and item means are presented in Table 9. Comparing genders, women rate the Importance of Campus Environment higher than men overall and across the scale items. It is notable that all of these environment items are considered fairly important, though the academic challenge and support to succeed academically are universally most important for incoming freshman students. First-generation students had similar expectations of campus support as their non-first-generation peers. International students indicated a higher Importance of Campus Environment, strongly driven by the importance of non-academic support. Assistance coping with non-academic responsibilities was important for 55.1 percent of international students, while only 37.1 percent of domestic students felt this way. A similar pattern is seen for the Institute providing support to thrive socially, with 58.9 percent of international students rating this as important, compared to 47.3 percent of domestic students. Having opportunities to interact with different students was also rated more important for international students, suggesting that the cultural experience is one of the motivations for coming to Georgia Tech.
0 20 40 60 80 100
Expected Academic Perseverance—Percent "Certain"
International Students Domestic Students
Study when there are other interesting things to do
Find additional information for course assignments when you don't understand the material*
Participate regularly in course discussions, even when you don't feel like it
Ask instructors for help when you struggle with course assignments*
Finish something you have started when you encounter challenges
Stay positive, even when you do poorly on a test or assignment*

Georgia Tech Office of Assessment
-18-
Table 9. Importance of Campus Environment Items
*d > .1; **d > .3; ***d > .5 GT Total Female Male
Eff. Size
First-Generation
Non-First- Generation
Eff. Size
Importance of Campus Environment Scale Score (0-10)
7.43 7.75 7.25 ** 7.49 7.43
How important is it to you that your college or university provides each of the following? 1 = Not important, 6 = Very important
[Percent responding 5 or 6]
1. A challenging academic experience 71.5 74.2 70.0 * 71.5 71.6
2. Support to help you succeed academically 84.9 91.0 81.4 ** 84.6 84.9
3. Opportunities to interact with students from different economic, social, and racial or ethnic backgrounds
56.3 62.8 52.7 * 56.2 56.2
4. Assistance coping with your non-academic responsibilities (work, family, etc.)
39.7 42.4 38.1 * 40.4 39.4
5. Support to help you thrive socially 49.2 55.2 45.7 * 50.0 49.2
6. Opportunities to attend campus events and activities
67.6 76.4 62.7 ** 63.7 68.2
Figure 9. Importance of Campus Environment Items by International Status
* d > .1; ** d > .3; *** d > .5
0 20 40 60 80 100
Perceived Academic Preparation—Percent "Important"
International Students Domestic Students
A challenging academic experience
Support to help you succeed academically
Opportunities to interact with students from different economic, social, and racial or ethnic backgrounds**
Assistance coping with your non‐academic responsibilities (work, family, etc.)**
Support to help you thrive socially *
Opportunities to attend campus events and activities
2012 BCSSE Freshman Survey
-19-
Other Expectations
Finances
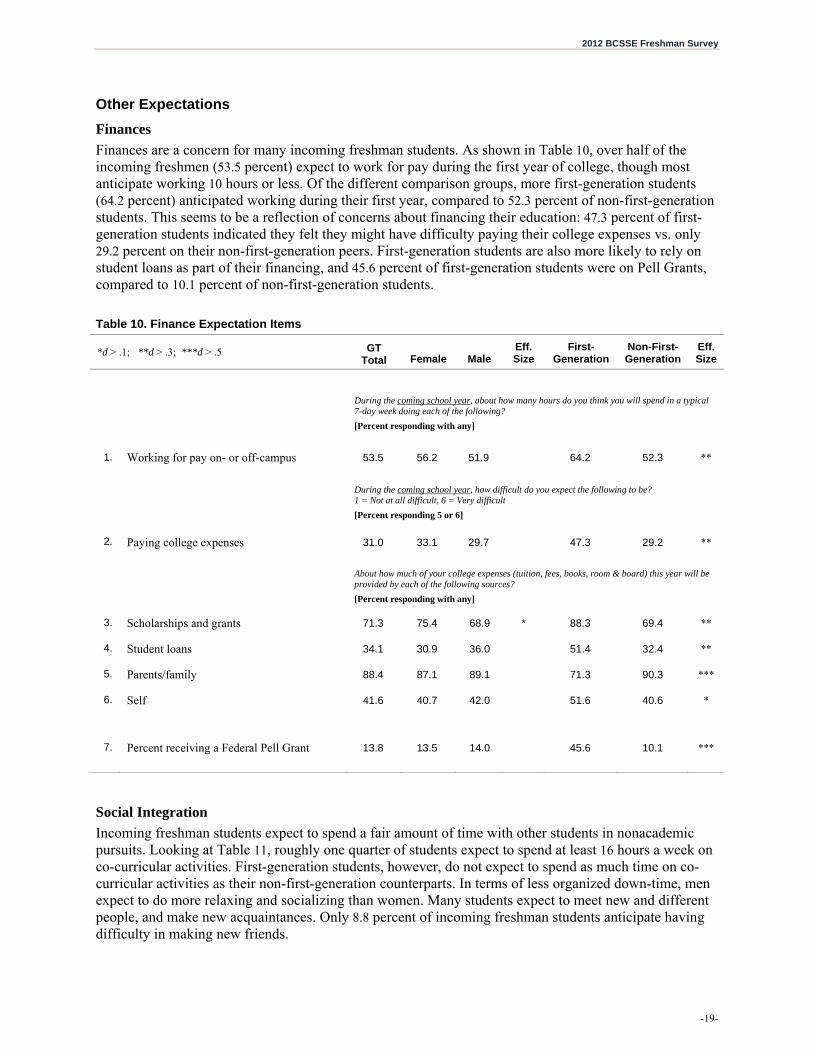
Finances are a concern for many incoming freshman students. As shown in Table 10, over half of the incoming freshmen (53.5 percent) expect to work for pay during the first year of college, though most anticipate working 10 hours or less. Of the different comparison groups, more first-generation students (64.2 percent) anticipated working during their first year, compared to 52.3 percent of non-first-generation students. This seems to be a reflection of concerns about financing their education: 47.3 percent of first-generation students indicated they felt they might have difficulty paying their college expenses vs. only 29.2 percent on their non-first-generation peers. First-generation students are also more likely to rely on student loans as part of their financing, and 45.6 percent of first-generation students were on Pell Grants, compared to 10.1 percent of non-first-generation students. Table 10. Finance Expectation Items
*d > .1; **d > .3; ***d > .5 GT Total Female Male
Eff. Size
First-Generation
Non-First- Generation
Eff. Size
During the coming school year, about how many hours do you think you will spend in a typical 7-day week doing each of the following?
[Percent responding with any]
1. Working for pay on- or off-campus 53.5 56.2 51.9 64.2 52.3 **
During the coming school year, how difficult do you expect the following to be? 1 = Not at all difficult, 6 = Very difficult
[Percent responding 5 or 6]
2. Paying college expenses 31.0 33.1 29.7 47.3 29.2 **
About how much of your college expenses (tuition, fees, books, room & board) this year will be provided by each of the following sources?
[Percent responding with any]
3. Scholarships and grants 71.3 75.4 68.9 * 88.3 69.4 **
4. Student loans 34.1 30.9 36.0 51.4 32.4 **
5. Parents/family 88.4 87.1 89.1 71.3 90.3 ***
6. Self 41.6 40.7 42.0 51.6 40.6 *
7. Percent receiving a Federal Pell Grant 13.8 13.5 14.0 45.6 10.1 ***
Social Integration
Incoming freshman students expect to spend a fair amount of time with other students in nonacademic pursuits. Looking at Table 11, roughly one quarter of students expect to spend at least 16 hours a week on co-curricular activities. First-generation students, however, do not expect to spend as much time on co-curricular activities as their non-first-generation counterparts. In terms of less organized down-time, men expect to do more relaxing and socializing than women. Many students expect to meet new and different people, and make new acquaintances. Only 8.8 percent of incoming freshman students anticipate having difficulty in making new friends.

Georgia Tech Office of Assessment
-20-
Other than the previously discussed expectations for diversity, international students do not differ drastically from their domestic counterparts in terms of expectations for socialization. International students expect to spend a bit less time socializing compared to domestic students—18.5 percent expect to spend more than 15 hours a week relaxing and socializing, compared to 22.1 percent of their domestic peers. About 10 percent of international students anticipate difficulty in making new friends, slightly higher than their domestic cohort (8.8 percent).
For incoming freshman students, 54.9 percent have close friends that will be at GT as well. Unsurprisingly, students who traveled the least distance to come to GT are more likely to have friends come here as well; 78.6 percent of students traveling 100 miles or less to come to GT will have close friends here, compared to 37.8 percent of those traveling over 100 miles. Women were slightly more likely to come alone, with only 51.8 percent having close friends at GT, compared to 56.6 percent of men. International students are not alone in this regard, with 41.1 percent having at least one close friend coming to GT with them. Those who came with friends expect to spend more time relaxing and socializing, with 23.4 percent expecting to spend at least 16 hours a week socializing, compared to 19.6 percent of those who came on their own. More students coming alone expect to have trouble making new friends—although the percentages are still relatively low—with only 10.4 percent of those coming alone expecting difficulties, compared to 7.5 percent of those coming with friends. The benefits of friendship seem to influence their expectations on performance, with 60.1 percent of those with close friends expecting to get mostly A’s in their classes, compared to 52.7 percent who came on their own.
Table 11. Social Integration Expectation Items
*d > .1; **d > .3; ***d > .5 GT Total Female Male
Eff. Size
First-Generation
Non-First- Generation
Eff. Size
During the coming school year, about how many hours do you think you will spend in a typical 7-day week doing each of the following?
[Percent responding “16 or more hours per week”]
1. Participating in co-curricular activities 24.4 23.4 24.8 19.3 24.9 *
2. Relaxing and socializing 21.6 15.9 24.9 * 19.2 21.8
During the coming school year, about how often do you expect to do each of the following?
[Percent responding “Often” or “Very often”]
3. Have serious conversations with students of a different race or ethnicity than your own
78.0 79.4 77.1 78.7 77.8
4. Have serious conversations with students who are very different from you in terms of their religious beliefs, political opinions, or personal values
76.6 79.8 74.9 * 77.9 76.5
During the coming school year, how difficult do you expect the following to be? 1 = Not at all difficult, 6 = Very difficult
[Percent responding 5 or 6]
5. Making new friends 8.8 9.5 8.3 10.1 8.6

2012 BCSSE Freshman Survey
-21-
SUMMARY
The 2012 Beginning College Survey of Student Engagement provides a new look at Georgia Tech’s incoming freshman students, with particular focus on academic engagement and their expectations for the coming year. As the first step in a new cycle of collection, this survey provides a strong starting point for future students and for later follow-up with other measures of engagement. Georgia Tech continues to draw high quality students from diverse backgrounds, including those who are the first in their families to go to college and many from abroad. No matter where they come from, the students coming here feel they are well-prepared for college, if a bit optimistic in some areas. First-generation students attending GT come with many of the same expectations as others but with greater concerns regarding their finances. The international student population is a unique group with some differences in their expectations, particularly in regard to their interactions with others and the non-academic support they expect to have at Georgia Tech. Incoming GT students are expecting to encounter new people, ideas, and experiences. They expect to work and interact with other students and with faculty, both in and out of the classroom. Most of all, they expect to succeed. Incoming GT freshmen are very optimistic about their future. Their expectations may be grander than reality permits, as seen from previous first-year students. Whether or not this is problematic requires continued monitoring of student opinions and behavior. The Office of Assessment will continue to track both expectations and reality through longitudinal studies.