BC Irrigation Management Guide - British Columbia · The primary purpose of this B.C. Irrigation...
46
B B . . C C . . I I R R R R I I G G A A T T I I O O N N M M A A N N A A G G E E M M E E N N T T G G U U I I D D E E Appendix C – Blank Worksheets Editor Ted W. van der Gulik, P.Eng. Authors Stephanie Tam, B.A.Sc. T. Janine Nyvall, P.Eng. Lance Brown, Eng Tech Prepared by B.C. Ministry of Agriculture, Food and Fisheries Resource Management Branch Published by Irrigation Industry Association of British Columbia 2005 ISSUE
Transcript of BC Irrigation Management Guide - British Columbia · The primary purpose of this B.C. Irrigation...

BB..CC.. IIRRRRIIGGAATTIIOONN MMAANNAAGGEEMMEENNTT GGUUIIDDEE
Appendix C – Blank Worksheets
Editor
Ted W. van der Gulik, P.Eng.
Authors
Stephanie Tam, B.A.Sc. T. Janine Nyvall, P.Eng. Lance Brown, Eng Tech
Prepared by
B.C. Ministry of Agriculture, Food and Fisheries Resource Management Branch
Published by
Irrigation Industry Association of British Columbia
2005 ISSUE

LIMITATION OF LIABILITY AND USER’S RESPONSIBILITY
The primary purpose of this B.C. Irrigation Management Guide is to provide irrigation professionals and consultants with a methodology to assess the irrigation system performance and manage the system effectively. While every effort has been made to ensure the accuracy and completeness of these materials, additional materials may be required to complete more advanced assessments. Advice of appropriate professionals and experts may assist in completing assessments that are not covered in this Guide. All information in this publication and related materials are provided entirely “as is” and no representations, warranties or conditions, either expressed or implied, are made in connection with your use of, or reliance upon, this information. This information is provided to you as the user entirely at your risk. The British Columbia Ministry of Agriculture, Food and Fisheries and the Irrigation Industry Association of British Columbia, their Directors, agents, employees, or contractors will not be liable for any claims, damages or losses of any kind whatsoever arising out of the use of, reliance upon, this information.
Appendix C Blank Worksheets C-1
C BLANK WORKSHEETS
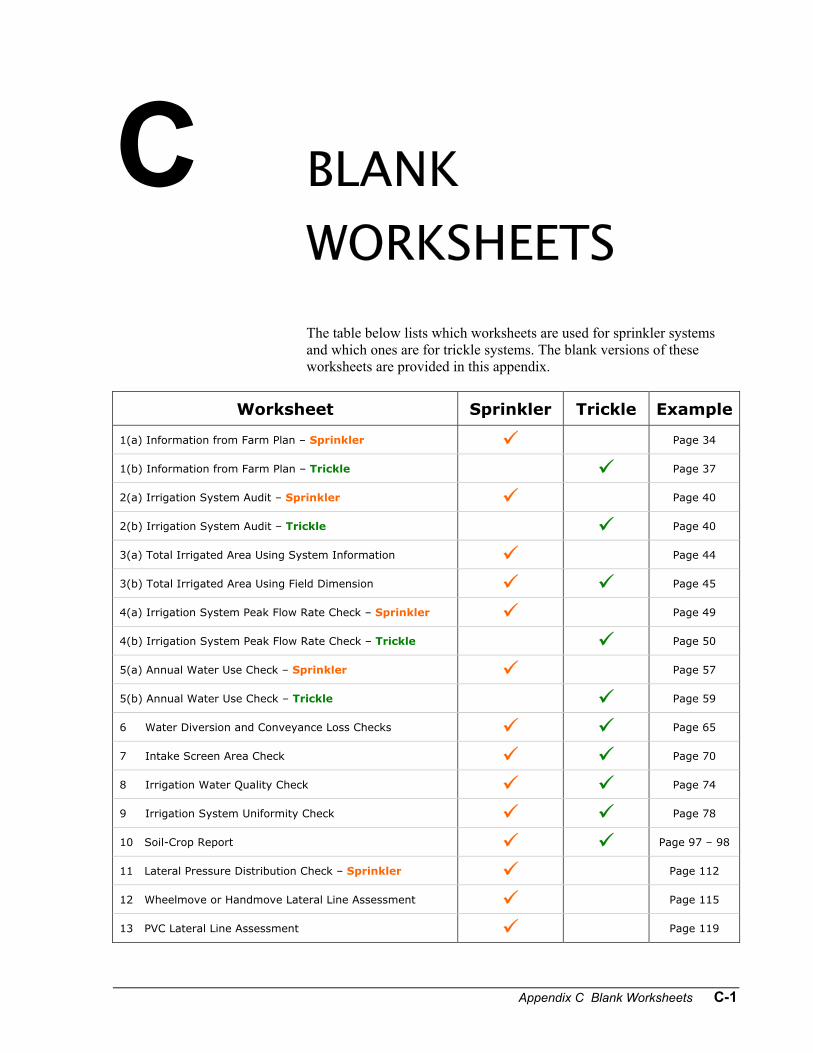
The table below lists which worksheets are used for sprinkler systems and which ones are for trickle systems. The blank versions of these worksheets are provided in this appendix.
Worksheet Sprinkler Trickle Example
1(a) Information from Farm Plan – Sprinkler Page 34
1(b) Information from Farm Plan – Trickle Page 37
2(a) Irrigation System Audit – Sprinkler Page 40
2(b) Irrigation System Audit – Trickle Page 40
3(a) Total Irrigated Area Using System Information Page 44
3(b) Total Irrigated Area Using Field Dimension Page 45
4(a) Irrigation System Peak Flow Rate Check – Sprinkler Page 49
4(b) Irrigation System Peak Flow Rate Check – Trickle Page 50
5(a) Annual Water Use Check – Sprinkler Page 57
5(b) Annual Water Use Check – Trickle Page 59
6 Water Diversion and Conveyance Loss Checks Page 65
7 Intake Screen Area Check Page 70
8 Irrigation Water Quality Check Page 74
9 Irrigation System Uniformity Check Page 78
10 Soil-Crop Report Page 97 – 98
11 Lateral Pressure Distribution Check – Sprinkler Page 112
12 Wheelmove or Handmove Lateral Line Assessment Page 115
13 PVC Lateral Line Assessment Page 119

C-2 B.C. Irrigation Management Guide
14 Wheelmove or Handmove Sprinkler Spacing Check Page 122
15 Assessment of Sprinkler System Performance Page 128
16 Assessment of Travelling Gun Performance Page 141
17 Centre Pivot System Performance Check Page 151
18 Equipment and Layout Check – Trickle Page 163
19 System Operating Time – Trickle Page 170
20 Determining Evaporation Using an Evaporation Pan Page 188
21 Crop Water Use Page 194
22 Sprinkler Irrigation Scheduling Using Water Budget Method Page 197 –
198 23 Trickle Irrigation Scheduling Using Plant Water
Requirement Method Page 200
24 Trickle Irrigation Scheduling Using Water Budget Method Page 202
25 Mainline Friction Loss Page 213
26 Pump Assessment Page 217
27 Irrigation Operating Cost Page 223
28 Chemigation Information Page 228, 230

Appendix C Blank Worksheets C-3
Worksheet 1(a) Information from Farm Plan – SPRINKLER
INFORMATION Value and Box No. Unit Source
Worksheet 3(a) Total Irrigated Area Using System Information Irrigation interval per pass ………….………………….. 1 days/pass Farm info Irrigation sets per day ..……………...…………...…….. 2 sets Farm info Sprinkler spacing ………...………….………………….. 3 ft Farm info Number of sprinklers ..……………...……….....………. 4 sprinklers Farm info Distance moved per set ..……………...……………….. 5 ft Farm info Worksheet 3(b) Total Irrigated Area Using Field Dimension Field width ………………...………….………………….. 1 ft Farm info Field length ..……………...…………...………………… 2 ft Farm info Worksheet 4(a) Irrigation System Peak Flow Rate Check Calculated Irrigation System Peak Flow Rate Peak flow rate on water licence or provided by irrigation district or water purveyor ...…………………. 2 US gpm
Water licence or purveyor
Peak evapotranspiration (ET) in …. – in/d Table 3.1 Estimated peak flow rate requirement per acre ……... 3 US gpm/acre
Table 3.2 or 3.3
Actual Irrigation System Flow Rate Flow rate metered or provided by district …………….. 5 US gpm
Meter or district
Pump Specifications: Model number …………………………………………… – Field check Impellor size ……………………………………………... – in Dia. Revolution per minute (rpm) …………………………… – rpm
Pump name plate
Flow rate …………………………………………………. 6 US gpm Pump curve Nozzle Specifications: Size ………………………………………………………. – in x in Field check Operating pressure …………………………………….. – psi Field check Flow rate ………………………………………………… 7 US gpm Farm plan Number of nozzles ……………………………………… 8 nozzles Farm plan Worksheet 5(a) Annual Water Use Check Calculated Annual Water Use Requirement Annual water withdrawal stated on water licence …… 2 ac-ft
Water licence
Estimated annual crop water requirement …………… 3 in Table 3.4 Application efficiency of irrigation system ……………. 4 % Table 6.1 Meter Information Meter reading at start of year ………………………….. 6 US gal Meter reading at end of year …………………………... 7 US gal
Water purveyor

C-4 B.C. Irrigation Management Guide
Pump Specifications Pump horsepower ………………………………………. 9 hp
Pump name plate
Energy consumption for entire year …………………... 10 KWh Hydro bill Refer to Worksheet 4(a) for the rest of the information regarding pump Irrigation Specifications Irrigation interval ………………………………………… 16 days Farm plan Number of irrigations per year ………………………… 17 Farm plan Worksheet 6 Water Diversion and Conveyance Loss Checks Conveyance channel flow rate at/near diversion ……. 1 US gpm Site Overflow in channel 2 US gpm Site Number of operating days per season ……………….. 3 days Site Amount of water licensed ……………………………… 4 ac-ft
Water licence
Conveyance channel flow rate at/near intake ……….. 5 US gpm Site Worksheet 7 Intake Screen Area Check Screen mesh size ………………………………………. 2 mesh Site Percent open area of mesh size ………………………. 3 % Table 4.3 For flat screen, Number of screened surfaces …………………………. 5 ft Site Length of screen ………………………………………… 6 ft Site Width of screen …………………………………………. 7 ft Site For cylindrical screen, Diameter of screen ……………………………………… 9 ft Site Length of screen ………………………………………… 10 ft Site Worksheet 8 Irrigation Water Quality Check Sodium adsorption ratio (SAR) ………………………... 1 Laboratory Electrical conductivity (EC) of water ………………….. 3 dS/m Table 4.4 E. coli count ……………………………………………… 5 cfu/100 ml Laboratory Fecal coliform count ……………………………………. 6 cfu/100 ml Laboratory

Appendix C Blank Worksheets C-5
Worksheet 1(b) Information from Farm Plan – TRICKLE INFORMATION Value and Box No. Unit Source
Worksheet 3(b) Total Irrigated Area Field width ….……………………………………………. 1 ft Farm info. Field length ...……………………………………………. 2 ft Farm info. Worksheet 4(b) Irrigation System Peak Flow Rate Check Calculated Irrigation System Peak Flow Rate Peak flow rate on water licence or provided by irrigation district or water purveyor ...…………………. 2 US gpm
Water licence or purveyor
Peak evapotranspiration (ET) in …. – in/d Table 3.1 Estimated peak flow rate requirement per acre ……... 3 US gpm/acre
Table 3.2 or 3.3
Actual Irrigation System Flow Rate Flow rate metered or provided by district …………….. 5 US gpm
Meter or district
Pump Specifications: Model number …………………………………………… – Field check Impellor size ……………………………………...……… – Revolution per minute (rpm) ……………………….….. – rpm
Pump name plate
Flow rate …………………………………………………. 6 US gpm Pump curve Emitter Specifications: Size ……………………………………….…...…………. – in I.D. Field check Operating pressure ……………………………….…….. – psi Field check Flow rate (zone 4) .………………………………...……. 7 gph Farm plan Number of emitters (zone 4) …………………………… 8 emitters Farm plan
Worksheet 5(b) Annual Water Use Check Calculated Annual Water Use Requirement Water withdrawal amount on water licence ………….. 2 ac-ft
Water licence
Estimated annual crop water requirement …………… 3 in Table 3.4 Crop adjustment factor 4 Table 4.2 Application efficiency of irrigation system ……………. 5 % Table 6.1 Meter Information Meter reading at start of year ………………………….. 6 US gal Meter reading at end of year …………………………... 7 US gal
Water purveyor
Pump Specifications Pump horsepower ………………………………………. 10 hp
Pump name plate
Energy consumption for entire year …………………... 11 KWh Hydro bill Refer to Worksheet 4(b) for the rest of the information regarding pump
C-6 B.C. Irrigation Management Guide
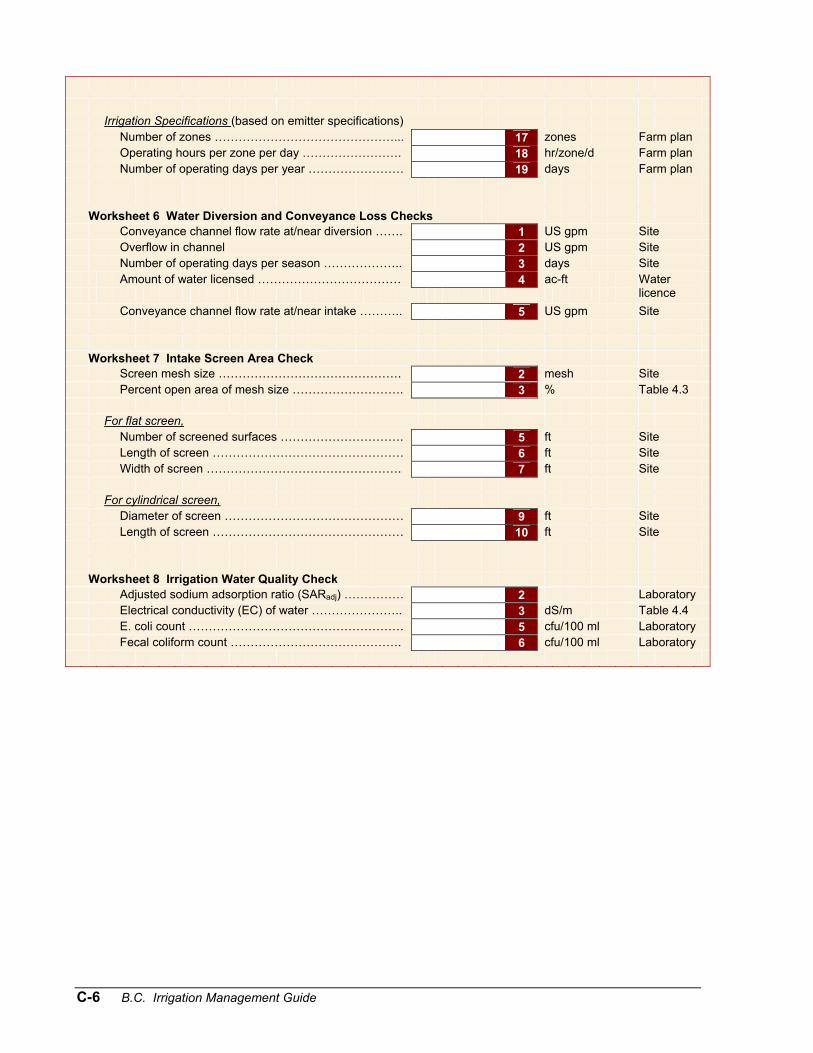
Irrigation Specifications (based on emitter specifications) Number of zones ………………………………………... 17 zones Farm plan Operating hours per zone per day ……………………. 18 hr/zone/d Farm plan Number of operating days per year …………………… 19 days Farm plan Worksheet 6 Water Diversion and Conveyance Loss Checks Conveyance channel flow rate at/near diversion ……. 1 US gpm Site Overflow in channel 2 US gpm Site Number of operating days per season ……………….. 3 days Site Amount of water licensed ……………………………… 4 ac-ft
Water licence
Conveyance channel flow rate at/near intake ……….. 5 US gpm Site Worksheet 7 Intake Screen Area Check Screen mesh size ………………………………………. 2 mesh Site Percent open area of mesh size ………………………. 3 % Table 4.3 For flat screen, Number of screened surfaces …………………………. 5 ft Site Length of screen ………………………………………… 6 ft Site Width of screen …………………………………………. 7 ft Site For cylindrical screen, Diameter of screen ……………………………………… 9 ft Site Length of screen ………………………………………… 10 ft Site Worksheet 8 Irrigation Water Quality Check Adjusted sodium adsorption ratio (SARadj) …………… 2 Laboratory Electrical conductivity (EC) of water ………………….. 3 dS/m Table 4.4 E. coli count ……………………………………………… 5 cfu/100 ml Laboratory Fecal coliform count ……………………………………. 6 cfu/100 ml Laboratory

Appendix C Blank Worksheets C-7
Worksheet 2(a) Irrigation System Audit – SPRINKLER
Checklist: Yes No 1. Are all sprinklers of the same model? ……...………………………....... 2. Are all nozzles of the same size? ……………………………………......
3. Are all sprinkler and lateral spacing uniform (50 – 60% wetted diameter)? …………………………………………………………………..
4. Is the operating pressure in the best range? …………………………… 5. Is pressure differential minimal? ……...………………………………….
Answer: Do the system conditions meet all the minimum standards? Yes - OK
No - See action items.
Worksheet 2(b) Irrigation System Audit – TRICKLE
Checklist: Yes No For each zone, 1. Are all emitters of the same model throughout the zone? ……............ 2. Are all emitters of the same size throughout the zone? ……............... 3. Are all emitter spacing uniform throughout the zone? ……………….... 4. Is pressure differential minimal? ……...…………………………………. 5. Is the same crop or same plant size grown in the zone? …………….. 6. Is the soil type uniform throughout the zone? ……...…………………..
Answer: Do the system conditions meet all the minimum standards? Yes - OK
No - See action items.

C-8 B.C. Irrigation Management Guide
Worksheet 3(a) Total Irrigated Area Using System Information Information: Irrigation interval per pass 1 days/pass Irrigation sets per day 2 sets Sprinkler spacing 3 ft Number of sprinklers 4 sprinklers Distance moved per set 5 ft
Calculation: Step 1. Calculate the number of sets per pass No. of Sets per Pass = Irrigation Interval per pass x Irrigation Sets per Day = 1 days x 2 = 6 sets Step 2. Calculate the field width Field Width = Sprinkler Spacing x No. of Sprinklers = 3 ft x 6 = 7 ft Step 3. Calculate the field length Field Length = Distance Moved per Set x No. of Sets = 5 ft x 6 = 8 ft Step 4. Determine the field area Equation 4.1(a) Field Width x Field Length
Total Irrigated Area = 43,560
7 ft x 8 ft
= 43,560
= 9 acres Repeat the same step for irregular shaped field.
Answer: Total Irrigated Area = Sum of All Field Areas = ( 9 + 9 + 9 ) acres
= 10 acres
Appendix C Blank Worksheets C-9
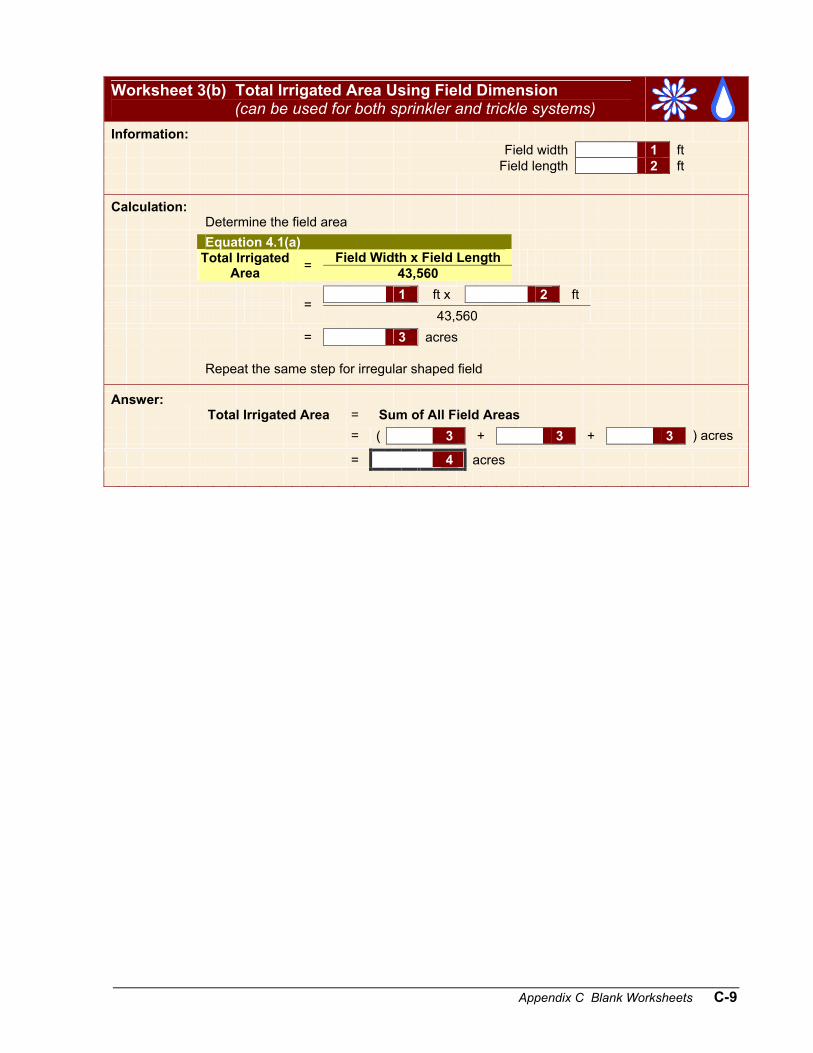
Worksheet 3(b) Total Irrigated Area Using Field Dimension (can be used for both sprinkler and trickle systems)
Information: Field width 1 ft Field length 2 ft
Calculation: Determine the field area Equation 4.1(a) Field Width x Field Length
Total Irrigated Area = 43,560
1 ft x 2 ft
= 43,560
= 3 acres Repeat the same step for irregular shaped field
Answer: Total Irrigated Area = Sum of All Field Areas = ( 3 + 3 + 3 ) acres
= 4 acres

C-10 B.C. Irrigation Management Guide
Worksheet 4(a) System Peak Flow Rate Check - SPRINKLER
Information: Irrigated area (Box 10 of Worksheet 3(a)) 1 acres EITHER peak flow rate on water licence (if stated) 2 US gpm OR peak flow rate requirement per acre (Table 3.3) 3 US gpm/acre
Calculation: Step 1. Determine calculated peak flow rate. Equation 4.2
Calculated Peak Flow Rate = Estimated Peak Flow Rate
Requirement per Acre x Irrigated Area
= 3 US gpm/acre x 1 acres
= 4 US gpm
Step 2. Determine actual irrigation system flow rate using one or more of the following methods: Method 1. Water purveyor restriction or measured flow rate using a meter
Flow rate measured using a meter or provided by district 5 US gpm
Method 2. Pump peak flow rate Irrigation pump peak flow from pump curve 6 US gpm
Method 3. Determine flow rate using sprinkler nozzles Nozzle flow rate from supplier’s tables 7 US gpm No. of nozzles 8 nozzles
Equation 4.3
Sprinkler System Output Flow Rate = Nozzle Flow Rate x No. of Nozzles
= 7 US gpm x 8 nozzles
= 9 US gpm Answer: Step 3. Calculate percent difference of peak flow rate. Equation 4.5 Irrigation System Flow Rate
Percent Difference = Calculated Peak Flow Rate x 100%
Maximum of 5, 6 or 9 US gpm
= 2 or 4 US gpm
x 100%
= 10 %
Is 10 % less than or equal to 100%
Yes Flow rate is not exceeded
No Refer to action items

Appendix C Blank Worksheets C-11
Worksheet 4(b) System Peak Flow Rate Check - TRICKLE
Information: Irrigated area (Box 10 of Worksheet 3(b)) 1 acres EITHER peak flow rate on water licence (if stated) 2 US gpm OR peak flow rate requirement per acre (Table 3.3) 3 US gpm/acre
Calculation: Step 1. Determine calculated peak flow rate. Equation 4.2
Calculated Peak Flow Rate = Estimated Peak Flow Rate
Requirement per Acre x Irrigated Area
= 3 US gpm/acre x 1 acres
= 4 US gpm
Step 2. Determine actual irrigation system flow rate using one or more of the following methods:
Method 1. Water purveyor restriction or measured flow rate using a meter
Flow rate measured using a meter or provided by district 5 US gpm
Method 2. Pump peak flow rate Irrigation pump peak flow from pump curve 6 US gpm
Method 3. Determine flow rate using trickle emitters Emitter flow rate from supplier’s tables 7 gph Number of emitters operating at one time 8 emitters
Equation 4.4
Trickle System Output Flow Rate = Emitter
Flow Rate x No. of Emitters x 0.0167
= 7 gph x 8 emitters x 0.0167
= 9 US gpm Answer: Step 3. Calculate percent difference of peak flow rate. Equation 4.5 Irrigation System Flow Rate
Percent Difference = Calculated Peak Flow Rate x 100%
Maximum of 5, 6 or 9 US gpm
= 2 or 4 US gpm
x 100%
= 10 %
Is 10 % less than or equal to 100%
Yes Flow rate is not exceeded
No Refer to action items

C-12 B.C. Irrigation Management Guide
Worksheet 5(a) Annual Water Use Check - SPRINKLER
Information: Irrigated area (Box 10 of Worksheet 3(a)) 1 acres Water withdrawal amount on water licence (if applicable) 2 ac-ft Estimated annual crop water requirement from Table 3.4 3 in Application efficiency from Table 6.1 4 %
Calculation: Step 1. Determine calculated annual water requirement. Equation 4.6 Estimated Annual Crop Water Requirement
Calculated Annual Water Requirement = Application Efficiency x 100%
3 in
= 4 %
x 100%
= 5 in Step 2. Determine actual annual water use using one or more of the following methods: Method 1. Metered water use Meter reading at start of year 6 US gal Meter reading at end of year 7 US gal
Equation 4.8 Meter Reading at End of Year – Meter Reading at Start of Year
Annual Water Use = 27027 x Irrigated Area
7 US gal – 6 US gal
= 27027 x 1 acres
= 8 in
Method 2. Pump water use Pump horsepower from supplier’s table 9 hp Energy consumption for entire year from hydro bill 10 KWh Pump flow rate from pump curve 11 US gpm
Equation 4.9(a) Pump Power = Pump Horsepower x 0.746 KW/hp = 9 hp x 0.746 KW/hp
= 12 KW
Equation 4.9(b) KWh for Entire Year
Pump Operating Hours = Pump Power
10 KWh
= 12 KW
= 13 hr

Appendix C Blank Worksheets C-13
Equation 4.9(c) Pump Operating Hours x Pump Flow Rate x 0.0022
Annual Water Use = Irrigated Area
13 hr x 11 US gpm x 0.0022
= 1 acres
= 14 in Method 3. Sprinkler system annual water use Sprinkler system output flow rate from Box 5, 6 or 9 of Worksheet 4(a) 15 US gpm Irrigation interval 16 days Number of irrigations per year 17 Equation 4.10 Annual Water Use System Flow Rate x Irrigation Interval x No. of Irrigations x 0.053 = Irrigated Area 15 US gpm x 16 days x 17 x 0.053
= 1 acres
= 18 in
Answer: If there is a water licence, go to Step 3(a), and do Step 3(b) to double-check.
If groundwater is used or water is supplied by a purveyor (no water licence), follow Step 3(b) only.
Step 3(a). Calculate the annual water use and compare it with the water licence withdrawal. Equation 4.12 Annual Water Use [in] x Irrigated Area [acres]
Annual Water Use [ac-ft] = 12 [in/ft]
8, 14 or 18 in x 1 acres
= 12 in/ft
= 19 ac-ft Is 19 ac-ft less than 2 ac-ft?
Yes Water withdrawal not exceeded
No Refer to Section 3.5
Step 3(b).
Calculate percent difference of annual water use. Use the metered water use if available because it is the most accurate method.
Equation 4.5 Actual Annual Water Use
Percent Difference = Calculated Annual Water Requirement x 100%
8,14 or 18 in
= 5 in
x 100%
= 10 %
Is 10 % less than 110% Yes
annual water use not exceeded by more than 10%
No Refer to action items

C-14 B.C. Irrigation Management Guide
Worksheet 5(b) Annual Water Use Check - TRICKLE
Information: Irrigated area (Box 10 of Worksheet 3(b)) 1 acres Water withdrawal amount on water licence (if applicable) 2 ac-ft Estimated annual crop water requirement from Table 3.4 3 in Crop adjustment factor from Table 4.2 4 Application efficiency from Table 6.1 5 %
Calculation: Step 1. Determine calculated annual water requirement. Equation 4.7
Estimated Annual Crop Water Requirement x
Crop Adjustment
Factor
Calculated Annual Water Requirement =
Application Efficiency
x 100%
3 in x 4
= 5 %
x 100%
= 6 in Step 2. Determine actual annual water use using one or more of the following methods: Method 1. Metered water use Meter reading at start of year 7 US gal Meter reading at end of year 8 US gal Equation 4.8 Meter Reading at End of Year – Meter Reading at Start of Year
Annual Water Use = 27027 x Irrigated Area
8 US gal – 7 US gal
= 27027 x 1 acres
= 9 in Method 2. Pump water use Pump horsepower from supplier’s table 10 hp Energy consumption for entire year from hydro bill 11 KWh Pump flow rate from pump curve 12 US gpm Equation 4.9(a) Pump Power = Pump Horsepower x 0.746 KW/hp = 10 hp x 0.746 KW/hp
= 13 KW Equation 4.9(b) KWh for Entire Year
Pump Operating Hours = Pump Power
11 KWh
= 13 KW
= 14 hr

Appendix C Blank Worksheets C-15
Equation 4.9(c) Pump Operating Hours x Pump Flow Rate x 0.0022
Annual Water Use = Irrigated Area
14 hr x 12 US gpm x 0.0022
= 1 acres
= 15 in Method 3. Sprinkler system annual water use Trickle system output flow rate from Box 5, 6 or 9 of Worksheet 4(b) 16 US gpm Number of zones 17 zones Operating hours per zone per day 18 hr/zone/d Number of operating days per year 19 d Equation 4.11(a) Annual Water Use Zone Flow Rate x No. of Zones x Operating Hours x No. of Days x 0.0022 = Irrigated Area 16 17 18 19 US gpm x zones x hr/zone/d x d x 0.0022
=
1 acres
= 20 in
Answer: If there is a water licence, go to Step 3(a), and do Step 3(b) to double-check.
If groundwater is used or water is supplied by a purveyor (no water licence), follow Step 3(b) only.
Step 3(a). Calculate the annual water use and compare it with the water licence withdrawal. Equation 4.12 Annual Water Use [in] x Irrigated Area [acres]
Annual Water Use [ac-ft] = 12 [in/ft]
9, 15 or 20 in x 1 acres
= 12 in/ft
= 19 ac-ft Is 19 ac-ft less than 2 ac-ft?
Yes Water withdrawal not exceeded
No Refer to Section 4.5

C-16 B.C. Irrigation Management Guide
Step 3(b).
Calculate percent difference of annual water use. Use the metered water use if available because it is the most accurate method.
Equation 4.5 Actual Annual Water Use
Percent Difference = Calculated Annual Water Requirement x 100%
9, 15 or 20 in
=
6 in x 100%
= 21 %
Is 21 % less than 110% Yes
annual water use not exceeded by more than 10%
No Refer to action items
Dis
tribu
tion
W
ater
S
cree
n
W
ater
Div
ersi
on &
Ann
ual
Pe
ak
Ir
rigat
ed
Sys
tem
Fa
rm
Uni
form
ity
Qua
lity
A
rea
C
onve
yanc
e Lo
ss
Wat
er U
se
Flow
Rat
e
Are
a
A
udit
P
lan
Appendix C Blank Worksheets C-17
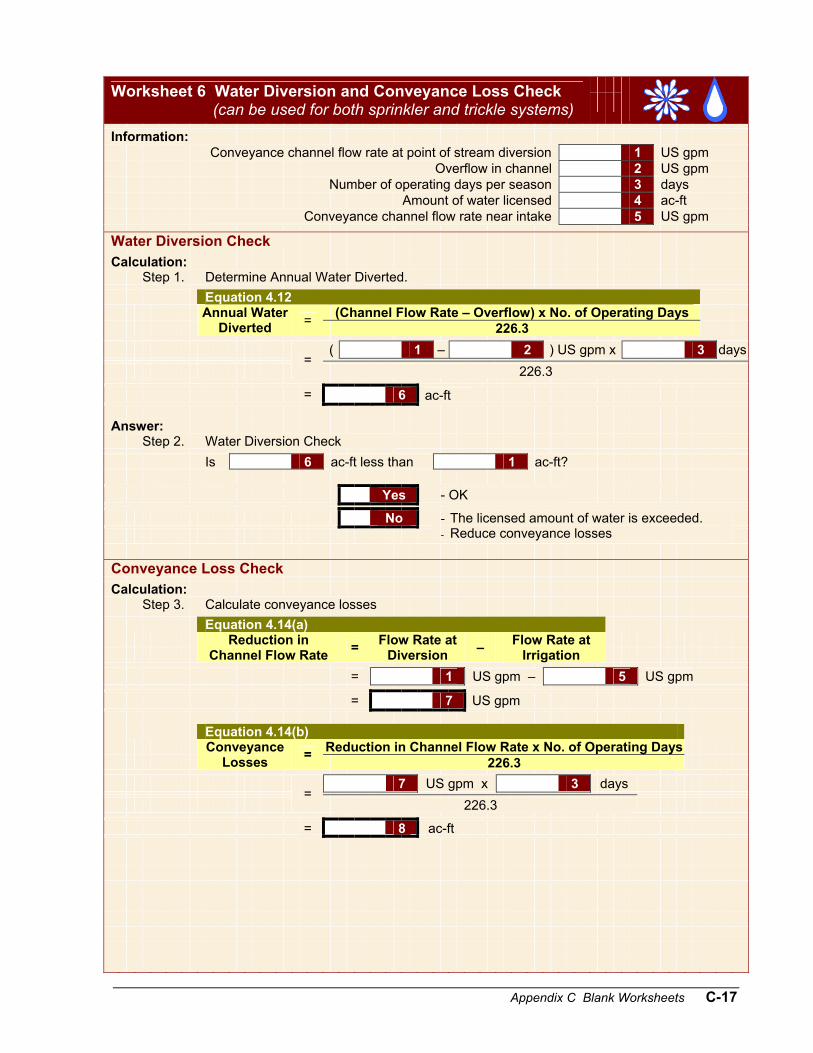
Worksheet 6 Water Diversion and Conveyance Loss Check (can be used for both sprinkler and trickle systems)
Information: Conveyance channel flow rate at point of stream diversion 1 US gpm Overflow in channel 2 US gpm Number of operating days per season 3 days Amount of water licensed 4 ac-ft Conveyance channel flow rate near intake 5 US gpm
Water Diversion Check Calculation: Step 1. Determine Annual Water Diverted. Equation 4.12 (Channel Flow Rate – Overflow) x No. of Operating Days
Annual Water Diverted = 226.3
( 1 – 2 ) US gpm x 3 days
= 226.3
= 6 ac-ft Answer: Step 2. Water Diversion Check Is 6 ac-ft less than 1 ac-ft? Yes - OK
No
- The licensed amount of water is exceeded. - Reduce conveyance losses
Conveyance Loss Check Calculation: Step 3. Calculate conveyance losses Equation 4.14(a)
Reduction in Channel Flow Rate = Flow Rate at
Diversion – Flow Rate at Irrigation
= 1 US gpm – 5 US gpm
= 7 US gpm Equation 4.14(b) Reduction in Channel Flow Rate x No. of Operating Days
Conveyance Losses = 226.3
7 US gpm x 3 days
=
226.3
= 8 ac-ft

C-18 B.C. Irrigation Management Guide
Answer: Step 4. Assess Conveyance Losses
Recommended Maximum Conveyance Losses = Water Licensed Amount x 25%
= 1 ac-ft x 25%
= 9 ac-ft Is 8 ac-ft equal to or less than 9 ac-ft? Yes - OK
No - see action items.
Dis
tribu
tion
W
ater
S
cree
n
W
ater
Div
ersi
on &
Ann
ual
P
eak
Irrig
ated
S
yste
m
Farm
U
nifo
rmity
Q
ualit
y
Are
a
Con
veya
nce
Loss
W
ater
Use
Fl
ow R
ate
A
rea
Aud
it
Pla
n

Appendix C Blank Worksheets C-19
Worksheet 7 Intake Screen Area Check (can be used for both sprinkler and trickle systems)
Information: Irrigation system flow rate from Worksheet 4(a) or 4(b) 1 US gpm Screen mesh size used 2 mesh Percent screen open area of mesh size from Table 4.3 3 % Number of screened surface (for flat screens only) 4 Screen length (for both flat and cylindrical screens) 5 ft Screen width (for flat screens only) 6 ft Screen breadth (for flat screens only if end area is screened) 7 ft Screen diameter (for cylindrical screens only) 8 ft
Calculation: Step 1. Calculate required screen surface area. Equation 4.15 Flow Rate
Suggested Screen Surface Area = 0.448 x % Open Area
1 US gpm
=
0.448 x 3 %
= 9 ft2 Step 2. Calculate actual screen area. Equation 4.16(a) Flat Screen
Total Flat Surface Area = No. of Flat Screened Surface x Length x Width
(+ end area if screened) = 4 x 5 ft x 6 ft ( + 6 ft x 7 ft)
= 10 ft2 Equation 4.16(b) Cylindrical Screen
Total Cylindrical Surface Area = 3.14 x Diameter x Length (+ end area if screened)
3.14 x (Diameter)2 = 3.14 x Diameter x Length + [ 4 ]
3.14 x ( 8 ft)2
= 3.14 x 8 ft x 5
ft + [ 4 ]
= 11 ft2 Answer: Step 3. Is 9 ft2 less than 10 or 11 ft2? Yes - OK
No
- Screen area is too small. Refer to action items.
C-20 B.C. Irrigation Management Guide
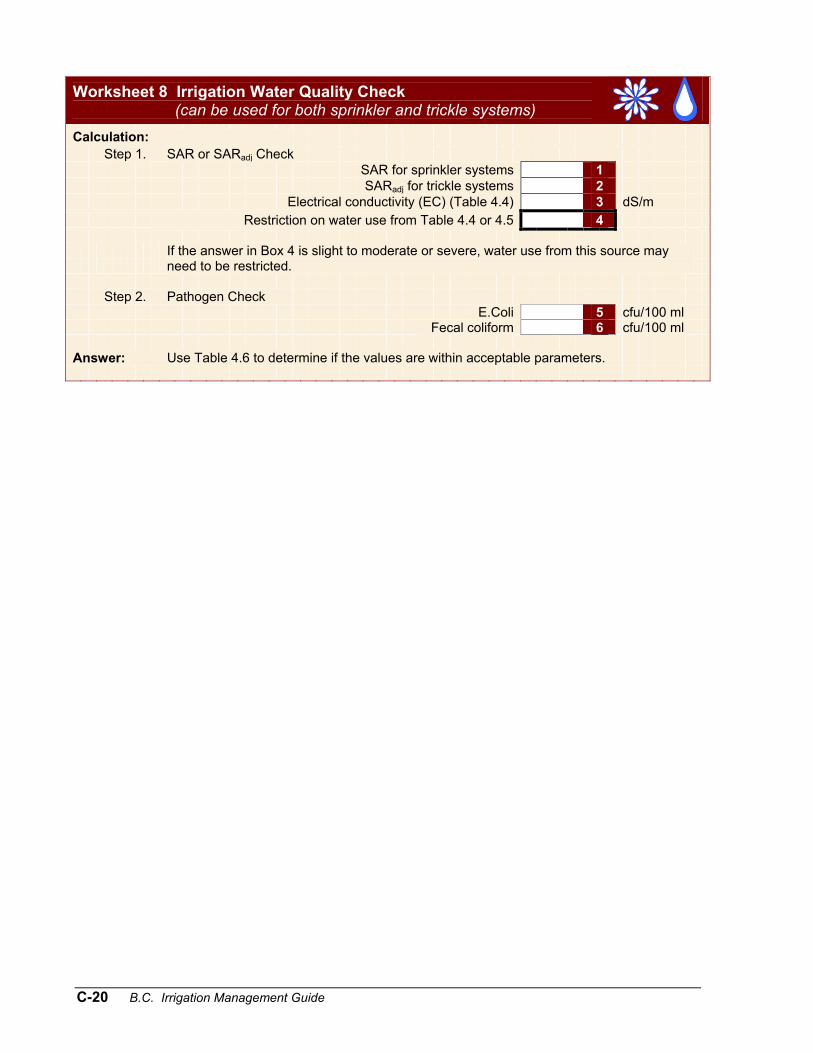
Worksheet 8 Irrigation Water Quality Check (can be used for both sprinkler and trickle systems) Calculation: Step 1. SAR or SARadj Check SAR for sprinkler systems 1 SARadj for trickle systems 2 Electrical conductivity (EC) (Table 4.4) 3 dS/m Restriction on water use from Table 4.4 or 4.5 4
If the answer in Box 4 is slight to moderate or severe, water use from this source may need to be restricted.
Step 2. Pathogen Check E.Coli 5 cfu/100 ml Fecal coliform 6 cfu/100 ml Answer: Use Table 4.6 to determine if the values are within acceptable parameters.

Appendix C Blank Worksheets C-21
Worksheet 9 Irrigation System Uniformity Check (can be used for both sprinkler and trickle systems)
Information/ Calculation: Total number of catch cans 1
Number of cans in the lowest 25% = 1 x 25%
= 2
Water Depth [mm] Ranking Lowest
Quartile [mm] Total 3 4
4 mm 3 mm
LQ = 2
Average Catch Overall = 1
= 5 mm 6 mm Equation 4.17 LQ x 100 DU = Average Catch Overall 5 mm x 100
= 6 mm
= 7 % Answer: Is 7 % more than or equal to 80% (for sprinkler systems) or 90% (for trickle systems) Yes Ok.
No See action items.

C-22 B.C. Irrigation Management Guide
Worksheet 10 Soil-Crop Report Information: Pit A B C Crop
Rooting Depth (RD) [m]
Availability Coefficient (AC) [decimal], Table 5.2
1
1
1
Maximum Application Rate (AR) [mm/hr], Table 5.4
Soil Depth [m] RD* [m] Texture AWSC
[mm/m] SWS [mm] Texture AWSC [mm/m] SWS [mm] Texture AWSC
[mm/m] SWS [mm]
2 3 4 3 4 3 4 2 3 4 3 4 3 4 2 3 4 3 4 3 4 2 3 4 3 4 3 4
Total SWS [mm] 5 5 5MSWD [mm] 6 6 6 Sum of MSWD [mm] 7
* RD = soil depth is only calculated for the soil in the root zone.
Sample Calculations – Pit A: Step 1. Calculate soil water storage (SWS) (a) Calculate SWS for each soil depth interval that has roots. Use the first interval as an example. Equation 5.1 SWS = RD x AWSC = 2 m x 3
= 4 mm
(b) Total SWS within the zone Total SWS = SWS( – m) + SWS( – m) + SWS( – m) + SWS( – m) = ( 4 + 4 + 4 + 4 ) mm
= 5 mm
Step 2. Calculate MSWD (a) Equation 5.2 MSWD = SWS x AC = 5 mm x 1
= 6 mm
(b) Calculate average MSWD for all soil pits Sum of MSWD
Average MSWD = Number of Readings
7 mm
=
= 8 mm
Note: If the soil types and values vary a lot between soil pits, e.g., sandy loam in one area and clay loam in another area, the area within the soil boundaries should be managed separately. Do not average these values. Rather, keep a separate record of each soil area.

Appendix C Blank Worksheets C-23
Worksheet 11 Lateral Pressure Distribution Check – SPRINKLER
Information: Location of Reading Reading First sprinkler 1 psi Sprinkler at ¼ distance 2 psi Sprinkler at ½ distance 3 psi Sprinkler at ¾ distance 4 psi Last sprinkler 5 psi
Highest value 6 psi Lowest value 7 psi Number of readings 8 psi Operating pressure range guide (Table 6.3) 9 psi
Assessment:
Check if all pressure readings are within the recommended operating pressure range (Table 6.3)
Are all pressure readings within 9 psi?
Yes Ok.
No Check action items. Calculation: Step 1. Calculate the average pressure Sum of Readings
Average Pressure = Number of Readings
( 1 + 2 + 3 + 4 + 5 ) psi
= 8
= 10 psi Step 2. Calculate the percent pressure difference Equation 6.1 Highest Value – Lowest Value
Percent Pressure Difference = Average Value x 100%
1 psi – 2 psi
= 5 psi
x 100%
= 6 % Answer: Is 6 % less than 20%? Yes Ok.
No Check action items.

C-24 B.C. Irrigation Management Guide
Worksheet 12 Wheelmove or Handmove Lateral Line Assessment
Note:
Worksheet 11 should be completed to ensure all sprinklers are operating in the proper pressure range. All measurements are in imperial units to facilitate using the tables in the B.C. Sprinkler Irrigation Manual. Appendix B provides conversions from imperial to metric units.
Information:
The data shown in the boxes below was determined from the site. The data is evaluated with the information provided in the sprinkler selection sheets (Table 3.3 to 3.9 of the B.C. Sprinkler Irrigation Manual)
System type and location Sprinkler spacing 1 ft x ft Nozzle flow rate 2 gpm Average operating pressure 3 psi Pressure at the start of the lateral 4 psi Pipe size(s) along lateral (diameters and % split) 5 Number of nozzles operating at one time on the lateral 6
Assessment: Check that the nozzle size and pressure in use match those on the chart.
Step 1. Assess the sprinkler operating pressure at the start of the lateral Recommended pressure at the start of the lateral 8 psi Is 4 psi less than or equal to 8 psi? Yes Ok. No Check action items. Step 2. Assess the number of sprinklers operating at one time on the lateral Recommended number of sprinklers 9 Is 6 less than or equal to 9 ? Yes Ok. No See action items.

Appendix C Blank Worksheets C-25
Worksheet 13 PVC Lateral Line Assessment
Information: Sprinkler operating pressure 1 psi Elevation change (10 ft x 0.433 psi) 2 psi Maximum friction loss = Pressure at the Start of the Lateral x 20% = 1 psi x 20%
= 3 psi
Nozzle Number
Total Flow Rate
[US gpm]
Pipe Diameter
[in]
Pipe Length
[ft]
Friction Loss
[psi/100 ft]
Friction Loss per Length
[psi] ÷ 100 ft x = ÷ 100 ft x = ÷ 100 ft x = ÷ 100 ft x = ÷ 100 ft x = ÷ 100 ft x = ÷ 100 ft x = ÷ 100 ft x = ÷ 100 ft x = ÷ 100 ft x = Total friction loss (sum of the right most column) = 4 psi Miscellaneous loss = 4 psi x 10% = 5 psi
Total friction loss (including miscellaneous loss)
= 4 psi + 5 psi = 6 psi Total lateral line friction loss (elevation loss + total friction loss)
= 2 psi + 6 psi = 7 psi Answer: Is 7 psi less than 3 psi?
Yes Total friction loss is fine. No Check action items.

C-26 B.C. Irrigation Management Guide
Worksheet 14 Wheelmove or Handmove Sprinkler Spacing Check
Information: Nozzle type Nozzle size (diameter) 1 in Lateral spacing 2 ft Operating pressure 3 psi Maximum wind speed 4 km/hr
Calculation: Diameter of throw (Table 6.5) 5 ft Spacing as a percentage of wetted diameter (Table 6.4) 6 % Equation 6.2
Recommended Spacing = Sprinkler Wetter
Diameter x Spacing as a Percentage of Wetter Diameter
= 5 ft x 6 %
= 7 ft
For a rectangular spacing, the maximum spacing should not exceed the recommended value by 15%.
Maximum Spacing = 7 ft x 115%
= 8 ft Answer: Is 2 ft less than or equal to 8 ft?
Yes Spacing is fine.
No Check action items.

Appendix C Blank Worksheets C-27
Worksheet 15 Assessment of Sprinkler System Performance
Information: System type and location Nozzle flow rate (Box 7, Worksheet 4(a)) 1 US gpm Sprinkler spacing (S1 = 40ft) 2 m Lateral spacing or distance the line is moved (S2 = 60ft) 3 m Stationary guns only, wetted radius (r) 4 m Maximum application rate (Table 5.4) 5 mm/hr Maximum soil water deficit (MSWD) (Box 8, Worksheet 10(a)) 6 mm Application efficiency (AE) 7 % Irrigation set time currently used on farm 8 hr Peak ET rate (Table 3.1) 9 mm/d Number of sets currently used to irrigate the field 10 sets Calculation: Application Rate Check (a) For sprinkler systems, calculate the application rate (AR) Equation 6.3 227 x Q AR = S1 x S2 227 x 1 US gpm
= 2 m x 3 m
= 11 mm/hr For stationary guns only, calculate the instantaneous application rate (IAR) Equation 6.10 227 x Q IAR = 3.14 x r2 227 x 1 US gpm
= 3.14 x ( 4 m)2
= 12 mm/hr (b) Is 11 or 12 mm/hr less than or equal to 5 mm/hr
Yes Ok. No See action items. Maximum Set Time Check (a) Calculate maximum set time Equation 6.4 MSWD x 100 %
Maximum Set Time = AR x AE
6 mm x 100%
= 11 or 12 mm/hr x 7 %
= 13 hr (b) Is 8 hr less than 13 hr?
Yes Ok. No See action items.

C-28 B.C. Irrigation Management Guide
Note: A set time that is convenient to match farm operations is often chosen. The actual operating time for a 12-hour set may be 11.5 hrs to allow time for moving the system, but 12 hours should be used in this calculation to determine the number of sets.
Irrigation Interval Check (a) Calculate the net amount of irrigation water applied during this set time Equation 6.5 AR x AE x Set Time IRR = 100% 11 or 12 mm/hr x 7 % x 8 hr
= 100%
= 14 mm (b) Calculate irrigation interval for the new set time Equation 6.6 IRR
Irrigation Interval = Peak ET Rate
14 mm
= 9 mm/d
= 15 d (c) Calculate the available number of sets that can be applied over the irrigation interval Equation 6.8 24 hr x Irrigation Interval
Available Sets = Set Time
24 hr x 15 d
= 8 hr
= 16 sets (d) Compare the available sets with the actual number of sets to irrigate the field Is 10 sets less than
The system does not need to be run continuously during peak times – see Scenario 1.
close to
The system is able to meet water requirements during peak times – see Scenario 2.
more than
The system may not have the capacity to irrigate the entire field during peak conditions – see Scenario 3.
16 sets? Basic Farm Irrigation Schedule The basic irrigation schedule for this system during peak water use periods is:
Set Time 8 hr
Irrigation Interval 16 d
This will be used as a starting point for irrigation scheduling during peak times of the year. For other times of the year, the irrigation interval may be longer or the set time is reduced.

Appendix C Blank Worksheets C-29
Worksheet 16 Assessment of Travelling Gun Performance
Information: System type and location
Nozzle flow rate 1 US gpm Lane spacing (S = 200 ft) 2 m Wetted radius (r = 165 ft) 3 m Longest travelled distance (L = 1,300 ft) 4 m Time to irrigate the longest travel lane 5 hr Percent of full circle covered (c) 6 Maximum application rate 7 mm/hr Maximum soil water deficit (MSWD) 8 mm Application efficiency (AE) (Table 6.1) 9 % Peak ET rate (Table 3.1) 10 mm/d Actual Irrigation interval 11 d Calculation: Application Rate Check (a) Calculate instantaneous application rate (IAR). Equation 6.10 227 x Q IAR = 3.14 x r2 x c 227 x 1 US gpm
= 3.14 x ( 3 m)2 x 6
= 12 mm/hr (b) Is 12 mm/hr less than 7 mm/hr
Yes Ok. No See action items. Travel Speed Check (a) Calculate the time required to irrigate the longest lane applying the MSWD Equation 6.11 L x S x MSWD T = 2.27 x Q x AE 4 m x 2 m x 8 mm
= 2.27 x 1 US gpm x 9 %
= 13 hr (b) Calculate actual and minimum travel speeds Equation 6.12 L Speed = T 4 m 4 m
Actual Speed =
5 hrMinimum
Speed = 13 hr
= 14 m/hr = 15 m/hr

C-30 B.C. Irrigation Management Guide
(c) Compare the actual and the minimum travel speeds Is 14 m/hr
less than
The system is applying more water than soil can store - causing over-irrigation – see Scenario 1.
close to
(within 10%) The amount applied matches the soil water storage capacity – see Scenario 2.
more than
The system is applying less water than what the soil can store – see Scenario 3.
15 m/hr? Irrigation Interval Check
(a) Calculate the net amount applied Equation 6.13 2.27 x Q x AE IRR = S x Speed 2.27 x 1 US gpm x 9 %
= 2 m x 14 m/hr
= 16 mm Is 16 mm less than or equal to 8 mm?
Yes Ok. No See action items. (b) Calculate irrigation interval during the peak season Equation 6.14 IRR
Irrigation Interval = Peak ET Rate
16 mm
= 10 mm/d
= 17 d (c) Is 11 d
less than
The system does not need to be run continuously during peak times – see Scenario 1.
close to
The system is able to meet water requirements during peak times – see Scenario 2.
more than
The system may not have the capacity to irrigate the entire field during peak conditions – see Scenario 3.
17 d?

Appendix C Blank Worksheets C-31
Worksheet 17 Centre Pivot System Performance Check
Information: System type and location Soil type
Pivot flow rate (Q) 1 US gpm Pivot length (R = 1,300 ft) 2 m Wetted radius (r = 40 ft) 3 m Percentage of full circle irrigated (P) 4 % Rotation speed (N) 5 hr/rev Application efficiency (AE) (Table 6.1) 6 % Maximum soil water deficit (MSWD) 7 mm Peak ET rate (Table 3.1) 8 mm/d Irrigation interval (24 hr) 9 d Calculation: Rotation Time Check (a) Calculate the pivot maximum application rate Equation 6.14 289 x Q PAR = R x r 289 x 1 US gpm
=
2 m x 3 m
= 10 mm/hr (b) Calculate the minimum travel speed Using the calculated PAR from (a) above the (Tm) can be determined from Figure 6.9 Maximum duration of application (Tm) (Figure 6.9) 11 min Equation 6.15 2 r S = Tm 2 x 3 m
= 11 min
= 12 m/min (c) Calculate the maximum rotation time and compare it with the actual rotation time Equation 6.16 3.14 x R N = 30 x S 3.14 x 2 m
= 30 x 12 m/min
= 13 hr/rev Is the actual rotation time 5 hr/rev less than or equal to 13 hr/rev?
Yes Ok. No See action items.

C-32 B.C. Irrigation Management Guide
Irrigation Interval Check (a) Calculate the area irrigated by the pivot Equation 6.18 3.14 x R2 x P A = 10,000 3.14 x ( 2 m )2 x 4
=
10,000
= 14 ha (b) Calculate the net amount applied, and compare it with the MSWD Equation 6.17 Q x Na x AE IRR = A x 4382 1 US gpm x 13 hr/rev x 6 %
=
14 ha x 4382
= 15 mm Is 15 mm less than or equal to 7 mm?
Yes Ok. No See action items. (c) Calculate the irrigation interval, and compare it with the actual value Equation 6.6 IRR
Irrigation Interval = Peak ET Rate
15 mm
= 8 mm/d
= 16 d Is 9 d less than or equal to 16 d?
Yes Ok. No See action items.
Appendix C Blank Worksheets C-33
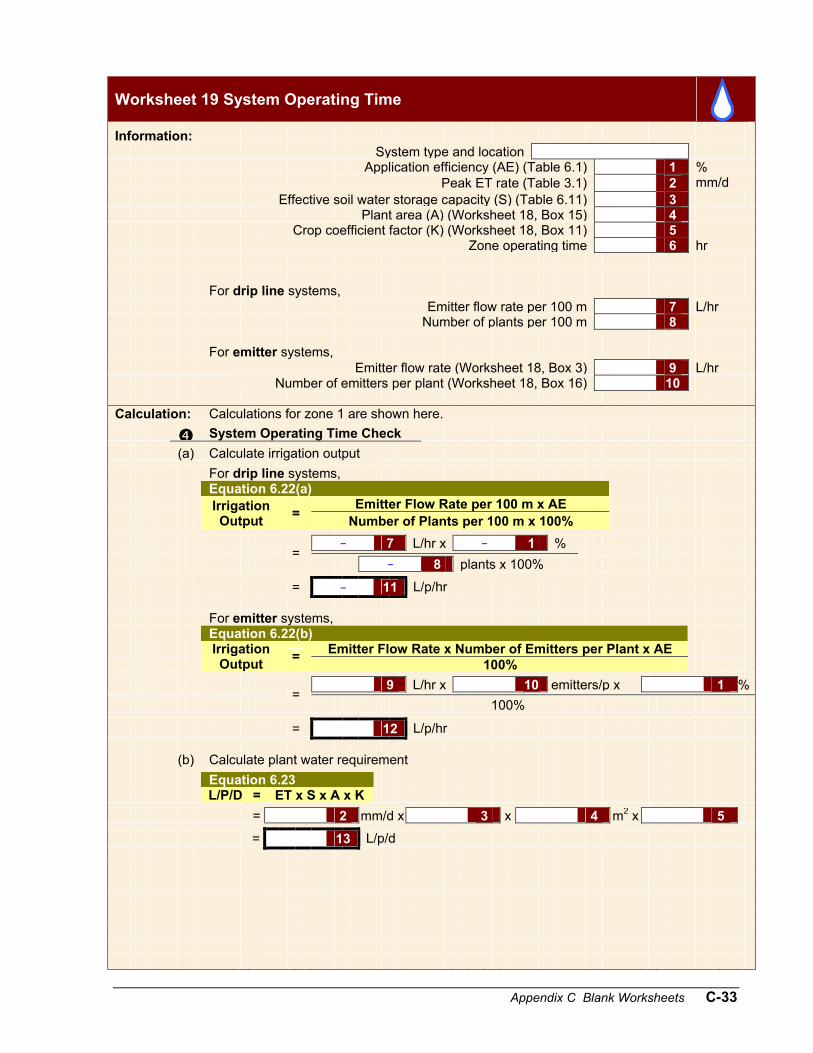
Worksheet 19 System Operating Time
Information: System type and location Application efficiency (AE) (Table 6.1) 1 % Peak ET rate (Table 3.1) 2 mm/d Effective soil water storage capacity (S) (Table 6.11) 3 Plant area (A) (Worksheet 18, Box 15) 4 Crop coefficient factor (K) (Worksheet 18, Box 11) 5 Zone operating time 6 hr For drip line systems, Emitter flow rate per 100 m 7 L/hr Number of plants per 100 m 8 For emitter systems, Emitter flow rate (Worksheet 18, Box 3) 9 L/hr Number of emitters per plant (Worksheet 18, Box 16) 10 Calculation: Calculations for zone 1 are shown here. System Operating Time Check (a) Calculate irrigation output For drip line systems, Equation 6.22(a) Emitter Flow Rate per 100 m x AE
Irrigation Output = Number of Plants per 100 m x 100%
– 7 L/hr x – 1 %
= – 8 plants x 100%
= – 11 L/p/hr For emitter systems, Equation 6.22(b) Emitter Flow Rate x Number of Emitters per Plant x AE
Irrigation Output = 100%
9 L/hr x 10 emitters/p x 1 %
= 100%
= 12 L/p/hr (b) Calculate plant water requirement Equation 6.23 L/P/D = ET x S x A x K = 2 mm/d x 3 x 4 m2 x 5 = 13 L/p/d

C-34 B.C. Irrigation Management Guide
(c) Calculate the operating time per day for each zone Equation 6.24 L/P/D
Operating Time = Irrigation Output
13 L/p/d
= 11 or 12 L/p/hr
= 14 hr/d
This is the number of hours per day the irrigation system should be running in peak periods to provide the crop with sufficient water without over-irrigation. The irrigation time per zone can be shorter during non-peak periods, but it should never be longer.
Answer: (a)
For each zone, calculate the time required to irrigate the plants during the peak time of the year, and input the answers under “Time to Irrigate Zone” below. Then, sum up all the times together to perform a check.
Zone Number
Required Operating Time [hr]
Actual Operating Time [hr]
14 6 14 6 Total = 15 16
(b) For each zone, Is 6 hr less than 14 hr?
Yes Ok. No See action items. (c) For the entire system, Is 16 hr equal to or less than 20 hr?
Yes Ok. No See action items.

Appendix C Blank Worksheets C-35
Worksheet 20 Determining Evaporation Using an Evaporation Pan
Recording information from an evaporation pan in the following table. Date Water Depth Evaporation Moisture Deficit per Day [mm] [mm] [mm/d] Sample Calculations: Number of days between _______ and _______ 1 d Evaporation between _______ and _______ = Water Depth on ________ – Water Depth on _______ = 2 mm – 3 mm
= 4 mm Evaporation Evaporation per Day = No. of Days 4 mm
= 1 d
= 5 mm/d
C-36 B.C. Irrigation Management Guide
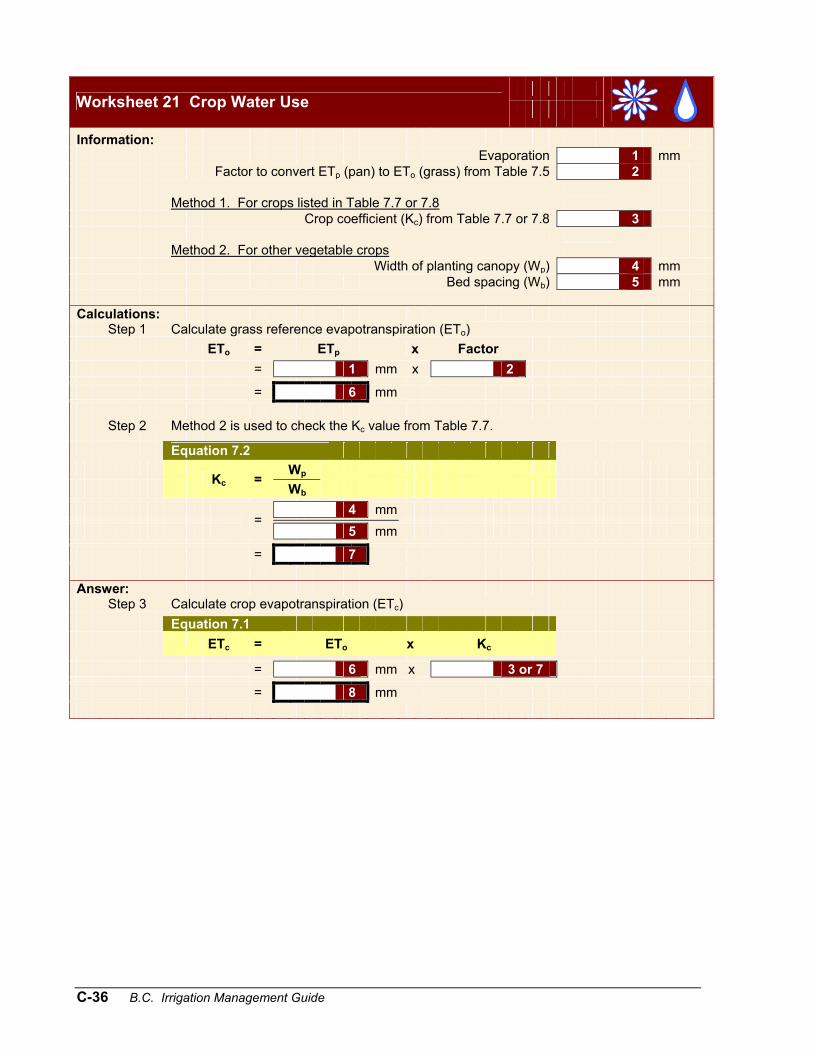
Worksheet 21 Crop Water Use
Information: Evaporation 1 mm Factor to convert ETp (pan) to ETo (grass) from Table 7.5 2 Method 1. For crops listed in Table 7.7 or 7.8 Crop coefficient (Kc) from Table 7.7 or 7.8 3 Method 2. For other vegetable crops Width of planting canopy (Wp) 4 mm Bed spacing (Wb) 5 mm Calculations: Step 1 Calculate grass reference evapotranspiration (ETo) ETo = ETp x Factor
= 1 mm x 2
= 6 mm Step 2 Method 2 is used to check the Kc value from Table 7.7.
Equation 7.2 Wp Kc =
Wb 4 mm
= 5 mm
= 7 Answer: Step 3 Calculate crop evapotranspiration (ETc) Equation 7.1 ETc = ETo x Kc
= 6 mm x 3 or 7
= 8 mm

Appendix C Blank Worksheets C-37
Worksheet 22 Sprinkler Irrigation Scheduling Using Water Budget Method
Information: Maximum soil water storage (SWS) capacity mm Maximum soil water deficit (MSWD) mm Crop coefficient (Kc)
Analysis: Nomenclature: PSWS = Previous Soil Water Storage EP = Effective Precipitation IRR = Net Depth of Irrigation Water Applied ETo = Reference Evapotranspiration Kc = Crop Coefficient CSWS = Current Soil Water Storage
All units are in millimetres (mm) except for Date and Kc. Date PSWS + EP + IRR – ETo x Kc = CSWS + + – x = + + – x = + + – x = + + – x = + + – x = + + – x = + + – x = + + – x = + + – x = + + – x = + + – x =
C-38 B.C. Irrigation Management Guide
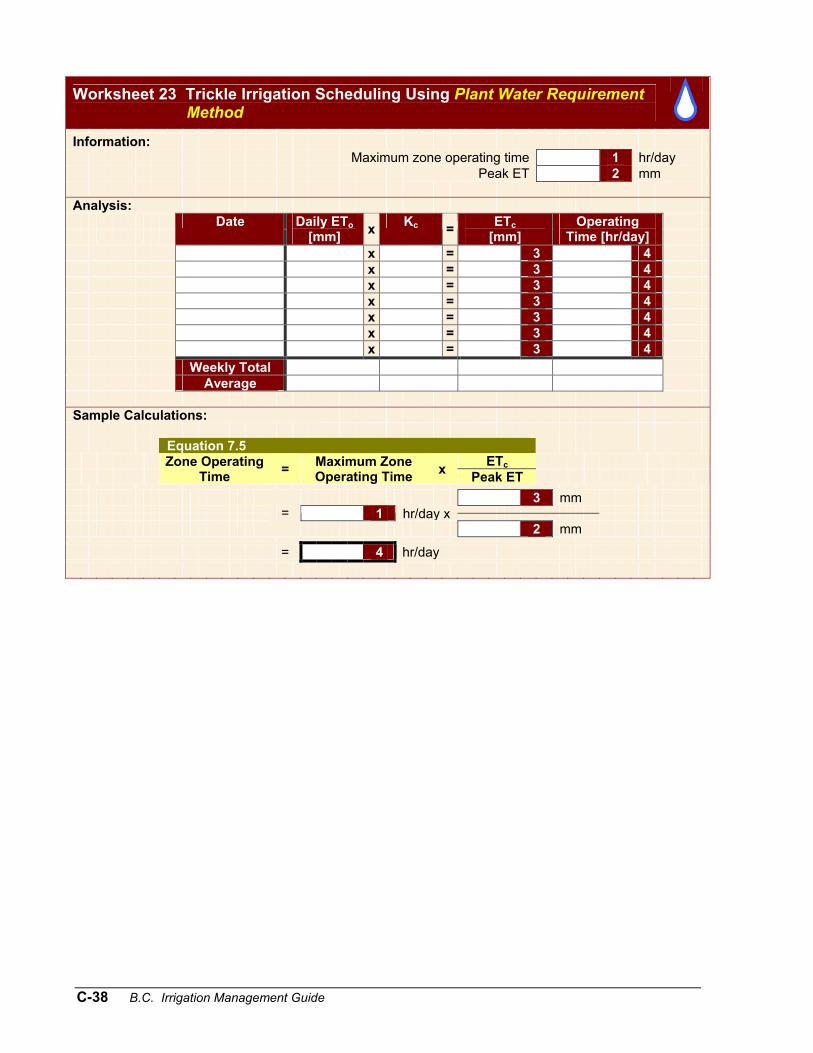
Worksheet 23 Trickle Irrigation Scheduling Using Plant Water Requirement Method
Information: Maximum zone operating time 1 hr/day Peak ET 2 mm Analysis:
Date Daily ETo [mm] x Kc = ETc
[mm] Operating
Time [hr/day] x = 3 4 x = 3 4 x = 3 4 x = 3 4 x = 3 4 x = 3 4 x = 3 4 Weekly Total Average Sample Calculations: Equation 7.5 ETc
Zone Operating Time = Maximum Zone
Operating Time x Peak ET 3 mm
1 hr/day x
= 2 mm
= 4 hr/day

Appendix C Blank Worksheets C-39
Worksheet 24 Trickle Irrigation Scheduling Using Water Budget Method
Information: Emitter spacing (S1) 1 m Row spacing (S2) 2 m Maximum soil water storage (SWS) capacity 3 mm Emitter Flow Rate (Q) 4 L/hr Application efficiency (AE) 5 %
Calculation: (a) The maximum soil water deficit (MSWD) for trickle systems is 25% of the SWS; therefore, MSWD = 3 mm x 25%
= 6 mm = Net Depth of Irrigation Water Applied (IRR)
(b) Irrigation should start when the balance reaches: = 3 mm – 6 mm
= 7 mm
(c) Determine operating time Equation 7.6 S1 x S2 x IRR x 100% T = Q x AE 1 m x 2 m x 4 mm x 100%
= 4 L/hr x 5 %
= 8 hr (d) Nomenclature: PSWS = Previous Soil Water Storage EP = Effective Precipitation IRR = Net Depth of Irrigation Water Applied ETo = Reference Evapotranspiration Kc = Crop Coefficient CSWS = Current Soil Water Storage
All units are in millimetres (mm) except for Date and Kc. Date PSWS + EP + IRR – ETo x Kc = CSWS + + – x = + + – x = + + – x = + + – x = + + – x = + + – x = + + – x = + + – x = + + – x = + + – x = + + – x = + + – x =

C-40 B.C. Irrigation Management Guide
Worksheet 25 Mainline Friction Losses
Assessment: (a) Record all the information in the table below: ID Flow Rate Length
Location Type [in] [US gpm] [ft] x Friction Loss
Factor per 100 ftHead
Loss [psi] Flow Speed
[m/s] X0 – X1 1 2 x ÷ 100 ft = 3 4 X1 – X2 1 2 x ÷ 100 ft = 3 4 X2 – X3 1 2 x ÷ 100 ft = 3 4 X3 – X4 1 2 x ÷ 100 ft = 3 4 X5 – X6 1 2 x ÷ 100 ft = 3 4
Total friction loss along mainline [psi] = 5 (b) Friction loss check Check the head loss for all of the pipe sections (boxes labelled 3)
E.g., X5 – X6 Is 3 psi less than or equal to 10 psi?
Yes Ok. No See action items (c) Flow speed check Check the flow speed for all of the pipe sections (boxes labelled 4) Equation 8.2 Q x 0.125
Flow Speed = d2
1 US gpm x 0.125
=
( 1 in)2
= 6 m/s E.g., X5 – X6 Is 4 or 6 m/s less than or equal to 1.5
Yes Ok. No See action items
Appendix C Blank Worksheets C-41
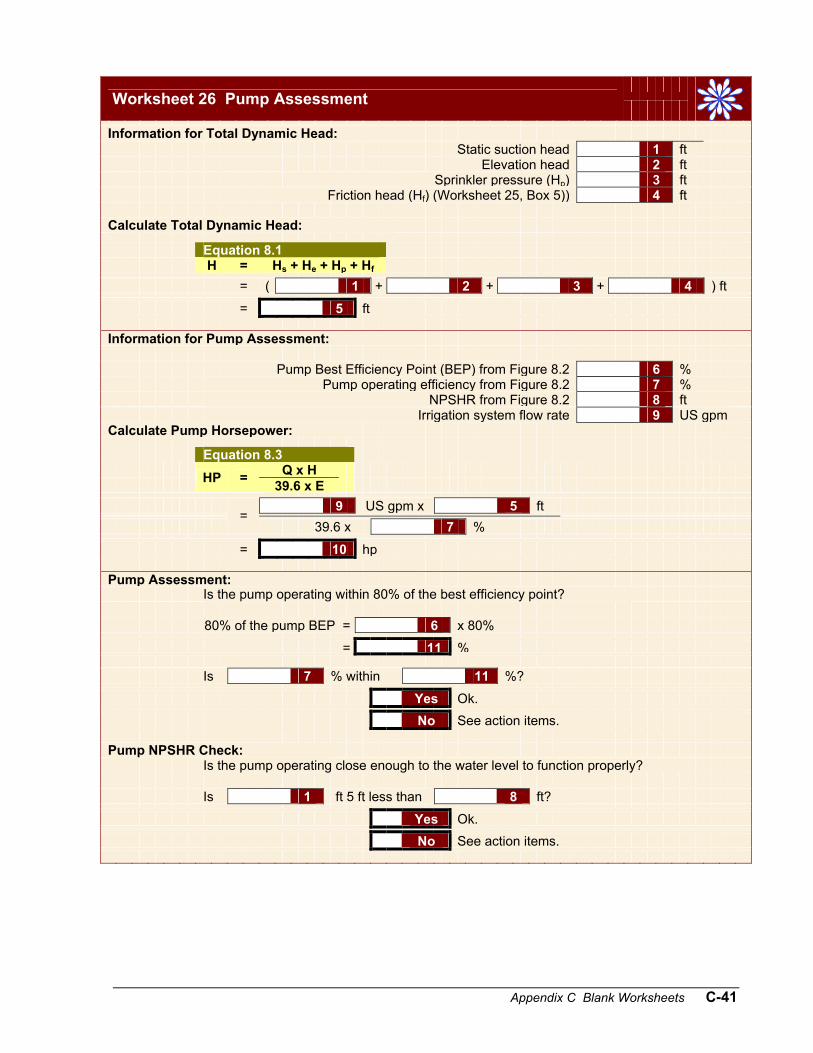
Worksheet 26 Pump Assessment
Information for Total Dynamic Head: Static suction head 1 ft Elevation head 2 ft Sprinkler pressure (Hp) 3 ft Friction head (Hf) (Worksheet 25, Box 5)) 4 ft Calculate Total Dynamic Head:
Equation 8.1 H = Hs + He + Hp + Hf = ( 1 + 2 + 3 + 4 ) ft
= 5 ft Information for Pump Assessment: Pump Best Efficiency Point (BEP) from Figure 8.2 6 % Pump operating efficiency from Figure 8.2 7 % NPSHR from Figure 8.2 8 ft Irrigation system flow rate 9 US gpmCalculate Pump Horsepower:
Equation 8.3 Q x H HP = 39.6 x E 9 US gpm x 5 ft
= 39.6 x 7 %
= 10 hp Pump Assessment: Is the pump operating within 80% of the best efficiency point? 80% of the pump BEP = 6 x 80%
= 11 % Is 7 % within 11 %?
Yes Ok. No See action items. Pump NPSHR Check: Is the pump operating close enough to the water level to function properly? Is 1 ft 5 ft less than 8 ft?
Yes Ok. No See action items.

C-42 B.C. Irrigation Management Guide
Worksheet 27 Irrigation Operating Cost
Information: Farm location Water Purveyor Water source (stream or lake) Irrigated area 1 acres System Efficiency 2 % Number of days system is operated 3 days
Annual Water Licence Fee Water use ≤ 40 ac-ft (Table 8.1) $ 4 Each additional 2 ac-ft of water use (Table 8.1) $ 5 Crop water requirement (Table 3.4) 6 in
Annual Water Storage Licence Fee Water stored ≤ 2,000 ac-ft (Table 8.1) $ 7 Each additional 1,000 ac-ft of water use (Table 8.1) $ 8 Crop water requirement (Table 3.4) 9 in Amount of water stored 10 in
Electric Cost Electric rate in irrigation season (Table 8.2) 11 $/Kw-hr Operating hours per season ( days x 24 hours /day) 12 hrs Pump horsepower 13 hp
Fuel Cost Fuel unit cost $ 14 /gal Fuel consumption 15 gal
Water Purveyor Total charges per acre of irrigation (Table 8.3) 16 $/acre Amount of water allowed (Table 8.3) 17 US gpm/acre Calculation: 1. Annual Water Licence Rental Equation 8.4 Irrigated Area x Crop Water Requirement x 100%
Amount of Water Use = 12 x AE
1 acre x 6 in x 100%
= 12 x 2 %
= 18 ac-ft
( 18 – 40 ) ac-ft$ 4 + $ 5Annual Water
Licence Fee = x2
= $ 19
( 10 – 2,000) ac-ft$ 7 + $ 8Annual Storage
Licence Fee = x2
= $ 20

Appendix C Blank Worksheets C-43
2. Annual Water Pumping Fee (choose either a or b) (a) Electric Equation 8.5(a)
Annual Electric Cost = Electric Charge x Number of Operating Hours x Pump Power x 0.746
= $ 11 /KWh x 12 hr x 13 hp x 0.746
= $ 21 (b) Fuel Equation 8.5(b)
Annual Fuel Cost = Fuel Unit Cost x Fuel Consumption x Number of Operating Hours
= $ 14 /gal x 15 gal x 12 hr
= $ 22 3. Water Purveyor Cost Water Purveyor Cost = $ 16 /acre x 17 acres
= $ 23

C-44 B.C. Irrigation Management Guide
Worksheet 28 Chemigation Information Information:
INFORMATION Value Unit Source System Information Field 1 Crop ………………………………………………...……. Worksheet 10(a) Field area …………………………………………….….. ha Worksheet 3(a), Box 10 Number of irrigation sets ……………………….…..….. sets Worksheet 15, Box 16 Area covered per set .……………………………….….. ha Worksheet 1, Box 16 Sprinkler Spacing ……………………………………….. ft x ft Worksheet 12, Box 1 Nozzle size ………..…………………………………….. in x in Worksheet 4(a) Operating pressure ….………………………………….. psi Worksheet 4(a) Sprinkler flow rate ………………………………………. US gpm Worksheet 4(a), Box 7 Application rate ….…………………………………...…. in/hr
Worksheet 15, Box 11 or 12
Irrigation set time .………………………………………. hr Worksheet 15, Box 13 Chemical Applied (obtain all information from system operation) Number of applications per year.................................. Date of application ……………………………………… Area to be treated per application …….………………. ha Chemical …………………………………...……………. Amount of nutrient to be applied per application…….. kg/ha Total amount of chemical to be applied ……………… kg/ha Amount of chemical required for area kg Injection rate ….…………………………………………. L/min Injection start time after irrigation begins [hr] ..………. hr Length of injection time per set [hr] .………………….. hr