Basel 3 Pillar 3 - Intesa Sanpaolo
72
Basel 3 Pillar 3 Disclosure as at 30 June 2016
Transcript of Basel 3 Pillar 3 - Intesa Sanpaolo

Basel 3 Pillar 3Disclosure as at 30 June 2016


This is an English translation of the Italian language original “Terzo pilastro di Basilea 3 – Informativa al pubblico al 30 giugno 2016” that has been prepared solely for the convenience of the reader. The Italian language original “Terzo pilastro di Basilea 3 – Informativa al pubblico al 30 giugno 2016” was approved by the Board of Directors of Intesa Sanpaolo on 2 August 2016 and is available on group.intesasanpaolo.com This document contains certain forward-looking statements, projections, objectives, estimates and forecasts reflecting the Intesa Sanpaolo management’s current views with respect to certain future events. Forward-looking statements, projections, objectives, estimates and forecasts are generally identifiable by the use of the words “may,” “will,” “should,” “plan,” “expect,” “anticipate,” “estimate,” “believe,” “intend,” “project,” “goal” or “target” or the negative of these words or other variations on these words or comparable terminology. These forward-looking statements include, but are not limited to, all statements other than statements of historical facts, including, without limitation, those regarding Intesa Sanpaolo’s future financial position and results of operations, strategy, plans, objectives, goals and targets and future developments in the markets where Intesa Sanpaolo participates or is seeking to participate. Due to such uncertainties and risks, readers are cautioned not to place undue reliance on such forward-looking statements as a prediction of actual results. The Intesa Sanpaolo Group’s ability to achieve its projected objectives or results is dependent on many factors which are outside management’s control. Actual results may differ materially from (and be more negative than) those projected or implied in the forward-looking statements. Such forward-looking information involves risks and uncertainties that could significantly affect expected results and is based on certain key assumptions. All forward-looking statements included herein are based on information available to Intesa Sanpaolo as of the date hereof. Intesa Sanpaolo undertakes no obligation to update publicly or revise any forward-looking statement, whether as a result of new information, future events or otherwise, except as may be required by applicable law. All subsequent written and oral forward-looking statements attributable to Intesa Sanpaolo or persons acting on its behalf are expressly qualified in their entirety by these cautionary statements.


Basel 3 Pillar 3 Disclosure as at 30 June 2016
Intesa Sanpaolo S.p.A. Registered office: Piazza San Carlo, 156 10121 Torino Secondary registered office: Via Monte di Pietà, 8 20121 Milano Share capital 8,731,874,498.36 Euro Registration number on the Torino Company Register and Fiscal Code 00799960158 VAT number 10810700152 Member of the National Interbank Deposit Guarantee Fund and of the National Guarantee Fund, included in the National Register of Banks No. 5361 and Parent Company of “Intesa Sanpaolo”, included in the National Register of Banking Groups.
3

Contents
Introduction 7 Own funds 11 Capital requirements 21 Credit risk: disclosure for portfolios subject to IRB approaches 27 Market risk: internal models 33 Operational risk: internal models 43 Leverage Ratio 45 Declaration of the Manager responsible for preparing the Company’s financial reports
49
Attachment 1: Own funds: Terms and conditions of all Common Equity Tier 1,
Additional Tier 1 and Tier 2 instruments issued during the semester
51
Attachment 2: Own funds: Transitional own funds disclosure template 55 Contacts 63
5


Introduction
Notes to the Basel 3 Pillar 3 disclosure With effect from 1 January 2014, the reforms of the accord by the Basel Committee (“Basel 3”) were implemented in the EU legal framework. Their aim is to improve the banking sector’s ability to absorb shocks arising from financial and economic stress, whatever the source, improve risk management and governance, and strengthen banks’ transparency and disclosures. In doing so, the Committee maintained the approach founded on three Pillars, which was at the basis of the previous capital accord, known as “Basel 2”, supplementing and strengthening it to increase the quantity and quality of intermediaries’ available capital as well as introducing counter-cyclical regulatory instruments, provisions on liquidity risk management and financial leverage containment. In particular, Pillar 3 – which concerns public disclosure obligations on capital adequacy, risk exposure and the general characteristics of related management and control systems, with the aim of better regulating the market – was also reviewed. Amongst other things, the amendments were designed to introduce greater transparency requirements, more information on the composition of regulatory capital and the methods used by banks to calculate capital ratios. That said, the content of “Basel 3” was incorporated into two EU legislative acts: – Regulation (EU) No. 575/2013 of 26 June 2013 (CRR), which governs the prudential supervision
requirements of Pillar 1 and public disclosure requirements (Pillar 3); – Directive 2013/36/EU of 26 June 2013 (CRD IV), which, among other things, deals with the access to
the activity of credit institutions, freedom of establishment, freedom to provide services, supervisory review process, and additional equity reserves.
EU legislation is complemented by the provisions issued by the Bank of Italy, in particular with Circular no. 285 of 17 December 2013, which contains the prudential supervision regulations applicable to Italian banks and banking groups, reviewed and updated to adjust the internal regulations to the new elements of the international regulatory framework, with special reference to the new regulatory and institutional structure of banking supervision of the European Union and taking into account the needs detected while supervising banks and other intermediaries. In accordance with the abovementioned provisions, this document has been drawn up on a consolidated basis with reference to a “prudential” scope of consolidation, essentially corresponding to the definition of Banking Group for Regulatory purposes (integrated by the proportional consolidation of the jointly controlled entities). The prudential scope of consolidation as at 30 June 2016 does not differ significantly from that used as at 31 December 2015. There have been no significant changes to the scope of application of internal models for calculating capital requirements compared to the situation as at 31 December 2015. Under the terms of art. 433 of the CRR, banks publish the disclosures envisaged in European regulations at least once a year, at the same time as the financial statements. They are also required to assess the need to publish some or all these disclosures more frequently, based on the significant characteristics of current activities. In particular, entities must assess whether there is a need to publish disclosures more frequently in relation to "Own Funds" (art. 437), "Capital Requirements" (art. 438), and disclosures regarding risk exposure or other aspects subject to rapid change. In accordance with Article 16 of Regulation (EU) No. 1093/2010, the EBA (European Banking Authority) then issued guidance concerning the need to publish public disclosures more frequently (Guidelines on materiality, proprietary and confidentiality and on disclosure frequency). Given the above regulatory provisions, when issuing its interim statements for March and September, Intesa Sanpaolo publishes summary disclosures on its “Own Funds”, “Capital Requirements” and “Leverage”, supplemented in the half-yearly report with additional information on the use of internal models for credit, market and operational risks.
7
Basel 3 Pillar 3 - Introduction
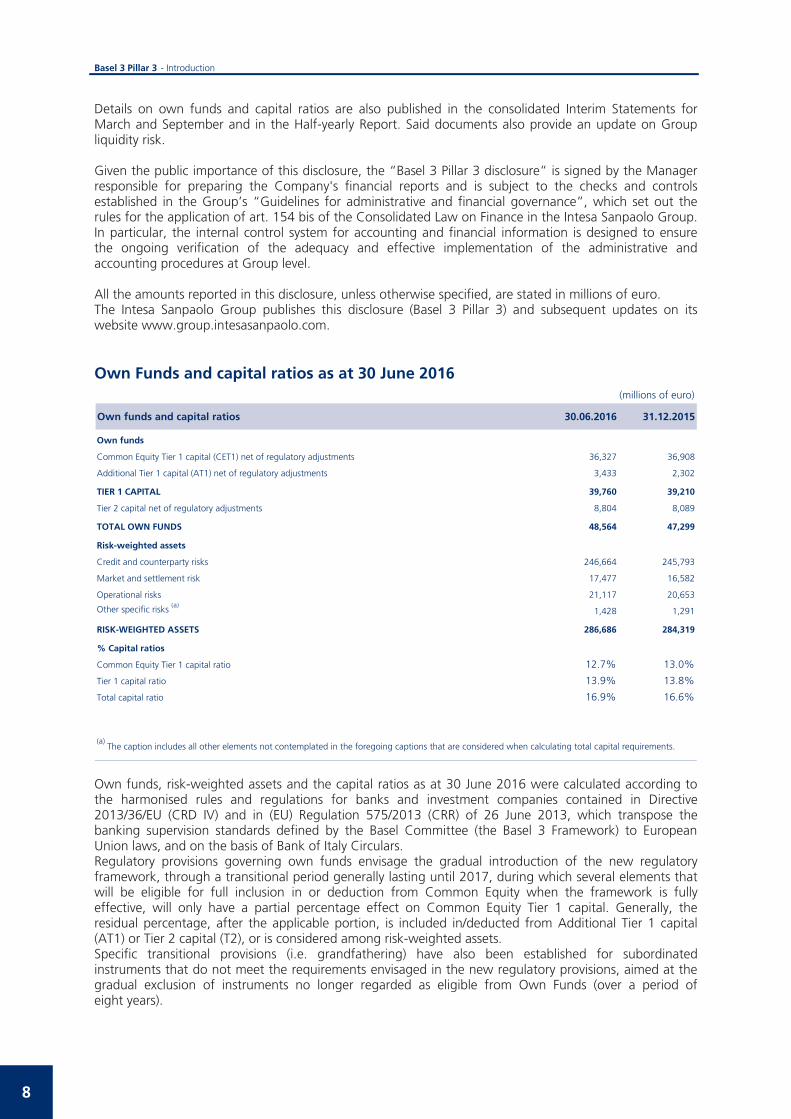
Details on own funds and capital ratios are also published in the consolidated Interim Statements for March and September and in the Half-yearly Report. Said documents also provide an update on Group liquidity risk. Given the public importance of this disclosure, the “Basel 3 Pillar 3 disclosure” is signed by the Manager responsible for preparing the Company's financial reports and is subject to the checks and controls established in the Group’s “Guidelines for administrative and financial governance”, which set out the rules for the application of art. 154 bis of the Consolidated Law on Finance in the Intesa Sanpaolo Group. In particular, the internal control system for accounting and financial information is designed to ensure the ongoing verification of the adequacy and effective implementation of the administrative and accounting procedures at Group level. All the amounts reported in this disclosure, unless otherwise specified, are stated in millions of euro. The Intesa Sanpaolo Group publishes this disclosure (Basel 3 Pillar 3) and subsequent updates on its website www.group.intesasanpaolo.com. Own Funds and capital ratios as at 30 June 2016
(millions of euro)
Own funds and capital ratios 30.06.2016 31.12.2015
Own funds
Common Equity Tier 1 capital (CET1) net of regulatory adjustments 36,327 36,908
Additional Tier 1 capital (AT1) net of regulatory adjustments 3,433 2,302
TIER 1 CAPITAL 39,760 39,210
Tier 2 capital net of regulatory adjustments 8,804 8,089
TOTAL OWN FUNDS 48,564 47,299
Risk-weighted assets
Credit and counterparty risks 246,664 245,793
Market and settlement risk 17,477 16,582
Operational risks 21,117 20,653
Other specific risks (a)1,428 1,291
RISK-WEIGHTED ASSETS 286,686 284,319
% Capital ratios
Common Equity Tier 1 capital ratio 12.7% 13.0%
Tier 1 capital ratio 13.9% 13.8%
Total capital ratio 16.9% 16.6%
(a) The caption includes all other elements not contemplated in the foregoing captions that are considered when calculating total capital requirements.
Own funds, risk-weighted assets and the capital ratios as at 30 June 2016 were calculated according to the harmonised rules and regulations for banks and investment companies contained in Directive 2013/36/EU (CRD IV) and in (EU) Regulation 575/2013 (CRR) of 26 June 2013, which transpose the banking supervision standards defined by the Basel Committee (the Basel 3 Framework) to European Union laws, and on the basis of Bank of Italy Circulars. Regulatory provisions governing own funds envisage the gradual introduction of the new regulatory framework, through a transitional period generally lasting until 2017, during which several elements that will be eligible for full inclusion in or deduction from Common Equity when the framework is fully effective, will only have a partial percentage effect on Common Equity Tier 1 capital. Generally, the residual percentage, after the applicable portion, is included in/deducted from Additional Tier 1 capital (AT1) or Tier 2 capital (T2), or is considered among risk-weighted assets. Specific transitional provisions (i.e. grandfathering) have also been established for subordinated instruments that do not meet the requirements envisaged in the new regulatory provisions, aimed at the gradual exclusion of instruments no longer regarded as eligible from Own Funds (over a period of eight years).
8
Basel 3 Pillar 3 - Introduction
Accordingly, the prudential ratios as at 30 June 2016 take account of the adjustments envisaged by the transitional provisions for 2016. As at 30 June 2016, total Own Funds came to 48,564 million euro, against risk-weighted assets of 286,686 million euro, resulting primarily from credit and counterparty risk and, to a lesser extent, operational and market risk. In January 2016 Intesa Sanpaolo launched a second Additional Tier 1 (AT1) issue of 1.25 billion euro, targeted at the international markets (a first AT1 issue of 1 billion dollars had been launched in September 2015). This issue has characteristics in line with the provisions of CRD IV and the CRR, is perpetual (with a maturity date tied to the duration of Intesa Sanpaolo, as set in its articles of association) and can be redeemed in advance by the issuer after 5 years from the issue date and on every coupon payment date thereafter. The coupon, payable semi-annually in arrears on 19 January and 19 July of each year, with first payment on 19 July 2016, is equal to 7.00% per annum. If the early redemption option is not exercised on 19 January 2021, a new fixed-rate coupon will be determined for the following five years (until the next recalculation date). As envisaged in the regulations applicable to the Additional Tier 1 issues, coupon payment is discretionary and subject to certain limitations. In addition, on 22 April 2016, Intesa Sanpaolo received authorisation for the early repayment of an AT1 instrument with a nominal value of approximately 478 million euro. The subordinated instrument in question, issued in October 2010 and subject to grandfathering following the introduction of the Basel 3 framework, since it did not comply with the new regulations, called for the possibility of early repayment from 1 June 2016. It should be emphasised that Common Equity Tier 1 capital does not include the net income for the period ended 30 June 2016, less the pro-rata dividend for the period, since Intesa Sanpaolo has decided to apply to the ECB for authorisation pursuant to Art. 26 of the CRR to include the net income for the period in Own Funds only when the amount of net income exceeds the total amount of the dividend planned for distribution for the year, equal to 3 billion euro for 2016 on the basis of the 2014-2017 Business Plan. Based on the foregoing, the Total capital ratio stood at 16.9%, while the ratio of the Group’s Tier 1 capital to its total risk-weighted assets (Tier 1 ratio) was 13.9%. The ratio of Common Equity Tier 1 capital (CET1) to risk-weighted assets (the Common Equity ratio) was 12.7%. The ECB's final decision concerning the capital requirements to be observed with effect from 1 January 2016, in light of the results of the Supervisory Review and Evaluation Process (SREP), imposed a consolidated capital requirement on Intesa Sanpaolo of 9.5% in terms of the CET1 ratio. Finally, on the basis of Article 467 (2) of the CRR, adopted by the Bank of Italy in Circular 285, the Intesa Sanpaolo Group has opted to exclude unrealised gains or losses on exposures to central administrations classified among financial assets available for sale (AFS) from its Own Funds. The effect on Common Equity Tier 1 capital as at 30 June 2016 was 4 basis points positive.
9


Own funds Qualitative and quantitative disclosure The harmonised rules for banks and investment companies contained in Directive 2013/36/EU (CRD IV) and in (EU) Regulation no. 575/2013 (CRR) of 26 June 2013, which transpose the banking supervision standards defined by the Basel Committee (the Basel 3 Framework) into European Union laws, became applicable from 1 January 2014. These regulatory provisions were adopted in Italy through the following circulars: Bank of Italy Circular no. 285: Supervisory regulations for banks; Bank of Italy Circular no. 286: Instructions for preparing prudential reports for banks and Italian
investment companies; Update of Bank of Italy Circular no. 154: Credit and financial institutions supervisory reports.
Preparation and transmission. This regulatory framework requires that Own Funds (or regulatory capital) are made up of the following tiers of capital: Tier 1 capital, in turn composed of:
o Common Equity Tier 1 Capital (CET1); o Additional Tier 1 Capital (AT1);
Tier 2 capital (T2) Tier 1’s predominant element is Common Equity, mainly composed of equity instruments (e.g. ordinary shares net of treasury shares), share premium reserves, profit reserves, valuation reserves and eligible minority interests, plus deducted elements. In order to be eligible for Common Equity, the equity instruments issued must guarantee absorption of losses on going concern, by satisfying the following characteristics: maximum level of subordination; option for suspending the payment of dividends/coupons at the full discretion of the issuer and in a
non-cumulative manner; unredeemability; absence of redemption incentives. At present, with reference to the Intesa Sanpaolo Group, no equity instrument other than ordinary shares is eligible for inclusion in Common Equity. A number of prudential filters are also envisaged with effects on Common Equity: filter on profits associated with future margins deriving from securitisations; filter on cash flow hedge (CFH) reserves; filter on profits or losses on liabilities designated at fair value (derivatives or otherwise) associated with
changes in own credit rating; adjustments to fair value assets associated with the “prudent valuation”.
The regulations also envisage a series of elements to be deducted from Common Equity Tier 1: goodwill, intangible assets and residual intangible assets; deferred tax assets (DTA) associated with future income not deriving from temporary differences (e.g.
DTA on losses carried forward); expected losses exceeding total adjustments (the shortfall reserve) for positions weighted according to
IRB approaches; net assets deriving from defined benefit plans; exposures for which it is decided to opt for deduction rather than a 1.250% weighting among RWA; minor investments in CET1 instruments issued by companies operating in the financial sector (less the
amount exceeding the thresholds envisaged in the regulations); deferred tax assets (DTA) that rely on future profitability and arise from temporary differences
(deducted for the amount exceeding thresholds envisaged in the regulations);
11

Basel 3 Pillar 3 – Own funds
significant investments in CET1 instruments issued by companies operating in the financial sector (less the amount exceeding the thresholds envisaged in the regulations).
In general, the AT1 category includes equity instruments other than ordinary shares (which are eligible for Common Equity) and which meet the regulatory requirements for inclusion in that level of own funds (e.g. savings shares or AT1 equity instruments). Tier 2 capital is mainly composed of eligible subordinated liabilities and any excess of adjustments over and above expected losses (the excess reserve) for positions weighted according to IRB approaches. As previously specified, the new regulatory framework will be introduced gradually over a transitional period, generally through 2017, during which several elements that, when the framework is in full effect, will be eligible for full inclusion in or deduction from common equity, will only have a partial percent effect on Common Equity Tier 1 Capital. Generally, the residual percentage, after the applicable portion, is included in/deducted from Additional Tier 1 Capital (AT1) or Tier 2 Capital (T2), or is considered among risk-weighted assets. Specific transitional provisions have also been established for subordinated instruments that do not meet the requirements envisaged in the new regulatory provisions, aimed at the gradual exclusion of instruments no longer regarded as eligible from own funds (over a period of eight years). Breakdown of Own Funds The structure of the Intesa Sanpaolo Group's Own Funds as at 30 June 2016 is summarised in the table below.
(millions of euro)
30.06.2016 31.12.2015
A. Common Equity Tier 1 (CET1) before the application of prudential filters 43,306 44,134
of which CET1 instruments subject to transitional adjustments - -
B. CET1 prudential filters (+ / -) -863 -743
C. CET1 before items to be deducted and effects of transitional period (A +/- B) 42,443 43,391
D. Items to be deducted from CET 1 -7,691 -7,940
E. Transitional period - Impact on CET1 (+/-), including minority interests subject to transitional adjustments 1,575 1,457
F. Total Common Equity Tier 1 (CET1) (C-D +/-E) 36,327 36,908
G. Additional Tier 1 (AT1) before items to be deducted and effects of transitional period 3,842 2,799
of which AT1 instruments subject to transitional adjustments 1,230 1,435
H. Items to be deducted from AT1 - -
I. Transitional period - Impact on AT1 (+/-), including instruments issued by subsidiaries and included in AT1 pursuant to transitional adjustments -409 -497
L. Total Additional Tier 1 (AT1) (G - H +/- I) 3,433 2,302
M. Tier 2 ( T2) before items to be deducted and effects of transitional period 9,204 8,480
of which T2 instruments subject to transitional adjustments 518 877
N. Items to be deducted from T2 -152 -152
O. Transitional period - Impact on T2 (+ / -), including instruments issued by subsidiaries and included in T2 pursuant to transitional adjustments -248 -239
P. Total Tier 2 (T2) (M - N +/- O) 8,804 8,089
Q. Total own funds (F + L + P) 48,564 47,299
12

Basel 3 Pillar 3 – Own funds
The tables below provide a detailed summary of the various capital levels before regulatory adjustments and transitional regime adjustments, together with the reconciliation between Common Equity Tier 1 and net book value. With regard to transitional regime adjustments, note that for the eligibility of: grandfathered instruments; minority interests; unrealised profits or losses on instruments designated at fair value; negative amounts resulting from the calculation of expected losses (shortfall reserve); IAS 19 filter on valuation reserves for actuarial gains or losses on defined benefit plans; other minor captions; the regulations envisage specific treatment allowing gradual entry into force of the rules, to be applied during the transitional period. In this respect, they state specific percentages for deductions and eligibility for Common Equity. Reconciliation of net book value and Common Equity Tier 1 Capital
(millions of euro)
30.06.2016 31.12.2015
Group Shareholders' equity 47,527 47,776
Minority interests 646 817
Shareholders' equity as per the Balance Sheet 48,173 48,593
Dividends and other expected charges (a) - -2,383
Shareholders' equity following presumed distribution to shareholders 48,173 46,210
Adjustments for instruments eligible for inclusion in AT1 or T2 and net income for the period
- Capital of savings shares eligible for inclusion in AT1 -485 -485
- Other equity instruments eligible for inclusion in AT1 -2,121 -871
- Minority interests eligible for inclusion in AT1 -6 -8
- Minority interests eligible for inclusion in T2 -4 -6
- Ineligible minority interests on full phase-in -590 -763
- Ineligible net income for the period (b) -1,707 -
- Treasury shares included under regulatory adjustments 62 68
- Other ineligible components on full phase-in -16 -11
Common Equity Tier 1 capital (CET1) before regulatory adjustments 43,306 44,134
Regulatory adjustments (including transitional adjustments) -6,979 -7,226
Common Equity Tier 1 capital (CET1) net of regulatory adjustments 36,327 36,908
(a) The figure at 31 December 2015 takes account of the dividends paid on 2015 profit, the portion of the remuneration on the AT1 instrument issued on 17 September 2015and the portion of the 2015 profit allocated to charity, net of the tax effect.
(b) Common Equity Tier 1 capital does not take account of the profit accrued during the period ended on 30 June 2016, after deducting the pro-rated share of the dividendon that profit, since Intesa Sanpaolo has decided to request authorisation from the ECB pursuant to Art. 26 of the CRR to include profit for the period in own funds solely ifthe amount of such profit exceeds the total amount of the dividend that is expected to be distributed for the year, i.e., 3 billion euro for 2016, on the basis of the 2014-2017Business Plan.
Further details are provided below on the composition of each capital level making up own funds.
13

Basel 3 Pillar 3 – Own funds
Common Equity Tier 1 Capital (CET1) (millions of euro)
30.06.2016 31.12.2015
Common Equity Tier 1 capital (CET1)
Share capital - ordinary shares 8,247 8,247
Share premium reserve 27,349 27,349
Reserves (a) 9,524 9,160
Accumulated other comprehensive income -1,860 -1,018
Net income (loss) for the period (b) 1,707 2,739
Net income (loss) for the period not eligible (b) -1,707 -
Pro-rata dividend to Intesa Sanpaolo shareholders in accordance with the Business Plan and other forseeable charges (c) - -2,383
Minority interests 46 40
Common Equity Tier 1 capital (CET1) before regulatory adjustments 43,306 44,134
Common Equity Tier 1 capital (CET1): Regulatory adjustments
Treasury shares -62 -68
Goodwill -4,172 -4,249
Other intangible assets -2,699 -2,791
Deferred tax assets that rely on future profitability and do not arise from temporary differences -185 -215
Negative amounts resulting from the calculation of expected losses (shortfall reserve) -212 -299
Defined benefit pension funds assets - -
Prudential filters
- of which Cash Flow Hedge Reserve 1,362 1,145
- of which Gains or Losses due to changes in own credit risk (DVA) 110 40
- of which Prudent valuation adjustments -182 -132
- of which Other prudential filters - -CET1 instruments of financial sector entities where the institution does not have a significant investment, held directly, indirectly and synthetically, which exceed the threshold of 10% of Common Equity - -
Deductions with 10% threshold (d) -2,153 -1,796
- of which Deferred tax assets (DTA) that rely on future profitability and arise from temporary differences - -- of which CET1 instruments of financial sector entities where the institution has a significant investment, held directly, indirectly and synthetically -2,153 -1,796
Deductions with threshold of 17,65% (e) -49 -
Positive or negative elements - other -312 -318
Total regulatory adjustments to Common Equity Tier 1 (CET1) -8,554 -8,683
Total adjustments in the transitional period (CET1) 1,575 1,457
Common Equity Tier 1 (CET1) - Total 36,327 36,908
(a) Portion included in CET1.
(b)Common Equity Tier 1 capital does not include the net income for the period ended 30 June 2016, less the pro-rata dividend for the period, since Intesa Sanpaolo has decided to
apply to the ECB for authorisation pursuant to Art. 26 of the CRR to include the net income for the period in Own Funds only when the amount of net income exceeds the totalamount of the dividend planned for distribution for the year, equal to 3 billion euro for 2016 on the basis of the 2014-2017 Business Plan.
(d) See the specific table for the details of the calculation of the deduction thresholds.
(e) The deductions reported refer solely to DTAs and material investments not deducted in the 10% threshold.
(c)As at 31 December 2015 the figure includes the dividends on 2015 results and share of the remuneration of AT1 instruments issued on 17 September 2015 and of the portion of
2015 net income allocated to chartity, net of tax.
It should be emphasised that Common Equity Tier 1 capital does not include the net income for the period ended 30 June 2016, less the pro-rata dividend for the period, since Intesa Sanpaolo has decided to apply to the ECB for authorisation pursuant to Art. 26 of the CRR to include the net income for the period in Own Funds only when the amount of net income exceeds the total amount of the dividend planned for distribution for the year, equal to 3 billion euro for 2016 on the basis of the 2014-2017 Business Plan. The “Negative elements – other” mainly include the sterilisation in common equity of deferred tax assets (DTA) associated with tax realignment of a single item of goodwill. Exclusion is gradual. The amount of the filter as at 30 June 2016 is 206 million euro and, based on the Supervisory Provisions, the remaining amounts will be fully eliminated from the calculation of own funds by 31 December 2016.
14

Basel 3 Pillar 3 – Own funds
Additional Tier 1 Capital (AT1) (millions of euro)
30.06.2016 31.12.2015
Additional Tier 1 capital (AT1)
Saving shares 485 485
Other AT1 instruments 2,121 871
Minority interests 6 8
Additional Tier 1 capital (AT1) before regulatory adjustments 2,612 1,364
Additional Tier 1 capital (AT1): Regulatory adjustments
AT1 instruments of financial sector entities where the institution does not have a significant investment, held directly, indirectly and synthetically
- -
AT1 instruments of financial sector entities where the institution has a significant investment, held directly, indirectly and synthetically
- -
Positive or negative items - other - -
Total regulatory adjustments to Additional Tier 1 (AT1) - -
Total adjustments in the transitional period, including minority interests (AT1) -409 -497
AT1 instruments eligible for grandfathering 1,230 1,435
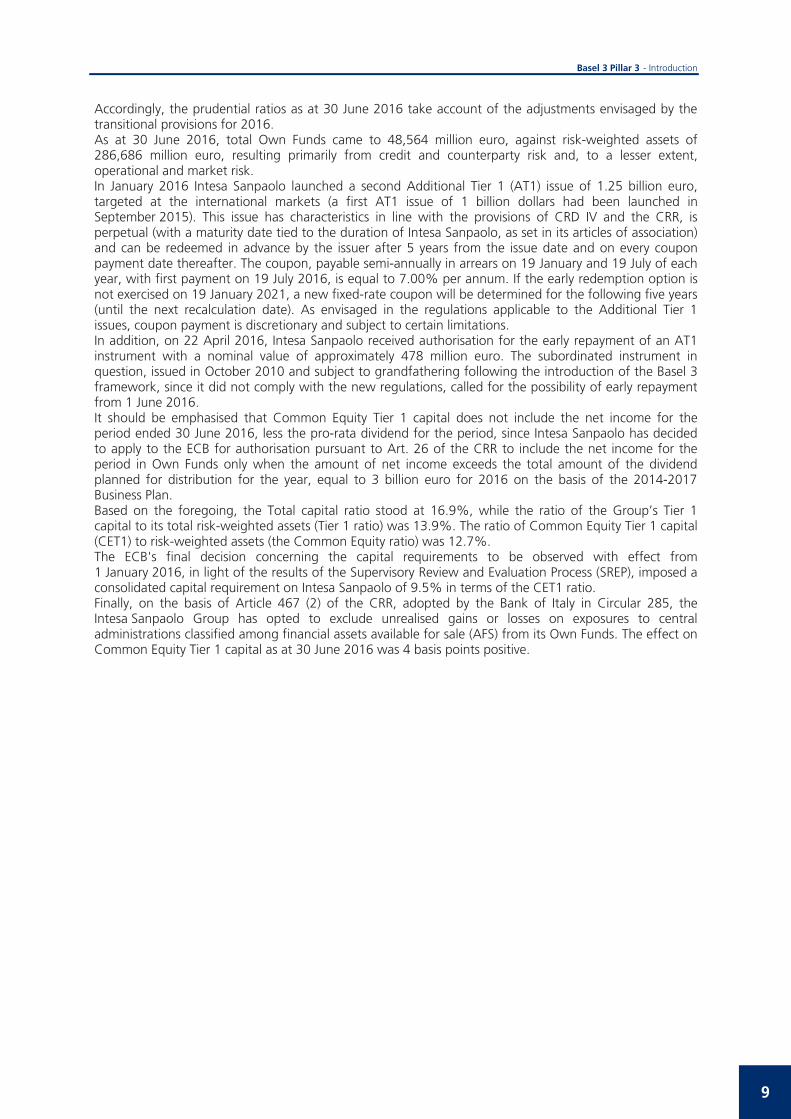
Additional Tier 1 (AT1) - Total 3,433 2,302 AT1 instruments are detailed in the tables below. In particular, it is worth mentioning that, at the beginning of 2016, Intesa Sanpaolo launched an Additional Tier 1 issue of 1.25 billion euro, targeted at the international markets. This issue also has characteristics in line with CRD IV provisions, is perpetual (with a maturity date tied to the duration of Intesa Sanpaolo, as set in its articles of association) and can be redeemed in advance by the issuer after 5 years from the issue date and on every coupon payment date thereafter. The issuer will pay a fixed rate coupon of 7.00% per annum, payable semi-annually in arrears every 19 January and 19 July of each year, with the first coupon payment on 19 July 2016. In the event that the early redemption rights are not utilised on 19 January 2021, a new coupon at fixed rate will be determined by adding the original spread to the 5-year Mid Swap Rate reckoned at the reset date. Such new annual coupon will be fixed for the following 5 years (until the next reset date). As envisaged in the regulations applicable to Additional Tier 1, coupon payment is discretionary and subject to certain limitations. The trigger of 5.125% of Common Equity Tier 1 (CET1) provides that, if the CET1 ratio of the Intesa Sanpaolo Group or Intesa Sanpaolo S.p.A. falls below such trigger, the nominal value of AT1 will be temporarily reduced for the amount needed to restore the trigger level, taking into account also the other instruments with similar characteristics. The full terms and conditions of all Common Equity Tier 1, Additional Tier 1 and Tier 2 instruments are reported in Attachment 1 to the Basel 3 Pillar 3 - Disclosure as at 31 December 2015. Attachment 1 as at 30 June 2016 reports only the details of two new instruments issued during the first half of the year. Attachment 2, on the other hand, reports the Transitional Own Funds Disclosure Template envisaged in Implementing Regulation (EU) 1423/2013.
15
Basel 3 Pillar 3 – Own funds
Additional Tier 1 (AT1) equity instruments as at 30 June 2016
Issuer Interest rate Step-up
Issuedate
Expirydate
Early redemption as
of
Currency
Subject to grandfather
ing
Originalamount incurrency
Contribution to regulatory
capital (millions of euro)
Intesa Sanpaolo8.375% fixed rate up to 14/10/2019;
thereafter 3-month Euribor + 687 b.p./yearYES 14-Oct-2009 perpetual 14-Oct-2019 Eur YES 1,500,000,000 580
Intesa Sanpaolo up to 20/6/2018 (excluded): 8.047%; thereafter 3-month Euribor + 4.10%
YES 20-Jun-2008 perpetual 20-Jun-2018 Eur YES 1,250,000,000 454
Intesa Sanpaolo 8.698% fixed rate up to 24/09/2018
(excluded); thereafter 3-month Euribor + 5.05%
SI 24-Sep-2008 perpetual 24-Sep-2018 Eur YES 250,000,000 196
Total Additional Tier 1 instruments subject to transitional provisions 1,230
Intesa Sanpaolo 7% fixed rate NO 19-Jan-2016 perpetual 19-Jan-2021 Eur NO 1,250,000,000 1,250
Intesa Sanpaolo 7.70% fixed rate (up to the first call date) NO 19-Sep-2015 perpetual 17-Sep-2025 Usd NO 1,000,000,000 871
Total Additional Tier 1 instruments not subject to transitional provisions 2,121
Total Additional Tier 1 equity instruments 3,351
Tier 2 Capital (T2)
(millions of euro)
30.06.2016 31.12.2015
Tier 2 Capital (T2)
T2 Instruments 8,682 7,597
Minority interests 4 6
Excess of provisions over expected losses eligible (excess reserve) - -
Tier 2 capital before regulatory adjustments 8,686 7,603
Tier 2 Capital (T2): Regulatory adjustments
T2 instruments of financial sector entities where the institution does not have a significant investment, held directly, indirectly and synthetically
- -
T2 instruments of financial sector entities where the institution has a significant investment, held directly, indirectly and synthetically
-152 -152
Positive or negative items - other - -
Total regulatory adjustments to Tier 2 (T2) -152 -152
Total adjustments in the transitional period, including minority interests (T2) -248 -239
T2 instruments eligible for grandfathering 518 877
Tier 2 Capital (T2) - Total 8,804 8,089
16
Basel 3 Pillar 3 – Own funds
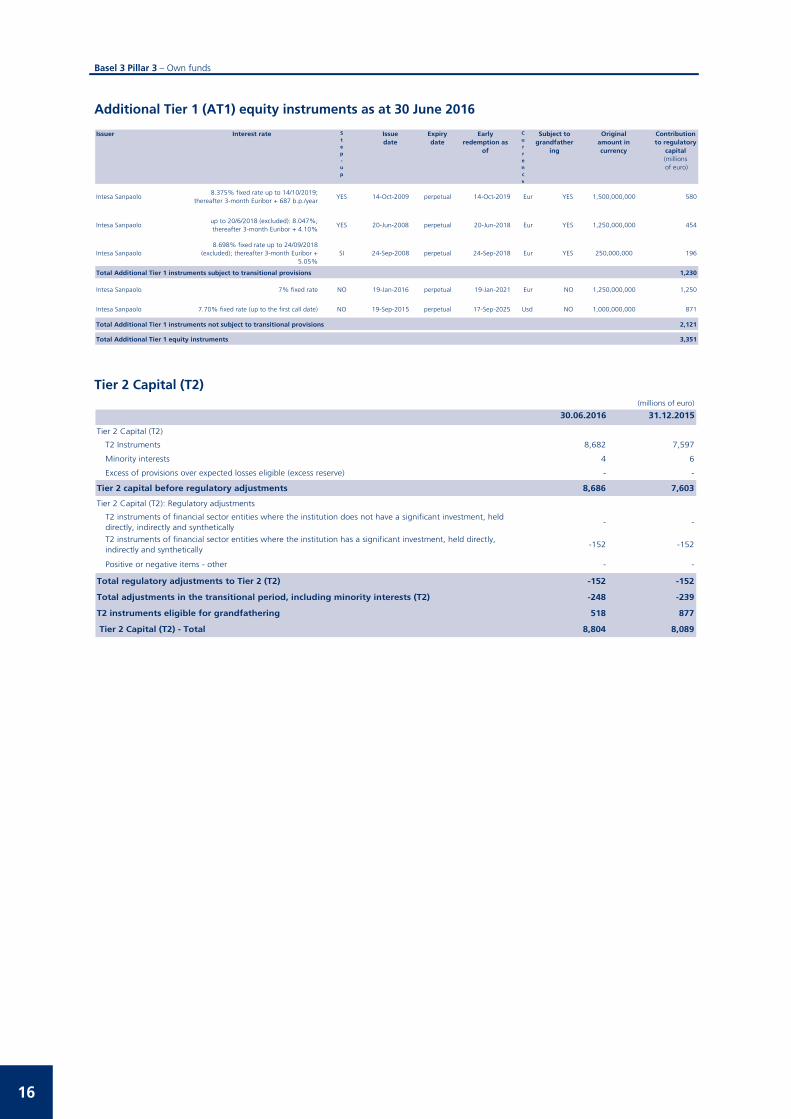
The details of instruments making up Tier 2, including those eligible for grandfathering, are provided in the following table. Tier 2 (T2) capital instruments as at 30 June 2016 Issuer Interest rate S
tep-up
Issuedate
Expirydate
Early redemption as
of
Currency
Subject to grandfather
ing
Originalamount incurrency
Contribution to regulatory
capital (millions of euro)
Intesa Sanpaolo (*)8.375% fixed rate up to 14/10/2019; then 3-
month Euribor + 687 bps/yearYES 14-Oct-2009 14-Oct-2059 14-Oct-2019 Eur YES 1,500,000,000 150
Intesa Sanpaolo (*)up to 20/6/2018 (excluded): 8.047% p.a.;
subsequently: 3-month Euribor + 4.10 p.a.YES 20-Jun-2008 20-Jun-2049 20-Jun-2018 Eur YES 1,250,000,000 118
Intesa Sanpaolointerest paid quarterly according to the formula
(3-month Euribor + 1.6%)/4NO 30-Sep-2010 30-Sep-2017 NO Eur YES 805,400,000 81
Intesa Sanpaolointerest paid quarterly according to the formula
(3-month Euribor + 1.60%)/4NO 10-Nov-2010 10-Nov-2017 NO Eur YES 479,050,000 52
Intesa Sanpaolointerest paid quarterly according to the formula
(3-month Euribor + 2%)/4NO 31-Mar-2011 31-Mar-2018 NO Eur YES 373,400,000 52
Intesa Sanpaolo (*)up to 24/9/2018 (excluded): 8.698% p.a.;
subsequently: 3-month Euribor + 5.05 p.a.YES 24-Sep-2008 24-Sep-2048 24-Sep-2018 Eur YES 250,000,000 51
Intesa Sanpaolo up to 18/3/2019 (excluded):5,625% p.a.;
subsequently: 3-month Sterling Libor + 1.125 p.a.
YES 18-Mar-2004 18-Mar-2024 18-Mar-2019 GBP YES 165,000,000 14
Total Tier 2 instruments subject to transitional provisions 518
Intesa Sanpaolo 5.017% fixed rate NO 26-Jun-2014 26-Jun-2024 NO Usd NO 2,000,000,000 1,770
Intesa Sanpaolo 6.6625% fixed rate NO 13-Sep-2013 13-Sep-2023 NO Eur NO 1,445,656,000 1,408
Intesa Sanpaolo 5.71% fixed rate NO 15-Jan-2016 15-Jan-2026 NO Usd NO 1,500,000,000 1,351
Intesa Sanpaolo 3.928% fixed rate NO 15-Sep-2014 15-Sep-2026 NO Eur NO 1,000,000,000 980
Intesa Sanpaolo 5.15% fixed rate NO 16-Jul-2010 16-Jul-2020 NO Eur NO 1,250,000,000 745
Intesa Sanpaolo 3-moths Euribor + 237 p.b./4 NO 30-Jun-2015 30-Jun-2022 NO Eur NO 781,962,000 718
Intesa Sanpaolo 5% fixed rate NO 23-Sep-2009 23-Sep-2019 NO Eur NO 1,500,000,000 676
Intesa Sanpaolo 2.855% fixed rate NO 23-Apr-2015 23-Apr-2025 NO Eur NO 500,000,000 480
Intesa Sanpaolo 6.625% fixed rate NO 08-May-2008 08-May-2018 NO Eur NO 1,250,000,000 310
Intesa Sanpaolo5.75% fixed rate; from 28/05/2013 3-month
Euribor +1.98%YES 28-May-2008 28-May-2018 NO Eur NO 1,000,000,000 96
Intesa Sanpaoloup to 20/2/2013 (excluded): 3-month Euribor +
0.25% p.a.; subsequently: 3-month Euribor + 0.85% p.a.
YES 20-Feb-2006 20-Feb-2018 NO Eur NO 750,000,000 49
Intesa Sanpaolo 6.16 % fixed rate NO 27-Jun-2008 27-Jun-2018 NO Eur NO 120,000,000 48
Intesa Sanpaoloup to 26/6/2013 (excluded): 4.375% p.a.;
subsequently: 3-month Euribor + 1.00% p.a.YES 26-Jun-2006 26-Jun-2018 NO Eur NO 500,000,000 43
Intesa Sanpaolo 3-month Euribor + 0.85% NO 17-Jul-2007 17-Jul-2017 NO Eur NO 30,000,000 6
Intesa Sanpaolo6.375% fixed rate; from 12/11/2012 3-month
Sterling LIBORYES 12-Oct-2007 12-Nov-2017 NO Gbp NO 250,000,000 1
Other lower instruments under one milion euro
1
Total Tier 2 instruments not subject to transitional provisions 8,682
Total Tier 2 instruments 9,200
(*) Instrument subject to grandfathering in the Additional Tier 1 capital, capped portion pursuant to art. 486 of EU Regulation 575/2013 (CRR).
17

Basel 3 Pillar 3 – Own funds
Deduction thresholds for DTAs and investments in companies operating in the financial sector (millions of euro)
30.06.2016 31.12.2015
A. Threshold of 10% for CET1 instruments of financial sector entities where the institution does not have a significant investment
3,695 3,725
B. Threshold of 10% for CET1 instruments of financial sector entities where the institution has a significant investment and for DTA that rely on future profitability and arise from temporary differences
3,695 3,725
C. Threshold of 15% for significant investments and DTA not deducted in the threshold described under point B
• 15% during the transitional period until 31 December 2017 5,614 5,618
• 17.65% from 2018 5,214 5,340
The regulations envisage that for certain regulatory adjustments, such as those for DTAs based on future income and deriving from temporary differences, and for significant and minor investments in CET1 instruments issued by companies in the financial sector, certain thresholds or “deductibles” are specified, calculated on Common Equity estimated using different approaches. For minor investments in Common Equity Tier 1 (CET1) instruments issued by companies in the financial sector the deduction of amounts exceeding 10% of CET1 prior to deductions deriving from exceeding the thresholds is envisaged. For significant investments in CET1 instruments and DTAs, however, an initial threshold on deductions is envisaged, still calculated as 10% of CET1 prior to deductions deriving from exceeding the thresholds, adjusted to take into account any excess over the threshold described in the previous point. A further threshold is indicated, calculated on 15% of Common Equity adjusted for the above 10% threshold, to be applied in aggregate on amounts not deducted using the first threshold. All amounts not deducted are weighted among risk-weighted assets in accordance with the percentages envisaged in the regulations for individual cases. As mentioned previously, these deductions are introduced gradually through the application of specific transitional rules. In addition to applying deductions with an increasing impact, these rules also envisage different treatment, compared to that applied when fully operative, for amounts not deducted. Transitional period adjustments as at 30 June 2016 Greater details on the impact of the transitional regime on the different levels of capital for the period under review are provided below.
(millions of euro)
Amounts eligible
/deductible on full phase-in
Adjustments to CET1
Net effect on CET1 at the
date
Instruments eligible for grandfathering - - - 1,230 518
Minority interests 46 68 114 - -
Other adjustments in the transitional period 701 -219 482 - -
- of which Unrealised gains on assets measured at fair value 701 -219 482 - -
- of which Unrealised losses on assets measured at fair value - - - - -
Regulatory adjustments -3,400 1,677 -1,723 -409 -409
- of which Deferred tax assets that rely on future profitability and do not arise from temporary differences
-185 74 -111 - -
- of which Negative amounts resulting from the calculation of expected losses (shortfall reserve) -212 85 -127 -42 -42
- of which IAS 19 Reserves -850 465 -385 - -
- of which CET1 instruments of financial sector entities where the institution does not have a significant investment, held directly, indirectly and synthetically
- - - - -
- of which Deferred tax assets (DTA) that rely on future profitability and arise from temporary differences
- - - - -
- of which CET1 instruments of financial sector entities where the institution has a significant investment, held directly, indirectly and synthetically
-2,153 1,053 -1,100 -367 -367
Other filters and adjustments - 49 49 - 161
Total adjustments in the transitional period and instruments eligible for grandfathering n.s. 1,575 n.s. 821 270
ADJUSTMENTS TO CET1 ADJUSTMENTS TO CET1
ADJUSTMENTS TO CET1
18

Basel 3 Pillar 3 – Own funds
Full reconciliation of the components of Common Equity Tier 1, Additional Tier 1 and Tier 2 capital, as well as the filters and deductions applied to the institution’s own funds and the balance sheet of the financial statements
(millions of euro)
ASSETS
Financial statements
scope
Prudential scope
100. Investments in associates and companies subject to joint control 1,400 6,884 -2,104 8, 19, 41b, 56b
of which: implicit goodwill in associated companies IAS 28-31 273 767 -767 8, 19, 41b, 56b
130. Intangible assets 7,113 6,433 -6,901 8
of which: goodwill 3,914 3,444 -3,914 8
of which: other intangible assets 3,199 2,989 -2,987 8
140. Tax assets 14,398 13,842 -111 10
of which: tax assets that rely on future profitability and do not arise from temporary differences net of the related deferred tax liability
185 185 -111 10
LIABILITIES
Financial statements
scope
Prudential scope
30. Securities issued 107,921 109,991 12,549 33, 46, 47, 52
of which: subordinated instruments subject to transitional arrangements 0 1,748 1,748 33, 47
of which: subordinated instruments not subject to transitional arrangements 0 10,802 10,801 46, 52
80. Tax liabilities 2,186 1,327 304 8
a) Current tax liabilities 342 305 n.d.
b) Deferred tax liabilities 1,844 1,022 n.d.
of which: tax liabilities related to goodwill and other intangible assets 0 304 304 8
140. Valuation reserves -1,860 -1,860 -93 3, 9, 11, 26a, 56c
of which: valuation reserves on securities available for sale 701 701 642 26a, 56c
of which: valuation reserves on cash flow hedges -1,361 -1,361 0 11
of which: foreign exchange differences -700 -700 -700 3
of which: legally-required revaluations 350 350 350 3
of which: valuation reserves on net actuarial losses -850 -850 -385 9
of which: other 0 0 0
170. Reserves 9,540 9,540 9,524 2
180. Share premium reserve 27,349 27,349 27,349 1
190. Share capital 8,732 8,732 8,732 1, 30
of which: ordinary shares 8,247 8,247 8,247 1
of which: savings shares 485 485 485 30
200. Treasury shares (-) -59 -59 -62 16
210. Minority interests (+/-) 646 243 125 5, 34, 48
of which CET1 compliant 114 5
of which AT1 compliant 6 34
of which T2 compliant 5 48
220. Net income (loss) for the period (+/-) 1,707 1,707 0 5a
of which net income (loss) for the period, net of the dividend in distribution on the net income (loss) for the period
0 5a
OTHER COMPONENTS OF OWN FUNDS
Total other components, of which: -748
Fair value gains and losses arising from the institution's own credit risk related to derivative liabilities
110 14
Value adjustments due to the requirements for prudent valuation -182 7
IRB shortfall of credit risk adjustments to expected losses -212 12, 41a, 56a
IRB Excess of provisions over expected losses eligible 0 50
Filter on unrealised capital gains on real properties -31 26
Filter on double tax realignment -206 26
Direct and indirect holdings of Tier 2 instruments of financial sector entities where the institution has a significant investment
-153 55
Indirect investments -74 26
Total own funds as at 30 June 2015 48,564
Relevant amountfor the purpose
of own funds
See table"Transitional own
funds disclosuretemplate"
Accounting data Relevant amountfor the purpose
of own funds
See table"Transitional own
funds disclosuretemplate"
Accounting data Relevant amountfor the purpose
of own funds
See table"Transitional own
funds disclosuretemplate"
19


Basel 3 Pillar 3 – Capital requirements
Capital requirements
Qualitative and quantitative disclosure According to the regulations for the prudential supervision of banks (Bank of Italy Circular 285 of 17 December 2013 and subsequent amendments), which adopt the provisions on capital measurement and capital ratios (Basel 3), the Banking Group’s capital must normally amount to at least 10.5% of total risk-weighted assets (Total Capital ratio) arising from the risks typically associated with banking and financial activity (credit, counterparty, market, and operational risk), weighted according to the regulatory segmentation of borrowers and considering credit risk mitigation techniques and the decrease in operational risk following insurance coverage.
With respect to credit risks, the Group received authorisation to use internal ratings-based approaches effective from the report as at 31 December 2008 on the Corporate portfolio for a scope extending to the Parent Company, network banks in the Banca dei Territori Division and the main Italian product companies. Progressively, the scope of application has been gradually extended to include the SME Retail and Retail Mortgage portfolios, as well as other Italian and international Group companies, as shown in the following table.
Company Corporate Corporate SME Retail Mortgage
FIRB AIRB LGD IRB LGD IRB LGD
n.a.
Dec - 2009 Dec - 2010 Dec - 2012 Jun - 2010
n.a. Dec - 2010 Dec - 2012 Dec - 2011
n.a. Dec - 2013 Dec - 2013 n.a.
n.a. Jun - 2012 n.a. n.a.
Mar - 2010 Dec - 2011 n.a. n.a.
Intesa Sanpaolo
Banco di Napoli
Cassa di Risparmio del Veneto
Cassa di Risparmio in Bologna
Cassa di Risparmio del Friuli Venezia Giulia
Cassa dei Risparmi di Forlì e della Romagna
Mediocredito Italiano
Gruppo Cassa di Risparmio di Firenze
Casse di Risparmio dell'Umbria
Banca Prossima
Banca IMI
Intesa Sanpaolo Bank Ireland
Vseobecna Uverova Banka Dec - 2010 Jun - 2014 Jun - 2014 Jun - 2012
Dec - 2008 Dec - 2010 Dec - 2012Jun - 2010
Dedicated rating approaches have been developed for the Banks and Public Entities Portfolio according to the type of counterparty to be assessed. This was the subject of a pre-validation inspection by the Supervisory Authority conducted in December 2013, followed by an additional validation visit in March 2015. In the same month an AIRB authorisation request was presented to the Supervisory Authority for this portfolio. The Group is also proceeding with development of the IRB systems for the other segments and the extension of the scope of companies for their application in accordance with a plan presented to the Supervisory Authority.
Banks must also comply with capital requirements for market risks calculated on the whole trading book separately for the various types of risk: position risk on debt securities and equities and concentration risk. Moreover, with reference to the entire financial statements, foreign exchange risk, settlement risk and position risk on commodities must be calculated. The use of internal models to calculate the capital requirement for market risks is permitted; in particular, Intesa Sanpaolo and Banca IMI apply the internal model to calculate general position risk and specific risk for equities and debt securities. Banca IMI’s internal model also includes the position risk on quotas of UCIs (for the Constant Proportion Portfolio Insurance - CPPI component). The scope of validated risks has subsequently been extended to position risk on dividend derivatives and position risk on commodities for Banca IMI, which is the only legal entity in the Group authorised to hold open positions in commodities. In addition, Banca IMI and Intesa Sanpaolo have been using Stressed VaR to calculate the requirement for market risks, since December 2011. Lastly, as from June 2014, capital requirements for the Parent Company's Hedge Fund portfolios are reported according to the internal model. Standardised approaches are used for the other types of risk.
21

Basel 3 Pillar 3 – Capital requirements
Counterparty risk is calculated independently of the portfolio of allocation. The Parent Company Intesa Sanpaolo and Banca IMI use the internal model approach both for management purposes, to measure credit line use, and for regulatory purposes, having received a specific authorisation from the Bank of Italy. The advanced measurement approach for counterparty risk is also implemented, for management purposes, in the banks of the Banche dei Territori Division and for SFT instruments, whilst awaiting formal authorisation for supervisory reporting purposes. The Group has set up all its risk measurement processes, systems and methods in accordance with Basel 3 requirements, namely: stress tests, wrong way risk analyses and back-testing programmes. With regard to Operational Risk, the Group obtained authorisation to use the Advanced Measurement Approach (AMA – internal model) to determine the associated capital requirement for regulatory purposes, with effect from the report as at 31 December 2009. The Intesa Sanpaolo Group participated in the 2016 EU-wide stress test, the exercise conducted by the European Banking Authority on the financial statements of European banks as at 31 December 2015. The test consisted of the simulation of the impact of two scenarios – baseline and adverse – and covers a time horizon of three years (2016-2018). The 2016 EU-wide stress test provides crucial information as part of the prudential review process of 2016. The results thus allowed the competent authorities to assess banks' ability to comply with the established minimum and additional own funds requirements in stress scenarios based on shared methodology and assumptions. Intesa Sanpaolo acknowledges the results of the 2016 EU-wide stress test announced by the EBA, which were extremely positive for the Group. The Common Equity Tier 1 ratio (CET1 ratio) resulting from the stress test for 2018, the final year considered in the exercise, was 12.8% for Intesa Sanpaolo in the baseline scenario and 10.2% in the adverse scenario, compared to the starting-point figure of 13% recorded as at 31 December 2015, and includes a 50 basis-point reduction - in both scenarios - for the transition from the calculation criteria applicable in 2015 to those in force for 2018. As already illustrated in the Section on “Own Funds”, the total regulatory capital is made up of the algebraic sum of the elements specified below: – Tier 1 Capital (capable of absorbing losses under going concern conditions). This capital is divided into
Common Equity Tier 1 Capital and Additional Tier 1 Capital; – Tier 2 Capital (capable of absorbing losses in the event of a crisis). The elements indicated above are subject to the following limits: – Common Equity Tier 1 must at all times be equal to at least 4.5% of risk-weighted assets; – Tier 1 Capital must at all times be equal to at least 6% of risk-weighted assets; – Own Funds (i.e. the total regulatory capital), equal to Tier 1 plus Tier 2 Capital, must at all times be
equal to at least 8.0% of risk-weighted assets.
The minimum capital standard requirements equal 7% of the Common Equity Tier 1, including the capital conservation buffer equal to 2.5%, 8.5% of Tier 1 and 10.5% of Tier Total. On 27 November 2015 the Intesa Sanpaolo Group received the ECB’s final decision regarding the minimum total capital requirements at consolidated level to be met starting from 1 January 2016 (9.5% of the Common Equity Tier 1 Ratio) following the results of the Supervisory Review and Evaluation Process (SREP). Directive 2013/36/EU (CRD IV) establishes the obligation for the designated national authorities to activate an operational framework for the definition of the ratio of the countercyclical capital buffer (CCyB) starting from 1 January 2016. The ratio is subject to review on a quarterly basis. The European regulation was implemented in Italy with Bank of Italy circular no. 285, which contains suitable regulations concerning CCyB. As at 30 June 2016 the countercyclical buffer of the Intesa Sanpaolo Group amounted to approximately 4 million euro and was calculated by applying to the total risk exposure amount the countercyclical ratio of the institution, equal to 0.001%, calculated as a weighted average of the countercyclical ratios applicable in the various countries to which the Intesa Sanpaolo Group has relevant credit exposures. Based on the analysis of the reference indicators, the Bank of Italy decided to set the countercyclical ratio (relating to the exposures towards Italian counterparties) for the second quarter of 2016 at 0% (equal to that for the first quarter). Finally, please note that, with letter dated 25 January 2016, the Bank of Italy identified the Intesa Sanpaolo banking group as an Other Systemically Important Institution (O-SII)
22

Basel 3 Pillar 3 – Capital requirements
authorised to operate in Italy. The decision was made pursuant to Bank of Italy circular no. 285, which implements the provisions of CRD IV in Italy and specifies the criteria on which the methodology for identifying the O-SIIs is based. The identification took into consideration the contribution of the four categories (size, importance for the Italian economy, complexity, interconnectedness with the financial system) the EBA guidelines use to determine the systemic importance of each institution at individual member state level. Based on the provisions set by CRD IV, the Bank of Italy decided to apply a capital buffer (the so-called O-SII Buffer) equal to 0% for 2016 (the first year of application of the O-SII-related regulation and thus of the buffer specified by the Bank of Italy). The adequacy of the internal control system for risks is also illustrated in the annual Internal Capital Adequacy Assessment Process Report, based on the extensive use of internal approaches for the measurement of risks and for the calculation of internal capital and total capital available. The document was approved and sent to the Supervisor in April 2016. Capital requirements and capital ratios of the Intesa Sanpaolo Group
(milions of euro)
A. CAPITAL REQUIREMENTS
A.1 Credit and counterparty risks 558,252 245,514 19,640 541,351 244,760 19,581
1. Standardised approach 259,193 116,654 9,332 246,977 117,528 9,402
2. Internal models (IRB) 2,784 6,542 523 2,391 4,917 393
3. Internal models - Advanced approach and retail exposures 289,347 117,388 9,391 286,768 117,890 9,432
4. Securitisations - banking book 6,928 4,930 394 5,215 4,425 354
A.2 Credit risk adjustment 1,150 92 1,033 83
A.3 Settlement risk 1 - 1 -
A.4 Market risk 17,476 1,399 16,581 1,326
1. Standardised approach 2,644 212 2,859 228
2. Internal models 14,832 1,187 13,722 1,098
A.5. Concentration risk - - - -
A.6 Operational risk 21,117 1,689 20,653 1,652
1. Basic indicator approach 559 45 559 45
2. Standardised approach 2,899 232 2,899 232
3. Advanced measurement approach 17,659 1,412 17,195 1,375
A.7 Other capital requirements - - - -
A.8 Other calculation elements (a)1,428 114 1,291 103
A.9 Total capital requirements 286,686 22,934 284,319 22,745
B. CAPITAL RATIOS (%)
B.1 Common Equity Tier 1 ratio 12.7% 13.0%
B.2 Tier 1 ratio 13.9% 13.8%
B.3 Total capital ratio 16.9% 16.6%
(a) This caption includes all the other requirements that enter into the calculation of total capital requirements, not considered in previous captions.
Requirements RequirementsUnweighted
amountsWeighted amounts
Unweighted amounts
Weighted amounts
30.06.2016 31.12.2015
In the case of the standardised approach, “unweighted amounts” correspond – in accordance with regulatory provisions – to the exposure value, which takes into account prudential filters, risk mitigation techniques and credit conversion factors. In the case of the internal rating based approach, “unweighted amounts” correspond to “exposure at default” (EAD). For guarantees given and commitments to disburse funds, credit conversion factors are included when determining EAD. The tables below provide details of the Group’s different capital requirements as at 30 June 2016, with a comparison to the same figures as at 31 December 2015. There have been no significant changes to the scope of application of internal models for calculating capital requirements compared to the situation as at 31 December 2015.
23

Basel 3 Pillar 3 – Capital requirements
Capital requirement for Credit and Counterparty Risk The following table breaks capital requirements down between credit risk and counterparty risk.
(millions of euro)
30.06.2016 31.12.2015
Credit risk 19,107 19,002
Counterparty risk 533 579
Total capital requirement for credit and counterparty risk 19,640 19,581
Capital requirement
Counterparty risk is calculated on both the trading book and the banking book. The relative requirements are presented, for each regulatory portfolio, in the following tables. Capital requirement for Credit and Counterparty Risk (Standardised Approach)
(millions of euro)
Regulatory portfolio
30.06.2016 31.12.2015
Exposures to or secured by central governments and central banks 1,372 1,387
Exposures to or secured by regional governments or local authorities 223 222
Exposures to or secured by public sector organisations 367 350
Exposures to or secured by multilateral development banks - -
Exposures to or secured by international organisations - -
Exposures to or secured by supervised institutions 1,107 1,276
Exposures to or secured by corporates 2,367 2,128
Retail exposures 1,546 1,749
Exposures secured by real estate property 129 129
Default exposures 435 452
High-risk exposures 15 19
Exposures in the form of covered bonds 9 9
Short-term exposures to corporates or to supervised institutions - -
Exposures to UCIs 192 165
Equity exposures 912 933
Other exposures 658 583
Total capital requirement for credit and counterparty risk (Standardised Approach) 9,332 9,402
Capital requirement
24

Basel 3 Pillar 3 – Capital requirements
Capital requirement for Credit and Counterparty Risk (IRB Approaches) (millions of euro)
Regulatory portfolio
30.06.2016 31.12.2015
A. Exposures to or secured by corporates (FIRB & AIRB Approach) 8,381 8,457
A.1) Specialised lending 746 892
A.2) Specialised lending - slotting criteria 71 75
A.3) SMEs 2,135 2,281
A.4) Other corporates 5,429 5,209
B. Retail exposures (IRB Approach) 1,079 1,039
B.1) Exposures secured by property: SMEs 62 66
B.2) Exposures secured by property: natural persons 808 760
B.3) Other retail exposures: SMEs 209 213
C. Equity exposures 454 329
C.1) Equity exposures (Simple risk weight approach) 319 201
- Private equity exposures in sufficiently diversified portfolios 1 3
- Exchange-traded equity exposures 37 37
- Other equity exposures 281 161
C.2) Equity exposures (PD/LGD approach) - -
C.3) Equity exposures (Exposures subject to fixed weighting factors) 135 128
Total capital requirement for credit and counterparty risk (IRB Approach) 9,914 9,825
Capital requirement
Details of the capital requirement for Credit and Counterparty Risk (IRB Approaches) - Specialised lending - slotting criteria
(millions of euro)
Regulatory portfolio
30.06.2016 31.12.2015
A. Specialised lending - slotting criteria 71 75
A.1) Category 1 - 50% - 70% greater than or equal to 2.5 years 11 8
A.2) Category 2 - 70% less than 2.5 years - 90% 23 17
A.3) Category 3 - 115% 19 31
A.4) Category 4 - 250% 18 19
A.5) Category 5 - 0% - -
Total capital requirement for credit and counterparty risk (IRB Approach) - slotting criteria 71 75
Capital requirement
Capital requirement for Credit and Counterparty Risk on securitisations – banking book
(millions of euro)
30.06.2016 31.12.2015
Securitisations - Standardised Approach 284 239
Securitisations - IRB (Rating Based Approach - Supervisory formula approach) 110 115
Total capital requirement for credit and counterparty risk on securitisations 394 354
Capital requirement
25

Basel 3 Pillar 3 – Capital requirements
Capital requirement for Market Risk (millions of euro)
30.06.2016 31.12.2015
Assets included in the regulatory trading book 1,286 1,254
Position risk (a)1,286 1,254
Other assets 113 72
Foreign exchange risk 84 52
Commodity risk 29 20
Total capital requirement for market risk 1,399 1,326
(a) The caption includes capital requirements for exposures to securitisations for 60 million euro.
Capital requirement
Capital requirement for Operational Risk
(millions of euro)
30.06.2016 31.12.2015
Basic indicator approach 45 45
Standardised approach 232 232
Advanced measurement approach 1,412 1,375
Total capital requirement for operational risk 1,689 1,652
Capital requirement
As already noted, almost all the Group companies use the Advanced Measurement Approach (AMA) and – to a lesser extent – the Standardised Approach to determine capital requirements for operational risk. A small remaining number of companies use the Basic Indicator Approach (BIA). For the AMA Approach the requirement is recalculated on a half yearly basis, whereas for the Standardised and the BIA Approaches the requirement is normally only calculated annually, unless one or more Group companies change approach during the year, by migrating towards more evolved models. Compared to December, the increase in the requirement for the Advanced Measurement Approach is due to the periodic updating of the database on external events and of the "eligible" insurance coverage for capital purposes.
26

Credit risk: disclosures for portfolios treated under IRB approaches
Quantitative disclosure The supervisory regulations provide for two approaches for the calculation of the capital requirement: the Standardised approach and the Internal Rating Based (IRB) approach, in which the risk weightings are a function of the banks' internal assessments of their borrowers. The IRB approach is in turn divided into a Foundation Internal Rating Based (FIRB) approach and an Advanced Internal Rating Based (AIRB) approach that differ in the risk parameters that banks are required to estimate. Under the foundation approach, banks use their own PD estimates and regulatory values for the other risk parameters, whereas under the advanced approach the latter are also estimated internally. Given that the rating systems for retail exposures must reflect both the borrower risk and the specific risk of the transaction, in this case there is no distinction between the foundation and the advanced approach. As illustrated in this document, the Group is also proceeding with development of the rating models for the various segments and the extension of the scope of companies for their application are continuing in accordance with the gradual rollout plan for the advanced approaches presented to the Supervisory Authority. The exposure values as at 30 June 2016 for the various IRB approaches (IRB, Foundation IRB and Advanced IRB) are shown in the tables below. Exposure values by regulatory portfolio (Foundation IRB Approach)
(millions of euro)
Regulatory portfolio30.06.2016 31.12.2015
Exposures to or secured by corporates:
- Specialised lending - -
- SMEs (Small and Medium Enterprises) 180 178
- Other corporates 810 849
Total credit risk (IRB) 990 1,027
Exposure value
Exposure values by regulatory portfolio (Advanced IRB Approach)
(millions of euro)
Regulatory portfolio30.06.2016 31.12.2015
Exposures to or secured by corporates:
- Specialised lending 14,689 16,207
- SMEs (Small and Medium Enterprises) 68,238 69,806
- Other corporates 116,432 115,830
Total credit risk (Advanced IRB approach) 199,359 201,843
Exposure value
27
Basel 3 Pillar 3 – Credit risk: disclosures for portfolios treated under IRB approaches
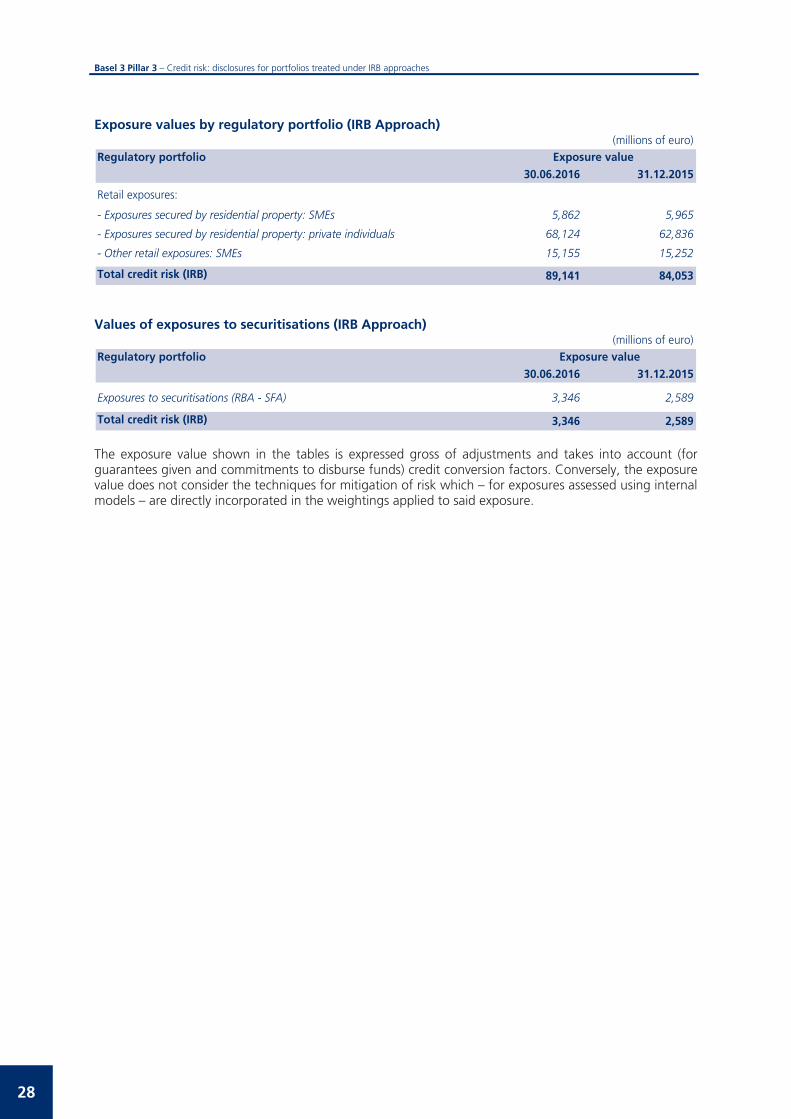
Exposure values by regulatory portfolio (IRB Approach)
(millions of euro)
Regulatory portfolio30.06.2016 31.12.2015
Retail exposures:
- Exposures secured by residential property: SMEs 5,862 5,965
- Exposures secured by residential property: private individuals 68,124 62,836
- Other retail exposures: SMEs 15,155 15,252
Total credit risk (IRB) 89,141 84,053
Exposure value
Values of exposures to securitisations (IRB Approach)
(millions of euro)
Regulatory portfolio30.06.2016 31.12.2015
Exposures to securitisations (RBA - SFA) 3,346 2,589
Total credit risk (IRB) 3,346 2,589
Exposure value
The exposure value shown in the tables is expressed gross of adjustments and takes into account (for guarantees given and commitments to disburse funds) credit conversion factors. Conversely, the exposure value does not consider the techniques for mitigation of risk which – for exposures assessed using internal models – are directly incorporated in the weightings applied to said exposure.
28

Basel 3 Pillar 3 – Credit risk: disclosures for portfolios treated under IRB approaches
Breakdown of exposures by exposure class and PD class (Foundation and Advanced IRB Approach)
(millions of euro)
31.12.2015Regulatory portfolio Rating
classCentral PD (%)
Exposurevalue
Average riskweight
Weighted average LGD
(%) (*)
Exposurevalue
- Specialised lending 14,689 16,207
-class from
1 to 3 - - - - -
-class 4 - - - - -
-class 5 - - - - -
-class 6 - - - - -
-class 7 0.09 5 38% 39.2 4
-class 8 - - - - 4
-class 9 0.19 256 59% 36.0 83
-class 10 0.25 406 53% 30.6 522
-class 11 0.39 931 59% 26.1 1,247
-class 12 0.62 2,183 52% 21.8 1,752
-class 13 0.98 934 65% 24.7 1,372
-class 14 1.39 1,526 79% 28.2 1,953
-class 15 2.16 1,496 79% 25.8 2,208
-class 16 3.74 937 80% 24.0 941
-class 17 5.91 827 101% 25.3 1,072
-class 18 10.19 883 116% 24.1 641
-class 19 14.34 273 146% 29.4 395
-class 20 19.56 736 169% 30.2 748
-class 21
(default) 100.00 3,296 - 40.4 3,265
- SMEs (Small and Medium Enterprises) 68,418 69,984 -class from
1 to 3 - - - - -
-class 4 - - - - -
-class 5 0.05 3 17% 41.3 4
-class 6 0.06 1,562 14% 34.3 1,332
-class 7 0.09 1,692 17% 33.4 1,667
-class 8 0.11 2,798 22% 33.6 2,590
-class 9 0.19 3,099 27% 33.2 2,938
-class 10 0.25 2,472 33% 33.3 2,497
-class 11 0.39 4,639 44% 33.9 4,404
-class 12 0.62 4,284 52% 32.9 4,041
-class 13 0.98 4,625 59% 32.6 4,945
-class 14 1.39 4,709 65% 32.0 5,069
-class 15 2.16 5,708 74% 31.6 5,989
-class 16 3.74 3,537 85% 30.7 4,385
-class 17 5.91 2,174 103% 30.6 2,375
-class 18 10.19 1,178 117% 30.3 1,303
-class 19 14.34 37 129% 33.3 33
-class 20 19.56 1,972 148% 31.2 2,199
-class 21
(default) 100.00 23,929 - 51.0 24,213
(*) The disclosure refers only to the Advanced IRB approach.
Exposures to or secured by corporates
30.06.2016
29

Basel 3 Pillar 3 – Credit risk: disclosures for portfolios treated under IRB approaches
(millions of euro)31.12.2015
Regulatory portfolio Rating class
Central PD (%)
Exposure value Average riskweight
Weighted average LGD
(%) (*)
Exposurevalue
- Other corporates 117,242 116,679 -class 1 - - - - -
-class 2 - - - - -
-class 3 0.03 2,459 10% 37.7 3,663
-class 4 0.04 1,657 14% 39.1 1,421
-class 5 0.05 1,734 17% 40.0 2,325
-class 6 0.06 7,386 20% 36.2 8,305
-class 7 0.09 8,475 28% 37.7 8,058
-class 8 0.11 9,188 31% 37.0 8,949
-class 9 0.19 9,611 40% 37.1 8,235
-class 10 0.25 10,571 52% 37.4 10,837
-class 11 0.39 11,766 61% 36.2 11,821
-class 12 0.62 12,229 77% 37.0 11,422
-class 13 0.98 6,381 82% 36.4 6,314
-class 14 1.39 8,336 93% 35.5 7,684
-class 15 2.16 7,859 114% 36.8 7,185
-class 16 3.74 3,381 124% 35.1 3,886
-class 17 5.91 1,587 158% 37.0 1,628
-class 18 10.19 1,618 198% 39.3 1,478
-class 19 14.34 97 229% 40.5 71
-class 20 19.56 1,297 197% 33.6 1,198
-class 21
(default) 100.00 11,610 - 45.1 12,199
(*) The disclosure refers only to the Advanced IRB approach.
30.06.2016
Exposures to or secured by corporates -continued
30

Basel 3 Pillar 3 – Credit risk: disclosures for portfolios treated under IRB approaches
Breakdown of exposures by exposure class and PD class (IRB Approach) (millions of euro)
31.12.2015Regulatory portfolio Rating
classCentral PD (%)
Exposure value Average riskweight
Weighted average LGD
(%)
Exposurevalue
- Exposures secured by residential property: SMEs 5,862 5,965
-class from 1 to 5 - - - - -
-class 6 - - - - -
-class 7 - - - - -
-class 8 0.11 743 6% 22.1 735
-class 9 0.19 2 15% 42.6 2
-class 10 0.25 510 8% 22.1 513
-class 11 0.39 323 12% 22.3 327
-class 12 0.62 354 15% 22.2 358
-class 13 0.98 458 20% 22.4 454
-class 14 1.39 531 23% 22.4 549
-class 15 2.16 521 26% 22.4 518
-class 16 3.74 256 28% 22.7 292
-class 17 5.91 163 32% 22.7 187
-class 18 10.19 3 95% 33.2 4
-class 19 14.34 139 40% 22.5 147
-class 20 19.56 154 46% 22.6 183
-class 21 - - - - -
(default) 100.00 1,705 - 33.6 1,696
- Exposures secured by residential property: private individuals 68,124 62,836 -class from
1 to 2 - - - - -
-class 3 0.03 1,222 2% 22.7 1,139
-class 4 - - - - -
-class 5 - - - - -
-class 6 0.06 7,599 3% 14.0 6,772
-class 7 - - - - -
-class 8 0.11 2,961 4% 13.6 2,492
-class 9 0.19 8,700 7% 13.3 7,719
-class 10 - - - - -
-class 11 0.39 19,639 10% 12.9 18,443
-class 12 0.62 10,412 16% 13.9 9,976
-class 13 0.98 - - - -
-class 14 1.39 4,697 24% 13.8 3,978
-class 15 2.16 3,351 32% 13.7 2,649
-class 16 3.74 3,101 49% 13.8 3,006
-class 17 5.91 - - - -
-class 18 - - - - -
-class 19 - - - - 1
-class 20 19.56 2,175 83% 13.9 2,399
-class 21 - - - - -
(default) 100.00 4,267 - 24.7 4,262
Retail exposures
30.06.2016
31
Basel 3 Pillar 3 – Credit risk: disclosures for portfolios treated under IRB approaches
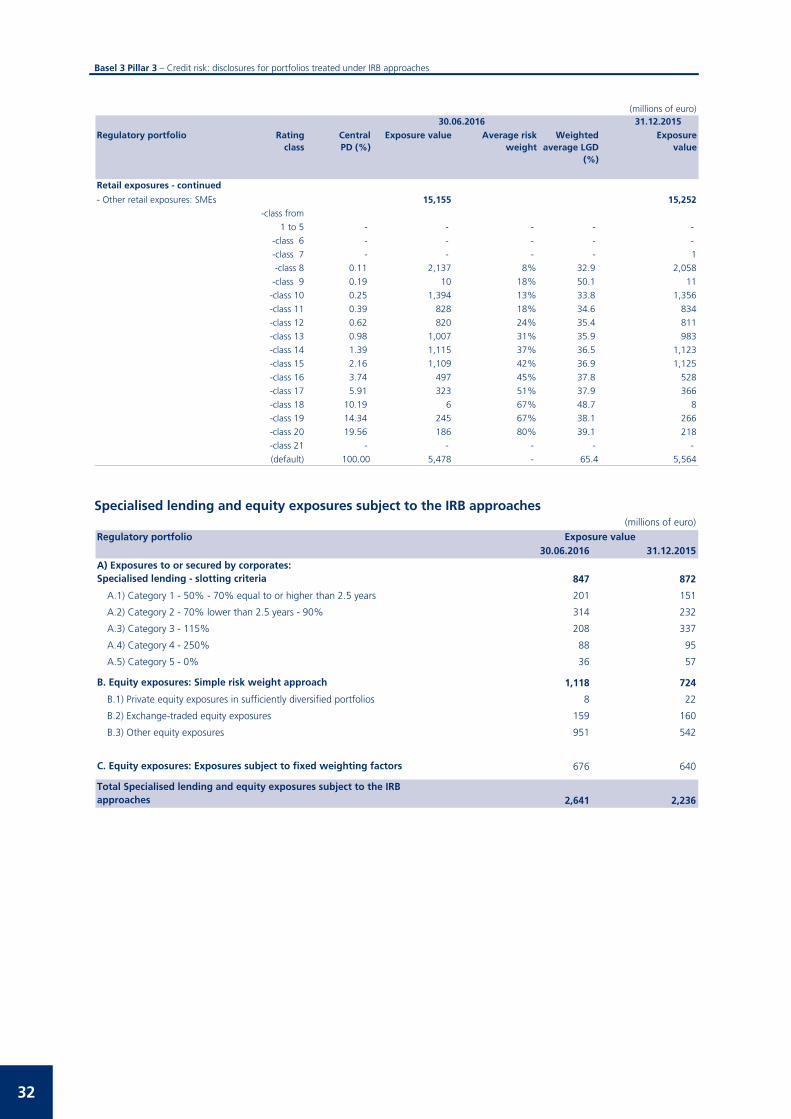
(millions of euro)31.12.2015
Regulatory portfolio Rating class
Central PD (%)
Exposure value Average riskweight
Weighted average LGD
(%)
Exposurevalue
- Other retail exposures: SMEs 15,155 15,252 -class from
1 to 5 - - - - -
-class 6 - - - - -
-class 7 - - - - 1
-class 8 0.11 2,137 8% 32.9 2,058
-class 9 0.19 10 18% 50.1 11
-class 10 0.25 1,394 13% 33.8 1,356
-class 11 0.39 828 18% 34.6 834
-class 12 0.62 820 24% 35.4 811
-class 13 0.98 1,007 31% 35.9 983
-class 14 1.39 1,115 37% 36.5 1,123
-class 15 2.16 1,109 42% 36.9 1,125
-class 16 3.74 497 45% 37.8 528
-class 17 5.91 323 51% 37.9 366
-class 18 10.19 6 67% 48.7 8
-class 19 14.34 245 67% 38.1 266
-class 20 19.56 186 80% 39.1 218
-class 21 - - - - -
(default) 100.00 5,478 - 65.4 5,564
30.06.2016
Retail exposures - continued
Specialised lending and equity exposures subject to the IRB approaches
(millions of euro)
Regulatory portfolio30.06.2016 31.12.2015
A) Exposures to or secured by corporates: Specialised lending - slotting criteria 847 872
A.1) Category 1 - 50% - 70% equal to or higher than 2.5 years 201 151
A.2) Category 2 - 70% lower than 2.5 years - 90% 314 232
A.3) Category 3 - 115% 208 337
A.4) Category 4 - 250% 88 95
A.5) Category 5 - 0% 36 57
B. Equity exposures: Simple risk weight approach 1,118 724
B.1) Private equity exposures in sufficiently diversified portfolios 8 22
B.2) Exchange-traded equity exposures 159 160
B.3) Other equity exposures 951 542
C. Equity exposures: Exposures subject to fixed weighting factors 676 640
Total Specialised lending and equity exposures subject to the IRB approaches 2,641 2,236
Exposure value
32
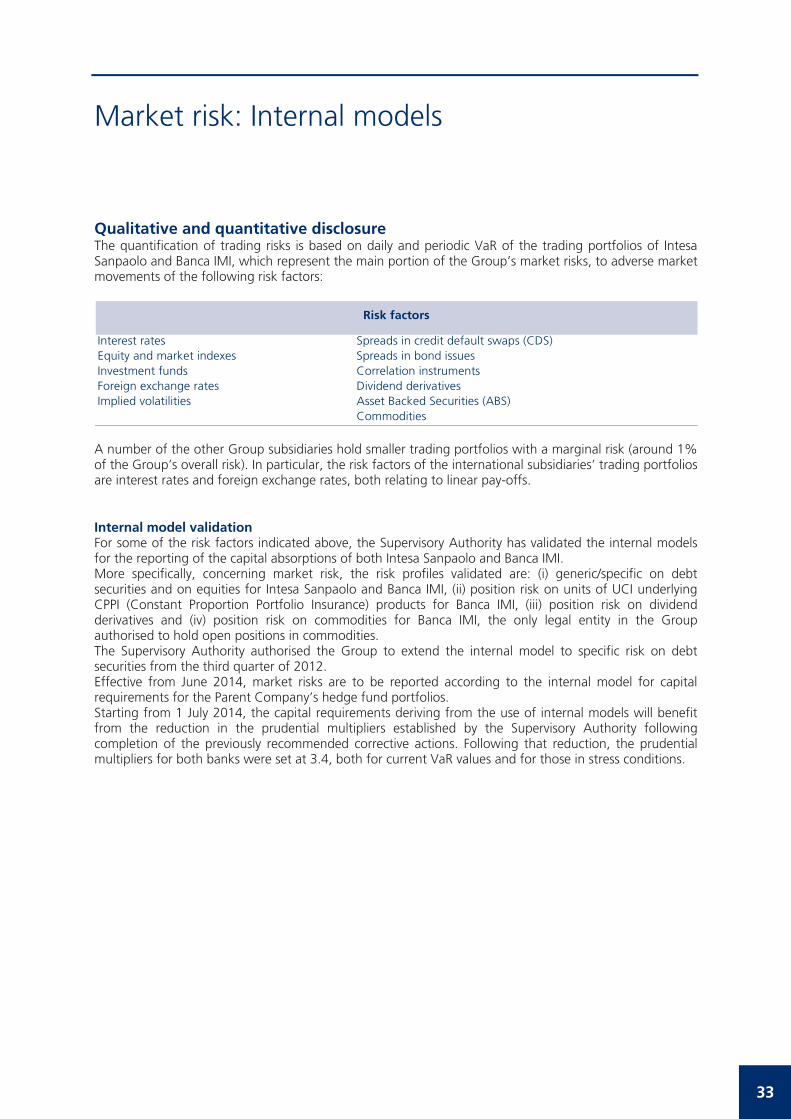
Market risk: Internal models Qualitative and quantitative disclosure The quantification of trading risks is based on daily and periodic VaR of the trading portfolios of Intesa Sanpaolo and Banca IMI, which represent the main portion of the Group’s market risks, to adverse market movements of the following risk factors:
Interest rates Spreads in credit default swaps (CDS)Equity and market indexes Spreads in bond issuesInvestment funds Correlation instrumentsForeign exchange rates Dividend derivativesImplied volatilities Asset Backed Securities (ABS)
Commodities
Risk factors
A number of the other Group subsidiaries hold smaller trading portfolios with a marginal risk (around 1% of the Group’s overall risk). In particular, the risk factors of the international subsidiaries’ trading portfolios are interest rates and foreign exchange rates, both relating to linear pay-offs. Internal model validation For some of the risk factors indicated above, the Supervisory Authority has validated the internal models for the reporting of the capital absorptions of both Intesa Sanpaolo and Banca IMI. More specifically, concerning market risk, the risk profiles validated are: (i) generic/specific on debt securities and on equities for Intesa Sanpaolo and Banca IMI, (ii) position risk on units of UCI underlying CPPI (Constant Proportion Portfolio Insurance) products for Banca IMI, (iii) position risk on dividend derivatives and (iv) position risk on commodities for Banca IMI, the only legal entity in the Group authorised to hold open positions in commodities. The Supervisory Authority authorised the Group to extend the internal model to specific risk on debt securities from the third quarter of 2012. Effective from June 2014, market risks are to be reported according to the internal model for capital requirements for the Parent Company’s hedge fund portfolios. Starting from 1 July 2014, the capital requirements deriving from the use of internal models will benefit from the reduction in the prudential multipliers established by the Supervisory Authority following completion of the previously recommended corrective actions. Following that reduction, the prudential multipliers for both banks were set at 3.4, both for current VaR values and for those in stress conditions.
33

Basel 3 Pillar 3 – Market risk: Internal models
Breakdown of capital requirements by Calculation approach (millions of euro)
30.06.2016 31.12.2015
Total risk weighted exposures: market risk 1,399 1,326Standardised approach 212 228
Position risk on debt instruments 79 104
Position risk on equity exposures 49 72
Foreign exchange risk 84 52
Position risk on commodities - -Internal models 1,187 1,098
Total risk weighted exposures: concentration risk - -
Position risk also shows the requirements relating to positions exposed towards trading book securitisations separately which amount to 60 million. VaR The analysis of market risk profiles relative to the trading book uses various quantitative indicators and VaR is the most important. Since VaR is a synthetic indicator which does not fully identify all types of potential loss, risk management has been enriched with other measures, in particular simulation measures for the quantification of risks from illiquid parameters (dividends, correlation, ABS, hedge funds). VaR estimates are calculated daily based on simulations of historical time-series, a 99% confidence level and 1-day holding period. The following paragraphs provide the estimates and evolution of VaR, defined as the sum of VaR and of the simulation on illiquid parameters, for the trading book of Intesa Sanpaolo and Banca IMI. Stress tests Stress tests measure the value changes of instruments or portfolios due to changes in risk factors of unexpected intensity and correlation, or extreme events, as well as changes representative of expectations of the future evolution of market variables. Stress tests are applied periodically to market risk exposures, typically adopting scenarios based on historical trends recorded by risk factors, for the purpose of identifying past worst case scenarios, or defining variation grids of risk factors to highlight the direction and non-linearity of trading strategies. Sensitivity and greeks Sensitivity measures make risk profiling more accurate, especially in the presence of option components. These measure the risk attributable to a change in the value of a financial position to predefined changes in valuation parameters including a one basis point increase in interest rates. Level measures Level measures are risk indicators which are based on the assumption of a direct relationship between the size of a financial position and the risk profile. These are used to monitor issuer/sector/country risk exposures for concentration analysis, through the identification of notional value, market value or conversion of the position in one or more benchmark instruments (so-called equivalent position).
34

Basel 3 Pillar 3 – Market risk: Internal models
Daily VaR evolution During the second quarter of 2016, the market risks generated by Intesa Sanpaolo and Banca IMI decreased compared to the average values of the first quarter of 2016. The average VaR for the period totalled 97 million euro compared to 105 million euro of March 2016. Daily VaR of the trading portfolio for Intesa Sanpaolo and Banca IMI
(millions of euro)
average 2nd quarter
minimum 2nd quarter
maximum 2nd quarter
average 1st quarter
average 4th quarter
average 3rd quarter
average 2nd quarter
average 1st quarter
Intesa Sanpaolo 11.5 10.2 14.1 14.9 13.2 11.6 13.8 12.1Banca IMI 85.5 70.8 122.4 90.0 85.0 104.7 71.1 64.6
Total 97.0 82.4 134.0 104.9 98.3 116.3 84.9 76.7
(a) Each line in the table sets out past estimates of daily operating VaR calculated on the quarterly historical time-series respectively of Intesa Sanpaolo and Banca IMI; minimum and maximum values for Intesa Sanpaolo andBanca IMI are estimated using aggregate historical time-series and therefore do not correspond to the sum of the individual values in the column.
2016 2015Operating VaR (a)
Compared to last year, the risk measures for the first half have increased: for 2016 an average group VaR of 101 million was recorded whilst in 2015 the average amounted to approximately 81 million euro.
(millions of euro)
average
1st half
minimum
1st half
maximum
1st half
average
1st half
minimum
1st half
maximum
1st halfIntesa Sanpaolo 13.2 10.2 17.5 12.9 6.0 18.5Banca IMI 87.7 64.8 122.4 67.9 54.0 113.6
Total 100.9 78.4 134.0 80.8 64.5 122.7
(a) Each line in the table sets out past estimates of daily VaR calculated on the historical time-series of the year respectively of Intesa Sanpaolo and Banca IMI; minimum andmaximum values for the two companies are estimated using aggregate historical time-series and therefore do not correspond to the sum of the individual values in the column.
20152016Operating VaR (a)
For Intesa Sanpaolo the breakdown of the risk profile in the second quarter of 2016, with regard to the various factors, shows the prevalence of the risk generated by foreign exchange, which accounted for 45% of total VaR (primarily linked to hedge positions of banking book entries, excluding which, the component relating to interest rate risk is the main one); for Banca IMI, credit spread risk was the most significant, representing 82% of total VaR. Contribution of risk factors to total VaR(a)
2nd quarter 2014 Shares Hedgefund
Rates Credit spread
Foreignexchange
rates
Otherparameters
Commodities
Intesa Sanpaolo 5% 12% 18% 16% 45% 3% 0%
Banca IMI 5% 0% 8% 82% 1% 2% 2%
Total 6% 1% 15% 69% 5% 2% 2%(a)
Each line in the table sets out the contribution of risk factors considering 100% the overall capital at risk, calculated as the average of daily estimates in the second quarter of 2016, broken down between Intesa
Sanpaolo and Banca IMI and indicating the distribution of overall capital at risk.
The evolution of VaR in the last twelve months is set out below. The trend in VaR is mainly attributable to Banca IMI. In the second quarter of 2016, a decrease in VaR was initially recorded as a result of sales and exiting scenarios of volatility; then, subsequently, from mid-May onwards, the measures recorded a slight increase as a result of purchases of government securities (within the limits approved for 2016). On 24 June 2016, in correspondence to the outcome of the referendum in the UK (Leave victory), volatility of credit spreads was then recorded on the markets accompanied by lower interest rates and share prices. The new scenario generated an increase in Group VaR, which recorded a peak of 134 million euro towards the end of the period; nevertheless, the risk measures remained contained within the set limits and, during the first few days of July, they were slightly down.
35

Basel 3 Pillar 3 – Market risk: Internal models
With regard to the hedge fund portfolio, the table below shows the exposures broken down by type of strategy adopted. Contribution of strategies to portfolio breakdown (a)
30.06.2016 31.12.2015
- Catalist Driven 14.0% 15.0%- Credit 45.0% 42.0%- Directional trading 21.6% 18.0%- Equity hedged 15.0% 19.0%- Equity Long Only 3.9% 5.8%- Multi-strategy 0.5% 0.2%
Total hedge funds 100.0% 100.0%(a)
The table sets out on every line the percentage of total cash exposures calculated on amounts at period-end. In the first half of 2016 the hedge fund portfolio maintained an asset allocation with a focus on strategies relating to credit (45% of the total in terms of portfolio value). The VaR of the hedge fund portfolio is calculated on a full transparency basis for funds managed on the Managed Account platform (79%). Risk control with regard to the trading activity of Intesa Sanpaolo and Banca IMI also uses scenario analyses and stress tests. The impact on the income statement of selected scenarios relating to the evolution of stock prices, interest rates, credit spreads, foreign exchange rates and commodity prices at the end of June is summarised in the following table:
(millions of euro)
volatility +10% and prices -5%
volatility -10% and prices +5%
+40bp lower rate -25bp +25bp -10% +10% -50% +50%
Total -3 8 -36 87 311 -299 27 -22 29 -16
EQUITY INTEREST RATES CREDIT SPREADSFOREIGN EXCHANGE
RATES COMMODITY
In particular: on stock market positions, a 5% decrease in stock prices with a resulting 10% increase in volatility
would have led to a loss of approximately 3 million euro; on interest rate exposures, a rise of the curves of 40 basis points would have had a negative impact of
36 million euro, whereas a scenario with near zero rates would have led to potential gains; on exposures sensitive to credit spread fluctuations, a 25 basis point widening in spreads would have
3
23
43
63
83
103
123
143
Jul-15 Sep-15 Dec-15 Mar-16 Jun-16
Mill
ions
of
euro
Daily evolution of market risks - VaR
Intesa Sanpaolo + Banca IMI Intesa Sanpaolo
36
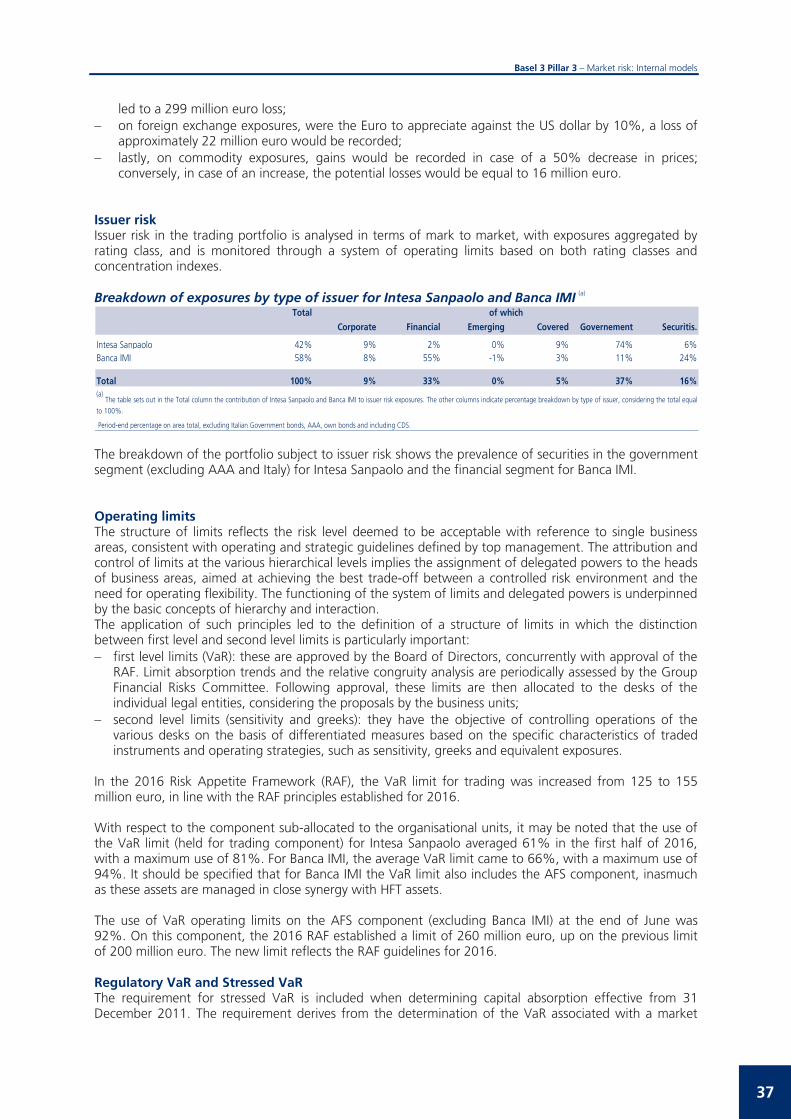
Basel 3 Pillar 3 – Market risk: Internal models
led to a 299 million euro loss; on foreign exchange exposures, were the Euro to appreciate against the US dollar by 10%, a loss of
approximately 22 million euro would be recorded; lastly, on commodity exposures, gains would be recorded in case of a 50% decrease in prices;
conversely, in case of an increase, the potential losses would be equal to 16 million euro. Issuer risk Issuer risk in the trading portfolio is analysed in terms of mark to market, with exposures aggregated by rating class, and is monitored through a system of operating limits based on both rating classes and concentration indexes. Breakdown of exposures by type of issuer for Intesa Sanpaolo and Banca IMI (a)
TotalCorporate Financial Emerging Covered Governement Securitis.
Intesa Sanpaolo 42% 9% 2% 0% 9% 74% 6%Banca IMI 58% 8% 55% -1% 3% 11% 24%
Total 100% 9% 33% 0% 5% 37% 16%(a)
The table sets out in the Total column the contribution of Intesa Sanpaolo and Banca IMI to issuer risk exposures. The other columns indicate percentage breakdown by type of issuer, considering the total equal
to 100%.
Period-end percentage on area total, excluding Italian Government bonds, AAA, own bonds and including CDS.
of which
The breakdown of the portfolio subject to issuer risk shows the prevalence of securities in the government segment (excluding AAA and Italy) for Intesa Sanpaolo and the financial segment for Banca IMI. Operating limits The structure of limits reflects the risk level deemed to be acceptable with reference to single business areas, consistent with operating and strategic guidelines defined by top management. The attribution and control of limits at the various hierarchical levels implies the assignment of delegated powers to the heads of business areas, aimed at achieving the best trade-off between a controlled risk environment and the need for operating flexibility. The functioning of the system of limits and delegated powers is underpinned by the basic concepts of hierarchy and interaction. The application of such principles led to the definition of a structure of limits in which the distinction between first level and second level limits is particularly important: first level limits (VaR): these are approved by the Board of Directors, concurrently with approval of the
RAF. Limit absorption trends and the relative congruity analysis are periodically assessed by the Group Financial Risks Committee. Following approval, these limits are then allocated to the desks of the individual legal entities, considering the proposals by the business units;
second level limits (sensitivity and greeks): they have the objective of controlling operations of the various desks on the basis of differentiated measures based on the specific characteristics of traded instruments and operating strategies, such as sensitivity, greeks and equivalent exposures.
In the 2016 Risk Appetite Framework (RAF), the VaR limit for trading was increased from 125 to 155 million euro, in line with the RAF principles established for 2016. With respect to the component sub-allocated to the organisational units, it may be noted that the use of the VaR limit (held for trading component) for Intesa Sanpaolo averaged 61% in the first half of 2016, with a maximum use of 81%. For Banca IMI, the average VaR limit came to 66%, with a maximum use of 94%. It should be specified that for Banca IMI the VaR limit also includes the AFS component, inasmuch as these assets are managed in close synergy with HFT assets. The use of VaR operating limits on the AFS component (excluding Banca IMI) at the end of June was 92%. On this component, the 2016 RAF established a limit of 260 million euro, up on the previous limit of 200 million euro. The new limit reflects the RAF guidelines for 2016. Regulatory VaR and Stressed VaR The requirement for stressed VaR is included when determining capital absorption effective from 31 December 2011. The requirement derives from the determination of the VaR associated with a market
37

Basel 3 Pillar 3 – Market risk: Internal models
stress period. This period was identified considering the following guidelines, on the basis of the indications presented in the Basel document “Revision to the Basel 2 market risk framework”: the period must represent a stress scenario for the portfolio; the period must have a significant impact on the main risk factors for the portfolios of Intesa
Sanpaolo and Banca IMI; the period must allow real historical series to be used for all portfolio risk factors. In keeping with the historical simulation approach employed to calculate VaR, the latter point is a discriminating condition in the selection of the holding period. In fact, in order to ensure that the scenario adopted is effectively consistent and to avoid the use of driver or comparable factors, the historical period must ensure the effective availability of market data. As at the date of preparation of the document, the period relevant to the measurement of stressed VaR was set as 1 January to 30 December 2011 for Intesa Sanpaolo and as 1 July 2011 to 30 June 2012 for Banca IMI. The graph below shows the trend of the measures.
The table below shows the summary measures relating to the regulatory capital with the breakdown for current VaR measures and VaR in stress conditions. Current daily value at risk
(millions of euro)
average
2nd quarter
minimum
2nd quarter
maximum
2nd quarter
average
1st quarter
average
4th quarter
average
3rd quarter
average2nd quarter
average1st quarter
Intesa Sanpaolo 3.5 2.5 6.4 6.4 4.9 6.1 11.7 9.7Banca IMI 19.7 15.3 26.8 14.2 14.1 12.1 9.6 10.7
Total 23.2 17.8 33.2 20.6 19.0 18.2 21.3 20.4
2016 2015
-
5
10
15
20
25
30
35
40
45
Jul-15 Sep-15 Dec-15 Mar-16 Jun-16
Mill
ion
euro
Daily evolution of market risks: VaR and regulatory Stressed VaR
Stressed VaR (Intesa Sanpaolo + Banca IMI) VaR (Intesa Sanpaolo + Banca IMI)
38

Basel 3 Pillar 3 – Market risk: Internal models
Value at risk in stress condition (millions of euro)
average
2nd quarter
minimum
2nd quarter
maximum
2nd quarter
average
1st quarter
average
4th quarter
average
3rd quarter
average2nd quarter
average1st quarter
Intesa Sanpaolo 11.3 7.9 16.2 18.2 16.5 19.9 15.8 16.5Banca IMI 39.6 31.6 47.6 43.3 45.5 25.4 29.2 35.9
Total 50.9 39.5 63.8 61.5 62.0 45.3 45.0 52.4
2016 2015
Incremental Risk Charge (IRC) The Incremental Risk Charge (IRC) is the maximum potential loss in the credit trading portfolio resulting from an upgrade/downgrade or bankruptcy of the issuers, over a 1-year period, with a 99.9% confidence level. This measure is additional to VaR and enables the correct representation of the specific risk on debt securities and credit derivatives because, in addition to idiosyncratic risk, it also captures event and default risk. The use of the IRC limits at the end of June amounted to 26.3% for Intesa Sanpaolo (limit of 290 million euro) and 74.9% for Banca IMI (limit of 400 million euro). The table below shows the summary data concerning the quarterly performance. Incremental Risk Charge
average
2nd quarter
minimum
2nd quarter
maximum
2nd quarter
average
1st quarter
average
4th quarter
average
3rd quarter
average2nd quarter
average1st quarter
Intesa Sanpaolo 86.1 72.6 113.7 118.3 109.8 113.6 130.8 147.8Banca IMI 126.8 96.0 294.1 107.6 106.5 93.2 139.0 182.3
Total 212.9 168.6 407.8 225.9 216.3 206.8 269.8 330.1
2016 2015
Backtesting The effectiveness of the VaR calculation methods must be monitored daily via backtesting which, as concerns regulatory backtesting, compares: – the daily estimates of value at risk; – the daily profits/losses based on backtesting which are determined using actual daily profits and losses
achieved by individual desks, net of components which are not considered in backtesting such as commissions and intraday activities.
Backtesting allows verification of the model’s capability of correctly seizing, from a statistical viewpoint, the variability in the daily valuation of trading positions, covering an observation period of one year (approximately 250 estimates). Any critical situations relative to the adequacy of the Internal Model are represented by situations in which daily profits/losses based on backtesting highlight more than three occasions, in the year of observation, in which the daily loss is higher than the value at risk estimate. Current regulations require that backtesting is performed by taking into consideration both the actual P&L series recorded and the theoretical series. The latter is based on revaluation of the portfolio value through the use of valuation models adopted for the VaR measurement calculation. The number of significant backtesting exceptions is determined as the maximum between those for actual P&L and theoretical P&L.
39

Basel 3 Pillar 3 – Market risk: Internal models
Backtesting in Intesa Sanpaolo There were three backtesting exceptions during the last year linked to the effects of the Greek debt crisis, and to equity market volatility at the end of August 2015.
Backtesting in Banca IMI Banca IMI's two backtesting exceptions are to be attributed to the increase in volatility of financial spreads recorded during the first quarter of 2016.
-15.0
-10.0
-5.0
0.0
5.0
10.0
15.0
Jul-15 Sep-15 Dec-15 Mar-16 Jun-16
Mili
ons
of e
uro
Daily profits/losses from backtesting Daily value at risk
-35.0
-30.0
-25.0
-20.0
-15.0
-10.0
-5.0
0.0
5.0
10.0
15.0
20.0
25.0
30.0
Jul-15 Sep-15 Dec-15 Mar-16 Jun-16
Mili
ons
of e
uro
Daily profits/losses from backtesting Daily value at risk
40
Basel 3 Pillar 3 – Market risk: Internal models
Fair Value Policy The Intesa Sanpaolo Group’s Fair Value Policy governs the measurement of financial instruments after initial recognition with reference to the Group’s portfolios measured at fair value. The Fair Value Policy, in all of its constituent documents, is governed and formalised by the Risk Management Department, applies to the Parent Company and all the consolidated subsidiaries, is integrated into the risk measurement and management processes, is subject to regular review and updating and approval by the relevant functions, and is used for the preparation of the financial statement documents. For details on the accounting criteria, on the various stages of the valuation process of financial instruments and more detailed information on the valuation models used for the measurement of financial instruments, reference should be made to the previous version of this document, relating to the 2015 financial year. These criteria are also summarised in the Consolidated Half-yearly Report as at 30 June 2016 (see “Risk Management”). During the first half of 2016 the main change to the Fair Value Policy was the implementation of the Funding Value Adjustment (FVA) in the assessment of OTC derivatives. This assessment component takes into consideration the liquidity risk premium, connected to the costs of funding the cash flows generated by an OTC derivative portfolio. Like the Credit/Debit Value Adjustment (bCVA), the FVA depends on the probability of default of the counterparties and considers any netting and collateralisation agreements (CSA).
41


Operational risk: Internal models
Qualitative and quantitative disclosure Methods for calculating Operational Risk With regard to operational risk, on 31 December 2009 the Group adopted the Advanced Measurement Approach (AMA - internal model), in partial use with the standardised (TSA) and basic approaches (BIA) to determine the associated capital requirement for regulatory purposes. The AMA approach was adopted by the leading banks and companies in the Banca dei Territori, Corporate and Investment Banking, Private Banking and Asset Management Divisions, by the Intesa Sanpaolo Group Services consortium, by VUB Banka (including Consumer Financial Holding and VUB Leasing) and PBZ Banka. The following shows the breakdown by type of operational event of capital requirement relating to the AMA, which represents 84% of the total requirement (equal to 1,689 million euro as at 30 June 2016). Breakdown of capital requirement (Advanced Measurement Approach - AMA) by type of operational event
43
Clients, products & business practices 47.5%
Disaster and other events 2.7%
Internal illegal activities 11.8%
Execution, delivery and process management 23.2%
Information technologies and utility services 4.3%
Employment practices and workplace safety 2.9%
External illegal activities 7.6%

Basel 3 Pillar 3 – Operational risk: Internal models
The internal model for calculating capital absorption is conceived in such a way as to combine all the main sources of quantitative (operational losses) and qualitative (Self-diagnosis) information. The quantitative component is based on an analysis of historical data concerning internal events (recorded by the organisational units, appropriately verified by the Head Office Department and managed by a dedicated IT system) and external events (by the Operational Riskdata eXchange Association). The qualitative component (scenario analysis) focuses on the forward-looking assessment of the risk exposure of each unit and is based on the structured, organised collection of subjective estimates expressed directly by management (subsidiaries, Parent Company’s business areas, the Corporate Centre) with the objective of assessing the potential economic impact of particularly severe operational events. Capital-at-risk is therefore identified as the minimum amount at Group level required to bear the maximum potential loss (worst case); Capital-at-risk is estimated using a Loss Distribution Approach model (actuarial statistical model to calculate the Value-at-risk of operational losses), applied on quantitative data and the results of the scenario analysis assuming a one-year estimation period, with a confidence level of 99.90%; the methodology also applies a corrective factor, which derives from the qualitative analyses of the risk level of the business environment (Business Environment Assessment), to take into account the effectiveness of internal controls in the various organisational units. Operational risks are monitored by an integrated reporting system, which provides management with support information for managing and/or mitigating the operational risk. In order to support the operational risk management process on a continuous basis, a structured training programme was implemented for employees actively involved in this process. In addition, the Group activated a traditional operational risk transfer policy (to protect against offences such as employee disloyalty, theft and damage, cash and valuables in transit losses, computer fraud, forgery, cyber crimes, earthquake and fire, and third-party liability), which contributes to mitigating exposure to operational risk. At the end of June 2013, in order to allow optimum use of the available operational risk transfer tools and to take advantage of the capital benefits, pursuant to applicable regulations the Group subscribed an insurance coverage policy named Operational Risk Insurance Programme, which offers additional coverage to traditional policies, significantly increasing the limit of liability, transferring the risk of significant operational losses to the insurance market. The internal model’s insurance mitigation component was approved by the Bank of Italy in June 2013 with immediate effect of its benefits on operations and on the capital requirements.
44
Leverage Ratio Qualitative disclosure Under the Basel 3 prudential regulations, the Leverage ratio entered definitively into effect on 1 January 2015. The Leverage ratio measures the degree to which Tier 1 Capital covers the Banking Group's total exposure. The ratio is calculated by considering assets and off-balance sheet exposures. The objective of the indicator is to contain the degree of indebtedness on banks' accounts by establishing a minimum level of coverage of exposures with equity. The ratio, which is monitored by the authorities, is expressed in percent form and is subject to a regulatory minimum threshold of 3% (the Basel Committee's reference value). The leverage ratio is calculated quarterly. The indicator is monitored at both the individual and Banking Group level. The Leverage ratio is calculated as the ratio of Tier 1 Capital to total exposure. Focusing on the denominator of the ratio, total exposure includes on-balance sheet exposures, net of any components deducted from Tier 1 Capital, and off-balance sheet exposures. The Delegated Act of the Commission of 10 October 2014 (which became Regulation (EU) No. 62/2015) was published in the Official Journal of the European Union on 17 January 2015. In the Delegated Act, which amends Regulation (EU) No. 575/2013 (the CRR), the European Commission provides indications aimed at ensuring the consistency of the various interpretations of the methods for calculating the Leverage Ratio that make the indicators calculated by the various institutions not comparable with one another. The main changes introduced by the Delegated Act, compared to the CRR regulation in force, impact on the exposure value, including, in particular: – for derivatives, the possibility of deducting from the exposure value the variation margin in cash, if
certain conditions laid down by the Delegated Act are met; – measurement of credit derivatives sold at their notional gross amount rather than at fair value, with
the possibility of deducting from the notional amount the changes in the fair value recognised through profit and loss (as negative components). When strict criteria are complied with, the offsetting of the protection sold with the protection purchased is also authorised;
– deduction from exposures of the “customer” component of transactions with a qualifying central counterparty (QCCP) where the entity is not obliged to reimburse the customer in the event of default of the QCCP, because no leverage effect is created;
– clarification that the collateral received for securities financing transactions cannot be used to reduce the exposure value of those transactions, but that receivables and payables in cash arising from such transactions with the same counterparty may be offset when strict criteria are met.
In addition, the Delegated Act - modifying Regulation (EU) No. 575/2013 - provides that the Leverage Ratio is calculated at the quarter end date, eliminating the discretion provided previously by the CRR (arithmetic mean of monthly ratios for the reference quarter, or - subject to prior authorisation of the competent Authority - the exact figure at the end of the quarter). On 15 February 2016, Commission Implementing Regulation 2016/200 was published in the Official Journal of the European Union laying down implementing technical standards with regard to the disclosure on the Leverage Ratio, under EU Regulation No. 575/2013. Therefore, starting from 31 March 2016, the Intesa Sanpaolo Group will publish the Leverage Ratio on the basis of the provisions contained in the Delegated Act. The reporting flows are still sent on the basis of the previous regulations, since Implementing Regulation (EU) No. 428/2016 of the Commission, amending Implementing Regulation (EU) No. 680/2014 laying down implementing technical standards with regard to supervisory reporting of institutions, shall apply from the first reference date for reporting due six months after the date of publication in the Official Journal of the European Union, that is from the reporting as at 30 September 2016.
45

Basel 3 Pillar 3 – Leverage ratio
Leverage Ratio of the Intesa Sanpaolo Group The following is the disclosure of the leverage ratio of the Intesa Sanpaolo Group as at 30 June 2016, disclosed in accordance with the regulatory principles of the CRR and set out according to the provisions of (EU) Implementing Regulation 2016/200. The ratio is expressed in percent form and is subject to the regulatory minimum threshold of 3% (the Basel Committee reference value). The Leverage Indicator is indicated according to the transitional provisions. Description of the processes used to manage the risk of excessive leverage The leverage ratio is one of the measurement criteria selected within the scope of the Risk Appetite Framework for the monitoring of the overall risk and, more specifically, of the Group’s capital adequacy. In line with the previous year, the 2016 RAF update confirmed the choice to define its limits by adding to the regulatory minimum of 3% a stress buffer (calculated considering a stress scenario with a 1/40 probability). Moreover, an Early Warning threshold has been confirmed, with an additional prudential buffer.
46

Basel 3 Pillar 3 – Leverage ratio
Quantitative disclosure LRCom table – Harmonised disclosure of the leverage ratio The table shows the leverage ratio as at 30 June 2016 and the breakdown of the total exposure into the main categories, according to the provisions of Article 451(1) (a, b, c) of the CRR.
(millions of euro)
30.06.2016
1 On-balance sheet items (excluding derivatives, SFTs and fiduciary assets, but including collateral) 503,873
2 (Asset amounts deducted in determining Tier 1 capital) - transitional regime -8,861
3 Total on-balance sheet exposures (excluding derivatives, SFTs and fiduciary assets) (sum of lines 1 and 2) 495,012
4 Replacement cost associated with all derivatives transactions (ie net of eligible cash variation margin) 13,305
5 Add-on amounts for PFE associated with all derivatives transactions (mark-to-market method) 13,076
EU-5a Exposure determined under Original Exposure Method -
6Gross-up for derivatives collateral provided where deducted from the balance sheet assets pursuant to the applicable accounting framework -
7 (Deductions of receivables assets for cash variation margin provided in derivatives transactions) -12,363
8 (Exempted CCP leg of client-cleared trade exposures) -
9 Adjusted effective notional amount of written credit derivatives 53,700
10 (Adjusted effective notional offsets and add-on deductions for written credit derivatives) -49,462
11 Total derivatives exposures (sum of lines 4 to 10) 18,256
12 Gross SFT assets (with no recognition of netting), after adjusting for sales accounting transactions 29,320
13 (Netted amounts of cash payables and cash receivables of gross SFT assets) -7,026
14 Counterparty credit risk exposure for SFT assets 3,397
EU-14a Derogation for SFTs: Counterparty credit risk exposure in accordance with Articles 429b(4) and 222 of Regulation (EU) No 575/2013 -
15 Agent transaction exposures -
EU-15a (Exempted CCP leg of client-cleared SFT exposure) -
16 Total securities financing transaction exposures (sum of lines 12to 15a) 25,691
17 Off-balance sheet exposures at gross notional amount 233,711
18 (Adjustments for conversion to credit equivalent amounts) -167,366
19 Other off-balance sheet exposures (sum of lines 17 and 18) 66,345
EU-19a(Exempted exposures in accordance with Article 429(7) and (14) of Regulation (EU) No 575/2013 (on and offbalance sheet)) -
EU-19b (Exposures exempted in accordance with Article 429 (14) of Regulation (EU) No 575/2013 (on and off balance sheet)) -
20 Tier 1 capital 39,761
21 Leverage ratio total exposure measure (sum of lines 3, 11, 16, 19, EU-19a and EU-19b) 605,304
22 Leverage ratio 6.57%
EU-23 Choice on transitional arrangements for the definition of the capital measure Transitional
EU-24 Amount of derecognised fiduciary items in accordance with Article 429(11) of Regulation (EU) No 575/2013 -
Capital and total exposure measure
Leverage ratio
Choice on transitional arrangements and amount of derecognised fiduciary items
On-balance sheet exposures (excluding derivatives and SFTs)
Derivative exposures
SFT exposures
Other off-balance sheet exposures
(Exempted exposures in accordance with Article 429(7) and (14) of Regulation (EU) No 575/2013 (on and off balance sheet))
47

Basel 3 Pillar 3 – Leverage ratio
LRSum table - Summary of the reconciliation between assets and exposures used to calculate the leverage ratio The table shows the reconciliation between total exposure (the denominator of the ratio) and the information disclosed in the financial statements in accordance with the provisions of Article 451 (1) (b) of the CRR.
(millions of euro)
30.06.2016
1 Total assets as per published financial statements 717,292
2 Adjustment for entities which are consolidated for accounting purposes but are outside the scope of regulatory consolidation -134,543
3Adjustment for fiduciary assets recognised on the balance sheet pursuant to the applicable accounting framework but excluded from the leverage ratio total exposure measure in accordance with Article 429(13) of Regulation (EU) No 575/2013 (CRR) -
4 Adjustments for derivative financial instruments -24,773
5 Adjustment for securities financing transactions (SFTs) -3,630
6 Adjustment for off-balance sheet items (ie conversion to credit equivalent amounts of off-balance sheet exposures) 66,345
EU-6a(Adjustment for intragroup exposures excluded from the leverage ratio total exposure measure in accordance with Article 429(7) of Regulation (EU) No 575/2013 (CRR)) -
EU-6b(Adjustment for intragroup exposures excluded from the leverage ratio total exposure measure in accordance with Article 429(14) of Regulation (EU) No 575/2013 (CRR)) -
7 Other adjustments (*) -15,387
8 Leverage ratio total exposure measure 605,304
(*) "Other adjustments" mainly include amounts related to assets deducted for the calculation of Tier 1 Capital (transitional regime)
Tavola di raffronto sintetico
LRSpl table - Breakdown of the balance sheet disclosures (excluding derivatives, SFTs and exempt exposures) For exposures other than derivatives and SFTs, the table provides a breakdown by counterparty, in accordance with the provisions of Article 451 (1) (b) of the CRR.
(millions of euro)
CRR leverage ratio exposures30.06.2016
EU-1 Total on-balance sheet exposures (excluding derivatives, SFTs, and exempted exposures), of which: 503,873
EU-2 Trading book exposures 16,538
EU-3 Banking book exposures, of which: 487,335
EU-4 Covered bonds 615
EU-5 Exposures treated as sovereigns 105,720
EU-6 Exposures to regional governments, local authorities, MDB, international organisations and PSE not treated as sovereigns 16,229
EU-7 Exposures to supervised intermediaries 36,769
EU-8 Secured by mortgages of immovable properties 89,950
EU-9 Retail exposures 36,214
EU-10 Corporate 133,372
EU-11 Exposures in default 32,462
EU-12 Other exposures (eg equity, securitisations, and other non-credit obligation assets) 36,004
48

Declaration of the Manager responsible for preparing the Company’s financial reports The Manager responsible for preparing the Company’s financial reports, Fabrizio Dabbene, declares, pursuant to par. 2 of art. 154-bis of the Consolidated Law on Finance, that the accounting information contained in this document “Basel 3 - Pillar 3 as at 30 June 2016” corresponds to the corporate records, books and accounts. Milano, August 2, 2016 Fabrizio Dabbene
Manager responsible for preparing the Company’s financial reports
49


Attachment 1
Own funds: Terms and conditions of all Common Equity Tier 1, Additional Tier 1 and Tier 2 instruments issued during the semester
51


Basel 3 Pillar 3 – Attachment 1: Own funds: Terms and conditions of capital instruments
1 Issuer Intesa Sanpaolo S.p.A.
2 Unique identifier US46115HAW79
3 Governing law(s) of the instrumentNew York Law, with the exception of matters concerning
subordination, regulated by Italian Law.
REGULATORY TREATMENT
4 Transitional CRR rules Tier 2 Capital
5 Post-transitional CRR rules Tier 2 Capital
6 Eligible at: solo; consolidated; solo & consolidated Solo & consolidated
7 Instrument type Debt security - Art. 62 CRR
8 Amount recognised in regulatory capital (€/mln) 1,351
Nominal amount of instrument: original amount in currency of issuance (mln) 1,500
Nominal amount of instrument: original amount - currency of issuance USD
Nominal amount of instruments: conversion of original amount into euro (€/mln) 1,378
9a Issue price 100
9b Redemption price 100
10 Accounting classification Liabilities - Amortised cost
11 Original date of issuance 15/01/2016
12 Perpetual or dated at maturity
13 Original maturity date 15/01/2026
14 Issuer call subject to prior supervisory approval N/A
Optional call date N/A
Contingent call dates and redemption amount N/A
16 Subsequent call dates, if applicable N/A
COUPONS / DIVIDENDS
17 Fixed or floating dividend/coupon Fixed
18 Coupon rate and any related index 5.71% per annum, payable semi-annually
19 Existence of a dividend stopper NO
Fully discretionary, partially discretionary or mandatory (in terms of timing) N/A
Fully discretionary, partially discretionary or mandatory (in terms of timing) - reasons for discretion N/A
20b Fully discretionary, partially discretionary or mandatory (in terms of amount) N/A
21 Existence of step up or other incentive to redeem NO
22 Noncomulative or comulative Noncumulative
23 Convertible or non-convertible Non-convertible
24 If convertible, conversion trigger(s) N/A
25 If convertible, fully or partially N/A
26 If convertible, conversion rate N/A
27 If convertible, mandatory or optional conversion N/A
28 If convertible, specify instrument type convertible into N/A
29 If convertible, specify issuer of instrument it converts into N/A
30 Write-down features NO
31 If write-down, write-down trigger(s) N/A
32 If write-down, full or partial N/A
33 If write-down, permanent or temporary N/A
34 If temporary write-down, description of write-up mechanism N/A
35 Position in subordination hierarchy in liquidationSenior compared to “Additional Tier 1” and
subordinated compared to “Senior Unsecured” instruments
36 Non-compliant transitioned features NO
37 If yes, specify non-compliant features N/A
N/A = Not applicable
9
15
20a
53

Basel 3 Pillar 3 – Attachment 1: Own funds: Terms and conditions of capital instruments
1 Issuer Intesa Sanpaolo S.p.A.
2 Unique identifier XS1346815787
3 Governing law(s) of the instrument English law, except subordination clauses
REGULATORY TREATMENT
4 Transitional CRR rules Additional Tier 1 Capital
5 Post-transitional CRR rules Additional Tier 1 Capital
6 Eligible at: solo; consolidated; solo & consolidated Solo & consolidated
7 Instrument type Debt security - Art. 52 CRR
8 Amount recognised in regulatory capital (€/mln) 1,250
Nominal amount of instrument: original amount in currency of issuance (mln) 1,250
Nominal amount of instrument: original amount - currency of issuance EUR
Nominal amount of instruments: conversion of original amount into euro (€/mln) 1,250
9a Issue price 100
9b Redemption price 100
10 Accounting classification Shareholders' equity
11 Original date of issuance 19/01/2016
12 Perpetual or dated Irredeemable
13 Original maturity date Without maturity date
14 Issuer call subject to prior supervisory approval Yes
Optional call date 19/01/2021 (and on every interest payment date thereafter)
Contingent call dates and redemption amount Regulatory and Tax Event
16 Subsequent call dates, if applicable Call date exercisable on every interest payment date after 19/01/2021
COUPONS / DIVIDENDS
17 Fixed or floating dividend/coupon Fixed
18 Coupon rate and any related index 7% per annum, payable semi-annually (up to the first call date)
19 Existence of a dividend stopper No
Fully discretionary, partially discretionary or mandatory (in terms of timing) Fully discretionary
Fully discretionary, partially discretionary or mandatory (in terms of timing) - reasons for discretion Fully discretionary. Moreover, the Regulator can prevent payment of interest at any time.
20b Fully discretionary, partially discretionary or mandatory (in terms of amount) Fully discretionary
21 Existence of step up or other incentive to redeem No
22 Noncomulative or comulative Noncumulative
23 Convertible or non-convertible Non-convertible
24 If convertible, conversion trigger(s) N/A
25 If convertible, fully or partially N/A
26 If convertible, conversion rate N/A
27 If convertible, mandatory or optional conversion N/A
28 If convertible, specify instrument type convertible into N/A
29 If convertible, specify issuer of instrument it converts into N/A
30 Write-down features Yes
31 If write-down, write-down trigger(s)Write-down of the nominal capital if the CET1 of Iintesa Sanpaolo or of the Intesa Sanpaolo
Group falls below 5.125 pct.32 If write-down, full or partial Full or partial
33 If write-down, permanent or temporary Temporary
34 If temporary write-down, description of write-up mechanismIn case the CET1 of ISP or of the Group is re-established above 5.125 pct, the issuer can decide
to write-up the Nominal Capital within the limits of the Maximum Distributable Amount.
35 Position in subordination hierarchy in liquidationSenior compared to Equity and subordinated compared to the instruments having lower
subordination level (i.e. T2)36 Non-compliant transitioned features No
37 If yes, specify non-compliant features N/A
N/A = Not applicable
9
15
20a
54

Attachment 2
Own funds: Transitional own funds disclosure template
55


Basel 3 Pillar 3 – Attachment 2 - Own funds: Transitional own funds disclosure template
(millions of euro)Amount at
disclosure dateAmounts subject
to pre-Regulation (EU) No 575/2013
treatment or prescribed residual
amount of Regulation (EU)
No 575.2013
1 Capital instruments and the related share premium accounts 35,596
of which: Ordinary shares 35,596
2 Retained earnings 9,524
3Accumulated other comprehensive income (and other reserves, to include unrealised gains and losses under theapplicable accounting standards) -1,860
3a Funds for general banking risk -
4Amount of qualifying items referred to in Article 484 (3) and the related share premium accounts subject to phase-outfrom CET1 capital -
Public sector capital injections grandfathered until 1 January 2018 -
5 Minority interests (amount allowed in consolidated CET1) 114 46
5a Independently reviewed interim profits net of any foreseeable charge or dividend -
6 Common Equity Tier 1 (CET1) capital before regulatory adjustments 43,374
7 Additional value adjustments (negative amount) -182
8 Intangible assets (net of related tax liability) (negative amount) -6,871
9 Transitional adjustment related to IAS 19 464
10 Deferred tax assets that rely on future profitability excluding those arising from temporary differences (net of related taxliability where the conditions in Article 38 (3) are met) (negative amount) -111 -185
11 Fair value reserves related to gains or losses on cash flow hedges 1,362
12 Negative amounts resulting from the calculation of expected loss amounts -127 -212
13 Any increase in equity that results from securitised assets (negative amount) -
14 Gains or losses on liabilities valued at fair value resulting from changes in own credit standing 110
15 Defined-benefit pension fund assets (negative amount) -
16 Direct and indirect holdings by the institution of own CET1 instruments (negative amount) -62
17 Holdings of the CET1 instruments of financial sector entities where those entities have reciprocal cross holdings with theinstitution designed to inflate artificially the own funds of the institution (negative amount) -
18 Direct and indirect holdings by the institution of the CET1 instruments of financial sector entities where the institutiondoes not have a significant investment in those entities (amount above the 10% threshold and net of eligible shortpositions) (negative amount)
-
19 Direct, indirect and synthetic holdings by the institution of the CET1 instruments of financial sector entities where theinstitution has a significant investment in those entities (amount above the 10% threshold and net of eligible shortpositions) (negative amount)
-1,100
20 [not relevant in EU regulation] -
20a Exposure amount of the following items which qualify for a risk weighting of 1250%, where the institution opts for thededuction alternative -
20b of which: qualifying holdings outside the financial sector (negative amount) -
20c of which: securitisation positions (negative amount) -
20d of which: free deliveries (negative amount) -
21 Deferred tax assets arising from temporary differences (amount above the 10% threshold, net of related tax liabilitywhere the conditions in Article 38 (3) are met) (negative amount) -
Common Equity Tier 1 (CET1) capital: instruments and reserves
Common Equity Tier 1 (CET1) capital: regulatory adjustments
57

Basel 3 Pillar 3 – Attachment 2 - Own funds: Transitional own funds disclosure template
(millions of euro)Amount at
disclosure dateAmounts subject
to pre-Regulation (EU) No 575/2013
treatment or prescribed residual
amount of Regulation (EU)
No 575.2013
22 Amount exceeding the 15% threshold (negative amount) -
23 of which: direct and indirect holdings by the institution of the CET1 instruments of financial sector entities where the institution has a significant investment in those entities
-
24 Deferred tax assets -
25 of which: deferred tax assets arising from temporary differences -
25a Losses for the current financial year (negative amount) -
25b Foreseeable tax charges relating to CET1 items (negative amount) -
26Regulatory adjustments applied to CET1 in respect of amounts subject to pre-CRR treatment
-311
26a Regulatory adjustments relating to unrealised gains and losses pursuant to Articles 467 and 468 -219
of which: Unrealised gains on debt securities issued by European Union central governments 102
of which: Unrealised gains on debt securities of issuers other than European Union central governments -190
of which: Unrealised gains on equities and quotas of UCI -131
26b Amount to be deducted from or added to CET1 capital with regard to additional filters and deductions required pre-CRR -
of which deduction of deferred tax assets that rely on future profitability and do not arise from temporary differences (Articles 469(1)(a), 36(1)(c) and 478(1) of the CRR)
-
of which deduction of negative amounts resulting from the calculation of expected loss amounts in accordance with Articles 158 and 159 of the CRR (Articles 469(1)(a), 36(1)(d) and 478(1) of the CRR)
-
of which deduction of the applicable amount of direct, indirect and synthetic holdings by the institution of CET1 instruments of financial sector entities where the institution has a significant investment in those entities and deferred tax assets that rely on future profitability and arise from temporary differences (Articles 469(1)(c), 36(1)(c) and (i) and 478(1) and (2) of the CRR)
-
of which impacts arising from deductible under transitional adjustments -
27 Qualifying AT1 deductions that exceed the AT1 capital of the institution (negative amount) -
28 Total regulatory adjustments to Common Equity Tier 1 (CET1) capital (7,047)
29 Common Equity Tier 1 (CET1) capital 36,327
58

Basel 3 Pillar 3 – Attachment 2 - Own funds: Transitional own funds disclosure template
(millions of euro)Amount at
disclosure dateAmounts subject
to pre-Regulation (EU) No 575/2013
treatment or prescribed residual
amount of Regulation (EU)
No 575.2013
30 Capital instruments and the related share premium accounts 2,605
31 of which: classified as equity under applicable accounting standards -
32 of which: classified as liabilities under applicable accounting standards -
33 Amount of qualifying items referred to in Article 484 (4) and the related share premium accounts subject to phase-outfrom AT1 1,230
Public sector capital injections grandfathered until 1 January 2018 -
34 Qualifying Tier 1 capital included in consolidated AT1 capital (including minority interests not included in row 5) issued bysubsidiaries and held by third parties 7
35 of which: instruments issued by subsidiaries subject to phase-out -
36 Additional Tier 1 (AT1) capital before regulatory adjustments 3,842
37 Direct and indirect holdings by an institution of own AT1 instruments (negative amount) -
38 Holdings of the AT1 instruments of financial sector entities where those entities have reciprocal cross holdings with theinstitution designed to inflate artificially the own funds of the institution (negative amount) -
39 Direct and indirect holdings of the AT1 instruments of financial sector entities where the institution does not have asignificant investment in those entities (amount above the 10% threshold and net of eligible short positions) (negativeamount)
-
40 Direct and indirect holdings by the institution of the AT1 instruments of financial sector entities where the institution hasa significant investment in those entities (amount above the 10% threshold and net of eligible short positions) (negativeamount)
-
41 Regulatory adjustments applied to Additional Tier 1 capital in respect of amounts subject to pre-CRR treatment andtransitional treatments subject to phase-out as prescribed in Regulation (EU) No 575/2013 (i.e. CRR residual amounts) -
41a Residual amounts deducted from Additional Tier 1 capital with regard to deduction from CET1 capital during thetransitional period pursuant to Article 472 of Regulation (EU) No 575/2013
(42)
of which residual amount by which expected losses exceed adjustments for IRB positions (42)
41b Residual amounts deducted from Additional Tier 1 capital with regard to deduction from Tier 2 capital during thetransitional period pursuant to Article 475 of Regulation (EU) No 575/2013
(367)
of which deduction of the applicable amount of direct, indirect and synthetic holdings by the institution of CET1 instruments of financial sector entities where the institution has a significant investment in those entities and deferred tax assets that rely on future profitability and arise from temporary differences (Articles 469(1)(c), 36(1)(c) and (i) and 478(1) and (2) of the CRR)
(376)
of which impacts arising from deductible under transitional adjustments 9
41c Amount to be deducted from or added to Additional Tier 1 capital with regard to additional filters and deductionsrequired pre-CRR
-
of which: possible filter for unrealised losses -
of which: possible filter for unrealised gains -
of which: other filter -
42 Qualifying T2 deductions that exceed the T2 capital of the institution (negative amount) -
43 Total regulatory adjustments to Additional Tier 1 (AT1) capital (409)
44 Additional Tier 1 (AT1) capital 3,433
45 Tier 1 capital (T1 = CET1 + AT1) 39,760
Additional Tier 1 (AT1) capital: regulatory adjustments
Additional Tier 1 (AT1) capital: instruments
59

Basel 3 Pillar 3 – Attachment 2 - Own funds: Transitional own funds disclosure template
(millions of euro)Amount at
disclosure dateAmounts subject
to pre-Regulation (EU) No 575/2013
treatment or prescribed residual
amount of Regulation (EU)
No 575.2013
46 Capital instruments and the related share premium accounts 8,814
47 Amount of qualifying items referred to in Article 484 (5) and the related share premium accounts subject to phase-out from T2
518
Public sector capital injections grandfathered until 1 January 2018 -
48 Qualifying own funds instruments included in consolidated T2 capital (including minority interests and AT1 instruments not included in rows 5 or 34) issued by subsidiaries and held by third parties
5
49 of which: instruments issued by subsidiaries subject to phase-out -
50 Credit risk adjustments -
51 Tier 2 (T2) capital before regulatory adjustments 9,337
52 Direct and indirect holdings by an institution of own T2 instruments and subordinated loans (negative amount)(132)
53 Holdings of the T2 instruments and subordinated loans of financial sector entities where those entities have reciprocalcross holdings with the institution designed to inflate artificially the own funds of the institution (negative amount) -
54 Direct and indirect holdings by the institution of the T2 instruments and subordinated loans of financial sector entitieswhere the institution does not have a significant investment in those entities (amount above the 10% threshold and netof eligible short positions) (negative amount)
-
54a of which new holdings not subject to transitional arrangements - 54b of which holdings existing before 1 January 2013 and subject to transitional arrangements -
55 Direct and indirect holdings by the institution of the T2 instruments and subordinated loans of financial sector entitieswhere the institution has a significant investment in those entities (net of eligible short positions) (negative amount) (152)
56 Regulatory adjustments applied to T2 capital in respect of amounts subject to pre-CRR treatment and transitionaltreatments subject to phase-out as prescribed in Regulation (EU) No 575/2013 (i.e. CRR residual amounts) -
56a Residual amounts deducted from T2 capital with regard to deduction from Common Equity Tier 1 capital during thetransitional period pursuant to Article 472 of Regulation (EU) No 575/2013
(42)
of which residual amount by which expected losses exceed adjustments for IRB positions (42)
56b Residual amounts deducted from T2 capital with regard to deduction from AT1 capital during the transitional periodpursuant to Article 475 of Regulation (EU) No 575/2013
(367)
of which deduction of the applicable amount of direct, indirect and synthetic holdings by the institution of CET1 instruments of financial sector entities where the institution has a significant investment in those entities and deferred tax assets that rely on future profitability and arise from temporary differences (Articles 469(1)(c), 36(1)(c) and (i) and 478(1) and (2) of the CRR)
(376)
of which impacts arising from deductible under transitional arrangements 9
56c Amount to be deducted from or added to T2 capital with regard to additional filters and deductions required pre-CRR160
of which: possible filter for unrealised losses - of which: unrealised gains on AFS securities subject to additional national filter 160
of which: other filter -
57 Total regulatory adjustments to Tier 2 (T2) capital (533)
58 Tier 2 (T2) capital 8,804
59 Total capital (TC = T1 + T2) 48,564
59a Risk weighted assets in respect of amounts subject to pre-CRR treatment and transitional treatments subject to phase-outas prescribed in Regulation (EU) No 575/2013 (i.e. CRR residual amounts)
-
of which: items not deducted from CET1 (Regulation (EU) No 575/2013 residual amounts) (items to be detailed line by line, e.g. deferred tax assets that rely on future profitability, net of the related tax liabilities, indirect holdings of own CET1 instruments, etc.)
-
of which: items not deducted from AT1 items (Regulation (EU) No 575/2013 residual amounts) (items to be deducted line by line, e.g. reciprocal cross holdings in Tier 2 instruments, direct holdings of non-significant investments in the capital of other financial sector entities, etc.)
-
Items not deducted from T2 items (Regulation (EU) No 575/2013 residual amounts) (items to be detailed line by line, e.g.indirect holdings of own T2 instruments, indirect holdings of non-significant investments in the capital of other financialsector entities, indirect holdings of significant investments in the capital of other financial sector entities, etc.)
-
60 Total risk weighted assets 286,686
Tier 2 (T2) capital: instruments and provisions
Tier 2 (T2) capital: regulatory adjustments
60

Basel 3 Pillar 3 – Attachment 2 - Own funds: Transitional own funds disclosure template
(millions of euro)Amount at
disclosure dateAmounts subject
to pre-Regulation (EU) No 575/2013
treatment or prescribed residual
amount of Regulation (EU)
No 575.2013
61 Common Equity Tier 1 capital (as a percentage of risk exposure amount) 12.7%
62 Tier 1 capital (as a percentage of risk exposure amount) 13.9%
63 Total capital (as a percentage of risk exposure amount) 16.9%
64 Institution specific buffer requirement (CET1 requirement in accordance with Article 92 (1) (a), plus capital conservation and countercyclical buffer requirements, plus systemic risk buffer, plus the systemically important institution buffer (G-SII or O-SII buffer), expressed as a percentage of risk exposure amount)
7.001%
65 of which: capital conservation buffer requirement 2.5%
66 of which: countercyclical buffer requirement 0.001%
67 of which: systemic risk buffer requirement -
67a of which: Global Systemically Important Institution (G-SII) or Other Systemically Important Institution (O-SII) buffer -
68 Common Equity Tier 1 capital available to meet buffers (as a percentage of total risk exposure amount) 5.4%
69 [not relevant in EU regulation]
70 [not relevant in EU regulation]
71 [not relevant in EU regulation]
72 Direct and indirect holdings of the capital of financial sector entities where the institution does not have a significant investment in those entities (amount below the 10% threshold and net of eligible short positions)
1,887
73 Direct and indirect holdings by the institution of the CET1 instruments of financial sector entities where the institution has a significant investment in those entities (amount below the 10% threshold and net of eligible short positions)
3,743
74 [not relevant in EU regulation] -
75 Deferred tax assets arising from temporary differences (amount below the 10% threshold, net of related tax liability where the conditions in Article 38 (3) are met)
1,211
76 Credit risk adjustments included in T2 in respect of exposures subject to standardised approach (prior to the application of the cap) -
77 Cap on inclusion of credit risk adjustments in T2 under standardised approach -
78 Credit risk adjustments included in T2 in respect of exposures subject to internal ratings-based approach (prior to the application of the cap)
-
79 Cap on inclusion of credit risk adjustments in T2 under internal ratings-based approach 752
80 Current cap on CET1 instruments subject to phase-out arrangements -
81 Amount excluded from CET1 due to cap (excess over cap after redemptions and maturities) -
82 Current cap on AT1 instruments subject to phase-out arrangements 1,230
83 Amount excluded from AT1 due to cap (excess over cap after redemptions and maturities) 318
84 Current cap on T2 instruments subject to phase-out arrangements 2,836
85 Amount excluded from T2 due to cap (excess over cap after redemptions and maturities) -
Capital instruments subject to phase-out arrangements (only applicable between 1 January 2013 and 1 January 2022)
Capital ratios and buffers
Capital ratios and buffers
Applicable caps on the inclusion of provisions in T2
61


Contacts
63

Basel 3 – Pillar 3 – Contacts
Intesa Sanpaolo S.p.A. Registered office Piazza San Carlo, 156 10121 Torino Telephone: +39 011 555 1 Secondary registered office Via Monte di Pietà, 8 20121 Milano Telephone: +39 02 879 11 Investor Relations & Price-Sensitive Communication Telephone: +39 02 8794 3180 Fax: +39 02 8794 3123 E-mail [email protected] Media Relations Telephone: +39 02 8796 3845 Fax: +39 02 8796 2098 E-mail [email protected] Internet: group.intesasanpaolo.com
65


Prepress and printing: Agema® S.p.A.
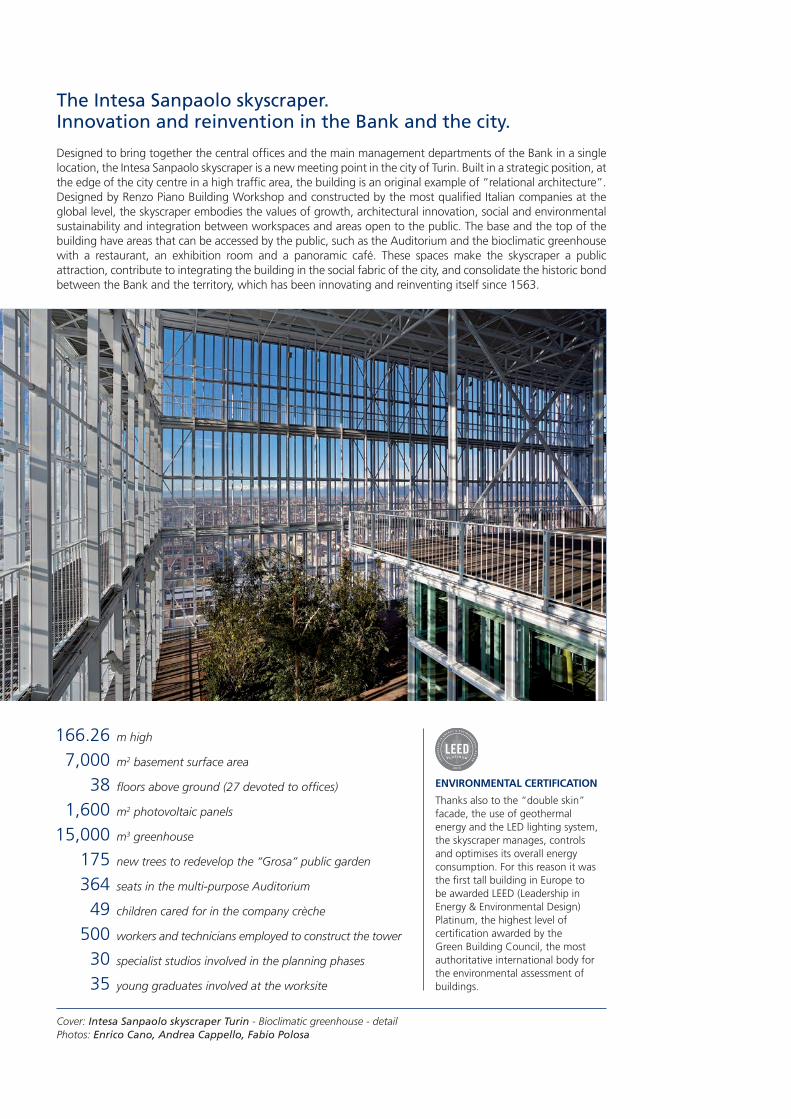
The Intesa Sanpaolo skyscraper.Innovation and reinvention in the Bank and the city.
Designed to bring together the central offices and the main management departments of the Bank in a single location, the Intesa Sanpaolo skyscraper is a new meeting point in the city of Turin. Built in a strategic position, at the edge of the city centre in a high traffic area, the building is an original example of “relational architecture”. Designed by Renzo Piano Building Workshop and constructed by the most qualified Italian companies at the global level, the skyscraper embodies the values of growth, architectural innovation, social and environmental sustainability and integration between workspaces and areas open to the public. The base and the top of the building have areas that can be accessed by the public, such as the Auditorium and the bioclimatic greenhouse with a restaurant, an exhibition room and a panoramic café. These spaces make the skyscraper a public attraction, contribute to integrating the building in the social fabric of the city, and consolidate the historic bond between the Bank and the territory, which has been innovating and reinventing itself since 1563.
m high
m2 basement surface area
floors above ground (27 devoted to offices)
m2 photovoltaic panels
m3 greenhouse
new trees to redevelop the “Grosa” public garden
seats in the multi-purpose Auditorium
children cared for in the company crèche
workers and technicians employed to construct the tower
specialist studios involved in the planning phases
young graduates involved at the worksite
166.267,000
381,600
15,000175364
49500
3035
ENVIRONMENTAL CERTIFICATION
Thanks also to the “double skin” facade, the use of geothermal energy and the LED lighting system, the skyscraper manages, controls and optimises its overall energy consumption. For this reason it was the first tall building in Europe to be awarded LEED (Leadership in Energy & Environmental Design) Platinum, the highest level of certification awarded by the Green Building Council, the most authoritative international body for the environmental assessment of buildings.
Cover: Intesa Sanpaolo skyscraper Turin - Bioclimatic greenhouse - detailPhotos: Enrico Cano, Andrea Cappello, Fabio Polosa