TIME FOR VALUE - Intesa Sanpaolo
230
TIME FOR VALUE 2009 Banca Fideuram Annual Report Ban B k of Group
Transcript of TIME FOR VALUE - Intesa Sanpaolo

TIME FOR VALUE
2009 Banca Fideuram
Annual Report
BanB k of Group

I I
M
iss
ion
To help our customers mmanage
heir assets wisely, bbaased on a
etailed analyysisiss of their real neeededs
nd risk profile.
To offer financial and insurancnce
dvisory services s with the supportrt
f expert professionalalss, acting
with total transparency annd
ompplete respect for the ruleses
That is Bancca a Fideuram’s MMisi sion.

Banca Fideuram at a glance 5
Directors’ Report 15
Social Responsibility and sustainable development 43
Report on Corporate Governance 83
Consolidated financial statements 91
Certification of the consolidated financial statements 199
Independent Auditors’ Report 203
Schedules 207
Glossary 213
I
I C
on
ten
ts
4,292
Per
sona
l Fin
anci
al A
dvi
sers
Ana
lysi
s o
f C
lient
Ass
ets
%
67,801 €m
2006 2007 2008 2009
15%DiscretionaryAccounts
20%Insurance andPension Funds
31%Securitiesand Currentaccounts
34%Mutual Funds
31.12.2009
2005

H i g h l i g h t s I
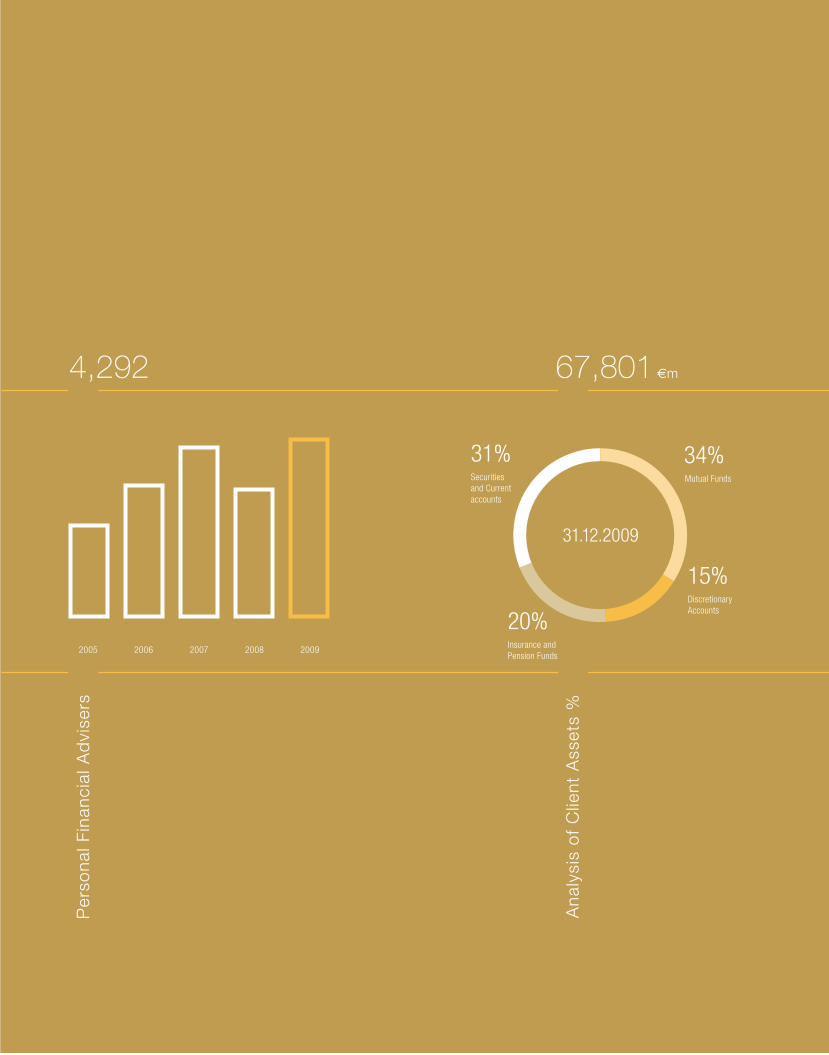
67,801 €m
Clie
nt A
sset
s
2,804 €m
Net
inflo
ws
178.4 €m
Co
nso
lidat
ed n
et p
rofit
190.8
224.4
255.5
176.1
178.4
64,312
67,59168,574
60,507
67,801
1,222
1,8181,617
345
2,804
2005 2005 20052006 2006 20062007 2007 20072008 2008 20082009 2009 2009
Client Assets Net commission income
Personal Financial Advisers
67,801 €m
4,292
441.5 €m
Net infl ows
2,804€m

H i g h l i g h t s I
Shareholders’ equity
764.3 €m
Net profi t
178.4 €m
ROE
27.9 %
Cost/Income Ratio
53.7%

BANCA FIDEURAMAT A GLANCE
6 Annua l Repor t 2009
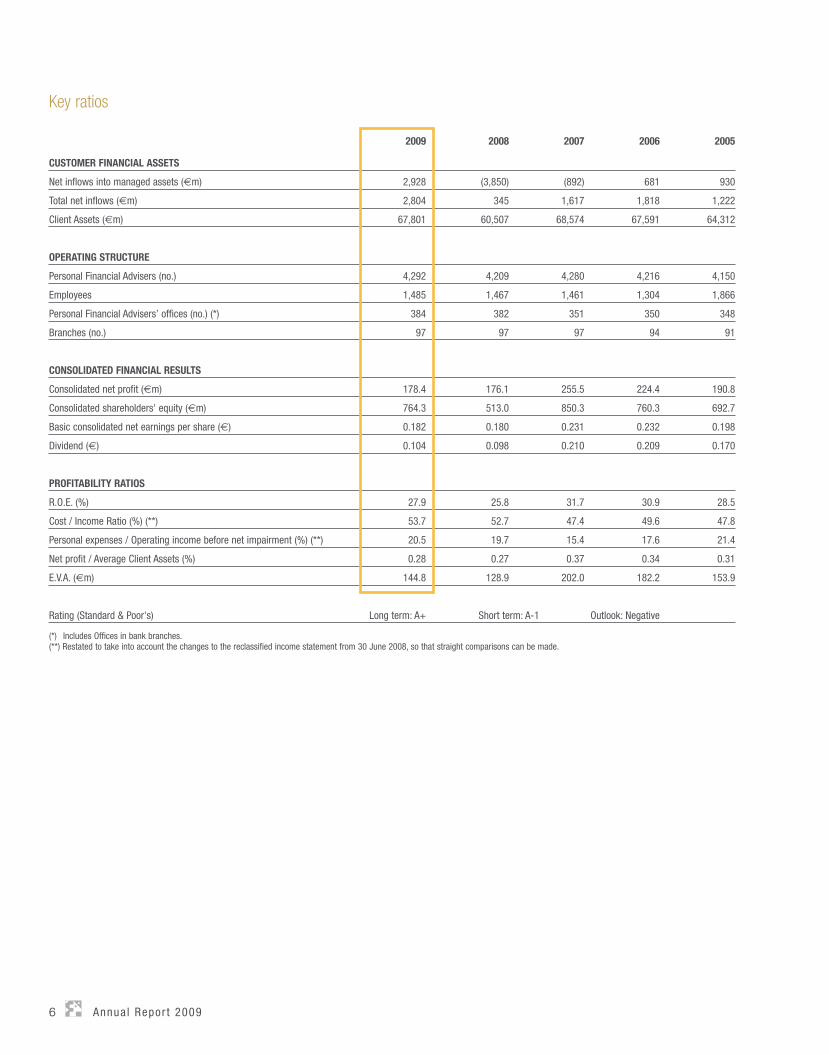
Key ratios
2009 2008 2007 2006 2005
CUSTOMER FINANCIAL ASSETS
Net inflows into managed assets (€m) 2,928 (3,850) (892) 681 930
Total net inflows (€m) 2,804 345 1,617 1,818 1,222
Client Assets (€m) 67,801 60,507 68,574 67,591 64,312
OPERATING STRUCTURE
Personal Financial Advisers (no.) 4,292 4,209 4,280 4,216 4,150
Employees 1,485 1,467 1,461 1,304 1,866
Personal Financial Advisers’ offices (no.) (*) 384 382 351 350 348
Branches (no.) 97 97 97 94 91
CONSOLIDATED FINANCIAL RESULTS
Consolidated net profit (€m) 178.4 176.1 255.5 224.4 190.8
Consolidated shareholders' equity (€m) 764.3 513.0 850.3 760.3 692.7
Basic consolidated net earnings per share (€) 0.182 0.180 0.231 0.232 0.198
Dividend (€) 0.104 0.098 0.210 0.209 0.170
PROFITABILITY RATIOS
R.O.E. (%) 27.9 25.8 31.7 30.9 28.5
Cost / Income Ratio (%) (**) 53.7 52.7 47.4 49.6 47.8
Personal expenses / Operating income before net impairment (%) (**) 20.5 19.7 15.4 17.6 21.4
Net profit / Average Client Assets (%) 0.28 0.27 0.37 0.34 0.31
E.V.A. (€m) 144.8 128.9 202.0 182.2 153.9
Rating (Standard & Poor's) Long term: A+ Short term: A-1 Outlook: Negative
(*) Includes Offices in bank branches.(**) Restated to take into account the changes to the reclassified income statement from 30 June 2008, so that straight comparisons can be made.
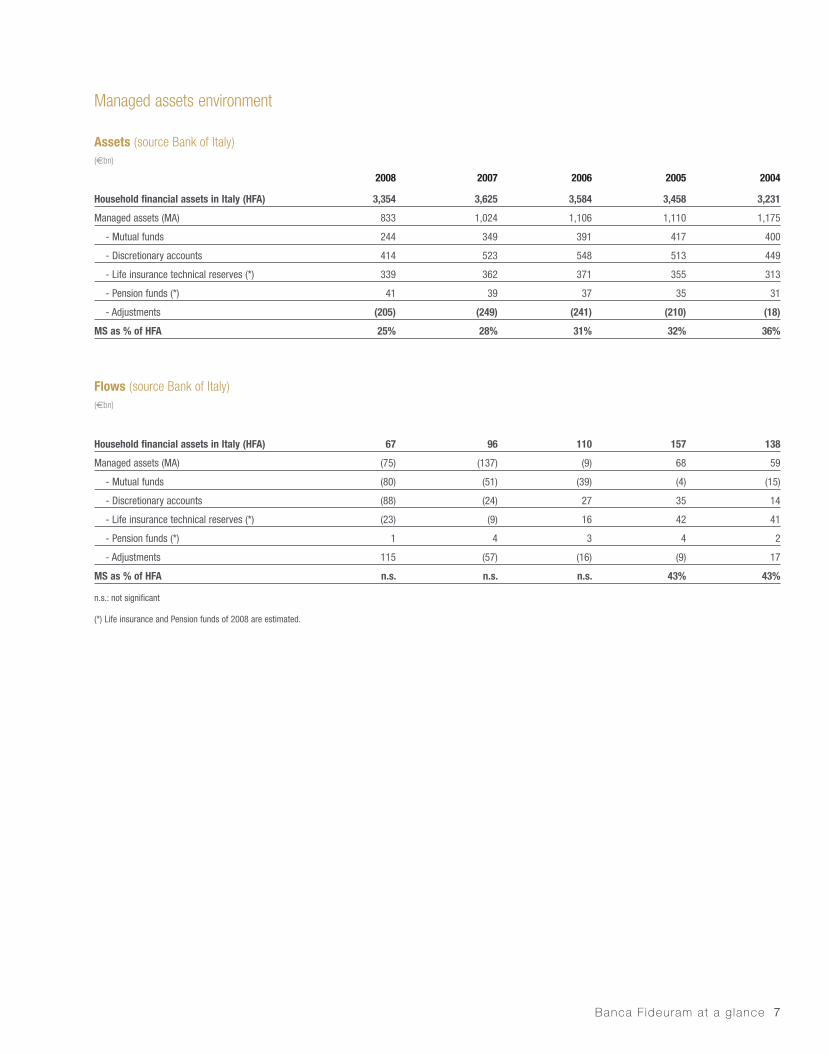
Managed assets environment
Assets (source Bank of Italy)(€bn)
2008 2007 2006 2005 2004
Household financial assets in Italy (HFA) 3,354 3,625 3,584 3,458 3,231
Managed assets (MA) 833 1,024 1,106 1,110 1,175
- Mutual funds 244 349 391 417 400
- Discretionary accounts 414 523 548 513 449
- Life insurance technical reserves (*) 339 362 371 355 313
- Pension funds (*) 41 39 37 35 31
- Adjustments (205) (249) (241) (210) (18)
MS as % of HFA 25% 28% 31% 32% 36%
Flows (source Bank of Italy)(€bn)
Household financial assets in Italy (HFA) 67 96 110 157 138
Managed assets (MA) (75) (137) (9) 68 59
- Mutual funds (80) (51) (39) (4) (15)
- Discretionary accounts (88) (24) 27 35 14
- Life insurance technical reserves (*) (23) (9) 16 42 41
- Pension funds (*) 1 4 3 4 2
- Adjustments 115 (57) (16) (9) 17
MS as % of HFA n.s. n.s. n.s. 43% 43%
n.s.: not significant
(*) Life insurance and Pension funds of 2008 are estimated.
Banca F ideuram at a g lance 7
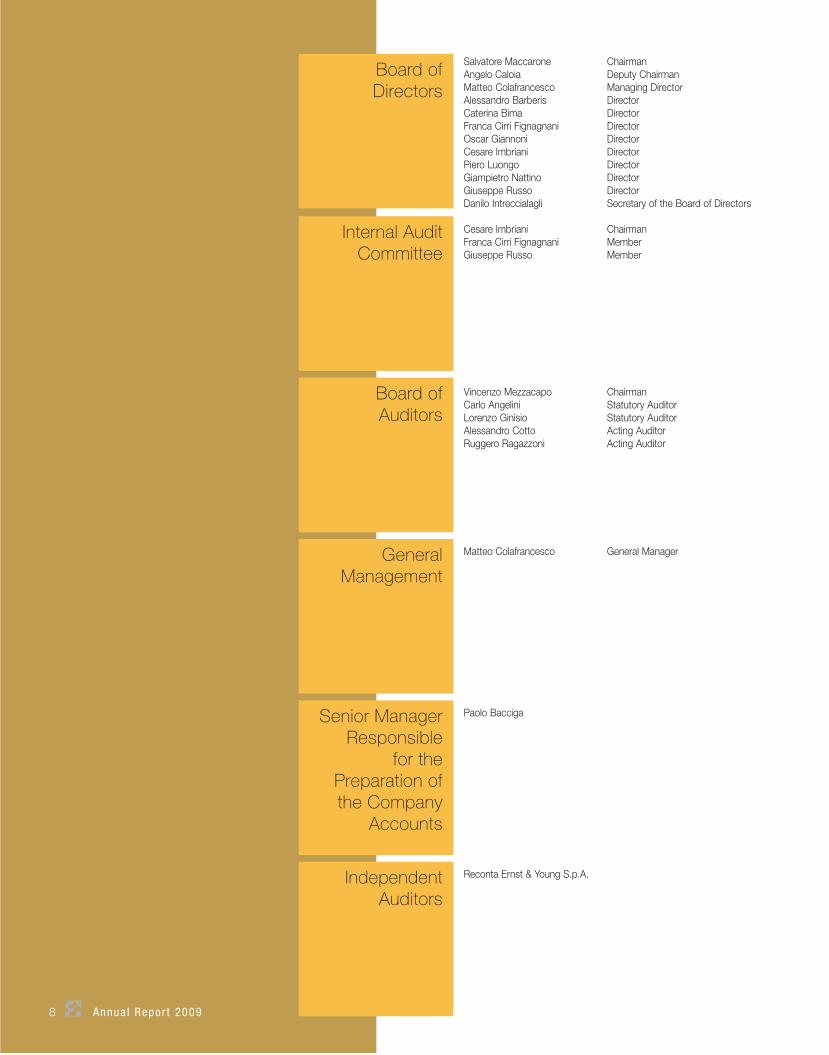
8 Annua l Repor t 2009
Salvatore Maccarone ChairmanAngelo Caloia Deputy Chairman Matteo Colafrancesco Managing DirectorAlessandro Barberis DirectorCaterina Bima DirectorFranca Cirri Fignagnani DirectorOscar Giannoni DirectorCesare Imbriani DirectorPiero Luongo DirectorGiampietro Nattino Director Giuseppe Russo Director Danilo Intreccialagli Secretary of the Board of Directors
Board of Directors
Vincenzo Mezzacapo ChairmanCarlo Angelini Statutory AuditorLorenzo Ginisio Statutory AuditorAlessandro Cotto Acting AuditorRuggero Ragazzoni Acting Auditor
Board of Auditors
Cesare Imbriani ChairmanFranca Cirri Fignagnani MemberGiuseppe Russo Member
Internal Audit Committee
Matteo Colafrancesco General ManagerGeneral Management
Paolo Bacciga Senior Manager Responsible
for the Preparation of the Company
Accounts
Reconta Ernst & Young S.p.A.Independent Auditors
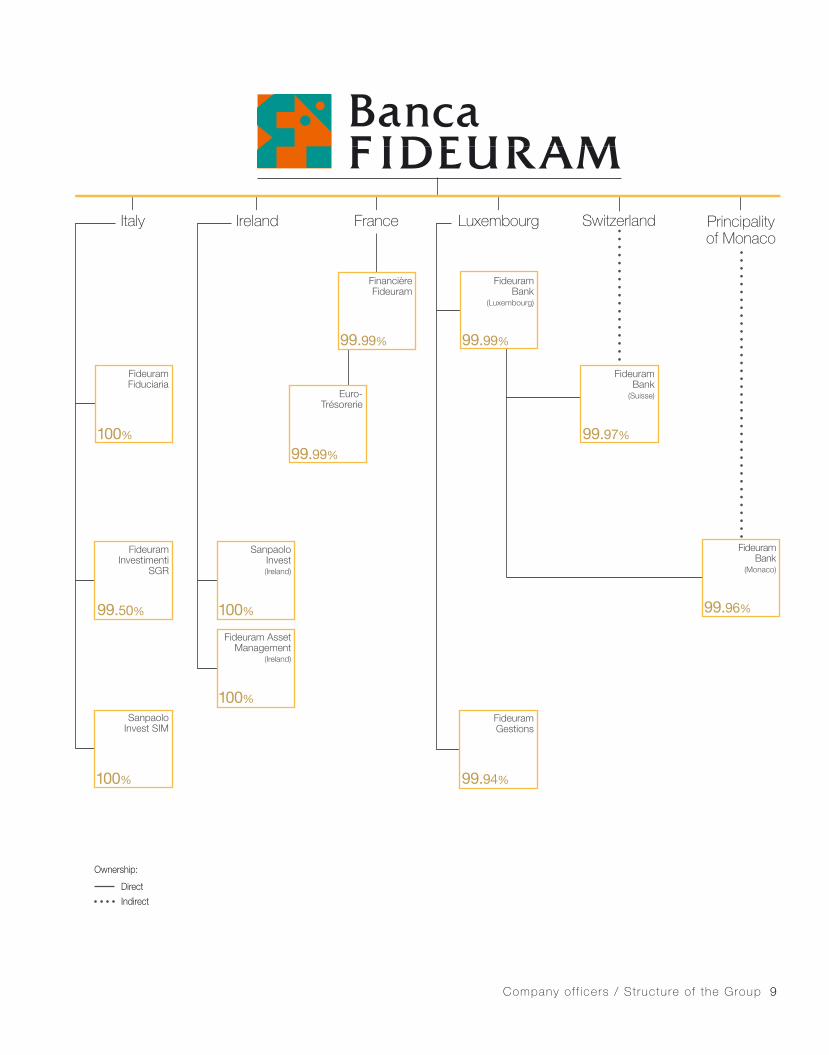
Indirect
Direct
99.96%
Fideuram Bank
(Monaco)
100%
FideuramFiduciaria
99.99%
Euro-Trésorerie
99.50%
FideuramInvestimenti
SGR
100%
SanpaoloInvest SIM
100%
Fideuram AssetManagement
(Ireland)
100%
SanpaoloInvest (Ireland)
99.99%
Fideuram Bank
(Luxembourg)
99.97%
Fideuram Bank
(Suisse)
99.94%
FideuramGestions
Italy Principalityof Monaco
Ireland SwitzerlandLuxembourgFrance
99.99%
FinancièreFideuram
Company of f icers / St ructure of the Group 9
Ownership:

TIME FOR VALUEA year ago the question was if and when we would emerge from one of the most complex crises ever to have struck first the financial world and then the real economy.
Many economic pundits were forecasting scenarios of deep recession from which the world economies would only emerge after a long period of time, weakened considerably.
Our vision was rightly cautious, but we were at the same time convinced that no crisis, however severe, could have led to the deterioration of the financial system and world economies. During a time of crisis and uncertainty, the importance of our role was greater than ever - which is to maintain our customers’ savings, often the fruit of years of sacrifice and careful management of their assets.
Today we can say that the “storm” has abated. Consumer confidence is rising and the growth forecasts for many countries are starting to enter positive territory, although the situation has still not stabilised completely and employment and production are under strong pressure.
What we have doneWe have continued doing what we’ve always believed in, looking after our customers with close personal
service, listening to their needs, understanding their requirements and advising them in their choices.
We have helped them overcome the fear and emotional responses that unexpected situations such as extraordinarily negative market trends can naturally cause, guiding them to make rational decisions thanks to our professional expertise. Customer relationships based on trust earned over time were once again a decisive factor.
We strengthened and extended every area of our operations still further:
• In managed assets, we launched innovative products such as “formula funds”, strengthened our asset management company’s management team and sought out external partnerships offering special expertise.
• In non managed assets, we provided placements of short and medium-term bonds to cover customers’ liquidity requirements.
• In lending we launched our first dedicated products.
Thanks to our organisational capabilities and speed of response we were able to exploit the opportunities that arose to the full. These included the “tax shield” (scudo fiscale) legislation, where we achieved exceptional results placing us amongst the top players in the market.
We dedicated all the time our customers needed, because we value time
What we have doWe have continued doing what we’ve
service, listening to their needs, un
We have helped them overcome extraordinarily negative market tthanks to our professional expeonce again a decisive factor.
We strengthened an
• In managed assetsstrengthened our aexternal partnershi
• In non managed cover customers
• In lending we la
Thanks to ouexploit the o(scudo fiscaamongst the
We dour cbeca

Our results exceeded all expectations:• Banca Fideuram and Sanpaolo Invest achieved net inflows totalling €2.8bn.
• Client Assets increased to €67.8bn, returning to the levels at year-end 2007.
• Managed assets, our core business, accounted for almost 70% of total client assets.
• Net profit returned to growth at €178.4m, testifying to the strength of our model in even the most challenging market conditions.
• Return On Equity was 27.9% and our Consolidated Core Tier 1 Ratio was 13.1%, showing the solidity of our company.
These results were achieved thanks to the dedication of all our people - our Personal Financial Advisers, management team and staff - each of whom played their part in a team game where the winning factor is an unstinting commitment to providing our customers with the very best service.
Investing in growth and innovationMay and June in particular saw us launching our new SEI Advanced Advisory contract, a project to which we have committed the finest resources available in our Network and Headquarters, with an unprecedented investment that is already starting to pay off.
By the end of the year, almost 9,000 Banca Fideuram and Sanpaolo Invest customers had subscribed to SEI, with over €3.5bn client assets.
SEI enables us to offer customised investment solutions that are appropriate for every need and to monitor them over time.
We are once again forerunners and innovators in the Italian managed assets market, as we have always been for over 40 years. Something of which we and our customers are rightly proud.
Last year also saw us open prestigious branches dedicated to our Private Banking customers in Turin and Milan, served by professionals able to provide our Personal Financial Advisers with quality support for the advisory they provide.
We likewise developed our range of products and services with dedicated products offering greater customisation potential to every single customer.
Our Headquarters and Personal Financial Advisers benefited from the creation of a dedicated Private Banking Service Line that supports our Networks by developing ad hoc solutions, customised proposals and ancillary services especially for our Private Banking customers.
Private Banking achieved the highest segment growth, with significant increases both in the number of customers (+3,960 customers on 2008, equating to +23.2%) and in Client Assets (+€5.5bn on 2008 with total CA of €28.8bn).
Towards new horizonsThe stock market is our rightful place as leaders in the Italian managed assets market, the fourth largest private bank in Italy and the sixth largest banking group for indirect inflows.
We are undisputed leaders in our sector with a market share of over 30%.
The secret to over 40 years’ success lies in our determination, dedication and, above all, the passion which drives us every day. And it is indeed this which informs my firm conviction that we will achieve the ambitious goals we have set ourselves.
“Time for value”: we dedicate the time needed to create value for our customers and shareholders alike.
We continued investing throughout 2009
We are ready for the challenges that the future holds in store
Matteo Colafrancesco
Managing Di rector ’s Statement 11

Directors’ Report
■ Reclassified consolidated financial statements 16 Reclassified Consolidated Balance Sheet Reclassified Consolidated Income Statement
■ Main results and strategies 18 The economic scenario Overview of consolidated results Group competitive position
■ Operating results 21 Assets and inflows
■ Financial results 23 Analysis of the income statement Asset and liability management Shareholders’ equity Segment Reporting Operations outside Italy
■ Human Resources, products and services 35 Human Resources Products and research and development activities System and information management
■ Supplementary information 38 Internal auditing Model of Financial Management Governance Subsequent events and outlook
C o n t e n t sSocial Responsibility and sustainable development■ Reporting principles 44■ Group profile 45■ Social report 46 Customers Personal Financial Advisers Human resources Suppliers The community The environment The financial system and other institutions Other events
■ Distribution of Value 80
Report on Corporate Governance 84
Consolidated financial statements ■ Consolidated balance sheet 92■ Consolidated income statement 94■ Consolidated statement of comprehensive income 95■ Statement of changes in consolidated shareholders’ equity 96■ Statement of consolidated cash flow 98■ Notes to the consolidated financial statements 99
Certification of the consolidated financial statements in accordance with article 154-bis of Legislative Decree No. 58 of 24 febuary 1998 201
Independent Auditors’ Report 204
Schedules ■ Reconciliations 208
Glossary 214


DIRECTORS’ REPORT
16 Annua l Repor t 2009
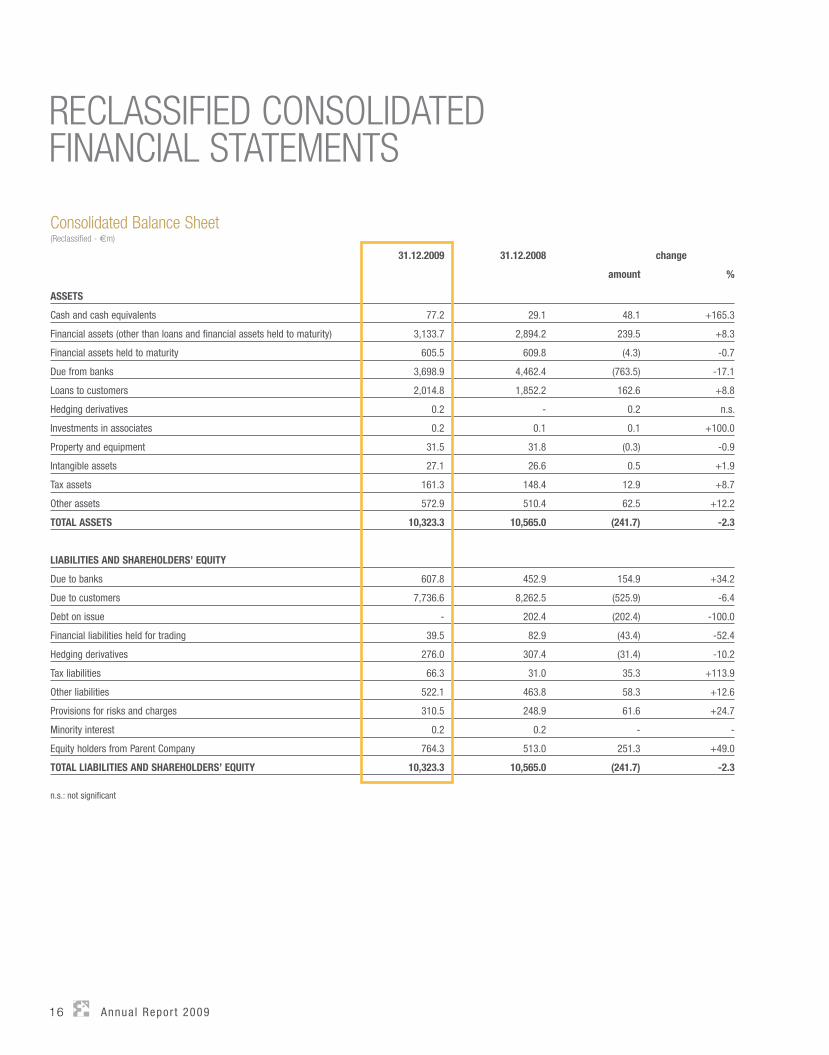
RECLASSIFIED CONSOLIDATED FINANCIAL STATEMENTS
Consolidated Balance Sheet (Reclassifi ed - €m)
31.12.2009 31.12.2008 change
amount %
ASSETS
Cash and cash equivalents 77.2 29.1 48.1 +165.3
Financial assets (other than loans and financial assets held to maturity) 3,133.7 2,894.2 239.5 +8.3
Financial assets held to maturity 605.5 609.8 (4.3) -0.7
Due from banks 3,698.9 4,462.4 (763.5) -17.1
Loans to customers 2,014.8 1,852.2 162.6 +8.8
Hedging derivatives 0.2 - 0.2 n.s.
Investments in associates 0.2 0.1 0.1 +100.0
Property and equipment 31.5 31.8 (0.3) -0.9
Intangible assets 27.1 26.6 0.5 +1.9
Tax assets 161.3 148.4 12.9 +8.7
Other assets 572.9 510.4 62.5 +12.2
TOTAL ASSETS 10,323.3 10,565.0 (241.7) -2.3
LIABILITIES AND SHAREHOLDERS’ EQUITY
Due to banks 607.8 452.9 154.9 +34.2
Due to customers 7,736.6 8,262.5 (525.9) -6.4
Debt on issue - 202.4 (202.4) -100.0
Financial liabilities held for trading 39.5 82.9 (43.4) -52.4
Hedging derivatives 276.0 307.4 (31.4) -10.2
Tax liabilities 66.3 31.0 35.3 +113.9
Other liabilities 522.1 463.8 58.3 +12.6
Provisions for risks and charges 310.5 248.9 61.6 +24.7
Minority interest 0.2 0.2 - -
Equity holders from Parent Company 764.3 513.0 251.3 +49.0
TOTAL LIABILITIES AND SHAREHOLDERS’ EQUITY 10,323.3 10,565.0 (241.7) -2.3
n.s.: not significant

Directors ’ Repor t Reclass i f ied conso l ida ted f inanc ia l s ta tements 17
Consolidated Income Statement(Reclassifi ed - €m)
2009 2008 change
amount %
Net interest income 157.6 158.2 (0.6) -0.4
Net profit (loss) on financial assets and liabilities 15.3 (10.2) 25.5 n.s.
Net commission income 441.5 468.4 (26.9) -5.7
OPERATING INCOME BEFORE NET IMPAIRMENT 614.4 616.4 (2.0) -0.3
Net impairment of financial assets (0.1) (3.5) 3.4 -97.1
OPERATING INCOME 614.3 612.9 1.4 +0.2
Personnel expenses (125.9) (121.6) (4.3) +3.5
Other administrative expenses (184.2) (189.9) 5.7 -3.0
Depreciation and amortization (17.8) (15.6) (2.2) +14.1
OPERATING EXPENSES (327.9) (327.1) (0.8) +0.2
Net provisions for risks and charges (43.1) (45.3) 2.2 -4.9
Gain from disposal of investments - 0.3 (0.3) -100.0
Other income (expense) (3.4) 4.4 (7.8) n.s.
PROFIT BEFORE TAX 239.9 245.2 (5.3) -2.2
Income taxes (*) (57.7) (56.5) (1.2) +2.1
Non-recurring expenses net of tax (*) (3.7) (12.5) 8.8 -70.4
Minority interest (0.1) (0.1) - -
NET PROFIT 178.4 176.1 2.3 +1.3
(*) 2008 restated on a like-for-like basis (see Reconciliation of reclassified income statement and consolidated income statement in the schedules).
n.s.: not significant
18 Annua l Repor t 2009
MAIN RESULTS AND STRATEGIESTHE ECONOMIC SCENARIOThe contraction in global economic activity in the closing months of 2008 continued into early 2009, but the containment of the financial sector crisis and strong economic policy response both on the monetary and fiscal fronts helped stabilise the economies of the advanced economies and consolidate the nascent recoveries in the emerging economies during the Spring.
In the U.S.A., the contraction in GDP eased significantly in the second quarter, when there was a strong recovery in business and consumer confidence. Growth returned to positive figures in the third quarter, thanks in part to a recovery in consumer spending which benefited from incentives supporting the motor sector as part of an extensive tax stimulus package launched by the new administration at the beginning of the year. Important support also came from a recovery in the residential building sector following four years of grave crisis, and in the last part of the year growth in addition benefited from the end of the drastic stock reduction process that had impacted prior quarters. Unemployment rose to 10% towards the end of the year compared to approximately 7% at the end of 2008, while inflation fell significantly during the year and was negative between March and October. The Federal Reserve, which had cut interest rates to zero at the end of 2008, embarked on a massive programme of buying securitised mortgages and government agency debt securities, which was extended to Treasury Bonds from March.
The Eurozone saw a substantial decline in economic activity at the beginning of the year, which was particularly serious for countries such
as Germany and Italy, which are more dependent on exports. During the Spring, the economy stabilised and returned to growth in Germany and France. GDP growth returned to positive territory in the third quarter of the year thanks to the favourable impact of consumer spending incentives and an exports recovery which led to a strong recovery in industrial production and helped stabilise the economic recovery in the last quarter of the year. Unemployment increased in 2009, albeit not as much as in the U.S.A., with companies preferring to make sharp cuts in working hours rather than to reduce the number of employees, availing themselves of government tax incentives. Inflation fell significantly and was negative between June and October. Faced with this extremely weak economic scenario, the European Central Bank continued cutting interest rates in the first part of the year, while however deciding not to follow the policy of buying assets and government bonds adopted by the Federal Reserve and Bank of England, instead pursuing a policy centred on providing substantial liquidity to the banking system. In Asia and above all China, there were already signs of recovery at the beginning of the year. The Chinese economy benefited from the substantial fiscal stimulus plan decided by the authorities last November, which led to an unprecedented increase in available liquidity and a considerable acceleration in infrastructure investments that enabled GDP to grow notwithstanding weaker exports. The Japanese economy also started climbing out of a deep recession from the second quarter thanks to a recovery in exports and the impact of the fiscal stimulus package adopted in the Spring. The crisis has however pushed the economy back into deflation, highlighting its structural weakness.
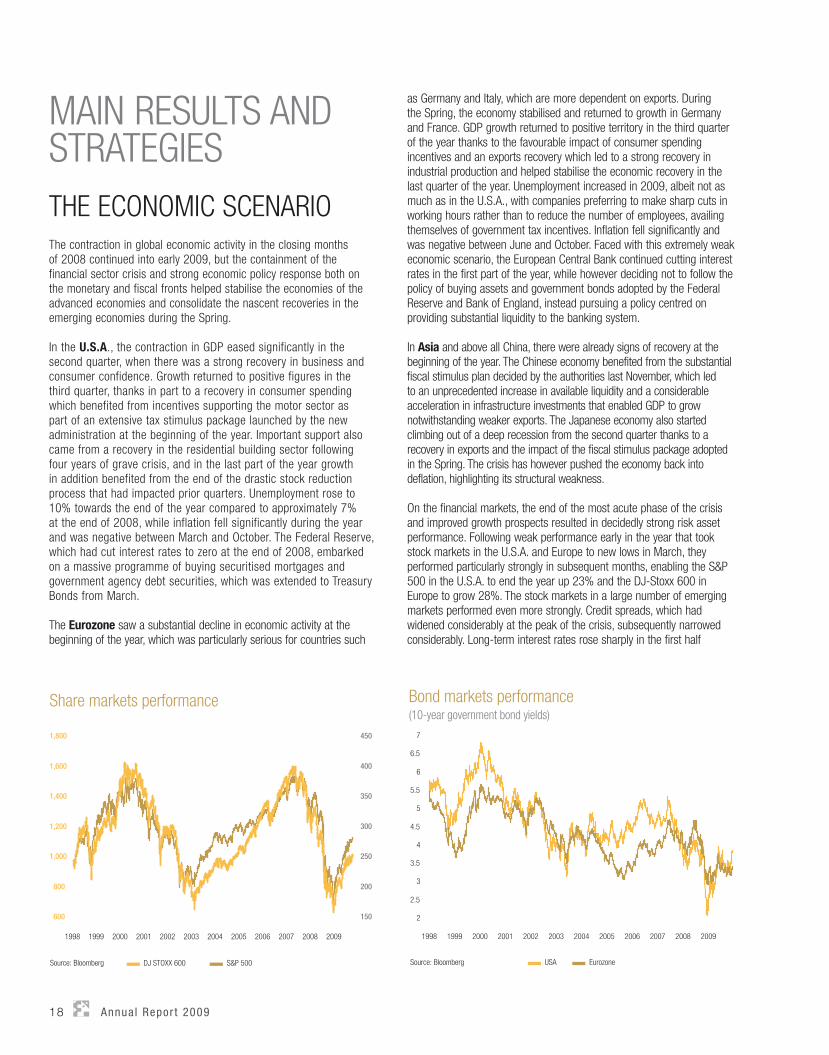
On the financial markets, the end of the most acute phase of the crisis and improved growth prospects resulted in decidedly strong risk asset performance. Following weak performance early in the year that took stock markets in the U.S.A. and Europe to new lows in March, they performed particularly strongly in subsequent months, enabling the S&P 500 in the U.S.A. to end the year up 23% and the DJ-Stoxx 600 in Europe to grow 28%. The stock markets in a large number of emerging markets performed even more strongly. Credit spreads, which had widened considerably at the peak of the crisis, subsequently narrowed considerably. Long-term interest rates rose sharply in the first half
Share markets performance
600
800
1,000
1,200
1,400
1,600
1,800
1998 1999 2000 2001 2002 2003 2004 2005 2006 2007 2008 2009
150
200
250
300
350
400
450
DJ STOXX 600 S&P 500Source: Bloomberg
Bond markets performance
USA Eurozone
2
2.5
3
3.5
4
4.5
5
5.5
6
6.5
7
1998 1999 2000 2001 2002 2003 2004 2005 2006 2007 2008 2009
Source: Bloomberg
(10-year government bond yields)

Directors ’ Repor t Main Resu l ts and St ra teg ies 19
(from 2% to approximately 4% in the U.S.A. and from 3% to 3.75% in the Eurozone for ten-year government bond yields) and then remained largely stable in the U.S.A. while falling in the Eurozone in the second half of the year. The central banks’ policies contributed to this trend, with the Federal Reserve and Bank of England embarking on massive programmes to purchase debt securities, while the European Central Bank substantially increased the liquidity it pumped into the system with the introduction of 12-month auctions from the middle of the year.
OVERVIEW OF CONSOLIDATED RESULTSThe Banca Fideuram Group ended 2009 with consolidated net profit of €178.4m, up €2.3m (+1.3%) on 2008 (€176.1m). R.O.E. was 27.9% (25.8% in 2008).
Analysing the main income statement items shows that the increase in income with respect to the previous financial year was due to increased operating income (+€1.4m) together with reduced provisions (-€2.2m) and one-off costs (-€8.8m), which were only partially offset by increased operating expenses (+€0.8m) and other expense (+€7.8m). The Group’s Cost/Income ratio was 53.7% (52.7% in 2008).
At 31 December 2009, the number of Personal Financial Advisers in the Fideuram and Sanpaolo Invest Networks totalled 4,292 compared with 4,209 at 31 December 2008. Total staff came to 1,485 employees at that date, compared with 1,467 at 31 December 2008. Bank branches and Personal Financial Advisers’ offices totalled 97 and 384 respectively, with Sanpaolo Invest SIM accounting for 186 of the latter.
Total customer numbers were approximately 626,000 at 31 December 2009, compared with 639,000 at 31 December 2008. Analysing this decrease by customer segment shows that it was entirely composed of marginal customers in the Mass Market segment, with all other customer segments (Private Banking and Affluent) showing growth (+14,000 on December 2008). The number of customers subscribed to our online services came to approximately 224,000, an increase of 15,000 on 31 December 2008.
GROUP COMPETITIVE POSITIONBanca Fideuram is a leader in the development, management and distribution of financial products and services for private individuals in Italy, benefiting from over 40 years’ experience in the sector. The Group’s activities are focused on providing financial advisory services and the development, management and distribution of financial, insurance and banking products and services. These financial advisory services see the Group assisting its customers with the informed management of their assets, based on a detailed analysis of their real needs and risk profile. This support is provided by experienced Personal Financial Advisers in our Personal Financial Adviser Networks, enabling the Group to build and consolidate confidential relationships of trust with our customers over time.
The core strengths distinguishing the Group can be summarised as follows:• A distinctive model centred on the professional relationships
between our Personal Financial Advisers and customers (“Network Bank” model), supported by a complete offering of Group products and services, together with a network of 97 dedicated bank branches located throughout Italy which make a decisive contribution to customer loyalty.
• An integrated Group of companies inside Italy and abroad which enable us to offer an extensive spectrum of products, services and expertise. This international integration, which is based on a strategy of specialisation that allocates each company its own professional competencies, makes it possible to provide a wide range of products in order to anticipate and respond promptly to market opportunities.
• Advisory-based service model. The professional relationship between each Personal Financial Adviser and customer consists in a financial advisory service governed by a specific contract. This service is delivered in two ways: - Base Advisory: provided free of charge to all customers and
consisting in personalised advisory regarding the customer’s investments.
- SEI Advanced Advisory: provided on the basis of a dedicated contract and subject to the payment of commission, this advanced advisory consists in identifying the customer’s individual requirements classified by “area of need”, in analysing their overall position and risk/return profile, identifying the investment strategies and solutions for each individual area of need and monitoring them over time.
• Customer segmentation with a focus on Private Banking. Sharp focus on high-end customers (over 40% of CA regard Private Banking customers, a figure that is continually growing1), a segment with high growth prospects in the Italian Market. A dedicated service model using ad hoc organisational management (“Private Banking Service Line”) and dedicated products and services.
1. Private Banking customers: customers with financial client assets of over €500,000.
20 Annua l Repor t 2009
• An open architecture model that offers third-party products alongside and to complement our Group products, satisfying even the most sophisticated needs through partnerships with leading third-party fund houses.
• Two well-known brands, Banca Fideuram and Sanpaolo Invest, with consolidated reputations of longstanding on the Italian market both with our customers and Personal Financial Advisers.
• High profitability (the highest R.O.E. on the market) leveraging the economies of scale of having the highest average client assets per Personal Financial Adviser in Italy (over €15m per Personal Financial Adviser, which is more than double the market average) and the economies of scope resulting from a consolidated market presence based on over 40 years of experience in the sector.
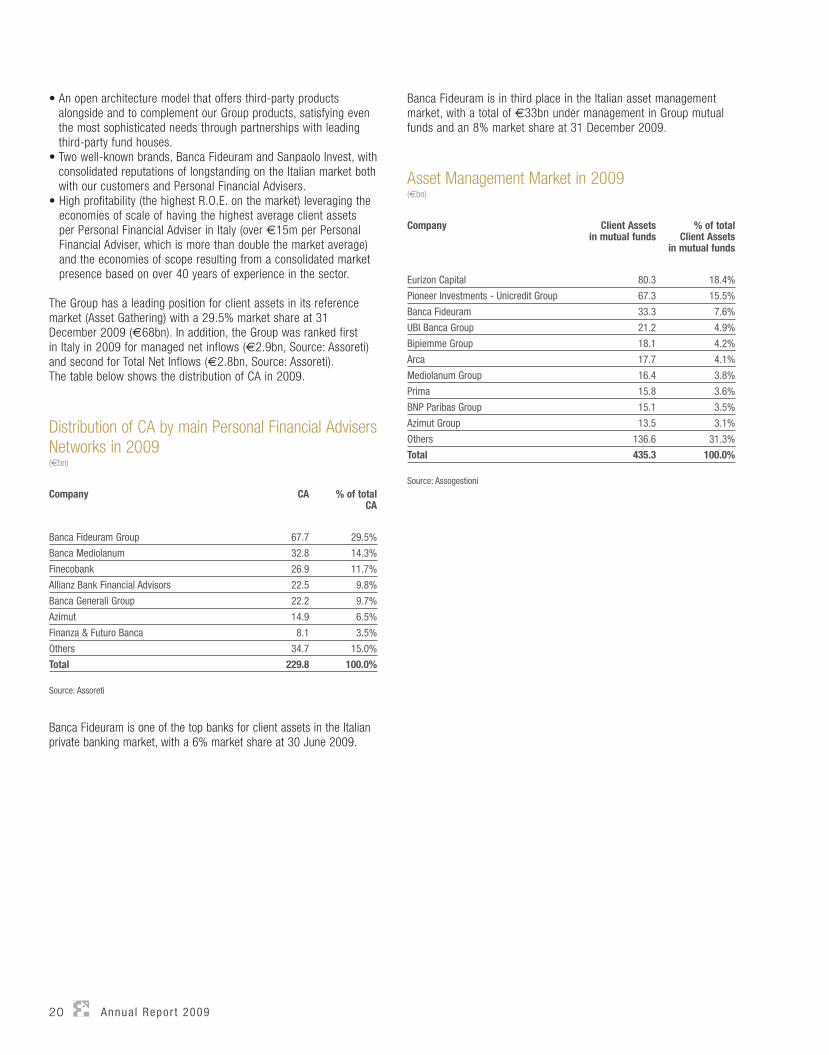
The Group has a leading position for client assets in its reference market (Asset Gathering) with a 29.5% market share at 31 December 2009 (€68bn). In addition, the Group was ranked first in Italy in 2009 for managed net inflows (€2.9bn, Source: Assoreti) and second for Total Net Inflows (€2.8bn, Source: Assoreti). The table below shows the distribution of CA in 2009.
Distribution of CA by main Personal Financial Advisers Networks in 2009(€bn)
Company CA % of total CA
Banca Fideuram Group 67.7 29.5%
Banca Mediolanum 32.8 14.3%
Finecobank 26.9 11.7%
Allianz Bank Financial Advisors 22.5 9.8%
Banca Generali Group 22.2 9.7%
Azimut 14.9 6.5%
Finanza & Futuro Banca 8.1 3.5%
Others 34.7 15.0%
Total 229.8 100.0%
Source: Assoreti
Banca Fideuram is one of the top banks for client assets in the Italian private banking market, with a 6% market share at 30 June 2009.
Banca Fideuram is in third place in the Italian asset management market, with a total of €33bn under management in Group mutual funds and an 8% market share at 31 December 2009.
Asset Management Market in 2009(€bn)
Company Client Assetsin mutual funds
% of total Client Assets
in mutual funds
Eurizon Capital 80.3 18.4%
Pioneer Investments - Unicredit Group 67.3 15.5%
Banca Fideuram 33.3 7.6%
UBI Banca Group 21.2 4.9%
Bipiemme Group 18.1 4.2%
Arca 17.7 4.1%
Mediolanum Group 16.4 3.8%
Prima 15.8 3.6%
BNP Paribas Group 15.1 3.5%
Azimut Group 13.5 3.1%
Others 136.6 31.3%
Total 435.3 100.0%
Source: Assogestioni

Directors ’ Repor t Opera t ing resu l ts 21
OPERATING RESULTSASSETS AND INFLOWSClient assets totalled €67.8bn at 31 December 2009, up €7.3bn (+12.1%) on the figure at 31 December 2008, helped both by the assets’ strong performance and net inflows of €2.8bn, acquired almost entirely in the last quarter of the year, largely as an effect of article 13-bis of Italian Decree Law No. 78/2009 (also known as the “scudo fiscale ter” or “third tax shield” ), issued to promote the regularisation and consequent repatriation of financial assets held by Italians outside Italy. The integration of the Banca CR Firenze Network in Sanpaolo Invest SIM contributed approximately €0.4bn to these positive net inflows.
Client Assets (€m)
31.12.2009 31.12.2008 change
amount %
Mutual funds 23,210 18,085 5,125 28.3
Discretionary accounts 10,373 9,639 734 7.6
Life insurance 13,038 12,354 684 5.5
including: Eurizon Vitaunit linked 9,987 9,506 481 5.1
Pension funds 413 215 198 92.1
Total managed assets 47,034 40,293 6,741 16.7
Total non managed assets 20,767 20,214 553 2.7
including: Securities 15,478 15,774 (296) -1.9
Total CA 67,801 60,507 7,294 12.1
Analysis of these items shows that managed assets, which achieved significant growth thanks above all to mutual funds, totalled €47bn compared with €40.3bn in the previous financial year (+16.7%). Managed assets, which accounted for 69.4% of total client assets compared with 66.6% at the end of 2008, showed a solid recovery notwithstanding the fact that the assets acquired as a consequence of the “tax shield” were still principally recorded under non-discretionary savings. Non managed assets were also up from 31 December 2008 at €20.8bn (+2.7%). These results indicate that we are in a process which sees customers shifting their asset allocation to managed assets products in order to benefit from the opportunities offered by the recovery in the financial markets. This interpretation was supported by the fact that in December shares had risen to an average of 22.4% of client assets with recurring fees (mutual funds, discretionay accounts and unit linked policies), up from 22.2% at the end of the third quarter of the year, although still significantly below the averages of over 30% achieved in the years prior to the crisis.
At the end of December 2009, shares had risen to an average of 24.6% of client assets with recurring fees.
The graphs show the quarterly trend for client assets in relation to type of inflow and sales network.
Total net inflows came to €2.8bn in 2009, up sharply (+€2.5bn) on the result for the previous financial year (€345m), highlighting how effectively the Group acted to attract the savings of customers who decided to avail themselves of the opportunity to repatriate their financial assets held outside Italy. Article 13-bis of Italian Decree Law No. 78/2009 offered natural persons holding financial and other assets outside Italy the option of regularising any breaches of the law without this being stated as provided for in their tax declaration, by regularising or repatriating said assets and submitting a tax declaration restricted to
Sanpaolo Invest Banca Fideuram
( m)Client Assets - by sales network
70,000
60,000
50,000
40,000
30,000
20,000
10,000
-31.12.2008
50,659
9,848
60,507
51,774
10,797
30.6.2009
62,571
53,905
11,133
30.9.2009
65,038
56,110
11,691
31.12.2009
67,801
50,051
9,864
31.3.2009
59,915
70,000
60,000
50,000
40,000
30,000
20,000
10,000
-
Non managed assets Managed assets
( m)
31.12.2008
60,507
40,293
20,214
Client Assets - by type of inflows
47,034
20,767
31.12.2009
67,801
42,302
20,269
30.6.2009
62,571
44,527
20,511
30.9.2009
65,038
40,011
19,904
31.3.2009
59,915
22 Annua l Repor t 2009
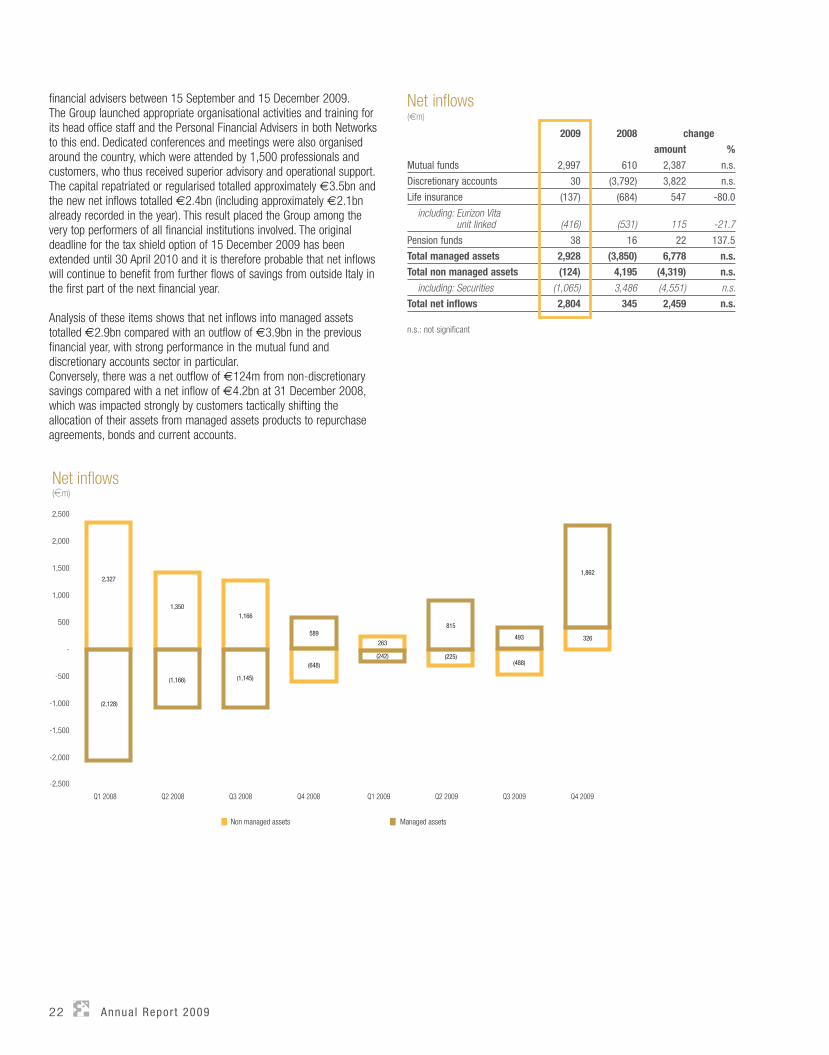
financial advisers between 15 September and 15 December 2009. The Group launched appropriate organisational activities and training for its head office staff and the Personal Financial Advisers in both Networks to this end. Dedicated conferences and meetings were also organised around the country, which were attended by 1,500 professionals and customers, who thus received superior advisory and operational support. The capital repatriated or regularised totalled approximately €3.5bn and the new net inflows totalled €2.4bn (including approximately €2.1bn already recorded in the year). This result placed the Group among the very top performers of all financial institutions involved. The original deadline for the tax shield option of 15 December 2009 has been extended until 30 April 2010 and it is therefore probable that net inflows will continue to benefit from further flows of savings from outside Italy in the first part of the next financial year.
Analysis of these items shows that net inflows into managed assets totalled €2.9bn compared with an outflow of €3.9bn in the previous financial year, with strong performance in the mutual fund and discretionary accounts sector in particular. Conversely, there was a net outflow of €124m from non-discretionary savings compared with a net inflow of €4.2bn at 31 December 2008, which was impacted strongly by customers tactically shifting the allocation of their assets from managed assets products to repurchase agreements, bonds and current accounts.
Net inflows(em)
-2,000
-2,500
-1,500
-1,000
-500
-
500
1,000
1,500
2,000
2,500
Q1 2008
2,327
(2,128)
Q1 2009
263
(242)
Q2 2009
815
(225)
Q3 2009
493
(488)
Q4 2009
326
1,862
Q2 2008
1,350
(1,166)
Q4 2008
(648)
589
Non managed assets Managed assets
Q3 2008
1,166
(1,145)
Net inflows(€m)
2009 2008 change
amount %
Mutual funds 2,997 610 2,387 n.s.
Discretionary accounts 30 (3,792) 3,822 n.s.
Life insurance (137) (684) 547 -80.0
including: Eurizon Vita unit linked (416) (531) 115 -21.7
Pension funds 38 16 22 137.5
Total managed assets 2,928 (3,850) 6,778 n.s.
Total non managed assets (124) 4,195 (4,319) n.s.
including: Securities (1,065) 3,486 (4,551) n.s.
Total net inflows 2,804 345 2,459 n.s.
n.s.: not signifi cant
Directors ’ Repor t Financ ia l resu l ts 23
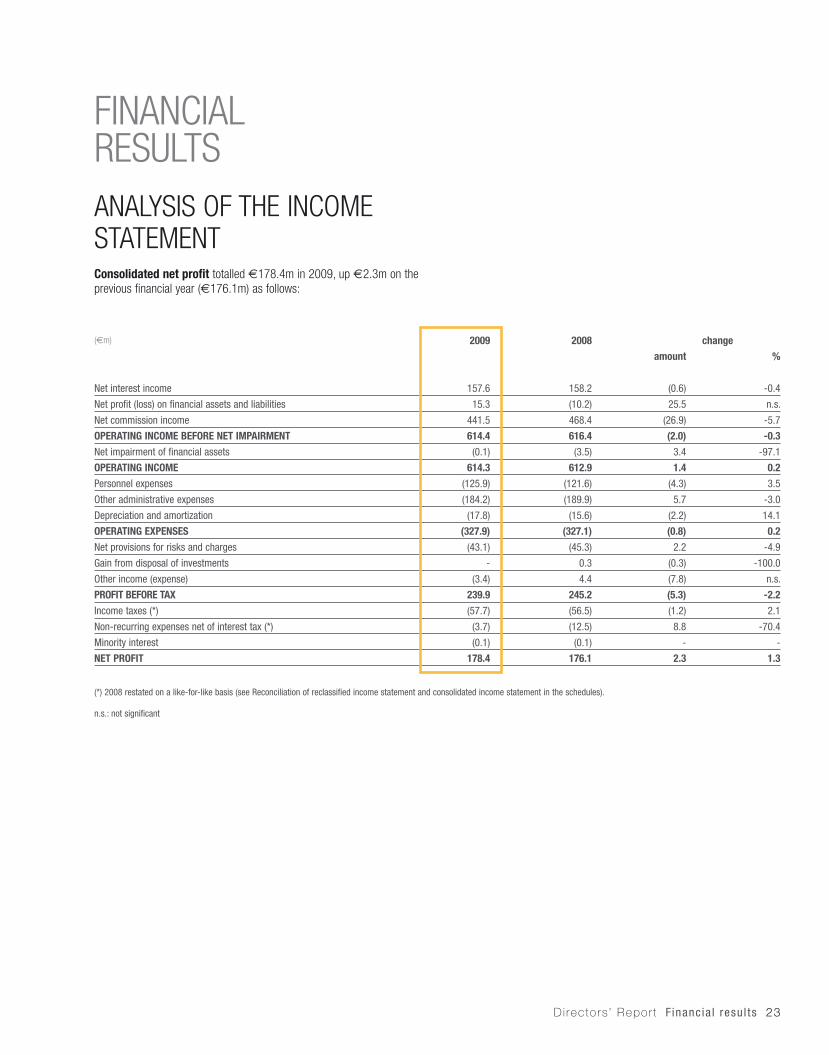
FINANCIAL RESULTSANALYSIS OF THE INCOME STATEMENTConsolidated net profit totalled €178.4m in 2009, up €2.3m on the previous financial year (€176.1m) as follows:
(€m) 2009 2008 change
amount %
Net interest income 157.6 158.2 (0.6) -0.4
Net profit (loss) on financial assets and liabilities 15.3 (10.2) 25.5 n.s.
Net commission income 441.5 468.4 (26.9) -5.7
OPERATING INCOME BEFORE NET IMPAIRMENT 614.4 616.4 (2.0) -0.3
Net impairment of financial assets (0.1) (3.5) 3.4 -97.1
OPERATING INCOME 614.3 612.9 1.4 0.2
Personnel expenses (125.9) (121.6) (4.3) 3.5
Other administrative expenses (184.2) (189.9) 5.7 -3.0
Depreciation and amortization (17.8) (15.6) (2.2) 14.1
OPERATING EXPENSES (327.9) (327.1) (0.8) 0.2
Net provisions for risks and charges (43.1) (45.3) 2.2 -4.9
Gain from disposal of investments - 0.3 (0.3) -100.0
Other income (expense) (3.4) 4.4 (7.8) n.s.
PROFIT BEFORE TAX 239.9 245.2 (5.3) -2.2
Income taxes (*) (57.7) (56.5) (1.2) 2.1
Non-recurring expenses net of interest tax (*) (3.7) (12.5) 8.8 -70.4
Minority interest (0.1) (0.1) - -
NET PROFIT 178.4 176.1 2.3 1.3
(*) 2008 restated on a like-for-like basis (see Reconciliation of reclassified income statement and consolidated income statement in the schedules).
n.s.: not significant

24 Annua l Repor t 2009
Operating income totalled €614.3m, up €1.4m (+0.2%) on the €612.9m achieved in 2008. The positive performance of this item was a result of growth in net profit on financial assets and liabilities (+€25.5m) and lower write-downs of loans (-€3.4m), partially offset by a decline in net commission income (-€26.9m).
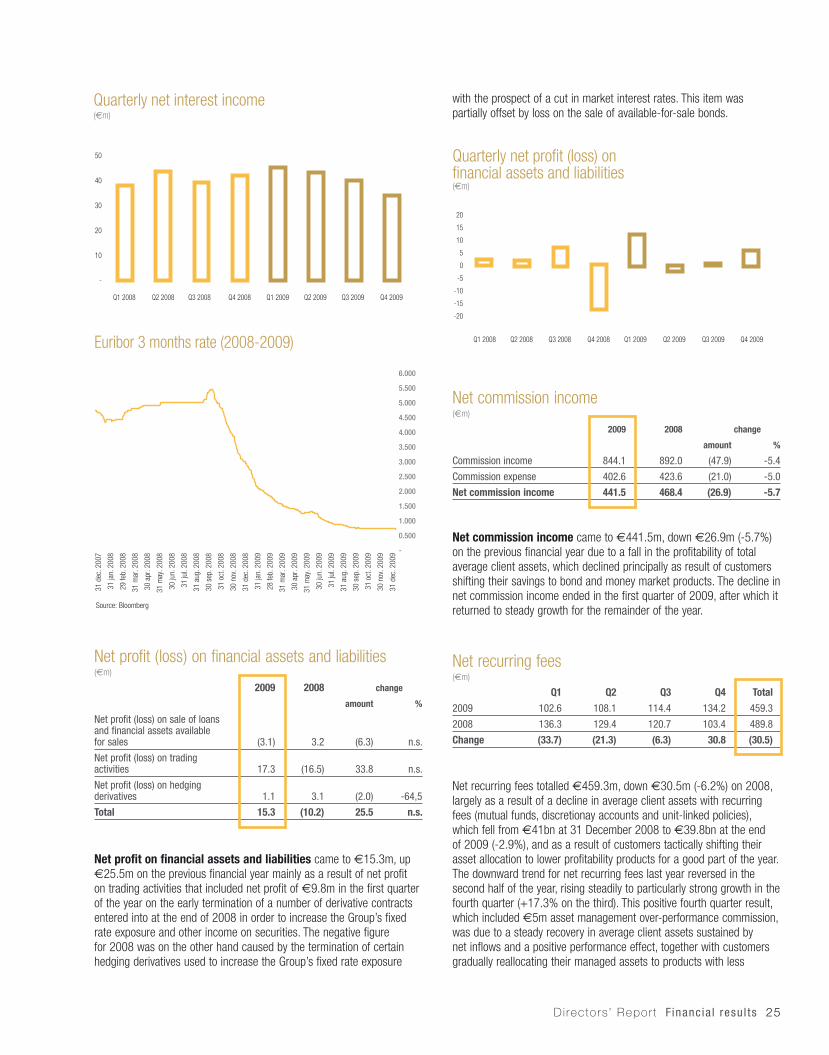
Net interest income (€m)
2009 2008 change
amount %
Interest expense on due to customers (64.7) (278.6) 213.9 -76.8
Interest expense on due to banks and on debt on issue (9.2) (47.3) 38.1 -80.5
Interest income on debt securities 200.4 311.9 (111.5) -35.7
Interest income on loans to customers 71.7 166.8 (95.1) -57.0
Interest expense on hedging derivatives (40.9) 5.2 (46.1) n.s.
Other net interest income 0.3 0.2 0.1 50.0
Total 157.6 158.2 (0.6) -0.4
Net interest income came to €157.6m, which was substantially the same as the total of €158.2m in 2008 (-€0.6m). Although market rates fell sharply, it was possible to maintain net interest income by adopting an asset management strategy that took the expansionary monetary policies being pursued into account. By increasing our position in fixed rate securities we were in fact able to increase the differential with respect to the cost of the inflows, which offset the contraction in loans under repurchase agreements. As a result of this strategy we were, moreover, also able to maintain high net interest income in the first three quarters and limit the impact on net interest income in the last quarter of the year notwithstanding the particularly sharp decline in market rates in the early months of 2009. Net interest income in the fourth quarter was down 15.8% on the third quarter and 19.1% on the fourth quarter of the previous year.
2009 2008
Q4 Q3 Q2 Q1 Q4 Q3 Q2 Q1 Restated (*)
Average
Net interest income 33.0 39.2 42.1 43.3 40.8 38.0 42.7 36.7 39.6
Net profit (loss) on financial assets and liabilities 5.0 0.6 (2.1) 11.8 (18.4) 6.7 1.3 0.2 (2.6)
Net commission income 134.4 106.9 102.8 97.4 96.0 114.2 137.5 120.7 117.1
OPERATING INCOME BEFORE NET IMPAIRMENT 172.4 146.7 142.8 152.5 118.4 158.9 181.5 157.6 154.1
Net impairment of financial assets (0.5) 0.2 (0.1) 0.3 (0.5) (2.9) (0.2) 0.1 (0.9)
OPERATING INCOME 171.9 146.9 142.7 152.8 117.9 156.0 181.3 157.7 153.2
Personnel expenses (32.2) (32.1) (31.4) (30.2) (26.6) (32.6) (30.6) (31.8) (30.4)
Other administrative expenses (46.9) (48.0) (44.5) (44.8) (49.0) (46.3) (46.9) (47.7) (47.5)
Depreciation and amortization (4.8) (4.4) (4.6) (4.0) (4.1) (3.9) (3.7) (3.9) (3.9)
OPERATING EXPENSES (83.9) (84.5) (80.5) (79.0) (79.7) (82.8) (81.2) (83.4) (81.8)
Net provisions for risks and charges (13.6) (9.7) (9.1) (10.7) (15.3) (12.0) (10.1) (7.9) (11.3)
Gain from disposal of investments - - - - - - - 0.3 0.1
Other income (expense) (4.1) (0.3) 0.6 0.4 (0.8) 2.8 (0.5) 2.9 1.1
PROFIT BEFORE TAX 70.3 52.4 53.7 63.5 22.1 64.0 89.5 69.6 61.3
Income taxes (*) (20.6) (10.6) (12.4) (14.1) (2.4) (17.1) (23.0) (14.0) (14.1)
Non-recurring expenses net of tax (*) (1.8) (1.2) (0.2) (0.5) (0.3) (10.3) (1.9) - (3.2)
Minority interest (0.1) - - - (0.1) - - - -
NET PROFIT 47.8 40.6 41.1 48.9 19.3 36.6 64.6 55.6 44.0
(*) Restated to take into account the changes to the reclassified income statement so that straight comparisons can be made.(**) Q4 2008 restated on a like-for-like basis (see Reconciliation of reclassified income statement and consolidated income statement in the schedules).
Quarterly Consolidated Income Statement(Reclassifi ed - €m)
Directors ’ Repor t Financ ia l resu l ts 25
Net profit (loss) on financial assets and liabilities(€m)
2009 2008 change
amount %
Net profit (loss) on sale of loans and financial assets available for sales (3.1) 3.2 (6.3) n.s.
Net profit (loss) on trading activities 17.3 (16.5) 33.8 n.s.
Net profit (loss) on hedging derivatives 1.1 3.1 (2.0) -64,5
Total 15.3 (10.2) 25.5 n.s.
Net profit on financial assets and liabilities came to €15.3m, up €25.5m on the previous financial year mainly as a result of net profit on trading activities that included net profit of €9.8m in the first quarter of the year on the early termination of a number of derivative contracts entered into at the end of 2008 in order to increase the Group’s fixed rate exposure and other income on securities. The negative figure for 2008 was on the other hand caused by the termination of certain hedging derivatives used to increase the Group’s fixed rate exposure
with the prospect of a cut in market interest rates. This item was partially offset by loss on the sale of available-for-sale bonds.
Net commission income(€m)
2009 2008 change
amount %
Commission income 844.1 892.0 (47.9) -5.4
Commission expense 402.6 423.6 (21.0) -5.0
Net commission income 441.5 468.4 (26.9) -5.7
Net commission income came to €441.5m, down €26.9m (-5.7%) on the previous financial year due to a fall in the profitability of total average client assets, which declined principally as result of customers shifting their savings to bond and money market products. The decline in net commission income ended in the first quarter of 2009, after which it returned to steady growth for the remainder of the year.
Net recurring fees(€m)
Q1 Q2 Q3 Q4 Total
2009 102.6 108.1 114.4 134.2 459.3
2008 136.3 129.4 120.7 103.4 489.8
Change (33.7) (21.3) (6.3) 30.8 (30.5)
Net recurring fees totalled €459.3m, down €30.5m (-6.2%) on 2008, largely as a result of a decline in average client assets with recurring fees (mutual funds, discretionay accounts and unit-linked policies), which fell from €41bn at 31 December 2008 to €39.8bn at the end of 2009 (-2.9%), and as a result of customers tactically shifting their asset allocation to lower profitability products for a good part of the year. The downward trend for net recurring fees last year reversed in the second half of the year, rising steadily to particularly strong growth in the fourth quarter (+17.3% on the third). This positive fourth quarter result, which included €5m asset management over-performance commission, was due to a steady recovery in average client assets sustained by net inflows and a positive performance effect, together with customers gradually reallocating their managed assets to products with less
20
15
10
5
0
-5
-10
-15
-20
Q1 2008 Q2 2008 Q3 2008 Q4 2008 Q1 2009 Q2 2009 Q3 2009 Q4 2009
Quarterly net profit (loss) onfinancial assets and liabilities( m)
-
10
20
30
40
50
Q1 2008 Q2 2008 Q3 2008 Q4 2008 Q1 2009 Q2 2009 Q3 2009 Q4 2009
Quarterly net interest income( m)
Euribor 3 months rate (2008-2009)
31 d
ec. 2
007
31 ja
n. 2
008
29 fe
b. 2
008
31 m
ar. 2
008
30 a
pr. 2
008
31 m
ay. 2
008
30 ju
n. 2
008
31 ju
l. 20
08
31 a
ug. 2
008
30 s
ep. 2
008
31 o
ct. 2
008
30 n
ov. 2
008
31 d
ec. 2
008
31 ja
n. 2
009
28 fe
b. 2
009
31 m
ar. 2
009
30 a
pr. 2
009
31 m
ay. 2
009
30 ju
n. 2
009
31 ju
l. 20
09
31 a
ug. 2
009
30 s
ep. 2
009
31 o
ct. 2
009
30 n
ov. 2
009
31 d
ec. 2
009 -
1.000
0.500
1.500
2.000
2.500
3.000
3.500
4.000
4.500
5.000
5.500
6.000
Source: Bloomberg
26 Annua l Repor t 2009
conservative risk profiles to benefit from the recovery in the financial markets. The positive effects of these phenomena on commission income will emerge fully during 2010.
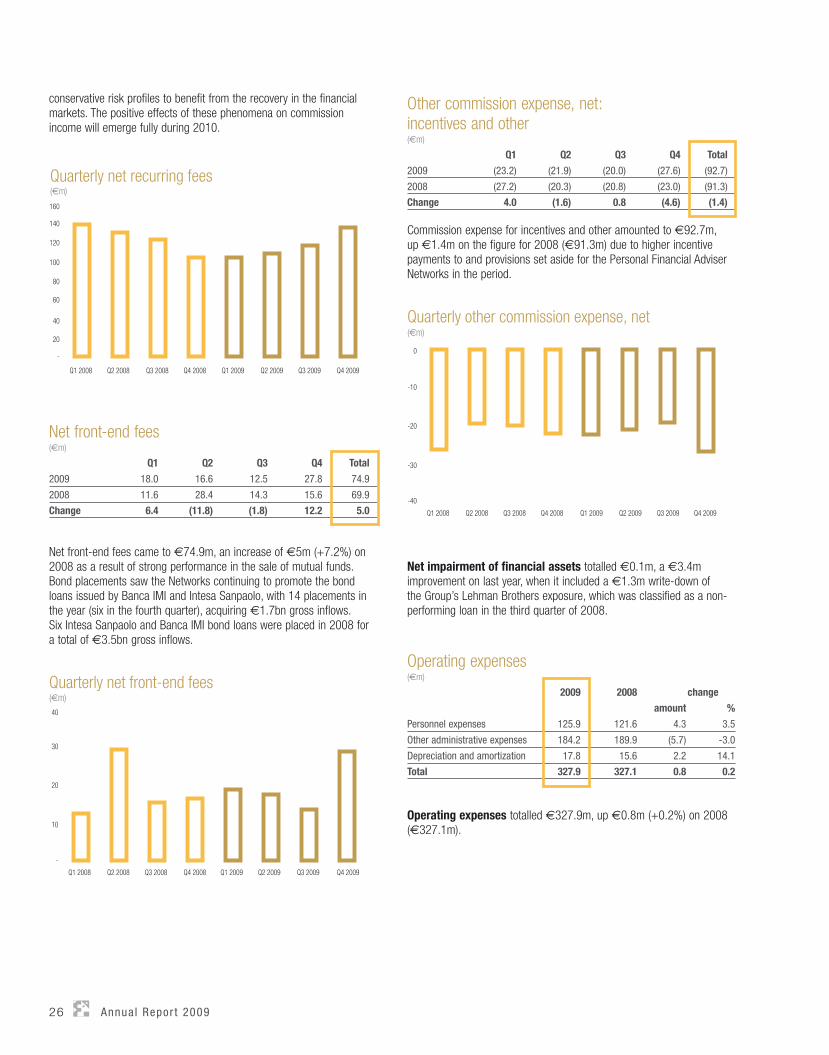
Net front-end fees(€m)
Q1 Q2 Q3 Q4 Total
2009 18.0 16.6 12.5 27.8 74.9
2008 11.6 28.4 14.3 15.6 69.9
Change 6.4 (11.8) (1.8) 12.2 5.0
Net front-end fees came to €74.9m, an increase of €5m (+7.2%) on 2008 as a result of strong performance in the sale of mutual funds. Bond placements saw the Networks continuing to promote the bond loans issued by Banca IMI and Intesa Sanpaolo, with 14 placements in the year (six in the fourth quarter), acquiring €1.7bn gross inflows. Six Intesa Sanpaolo and Banca IMI bond loans were placed in 2008 for a total of €3.5bn gross inflows.
Other commission expense, net: incentives and other(€m)
Q1 Q2 Q3 Q4 Total
2009 (23.2) (21.9) (20.0) (27.6) (92.7)
2008 (27.2) (20.3) (20.8) (23.0) (91.3)
Change 4.0 (1.6) 0.8 (4.6) (1.4)
Commission expense for incentives and other amounted to €92.7m, up €1.4m on the figure for 2008 (€91.3m) due to higher incentive payments to and provisions set aside for the Personal Financial Adviser Networks in the period.
Net impairment of financial assets totalled €0.1m, a €3.4m improvement on last year, when it included a €1.3m write-down of the Group’s Lehman Brothers exposure, which was classified as a non-performing loan in the third quarter of 2008.
Operating expenses(€m)
2009 2008 change
amount %
Personnel expenses 125.9 121.6 4.3 3.5
Other administrative expenses 184.2 189.9 (5.7) -3.0
Depreciation and amortization 17.8 15.6 2.2 14.1
Total 327.9 327.1 0.8 0.2
Operating expenses totalled €327.9m, up €0.8m (+0.2%) on 2008 (€327.1m).
-
160
140
120
100
80
60
40
20
Q1 2008 Q2 2008 Q3 2008 Q4 2008 Q1 2009 Q2 2009 Q3 2009 Q4 2009
Quarterly net recurring fees( m)
-
30
40
20
10
Q1 2008 Q2 2008 Q3 2008 Q4 2008 Q1 2009 Q2 2009 Q3 2009 Q4 2009
Quarterly net front-end fees( m)
-40
0
-10
-20
-30
Q1 2008 Q2 2008 Q3 2008 Q4 2008 Q1 2009 Q2 2009 Q3 2009 Q4 2009
Quarterly other commission expense, net( m)
Directors ’ Repor t Financ ia l resu l ts 27
Personnel expenses, including the costs resulting from the return of the user assistance and banking back office staff previously allocated to Intesa Sanpaolo to support the related services provided as outsourcer, totalled €125.9m, up €4.3m (+3.5%) on the figure for 2008. Comparing the figures on a like-for-like basis, which is to say net of the return of these staff, personnel expenses fell by approximately €0.6m as a result of the staff efficiency measures implemented in the previous financial year and initiatives to contain the variable components of remuneration.
Other administrative expenses totalled €184.2m, down €5.7m (-3%) on the figure for last year (€189.9m). Comparing the figures on a like-for-like basis, which is to say net of the return of these staff to the Group, other administrative expenses were down approximately €0.8m, largely due to lower professional services and advertising and marketing costs.
Depreciation and amortization totalled €17.8m, up €2.2m (+14.1%) on 2008 as a result of new software investments.
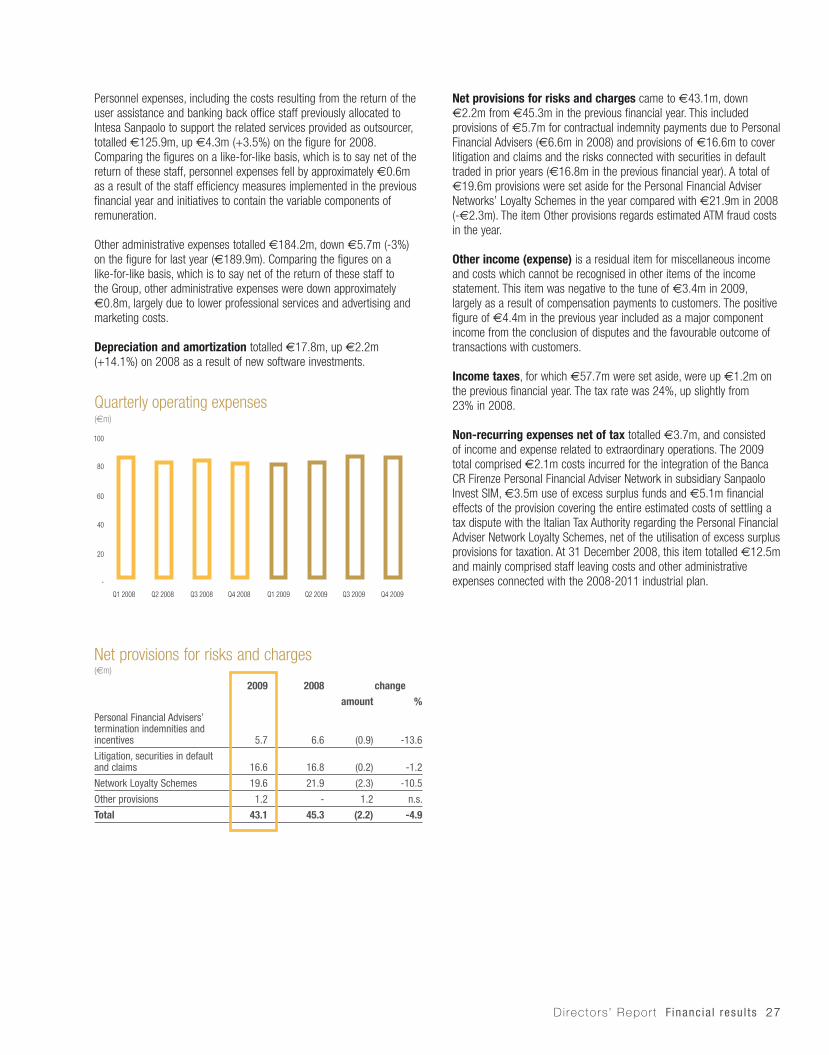
Net provisions for risks and charges(€m)
2009 2008 change
amount %
Personal Financial Advisers’ termination indemnities and incentives 5.7 6.6 (0.9) -13.6
Litigation, securities in default and claims 16.6 16.8 (0.2) -1.2
Network Loyalty Schemes 19.6 21.9 (2.3) -10.5
Other provisions 1.2 - 1.2 n.s.
Total 43.1 45.3 (2.2) -4.9
Net provisions for risks and charges came to €43.1m, down €2.2m from €45.3m in the previous financial year. This included provisions of €5.7m for contractual indemnity payments due to Personal Financial Advisers (€6.6m in 2008) and provisions of €16.6m to cover litigation and claims and the risks connected with securities in default traded in prior years (€16.8m in the previous financial year). A total of €19.6m provisions were set aside for the Personal Financial Adviser Networks’ Loyalty Schemes in the year compared with €21.9m in 2008 (-€2.3m). The item Other provisions regards estimated ATM fraud costs in the year. Other income (expense) is a residual item for miscellaneous income and costs which cannot be recognised in other items of the income statement. This item was negative to the tune of €3.4m in 2009, largely as a result of compensation payments to customers. The positive figure of €4.4m in the previous year included as a major component income from the conclusion of disputes and the favourable outcome of transactions with customers.
Income taxes, for which €57.7m were set aside, were up €1.2m on the previous financial year. The tax rate was 24%, up slightly from 23% in 2008. Non-recurring expenses net of tax totalled €3.7m, and consisted of income and expense related to extraordinary operations. The 2009 total comprised €2.1m costs incurred for the integration of the Banca CR Firenze Personal Financial Adviser Network in subsidiary Sanpaolo Invest SIM, €3.5m use of excess surplus funds and €5.1m financial effects of the provision covering the entire estimated costs of settling a tax dispute with the Italian Tax Authority regarding the Personal Financial Adviser Network Loyalty Schemes, net of the utilisation of excess surplus provisions for taxation. At 31 December 2008, this item totalled €12.5m and mainly comprised staff leaving costs and other administrative expenses connected with the 2008-2011 industrial plan.
-
100
80
60
40
20
Q1 2008 Q2 2008 Q3 2008 Q4 2008 Q1 2009 Q2 2009 Q3 2009 Q4 2009
Quarterly operating expenses( m)

28 Annua l Repor t 2009
(€m) 31.12.2009 31.12.2008 change
amount %
ASSETS
Financial assets 3,739.4 3,504.0 235.4 6.7
Due from banks 3,698.9 4,462.4 (763.5) -17.1
Loans to customers 2,014.8 1,852.2 162.6 8.8
Investments in associates 0.2 0.1 0.1 100.0
Property, equipment and intangible assets 58.6 58.4 0.2 0.3
Other assets 811.4 687.9 123.5 18.0
TOTAL ASSETS 10,323.3 10,565.0 (241.7) -2.3
LIABILITIES AND SHAREHOLDERS’ EQUITY
Due to banks 607.8 452.9 154.9 34.2
Due to customers 7,736.6 8,262.5 (525.9) -6.4
Financial liabilities 315.5 592.7 (277.2) -46.8
Other liabilities 588.4 494.8 93.6 18.9
Provisions for risks and charges 310.5 248.9 61.6 24.7
Minority interest 0.2 0.2 - -
Equity holders from Parent Company 764.3 513.0 251.3 49.0
TOTAL LIABILITIES AND SHAREHOLDERS’ EQUITY 10,323.3 10,565.0 (241.7) -2.3
Quarterly Consolidated Balance Sheets(Reclassifi ed - €m)
31.12.2009 30.09.2009 30.06.2009 31.03.2009 31.12.2008 30.09.2008 30.06.2008 31.03.2008
ASSETS
Financial assets 3,739.4 3,682.8 3,765.5 3,376.3 3,504.0 3,644.6 4,268.2 4,449.6
Due from banks 3,698.9 2,504.1 3,060.1 3,125.1 4,462.4 4,963.1 5,364.1 6,266.4
Loans to customers 2,014.8 1,899.4 1,894.6 1,808.4 1,852.2 1,646.9 998.1 1,108.4
Investments in associates 0.2 0.2 0.2 0.1 0.1 0.1 0.1 0.1
Property, equipment and intangible assets 58.6 56.9 59.1 60.1 58.4 56.1 56.2 60.4
Other assets 811.4 653.0 665.5 824.2 687.9 734.1 793.0 795.5
TOTAL ASSETS 10,323.3 8,796.4 9,445.0 9,194.2 10,565.0 11,044.9 11,479.7 12,680.4
LIABILITIES AND SHAREHOLDERS’ EQUITY
Due to banks 607.8 268.0 409.1 363.0 452.9 536.8 596.9 911.5
Due to customers 7,736.6 6,483.0 6,812.5 6,879.7 8,262.5 8,350.9 8,696.9 9,422.2
Financial liabilities 315.5 509.6 847.6 561.8 592.7 515.7 439.9 543.1
Other liabilities 588.4 557.6 549.3 606.0 494.8 752.9 842.3 731.7
Provisions for risks and charges 310.5 286.9 269.9 256.8 248.9 231.5 212.5 224.6
Minority interest 0.2 0.2 0.2 0.2 0.2 0.2 0.2 0.2
Equity holders from Parent Company 764.3 691.1 556.4 526.7 513.0 656.9 691.0 847.1
TOTAL LIABILITIES AND SHAREHOLDERS’ EQUITY 10,323.3 8,796.4 9,445.0 9,194.2 10,565.0 11,044.9 11,479.7 12,680.4
ASSET AND LIABILITY MANAGEMENTThe main balance sheet items are analysed in the tables below, comparing the results with the corresponding figures at 31 December 2008.

Directors ’ Repor t Financ ia l resu l ts 29
Group financial assets held for treasury and investment purposes totalled€3.7bn, up €235.4m on the figure at the end of 2008 (+6.7%).
Financial assets(€m)
31.12.2009 31.12.2008 change
amount %
Financial assets held for trading 56.7 96.7 (40.0) -41.4
Financial assets designated at fair value 218.7 184.0 34.7 18.9
Financial assets available for sale 2,858.3 2,613.5 244.8 9.4
Financial assets held to maturity 605.5 609.8 (4.3) -0.7
Hedging derivatives 0.2 - 0.2 n.s.
Total 3,739.4 3,504.0 235.4 6.7
n.s.: not significant
The increase was mainly due to fair value gains on financial assets available-for-sale (+€244.8m), which were only partially reduced by a fall in financial assets held for trading, which were down €40m on 2008 due to sales of securities and fair value losses on derivatives. It should be noted that the Group portfolio has no exposure to the American subprime mortgage market and likewise has no exposure to any vehicle companies not included in the consolidation.
Financial liabilities(€m)
31.12.2009 31.12.2008 change
amount %
Debt on issue - 202.4 (202.4) -100.0
Financiali liabilitiesheld for trading 39.5 82.9 (43.4) -52.4
Hedging derivatives 276.0 307.4 (31.4) -10.2
Total 315.5 592.7 (277.2) -46.8
Financial liabilities, which consisted entirely of derivatives at year-end, totalled €315.5m, €277.2m less (-46.8%) than the figure at 31 December 2008 as the result of a bond loan that matured in the year and fair value gains on the derivative contracts in the portfolio.
Due from banks(€m)
31.12.2009 31.12.2008 change
amount %
Due from Central Banks 456.7 79.2 377.5 n.s.
Current accounts and demand deposits 496.3 400.4 95.9 24.0
Term deposits 1,690.4 1,965.0 (274,6) -14.0
Debt securities 1,055.5 2,017.8 (962,3) -47.7
Total 3,698.9 4,462.4 (763,5) -17.1
Due from banks came to €3.7bn, down €0.8bn (-17.1%) from the figure at the end of 2008 as a result of a decline in lending on the interbank market and a fall in debt securities, reflecting a decrease in customer deposits (-€0.5bn) which led to reduced treasury activities.
Due to banks(€m)
31.12.2009 31.12.2008 change
amount %
Current accounts and demand deposits 560.7 364.1 196.6 54.0
Term deposits 47.1 42.9 4.2 9.8
Repurchase agreements - 45.9 (45.9) -100.0
Total 607.8 452.9 154.9 34.2
Due to banks totalled e607.8m, up e154.9m (+34.2%) on the 2008 financial year due to increased inflows into current accounts and term deposits. The Group continued to be a net lender on the interbank market, with net interbank deposits of €3.1bn at 31 December 2009 (e3.7bn deposits and e0.6m liabilities), down 22.9% from e4bn at 31 December 2008 (e4.5bn deposits and e0.5bn liabilities).
Loans to customers(€m)
31.12.2009 31.12.2008 change
amount %
Current accounts 793.2 727.5 65.7 9.0
Repurchase agreements 109.4 - 109.4 n.s.
Loans 71.5 61.9 9.6 15.5
Other 110.7 62.5 48.2 77.1
Debt securities 923.4 995.5 (72.1) -7.2
Impaired assets 6.6 4.8 1.8 37.5
Total 2,014.8 1,852.2 162.6 8.8
Structured securities and equities
1.8%
Financial and insurance bonds
43.8%
Corporate bonds21.6%
Securities secured by-collateral3.3%
Governemnt bonds23.6%
Endowment policies5.9%
Financial assets at 31 December 2009
30 Annua l Repor t 2009
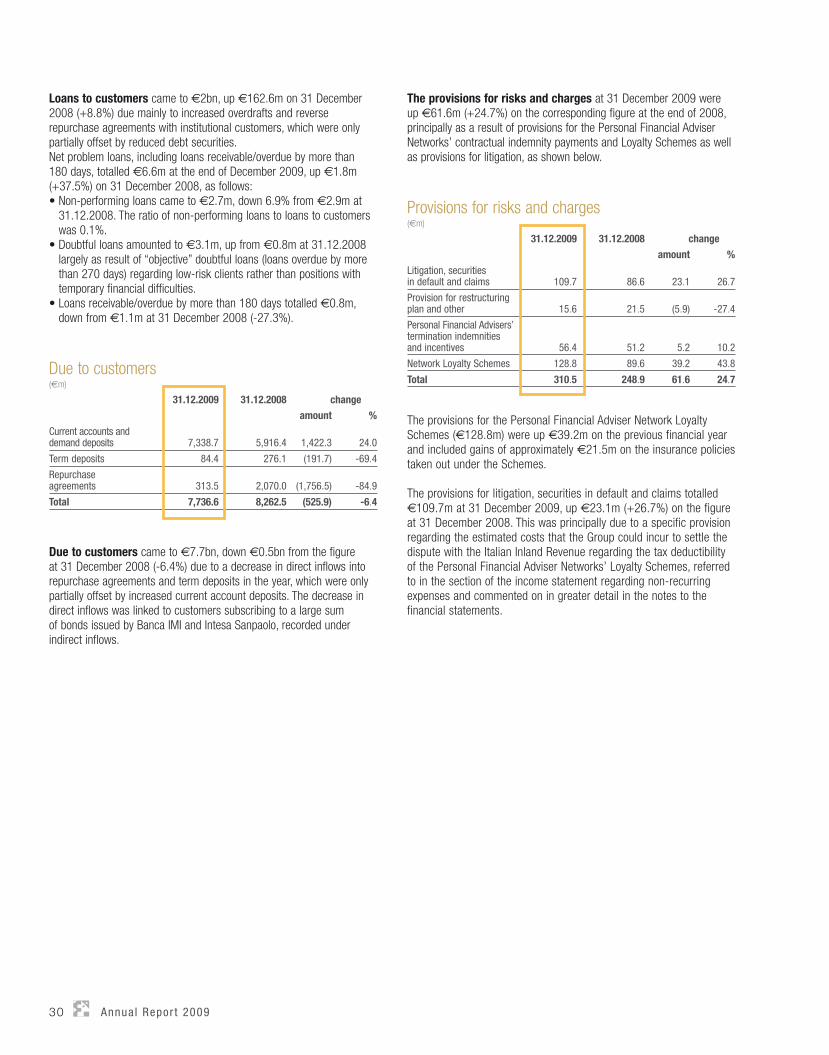
Loans to customers came to €2bn, up €162.6m on 31 December 2008 (+8.8%) due mainly to increased overdrafts and reverse repurchase agreements with institutional customers, which were only partially offset by reduced debt securities.Net problem loans, including loans receivable/overdue by more than 180 days, totalled €6.6m at the end of December 2009, up €1.8m (+37.5%) on 31 December 2008, as follows:• Non-performing loans came to €2.7m, down 6.9% from €2.9m at
31.12.2008. The ratio of non-performing loans to loans to customers was 0.1%.
• Doubtful loans amounted to €3.1m, up from €0.8m at 31.12.2008 largely as result of “objective” doubtful loans (loans overdue by more than 270 days) regarding low-risk clients rather than positions with temporary financial difficulties.
• Loans receivable/overdue by more than 180 days totalled €0.8m, down from €1.1m at 31 December 2008 (-27.3%).
Due to customers(€m)
31.12.2009 31.12.2008 change
amount %
Current accounts and demand deposits 7,338.7 5,916.4 1,422.3 24.0
Term deposits 84.4 276.1 (191.7) -69.4
Repurchase agreements 313.5 2,070.0 (1,756.5) -84.9
Total 7,736.6 8,262.5 (525.9) -6.4
Due to customers came to €7.7bn, down €0.5bn from the figure at 31 December 2008 (-6.4%) due to a decrease in direct inflows into repurchase agreements and term deposits in the year, which were only partially offset by increased current account deposits. The decrease in direct inflows was linked to customers subscribing to a large sum of bonds issued by Banca IMI and Intesa Sanpaolo, recorded under indirect inflows.
The provisions for risks and charges at 31 December 2009 were up €61.6m (+24.7%) on the corresponding figure at the end of 2008, principally as a result of provisions for the Personal Financial Adviser Networks’ contractual indemnity payments and Loyalty Schemes as well as provisions for litigation, as shown below.
Provisions for risks and charges(€m)
31.12.2009 31.12.2008 change
amount %
Litigation, securities in default and claims 109.7 86.6 23.1 26.7
Provision for restructuring plan and other 15.6 21.5 (5.9) -27.4
Personal Financial Advisers’ termination indemnities and incentives 56.4 51.2 5.2 10.2
Network Loyalty Schemes 128.8 89.6 39.2 43.8
Total 310.5 248.9 61.6 24.7
The provisions for the Personal Financial Adviser Network Loyalty Schemes (€128.8m) were up €39.2m on the previous financial year and included gains of approximately €21.5m on the insurance policies taken out under the Schemes.
The provisions for litigation, securities in default and claims totalled €109.7m at 31 December 2009, up €23.1m (+26.7%) on the figure at 31 December 2008. This was principally due to a specific provision regarding the estimated costs that the Group could incur to settle the dispute with the Italian Inland Revenue regarding the tax deductibility of the Personal Financial Adviser Networks’ Loyalty Schemes, referred to in the section of the income statement regarding non-recurring expenses and commented on in greater detail in the notes to the financial statements.

Directors ’ Repor t Financ ia l resu l ts 31
SHAREHOLDERS’ EQUITY
Group shareholders’equity including net profit for the year totalled €764.3m at 31 December 2009, having changed as follows:
Changes in Group Shareholder’s Equity(€m)
2009 2008
Opening shareholders' equity 513.0 850.3
Dividends distribution (96.1) (205.9)
Change in financial assets available for sale 160.2 (305.0)
Change in stock option reserve - (2.8)
Integration of CRF (6.6) -
Transfer of depositary bank business 16.5 -
Exchange rates differences and others (1.1) 0.3
Net profit 178.4 176.1
Closing shareholders' equity 764.3 513.0
The €160.2m increase in financial assets available for sale was principally due to a decrease in the negative reserve generated by fair value increases in securities holdings during the year. The negative reserve for financial assets available for sale totalled €169.9m at the end of December and amongst other items included:• €9.5m regarding losses on securities that were reclassified as
financial assets held to maturity during the first quarter of 2008.• €38.9m regarding losses on securities that were reclassified as
Loans & Receivables in the third quarter of 2008 following the Group’s decision to avail itself of the option provided for by the amendment to IAS 39 in the Annex to Regulation No. 1004/2008 issued by the European Commission on 15 October 2008.
These reserves are being amortised to profit or loss over the residual life of the respective securities in accordance with IAS 39 paragraph 54.
The €6.6m decrease regarded the net amounts paid for the acquisition of the Banca CR Firenze Personal Financial Adviser Network in the second quarter of the year. In accordance with the Group policy regarding business combinations under common control, which provides for the continuous recognition of such transactions in the accounts, the difference between the amounts paid to Banca CR Firenze (economic value determined by an independent expert) and the net book values of the assets transferred was recognised, being deducted from the reserves after tax.
The €16.5m increase was due to the amounts received for the transfer of Banca Fideuram’s depositary bank business to Intesa Sanpaolo Servizi Transazionali S.p.A., a company which is wholly owned by Intesa Sanpaolo. As a business combination transaction, the difference between the amounts received and the net book values of the assets transferred was likewise recognised, being added to the reserves after tax.
The Group did not hold any treasury shares at 31 December 2009. Neither Banca Fideuram nor any of the other companies included in the consolidation bought shares in the bank or its parent company Intesa Sanpaolo during 2009, either directly or through trust companies or third parties.
Reconciliation of parent company and Group shareholders’ equity and net profit(€m)
31.12.2009
Shareholders’ equity
including: Net profit
Parent company shareholders’ equity 694.2 128.0
Net profit of subsidiaries consolidated line-by-line 138.4 138.4
Change in consolidation reserve (2.4) -
Dividend income from Group companies - (154.5)
Write-back of intra-group goodwill (8.8) -
Write-back of intercompany securities sales 71.8 67.4
Valuation of subsidiaries’ available-for-sale financial assets (128.7) -
Other differences (0.2) (0.9)
Group shareholders’ equity 764.3 178.4
Committed to providing comprehensive information, the Group voluntarily calculates its consolidated regulatory and total capital requirements. At 31 December 2009, our Tier 1 Ratio was 13.1% and our Total Capital Ratio 13.6%.
32 Annua l Repor t 2009
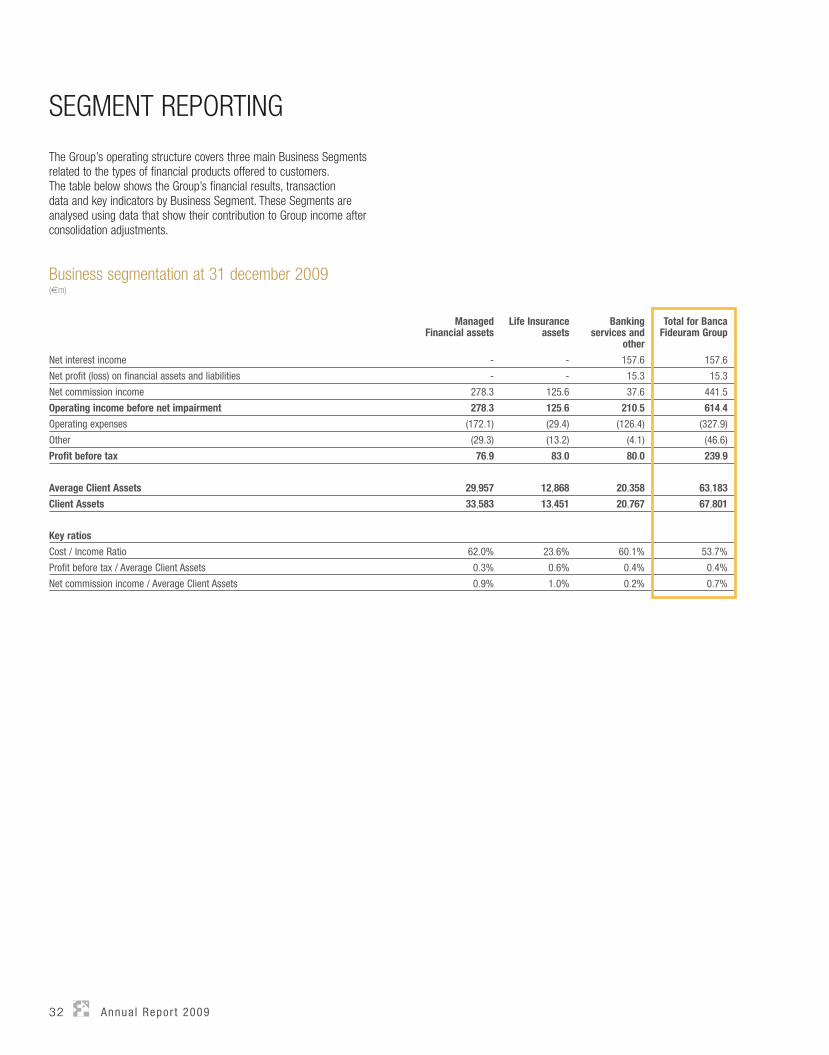
Business segmentation at 31 december 2009(€m)
Managed Financial assets
Life Insurance assets
Banking services and
other
Total for Banca Fideuram Group
Net interest income - - 157.6 157.6
Net profit (loss) on financial assets and liabilities - - 15.3 15.3
Net commission income 278.3 125.6 37.6 441.5
Operating income before net impairment 278.3 125.6 210.5 614.4
Operating expenses (172.1) (29.4) (126.4) (327.9)
Other (29.3) (13.2) (4.1) (46.6)
Profit before tax 76.9 83.0 80.0 239.9
Average Client Assets 29,957 12,868 20,358 63,183
Client Assets 33,583 13,451 20,767 67,801
Key ratios
Cost / Income Ratio 62.0% 23.6% 60.1% 53.7%
Profit before tax / Average Client Assets 0.3% 0.6% 0.4% 0.4%
Net commission income / Average Client Assets 0.9% 1.0% 0.2% 0.7%
SEGMENT REPORTING
The Group’s operating structure covers three main Business Segments related to the types of financial products offered to customers.The table below shows the Group’s financial results, transaction data and key indicators by Business Segment. These Segments are analysed using data that show their contribution to Group income after consolidation adjustments.

Directors ’ Repor t Financ ia l resu l ts 33
Managed Financial Assets SegmentThe Managed Financial Assets Segment covers the Group’s discretionary accounts and mutual fund business, which totalled €33.6bn at 31 December 2009 (49.5% of total client assets). In 2009, this segment generated €278.3m net commission income and contributed €76.9m to income from current operations. The ratio of net commission income to client assets (CA) was 0.9%, while the ratio of gross income to CA was 0.3%.
Managed Financial Assets(€m)
31.12.2009 31.12.2008 % change
Net interest income - - -
Net profit (loss) on financial assets and liabilities - - -
Net commission income 278.3 307.6 -9.5
Operating income before net impairment 278.3 307.6 -9.5
Operating expenses (172.1) (165.9) 3.7
Other (29.3) (26.9) 8.9
Profit before tax 76.9 114.8 -33.0
Average Client Assets 29,957 30,471 -1.7
Client Assets 33,583 27,724 21.1
Key ratios
Cost / Income Ratio 62.0% 53.4%
Profit before tax / Average Client Assets 0.3% 0.4%
Net commission income / Average Client Assets 0.9% 1.0%
Life Insurance Assets SegmentThis segment covers the Group’s life insurance and pension fund business, which totalled €13.4bn at 31 December 2009 (19.8% of total client assets). The net fee and commission income generated by this segment came to €125.6m and contributed €83.0m to income from current operations. The ratio of net commission income to client assets (CA) was 1%, while the ratio of gross income to CA was 0.6%.
Life Insurance Assets(€m)
31.12.2009 31.12.2008 % change
Net interest income - - -
Net profit (loss) on financial assets and liabilities - - -
Net commission income 125.6 130.9 -4.0
Operating income before net impairment 125.6 130.9 -4.0
Operating expenses (29.4) (32.0) -8.1
Other (13.2) (11.4) 15.8
Profit before tax 83.0 87.5 -5.1
Average Client Assets 12,868 13,509 -4.7
Client Assets 13,451 12,569 7.0
Key ratios
Cost / Income Ratio 23.6% 24.2%
Profit before tax / Average Client Assets 0.6% 0.6%
Net commission income / Average Client Assets 1.0% 1.0%
Banking Services and Other SegmentThe Banking Services and Other Segment covers the Group’s banking and financial services, together with its central departments, holding activities and finance activities, as well as - generally speaking - the coordination and control activities for its other operating segments.This segment includes non managed assets, mainly comprised of securities and current accounts, which totalled €20.8bn at 31 December 2009 (30.7% of total client assets).The contribution of this segment to profit before tax was €80.0m.
Banking Services and other(€m)
31.12.2009 31.12.2008 % change
Net interest income 157.6 158.2 -0.4
Net profit (loss) on financial assets and liabilities 15.3 (10.2) n.s.
Net commission income 37.6 29.9 25.8
Operating income before net impairment 210.5 177.9 18.3
Operating expenses (126.4) (129.2) -2.2
Other (4.1) (5.8) -29.3
Profit before tax 80.0 42.9 86.5
Average Client Assets 20,358 20,346 0.1
Client Assets 20,767 20,214 2.7
Key ratios
Cost / Income Ratio 60.1% 72.5%
Profit before tax / Average Client Assets 0.4% 0.2%
Net commission income / Average Client Assets 0.2% 0.1%
n.s.: not significant
34 Annua l Repor t 2009
OPERATIONS OUTSIDE ITALYAsset ManagementThe Banca Fideuram Group’s core asset management activities have been conducted in Luxembourg for over 40 years and have also been developed in Ireland in recent years. At 31 December 2009, 259 personnel were deployed in the companies providing asset management activities in the Group, almost two thirds of whom were employed outside Italy.
Fideuram Bank (Luxembourg)’s business is the custody of assets and settlement of transactions for institutional customers, provided through a select international network of approximately 40 corresponding banks. The bank is in particular responsible for managing the Banca Fideuram Group’s Luxembourg and Irish funds, for which it in addition acts as securities lending agent. The bank also provides important technological and organisational support for its affiliated companies outside Luxembourg in the form of information technology, administrative and back-office services. The funds managed by Fideuram Bank (Luxembourg) totalled €30.1bn at 31 December 2009.
Fideuram Gestions is the manager of the Luxembourg mutual funds marketed by Banca Fideuram and Sanpaolo Invest (Fonditalia, Interfund SICAV, Fideuram Fund and Fideuram Multimanager Fund). It is responsible for setting up, managing and administering the funds, as well as for calculating their net inventory values and for their risk management. The client assets in the 110 funds concerned totalled €28.9bn at 31 December 2009.
Sanpaolo Invest (Ireland) is the manager of the Irish UCITS III “harmonised” mutual fund distributed under the Ailis Funds name (formerly Sanpaolo Invest Funds) by Sanpaolo Invest SIM and, since the second half of 2009, by Banca Fideuram as well. During the year the company also launched three new funds under the Ailis umbrella and marketed them successfully to customers, while simultaneously launching a project for rationalising the number of other funds by modifying their investment objectives and merging several of them in a process that will be completed during the first half of 2010. The client assets by the company came to approximately €1.2bn at 31 December 2009.
During the year Fideuram Asset Management (Ireland) advanced the quality and efficiency of the operating and management processes related to its role as delegated manager of the collective savings products marketed by the companies in the Banca Fideuram Group (Luxembourg, Irish and Italian collective investment undertakings) and the insurance companies in the Intesa Sanpaolo Group (Irish insurance portfolios and Italian pension fund). Client assets increased significantly (from €27.2bn at the beginning of the year to approximately €34.5bn at 31.12.2009) as a result both of the acquisition of a management mandate for certain Banca Fideuram Group Italian mutual funds at the end of 2009 (€2.7bn) and their successful distribution coupled with strong management performance. Lastly, the introduction of advanced IT systems for investment risk management and control was completed in 2009.
Private BankingSwiss subsidiary Fideuram Bank (Suisse) was impacted in the final months of 2009 by the effects of article 13-bis of Italian Decree Law No. 78/2009, issued to promote the regularisation and consequent repatriation of Italian citizens’ financial assets held outside Italy (also know as the “third tax shield” or “Scudo Fiscale ter”). The number of Italian customers availing themselves of the tax concessions provided for by this legislation caused a fall in client assets, which declined from €1.3bn at the beginning of the year to €0.8bn at 31.12.2009. Notwithstanding this decline in client assets, profitability continued to be positive.
Fideuram Bank (Monaco), our subsidiary in the Principality of Monaco, launched its banking business on 1 December 2008 and ended 2009 with €12.5m client assets.
TreasuryPart of the Group’s treasury and finance activities are conducted in France. These activities are carried out by subsidiary Euro-Trésorerie, which had securities holdings of approximately €1.4bn at the end of 2009 (€2bn at 31 December 2008). The implementation of the portfolio restructuring plan formulated in late 2008 involved the arm’s-length sale of approximately €0.5bn securities to Banca Fideuram. The Banca Fideuram Board of Directors’ meeting of 12 May 2009 authorised the subscription under arms-length conditions of sixteen fixed-rate bonds issued by Euro-Trésorerie with a total nominal value of €414m and maturities between June 2010 and November 2014. These bonds will be used to ensure an appropriate balance is maintained between the maturity structures of assets and liabilities, as provided for in the plan.
Directors ’ Repor t Human Resources , products and ser v ices 35
HUMAN RESOURCES, PRODUCTS AND SERVICESHUMAN RESOURCESMore detailed information on our human resources can be found in the related paragraphs of the section “Social Responsibility and sustainable development”.
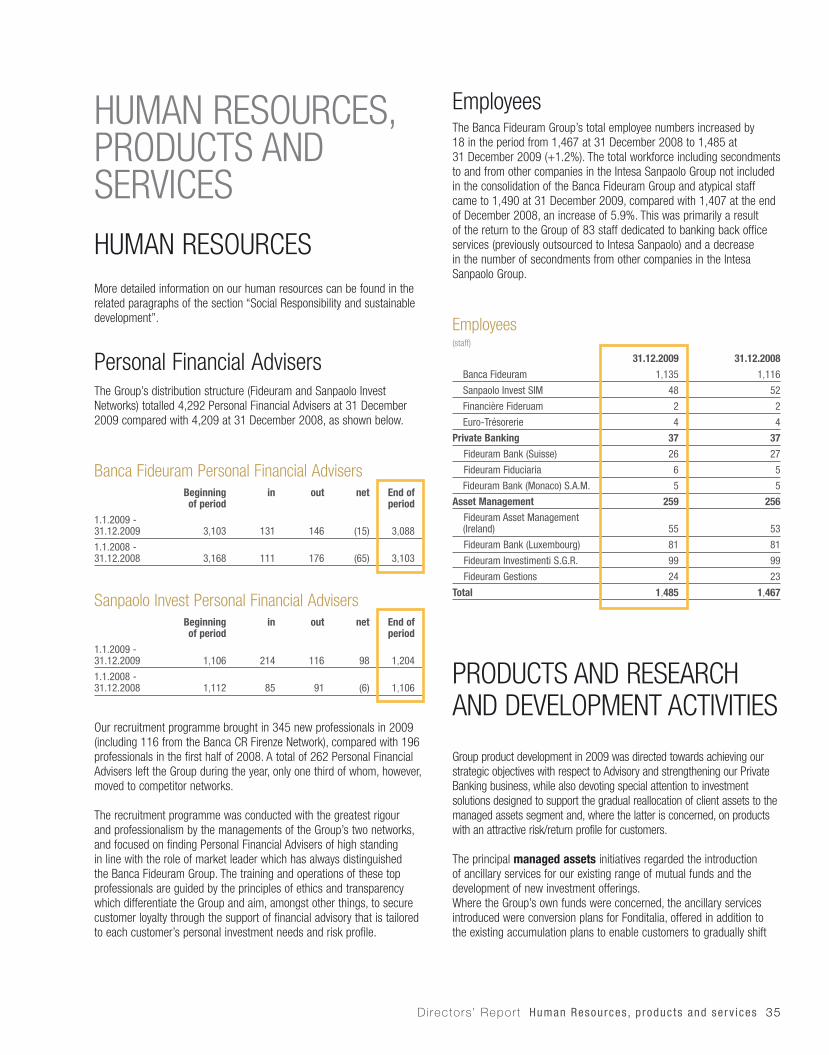
Personal Financial AdvisersThe Group’s distribution structure (Fideuram and Sanpaolo Invest Networks) totalled 4,292 Personal Financial Advisers at 31 December 2009 compared with 4,209 at 31 December 2008, as shown below.
Banca Fideuram Personal Financial AdvisersBeginning of period
in out net End of period
1.1.2009 - 31.12.2009 3,103 131 146 (15) 3,088
1.1.2008 - 31.12.2008 3,168 111 176 (65) 3,103
Sanpaolo Invest Personal Financial AdvisersBeginning of period
in out net End of period
1.1.2009 - 31.12.2009 1,106 214 116 98 1,204
1.1.2008 - 31.12.2008 1,112 85 91 (6) 1,106
Our recruitment programme brought in 345 new professionals in 2009 (including 116 from the Banca CR Firenze Network), compared with 196 professionals in the first half of 2008. A total of 262 Personal Financial Advisers left the Group during the year, only one third of whom, however, moved to competitor networks.
The recruitment programme was conducted with the greatest rigour and professionalism by the managements of the Group’s two networks, and focused on finding Personal Financial Advisers of high standing in line with the role of market leader which has always distinguished the Banca Fideuram Group. The training and operations of these top professionals are guided by the principles of ethics and transparency which differentiate the Group and aim, amongst other things, to secure customer loyalty through the support of financial advisory that is tailored to each customer’s personal investment needs and risk profile.
EmployeesThe Banca Fideuram Group’s total employee numbers increased by 18 in the period from 1,467 at 31 December 2008 to 1,485 at 31 December 2009 (+1.2%). The total workforce including secondments to and from other companies in the Intesa Sanpaolo Group not included in the consolidation of the Banca Fideuram Group and atypical staff came to 1,490 at 31 December 2009, compared with 1,407 at the end of December 2008, an increase of 5.9%. This was primarily a result of the return to the Group of 83 staff dedicated to banking back office services (previously outsourced to Intesa Sanpaolo) and a decrease in the number of secondments from other companies in the Intesa Sanpaolo Group.
Employees(staff)
31.12.2009 31.12.2008
Banca Fideuram 1,135 1,116
Sanpaolo Invest SIM 48 52
Financière Fideruam 2 2
Euro-Trésorerie 4 4
Private Banking 37 37
Fideuram Bank (Suisse) 26 27
Fideuram Fiduciaria 6 5
Fideuram Bank (Monaco) S.A.M. 5 5
Asset Management 259 256
Fideuram Asset Management (Ireland) 55 53
Fideuram Bank (Luxembourg) 81 81
Fideuram Investimenti S.G.R. 99 99
Fideuram Gestions 24 23
Total 1,485 1,467
PRODUCTS AND RESEARCH AND DEVELOPMENT ACTIVITIES
Group product development in 2009 was directed towards achieving our strategic objectives with respect to Advisory and strengthening our Private Banking business, while also devoting special attention to investment solutions designed to support the gradual reallocation of client assets to the managed assets segment and, where the latter is concerned, on products with an attractive risk/return profile for customers.
The principal managed assets initiatives regarded the introduction of ancillary services for our existing range of mutual funds and the development of new investment offerings.Where the Group’s own funds were concerned, the ancillary services introduced were conversion plans for Fonditalia, offered in addition to the existing accumulation plans to enable customers to gradually shift

36 Annua l Repor t 2009
their assets to higher-risk investments with the reassurance of tight risk control through a programme that specifies the frequency, duration and amount converted from any one fund to other funds.On the new product front, the Fonditalia range of funds was extended with the introduction of Fonditalia Flexible Emerging Markets, a total return fund able to combine the best opportunities of its reference market with a moderate risk profile.We likewise offered the first three formula funds in the Irish Ailis investment vehicle (created by renaming the Sanpaolo Invest Ireland Fund), solutions with a coupon structure and capital protection upon maturity designed to exploit the recovery in the markets:• Ailis Coupon Plus, a six-year fund that features five fixed-rate annual
coupons and a final gross coupon linked to the performance of the DJ EURO STOXX 50 index.
• Ailis Cedola Dinamica, a six-year fund that features one fixed-rate gross annual coupon and five gross annual coupons linked to the performance of the DJ EURO STOXX 50.
• Ailis Rendimento Misto, a five-year fund with predetermined half-yearly coupon payments for the first two years (four coupons) that is then linked to the performance of the Euribor in subsequent years.
The funds are converted into a conservative money market investment at the end of the investment period.In addition, we made a number of changes revising our Fideuram Fund Luxembourg fund, converting two existing funds of limited commercial interest to benefit from new opportunities in the market:• Fideuram Fund Commodities created to enhance our range of
sector funds• Fideuram Fund Marshall Wace TOPS, which is sub-investment
management agreement to Marshall Wace, was created to provide a fund offering alternative investment strategies (long/short equity).
Enhancing our range of Third-Party Mutual Funds, we began marketing the following new funds in 2009:• Financière de L’Echiquier (Fondo Patrimoine and Fondo Aggressor)• BNP Paribas (Parvest SICAV)• SGAM Fund• Carmignac (Carmignac Portfolio SICAV, Carmignac Court Terme,
Carmignac Emergents, Carmignac Investissement, Carmignac Patrimoine, Carmignac Profil Réactif 75, Carmignac Profil Réactif 50 and Carmignac Sécurité)
• BNY Mellon Global Funds• Franklin Templeton Investment Funds• Oyster Funds• Giotto Lux• DWS Invest SICAV.
The Group’s insurance assets range benefited from changes increasing the efficiency of our Skandia external-fund unit linked policies. This saw Fideuram/Sanpaolo Invest’s In Prima Persona and Fideuram/Sanpaolo Invest’s In Persona move from a weekly to a daily investment plan which makes the investment timing the same as those hitherto available for à la carte funds only.
On the non-managed assets front, we completed a series of important initiatives in 2009 regarding both our range of banking services and our range of managed financial instruments.As part of the process of improving the lending services offered to customers, we launched an important lending offering development project at the end of 2008, which generated its first results during 2009.In June, we launched the Credit Line range of Banca Fideuram unsecured lines of credit for high-profile retail customers, available
in two versions - Credit Line and Credit Line Plus - depending on the borrower’s assets. In October, we launched Credit Shield, a line of credit secured by financial products subscribed using funds repatriated as a consequence of article 13-bis of Italian Decree Law No. 78/2009 (“third tax shield” or “scudo fiscale ter”) or arising from the repatriation of capital. Lastly, December saw us launching the new Lombard One secured lines of credit, which offer rapid disbursement, customised conditions and greater flexibility in a range of products that can be secured. Initiatives regarding our securities products in 2009 saw us marketing a large number of bond loans issued by the Intesa Sanpaolo Group. In addition, our range of certificates was extended with the issue of two new Banca IMI five-year certificates in October 2009:• Euro Equity Protection CAP Certificates on the DJ EURO STOXX 50,
with 100% capital protection;• Euro Equity Protection CAP Certificates on the DJ Stoxx 600 Health
Care, with 95% capital protection.Lastly, Banca Fideuram equipped itself with dedicated instruments to support the capital repatriated as an effect of article 13-bis of Italian Decree Law. No. 78/2009:• The Fideuram Omnia asset management service was extended with
the Ego Personal Scudo line.• A number of private insurance products were developed in conjunction
with Skandia and Generali Pan Europe. • Our banking offering was enhanced with the introduction of Fideuram
Conto Scudo 2009, while our lending offering saw the launch of Credit Shield as previously announced.
• The Group’s managed assets products were extended with three dedicated bond issues, two mixed-rate bonds (fixed coupon in first year and floating coupon in subsequent years) and a bond with a yield upon maturity that is linked to a basket of stock market indices (S&P 500, DJ EURO STOXX 50, Nikkei 225, FTSE MIB and MSCI Emerging Markets).
With the coming into force of the Markets in Financial Instruments Directive (MiFID) in November 2007, the Group centred its service model on advisory, providing a service for all its customers and through all its service channels that is based on customer profiling for maximum risk level and on ascertaining that there is an appropriate match between each customer’s financial profile and total asset risk. The Group launched its new fee-paying customised advanced advisory service, named SEI, in mid-June 2009. After six months, over 9,000 customers were subscribed to the service (72% Banca Fideuram and 28% Sanpaolo Invest) served by approximately 1,100 active Personal Financial Advisers. SEI charges commission for activating the service and regular annual commission, both calculated in relation to the customer’s assets managed by the Group and their potential. SEI customers receive regular clear and detailed statements which allow them to track their assets’ progress towards their goals and to monitor the suitability of their asset risks with respect to their financial profile. Combining a distinctive work method, in-depth training and an innovative information technology platform, SEI enables the group to make the most of its Personal Financial Advisers’ professionalism and their role as financial advisers. The “SEI method” is centred on the customer and their needs, which are segmented into six areas: protection, liquidity, reserve, pension, investment and extra-return. SEI provides our Personal Financial Advisers with important support for analysing customer needs, for identifying optimum solutions that meet them and for monitoring their progress over time, while at the same time constantly monitoring the

Directors ’ Repor t Human Resources , products and ser v ices 37
overall risk level of their assets in full compliance with the regulations in force introduced by the MiFID Directive. A further strength of the service is that SEI can be extended to provide a systematic analysis of all a customer’s assets even if they are with other financial brokers.We plan to substantially increase the number of customers subscribed to the SEI service in 2010 and to further develop the IT platform supporting our Personal Financial Advisers in delivering the service. We shall in addition be expanding the process for assessing the appropriateness of the investments recommended as part of our core and advanced advisory services to the benefit of our customers, incorporating a set of variables that take the compatibility of each financial instrument and customer into account. The process will take the credit risk, complexity and liquidity of the financial instruments into account as well their market risk, together with the frequency of the transactions planned.
SYSTEMS AND INFORMATION MANAGEMENTA number of organisational actions were launched at the beginning of 2009 to rationalise and strengthen the Group operating structure, bringing a number of activities that had previously been outsourced to Intesa Sanpaolo back into the Group, namely the banking Back Office and related organisational support, the management of requests by the Judicial Authorities, the management of online users and the management of archive searches. We also continued the activity of mapping, measuring and implementing a standardised design procedure for all our corporate processes, adopting a new methodology for representing processes and using the Intesa Sanpaolo target application ARIS. This activity, which will continue in 2010, mainly involved mapping those operating processes impacted by Italian law 262/05, producing the Group’s Financial Management Governance reference documents.
We updated the service contract between Intesa Sanpaolo Group Services and Banca Fideuram, and drew up new service contracts between Intesa Sanpaolo Group Services and the companies in the Banca Fideuram Group. Following the updating of the contract with Intesa Sanpaolo, Banca Fideuram also updated its service contracts with the other companies in the Group, which amongst other things led to the revision of certain operating protocols. During 2009, Information Systems managed approximately 25 projects provided for in the Capital Budget with a total spend of approximately €16m. In addition, a structured IT demand management process was launched that aims to contain costs and improve the allocation of resources. Approximately 280 advanced maintenance interventions were carried out on our principal applications as part of this process, some 70 of which were conducted with the involvement of Intesa Sanpaolo Group Services. The operating costs managed by Information Systems during the year for application monitoring and management and user assistance totalled approximately €11m. Expenditure management was strengthened further and a specialist system was launched for the management of supplier contracts that require precise monitoring of Service Level Agreements and dedicated review activities for reducing costs, improving service and including ancillary services. Software quality improvement initiatives were also launched and
completed in the year, enabling the Group to achieve a substantial reduction in the number of tickets, particularly those regarding the SIM PB application.
The launch of our fee-paying SEI advanced financial advisory service and “Key Client” dedicated Private Banking service supported by its own application platform required us to introduce over twenty automatic checks and carry out more than thirty interventions to ensure the systems are continually aligned and provide full data consistency including with respect to historical data (not previously included in customer reporting).
The initiatives launched in 2008 were consolidated to bring forward the availability of SIM PB customer position system data and the systems it feeds (SEI and in the future Key Client) to the beginning of the day. The maintenance of this service standard is ensured through both the optimisation and monitoring of nighttime procedures, with dedicated monitoring shifts that enable any data reception problems to be solved. The daily opening hours of our IT Help Desk (User Assistance) were likewise extended by three hours with a view to improving Network service levels.
A number of different strategic projects implementing the guidelines of the 2008-2011 Industrial Plan were advanced during the year for which Organisation and Security acts as Program Management Office, taking care of monitoring activities and ensuring that planned schedules are respected, that the interventions are launched and the specified deliveries issued as agreed. The main projects concerned were as follows: • Integration of the Banca CR Firenze Personal Financial Adviser
Network: This project adapted the Fideuram and Sanpaolo Invest Networks’ IT systems to sell the products of eight new third-party providers previously in the Banca CR Firenze product range and migrated the Personal Financial Advisers, customers and products included in the transfer of the company division.
• Private Banking Project: This project set up our new Private Banking Centres (the Turin and Milan Centres were opened in 2009), developing a new service model for Private Banking Customers that offers advanced products and services, and creating a dedicated unit (Private Banking Service Line). The Key Client project setting up an advanced advisory and reporting system for Private Banking customers formed part of this and was completed in January 2010, joining SIM PB (base advisory) and SEI (advanced advisory) to complete the Group’s range of specialist IT tools dedicated to different advisory levels.
• SEI Project: This project saw us releasing the acquisition system for our new single advisory contract together with the related system for calculating subscription commissions and a reporting system that sends documents directly to the customer (welcome letter, diagnosis and SEI quarterly monitoring report). The work undertaken included enhancing the SEI application platform for managing advanced advisory services with functions such as extending the calculation of yields and returns, launching a guided portfolio builder, adding new alerts, the automatic population of the model pyramid and the management of Fideuram Fiduciaria customers.
• Lending Project: This project developed a new Lending offering, including new products (a prearranged unsecured line of credit and new secured loan product), a new loan process, additional forms of collateral and the introduction of remuneration for the Network.
• Depository Bank Project: This project concerned the transfer to Intesa Sanpaolo Servizi Transazionali of Banca Fideuram’s Depositary Bank
38 Annua l Repor t 2009
management activities regarding the Italian Mutual funds managed by Fideuram Investimenti and the Fideuram Pension Fund managed by Eurizon Vita.
• New Appropriateness Model Project: This project managed the development of the appropriateness model to ensure its compliance with the regulations in force (MiFID and higher-level implementation specifications introduced by a Level III document issued by the Italian National Commission for Listed Companies and the Stock Exchange - CONSOB) and alignment with the Intesa Sanpaolo model. The new financial appropriateness model is based on a multivariate approach for ensuring consistency between the customer profile and a series of investment portfolio indicators.
• Money Managers Front End Project (FOX): The migration of the Group’s Irish, Luxembourg and Italian funds to the new Bloomberg POMS Front Office system was completed for our Asset Management companies in the year, substantially increasing the variety of instruments available to money managers, while simultaneously advancing process standardisation and Compliance.
We also launched a Management Dashboard (“Cruscotto Direzionale”) in 2009 with the aim of providing overview information on the main financial and management indicators to support Top Management with monitoring the Group’s main corporate and business phenomena. In compliance with the Privacy Authority’s requirements, the Group completed the required annual updating of the Security Programme Document drawn up in accordance with article 34 of Italian Legislative Decree 196/03 (Codice in materia di protezione dei dati personali - “Code regarding the protection of personal data”). Lastly, we updated the Group Business Continuity Plan (BCP) setting out a series of organisational and operational measures designed to help ensure business continuity in crisis situations caused by disasters that could make work premises inaccessible and essential resources unavailable.
SUPPLEMENTARY INFORMATIONINTERNAL AUDITINGBanca Fideuram has a dedicated Compliance unit which reports directly to the Corporate Risk Manager, who is also the Bank’s Compliance Officer. The Compliance Officer reports functionally to the Board of Directors and hierarchically to the Managing Director.
Compliance activities are governed by internal regulations, approved by the Bank’s Board of Directors on 25 August 2009, adopting the Intesa Sanpaolo “Group Compliance Guidelines” and adapting them to the Banca Fideuram Group’s corporate context and applicable regulations (“Regulations implementing Group Compliance Guidelines”).
The Compliance Unit is directly responsible for performing all the tasks that current regulations require of a compliance unit with respect to the regulatory frameworks considered of greatest relevance by the Supervisory Authorities or regarding which it is nevertheless considered necessary to provide centralised compliance risk management (investment services, insurance and pensions brokerage, market abuse, conflicts of interest, personal transactions, solicitation to the public, transparency of contractual conditions, family loans, lending of money at exorbitant interest rates, improper business practices, systems of payment and the administrative responsibility of legal persons). When compliance duties are performed by other company departments and units with the necessary competencies (insider list, related parties, duties of bank group directors, competition protection regarding mergers, understandings and abuses of dominant positions, privacy, safety at work and environmental protection), the Compliance Unit’s role is to provide effective guidelines and methodology rules for managing and assessing compliance risk, for coordinating compliance initiatives (including for the purpose of establishing risk priorities), for auditing their effective application by related departments and units, and for producing integrated information for the Board of Directors.
The aforementioned Regulations implementing Group Compliance Guidelines require the Compliance Unit to provide the Board of Directors with the following reports:• An annual report identifying and assessing the main compliance
risks to which the Bank is exposed and an annual programme setting out the related management interventions addressing both any shortcomings (in policies, procedures, implementation or execution) to have emerged in the course of the company’s business, and the need to tackle any new compliance risks identified in the course of the annual risk assessment.
• A half-year report detailing the activities carried out, any critical situations identified and corrective actions formulated.
The Compliance Unit’s activities during 2009 in accordance with current legislation and the Regulations implementing Group Compliance Guidelines aimed to:
Directors ’ Repor t Supplementar y in format ion 39
• Identify the laws and regulations applicable to the bank and measure/assess their impact on company processes and procedures.
• Propose organisational and procedural changes to ensure appropriate management of any compliance risks identified.
• Monitor the effectiveness of the organisational changes suggested to prevent compliance risk.
• Assess in advance the compliance of all the bank’s innovative projects with applicable legislation.
• Provide ongoing advisory and support for the bank’s other corporate units and management bodies in all areas where compliance risk is significant.
Internal auditing is the responsibility of the Audit Department, which comprises the following organisational units:• The Networks Audit Unit, which is responsible for auditing the Personal
Financial Advisers in the Fideuram and Sanpaolo Invest Networks, as well as the Group’s peripheral banking structures (Area Main Branches, Delivery Points and Service Points).
• The Central Departments and Subsidiaries Audit Unit, which is responsible for auditing the activities of the Group’s central departments and subsidiaries, including with respect to ICT service processes (as an outsourcer of the internal audit unit), as well as for monitoring the correct performance of internal audits.
The Head of the Audit Department reports functionally to the Board of Directors and hierarchically to the Managing Director. In addition, the Head of the Audit Department is required to inform the Internal Audit Committee and Board of Directors about the Department’s activities, reporting to the former on a monthly basis and to the latter on a half-yearly basis, also doing so with respect to activities carried out on behalf of Group Companies.
Audit activities follow an annual programme approved by a specific resolution of the Board of Directors following examination by the Internal Audit Committee. During 2009, 802 audits were carried out across all the Personal Financial Adviser operating areas of both distribution networks (601 for Banca Fideuram and 201 for Sanpaolo Invest), 256 of which (approximately 32% of the total) involved further on-the-spot investigations (186 for Banca Fideuram and 70 for Sanpaolo Invest). A total of 5,080 alerts from the Audit Information System (AIS) were noted and individually validated (3,940 for Banca Fideuram and 1,140 for Sanpaolo Invest), concerning 2,205 Personal Financial Advisers (1,616 in the Fideuram Network and 589 in the Sanpaolo Invest Network). The Department examined 335 cases of customer complaints (272 for Banca Fideuram and 63 for Sanpaolo Invest) to investigate the work of our Personal Financial Advisers.
In accordance with the work plan presented to the Board of Directors, the Department carried out audits on the Group’s central departments, main branches and peripheral branches in the period, as well as on those Group companies (both in and outside Italy) which outsource their internal audit activities to the Audit Department.
Working to help ensure full compliance with the MiFID Directive, the Audit Department provided support for the evaluation of the internal audit system and its related procedures.The Head of the Audit Department also carried out dedicated activities as Anti-Money Laundering Officer to ensure compliance with anti-money laundering legislation, including the recently-introduced EU Third Directive.
MODEL OF FINANCIAL MANAGEMENT GOVERNANCE
Reference regulatory frameworkItalian Law No. 262/2005 significantly strengthened the protection afforded savings invested in financial instruments. Law No. 262/2005 forms part of a legislative drive that has steadily strengthened Italy’s governance systems through Legislative Decree No. 231/2001, the European Financial Information Directives (Market Abuse, Financial Statements, Transparency and MiFID Directives), the Italian Stock Exchange’s new Code of Self Discipline and the Bank of Italy’s Regulatory Requirements regarding auditing and corporate governance. The legal framework outlined above underwent subsequent changes as a result of Italian Legislative Decree No. 195 of 6 November 2007, implementing the EU Transparency Directive (Directive No. 2004/109/EC). Said legislative decree amongst other things extended the scope of application of article 154 bis of the Italian Finance Consolidation Act (TUF) to all “listed issuers having Italy as their member state of origin” in accordance with article 1, subparagraph 1, w-quater of the TUF, and increased the certification statements required of Senior Management and the Senior Manager Responsible for the Preparation of the Company Accounts.Lastly, Italian Legislative Decree No. 173 of 3 November 2008 implementing EU Directive 2006/46/EC introduced a number of specific provisions regarding financial statements and corporate governance, specifically by amending a number of provisions of the Italian Civil Code, Finance Consolidation Act (TUF) and other legislative provisions regarding the financial statements of banks and insurance companies.The main new provisions introduced by the decree concern the content of the notes to financial statements, the accounting principles used to prepare financial statements, the information on corporate governance and the extension of the independent auditors’ opinion on consistency to certain information on governance.
Organisational ModelBanca Fideuram has aligned its By-Laws, appointed a Senior Manager Responsible for the Preparation of the Company Accounts and formulated dedicated guidelines and coordination rules for its Model of Financial Management Governance suitable for continuously monitoring the suitability and effective application of its administrative and accounting procedures.Our Organisational Model was developed taking into account international frameworks such as the recommendations of the Committee of Sponsoring Organizations of the Treadway Commission (COSO) and the Control Objectives for IT and related technology (COBIT)1 The Banca Fideuram Senior Manager Responsible for the Preparation of the Company Accounts has managed the model using a dedicated unit and other competent company units and departments with specific roles in the bank’s Internal Audit System.
Certification of the 2009 annual financial statementsThe Banca Fideuram Senior Manager Responsible for the Preparation of the Company Accounts has managed the effective implementation of the Model of Financial Management Governance. The scope of application of said model in the Banca Fideuram Group has been specified in relation to qualitative and quantitative parameters which have made it possible
1. The Committee of Sponsoring Organizations of the Treadway Commission is a US body dedicated to improving the quality of company information by providing guidance on ethical standards and an effective system of corporate governance and organisation. The Control OBjectives for IT and related technology is a set of guidance materials developed by the IT Governance Institute, a US body that aims to develop and improve corporate standards in the IT sector.

40 Annua l Repor t 2009
Group managed assets grew in the last quarter of the year and will already impact positively on net commission income in the first quarter of 2010. It is also envisaged that increased profit will be generated by the systems now in place for our SEI Advanced Advisory Service and customised activities for Private Banking customers.
The main risks and uncertainties foreseeable for 2010 are entirely related to the weakness in the real economy and the tensions still present in the financial markets which it is, however, envisaged will gradually attenuate considering the positive signs that had already emerged in the second half of last year and now make it likely that net profit will be higher than in 2009.
The Board of Directors Rome, 12 March 2010
to identify the companies considered significant for the purposes of providing financial information and to identify the relevant corporate processes. The processes thus selected were assessed in relation to potential risk in order to determine the appropriate analytical level for the methods of analysis adopted. The activities performed in the 2009 financial year regarded Banca Fideuram, Fideuram Investimenti SGR, Fideuram Gestions and Euro Trésorerie. The audits carried out regarding the 2009 financial year concerned those processes assessed as posing the greatest potential risk in the areas of financial and insurance product distribution, product sales channel management by the Personal Financial Adviser Networks, Finance, Risk Control and Planning and Monitoring, as well as various different business support processes, the processes for managing the Group’s technological infrastructure and the applications for its administrative processes.
Upon completion of the activities for the 2009 financial year auditing the suitability of the administrative and accounting procedures and the effectiveness of the related controls, as well as the suitability of the organisational solutions in place, the system of internal controls on the financial information of Banca Fideuram and its subsidiaries was considered to be suitable.
SUBSEQUENT EVENTS AND OUTLOOKOn 23 February 2010, Intesa Sanpaolo’s Board of Management and Supervisory Board decided - in accordance with their respective competencies - to embark on the process for listing Banca Fideuram and a related global sharing offering. The Banca Fideuram Board of Directors approved said course of action for the aspects under its remit on 25 February 2010.In the recent past, despite obviously being affected by the crisis in the markets, the Bank launched and for the most part completed a series of management interventions increasing its independence in the Group and improving its prospective competitive positioning.
The status of listed company would also confer additional benefits in terms of greater visibility on the international financial markets, increased financial capital and greater decision-making autonomy and independence.


SOCIAL RESPONSIBILITY AND SUSTAINABLE DEVELOPMENT

44 Annua l Repor t 2009
REPORTING PRINCIPLESThis section has been prepared in accordance with the G3 reporting guidelines of the Global Reporting Initiative (GRI), which are the main international reference model for social and environmental reporting.
■ MATERIALITYIn deciding the topics to be covered, every element that significantly influences stakeholder valuations and decisions was examined in line with our Mission Statement.
■ INCLUSIVENESSAll the company units involved in the reporting process engaged in an ongoing dialogue with stakeholders in order to meet their expectations.
■ SUSTAINABILITYThe Banca Fideuram Group is committed to the concept of sustainable development, viewing its own business in a wider context.
■ COMPLETENESSThe information presented herein refers to the companies included in the consolidation of the Banca Fideuram Group at 31 December 2009 unless stated otherwise. All figures shown refer to the period 1/1/2009 - 31/12/2009.This section also presents qualitative information on significant events in the early months of 2010.
■ BALANCEThe information presented here in covers the positive and negative aspects of our resultes in the year to enable a complete assessment of the Group’s performance.
■ COMPARABILITYThe figures presented herein are, where possible, compared with those for the previous financial year in order to enable stakeholders to analyse changes in the Group’s performance.
■ ACCURACYThe figures presented herein are the result of detailed and direct monitoring. Specific notes indicate where estimates have been used. The information on Distribution of Value was prepared using the data presented in the Consolidated Financial Statements at 31 December 2009.
■ TIMELINESSThis information is published every year and made available to stakeholders on our company website on the same day as the Banca Fideuram Board of Directors approve it together with the financial statements.
■ CLARITYThe information in this document is expressed in a simple and accessible manner, so that it can be understood by all stakeholders. The document is translated into English so that it can also be read by non-Italian stakeholders.

Socia l Responsib i l i ty Repor t ing p r inc ip les / Group pro f i le 45
GROUP PROFILEVALUESBanca Fideuram adopts the Code of Ethical Conduct of its parent company Intesa Sanpaolo, sharing and committing itself to the same values as the Intesa Sanpaolo Group. The values set out in the Code of Ethical Conduct are an expression of the rich corporate cultures which are the living heritage of the Intesa Sanpaolo Group. Banca Fideuram and its Personal Financial Advisers daily work is thus not only founded on and in accordance with the guiding principles and general values in the Code of Ethical Conduct, but also rooted in the values that distinguish the bank’s culture and tradition, namely.
SHORT HISTORY1968 Fideuram acquired by Istituto Mobiliare Italiano (IMI) in order to
operate in the mutual fund sector, taking over the business of International Overseas Services (IOS). Fideuram offered Italian investors the Fonditalia and Interfund “historical” Luxembourg mutual funds through a Network of approximately 300 Personal Financial Advisers.
1984 Fideuram started offering its first Italian mutual funds: Imirend and Imicapital.
1992 Banca Fideuram formed through the merger of two companies in the IMI Group: Banca Manusardi, which was listed on the Milan stock exchange, and Fideuram. The shares continued to be listed under the new company name.
1996 Banca Fideuram included in the MIB 30 Italian blue-chip index.
1997 Banca Fideuram launched a personalised financial planning service with an advanced technological platform to the benefit of its customers. This service was given the English name “personal financial planning”.
1998 Establishment of subsidiary Fideuram Bank (Luxembourg).
2000 Banca Fideuram extended its activities into France with the acquisition of the Wargny Group.
2001 Establishment of subsidiary Fideuram Bank (Suisse) in Switzerland.
2002 Banca Fideuram acquired Sanpaolo Invest SIM.
2004 Insurance subsidiary Fideuram Vita was transferred to Assicurazioni Internazionali di Previdenza S.p.A. (now EurizonVita).
2005 Sanpaolo IMI (now Intesa Sanpaolo) transferred its holding in Banca Fideuram to the newly-established company Eurizon Financial Group S.p.A., controlled directly by Sanpaolo IMI.
2006 Banca Fideuram’s operations support services were centralised in Universo Servizi S.p.A. (subsequently Eurizon Solutions). Eurizon Financial Group S.p.A. launched a public purchase offer to buy all the shares in Banca Fideuram.
2007 Following Eurizon Financial Group’s successful public purchase offer, Borsa Italiana delisted Banca Fideuram shares from its Mercato Telematico Azionario electronic stock market and Banca Fideuram was brought under the full ownership and direct control of Intesa Sanpaolo with the reorganisation of the Eurizon Group’s business. The activities and specialist units previously centralised in the Eurizon Financial Group were brought back within Banca Fideuram, as were the operations support units previously sold to Eurizon Solutions.
2008 Banca Fideuram celebrated a history of 40 years’ leadership in its sector. A history in which the bank’s role developed from the sale of products to the provision of investment advisory services which provide its customers with solutions that are customised to meet their needs. Completion of the process for converting Fideuram Bank (Monaco) SAM, formerly Fideuram Wargny Gestion SAM, into a bank. Banque Privée Fideuram (subsequently Fideuram France S.A.) returned its banking license.
2009 As part of the activities for reorganising the distribution channels within the Intesa Sanpaolo Group, the Banca CR Firenze Personal Financial Adviser Network was integrated in that of subsidiary Sanpaolo Invest SIM.
The Group launched its SEI advanced advisory service in June, issuing and distributing the new single advisory and sale contract to the Fideuram and Sanpaolo Invest Networks, which enables them to tailor the financial planning and risk management services offered to their customers’ different and changing needs. On 16 October 2009, the merger of Fideuram France S.A. and Financière Fideuram S.A. was completed. The bank’s first two Private Banking Centres were opened in Turin and Milan in October and November respectively. Lastly, the transaction transferring Banca Fideuram’s Depositary Bank division to Intesa Sanpaolo Servizi Transazionali S.p.A. as part of the project for centralising the Intesa Sanpaolo Group’s Securities Services business in a single company was completed in December.
■ The Centrality of the Individual Understanding and valuing individual qualities in relations between our Personal Financial Advisers and our Customers and between Banca Fideuram and our Personal Financial Advisers
■ Professional excellence Continuous improvement of our knowledge and ability to use it in providing advisory services■ Openness to the new Readiness to embrace socioeconomic change and make this an added value of the service we offer■ Systematic approach Commitment to developing solutions that comprehensively meet customer needs■ Dedication to quality of service Attention to upholding and improving every aspect, both tangible and intangible, of the bank’s service
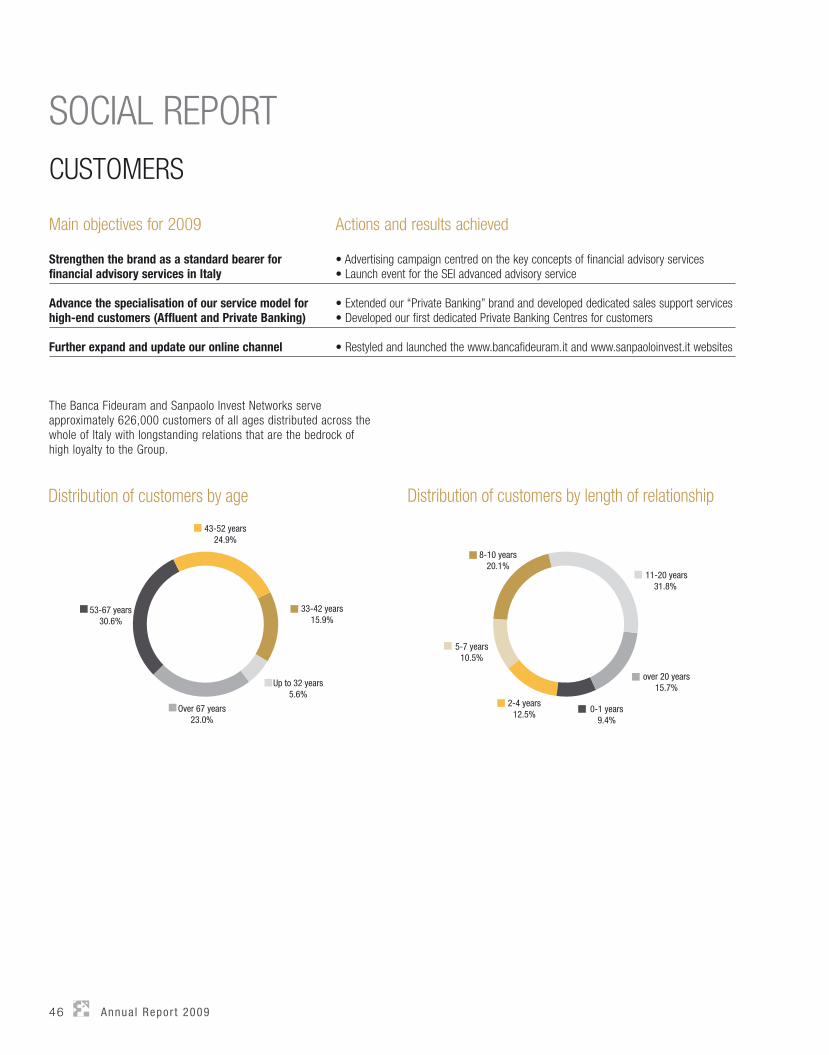
46 Annua l Repor t 2009
The Banca Fideuram and Sanpaolo Invest Networks serve approximately 626,000 customers of all ages distributed across the whole of Italy with longstanding relations that are the bedrock of high loyalty to the Group.
Distribution of customers by age
Over 67 years23.0%
53-67 years30.6%
43-52 years24.9%
33-42 years15.9%
Up to 32 years5.6%
over 20 years15.7%
0-1 years9.4%
2-4 years12.5%
5-7 years10.5%
8-10 years20.1%
11-20 years31.8%
Distribution of customers by length of relationship
SOCIAL REPORTCUSTOMERS
Main objectives for 2009 Actions and results achieved
Strengthen the brand as a standard bearer for financial advisory services in Italy
• Advertising campaign centred on the key concepts of financial advisory services• Launch event for the SEI advanced advisory service
Advance the specialisation of our service model for high-end customers (Affluent and Private Banking)
• Extended our “Private Banking” brand and developed dedicated sales support services• Developed our first dedicated Private Banking Centres for customers
Further expand and update our online channel • Restyled and launched the www.bancafideuram.it and www.sanpaoloinvest.it websites
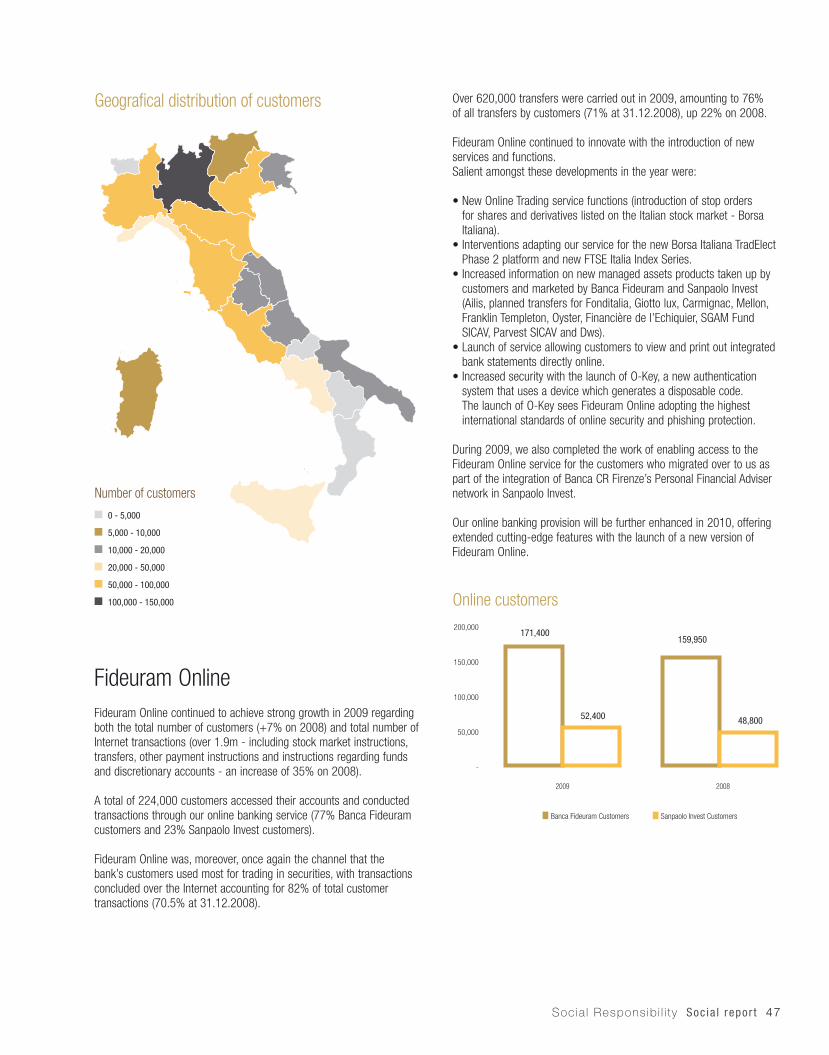
Socia l Responsib i l i ty Soc ia l repor t 47
Over 620,000 transfers were carried out in 2009, amounting to 76%of all transfers by customers (71% at 31.12.2008), up 22% on 2008.
Fideuram Online continued to innovate with the introduction of new services and functions. Salient amongst these developments in the year were:
• New Online Trading service functions (introduction of stop orders for shares and derivatives listed on the Italian stock market - Borsa Italiana).
• Interventions adapting our service for the new Borsa Italiana TradElect Phase 2 platform and new FTSE Italia Index Series.
• Increased information on new managed assets products taken up by customers and marketed by Banca Fideuram and Sanpaolo Invest (Ailis, planned transfers for Fonditalia, Giotto lux, Carmignac, Mellon, Franklin Templeton, Oyster, Financière de l’Echiquier, SGAM Fund SICAV, Parvest SICAV and Dws).
• Launch of service allowing customers to view and print out integrated bank statements directly online.
• Increased security with the launch of O-Key, a new authentication system that uses a device which generates a disposable code. The launch of O-Key sees Fideuram Online adopting the highest international standards of online security and phishing protection.
During 2009, we also completed the work of enabling access to the Fideuram Online service for the customers who migrated over to us as part of the integration of Banca CR Firenze’s Personal Financial Adviser network in Sanpaolo Invest.
Our online banking provision will be further enhanced in 2010, offering extended cutting-edge features with the launch of a new version of Fideuram Online.
Fideuram OnlineFideuram Online continued to achieve strong growth in 2009 regarding both the total number of customers (+7% on 2008) and total number of Internet transactions (over 1.9m - including stock market instructions, transfers, other payment instructions and instructions regarding funds and discretionary accounts - an increase of 35% on 2008).
A total of 224,000 customers accessed their accounts and conducted transactions through our online banking service (77% Banca Fideuram customers and 23% Sanpaolo Invest customers).
Fideuram Online was, moreover, once again the channel that the bank’s customers used most for trading in securities, with transactions concluded over the Internet accounting for 82% of total customer transactions (70.5% at 31.12.2008).
Number of customers
Geografical distribution of customers
0 - 5,000
5,000 - 10,000
10,000 - 20,000
20,000 - 50,000
50,000 - 100,000
100,000 - 150,000 Online customers
159,950
48,800
-
50,000
100,000
150,000
200,000
20082009
Sanpaolo Invest CustomersBanca Fideuram Customers
171,400
52,400
48 Annua l Repor t 2009
Market research
Banca Fideuram continued to invest in market research in 2009 with the aim of improving its insight into customer needs and Italian market trends.
The bank continued its participation in the main sector surveys during the year - Gfk Eurisko’s Multifinanziaria survey, and the joint Gfk Eurisko and Prometeia survey on Italian family savings in particular - focusing on the crisis with in-depth analyses that went beyond the simple media reactions to the situation.
This research showed the extent to which the crisis had a concrete impact on family behaviour, with more careful and rational consumption, the attribution of value to experience and not to promises, a closer focus on content and respect for agreements together with specific financial consequences and a lack of investment planning (based on available resources), an avoidance of consumer credit and search for small, different and alternative small suppliers, with savers - at least in their intentions - tending towards self-sufficiency.
The survey at the same time attempted to shatter a number of commonplace myths with the aim of promoting an active decision-making process:
• Consumer spending is falling. The data in fact showed that we are looking at a process of rationalisation, with consumers preferring to buy during sales and revising their purchase priorities, while their propensity to purchase remains unchanged.
• Families aren’t saving any more. The percentage of families saving has in fact remained unchanged, as has the percentage of their earnings saved. The only thing that has changed is that families are now more attentive to their savings goals as a result of market uncertainty.
In addition, the following ad hoc research was carried out to support Banca Fideuram’s communications:
• A copy test prior to the choice of our advertising campaign, using focus groups of existing and prospective customers. This test showed that the campaign chosen (on an advisory service considered as 3 distinct components: Listening to you, Knowing you and Advising you) was able to meet customer expectations,
centred on service customisation and being able to relate to a message that was considered to be clear, direct and easy to understand.
• A post test on the effectiveness of the campaign, carried out through face-to-face personal interviews with a national sample group that was representative of our target “investors”. The results showed that: - The campaign’s impact on brand image was both positive and
increasing in all aspects (compared to the pre-test phase), with respondents expressing their appreciation of the visuals (beautiful, carefully-executed and elegant) and graphic design in particular. Good results were likewise achieved with respect to ease of understanding of the message and the originality of the communications.
- The focus group’s appreciation of the campaign exceeded the system benchmark, with 36% stating they liked it a lot or quite a lot compared with the Gfk Eurisko benchmark of around 25% for financial system communications.
- The investors’ assessments were extremely positive with respect both to brand image and their enjoyment of the campaign.
- The campaign appears to have succeeded in clearly and comprehensibly communicating the bank’s message of attention to and partnership with its customers. Banca Fideuram perceived to be a bank that is professional, reliable and close to its customers, taking a real interest in listening to and advising them.
- The message conveyed by the campaign was considered to be expressed clearly and comprehensibly. Indeed only a small percentage stated they found it somewhat or very difficult to understand.
The media mix and creative strategy developed were thus shown to be successful and effective in terms of:• Increased brand visibility: brand recognition increased with
respect to the pre-campaign period, and not just for the general population but Banca Fideuram’s target groups as well (readers of daily newspapers and investors).
• Transfer of a positive mood regarding Banca Fideuram, strengthening the perception of the bank’s interest in/closeness to its customers and their needs (up 10 percentage points), while also - albeit modestly - stimulating the desire to take action to learn more and obtain information on the bank (+3 percentage points).
• Positive return regarding the bank’s image with its core target of investors, especially with respect to “brand innovation and dynamism” and “offering interesting products in line with their needs”.
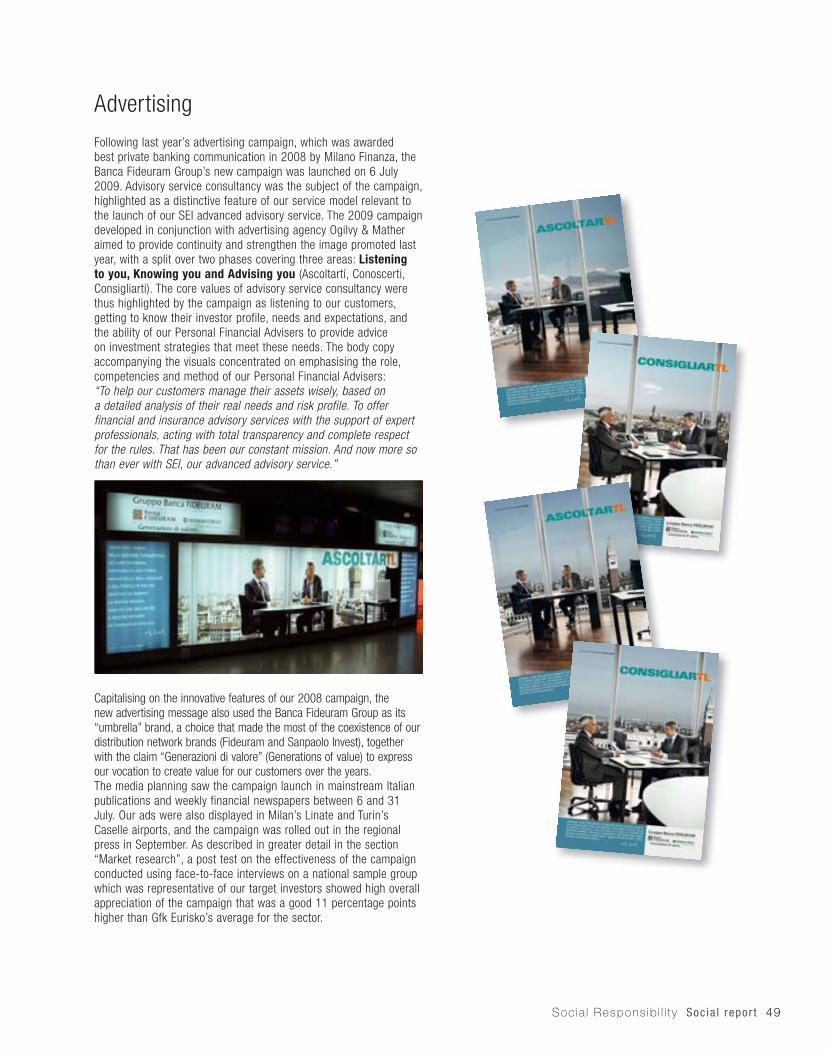
Socia l Responsib i l i ty Soc ia l repor t 49
Advertising
Following last year’s advertising campaign, which was awarded best private banking communication in 2008 by Milano Finanza, the Banca Fideuram Group’s new campaign was launched on 6 July 2009. Advisory service consultancy was the subject of the campaign, highlighted as a distinctive feature of our service model relevant to the launch of our SEI advanced advisory service. The 2009 campaign developed in conjunction with advertising agency Ogilvy & Mather aimed to provide continuity and strengthen the image promoted last year, with a split over two phases covering three areas: Listening to you, Knowing you and Advising you (Ascoltarti, Conoscerti, Consigliarti). The core values of advisory service consultancy were thus highlighted by the campaign as listening to our customers, getting to know their investor profile, needs and expectations, and the ability of our Personal Financial Advisers to provide advice on investment strategies that meet these needs. The body copy accompanying the visuals concentrated on emphasising the role, competencies and method of our Personal Financial Advisers: “To help our customers manage their assets wisely, based on a detailed analysis of their real needs and risk profile. To offer financial and insurance advisory services with the support of expert professionals, acting with total transparency and complete respect for the rules. That has been our constant mission. And now more so than ever with SEI, our advanced advisory service.”
Capitalising on the innovative features of our 2008 campaign, the new advertising message also used the Banca Fideuram Group as its “umbrella” brand, a choice that made the most of the coexistence of our distribution network brands (Fideuram and Sanpaolo Invest), together with the claim “Generazioni di valore” (Generations of value) to express our vocation to create value for our customers over the years. The media planning saw the campaign launch in mainstream Italian publications and weekly financial newspapers between 6 and 31 July. Our ads were also displayed in Milan’s Linate and Turin’s Caselle airports, and the campaign was rolled out in the regional press in September. As described in greater detail in the section “Market research”, a post test on the effectiveness of the campaign conducted using face-to-face interviews on a national sample group which was representative of our target investors showed high overall appreciation of the campaign that was a good 11 percentage points higher than Gfk Eurisko’s average for the sector.

50 Annua l Repor t 2009
SEI launch event
Our new advanced advisory service, SEI, was officially launched in 2009. One of the focal points in our 2008-2011 Industrial Plan, SEI is an advisory method for analysing and planning the investments of Banca Fideuram and Sanpaolo Invest’s top customers. The SEI presentation event took place in the prestigious Palazzo Mezzanotte in Milan on 19 May 2009 and involved the Group’s top management, managers and best Personal Financial Advisers. The day had a rich and interesting agenda. Following a brief opening speech and welcome by Managing Director Matteo Colafrancesco, the first speaker was Chairman Salvatore Maccarone, who considered the financial crisis along with the educational and supporting role that Personal Financial Advisers play for their customers, a role that has become increasingly crucial in today’s delicate market scenarios. Managing Director Matteo Colafrancesco returned to address the public on the same subject in a paper entitled “Consultancy: Tradition and Innovation” in which he explored Banca Fideuram’s history as a pioneer of financial advisory services in Italy and summarised the salient facts and figures of its leadership. Banca Fideuram has been a driving force in
the history of financial advisory services and looks to the future with its head held high, prepared for a historic turning point in the business with SEI. The proceedings then addressed the central topic of the day, the Group’s advanced advisory contract.A series of introductory talks led into a round table discussion on advisory services chaired by the MF MILANO FINANZA journalist Osvaldo de Paolini. The guests taking part included Giuseppe D’Agostino (Head of the Brokers’ Division of the Italian National Commission for Listed Companies and the Stock Exchange - CONSOB), Antonio Spallanzani (Chairman of the Italian Association of Companies Selling Financial Products and Investment Services - Assoreti), Elio Conti Nibali (Chairman of the Italian Financial Advisers’ Association - ANASF), Andrea Viganò (Southern Europe Head BlackRock), Massimo Greco (Country Head J.P. Morgan Asset Management), Andrea Buraschi (Professor, Chair in Finance, Imperial College, London) and Tommaso Corcos (Managing Director Fideuram Investimenti). The discussion touched on many different subjects, from the intensification of the crisis to the need to provide more sober information, comparisons with the American model of financial advisory services and suggestions on how to best position oneself in the future.
The guests also paused to consider the decisive role that Banca Fideuram has played in the growth of managed assets in Italy. Our Personal Financial Advisers provide a service which delivers substantial added value that more than justifies its cost, and it is this, moreover, which prepared the way for the SEI contract.
The official launch of SEI was very appropriately followed by a prize-giving for the Group’s most loyal Personal Financial Advisers and those who had distinguished themselves with the top results in the year, closing the day on a high point.

Socia l Responsib i l i ty Soc ia l repor t 51
Private Banking Project
The Banca Fideuram Group opened its first four Private Banking centres for the Banca Fideuram and Sanpaolo Invest Networks in Milan and Turin during 2009. These new centres provide an exclusive and elegant environment which reflects the values of confidentiality and attention to detail that have always distinguished Banca Fideuram’s work. To mark the opening of the Milan Private Banking Centre in the courtyard of our Corso di Porta Romana branch, we put on an exhibition of nativity scene displays from around the world in conjunction with the Capuchin Missionaries, contributing to the important humanitarian work of the missionaries and bringing the bank’s heritage under the spotlight. These centres dedicated to our top customers are the ideal place to cultivate unique customer relationships truly able to create value.
Banca Fideuram has always focused on high-end customers and its Personal Financial Advisers take care of the interests of 20,000
customers who have deposits and investments of approximately €27bn with the bank today, positioning us amongst the top four operators on the Italian private banking market. The new centres we have opened represent the first step towards the implementation of a service line dedicated to our top customers, providing privileged access to the Group’s services under a prestige brand, in an even more attentive and closely-tailored development of the service model and values that have always been central to Fideuram and made relationship-building, customisation and attention to the detail the secrets of our success. The new brand, which has inspired the design of the new centres, is also expressed in a range of below-the-line communications tools (brochures, leaflets, letters and advertising) developed exclusively to support the new service line.

52 Annua l Repor t 2009
The new Banca Fideuram and Sanpaolo Invest websites
The new Banca Fideuram and Sanpaolo Invest websites went live in November 2009. The new portals benefit from radically revised graphics and content, developed paying special attention to those aspects of greatest interest to our customers and Personal Financial Advisers - always the focal point of the Group’s Internet communications.
The web has maintained and strengthened its position as a channel for promoting our corporate values and disseminating news and in-depth information on Banca Fideuram and Sanpaolo Invest products and solutions, while equally providing customers with a further service for ensuring transparency and a full understanding of the products and services offered. It has at the same time become a prime medium for communicating the crucial role played by our Personal Financial Advisers, who are central figures in our Web presence through communications highlighting their value, customer relationships and advisory support, and in addition through a recruitment mini-site promoting their professional profile, enhanced by dynamic, attractive graphic design. The new site is thus an innovative tool for promoting a wider and more in-depth understanding of the value of our Personal Financial Advisers.
The key concepts guiding the creative work on the site were to achieve simplicity and immediacy. The new site design achieves this by being easy to understand and immediately recognisable, partly by echoing the design elements of our 2008 below-the-line communications, ensuring that the website consolidates the Banca Fideuram Group brand and brand image from first impact. This is enhanced by refined graphic motifs that have been extended into panoramas to provide a visual key to the content, aiding interpretation and navigation.
PattiChiari
Banca Fideuram continued consolidating customer awareness of its banking and investment products and services in 2009, as in prior years, joining the “quality commitments” initiative (“impegni per la qualità”), a set of tools and rules for simplifying retail banking developed by PattiChiari, the project launched by the Italian Banking Association (ABI) to improve relations between banks and their customers.
Banca Fideuram has been involved in the following PattiChiari projects over the years:
LighthouseThis is a free service that informs customers over the telephone or Internet, wherever they are, of the location of the nearest fully-functioning ATM machine, complete with a map of the area and the quickest route to the machine.
Sure Times Cheque AvailabilityThis initiative provides customers with precise information on how long it will actually take cheques paid into their accounts to clear and for the sums to become available.
Current Accounts ComparedAn initiative that provides customers with general information sheets that compare Banca Fideuram’s current accounts with those of its competitors, making it easier to assess the cost of these products.
Financial Investments ComparedThe banks involved in this initiative provide easy-to-use tools that help customers identify their investment objectives properly.
Structured Bank BondsThis initiative has developed special information procedures for the placement of structured and subordinated bonds, which enable customers to evaluate any choice of these products properly.
In addition, Banca Fideuram made the following “quality commitments” in 2009:
COMMITMENTS REGARDING CURRENT ACCOUNTS Package current account comparison engine Ordinary current account comparison engine Package current account price indicator Ordinary current account price indicator Changing account guide Monitoring of average current account closure times Publication of average current account closure times Automatic direct debit transfer Information on ATM charges Card charge error refund times ATM-FARO service quality monitoring FARO centralised call centre
CE
RT
IF
ICATO PATT
ICH
IAR
I
Obbligazioni Basso Rischio
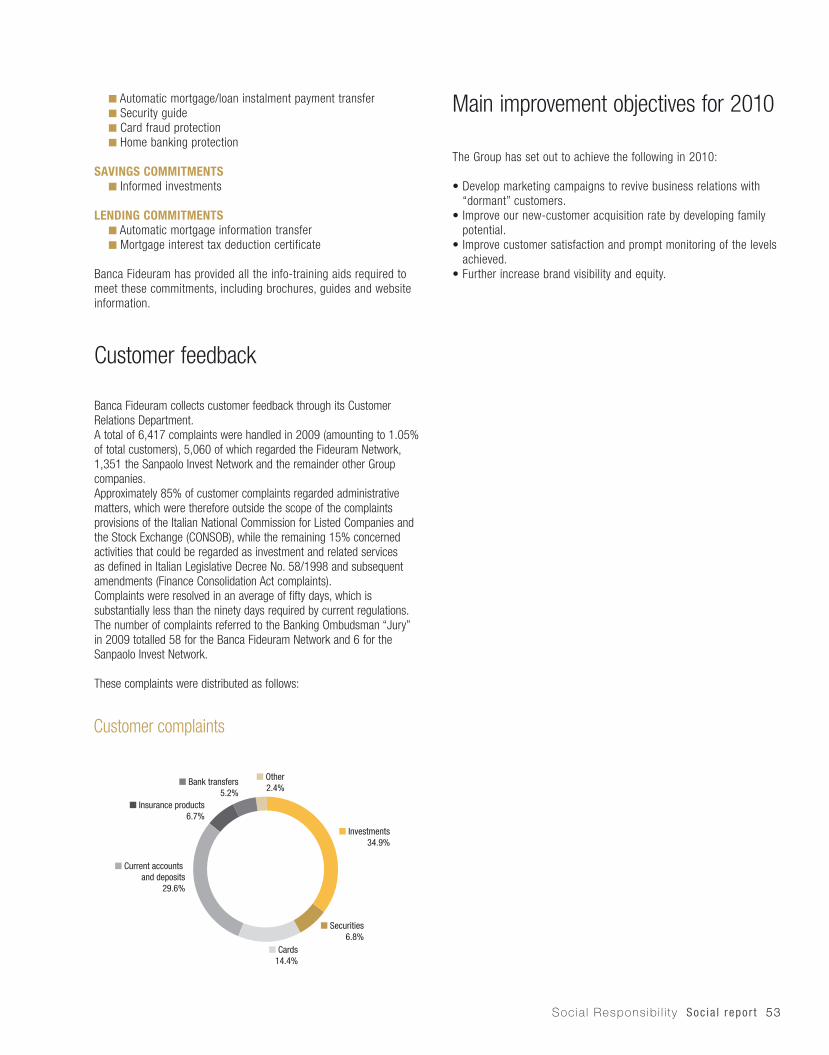
Socia l Responsib i l i ty Soc ia l repor t 53
Automatic mortgage/loan instalment payment transfer Security guide Card fraud protection Home banking protection
SAVINGS COMMITMENTS Informed investments
LENDING COMMITMENTS Automatic mortgage information transfer Mortgage interest tax deduction certificate
Banca Fideuram has provided all the info-training aids required to meet these commitments, including brochures, guides and website information.
Customer feedback
Banca Fideuram collects customer feedback through its Customer Relations Department.A total of 6,417 complaints were handled in 2009 (amounting to 1.05% of total customers), 5,060 of which regarded the Fideuram Network, 1,351 the Sanpaolo Invest Network and the remainder other Group companies.Approximately 85% of customer complaints regarded administrative matters, which were therefore outside the scope of the complaints provisions of the Italian National Commission for Listed Companies and the Stock Exchange (CONSOB), while the remaining 15% concerned activities that could be regarded as investment and related services as defined in Italian Legislative Decree No. 58/1998 and subsequent amendments (Finance Consolidation Act complaints).Complaints were resolved in an average of fifty days, which is substantially less than the ninety days required by current regulations. The number of complaints referred to the Banking Ombudsman “Jury” in 2009 totalled 58 for the Banca Fideuram Network and 6 for the Sanpaolo Invest Network.
These complaints were distributed as follows:
Main improvement objectives for 2010
The Group has set out to achieve the following in 2010:
• Develop marketing campaigns to revive business relations with “dormant” customers.
• Improve our new-customer acquisition rate by developing family potential.
• Improve customer satisfaction and prompt monitoring of the levels achieved.
• Further increase brand visibility and equity.
Customer complaints
■ Investments34.9%
■ Insurance products6.7%
■ Bank transfers5.2%
■ Other2.4%
■ Cards14.4%
■ Current accounts and deposits
29.6%
■ Securities6.8%

54 Annua l Repor t 2009
PERSONAL FINANCIAL ADVISERS
Geographical distribution of NetworksThe Banca Fideuram Group provides extensive coverage of Italy through two distribution networks, the Fideuram Network and Sanpaolo Invest Network.
Both Networks are divided into areas, each of which is coordinated by an Area Manager supported by their own management team, and sized to suit the business potential of the territory concerned, which can cover several regions or just a few provinces.
The Fideuram network is divided into eight areas, while the Sanpaolo Invest Network is divided into four areas which were joined by a fifth transitional area in 2009 that did not have any geographical delimitation and included all the Personal Financial Advisers from Banca CR Firenze located in the different regions of Italy following the acquisition of the related business division.
As of 1 January 2010, the Personal Financial Advisers from Banca CR Firenze joined the relevant geographical areas following the usual criteria.
Main objectives for 2009 Actions and results achieved
Volume growth in terms both of net inflows and recruitment
• The Banca Fideuram Group’s net inflows rose to €2,804m in 2009, compared with €345m in 2008.The initiatives taken regarding the Group’s incentive mechanisms enabled us to achieve our net inflow growth target with an incentive scheme that is now based on a single bonus calculated on the inflows and weighted in relation to the type of financial advisory service provided. In addition, our ordinary and extraordinary annual bonuses have now been joined by a half-year bonus scheme. The dramatic trend reversal achieved was also due to the effects of the “tax shield” legislation brought in with Italian Decree Law No. 78/2009.
Step up recruitment • The number of Personal Financial Advisers in the Fideuram and Sanpaolo Invest Networks rose from 4,209 in 2008 to 4,292 at the end of 2009.A total of 345 new Personal Financial Advisers were recruited in the year, approximately 70% of whom came from competitor networks. In addition, a further 120 new Personal Financial Advisers joined the networks as a result of the merger of Banca CR Firenze (including 4 recruited in the course of the year). The incentive mechanisms in place to support recruitment were also revised, aiming to reward systematic overall results rather than to reward each individual recruitment. The observation period for the targets was extended to a whole year so as not to reward “false targets” (recruitments followed by resignations shortly afterwards).
The different geographical zones in each area are shown in the tables below:
Area Structure of the Fideuram Network
Area 2009 2008
1 Valle d’Aosta and Piedmont Valle d’Aosta and Piedmont
2 Lombardy (Provinces of Milan, Lodi and Pavia) and Liguria
Lombardy (Provinces of Milan, Lodi and Pavia) and Liguria
3 Lombardy (excepting Provinces of Milan, Lodi and Pavia)
Lombardy (excepting Provinces of Milan, Lodi and Pavia)
4 Venetia, Friuli Venezia Giulia and Trentino Alto Adige
Venetia, Friuli Venezia Giulia and Trentino Alto Adige
5 Tuscany, Umbria and the Marches Tuscany, Umbria and the Marches
6 Latium (excepting the Gaeta town council area), Sardinia
Latium (excepting the Gaeta town council area), Sardinia
7Latium (excepting the Gaeta town
council area), SardiniaLatium (excepting the Gaeta town
council area), Sardinia
8
Campania, Abruzzo, Molise, Puglia, Basilicata, Calabria and
Sicily, Latium (Gaeta town council area only)
Campania, Abruzzo, Molise, Puglia, Basilicata, Calabria and Sicily,
Latium (Gaeta town council area only)

Socia l Responsib i l i ty Soc ia l repor t 55
Area Structure of the Sanpaolo Invest Network
Area 2009 2008
1Piedmont, Valle d'Aosta,
Sardinia and LiguriaPiedmont, Valle d'Aosta,
Sardinia and Liguria
2
Lombardy, Venetia, Friuli Venezia Giulia, Trentino Alto Adige, Emilia
Romagna and the Marches
Lombardy, Venetia, Friuli Venezia Giulia, Trentino Alto Adige, Emilia
Romagna and the Marches
3 Tuscany, Umbria and Latium Tuscany, Umbria and Latium
4Abruzzo, Campania, Calabria,
Puglia, Molise, Sicily and BasilicataAbruzzo, Campania, Calabria,
Puglia, Molise, Sicily and Basilicata
5
Distribution of Banca CR Firenze Personal Financial Advisers
throughout Italy
Size of NetworksThe Banca Fideuram Group’s business activities are conducted through its Personal Financial Adviser networks, which build and take care of its customer relationships over time.
The Group’s two Networks totalled 4,292 at 31 December 2009, comprising 3,088 Banca Fideuram Personal Financial Advisers (3,103 in 2008) and 1,204 Sanpaolo Invest Personal Financial Advisers (1,106 in 2008).
New Personal Financial Advisers recruited totalled 345 at 31 December 2009 (196 in 2008), while a total of 262 left the Networks during the year (267 in 2008). Only 81 of these Personal Financial Advisers left the Group for competitor networks during the year.
The 2009 figures regarding sector of origin confirm the trend which had already emerged in 2008, with over 60% of our new Personal Financial Advisers coming from competitor Networks.
Fideuram Network - Personal Financial Advisers - Origin by rank
2009 2008
Rank Bank Network Other Total Bank Network Other Total
Managers - 2 - 2 - - - -
Personal Financial Advisers 47 52 30 129 32 55 24 111
Total 47 54 30 131 32 55 24 111
Sanpaolo Invest Network - Personal Financial Advisers - Origin by rank
2009 2008
Rank Bank Network Other Total Bank Network Other Total
Managers - 20 - 20 - 1 - 1
Personal Financial Advisers 12 168 14 194 12 64 8 84
Total 12 188 14 214 12 65 8 85
The tables below show the regional and area distribution of Personal Financial Adviser in both Networks.
Fideuram Network - Area Coverage - Number of Personal Financial Advisers by area
Area Number of Personal Financial Advisers 2009
Number of Personal Financial Advisers 2008
1 419 419
2 405 381
3 330 346
4 365 366
5 324 337
6 446 457
7 395 384
8 404 413
Total 3,088 3,103
Sanpaolo Invest Network - Area Coverage - Number of Personal Financial Advisers by area
Area Number of Personal Financial Advisers 2009
Number of Personal Financial Advisers 2008
1 256 252
2 263 290
3 267 277
4 298 287
5 120 -
Total 1,204 1,106
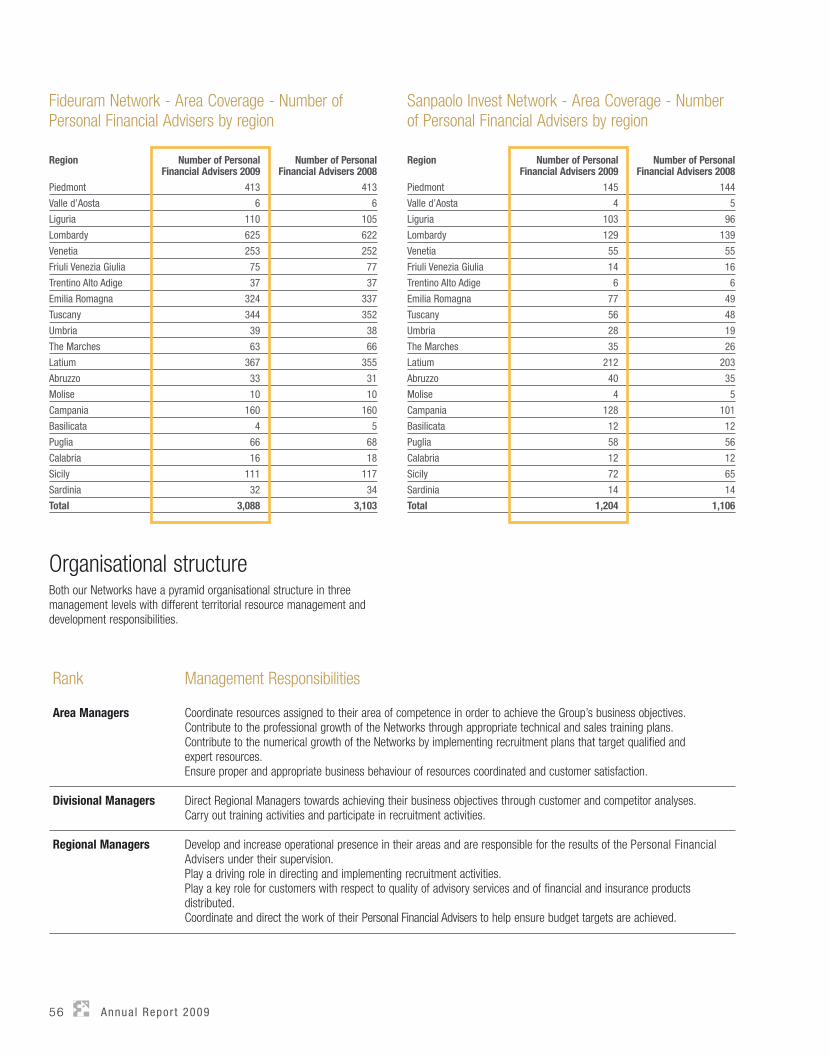
56 Annua l Repor t 2009
Sanpaolo Invest Network - Area Coverage - Number of Personal Financial Advisers by region Region Number of Personal
Financial Advisers 2009Number of Personal
Financial Advisers 2008
Piedmont 145 144
Valle d’Aosta 4 5
Liguria 103 96
Lombardy 129 139
Venetia 55 55
Friuli Venezia Giulia 14 16
Trentino Alto Adige 6 6
Emilia Romagna 77 49
Tuscany 56 48
Umbria 28 19
The Marches 35 26
Latium 212 203
Abruzzo 40 35
Molise 4 5
Campania 128 101
Basilicata 12 12
Puglia 58 56
Calabria 12 12
Sicily 72 65
Sardinia 14 14
Total 1,204 1,106
Fideuram Network - Area Coverage - Number of Personal Financial Advisers by region
Region Number of Personal Financial Advisers 2009
Number of Personal Financial Advisers 2008
Piedmont 413 413
Valle d’Aosta 6 6
Liguria 110 105
Lombardy 625 622
Venetia 253 252
Friuli Venezia Giulia 75 77
Trentino Alto Adige 37 37
Emilia Romagna 324 337
Tuscany 344 352
Umbria 39 38
The Marches 63 66
Latium 367 355
Abruzzo 33 31
Molise 10 10
Campania 160 160
Basilicata 4 5
Puglia 66 68
Calabria 16 18
Sicily 111 117
Sardinia 32 34
Total 3,088 3,103
Rank Management Responsibilities
Area Managers Coordinate resources assigned to their area of competence in order to achieve the Group’s business objectives.Contribute to the professional growth of the Networks through appropriate technical and sales training plans.Contribute to the numerical growth of the Networks by implementing recruitment plans that target qualified and expert resources.Ensure proper and appropriate business behaviour of resources coordinated and customer satisfaction.
Divisional Managers Direct Regional Managers towards achieving their business objectives through customer and competitor analyses.Carry out training activities and participate in recruitment activities.
Regional Managers Develop and increase operational presence in their areas and are responsible for the results of the Personal Financial Advisers under their supervision.Play a driving role in directing and implementing recruitment activities.Play a key role for customers with respect to quality of advisory services and of financial and insurance productsdistributed.Coordinate and direct the work of their Personal Financial Advisers to help ensure budget targets are achieved.
Organisational structureBoth our Networks have a pyramid organisational structure in three management levels with different territorial resource management and development responsibilities.

Socia l Responsib i l i ty Soc ia l repor t 57
Fideuram Network - Personal Financial Advisers - Average age by rank
Rank Total number < 30 years 30-40 years 40-50 years 50-60 years Over 60 Average age
Area Managers 8 - - 1 1 6 55
Divisional Managers 25 - - 13 10 2 50
Regional Managers 122 - 5 69 48 - 48
Supervisors 341 - 27 159 137 18 49
Personal Financial Advisers 2,592 42 304 865 1,001 380 50
Total 3,088 42 336 1,107 1,197 406 50
Sanpaolo Invest Network - Personal Financial Advisers - Average age by rank
Rank Total number < 30 years 30-40 years 40-50 years 50-60 years Over 60 Average age
Area Managers 4 - - 2 2 - 50
Divisional Managers 13 - - 6 7 - 51
Regional Managers 64 - 6 29 24 5 49
Supervisors 141 - 30 69 32 10 46
Personal Financial Advisers 982 13 189 426 233 121 47
Total 1,204 13 225 532 298 136 47
Fideuram Network - Personal Financial AdvisersStaff numbers by rank
Rank 2009 2008
Area Managers 8 7 Divisional Managers 25 26 Regional Managers 122 120 Supervisors 344 362 Personal Financial Advisers 2,589 2,588 Total 3,088 3,103
Sanpaolo Invest Network - Personal Financial Advisers - Staff numbers by rank
Rank 2009 2008
Area Managers 4 4 Divisional Managers 13 9 Regional Managers 64 46 Supervisors 141 132 Personal Financial Advisers 982 915 Total 1,204 1,106
The following tables show the main characteristics of the Banca Fideuram Group’s Personal Financial Advisers.It should be emphasised that these characteristics have remained
almost entirely unchanged over the years, or have only changed very slightly, confirming the structural maturity achieved.
Fideuram Network - Personal Financial Advisers - Length of service by rank
Rank Total number < 5 years 5-10 years 10-15 years 15-20 years Over 20 years Average length of service
Area Managers 8 - - 1 - 7 23
Divisional Managers 25 1 2 4 1 17 21
Regional Managers 122 9 43 27 9 34 15
Supervisors 341 44 118 47 58 74 13
Personal Financial Advisers 2,592 552 741 289 448 562 12
Total 3,088 606 904 368 516 694 12
Sanpaolo Invest Network - Personal Financial Advisers - Length of service by rank
Rank Total number < 5 years 5-10 years 10-15 years 15-20 years Over 20 years Average length of service
Area Managers 4 - - - 2 2 20
Divisional Managers 13 4 2 - 2 5 12
Regional Managers 64 16 17 4 12 15 10
Supervisors 141 48 16 43 18 16 10
Personal Financial Advisers 982 366 197 217 106 96 6
Total 1,204 434 232 264 140 134 9

58 Annua l Repor t 2009
Fideuram Network - Area Coverage - Logistics structure by region
Region Bank branches Personal Financial Advisers’ offices
2009 2008 2009 2008Piedmont 12 12 31 31Valle d’Aosta - - 1 1Liguria 5 5 9 9Lombardy 21 21 25 25Venetia 7 7 20 21Friuli Venezia Giulia 3 3 6 6Trentino Alto Adige 2 2 6 5Emilia Romagna 10 10 20 20Tuscany 12 12 27 27Umbria 1 1 4 4The Marches 2 2 6 6Latium 7 7 14 14Abruzzo 1 1 4 4Molise - - 2 2Campania 5 5 7 7Basilicata - - 1 1Puglia 3 3 4 4Calabria 1 1 2 2Sicily 4 4 6 6Sardinia 1 1 3 3Total 97 97 198 198
Sanpaolo Invest Network - Area Coverage - Logistics structure by region
Region Personal Financial Advisers’ offices
2009 2008Piedmont 16 16Valle d’Aosta 1 1Liguria 14 13Lombardy 22 20Venetia 11 10Friuli Venezia Giulia 3 4Trentino Alto Adige 1 1Emilia Romagna 16 9Tuscany 12 10Umbria 5 4The Marches 8 6Latium 32 22Abruzzo 8 5Molise 2 2Campania 14 10Basilicata 1 1Puglia 9 8Calabria 2 2Sicily 6 6Sardinia 3 3Total 186 153
Fideuram Network - Personal Financial Advisers - Distribution by rank and gender
2009 2008
Rank Men Women Total Men Women Total
Managers 152 3 155 150 3 153
Personal Financial Advisers 2,537 396 2,933 2,550 400 2,950
Total 2,689 399 3,088 2,700 403 3,103
Sanpaolo Invest Network - Personal Financial Advisers - Distribution by rank and gender
2009 2008
Rank Men Women Total Men Women Total
Managers 79 2 81 58 1 59
Personal Financial Advisers 919 204 1.123 866 181 1,047
Total 998 206 1.204 924 182 1,106
Logistics structure supporting the NetworksOur Personal Financial Advisers are supported in their work by the Banca Fideuram logistics structure of 97 bank branches (7 area main branches and 90 small local branches known as Delivery Points - “Punti di Erogazione” or “PEs”) together with 384 Personal Financial Advisers’ Offices (198 in the Fideuram Network and 186 in the Sanpaolo Invest Network).
The delivery points, where customers can carry out routine banking transactions, are generally next to the Personal Financial Advisers’ Offices. The Group has a flexible costs policy for these Offices, paying the rental costs and part of the operating costs directly and/or indirectly (through contributions paid to management), while also providing for their connection to the company IT network.
As in 2008, we did not open any new branches or offices in 2009, considering the area coverage achieved to date to be well matched to the Networks’ logistical requirements and customer need.

Socia l Responsib i l i ty Soc ia l repor t 59
Contractual relationsRelations between the Banca Fideuram Group and its Personal Financial Advisers are governed by an open-ended agency contract based on Italy’s Collective Economic Agreement for Agents and Representatives in the Commerce sector.
This contract both stipulates the basic collective provisions for our Personal Financial Advisers and further benefits which supplement their remuneration, social security and pension provisions, principally by linking them to the achievement of annual sales targets.
Remuneration The remuneration of the Network’s Personal Financial Advisers and Managers is made up of two components: commission/fees and other incentives/bonuses.
Commission and fees consist of front-end fees and management fees, with the former rewarding the acquisition of new financial assets and being linked to total client assets, while the latter reward each Personal Financial Adviser’s ability to retain client assets over time.
Network Managers receive overrides based on the fees and commission accrued by the Personal Financial Advisers under their responsibility, the rate of which varies according to their roles and responsibilities, as well as special sales targets set in each annual budget.
Fideuram Network - Area Coverage - Logistics structure by area
Area Bank branches Personal Financial Advisers’ offices
2009 2008 2009 2008
1 12 12 32 32
2 16 16 21 21
3 10 10 13 13
4 12 12 32 32
5 10 10 20 20
6 15 15 37 38
7 8 8 16 15
8 14 14 27 27
Total 97 97 198 198
Sanpaolo Invest Network - Area Coverage - Logistics structure by area
Area Personal Financial Advisers’ offices
2009 2008
1 31 31
2 47 49
3 39 38
4 36 35
5 33 -
Total 186 153
Fideuram distribution network
■ Area 1Personal Financial Advisers 419Branches 12Personal Financial Advisers’ offices 32
■ Area 2Personal Financial Advisers 405Branches 16Personal Financial Advisers’ offices 21
■ Area 3Personal Financial Advisers 330Branches 10Personal Financial Advisers’ offices 13
■ Area 4Personal Financial Advisers 365Branches 12Personal Financial Advisers’ offices 32
■ Area 5Personal Financial Advisers 324Branches 10Personal Financial Advisers’ offices 20
■ Area 6Personal Financial Advisers 446Branches 15Personal Financial Advisers’ offices 37
■ Area 7Personal Financial Advisers 395Branches 8Personal Financial Advisers’ offices 16
■ Area 8Personal Financial Advisers 404Branches 14Personal Financial Advisers’ offices 27
Sanpaolo Invest distribution network
■ Area 1Personal Financial Advisers 256Personal Financial Advisers' offices 31
■ Area 2Personal Financial Advisers 263Personal Financial Advisers' offices 47
■ Area 4Personal Financial Advisers 298Personal Financial Advisers' offices 36■ Area 3
Personal Financial Advisers 267Personal Financial Advisers' offices 39
■ Area 5 (former Banca CR Firenze Network)Personal Financial Advisers 120Personal Financial Advisers' offices 33

60 Annua l Repor t 2009
In addition to this, there are, moreover, other forms of remuneration for Personal Financial Advisers and Managers which complete the remuneration of the Group’s Networks, consisting of a series of bonus and incentive schemes, including non-monetary incentives, which are also used to support the implementation sales policies.
A bonus regulation is issued every year, delineating the mechanisms for incentivising the organisation to achieve our business targets.In 2009, the incentive/bonus plan for Personal Financial Advisers and Network Managers, designed to support volume growth while also focusing special attention on inflow quality, was calculated using a weighting system applied to the inflows in relation to the service content of each product concerned. The bonus was in addition structured over a half-year time horizon to offer greater versatility and flexibility in the uncertain financial market conditions last year.
Network Sales ActivitiesThe Banca Fideuram Group’s total net inflows rose to €2,804m in 2009 (€345m in 2008), while client assets came to €67,801m at 31 December 2009 (€60,507m in 2008).
Fideuram Network - Average number of customers for Personal Financial Advisers
Number of Personal Financial Advisers
Number of customers
Ratio of Customers to Personal Financial
Advisers2009 3,088 502,268 163:12008 3,103 516,562 166:1
Sanpaolo Invest Network - Average number of customers for Personal Financial Advisers
Number of Personal Financial Advisers
Number of customers
Ratio of Customers to Personal Financial
Advisers2009 1,204 123,962 103:12008 1,106 122,037 110:1
The results achieved in 2009 put the Banca Fideuram Group in first place in the Assoreti ranking for client assets (first place in 2008) and in second place for total net inflows (fifth place in 2008).
6.5%
2.2% 1.5%
9.0%
29.5%
14.3%11.7%
9.8% 9.7%
3.5% 2.3%
-
5%
10%
15%
20%
25%
30%
35%
Banc
aFi
deur
am G
roup
Med
iola
num
Gro
up
UniC
redi
t Gro
up
Allia
nz G
roup
Banc
a Ge
nera
li Gr
oup
Azim
ut G
roup
Deut
sche
Ban
k Gr
oup
Unio
ne d
i Ban
che
Italia
ne G
roup
Mon
te d
ei P
asch
idi
Sie
na G
roup
Aviva
Gro
up
Othe
r
Client assets at 31 december 2009
Source: Assoreti
Total net inflows 2009
UniC
redi
t Gro
up
Med
iola
num
Grou
p
Cred
ito E
milia
no -
Cred
em G
roup
Banc
a Fi
deur
amGr
oup
Cred
it Su
isse
Grou
p (It
aly)
Banc
a Ge
nera
liGr
oup
Mon
te P
asch
i Si
ena
Grou
p
Unio
ne d
i Ban
che
Italia
ne G
roup
Azim
ut G
roup
Deut
sche
Ban
k Gr
oup
Othe
r
15.9%
11.7%8.9%
5.3% 4.4% 3.4% 3.0% 2.7% 2.3%
9.2%
33.2%
-
5%
10%
15%
20%
25%
30%
35%
Source: Assoreti

Socia l Responsib i l i ty Soc ia l repor t 61
Key TV2009 was a further year of consolidation for Key TV, Banca Fideuram’s business TV channel, launched on 16 October 2006.The Fideuram and Sanpaolo Invest Networks’ Personal Financial Advisers all have access to the content of our business TV channel, which has become an increasingly important aid to support them in their work.
Key TV has been designed to provide regular, timely and complete information to keep our Personal Financial Advisers constantly updated on all the Group’s internal and external developments, using different formats aligned to their needs: • Key Company: for all communications on the life
of the bank (with programmes on results, contests and events).
• Key Job: focused on daily work and operating practices, with in-depth information on products, services, procedures and circulars.
• Key Market: greater focus on markets, product performance and marketing initiatives.
Minutes of product programme time for each format in 2009
Key market29’
Key job145’
Key special250’
Key company150’
Space has, moreover, also been dedicated to over 15 third-party investment companies, with special programmes dedicated to the performance of their products.
A total of 86 programme episodes were produced during the year, amounting to 18 hours and 27 minutes’ programme time. The Continuing Professional Development support for our Personal Financial Advisers included programmes updating them on the new MiFID directive, financial crisis, Italian “tax shield” legislation and advanced financial advisory service with special programmes dedicated to our SEI project.

62 Annua l Repor t 2009
Business meetings, travel and conferencesDuring the year there were the usual meetings and events involving the Personal Financial Adviser Networks, in addition to the travel and conferences to which our top performers in Italy were invited. These included:• Beginning of year meetings presenting the annual budget.• Prize-giving meeting for the Best Personal Financial Advisers, the
Personal Financial Advisers with the highest client assets in Italy, and the Top Performers - the Personal Financial Advisers who were ranked first in relation to specific business targets.
• Meetings during the year focused on the bank’s medium-term objectives and related strategies.
Personal Financial Adviser training The Group’s training commitment in 2009 concentrated on the intensive and widespread dissemination of our fee-charging advanced advisory method, SEI. SEI is a structured work method supported by leading-edge information technology tools, which makes it possible to offer an advisory service that brings customers substantial added value through innovation, including where the professional competencies of our Personal Financial Advisers are concerned.
Following the official launch of the related fee-charging advisory contract in June, our Personal Financial Advisers have every element in place to offer their customers the new SEI advanced advisory model. Supporting and promoting the new service, we launched a training programme to consolidate our Personal Financial Advisers’ competencies and to provide operating support, centred on the presentation and distribution of the fee-charging advanced advisory contract to customers.This programme supported the field work of a group of around 80 Personal Financial Advisers for approximately 3 months, focusing on a territory of three Business Areas and providing professional development training courses aimed at maximising the opportunities for achieving widespread, consistently excellent results with respect to increasing client assets, identifying successful cases for dissemination to colleagues and generating improvement ideas and proposals for making the SEI advanced advisory method even more effective at serving our customers. Alongside this central activity in the year, we also continued to provide training focused on consolidating the specialist competencies of our Personal Financial Advisers and Managers: • Developing a specialist training programme to support the project
for disseminating and consolidating the service model for our Private Banking customers. This training programme is being delivered to Personal Financial Advisers who have acquired substantial experience over long service and/or show considerable growth potential in the Private Banking segment. As in 2008, the training programme was developed and delivered in conjunction with the Imperial College London Business School and SDA Bocconi School of Management. The involvement of these two institutions ensured the training delivered offered the strengths of continuity and
consolidation, an international vision of Wealth Management and an in-depth specialist Wealth Advisory perspective.
• Insurance and pensions training courses for all newly-recruited Personal Financial Advisers, and refresher training courses for all Personal Financial Advisers designed to equip them to join the Single Register of Insurance and Reinsurance Brokers (Registro Unico Intermediari assicurativi e riassicurativi - RUI) of the Italian supervisory body for private insurance (ISVAP).
• A project supporting European Financial Planning Association (€FPA) certification through the payment of Study Grants for the preparatory courses for the certification exam and the provision of training for maintaining €FPA certification for those Personal Financial Advisers who have already obtained it.
• Our induction training programme for newly-appointed managers was completed.
The training sites In-formati con un click! (In-form/train yourself with a click!) and Navigando si impara (Navigate to learn), designed to provide constant refresher training online for our Personal Financial Advisers, were further strengthened with:
• Refresher training on our product range and new additions to the array of products and services offered.
• Training aids to support the optimum use of the business applications used for managing the mutual funds offered.
• Insurance and pension training in accordance with the new regulations issued by the Italian supervisory body for private insurance (ISVAP).
• Refresher training that updates participants on regulatory developments regarding the provision of financial advice and entry to the profession (Italian National Commission for Listed Companies and the Stock Exchange - CONSOB).
• The platform was moreover also enhanced with new functions enabling decentred management of the information on those courses delivered directly by the Networks.
A total of 335,340 hours of class-based and distance training were provided in 2009.

Socia l Responsib i l i ty Soc ia l repor t 63
■ Managerial Development1.4%
■ Class-based Product Training
4.4%
■ E-learning Product Training
9.5%
■ Personal Financial Adviser Vocational Training
29.1%
■ Specialist Competencies55.6%
Distribution of Fideuram Network training hours by Training Area (%)
■ Specialist Competencies
55.1%
■ Managerial Development1.2%
■ Personal Financial Adviser Vocational Training
31.5%
■ Class-based Product Training9.1%
■ E-learning Product Training
3.1%
Distribution of Sanpaolo Invest Network training hours by Training Area (%)
E-learning
2009 2008 change
Training Area Attendances Total hours Attendances Total hours Attendances Total hours
Personal Financial Adviser Vocational Training
12,895 99,573 24,971 107,315 -48% -7%
Product Training 9,876 26,515 14,903 44,044 -34% -40%
Total 22,771 126,088 39,874 151,359 -43% -17%
Class-based training
2009 2008 change
Training Area Attendances Total hours Attendances Total hours Attendances Total hours
Specialist Competencies 18,388 186,131 14,582 135,925 26% 37%
Managerial Development 475 4,555 1,568 17,701 -70% -74%
Class-based Product Training 3,400 18,566 6,342 25,283 -46% -27%
Total 22,263 209,252 22,492 178,909 -1% 17%
This training data is shown in greater detail below, broken down into e-learning and class-based training.
64 Annua l Repor t 2009
Main improvement objectives for 2010
• To enhance the Group’s distinctive strengths, increasingly linked to customer service, leveraging a unique advisory service, providing exceptional Private Banking management by advancing our “higher-service-level” asset management, and steadily returning the Fideuram Group to its sustainable historical value.
• Returning to profitability in line with the value generated for our customers, ensuring that our service levels support profitability levels that are in line with the Group’s historical levels, engineering a decisive shift of client assets toward managed asset products.
• Maintaining growth that is compatible with sustaining our corporate value over time by growing client assets, achieving guided growth in recruitment and obtaining an extension to Italy’s “tax shield” legislation, including through reorganising our product classification so that it is mainly based on the level of customer service provided.
The 2010 bonus and incentive scheme has been designed to promote these objectives, having as its prime objective to support a shift in client assets to managed asset products, increasing the components with the greatest customer service content. A new inflow weighting system is being developed to this end, with weightings that increase in relation to customer service level, grouping all the products in a given family in a single class (with some exceptions) and using zero weightings for managed products and money market funds (to promote a shift to higher-value-added products in customers’ interests). The time horizons for the 2010 bonus and incentive scheme are tailored to these objectives, with an annual bonus on Total Net Inflows and a bonus based on Weighted Inflows which will be six-monthly to promote a rapid recovery in managed assets. In addition, the Group’s Personal Financial Advisers and Managers will receive a bonus on the SEI service to reward its growth and promote the provision of fee-charging quality advisory services.
The Banca Fideuram Group’s training commitment includes an undertaking to provide its Personal Financial Advisers with a complete formal training path that enables them to achieve professional certification in the sale of the SEI advanced advisory service. This training programme is designed to consolidate the relational, technical and methodological competencies of our Personal Financial Advisers with a view to supporting their further development, and will be carefully structured to include a dedicated relational techniques course, a specialist course consolidating Wealth Management and Wealth Advisory technical competencies that deploys a new teaching format, and an innovative training course for developing personal competencies centred on individual coaching for disseminating information on successful cases. This initiative is dedicated exclusively to those Personal Financial Advisers who have obtained outstanding qualitative and quantitative results in promoting the take-up of the fee-charging advanced advisory service.
Last but not least, we will complete the launch of our New Talent Project which aims to train talented young graduates with specialisations in economics and launch them on careers as Personal Financial Advisers. The project is a strategic investment supporting the Group’s future growth. The initial feasibility analysis for identifying different types of university partnerships has been completed and we plan to take the project into its operational phase with a pilot course in 2010. The project target is still to recruit approximately 1,000 young graduates over a three-year period using a structured selection process with objective assessment criteria and tools to ensure candidates match the Group’s requirements profile.
The training plans provide for the development of a highly-structured process of entry to the profession through training in every area of financial advisory services and in the product and service model of the Banca Fideuram Group, together with a programme supporting candidates with a period of on-the-job training through field placements.
Alongside these special initiatives, we will of course continue to dedicate our customary consolidated attention to refresher training, ensuring that our Personal Financial Advisers benefit from constant updating and continuing our training programmes for those professionals providing special service levels for our Private Banking customers.
The Group’s 2010 strategic approaches differ substantially from and are not directly comparable with the previous three-year period with respect to its operating context and targets, involving a radical change in our collective behaviour that will see us making special efforts to restore the Group’s profitability. These will be concentrated in the first half of the year, including for the purposes of supporting Banca Fideuram’s listing on the stock exchange.
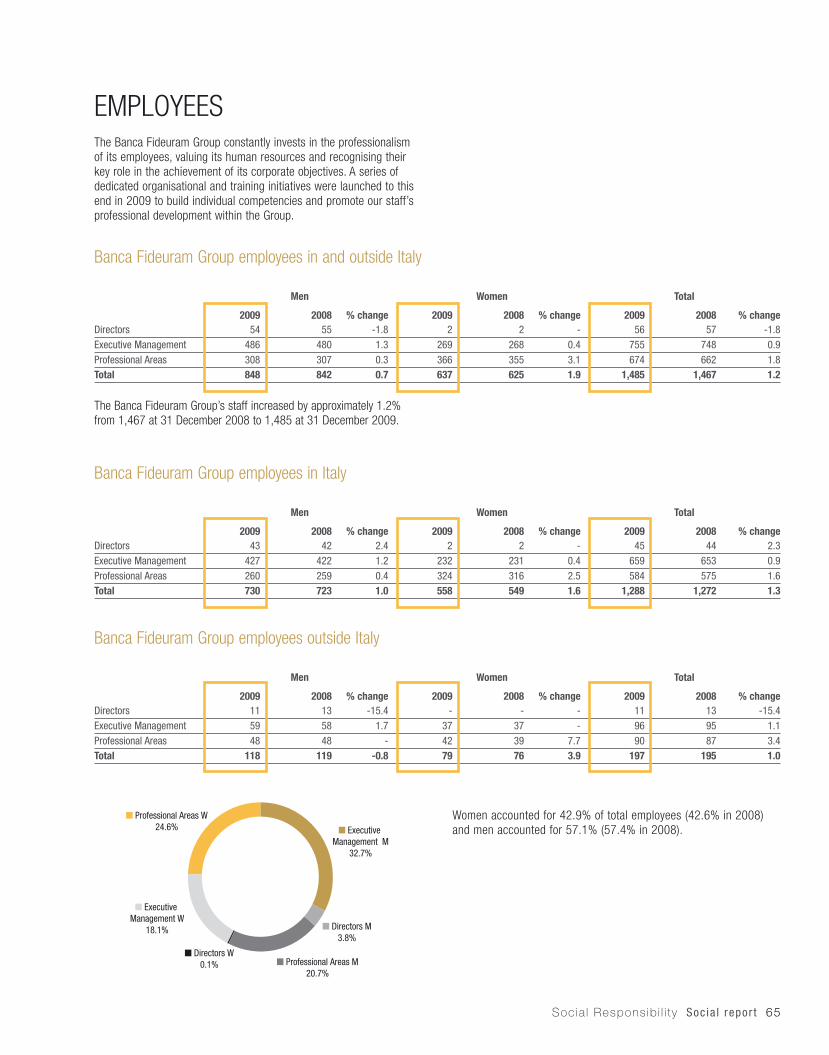
Socia l Responsib i l i ty Soc ia l repor t 65
Banca Fideuram Group employees in Italy
Men Women Total
2009 2008 % change 2009 2008 % change 2009 2008 % changeDirectors 43 42 2.4 2 2 - 45 44 2.3Executive Management 427 422 1.2 232 231 0.4 659 653 0.9Professional Areas 260 259 0.4 324 316 2.5 584 575 1.6Total 730 723 1.0 558 549 1.6 1,288 1,272 1.3
Banca Fideuram Group employees in and outside Italy
Men Women Total
2009 2008 % change 2009 2008 % change 2009 2008 % changeDirectors 54 55 -1.8 2 2 - 56 57 -1.8Executive Management 486 480 1.3 269 268 0.4 755 748 0.9Professional Areas 308 307 0.3 366 355 3.1 674 662 1.8Total 848 842 0.7 637 625 1.9 1,485 1,467 1.2
Women accounted for 42.9% of total employees (42.6% in 2008) and men accounted for 57.1% (57.4% in 2008).
Banca Fideuram Group employees outside Italy
Men Women Total
2009 2008 % change 2009 2008 % change 2009 2008 % changeDirectors 11 13 -15.4 - - - 11 13 -15.4Executive Management 59 58 1.7 37 37 - 96 95 1.1Professional Areas 48 48 - 42 39 7.7 90 87 3.4Total 118 119 -0.8 79 76 3.9 197 195 1.0
■ Executive Management W
18.1%
■ Professional Areas W24.6%
■ Directors M3.8%
■ Executive Management M
32.7%
■ Professional Areas M20.7%
■ Directors W0.1%
EMPLOYEESThe Banca Fideuram Group constantly invests in the professionalism of its employees, valuing its human resources and recognising their key role in the achievement of its corporate objectives. A series of dedicated organisational and training initiatives were launched to this end in 2009 to build individual competencies and promote our staff’s professional development within the Group.
The Banca Fideuram Group’s staff increased by approximately 1.2% from 1,467 at 31 December 2008 to 1,485 at 31 December 2009.

66 Annua l Repor t 2009
Staff contracts
Men Women Total
2009 2008 % change 2009 2008 % change 2009 2008 % change
Open-ended 831 836 -0.6 610 610 - 1,441 1,446 -0.3
Fixed-term 15 5 200.0 12 11 9.1 27 16 68.8
Work-entry contracts 2 1 100.0 13 2 n.s. 15 3 n.s.
Apprenticeship contracts - - - 2 2 - 2 2 -
Total 848 842 0.7 637 625 1.9 1,485 1,467 1.2
n.s.: not significant
Italy
Men Women Total
2009 2008 % change 2009 2008 % change 2009 2008 % change
Open-ended 718 720 -0.3 534 537 -0.6 1,252 1,257 -0.4
Fixed-term 10 2 n.s. 9 8 12.5 19 10 90.0
Work-entry contracts 2 1 100.0 13 2 n.s. 15 3 n.s.
Apprenticeship contracts - - - 2 2 - 2 2 -
Total 730 723 1.0 558 549 1.6 1,288 1,272 1.3
Outside Italy
Men Women Total
2009 2008 % change 2009 2008 % change 2009 2008 % change
Open-ended 113 116 -2.6 76 73 4.1 189 189 -
Fixed-term 5 3 66.7 3 3 - 8 6 33.3
Work-entry contracts - - - - - - - - -
Apprenticeship contracts - - - - - - - - -
Total 118 119 -0.8 79 76 3.9 197 195 1.0
Group personnel operating in Italy accounted for 86.7% of total employees, while those operating outside Italy accounted for 13.3%, which was practically the same as the previous year.
Employees by category of employment
54
486
308
2
269
366
-
100
200
300
400
500
600
Directors Executive Management Professional Areas
WomenMen
Employees by gender
730
118
558
79
-
100
200
300
400
500
600
700
800
Italy Outside Italy
WomenMen
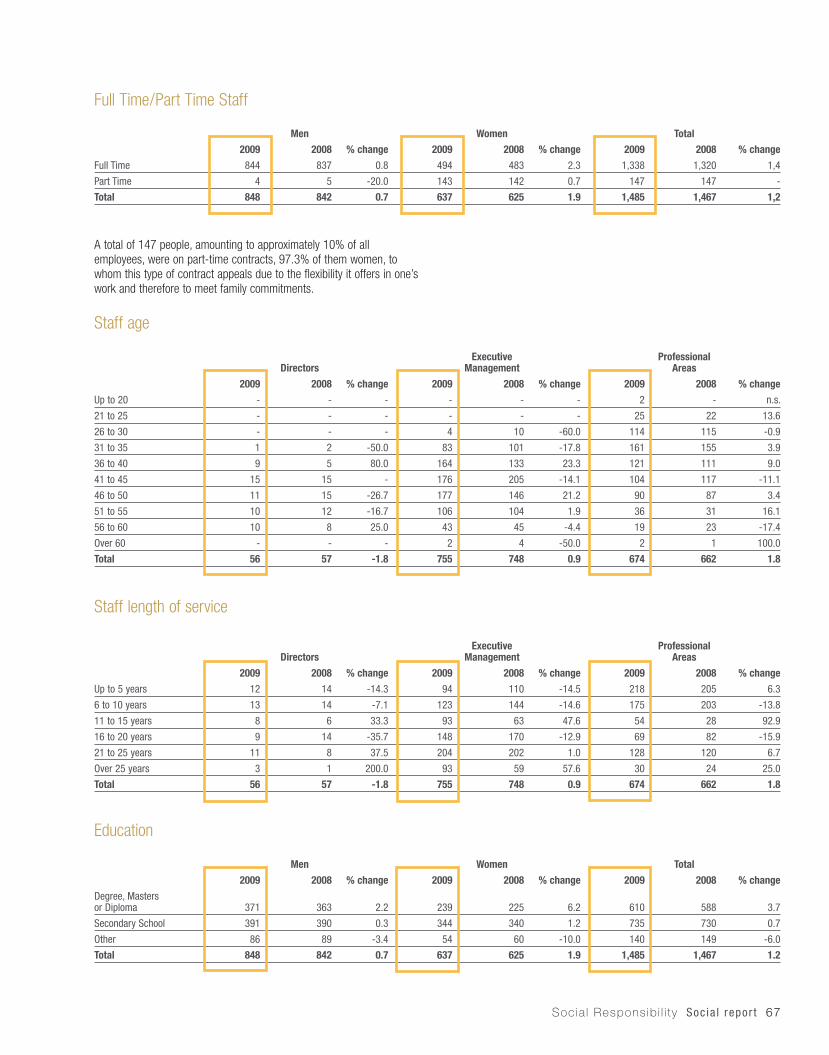
Socia l Responsib i l i ty Soc ia l repor t 67
Education
Men Women Total
2009 2008 % change 2009 2008 % change 2009 2008 % change
Degree, Masters or Diploma 371 363 2.2 239 225 6.2 610 588 3.7
Secondary School 391 390 0.3 344 340 1.2 735 730 0.7
Other 86 89 -3.4 54 60 -10.0 140 149 -6.0
Total 848 842 0.7 637 625 1.9 1,485 1,467 1.2
Staff length of service
DirectorsExecutive
ManagementProfessional
Areas
2009 2008 % change 2009 2008 % change 2009 2008 % change
Up to 5 years 12 14 -14.3 94 110 -14.5 218 205 6.3
6 to 10 years 13 14 -7.1 123 144 -14.6 175 203 -13.8
11 to 15 years 8 6 33.3 93 63 47.6 54 28 92.9
16 to 20 years 9 14 -35.7 148 170 -12.9 69 82 -15.9
21 to 25 years 11 8 37.5 204 202 1.0 128 120 6.7
Over 25 years 3 1 200.0 93 59 57.6 30 24 25.0
Total 56 57 -1.8 755 748 0.9 674 662 1.8
Staff age
Directors Executive
ManagementProfessional
Areas
2009 2008 % change 2009 2008 % change 2009 2008 % change
Up to 20 - - - - - - 2 - n.s.
21 to 25 - - - - - - 25 22 13.6
26 to 30 - - - 4 10 -60.0 114 115 -0.9
31 to 35 1 2 -50.0 83 101 -17.8 161 155 3.9
36 to 40 9 5 80.0 164 133 23.3 121 111 9.0
41 to 45 15 15 - 176 205 -14.1 104 117 -11.1
46 to 50 11 15 -26.7 177 146 21.2 90 87 3.4
51 to 55 10 12 -16.7 106 104 1.9 36 31 16.1
56 to 60 10 8 25.0 43 45 -4.4 19 23 -17.4
Over 60 - - - 2 4 -50.0 2 1 100.0
Total 56 57 -1.8 755 748 0.9 674 662 1.8
Full Time/Part Time Staff
Men Women Total
2009 2008 % change 2009 2008 % change 2009 2008 % change
Full Time 844 837 0.8 494 483 2.3 1,338 1,320 1,4
Part Time 4 5 -20.0 143 142 0.7 147 147 -
Total 848 842 0.7 637 625 1.9 1,485 1,467 1,2
A total of 147 people, amounting to approximately 10% of all employees, were on part-time contracts, 97.3% of them women, to whom this type of contract appeals due to the flexibility it offers in one’s work and therefore to meet family commitments.
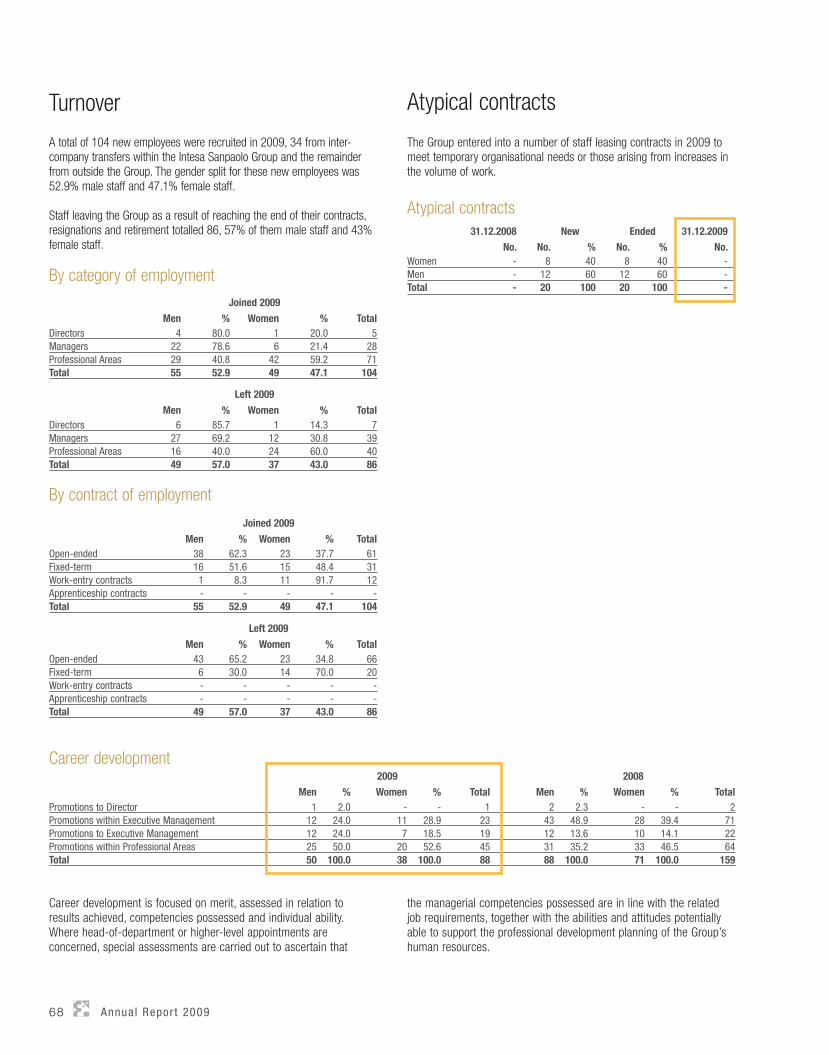
68 Annua l Repor t 2009
Atypical contracts
The Group entered into a number of staff leasing contracts in 2009 to meet temporary organisational needs or those arising from increases in the volume of work.
Career development is focused on merit, assessed in relation to results achieved, competencies possessed and individual ability. Where head-of-department or higher-level appointments are concerned, special assessments are carried out to ascertain that
Turnover
A total of 104 new employees were recruited in 2009, 34 from inter-company transfers within the Intesa Sanpaolo Group and the remainder from outside the Group. The gender split for these new employees was 52.9% male staff and 47.1% female staff.
Staff leaving the Group as a result of reaching the end of their contracts, resignations and retirement totalled 86, 57% of them male staff and 43% female staff.
By category of employment
Joined 2009
Men % Women % TotalDirectors 4 80.0 1 20.0 5Managers 22 78.6 6 21.4 28Professional Areas 29 40.8 42 59.2 71Total 55 52.9 49 47.1 104
Left 2009
Men % Women % TotalDirectors 6 85.7 1 14.3 7Managers 27 69.2 12 30.8 39Professional Areas 16 40.0 24 60.0 40Total 49 57.0 37 43.0 86
By contract of employment
Joined 2009
Men % Women % TotalOpen-ended 38 62.3 23 37.7 61Fixed-term 16 51.6 15 48.4 31Work-entry contracts 1 8.3 11 91.7 12Apprenticeship contracts - - - - -Total 55 52.9 49 47.1 104
Left 2009
Men % Women % TotalOpen-ended 43 65.2 23 34.8 66Fixed-term 6 30.0 14 70.0 20Work-entry contracts - - - - -Apprenticeship contracts - - - - -Total 49 57.0 37 43.0 86
Atypical contracts31.12.2008 New Ended 31.12.2009
No. No. % No. % No.Women - 8 40 8 40 -Men - 12 60 12 60 -Total - 20 100 20 100 -
Career development 2009 2008
Men % Women % Total Men % Women % TotalPromotions to Director 1 2.0 - - 1 2 2.3 - - 2Promotions within Executive Management 12 24.0 11 28.9 23 43 48.9 28 39.4 71Promotions to Executive Management 12 24.0 7 18.5 19 12 13.6 10 14.1 22Promotions within Professional Areas 25 50.0 20 52.6 45 31 35.2 33 46.5 64Total 50 100.0 38 100.0 88 88 100.0 71 100.0 159
the managerial competencies possessed are in line with the related job requirements, together with the abilities and attitudes potentially able to support the professional development planning of the Group’s human resources.
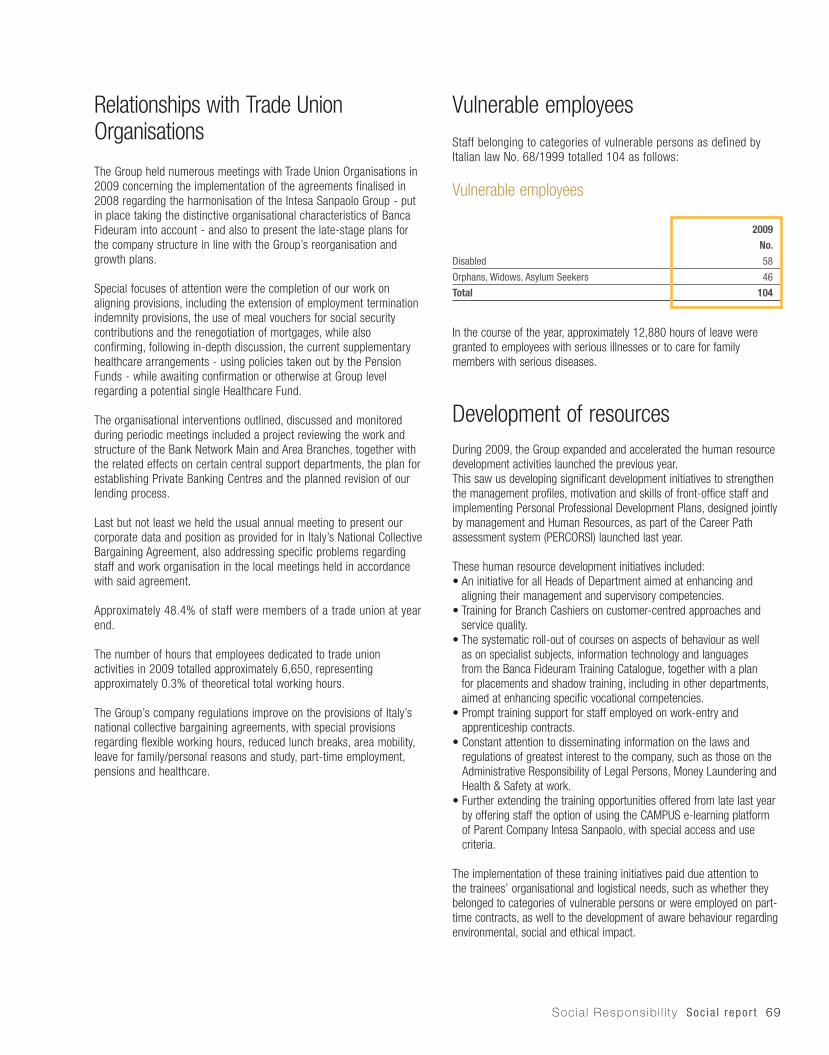
Socia l Responsib i l i ty Soc ia l repor t 69
Vulnerable employeesStaff belonging to categories of vulnerable persons as defined by Italian law No. 68/1999 totalled 104 as follows:
Vulnerable employees
2009
No.
Disabled 58
Orphans, Widows, Asylum Seekers 46
Total 104
In the course of the year, approximately 12,880 hours of leave were granted to employees with serious illnesses or to care for family members with serious diseases.
Development of resourcesDuring 2009, the Group expanded and accelerated the human resource development activities launched the previous year. This saw us developing significant development initiatives to strengthen the management profiles, motivation and skills of front-office staff and implementing Personal Professional Development Plans, designed jointly by management and Human Resources, as part of the Career Path assessment system (PERCORSI) launched last year.
These human resource development initiatives included: • An initiative for all Heads of Department aimed at enhancing and
aligning their management and supervisory competencies. • Training for Branch Cashiers on customer-centred approaches and
service quality. • The systematic roll-out of courses on aspects of behaviour as well
as on specialist subjects, information technology and languages from the Banca Fideuram Training Catalogue, together with a plan for placements and shadow training, including in other departments, aimed at enhancing specific vocational competencies.
• Prompt training support for staff employed on work-entry and apprenticeship contracts.
• Constant attention to disseminating information on the laws and regulations of greatest interest to the company, such as those on the Administrative Responsibility of Legal Persons, Money Laundering and Health & Safety at work.
• Further extending the training opportunities offered from late last year by offering staff the option of using the CAMPUS e-learning platform of Parent Company Intesa Sanpaolo, with special access and use criteria.
The implementation of these training initiatives paid due attention to the trainees’ organisational and logistical needs, such as whether they belonged to categories of vulnerable persons or were employed on part-time contracts, as well to the development of aware behaviour regarding environmental, social and ethical impact.
Relationships with Trade Union Organisations
The Group held numerous meetings with Trade Union Organisations in 2009 concerning the implementation of the agreements finalised in 2008 regarding the harmonisation of the Intesa Sanpaolo Group - put in place taking the distinctive organisational characteristics of Banca Fideuram into account - and also to present the late-stage plans for the company structure in line with the Group’s reorganisation and growth plans.
Special focuses of attention were the completion of our work on aligning provisions, including the extension of employment termination indemnity provisions, the use of meal vouchers for social security contributions and the renegotiation of mortgages, while also confirming, following in-depth discussion, the current supplementary healthcare arrangements - using policies taken out by the Pension Funds - while awaiting confirmation or otherwise at Group level regarding a potential single Healthcare Fund.
The organisational interventions outlined, discussed and monitored during periodic meetings included a project reviewing the work and structure of the Bank Network Main and Area Branches, together with the related effects on certain central support departments, the plan for establishing Private Banking Centres and the planned revision of our lending process.
Last but not least we held the usual annual meeting to present our corporate data and position as provided for in Italy’s National Collective Bargaining Agreement, also addressing specific problems regarding staff and work organisation in the local meetings held in accordance with said agreement.
Approximately 48.4% of staff were members of a trade union at year end.
The number of hours that employees dedicated to trade union activities in 2009 totalled approximately 6,650, representing approximately 0.3% of theoretical total working hours.
The Group’s company regulations improve on the provisions of Italy’s national collective bargaining agreements, with special provisions regarding flexible working hours, reduced lunch breaks, area mobility, leave for family/personal reasons and study, part-time employment, pensions and healthcare.

70 Annua l Repor t 2009
E-Learning
2009 2008 Change
Training area Attendances Total hours Attendances Total hours Attendances Total hours
Specialist 263 518 1,025 3,636 -74.3% -85.8%
Managerial Personal Development 38 142 30 112 26,7% 26.8%
Total 301 660 1,055 3,748 -71.5% -82.4%
Class-based training
2009 2008 Change
Training area Attendances Total hours Attendances Total hours Attendances Total hours
IN-HOUSE TRAINING
Specialist 1,272 16,832 2,692 11,347 -52.7% 48.3%
Managerial Personal Development 108 1,736 56 870 92.9% 99.5%
EXTERNAL TRAINING
Workshops/ConferencesLanguage courses 219 4,421 174 3,315 25.9% 33.4%
Total 1,599 22,989 2,922 15,532 -45.3% 48.0%
Our human resource development processes likewise saw us continuing the work of our managerial potential assessment centres, which aim to map the abilities and attitudes of staff with the potential for development towards roles or responsibilities in line with the Group’s corporate growth plans.
Lastly, 2009 saw the Group launch a plan for enhancing our Internal Communications through a gradual development programme during 2010 that aims to increase the efficiency of the Group’s communications and information processes by intensifying employee involvement both regarding person-company relations and extra-vocational subjects such as the environment, solidarity and leisure.
The training provided by Banca Fideuram Group companies in Italy totalled 23,649 hours in 2009 (+22.7% on 2008) as shown below, broken down into:• Class-based training: - In-house: technical/specialist and behaviour courses, organised
internally to meet training needs identified. - External: training courses/events to increase knowledge of specific
professional areas, delivered by specialist companies and institutes.• E-learning.
20082009
-
20%
40%
60%
80%
100%
Training by type of delivery (total hours)
Class-based training E-learning
97.2%
2.8%
80.6%
19.4%
Employee healthcare, pensions and servicesIn line with Intesa Sanpaolo’s human resource management policies and related tools, we offer a complete spectrum of staff benefits and concessions, including:
- Complementary social security- Supplementary health care- Company obligations in the event of the death in service or total
permanent disability of employees- Special staff conditions for bank transactions and loans- Bonus for 25 and 35 years’ service at 31 December 2006.
Committed to helping personnel return to work after long periods of leave, Banca Fideuram is involved in the PERmano project launched by Parent Company Intesa Sanpaolo to provide constant and constructive support to people before, during and after periods of leave. Employees
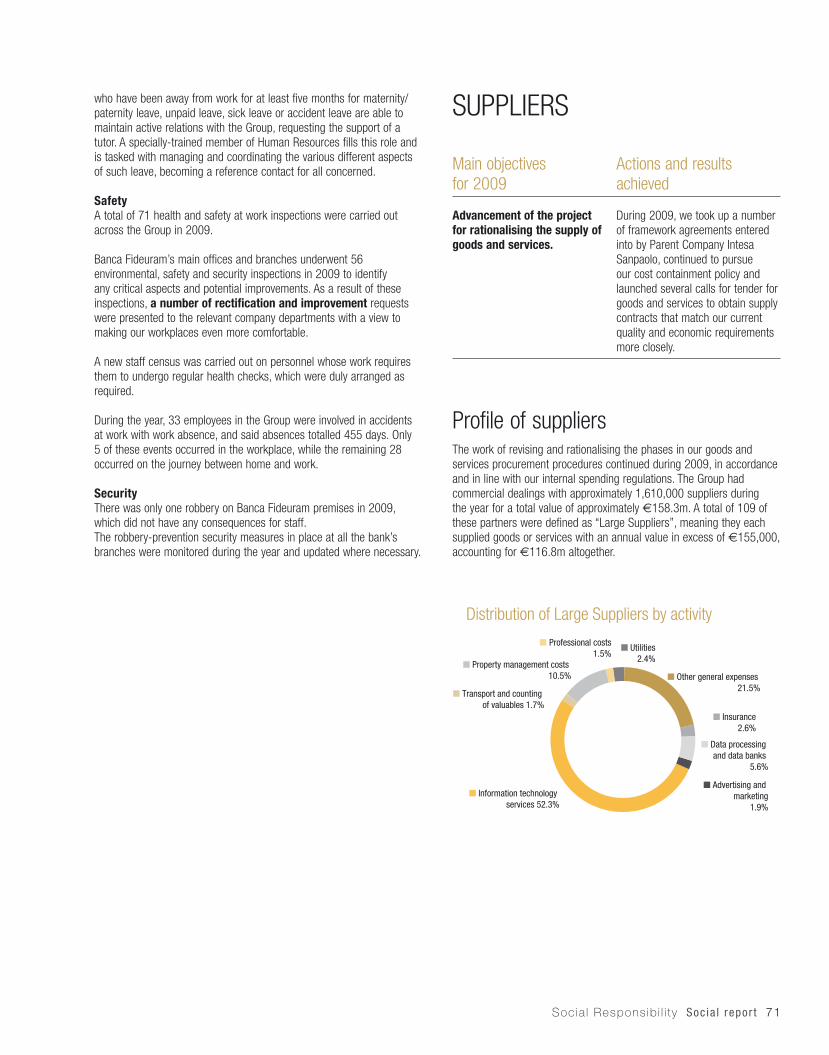
Socia l Responsib i l i ty Soc ia l repor t 71
who have been away from work for at least five months for maternity/paternity leave, unpaid leave, sick leave or accident leave are able to maintain active relations with the Group, requesting the support of a tutor. A specially-trained member of Human Resources fills this role and is tasked with managing and coordinating the various different aspects of such leave, becoming a reference contact for all concerned.
SafetyA total of 71 health and safety at work inspections were carried out across the Group in 2009.
Banca Fideuram’s main offices and branches underwent 56 environmental, safety and security inspections in 2009 to identify any critical aspects and potential improvements. As a result of these inspections, a number of rectification and improvement requests were presented to the relevant company departments with a view to making our workplaces even more comfortable.
A new staff census was carried out on personnel whose work requires them to undergo regular health checks, which were duly arranged as required.
During the year, 33 employees in the Group were involved in accidents at work with work absence, and said absences totalled 455 days. Only 5 of these events occurred in the workplace, while the remaining 28 occurred on the journey between home and work.
SecurityThere was only one robbery on Banca Fideuram premises in 2009, which did not have any consequences for staff. The robbery-prevention security measures in place at all the bank’s branches were monitored during the year and updated where necessary.
SUPPLIERS
Main objectives for 2009
Actions and results achieved
Advancement of the project for rationalising the supply of goods and services.
During 2009, we took up a number of framework agreements entered into by Parent Company Intesa Sanpaolo, continued to pursue our cost containment policy and launched several calls for tender for goods and services to obtain supply contracts that match our current quality and economic requirements more closely.
Profile of suppliersThe work of revising and rationalising the phases in our goods and services procurement procedures continued during 2009, in accordance and in line with our internal spending regulations. The Group had commercial dealings with approximately 1,610,000 suppliers during the year for a total value of approximately €158.3m. A total of 109 of these partners were defined as “Large Suppliers”, meaning they each supplied goods or services with an annual value in excess of €155,000, accounting for €116.8m altogether.
Distribution of Large Suppliers by activity
■ Data processing and data banks
5.6%
■ Advertising and marketing
1.9%
■ Information technology services 52.3%
■ Other general expenses 21.5%
■ Insurance2.6%
■ Property management costs 10.5%
■ Transport and counting of valuables 1.7%
■ Professional costs1.5%
■ Utilities2.4%
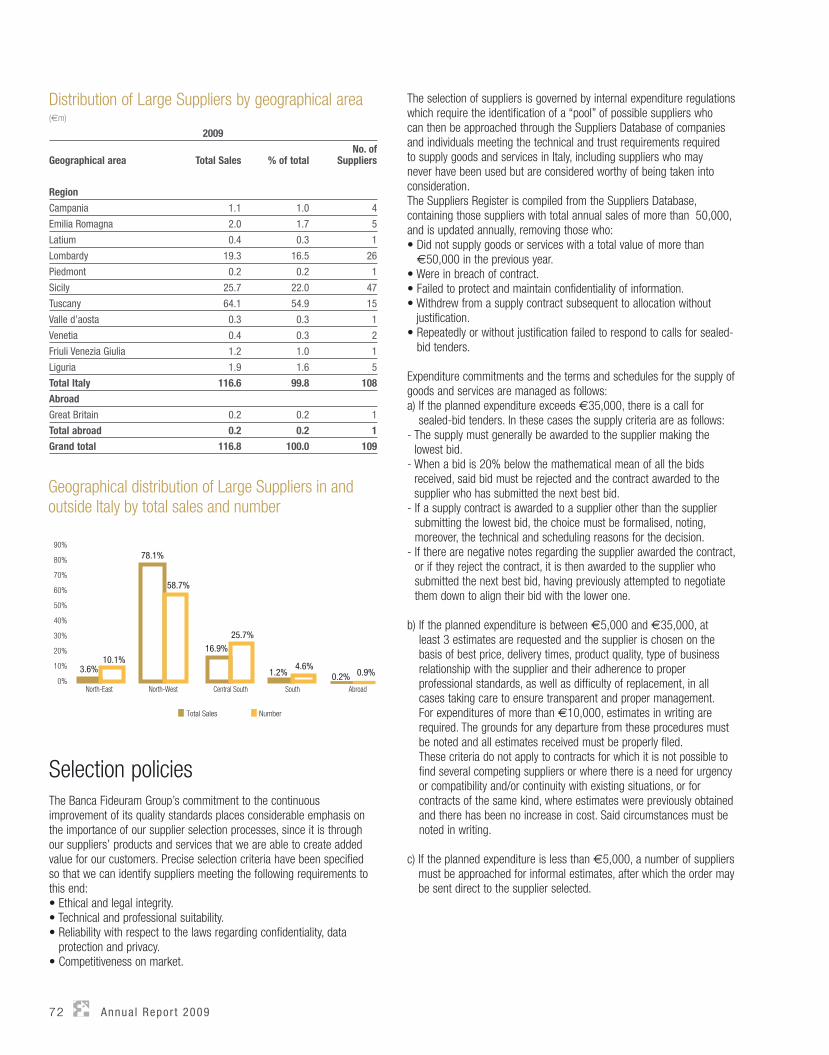
72 Annua l Repor t 2009
Distribution of Large Suppliers by geographical area(€m)
2009
Geographical area Total Sales % of total No. of
Suppliers
Region
Campania 1.1 1.0 4
Emilia Romagna 2.0 1.7 5
Latium 0.4 0.3 1
Lombardy 19.3 16.5 26
Piedmont 0.2 0.2 1
Sicily 25.7 22.0 47
Tuscany 64.1 54.9 15
Valle d’aosta 0.3 0.3 1
Venetia 0.4 0.3 2
Friuli Venezia Giulia 1.2 1.0 1
Liguria 1.9 1.6 5
Total Italy 116.6 99.8 108
Abroad
Great Britain 0.2 0.2 1
Total abroad 0.2 0.2 1
Grand total 116.8 100.0 109
Selection policiesThe Banca Fideuram Group’s commitment to the continuous improvement of its quality standards places considerable emphasis on the importance of our supplier selection processes, since it is through our suppliers’ products and services that we are able to create added value for our customers. Precise selection criteria have been specified so that we can identify suppliers meeting the following requirements to this end:• Ethical and legal integrity.• Technical and professional suitability.• Reliability with respect to the laws regarding confidentiality, data
protection and privacy.• Competitiveness on market.
The selection of suppliers is governed by internal expenditure regulations which require the identification of a “pool” of possible suppliers who can then be approached through the Suppliers Database of companies and individuals meeting the technical and trust requirements required to supply goods and services in Italy, including suppliers who may never have been used but are considered worthy of being taken into consideration. The Suppliers Register is compiled from the Suppliers Database, containing those suppliers with total annual sales of more than 50,000, and is updated annually, removing those who: • Did not supply goods or services with a total value of more than
€50,000 in the previous year.• Were in breach of contract.• Failed to protect and maintain confidentiality of information.• Withdrew from a supply contract subsequent to allocation without
justification.• Repeatedly or without justification failed to respond to calls for sealed-
bid tenders.
Expenditure commitments and the terms and schedules for the supply of goods and services are managed as follows:a) If the planned expenditure exceeds €35,000, there is a call for
sealed-bid tenders. In these cases the supply criteria are as follows:- The supply must generally be awarded to the supplier making the
lowest bid.- When a bid is 20% below the mathematical mean of all the bids
received, said bid must be rejected and the contract awarded to the supplier who has submitted the next best bid.
- If a supply contract is awarded to a supplier other than the supplier submitting the lowest bid, the choice must be formalised, noting, moreover, the technical and scheduling reasons for the decision.
- If there are negative notes regarding the supplier awarded the contract, or if they reject the contract, it is then awarded to the supplier who submitted the next best bid, having previously attempted to negotiate them down to align their bid with the lower one.
b) If the planned expenditure is between €5,000 and €35,000, at least 3 estimates are requested and the supplier is chosen on the basis of best price, delivery times, product quality, type of business relationship with the supplier and their adherence to proper professional standards, as well as difficulty of replacement, in all cases taking care to ensure transparent and proper management. For expenditures of more than €10,000, estimates in writing are required. The grounds for any departure from these procedures must be noted and all estimates received must be properly filed. These criteria do not apply to contracts for which it is not possible to find several competing suppliers or where there is a need for urgency or compatibility and/or continuity with existing situations, or for contracts of the same kind, where estimates were previously obtained and there has been no increase in cost. Said circumstances must be noted in writing.
c) If the planned expenditure is less than €5,000, a number of suppliers must be approached for informal estimates, after which the order may be sent direct to the supplier selected.
NumberTotal Sales
Geographical distribution of Large Suppliers in and outside Italy by total sales and number
0%
10%
20%
30%
40%
50%
60%
70%
80%
90%
3.6%10.1%
North-East
78.1%
58.7%
North-West
16.9%
25.7%
Central South
1.2%4.6%
South
0.2% 0.9%
Abroad

Socia l Responsib i l i ty Soc ia l repor t 73
AISM
“The AISM-Banca Fideuram grant made it possible for me to carry out a two-year research project at the University of California, San Francisco, on mesenchymal stem cells and the mechanisms behind their potential therapeutic effects on autoimmune diseases. The results are encouraging and the study, which has just been completed, thanks in part to the use of a new gene analysis approach, opens the way for potential further research into these mechanisms. The bone marrow contains progenitor mesenchymal cells known as mesenchymal stem cells (MSCs) which may regulate many functions of the autoimmune cells.It has recently been shown that MSCs can block the proliferation of certain immune system cells, suggesting that MSCs could be used as a therapy for diseases in which the immune system is compromised, such as multiple sclerosis. The research project set out to identify the principal mechanisms of these cells’ “regulatory” action on the immune system, including through the use of a new bioinformatic genetic analysis approach which made it possible to pinpoint certain genes of special interest involved in the regulation of molecules that influence immune system modulation. The research team also validated the experimental in vitro and in vivo genic expression results obtained by injecting MSCs in an animal model of multiple sclerosis. Lastly, it was also shown that MSCs lead to an improvement in the disease both in terms of reducing the clinical assessment score and in terms of reducing inflammatory infiltrates. The data suggest that the way MSCs block inflammation involves a variety of genes that lead to the production of molecules which are able to block the immune response that causes the inflammation characteristic of multiple sclerosis. Gaining an understanding of all the mechanisms involved in the therapeutic effect of MSCs could enable the evaluation of new therapeutic approaches to autoimmune diseases such as multiple sclerosis.”
Simona Casazza, Department of Neuroscience, Ophthalmology
and Genetics, University of Genoa.
Relationship ManagementSupplier relationship management may be direct or outsourced and is directed towards achieving effective and compliant performance of the contractual agreements.
Improvement objectives for 2010During 2010 we will continue to work on rationalising and optimising our selection processes by continuing to join Intesa Sanpaolo’s operating contracts and drawing up direct agreements with the suppliers of various types of goods and services in order to make our liabilities cycle more fluid and transparent.
THE COMMUNITYCharitable and other donations totalled €250,000 in 2009, equating to approximately one thousandth of our consolidated gross operating income in 2008, distributed to a number of respected bodies operating in the humanitarian, aid, scientific research, arts and environmental sectors. In pursuit of our community commitments, following detailed enquiries and a diligent selection process, we granted 44 requests for charitable donations in the year out of a total of 77 received, donating a total of €250,000 as follows:- €128,500 to 31 humanitarian and aid initiatives.- €115,000 to 13 associations operating in the arts and scientific
research sectors.In addition to said 44 donation requests granted, we also donated €6,500 to the Intesa Sanpaolo initiative in support of Abruzzo’s earthquake victims.
The bank has confirmed that the amount set aside for charitable and other donations in 2010 is €250,000. The Bank has likewise confirmed how this will be distributed to respected bodies operating in the aforementioned sectors.
Partnership with AISMBanca Fideuram’s interest in scientific research and commitment to those with serious illnesses saw us continuing our support for the Italian Multiple Sclerosis Association’s programme sponsoring research and study outside Italy, with a targeted donation of €30,000. These funds maintain our 2008 financing of a scientific research study at the University of California (San Francisco), extending the related grant for a further year. Our choice of the Italian Multiple Sclerosis Association (AISM) is not a random decision but the result of deeply shared aims and values. The AISM does not base its work exclusively on research which is essential for overcoming the disease in the near future, but also plays a leading role in supporting and attending to the families of people with the disease, regarding a strong local presence and close personal contact as key values - key values that are shared by Banca Fideuram.

74 Annua l Repor t 2009
The SkySpark project
During 2009, Banca Fideuram continued to be a supporting sponsor of the SkySpark project, which aims to develop an entirely electric passenger aircraft using the latest energy generation technologies. The fuel cells under development could make it possible to generate energy in the future with practically no impact in terms of either environmental or noise pollution. This ambitious project represents a concrete commitment to improving the quality of our daily life in its broadest sense, regarding not only the convenience of fast travel but also respect for the ecosystem which is the source of life and the habitat of each and every one of us. The project achieved its highly-important first goal in 2009, when pilot and astronaut Maurizio Cheli set a world speed record for alternative power aircraft at the World Air Games in Turin in June, reaching 250 kilometres per hour. Like the SkySpark project, Banca Fideuram was also founded on a visionary approach which has, moreover, proven itself capable of building concrete achievements year after year, thanks to the tenacity and strong convictions of a team with a real passion for challenge and a natural vocation for innovation.
The “Roma Seven 2009”The G. Onesti dell’Acqua Acetosa Sports Centre hosted the event that has dominated Rome’s summer sports scene for eight years, the “Roma Seven” international rugby sevens tournament which has won a place as one of the top 10 tournaments of its kind in the world. Banca Fideuram was the tournament’s title sponsor for the second year in a row in 2009, a year in which it welcomed 20 of the finest teams and clubs in Italy and the world for both men and women, who were included in the tournament for the first time. The Roma Seven kicked off on Thursday 5 June and ended on Saturday 7 June after a packed calendar of eliminators, finals and a tremendous grand final. The tournament over, the classic celebrations exploded in an exuberant “third half”.
Banca Fideuram - along with co-sponsors Rome City Council, Rome Provincial Council and the Ministry of Culture and Education - supported the organisation of the event unstintingly, ensuring amongst other things that it achieved extensive and widespread media coverage and was broadcast on the RAI Sport Più digital terrestrial TV channel. This achieved high visibility for the Group in the world of sport and again allied us with a discipline that is approached with great rigour, commitment and sacrifice, while being rewarded with great results and great appreciation - not unlike the work of our Personal Financial Advisers.

Socia l Responsib i l i ty Soc ia l repor t 75
Professional Events
Banca Fideuram devoted considerable attention to the professional sector in 2009, sponsoring Italy’s first national conference for accountants and bookkeepers, the Congresso Nazionale dei Dottori Commercialisti e degli Esperti Contabili held in the Lingotto Conference Centre in Turin between the 11th and 13th of March 2009 on the subject “Agents of change” (“Protagonisti del cambiamento”). We also organised a series of training days for bookkeepers, accountants, notaries and lawyers in Piedmont and Latium between March and June on the subject “Protecting our Heritage and Inheritance across the Generations”.
Yachting Gala III The third Yachting Gala organised by the Azimut-Benetti Group took place at the Varazze Marina on the 27th and 28th of June 2009 with the Banca Fideuram Group as main sponsor. The two-day event saw Banca Fideuram participating with its own stand on the Varazze Marina quayside, while also entertaining clients in the special VIP lounge and organising visits and sea trips on Azimut-Benetti yachts.
Tax Shield Events
Dedicated to helping our customers make informed choices in the management of their assets and to offering financial and pensions advice through highly-qualified professionals (key values in Banca Fideuram’s mission), we organised 25 events across Italy in September and October in conjunction with consultants Ceppellini Lugano & Associati and leading professional associations, involving over 2,000 professionals in an in-depth consideration of Italy’s “Tax Shield” legislation.

76 Annua l Repor t 2009
Roberto Bolle & Friends
The Banca Fideuram Group continued to support the National Trust for Italy (Fondo per l’Ambiente Italiano - FAI) in 2009, sponsoring the important cultural event “Roberto Bolle & Friends” at the Teatro Regio theatre in Turin. This international dance gala raised funds for the restoration of the Castello di Masino palace, the historic residence of the Counts Valperga, which the FAI bought in 1988.
Culture, Environment and Research
The Group donated €15,000 to support a research project organised by the Biology Department of the “Tor Vergata” University, Rome, into the effects of global warming on biodiversity. Other organisations receiving financial support from Banca Fideuram included the Università Cattolica del Sacro Cuore university, the Modigliani Institut Archives Légales and the National Trust for Italy (Fondo per l’Ambiente Italiano - FAI). Lastly, Banca Fideuram continued its support of the Amici della Scala Association in Milan in 2009.
Humanitarian projectsBanca Fideuram provided the same level of support for humanitarian projects in 2009 as in prior years. Many existing partnerships with non-profit associations and with Italian and international organisations that operate in areas where social hardship is a real emergency were continued to support new projects.
Special attention was dedicated to the San Patrignano Community which provides free accommodation and rehabilitation for socially excluded people and habitual users of all types of drugs through individual programmes and family support.
In addition, a substantial sum was donated to support a project by the Associazione Missioni Estere Cappuccini (Capuchin Association for Foreign Missions) to build a nursery school in an Ethiopian village that does not currently have any institution for children’s literacy and pre-school education.
Banca Fideuram helped Abruzzo’s earthquake victims by, amongst other things, financing the “La Fonte” association’s project to build a medical centre for the people of Rocca di Mezzo, in the Province of Aquila, whose health centre was declared unsafe following the earthquake of April 2009.
Lastly, Banca Fideuram also continued to provide financial support for the Lega del Filo d’oro, which assists the deafblind, Medici Senza Frontiere (Médecins Sans Frontières), the food bank association Fondazione per il Banco Alimentare, the Nucleo Protezione Civile dell’Associazione dei Carabinieri, the civil defence body of the Association of Carabinieri, and the police blood donor and volunteer work charity Associazione Donatori e Volontari Personale Polizia di Stato Onlus.
New links formed with charities during the year included, amongst others, the Palliative Care Service VIDAS and the Telefono Azzurro Rosa association against violence to children and women who successfully approached Banca Fideuram for donations to help them in their charitable work.
Restoration of the organ in the church of Sant’Ignazio di Loyola in Rome
Banca Fideuram’s passion for Italy’s artistic and cultural heritage continues to be expressed in its commitment to the now complete restoration of the Tamburini organ in the church of Sant’Ignazio di Loyola in Rome, undertaken by the Jesuit Fathers with the support of the Fondazione Pro Musica e Arte Sacra (Foundation for Sacred Music and Art). The restored organ was blessed in a formal ceremony on 22 November 2009, followed by a concert by the soloists of Munich’s Bavarian Radio Symphony Orchestra, conducted by Johannes Skudlik.

Socia l Responsib i l i ty Soc ia l repor t 77
Charitable activities of Sanpaolo Invest
In 2009, Sanpaolo Invest set aside a total of €9,000 for charity which was distributed to the following respected bodies in the humanitarian/aid sectors:• The Lanciano Domani Cultural Association, a non-profit
humanitarian and literacy organisation whose 2010 programme of activities includes the completion and expansion of its projects in recent years (building an additional classroom for a nursery school in Goru and the completion of three classrooms in the Awaite village school, together with the connection of the school and dining hall to the electricity network).
• The Associazione Ersilia Onlus, a humanitarian cultural association
that undertakes projects dedicated to the world’s poor. The association’s 2010 project is centred on building a paediatric health centre in the desert town of Manchay on the outskirts of Lima in Peru.
Sanpaolo Invest also regularly supports “Save the Children” by buying its Christmas cards.
In 2009, the Banca Fideuram Group company Fideuram Gestions SA chose to donate its Christmas card budget to Handicap International, an association that helps people in developing countries with disabilities resulting from incapacitating diseases, war and natural catastrophes.
Media RelationsIn an increasingly difficult market scenario, where financial consultancy and the need for relationships of trust have become crucially important for savers, the prime objective of our media communications is to highlight Banca Fideuram’s leadership in providing a customised financial advisory service and in private banking, while simultaneously increasing the visibility of the bank’s core business.
Media interest in the Banca Fideuram Group increased significantly in 2009. The creation of an innovative advanced advisory method (SEI), the development of our private banking, the recruitment of new Personal Financial Advisers, our financial results, Italy’s tax shield legislation, our fund managers’ market views and the future of Banca Fideuram proved the subjects of greatest interest to the Italian and international media.
The launch of SEI and further strengthening of Banca Fideuram’s competitive position in the private banking sector in particular attracted great media interest. We met with the press in May to present our new advanced advisory method, aiming to focus media attention on the implementation of this important project and succeeded in this goal, stimulating interviews, articles and editorials that appropriately identified the features and importance of this new advanced advisory method.
Our private banking project, creation of a dedicated service line and opening of our prestigious first Private Banking centres in Turin and Milan, together with the further strengthening of our product range for Private Banking customers, contributed significantly to gaining constant coverage of Banca Fideuram in the specialist and mainstream press, with updates and in-depth reporting that highlighted the strengths of our service in line with the high standing of the bank’s customers.
In addition, our continuous recruitment of new Personal Financial Advisers with large portfolios was noted on various occasions by the
media, who highlighted the advisory approach that has consistently set the bank apart and proved particularly appropriate in the market uncertainty and extreme volatility of recent years.
The media was kept informed of the bank’s operations and performance through regular press releases. In 2009, Banca Fideuram was moreover again one of the finalists in the section for “Major and Large Banks” of the “Oscar di Bilancio” Financial Statement Oscars thanks to the clarity and transparency of its financial statements.
Banca Fideuram’s initiatives regarding Italy’s “tax shield” legislation were centred on external communications targeted directly at players who have historically acted as mediators in the repatriation of capital, positioning the bank as a special partner of the main Italian professional associations (accountants, lawyers and notaries). We were able to achieve this thanks to the Group’s strong credibility and the established local presence of our distribution networks. The excellent business results achieved were duly reported in the press. What’s more we made use of a dedicated press survey throughout the “tax shield” period to keep our distribution networks updated on all the main developments on the subject in real time.
Our product factories were likewise the focus of media attention, generating many requests for the market views of the fund managers at Fideuram Investimenti and Fideuram Asset Management Ireland, who were frequently invited to take part in surveys and interviews by the specialist press, in whose reporting their outstanding fund management did not go unremarked.
Our objective for 2010 is to continue and consolidate the approach followed in 2009, aiming to support the work of our Personal Financial Advisers by providing customers, investors and employees alike with ever more attentive and transparent information.
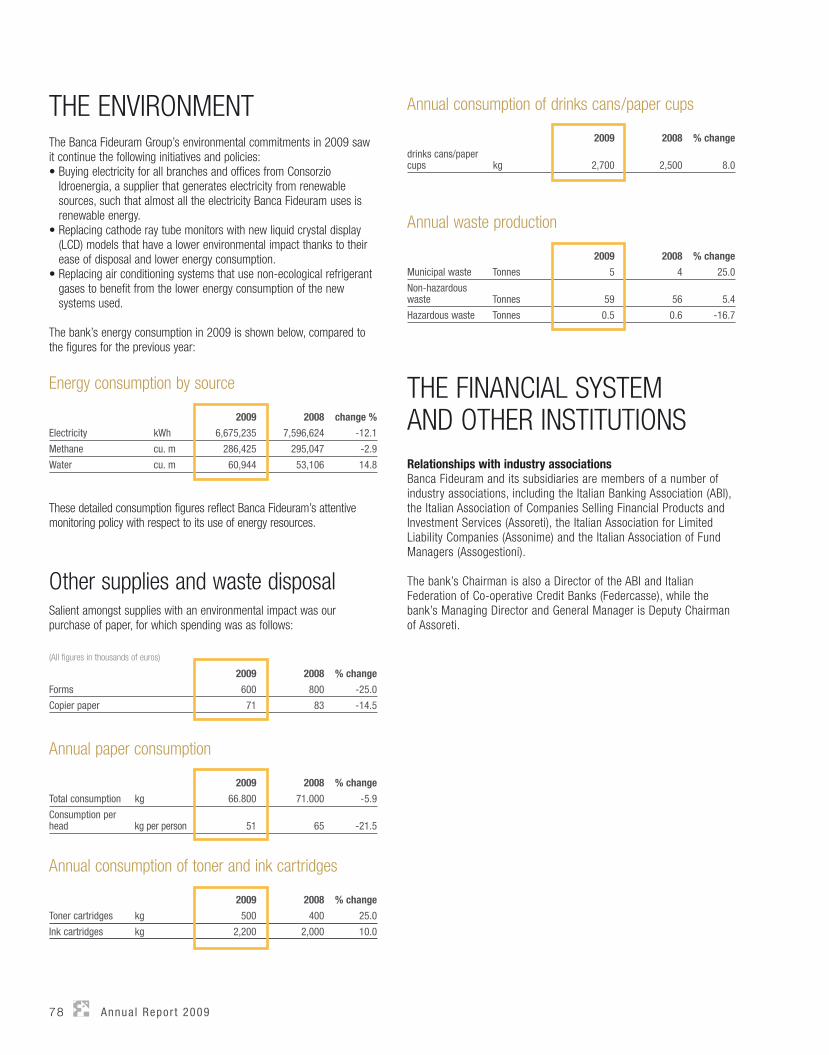
78 Annua l Repor t 2009
THE ENVIRONMENTThe Banca Fideuram Group’s environmental commitments in 2009 saw it continue the following initiatives and policies: • Buying electricity for all branches and offices from Consorzio
Idroenergia, a supplier that generates electricity from renewable sources, such that almost all the electricity Banca Fideuram uses is renewable energy.
• Replacing cathode ray tube monitors with new liquid crystal display (LCD) models that have a lower environmental impact thanks to their ease of disposal and lower energy consumption.
• Replacing air conditioning systems that use non-ecological refrigerant gases to benefit from the lower energy consumption of the new systems used.
The bank’s energy consumption in 2009 is shown below, compared to the figures for the previous year:
Energy consumption by source
2009 2008 change %
Electricity kWh 6,675,235 7,596,624 -12.1
Methane cu. m 286,425 295,047 -2.9
Water cu. m 60,944 53,106 14.8
These detailed consumption figures reflect Banca Fideuram’s attentive monitoring policy with respect to its use of energy resources.
Other supplies and waste disposalSalient amongst supplies with an environmental impact was our purchase of paper, for which spending was as follows:
(All fi gures in thousands of euros)
2009 2008 % change
Forms 600 800 -25.0
Copier paper 71 83 -14.5
Annual paper consumption
2009 2008 % change
Total consumption kg 66.800 71.000 -5.9
Consumption per head kg per person 51 65 -21.5
Annual consumption of toner and ink cartridges
2009 2008 % change
Toner cartridges kg 500 400 25.0
Ink cartridges kg 2,200 2,000 10.0
Annual consumption of drinks cans/paper cups
2009 2008 % change
drinks cans/paper cups kg 2,700 2,500 8.0
Annual waste production
2009 2008 % change
Municipal waste Tonnes 5 4 25.0
Non-hazardous waste Tonnes 59 56 5.4
Hazardous waste Tonnes 0.5 0.6 -16.7
THE FINANCIAL SYSTEMAND OTHER INSTITUTIONSRelationships with industry associationsBanca Fideuram and its subsidiaries are members of a number of industry associations, including the Italian Banking Association (ABI), the Italian Association of Companies Selling Financial Products and Investment Services (Assoreti), the Italian Association for Limited Liability Companies (Assonime) and the Italian Association of Fund Managers (Assogestioni).
The bank’s Chairman is also a Director of the ABI and Italian Federation of Co-operative Credit Banks (Federcasse), while the bank’s Managing Director and General Manager is Deputy Chairman of Assoreti.

Socia l Responsib i l i ty Soc ia l repor t 79
OTHER EVENTSFinancial Statements OscarsCommunication is essential for maintaining and increasing awareness of our brand, of our way of interpreting market trends and of providing advisory services to our customers. Which is why Banca Fideuram took part in the 2009 “Oscar di Bilancio” Financial Statement Oscars organised by the Italian Public Relations Federation (Federazione Relazioni Pubbliche Italiana - FERPI) under the High Patronage of the President of the Republic of Italy, which is the only National Award recognised by the Italian financial community, and has for over 50 years stimulated and promoted the development of a culture of transparent and exhaustive reporting.
The bank took part in the category Oscar for Major and Large Banks and Financial Companies in which it achieved the position of finalist on the following grounds:
The bank’s efforts to communicate its activities in a clear, simple and effective manner through graphs and other visual aids are worthy of special praise. The succinct corporate reporting is likewise commendable for its effective application of the principle of materiality in the logic “stakeholders/objectives/actions and results achieved”. The graphic design reflects the bank’s coordinated image.
The first bank in Italy to offer asset management services, Banca Fideuram has been a leader in private banking for over 40 years thanks to the quality of its advisory support.The bank’s prime objective is to provide its stakeholders with integrated, complete, transparent and comprehensible information in the form of accounting information and in-depth comments on the main aspects of the bank’s operations and performance. Nothing conveys the size and strength of a bank better than facts and figures, but our facts and figures could never have been achieved without our stakeholders’ trust.
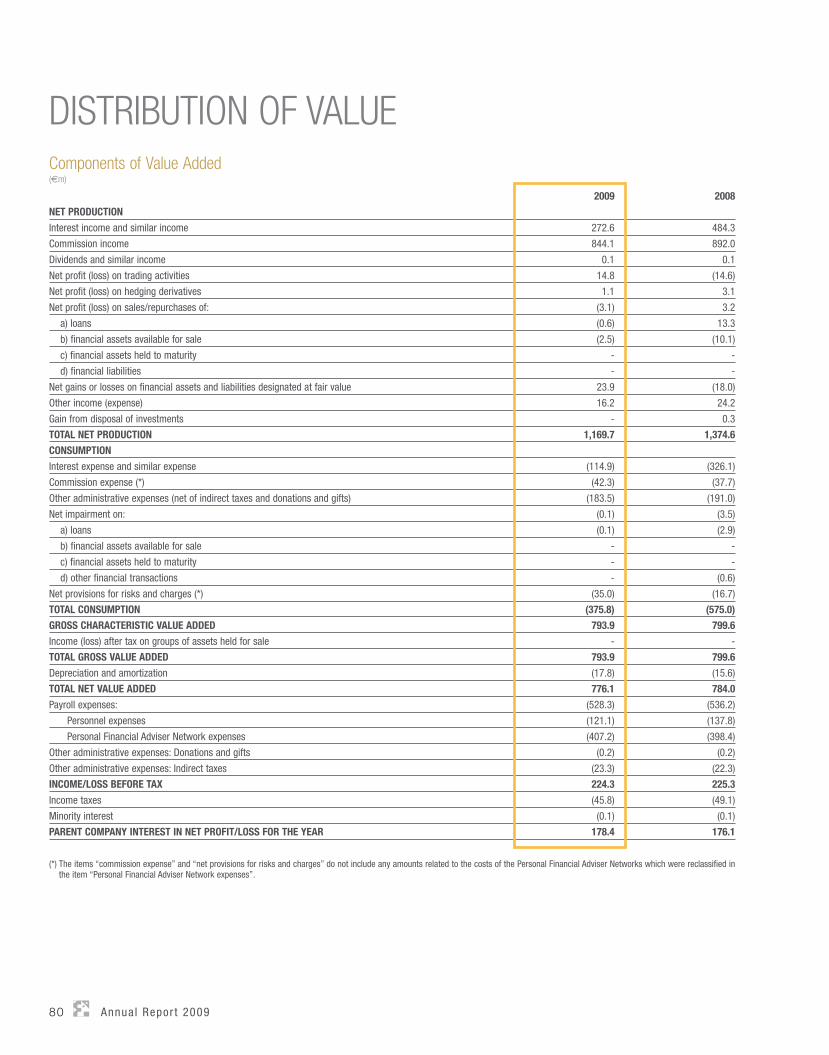
80 Annua l Repor t 2009
DISTRIBUTION OF VALUEComponents of Value Added(€m)
2009 2008
NET PRODUCTION
Interest income and similar income 272.6 484.3
Commission income 844.1 892.0
Dividends and similar income 0.1 0.1
Net profit (loss) on trading activities 14.8 (14.6)
Net profit (loss) on hedging derivatives 1.1 3.1
Net profit (loss) on sales/repurchases of: (3.1) 3.2
a) loans (0.6) 13.3
b) financial assets available for sale (2.5) (10.1)
c) financial assets held to maturity - -
d) financial liabilities - -
Net gains or losses on financial assets and liabilities designated at fair value 23.9 (18.0)
Other income (expense) 16.2 24.2
Gain from disposal of investments - 0.3
TOTAL NET PRODUCTION 1,169.7 1,374.6
CONSUMPTION
Interest expense and similar expense (114.9) (326.1)
Commission expense (*) (42.3) (37.7)
Other administrative expenses (net of indirect taxes and donations and gifts) (183.5) (191.0)
Net impairment on: (0.1) (3.5)
a) loans (0.1) (2.9)
b) financial assets available for sale - -
c) financial assets held to maturity - -
d) other financial transactions - (0.6)
Net provisions for risks and charges (*) (35.0) (16.7)
TOTAL CONSUMPTION (375.8) (575.0)
GROSS CHARACTERISTIC VALUE ADDED 793.9 799.6
Income (loss) after tax on groups of assets held for sale - -
TOTAL GROSS VALUE ADDED 793.9 799.6
Depreciation and amortization (17.8) (15.6)
TOTAL NET VALUE ADDED 776.1 784.0
Payroll expenses: (528.3) (536.2)
Personnel expenses (121.1) (137.8)
Personal Financial Adviser Network expenses (407.2) (398.4)
Other administrative expenses: Donations and gifts (0.2) (0.2)
Other administrative expenses: Indirect taxes (23.3) (22.3)
INCOME/LOSS BEFORE TAX 224.3 225.3
Income taxes (45.8) (49.1)
Minority interest (0.1) (0.1)
PARENT COMPANY INTEREST IN NET PROFIT/LOSS FOR THE YEAR 178.4 176.1
(*) The items “commission expense” and “net provisions for risks and charges” do not include any amounts related to the costs of the Personal Financial Adviser Networks which were reclassified in the item “Personal Financial Adviser Network expenses”.
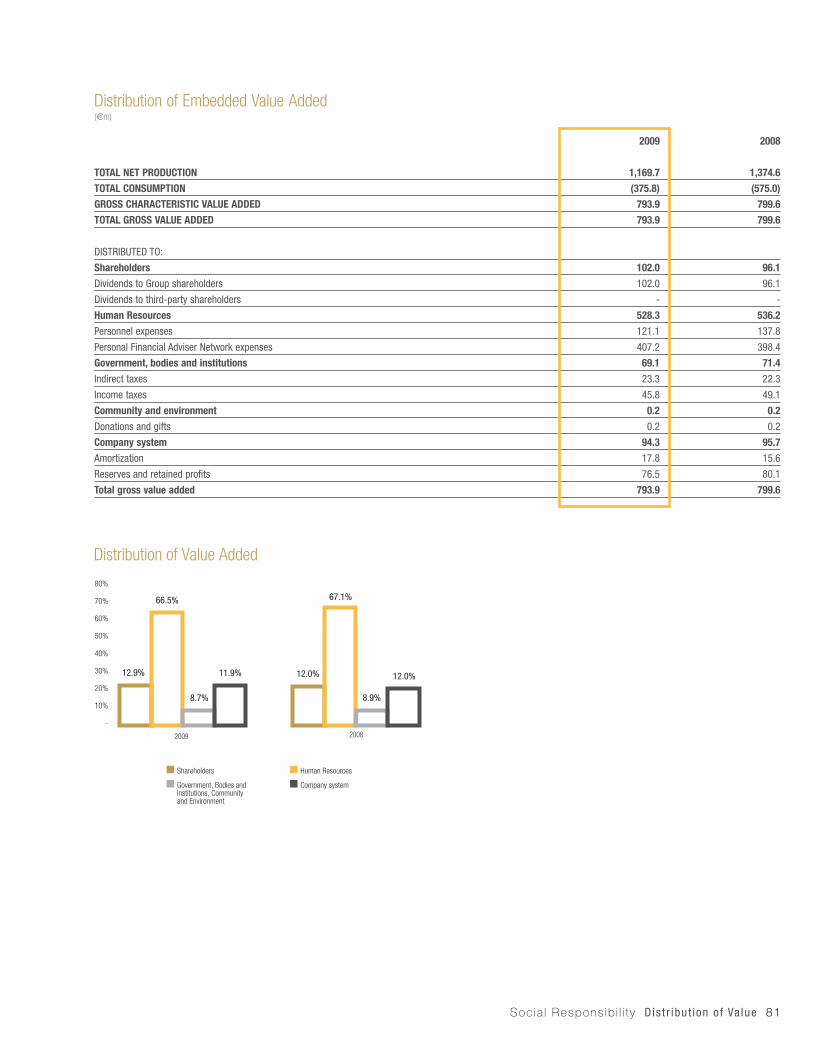
Socia l Responsib i l i ty Dis t r ibut ion o f Va lue 81
Distribution of Embedded Value Added(€m)
2009 2008
TOTAL NET PRODUCTION 1,169.7 1,374.6
TOTAL CONSUMPTION (375.8) (575.0)
GROSS CHARACTERISTIC VALUE ADDED 793.9 799.6
TOTAL GROSS VALUE ADDED 793.9 799.6
DISTRIBUTED TO:
Shareholders 102.0 96.1
Dividends to Group shareholders 102.0 96.1
Dividends to third-party shareholders - -
Human Resources 528.3 536.2
Personnel expenses 121.1 137.8
Personal Financial Adviser Network expenses 407.2 398.4
Government, bodies and institutions 69.1 71.4
Indirect taxes 23.3 22.3
Income taxes 45.8 49.1
Community and environment 0.2 0.2
Donations and gifts 0.2 0.2
Company system 94.3 95.7
Amortization 17.8 15.6
Reserves and retained profits 76.5 80.1
Total gross value added 793.9 799.6
Distribution of Value Added
-
10%
20%
30%
40%
50%
60%
70%
80%
Shareholders Human Resources
Government, Bodies and Institutions, Community and Environment
Company system
12.9% 12.0%
66.5% 67.1%
8.7% 8.9%
11.9% 12.0%
2009 2008


REPORT ON CORPORATE GOVERNANCE
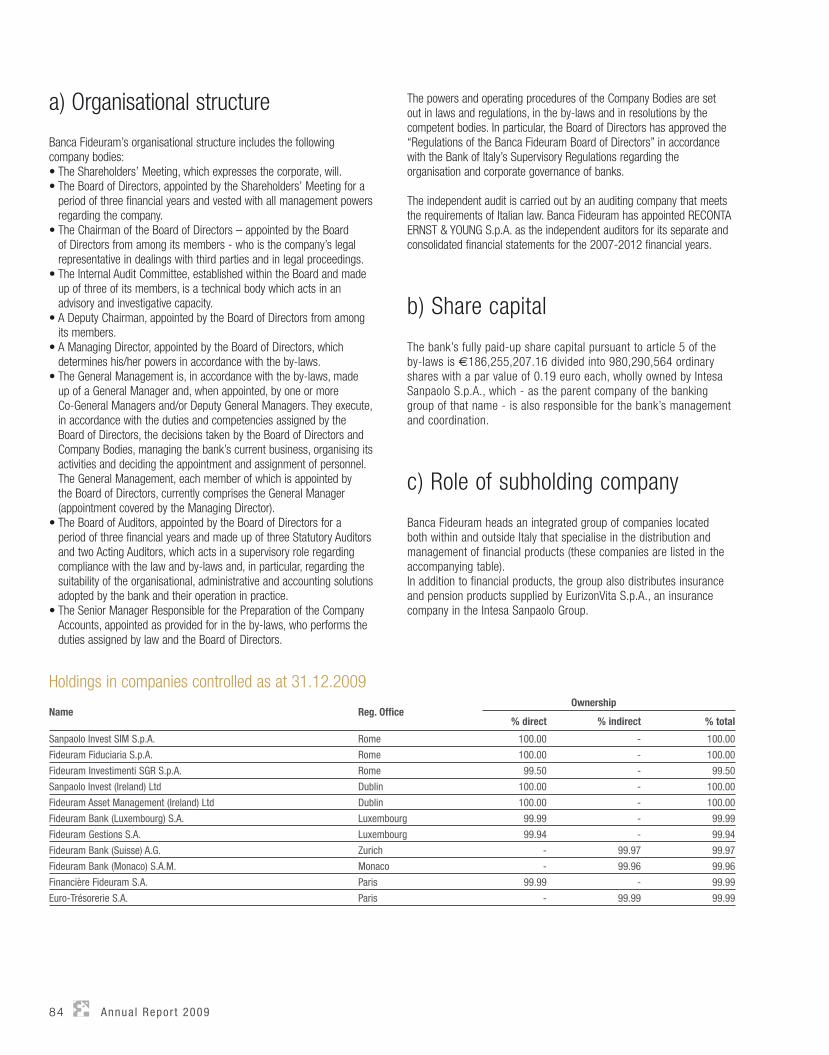
84 Annua l Repor t 2009
a) Organisational structure
Banca Fideuram’s organisational structure includes the following company bodies: • The Shareholders’ Meeting, which expresses the corporate, will. • The Board of Directors, appointed by the Shareholders’ Meeting for a
period of three financial years and vested with all management powers regarding the company.
• The Chairman of the Board of Directors – appointed by the Board of Directors from among its members - who is the company’s legal representative in dealings with third parties and in legal proceedings.
• The Internal Audit Committee, established within the Board and made up of three of its members, is a technical body which acts in an advisory and investigative capacity.
• A Deputy Chairman, appointed by the Board of Directors from among its members.
• A Managing Director, appointed by the Board of Directors, which determines his/her powers in accordance with the by-laws.
• The General Management is, in accordance with the by-laws, made up of a General Manager and, when appointed, by one or more Co-General Managers and/or Deputy General Managers. They execute, in accordance with the duties and competencies assigned by the Board of Directors, the decisions taken by the Board of Directors and Company Bodies, managing the bank’s current business, organising its activities and deciding the appointment and assignment of personnel. The General Management, each member of which is appointed by the Board of Directors, currently comprises the General Manager (appointment covered by the Managing Director).
• The Board of Auditors, appointed by the Board of Directors for a period of three financial years and made up of three Statutory Auditors and two Acting Auditors, which acts in a supervisory role regarding compliance with the law and by-laws and, in particular, regarding the suitability of the organisational, administrative and accounting solutions adopted by the bank and their operation in practice.
• The Senior Manager Responsible for the Preparation of the Company Accounts, appointed as provided for in the by-laws, who performs the duties assigned by law and the Board of Directors.
The powers and operating procedures of the Company Bodies are set out in laws and regulations, in the by-laws and in resolutions by the competent bodies. In particular, the Board of Directors has approved the “Regulations of the Banca Fideuram Board of Directors” in accordance with the Bank of Italy’s Supervisory Regulations regarding the organisation and corporate governance of banks.
The independent audit is carried out by an auditing company that meets the requirements of Italian law. Banca Fideuram has appointed RECONTA ERNST & YOUNG S.p.A. as the independent auditors for its separate and consolidated financial statements for the 2007-2012 financial years.
b) Share capital
The bank’s fully paid-up share capital pursuant to article 5 of the by-laws is €186,255,207.16 divided into 980,290,564 ordinary shares with a par value of 0.19 euro each, wholly owned by Intesa Sanpaolo S.p.A., which - as the parent company of the banking group of that name - is also responsible for the bank’s management and coordination.
c) Role of subholding company
Banca Fideuram heads an integrated group of companies located both within and outside Italy that specialise in the distribution and management of financial products (these companies are listed in the accompanying table). In addition to financial products, the group also distributes insurance and pension products supplied by EurizonVita S.p.A., an insurance company in the Intesa Sanpaolo Group.
Holdings in companies controlled as at 31.12.2009
Name Reg. OfficeOwnership
% direct % indirect % total
Sanpaolo Invest SIM S.p.A. Rome 100.00 - 100.00
Fideuram Fiduciaria S.p.A. Rome 100.00 - 100.00
Fideuram Investimenti SGR S.p.A. Rome 99.50 - 99.50
Sanpaolo Invest (Ireland) Ltd Dublin 100.00 - 100.00
Fideuram Asset Management (Ireland) Ltd Dublin 100.00 - 100.00
Fideuram Bank (Luxembourg) S.A. Luxembourg 99.99 - 99.99
Fideuram Gestions S.A. Luxembourg 99.94 - 99.94
Fideuram Bank (Suisse) A.G. Zurich - 99.97 99.97
Fideuram Bank (Monaco) S.A.M. Monaco - 99.96 99.96
Financière Fideuram S.A. Paris 99.99 - 99.99
Euro-Trésorerie S.A. Paris - 99.99 99.99
Repor t on corpora te governance 85
1. COMPANY DIRECTORSa) Composition and role of the
Board of Directors
The members of the bank’s current Board of Directors, whose term of office ends with the Shareholders’ Meeting to approve the financial statements for the 2011 financial year, are as follows:
Salvatore MACCARONE ChairmanAngelo CALOIA Deputy ChairmanMatteo COLAFRANCESCO Managing Director/General ManagerAlessandro BARBERIS DirectorCaterina BIMA DirectorFranca CIRRI FIGNAGNANI DirectorOscar GIANNONI DirectorCesare IMBRIANI DirectorPiero LUONGO DirectorGiampietro NATTINO DirectorGiuseppe RUSSO Director
Within the structure of the bank’s Board of Directors, the title of Executive Director may only be applied to the Managing Director and General Manager, in consideration of his/her assigned duties and powers of executive management and for the direction of the bank’s business and of the Personal Financial Adviser networks. Nine of the other Directors (Salvatore Maccarone, Angelo Caloia, Alessandro Barberis, Caterina Bima, Franca Cirri Fignagnani, Oscar Giannoni, Cesare Imbriani, Giampietro Nattino and Giuseppe Russo) satisfy the requirements of independence set out in article 13 of the by-laws. These directors:(a) Are not employed by and do not have ongoing consultancy or
remunerated work or other financial relationships with the company or its subsidiaries, parent companies or companies in which it has a joint controlling interest able to compromise their independence.
(b) Are not executive directors of the company or its subsidiaries, parent companies or companies in which it has a joint controlling interest.
(c) Are not relatives up to the second degree of consanguinity or affinity of any people in the situations specified in point (b) above.
Pursuant to said article 13 of the by-laws, the Board of Directors issued a specific regulation setting the maximum number of appointments outside the Intesa Sanpaolo Group that may be held by Directors (5 for Executive Directors and 10 for Non-Executive Directors) and has verified that each Director respects the limit on the total number of appointments they may hold on the basis of their own individual declarations. In accordance with article 17 of the by-laws, the Board of Directors is in charge of the bank’s ordinary and extraordinary management, excepting in those matters where Italian law restricts decision-making power to the Shareholders’ Meeting. In particular, the Board of Directors has the authority to make decisions concerning, inter alia, general management policy, strategic policy and operations and business and financial plans, the approval of internal regulations, the appointment of General Management and internal audit managers, and the purchase and sale of
equity investments. The Board of Directors likewise has the authority to make decisions concerning the following: • Mergers and spin-offs in the cases and following the procedures
provided for by the laws and regulations in force. • The establishment and closure of sub-offices. • Reductions in the share capital in cases of the withdrawal of
shareholders. • Amendments to the by-laws in line with regulatory provisions. When delegating authority to the other company bodies, the Board of Directors expressly retained sole responsibility for all the duties set out in article 1, subparagraph 1, of the Italian Stock Exchange’s Code of Self-discipline of Listed Companies, and in particular: a) Approving the strategic business and financial plans of the bank and
its subsidiaries and formulating directives governing relations with subsidiaries.
b) Approving the separate and consolidated budget and monthly, quarterly, half-year and annual financial statements.
c) Assessing the suitability of the organisational, administrative and general accounting systems of the bank and of its strategically significant subsidiaries.
d) Delegating authority to company bodies and revoking such authority, specifying the limits to and procedures for the exercise of said authority, together with the frequency - at least quarterly - with which said bodies are required to report to the Board of Directors on the activities carried out in the exercise of said authority.
e) Deciding, in line with Group policies, the remuneration of the members of General Management as well as, following favourable consultation with the Board of Auditors, the remuneration of directors with special positions or duties.
f) Evaluating general performance, taking into consideration, in particular, the information received from company bodies and regularly comparing the results achieved with those planned.
g) Examining and approving strategically, economically or financially significant transactions by the bank and its subsidiaries, paying particular attention to situations in which one or more directors have a potential direct or indirect conflict of interest, or, more generally, to transactions with related parties.
h) Reporting to the Shareholders at the Shareholders’ Meeting on activities carried out and planned.
Where transactions with related parties are concerned, on 12 May 2008, the bank’s Board of Directors adopted the latest version of Intesa Sanpaolo’s Regulations governing the management of transactions with related parties, the implementation of which was completed with the approval, at the next Board Meeting on 24 June 2008, of the Banca Fideuram Group Regulations governing the management of transactions with related parties. The main points in said regulations are as follows. The Board of Directors must be kept constantly informed of all decisions taken by delegated bodies through information supplied at regular intervals by the Managing Director and General Manager.
Meetings of the Board of Directors, which the by-laws stipulate must generally be held at two-month intervals, are normally held every month. The Board of Directors held 12 meetings in 2009. Board Meeting Attendance was 94% overall, both where all the Directors and the Independent Directors in particular were concerned.

86 Annua l Repor t 2009
b) Chairman
In accordance with the provisions of the by-laws, the Chairman is empowered to act as the company’s legal representative. The Board of Directors has in addition assigned non-managerial duties and powers to the Chairman that are instrumental to the operation of the company, including: Supervising the implementation - by the Managing Director and General Manager - of the resolutions of the Board of Directors. Acting on the decisions of the Board of Directors, having taken due note of the opinions of the Managing Director and General Manager, with respect to share capital and the purchase and sale of equity investments. Proposing the appointment of members of General Management in consultation with the Managing Director and General Manager. Formulating and managing communications, branding and charitable activities in consultation with the Managing Director and General Manager.
c) Managing Director and General Manager
The Managing Director and General Manager is responsible for the management of the bank and Personal Financial Adviser Networks, with full powers of ordinary and extraordinary management in accordance with the general planning and strategic policies decided by the Board of Directors, with the sole exception of those powers which by law may not be delegated and those restricted to the Board of Directors or other company bodies.
d) Internal Audit CommitteeThe Board of Directors is supported in its institutional functions by a Technical Committee set up from among its members, which acts in an advisory and investigative capacity.
The Internal Audit Committee is made up of the Directors Cesare Imbriani, who also chairs the committee, Giuseppe Russo and Franca Cirri Fignagnani - all non-executive directors and independent in accordance with the by-laws.
The following participate in the work of the Committee: the Chairman of the Board of Auditors, the Managing Director and General Manager, the Head of the bank’s Audit Department and the Head of the parent company’s Audit Department.
The Internal Audit Committee held 13 meetings in 2009.
The Members of the Board of Directors and Internal Audit Committee are provided with the documents and information required for proper evaluation of the items on the agenda suitably in advance of their meetings.
2. REMUNERATION OF DIRECTORS
The policies governing the remuneration of directors in accordance with article 12 of the by-laws are approved by the Shareholders’ Meeting. The latter decides the annual remuneration of each Director and any compensation for attending meetings of the Board of Directors and any Committees in accordance with article 18 of the by-laws. The Board of Directors decides the additional remuneration of Directors with special positions or duties, in accordance with article 2389 of the Italian Civil Code, having taken due note of the opinion of the Board of Auditors. The Managing Director is, as General Manager, entitled to a gross fixed salary and a variable bonus linked to the achievement of objectives set in advance by the Board of Directors.
Details of the remuneration paid to the Directors are provided in the Notes to the Annual Financial Statements.
3. INTERNAL AUDIT SYSTEMThe internal audit system is an essential core component of the bank’s corporate processes, designed to ensure, through managing the related risks, that the bank and its subsidiaries are managed properly with a view to achieving their set objectives and, at the same time, to taking care of their stakeholders’ interests.
The internal audit system operates in accordance with the relevant laws and regulations in force and, in particular, the related provisions of the Bank of Italy’s supervisory regulations, the Italian Finance Consolidation Act and the provisions implementing it issued by the Italian National Commission for Listed Companies and the Stock Exchange (CONSOB) and the Bank of Italy, as well as the internal regulations of the Intesa Sanpaolo Group. The related duties are entrusted to the aforementioned Internal Audit Committee and a dedicated Audit Department, which reports directly to the Board of Directors and to the Managing Director and General Manager, and which enjoys the necessary autonomy and independence from the operating structures and has unrestricted access to company data, archives and assets in the performance of its duties.
The Board of Directors has assigned the Internal Audit Committee the following duties: • Assisting the Board of Directors in the performance of its duties of
establishing guidelines and periodic checks into the suitability and effective operation of the Bank and its subsidiaries’ internal audit system.
• Evaluating the work plans prepared by the Audit Department Manager and Compliance Unit and receiving their periodic reports.
• Evaluating, together with the Senior Manager Responsible for the Preparation of the Company Accounts and the Independent Auditors, the suitability of the accounting policies used and their compatibility

Repor t on corpora te governance 87
for the purposes of preparing the separate and consolidated financial statements, through the prompt examination of the annual and interim accounts.
• Evaluating the Independent Auditors’ proposals, submitted with the aim of gaining appointment, as well as the work plan prepared for the audit and the results set out in the report and letter of comments.
• Maintaining close contacts with the Board of Auditors, through the Chairman of the Board of Auditors’ participation in the Committee’s meetings, in order to ensure a prompt two-way exchange of information on matters relevant to the internal audit system.
• Reporting to the Board of Directors, at least six-monthly, upon the approval of the financial statements and half-year report, on the activities carried out and on the suitability of the bank and its subsidiaries’ internal audit system.
The Committee is in addition also required to: • Provide prior evaluation of the suitability of any significant insider
transactions with related parties. • Assess customer complaints concerning bonds issued by
corporate parties in default and proposals regarding compensation for damages to customers for any offences by Personal Financial Advisers.
• Performing any additional duties assigned by the Board of Directors, in particular with regard to relations with the Independent Auditors.
The Board of Directors adopted the new Banca Fideuram “Model of organisation, management and control in accordance with Italian Legislative Decree No. 231 of 8 June 2001” at its meeting of 11 December 2008 (subsequently updated at the board meeting of 12 May 2009), which aims to prevent the possibility of the offences specified in the decree from being committed and, consequently, the administrative responsibility of the company.
The duty of supervising the operation and effectiveness of the model and compliance with it is entrusted to a Supervisory Board vested with autonomous powers of initiative and control that is autonomous, independent, professional and operates with continuity of action.
The Banca Fideuram Board of Directors implemented the provisions of said model by making its Supervisory Board independent and distinct from the Internal Audit Committee. The Supervisory Board is currently made up of Director Cesare Imbriani, who Chairs the Board, Alessandro Cotto (Acting Auditor) and Pierluigi Cipolloni (Head of the Audit Department).
The Supervisory Board held 8 meetings in 2009.
The Audit Department is responsible for auditing the proper conduct of the bank’s operations and processes, assessing the bank’s overall internal audit system and its suitability for ensuring the effectiveness and efficiency of company processes, the reliability and integrity of accounting and management information, and the compliance of operations both with the policies established by the company’s governance bodies and with internal and external regulations. The activities of the Audit Department are principally focused on identifying any abnormal or risk behaviour and situations, any infringements of the law and regulations in Italy and abroad, as
well as any failure to respect internal procedures and regulations, formulating recommendations regarding the implementation of the measures required to eliminate the phenomena noted.
The Audit Department currently comprises the following units: • The Networks Audit Unit, which is responsible for auditing the
Banca Fideuram and Sanpaolo Invest Networks, as well as the bank’s peripheral banking structures.
• The Central Departments and Subsidiaries Audit Unit, which is responsible for carrying out the auditing and internal auditing of the bank’s central organisational departments and of its subsidiaries.
The Head of the Audit Department reports to the Internal Audit Committee at every meeting - normally monthly - on the activities carried out in the period as well as on any specific related matters, and prepares a report at six-month intervals on the department’s activities, which is presented to the Board of Directors and Board of Auditors, following its prior presentation to the Internal Audit Committee.
The Audit Department provides prompt notification of any confirmed serious irregularities to the Chairman of the Board of Directors, the Managing Director and General Manager, the Chairman of the Internal Audit Committee, the Chairman of the Board of Auditors and the Head of the Parent Company’s Audit Department for the information to be presented at the earliest practicable meeting of the Internal Audit Committee and, in the most serious cases, of the Board of Directors.
The Corporate Risk Department reports directly to the Board of Directors and to the Managing Director and General Manager. The department is responsible for drawing up risk management and compliance guidelines and policies in line with company strategies and objectives and our parent company’s guidelines, as well as for coordinating their implementation.
The Compliance Unit within the Corporate Risk Department is organisationally and operatively separate from the Audit Department and is responsible for identifying, over time, the laws and sector regulations which apply, measuring and evaluating their impact on company processes and procedures, while verifying the bank’s compliance with them, in addition to managing the audit and control activities related to Italian Legislative Decree No. 231/2001.
The Compliance Unit monitors compliance risk, verifying that all internal processes are consonant with the objective of preventing the infringement of any laws and regulations, in addition to supporting company departments with the ex-ante evaluation of the compliance aspects of projects and with developing and proposing any organisational and procedural changes for ensuring appropriate management and preventing compliance risks, evaluating the effectiveness of said changes over time.
The Board of Directors and Internal Audit Committee are kept informed of the Compliance Unit’s activities at six-monthly intervals. Following favourable consultation with the Board of Auditors, the Board of Directors appointed the Head of the Corporate Risk Department as the bank’s Compliance Officer.

88 Annua l Repor t 2009
6. SHAREHOLDERS’ MEETINGSThe practice adopted thus far by the Board of Directors has always been as follows: • To ensure shareholders are provided with information on the company
at Shareholders’ Meetings. • To encourage the participation of all the Directors in Shareholders’
Meetings. Shareholders’ Meetings are called in accordance with the by-laws, giving written notice delivered at least eight days in advance by registered mail with return receipt to all shareholders in the list of shareholders, sent to their respective places of domicile or, if the shareholder has specifically requested it for this purpose, to their fax number or e-mail address.
There were two Banca Fideuram Shareholders’ Meetings during the 2009 financial year: • An Ordinary Shareholders’ Meeting on 7 April to review the
remuneration of the bank’s independent auditors, approve the annual financial statements, appoint the Board of Directors and decide their emoluments together with the matters specified in Italian Ministerial Decree No. 161/98 regarding the requirements of bank managers.
• A Shareholders’ Meeting on 25 June to approve a series of proposed amendments to the by-laws in extraordinary session, and to approve matters of remuneration policy in ordinary session.
7. BOARD OF AUDITORSThe term of the bank’s current Board of Auditors ends with the Shareholders’ Meeting called to approve the 2010 financial statements. The current Board of Auditors consists of:
Vincenzo MEZZACAPO Chairman of the Board of AuditorsCarlo ANGELINI Statutory AuditorLorenzo GINISIO Statutory AuditorRuggero RAGAZZONI Acting AuditorAlessandro COTTO Acting Auditor
The Board of Auditors held 15 meetings in 2009.
The Board of Auditors takes part in every meeting of the Board of Directors and is therefore continuously informed about the bank’s activities. In accordance with the combined provisions of article 2381 of the Italian Civil Code and article 19 of the by-laws, and to ensure that the Board of Auditors possesses every informational tool necessary to perform its duties effectively, the Directors report to the Board of Auditors at least quarterly on the most significant economic, financial and asset-related activities of the company and its subsidiaries, as well as, in particular, on the transactions in which they have an interest, either on their own behalf or on behalf of third parties, or which have been influenced by parties that play a senior management or coordinating role.
At its meeting of 13 December 2007, the Board of Directors approved the “Banca Fideuram Operational Risk Management Regulations” implementing the “Group Operational Risk Management Guidelines”, adapting the guiding principles, organisational architecture and general Operational Risk Management processes provided for at Group level to its own operating context.
4. TRANSACTIONS WITH RELATED PARTIES
On 24 June 2008, the Board of Directors approved the latest version of the Banca Fideuram Group Regulations governing the management of transactions with related parties, intended to ensure the correctness of significant insider transactions, carried out either directly or indirectly by its subsidiaries, with its own related parties or with those of parent company Intesa Sanpaolo. This procedure specifies the following in particular: • The criteria for identifying related parties. • The procedure for investigating transactions with related parties. • The transactions with related parties that may only be authorised
by the bank’s or its subsidiaries’ Boards of Directors. • The transactions for which prior evaluation by the Internal Audit
Committee is required, as well as those requiring the prior opinion of the parent company.
• Subsequent periodic information.
In those cases where the related party is also a director of the banking group, the situation is not only governed by the group’s regulations for transactions with related parties, but also by the special provisions set forth in article 136 of Italian Legislative Decree No. 385/1993 (the Banking Consolidation Act - Testo Unico Bancario), as well as - where appropriate - the provisions of articles 2391 and 2391-bis of the Italian Civil Code governing directors’ interests, and article 2497-ter of the Civil Code on decisions taken by parties that play a senior management or coordinating role.
5. CONFIDENTIAL INFORMATIONThe Board of Directors adopted the Intesa Sanpaolo “Regulations governing the communication of inside information to the market”, which it implemented by issuing its own internal regulations in compliance with Italian market abuse law and regulations. The bank also started maintaining an Insider List.

La Re laz ione su l Governo soc ie tar io 89


CONSOLIDATEDFINANCIALSTATEMENTS

92 Annua l Repor t 2009
Consolidated Balance Sheet(All fi gures in thousands of euros)
31.12.2009 31.12.2008
ASSETS
10. Cash and cash equivalents 77,188 29,055
20. Financial assets held for trading 56,680 96,745
30. Financial assets designated at fair value 218,723 183,978
40. Financial assets available for sale 2,858,332 2,613,474
50. Financial assets held to maturity 605,451 609,780
60. Due from banks 3,698,915 4,462,356
70. Loans to customers 2,014,785 1,852,219
80. Hedging derivatives 236 -
90. Adjustment of financial assets subject to generic hedging - -
100. Investments in associates 190 120
110. Reinsurers' share of technical reserves - -
120. Property and equipment 31,541 31,757
130. Intangible assets 27,135 26,613
including: goodwill - -
140. Tax assets 161,308 148,453
a) current 12,075 6,910
b) deferred 149,233 141,543
150. Non-current assets and groups of assets held for sale - -
160. Other assets 572,805 510,468
TOTAL ASSETS 10,323,289 10,565,018
Chairman of the Board of DirectorsSalvatore Maccarone
Managing Director Matteo Colafrancesco
Senior Manager Responsible for the Preparation of the company accountsPaolo Bacciga

Consol idated F inancia l Statements Conso l ida ted Ba lance Sheet 93
Consolidated Balance Sheet(All fi gures in thousands of euros)
31.12.2009 31.12.2008
LIABILITIES AND SHAREHOLDERS’ EQUITY
10. Due to banks 607,756 452,864
20. Due to customers 7,736,555 8,262,502
30. Debt on issue - 202,440
40. Financial liabilities held for trading 39,503 82,860
50. Financial liabilities designated at fair value - -
60. Hedging derivatives 276,024 307,357
70. Adjustment of financial liabilities subject to generic hedging - -
80. Tax liabilities 66,334 30,974
a) current 36,329 22,868
b) deferred 30,005 8,106
90. Liabilities associated with non current assets held for sale and discontinued operations - -
100. Other liabilities 498,461 439,065
110. Employment termination indemnities 23,586 24,793
120. Provisions for risks and charges: 310,527 248,941
a) Pensions and other commitments - -
b) Other provisions 310,527 248,941
130. Technical reserves - -
140. Valuation reserves (149,880) (310,010)
150. Redeemable shares - -
160. Capital instruments - -
170. Reserves 540,460 451,524
180. Share premium reserve 9,138 9,138
190. Capital 186,255 186,255
200. Treasury shares (-) - -
210. Minority interest 216 194
220. Net profit (loss) for the year 178,354 176,121
TOTAL LIABILITIES AND SHAREHOLDERS' EQUITY 10,323,289 10,565,018
Chairman of the Board of DirectorsSalvatore Maccarone
Managing Director Matteo Colafrancesco
Senior Manager Responsible for the Preparation of the company accountsPaolo Bacciga
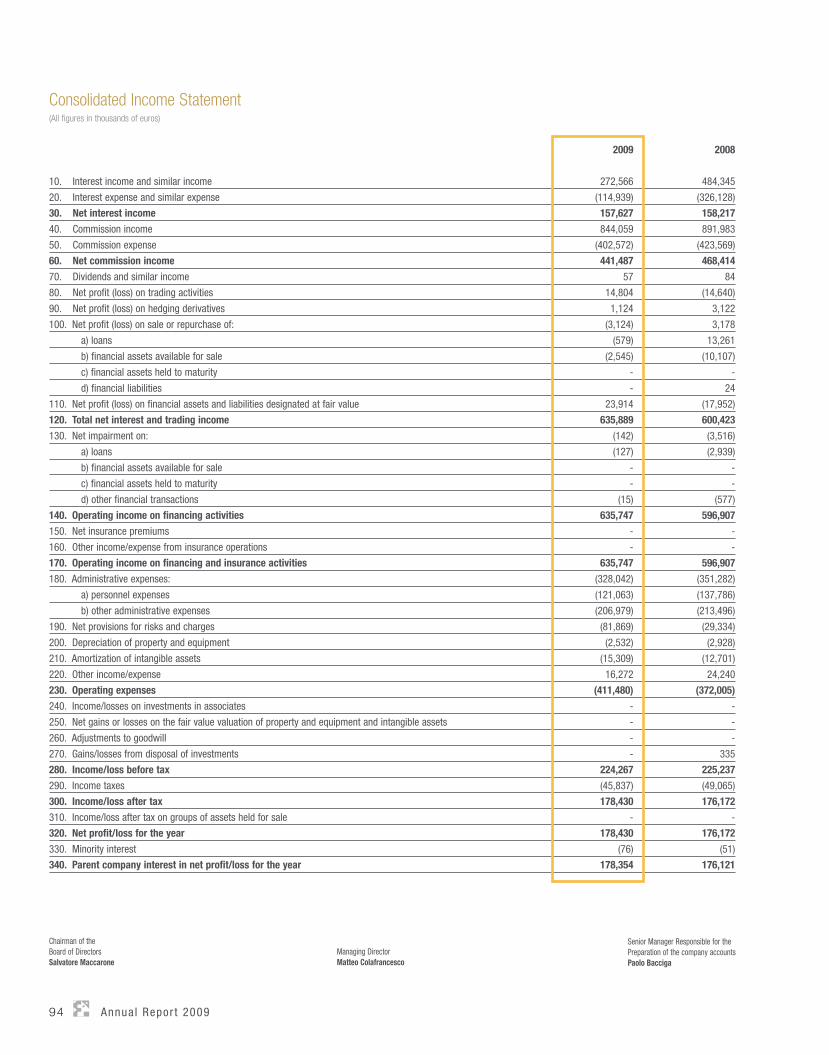
94 Annua l Repor t 2009
Consolidated Income Statement(All fi gures in thousands of euros)
2009 2008
10. Interest income and similar income 272,566 484,345
20. Interest expense and similar expense (114,939) (326,128)
30. Net interest income 157,627 158,217
40. Commission income 844,059 891,983
50. Commission expense (402,572) (423,569)
60. Net commission income 441,487 468,414
70. Dividends and similar income 57 84
80. Net profit (loss) on trading activities 14,804 (14,640)
90. Net profit (loss) on hedging derivatives 1,124 3,122
100. Net profit (loss) on sale or repurchase of: (3,124) 3,178
a) loans (579) 13,261
b) financial assets available for sale (2,545) (10,107)
c) financial assets held to maturity - -
d) financial liabilities - 24
110. Net profit (loss) on financial assets and liabilities designated at fair value 23,914 (17,952)
120. Total net interest and trading income 635,889 600,423
130. Net impairment on: (142) (3,516)
a) loans (127) (2,939)
b) financial assets available for sale - -
c) financial assets held to maturity - -
d) other financial transactions (15) (577)
140. Operating income on financing activities 635,747 596,907
150. Net insurance premiums - -
160. Other income/expense from insurance operations - -
170. Operating income on financing and insurance activities 635,747 596,907
180. Administrative expenses: (328,042) (351,282)
a) personnel expenses (121,063) (137,786)
b) other administrative expenses (206,979) (213,496)
190. Net provisions for risks and charges (81,869) (29,334)
200. Depreciation of property and equipment (2,532) (2,928)
210. Amortization of intangible assets (15,309) (12,701)
220. Other income/expense 16,272 24,240
230. Operating expenses (411,480) (372,005)
240. Income/losses on investments in associates - -
250. Net gains or losses on the fair value valuation of property and equipment and intangible assets - -
260. Adjustments to goodwill - -
270. Gains/losses from disposal of investments - 335
280. Income/loss before tax 224,267 225,237
290. Income taxes (45,837) (49,065)
300. Income/loss after tax 178,430 176,172
310. Income/loss after tax on groups of assets held for sale - -
320. Net profit/loss for the year 178,430 176,172
330. Minority interest (76) (51)
340. Parent company interest in net profit/loss for the year 178,354 176,121
Chairman of the Board of DirectorsSalvatore Maccarone
Managing Director Matteo Colafrancesco
Senior Manager Responsible for the Preparation of the company accountsPaolo Bacciga

Consol idated F inancia l Statements Conso l ida ted s ta tement o f comprehens ive income 95
Consolidated statement of comprehensive income(All fi gures in thousands of euros)
31.12.2009 31.12.2008
10. Net profit/loss for the year 178,430 176,172
Other comprehensive income after tax
20. Financial assets available for sale 160,176 (305,010)
30. Property and equipment - -
40. Intangible assets - -
50. Hedging of foreign investments - -
60. Hedging of financial flows - -
70. Exchange rate differences (46) 2,322
80. Non-current assets held for sale - -
90. Actuarial gain/loss on defined-benefit plans - -
100. Revaluation reserves related to investments carried at equity - -
110. Total other comprehensive income after tax 160,130 (302,688)
120. Total comprehensive income 338,560 (126,516)
130. Total comprehensive income attributable to minority interest 76 51
140. Total comprehensive income attributable to parent company 338,484 (126,567)

96 Annua l Repor t 2009
Statement of changes in consolidated shareholders’ equity(All fi gures in thousands of euros)
Balan
ce a
s at 3
1.12.2
007
Chan
ge to
ope
ning
balan
ce
Balan
ce a
s at 1
.1.20
08
Allocation of income for the previous year Changes in the year
Grou
p Sha
reho
lders’
equit
y as a
t 31.1
2.200
8
Mino
rity i
nter
est a
s at 3
1.12.2
008
Rese
rves
Divid
ends
and
oth
er
Chan
ges i
n re
serv
es
Transactions involving shareholders’ equity
Total
comp
rehe
nsive
inco
me
for th
e yea
r
Issue
of n
ew sh
ares
Purc
hase
of t
reas
ury s
hare
s
Distr
ibutio
n of
extra
ordin
ary
divide
nds
Chan
ge in
capit
al ins
trum
ents
Deriv
ative
s bas
ed o
n tre
asur
y sha
res
Stoc
k op
tions
Capital: 186,255 - 186,255 - - - - - - - - - - 186,255 -
a) Ordinary shares 186,255 - 186,255 - - - - - - - - - - 186,255 -
b) Other shares - - - - - - - - - - - - - - -
Share premium reserve 9,138 - 9,138 - - - - - - - - - - 9,138 -
Reserves: 406,717 - 406,717 49,615 - (2,001) - - - - - (2,807) - 451,524 143
a) from net income 293,749 - 293,749 49,615 - (2,001) - - - - - (2,807) - 338,556 143
b) other 112,968 - 112,968 - - - - - - - - - - 112,968 -
Valuation reserves (7,322) - (7,322) - - - - - - - - - (302,688) (310,010) -
Capital instruments - - - - - - - - - - - - - - -
Treasury shares - - - - - - - - - - - - - - -
Net profit/loss for the year 255,476 - 255,476 (49,615) (205,861) - - - - - - - 176,121 176,121 51
Group shareholders' equity 850,264 - 850,264 - (205,861) (2,001) - - - - - (2,807) (126,567) 513,028 -
Minority interest 241 - 241 - - (98) - - - - - - 51 - 194

Consol idated F inancia l Statements Sta tement o f changes in conso l ida ted shareho lders ’ equ i ty 97
Statement of changes in consolidated shareholders’ equity(All fi gures in thousands of euros)
Balan
ce a
s at 3
1.12.2
008
Chan
ge to
ope
ning
balan
ce
Balan
ce a
s at 1
.1.20
09
Allocation of income for the previous year Changes in the year
Grou
p Sha
reho
lders’
equit
y as a
t 31.1
2.200
9
Mino
rity i
nter
est a
s at 3
1.12.2
009
Rese
rves
Divid
ends
and
oth
er
Chan
ges i
n re
serv
es
Transactions involving shareholders’ equity
Total
comp
rehe
nsive
inco
me
for th
e yea
r
Issue
of n
ew sh
ares
Purc
hase
of t
reas
ury s
hare
s
Distr
ibutio
n of
extra
ordin
ary
divide
nds
Chan
ge in
capit
al ins
trum
ents
Deriv
ative
s bas
ed o
n tre
asur
y sha
res
Stoc
k op
tions
Capital: 186,255 - 186,255 - - - - - - - - - - 186,255 -
a) Ordinary shares 186,255 - 186,255 - - - - - - - - - - 186,255 -
b) Other shares - - - - - - - - - - - - - - -
Share premium reserve 9,138 - 9,138 - - - - - - - - - - 9,138 -
Reserves: 451,524 - 451,524 80,053 - 8,883 - - - - - - - 540,460 140
a) from net income 338,556 - 338,556 80,053 - 8,883 - - - - - - - 427,492 140
b) other 112,968 - 112,968 - - - - - - - - - - 112,968 -
Valuation reserves (310,010) - (310,010) - - - - - - - - - 160,130 (149,880) -
Capital instruments - - - - - - - - - - - - - - -
Treasury shares - - - - - - - - - - - - - - -
Net profit/loss for the year 176,121 - 176,121 (80,053) (96,068) - - - - - - - 178,354 178,354 76
Group shareholders' equity 513,028 - 513,028 - (96,068) 8,883 - - - - - - 338,484 764,327 -
Minority interest 194 - 194 - - (54) - - - - - - 76 - 216

98 Annua l Repor t 2009
Statement of consolidated cash flows (Indirect method)(All fi gures in thousands of euros)
2009 2008
A. OPERATING ACTIVITIES 1. Operations 287,325 299,622 Net profit/loss 178,354 176,121 Net profit (loss) on financial assets held for trading and on financial assets/liabilities designated at fair value (38,718) 32,592 Net profit (loss) on hedging derivatives (1,124) (3,122) Net profit (loss) on financial assets available for sale 2,545 10,107 Net impairment 142 3,516 Depreciation of property and equipment and amortization of intangible assets 17,841 15,629 Net provisions for risks and charges and other costs/income 81,869 29,334 Uncollected net insurance premiums - - Uncollected other insurance income/expense - - Unpaid taxes and levies 45,837 49,065 Net adjustments/write-backs of net value after tax of groups of assets held for sale - - Other adjustments 579 (13,620) 2. Cash from/used in financing activities 322,485 1,256,749 Financial assets held for trading 54,869 (66,410) Financial assets designated at fair value (10,831) (35,476) Hedging derivatives 888 83,923 Financial assets available for sale (247,403) 335,260 Due from banks: demand deposits (97,168) (168,323) Due from banks: other receivables 860,022 1,227,622 Loans to customers (162,685) (308,841) Other assets (75,207) 188,994 3. Cash from/used in financial liabilities (716,881) (1,214,243) Due to banks: demand deposits 196,544 (203,402) Due to banks: other debts (41,652) (313,317) Due to customers (525,947) (397,447) Debt on issue (202,440) (150,171) Financial liabilities held for trading (43,357) 72,201 Financial liabilities designated at fair value - - Hedging derivatives (31,333) 271,877 Other liabilities (68,696) (493,984) Net cash from/used in operating activities (107,071) 342,128B. INVESTMENT ACTIVITIES 1. Cash from 4,386 84 Disposal of subsidiaries - - Dividend income in investments in associates 57 84 Sale of financial assets held to maturity 4,329 - Sale of property and equipment - - Sale of intangible assets - - Sale of subsidiaries and company divisions - - 2. Cash used in (18,217) (31,814) Acquisition of subsidiaries (70) - Acquisition of financial assets held to maturity - (19,811) Acquisition of property and equipment (2,316) (922) Acquisition of intangible assets (15,831) (11,081) Acquisition of subsidiaries and company divisions - - Net cash from/used in investing activities (13,831) (31,730)C. FUNDING ACTIVITIES Issue/purchase of treasury shares - - Issue/purchase of capital instruments - - Distribution of dividends and other 169,035 (307,543) Net cash from/used in funding activities 169,035 (307,543)NET CASH GENERATED/USED IN THE YEAR 48,133 2,855
Reconciliation
Cash and cash equivalents at beginning of year 29,055 26,200Net cash generated/used in the year 48,133 2,855 Cash and cash equivalents: effect of changes in exchange rates - - Cash and cash equivalents at end of year 77,188 29,055

Consol idated F inancia l Statements Notes 99
■ Part A - Accounting policiesA.1 - General• Section 1 - Declaration of compliance with the international
accounting standards• Section 2 - General accounting policies• Section 3 - Scope and methods of consolidation• Section 4 - Subsequent events• Section 5 - Other aspects
A.2 - Main financial statement items• Section 1 - Financial assets held for trading• Section 2 - Financial assets available for sale• Section 3 - Financial assets held to maturity• Section 4 - Loans• Section 5 - Financial assets designated at fair value• Section 6 - Hedging transactions• Section 7 - Investments in associates• Section 8 - Property and equipment• Section 9 - Intangible assets• Section 10 - Non-current assets and groups of assets held for sale• Section 11 - Current and deferred tax assets and liabilities• Section 12 - Provisions for risks and charges• Section 13 - Debts and debt on issue• Section 14 - Financial liabilities held for trading• Section 18 - Other information
A.3 - Fair value disclosures
■ Part B - Notes to the consolidated balance sheetASSETS• Section 1 - Cash and cash equivalents - Item 10• Section 2 - Financial assets held for trading - Item 20• Section 3 - Financial assets designated at fair value - Item 30• Section 4 - Financial assets available for sale - Item 40• Section 5 - Financial assets held to maturity - Item 50• Section 6 - Due from banks - Item 60• Section 7 - Loans to customers - Item 70• Section 8 - Hedging derivatives - Item 80• Section 10 - Investments in associates - Item 100• Section 12 - Property and equipment - Item 120• Section 13 - Intangible assets - Item 130• Section 14 - Tax assets and tax liabilities - assets Item 140
and liabilities Item 80• Section 16 - Other assets - Item 160
LIABILITIES• Section 1 - Due to banks - Item 10• Section 2 - Due to customers - Item 20• Section 3 - Debt on issue - Item 30• Section 4 - Financial liabilities held for trading - Item 40• Section 6 - Hedging derivatives - Item 60• Section 10 - Other liabilities - Item 100• Section 11 - Employment termination indemnities - Item 110• Section 12 - Provisions for risks and charges - Item 120• Section 15 - Equity holders from Parent Company - Items 140,
160, 170, 180, 190, 200 and 220
OTHER INFORMATION
■ Part C - Notes to the consolidated income statement• Section 1 - Interest - Items 10 and 20• Section 2 - Commission income and expense - Items 40 and 50• Section 3 - Dividends and similar income - Item 70• Section 4 - Net profit (loss) on trading activities - Item 80• Section 5 - Net profit (loss) on hedging derivatives - Item 90• Section 6 - Net profit (loss) from sale and repurchase - Item 100• Section 7 - Net profit (loss) on financial assets/liabilities
designated at fair value - Item 110• Section 8 - Net impairment on financial assets - Item 130• Section 11 - Administrative expenses - Item 180• Section 12 - Net provisions for risks and charges - Item 190• Section 13 - Depreciation and amortization of property and
equipment - Item 200• Section 14 - Depreciation and amortization of intangible assets -
Item 210• Section 15 - Other income (expense) - Item 220• Section 19 - Gains (losses) from disposal of investments - Item 270• Section 20 - Income taxes - Item 290• Section 22 - Minority interest - Item 330• Section 24 - Earnings per share
■ Part D - Total comprehensive income• Components of total comprehensive income
■ Part E - Information on risks and related hedging policies• 1.1 Credit risk• 1.2 Market risks• 1.3 Liquidity risk• 1.4 Operational risks
■ Part F - Information on consolidated shareholders’ equity• Section 1 - Consolidated shareholders’ equity
■ Part G - Business combination transactions of companies or company divisions • Section 1 - Transactions completed in the year
■ Part H - Transactions with related parties
■ Part I - Payment agreements based on own equity instruments
■ Part L - Segment Reporting
Notes to the Consolidated Financial Statements
100 Annua l Repor t 2009
PART A
ACCOUNTING POLICIESA.1 - GENERAL
SECTION 1
Declaration of compliance with the international accounting standards
The Consolidated Financial Statements of the Banca Fideuram Group have been prepared pursuant to Italian Legislative Decree No. 38 of 28 February 2005 in accordance with the International Accounting Standards (IAS) and International Financial Reporting Standards (IFRS) as approved by the European Commission up until 31 December 2009, following the procedure provided for by EC Regulation No. 1606/2002.
In addition, with a view to adopting effective guidelines for the interpretation and adoption of these accounting standards, this Report was also prepared in accordance with the interpretations provided by the International Financial Reporting Interpretations Committee (IFRIC), as well as the documents supporting the introduction of the IAS/IFRS in Italy prepared by the Italian accounting standards body (Organismo Italiano di Contabilità - OIC) and the interpretation documents prepared by the Italian Banking Association (Associazione Bancaria Italiana - ABI).
SECTION 2
General accounting policiesThe Consolidated Financial Statements of the Banca Fideuram Group, prepared in accordance with Bank of Italy Circular No. 262 of 22 December 2005 and subsequent amendments, comprise the compulsory consolidated statements provided for by IAS 1 (namely a balance sheet, income statement, statement of comprehensive income, statement of changes in equity and cash flow statement) and the present Notes to the Consolidated Financial Statements. These are completed by the Directors’ Report.
The Notes to the Consolidated Financial Statements present all the information provided for by the regulations, together with the additional information considered necessary to provide a faithful and proper representation of the Group’s position. The compulsory tables and details required by the Bank of Italy are identified separately using the numbering specified by said Supervisory Authority.
The results at 31 December 2009 have been presented alongside the figures for the previous financial year for the purposes of comparison.The report uses the euro as its functional currency. The figures in the Financial Statements and Notes are stated in thousands of euro unless specified otherwise.
The balance sheet and income statement at 31 December 2009 accompanying the Directors’ Report are a reclassified condensed balance sheet and reclassified condensed income statement to facilitate
comparison of the figures for different periods and to enable a clearer and more immediate understanding of the bank’s financial position. These statements are condensed statements containing appropriate groupings of the items in the official financial statements. Moreover, the reclassified income statement has been changed as follows to provide a clearer presentation of the Group’s operating performance:
• Net profit on financial assets and the Group’s provisions are now stated net of the returns on the insurance policies taken out as part of the Personal Financial Adviser Networks’ Loyalty Schemes, which - in pertaining to the Personal Financial Advisers - are recognised in the official statement as gains on assets designated at fair value and allocated to the provisions for risks and charges.
• Indirect taxes recovered, which are recognised in the official Bank of Italy schedule as other income, are deducted directly from the related costs.
• Non recurring expenses have been reclassified in a separate item of their own: “non recurring expenses net of tax”.
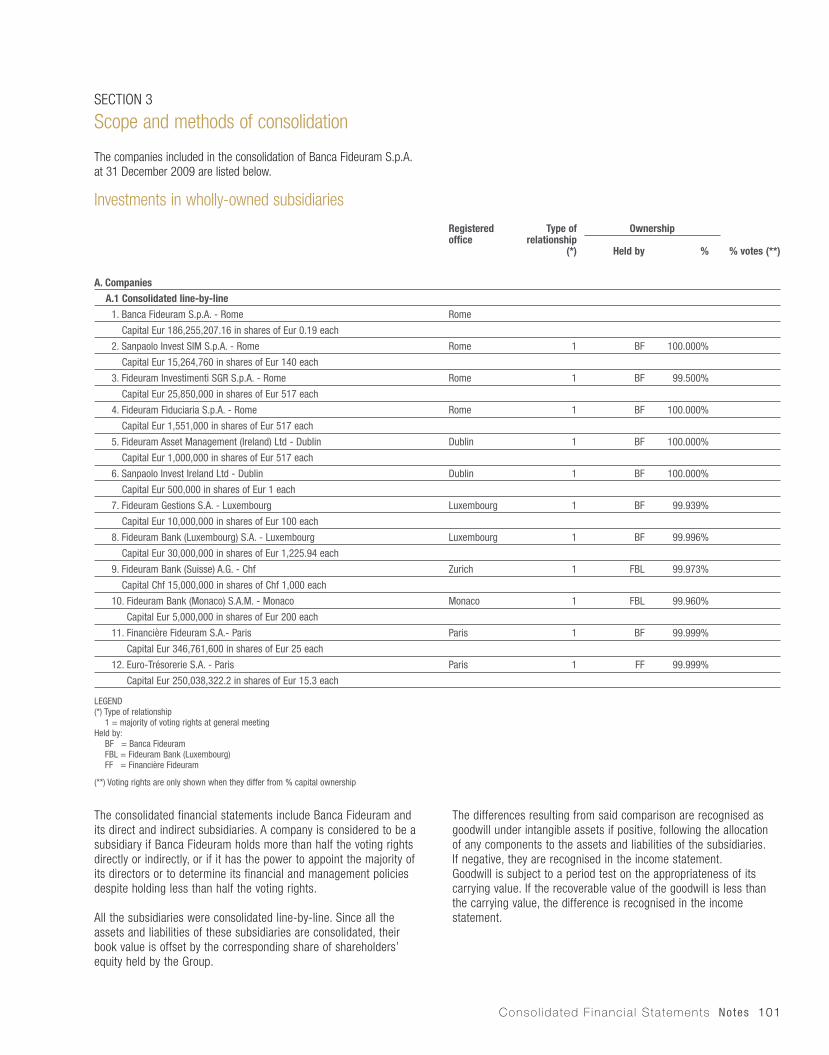
Consol idated F inancia l Statements Notes 101
SECTION 3
Scope and methods of consolidation
The companies included in the consolidation of Banca Fideuram S.p.A. at 31 December 2009 are listed below.
The consolidated financial statements include Banca Fideuram and its direct and indirect subsidiaries. A company is considered to be a subsidiary if Banca Fideuram holds more than half the voting rights directly or indirectly, or if it has the power to appoint the majority of its directors or to determine its financial and management policies despite holding less than half the voting rights.
All the subsidiaries were consolidated line-by-line. Since all the assets and liabilities of these subsidiaries are consolidated, their book value is offset by the corresponding share of shareholders’ equity held by the Group.
The differences resulting from said comparison are recognised as goodwill under intangible assets if positive, following the allocation of any components to the assets and liabilities of the subsidiaries. If negative, they are recognised in the income statement. Goodwill is subject to a period test on the appropriateness of its carrying value. If the recoverable value of the goodwill is less than the carrying value, the difference is recognised in the income statement.
Investments in wholly-owned subsidiaries
Registered office
Type of relationship
(*)
Ownership
% votes (**)Held by %
A. Companies
A.1 Consolidated line-by-line
1. Banca Fideuram S.p.A. - Rome Rome
Capital Eur 186,255,207.16 in shares of Eur 0.19 each
2. Sanpaolo Invest SIM S.p.A. - Rome Rome 1 BF 100.000%
Capital Eur 15,264,760 in shares of Eur 140 each
3. Fideuram Investimenti SGR S.p.A. - Rome Rome 1 BF 99.500%
Capital Eur 25,850,000 in shares of Eur 517 each
4. Fideuram Fiduciaria S.p.A. - Rome Rome 1 BF 100.000%
Capital Eur 1,551,000 in shares of Eur 517 each
5. Fideuram Asset Management (Ireland) Ltd - Dublin Dublin 1 BF 100.000%
Capital Eur 1,000,000 in shares of Eur 517 each
6. Sanpaolo Invest Ireland Ltd - Dublin Dublin 1 BF 100.000%
Capital Eur 500,000 in shares of Eur 1 each
7. Fideuram Gestions S.A. - Luxembourg Luxembourg 1 BF 99.939%
Capital Eur 10,000,000 in shares of Eur 100 each
8. Fideuram Bank (Luxembourg) S.A. - Luxembourg Luxembourg 1 BF 99.996%
Capital Eur 30,000,000 in shares of Eur 1,225.94 each
9. Fideuram Bank (Suisse) A.G. - Chf Zurich 1 FBL 99.973%
Capital Chf 15,000,000 in shares of Chf 1,000 each
10. Fideuram Bank (Monaco) S.A.M. - Monaco Monaco 1 FBL 99.960%
Capital Eur 5,000,000 in shares of Eur 200 each
11. Financière Fideuram S.A.- Paris Paris 1 BF 99.999%
Capital Eur 346,761,600 in shares of Eur 25 each
12. Euro-Trésorerie S.A. - Paris Paris 1 FF 99.999%
Capital Eur 250,038,322.2 in shares of Eur 15.3 each
LEGEND(*) Type of relationship 1 = majority of voting rights at general meetingHeld by: BF = Banca Fideuram FBL = Fideuram Bank (Luxembourg) FF = Financière Fideuram
(**) Voting rights are only shown when they differ from % capital ownership

102 Annua l Repor t 2009
All relations with respect to assets and liabilities, and all income and expenses between consolidated companies are eliminated.
The financial statements used for the line-by-line consolidation were those at 31 December 2009, as approved by the competent bodies of the subsidiary undertakings, adjusted where necessary to align them with Group accounting policies.
The financial statement data of companies operating outside the European Monetary Union are translated to euro applying the year-end exchange rates to balance sheet items and the average exchange rates for the year to income statement items. Any exchange rate differences arising from conversions at said exchange rates are recognised in the revaluation reserve.
Compared with 31 December 2008, the consolidation of the Banca Fideuram Group no longer included Fideuram France S.A. following its merger with Financière Fideuram, which took legal effect from 16 October 2009.
SECTION 4
Subsequent eventsOn 23 February 2010, Intesa Sanpaolo’s Board of Management and Supervisory Board decided - in accordance with their respective competencies - to embark on the process of listing Banca Fideuram and the related global sharing offering. The Banca Fideuram Board of Directors approved said course of action for the aspects under its remit on 25 February 2010.
SECTION 5
Other aspectsThe Banca Fideuram Group’s Consolidated Financial Statements and the separate financial statements of the Group parent company are audited by Reconta Ernst & Young S.p.A. The table below provides detailed information on the remuneration that the Banca Fideuram Group has paid Reconta Ernst & Young and the other entities in its network for the auditing and other services they provided in the 2009 financial year, in accordance with article 149 duodecies of the Regulations for Companies Issuing Financial Statements (No. 11971) issued by the Italian National Commission for Listed Companies and the Stock Exchange (CONSOB).
Type of service Entity providing the service
Recipient Remuneration(in thousands of euro)
Independent audit (*)Reconta Ernst
& YoungBanca Fideuram
Subsidiaries 1,881
Total 1,881
(*) This figure includes €864 thousand paid for the auditing of the mutual funds managed by Group companies.

Consol idated F inancia l Statements Notes 103
A.2 - MAIN FINANCIAL STATEMENT ITEMS
This section sets out the accounting policies adopted to prepare the consolidated financial statements at 31 December 2009.
Changes with respect to the previous financial year included the new version of IFRS 8 (replacing IAS 14) and the revised versions of certain standards and interpretations which came into effect.The most important changes were as follows:• The new IFRS 8 (Operating Segments) requires segment reporting in
the financial statements to provide the information that management considers relevant for taking its operating decisions. The segment-reporting format currently adopted by the Group already complies with the requirements of the new standard.
• The revised version of IAS 1 (Presentation of Financial Statements) includes a Statement of Comprehensive Income, a new statement of total income generated in the period which not only shows net income but also any net changes in the value of assets recorded as offsetting entries in the revaluation reserves.
• The Comprehensive Income has been stated as a separate item in the statement of changes in equity and has moreover been included in a restated statement of changes in equity at 31 December 2008 for the purposes of comparison and the provision of complete and consistent information.
• The revised version of IFRS 7 included a number of amendments introducing a fair value hierarchy. The new version of the standard provides for a three-level hierarchy for financial instruments designated at fair value, based on the lowest level of market input significant to the overall fair value, and replaces the previous distinction between listed and unlisted financial instruments.
The other regulatory changes resulting from the process of revising the accounting standards have not had any significant impact on these financial statements.
The Bank of Italy updated Circular No. 262/2005 on the preparation of financial statements and the notes to financial statements on 18 November 2009 to incorporate the amendments to the international accounting standards. The update also involved rationalising and simplifying certain tables in the notes to financial statements. The principal changes were as follows: • The change to the Statement of Cash Flows led to said statement
at 31 December 2008 provided for the purposes of comparison and the provision of complete and consistent information being restated so that straight comparisons can be made.
• The reorganisation of the analyses provided for impaired assets, assets disposed of but not written off and derivatives, which are now stated under their relevant technical categories and not as separate items.
• The revision of the information provided on derivatives, which is now set out almost exclusively in Part E of the Notes to the Financial Statements.
• The updating of the information provided on shareholders’ equity. • Discontinuing the systematic disaggregation of the consolidated
results by operating sector (banking group, insurance companies and other companies), and replacing it with the requirement to provide such analyses only when significant.
The regulatory scope of consolidation was adopted for Part E of the Notes to the Financial Statement on risk, in line with the information already provided regarding the Basel third pillar, to align the information provided with the European harmonised regulatory schedules and information requirements of the Basel third pillar.
SECTION 1
Financial assets held for tradingFinancial assets held for trading include the following:
• Debt securities and equities purchased principally to obtain short-term profits.
• Derivative contracts excepting for those designated as hedging instruments.
Financial assets held for trading are initially recognised in the balance sheet at their fair value, which is usually their purchase price.They are subsequently designated at their fair value with a balancing entry in the income statement.
Securities and derivatives for which the fair value cannot be determined reliably are carried in the financial statements at cost, adjusted for losses from any decline in value. The fair value of financial instruments listed on active markets is taken to be their market value. In the absence of an active market, the fair value is determined on the basis of the prices of recent transactions and the market values of similar financial instruments, taking the results of valuation models (mainly based on objective financial variables) into account.
Derivatives are treated as assets in the financial statements if their fair value is positive and as liabilities if their fair value is negative.
SECTION 2
Financial assets available for sale
These are financial assets that cannot be classified as loans, financial assets held to maturity or financial assets held for trading.
Financial assets available for sale are initially recognised in the balance sheet at their fair value, which is usually their purchase price plus any transaction costs, if material and determinable, directly attributable to them.
They are subsequently recognised at fair value in a balancing entry of a specific shareholders’ equity reserve.
Certain unlisted equities, the fair value of which cannot be calculated in a reliable or verifiable manner, are carried in the financial statements at cost and written down in those cases where a loss due to decline in value is verified.
The valuations recorded in the specific shareholders’ equity reserve are recognised in the income statement upon disposal or when a loss due to decline in value is verified. The Group verifies situations in which a loss due to a decline in value is deemed to have occurred,
104 Annua l Repor t 2009
and the related estimates, using all the information at its disposal, based on observable data of events that have already occurred at the valuation date.
Losses due to the decline in value of equities cannot lead to write-backs in the income statement when the reasons for the write-downs cease to apply. These write-backs are therefore made in the shareholders’ equity reserve.
Conversely, write-backs of debt securities are recorded in the income statement. Interest on debt securities in this category is calculated using the effective interest rate method and recorded in the income statement.
SECTION 3
Financial assets held to maturity
Investments held to maturity are listed non-derivative financial instruments that have fixed or determinable payments and fixed maturities, which the Group intends and has the ability to hold until maturity.
When initially recognised, financial assets held to maturity are recorded in the balance sheet at their fair value, which is usually their purchase price plus any transaction costs directly attributable to their purchase.
They are subsequently valued at their amortised cost, calculated using the effective interest method. Gains and losses on financial assets held to maturity are recognised in the income statement when these assets are written off or when their value decreases, as well as through the amortization process.
Losses due to decreases in value are calculated as the difference between the asset’s book value and the present value of estimated future financial flows, discounted at their original effective interest rate.
Write-backs are recorded in the income statement up to the amortised cost the assets would have had if they were not written down.
SECTION 4
Loans
Loans include non-derivative financial assets, including debt securities, that have fixed or determinable payments and do not have a quoted price on an active market and were not designated at purchase as assets available for sale.
Loans are recorded in the financial statements upon disbursement. When initially recognised, loans are recorded in the balance sheet at their fair value, which is usually their purchase price plus any transaction costs, if material and determinable, directly attributable to their disbursement.
They are subsequently valued at their amortised cost using the effective interest method.The book value of loans is periodically verified for any decline in value
that could lead to a reduction in their estimated realisable value, considering both the solvency of any specific debtors with payment difficulties and the debt servicing difficulties of debtors’ market sectors or countries of residence, also taking into account any collateral and any negative economic trends regarding comparable categories of loans.
The classification criteria used, based on the related Bank of Italy regulations, are set out below.• Non-performing loans: Loans to parties that are insolvent or in a
substantially equivalent situation.• Doubtful loans: Loans to parties that are in a situation that is
objectively one of temporary difficulty which they are likely to overcome in an appropriate period of time.
• Restructured loans: Loans in which a pool of banks (or a single-lender bank) grants a deferment of a debt and renegotiate the loan at interest rates that are below market rates.
• Overdue loans: Loans to parties which have payments overdue or past due at period end as defined by the relevant Bank of Italy regulations.
• Country risk: Unsecured loans to residents of countries with debt-servicing difficulties.
• Performing loans: Loans to parties that did not present any specific insolvency risks at the valuation date.
The decision to designate a loan as an impaired loan is taken by the Group’s operating units in conjunction with its central credit control units.
The losses in value of performing loans and overdue loans are determined on a collective basis, adopting a historical/statistical approach that aims to estimate the impairment in value of the loans that is considered to have effectively been incurred at the reference date without the amount yet being known at the time of valuation.
The determination of the estimated realisable value of impaired loans, which is formalised in decisions by senior management and other administrative functions that have been conferred with specific decision-making powers, is based on the present value of the expected financial flows of the principal and interest of the loans.
The core elements used to calculate the present value of the flows are the estimated collections (expected financial flows) and related due dates, together with the discount rate to apply.
The write-downs, which are individual and collective, are write-downs to the amount recorded under balance sheet assets in accordance with the above accounting treatment, and are reinstated by write-backs relating to the income statement item for net write-downs to loans if the reasons for the write-downs cease to apply or the amounts recovered exceed the original write-downs.
Considering the method used to calculate the estimated realisable value of impaired loans, the simple passing of time, with the consequent approach of the due dates for recovery, will result in an automatic reduction in the implicit financial charges previously deducted from the value of the loans.

Consol idated F inancia l Statements Notes 105
SECTION 5
Financial assets designated at fair valueThe Banca Fideuram Group has mainly adopted the Fair Value Option for the insurance policies taken out to insure the market yields of the Personal Financial Adviser Networks’ Loyalty Schemes, considering them to be a group of financial assets designated at fair value in line with IAS guidelines.
The accounting policies adopted are the same as those set out in section 1 regarding financial assets held for trading.
SECTION 6
Hedging transactions
The Group uses derivative contracts to hedge the interest rate risk of certain of its fixed-rate securities.
These hedging transactions aim to neutralise any potential losses from interest rate fluctuations with the income obtained from the hedging instruments.
The relationship between the hedging instruments and items hedged is documented formally and the effectiveness of the hedging verified at regular intervals. A hedge is considered to be effective when the cash flow fluctuations of the item hedged are completely offset by the cash flows from the hedging instrument, keeping the ratio between the fluctuations within a range of between 80% and 125%. The hedging derivatives are recognised at fair value. For fair value hedging, the fluctuations in the value of the derivatives and hedged instruments are recognised in the income statement where the component attributable to interest rate risk is concerned. Any difference, indicating the extent to which the hedge is only partially effective, consequently has a net financial effect.
SECTION 7
Investments in associatesCompanies over which the Group exercises significant influence are carried at equity.
A company is considered to be subject to significant influence when the Group directs its administrative, financial and management choices by virtue of legal and de facto ties, and this is assumed to be the case when the Group holds 20% or more of the voting rights.
The equity method involves initially recognising an investment in associates at cost and subsequently adjusting the value in relation to the stake in the subsidiary’s shareholders’ equity. The difference between the value of the investment in associates and the subsidiary’s shareholders’ equity is included in the book value of the subsidiary. The related portion of the subsidiary’s operating result is recognised in the consolidated income statement. If there is evidence that the value of an investment in associates may have decreased, the Group proceeds to estimate the recoverable value of the investment in associates. If the recoverable value is less than the book value, the difference is recognised in the income statement.
SECTION 8
Property and equipmentProperty and equipment include:• Land• Immovable property used for operating purposes• Technical plant and equipment• Furniture, plant and equipment• Works of art.
Immovable property used for operating purposes is defined as buildings owned (or leased under financial leasing contracts) that are used for the production and supply of services or for administrative purposes, and which have a useful life that is longer than one year. Property and equipment are initially recognised at cost, with the latter understood to mean both the purchase price and any related direct charges incurred for the purchase or commissioning of the asset. Any expenses subsequent to purchase increase the book value of the asset or are recorded as separate assets only when they lead to an increase in the future economic benefits resulting from the use of the investments. Other expenses incurred subsequent to purchase are recorded in the income statement in the financial year when they are incurred.
Subsequent to their initial recognition, property and equipment are recognised at cost, deducting any depreciation and loss in value.
The depreciable value is distributed systematically over the useful life of the asset on a straight-line basis with the exception of for the following:• Land, which has an indefinite useful life and is not, therefore,
depreciable. The value of land, moreover, also needs to be accounted for separately from the value of buildings, even when they are purchased together. This splitting of the value of land and the value of buildings is performed on the basis of a survey by independent experts solely for buildings held on a “ground-to-roof” basis.
• Works of art, since their useful life cannot be estimated and their value is not normally likely to decline over time.
The useful life of property and equipment subject to depreciation is verified periodically. If the initial estimates require adjustment, the related depreciation rate is consequently also changed. In addition, at every accounting reference date, the Group also verifies whether there are any signs of an asset having suffered an impairment loss. If this is the case, the Group proceeds to calculate the recoverable value of the asset, which is the higher of net sale price and value in use. Should the reasons for the impairment loss cease to apply, the Group estimates the asset’s recoverable value.
Property and equipment are written off the balance sheet upon disposal or when an asset is permanently withdrawn from use and no future economic benefits are expected from its disposal.

106 Annua l Repor t 2009
SECTION 9
Intangible assetsIntangible assets are identifiable non-monetary assets without physical substance, possessed for long-term use. They include goodwill, incremental costs on buildings that are not owned and not leased under financial leasing agreements, and software developed internally or purchased from third parties.
Goodwill is the excess of purchase price over fair value at the date of purchase of the net assets and liabilities of acquired companies or company divisions. Goodwill is not subject to systematic amortization, but to a periodical test to verify the appropriateness of its book value. The value of goodwill is reduced if its recoverable value is lower than its book value. Recoverable value is taken to be the greater of the fair value of the unit generating the financial flows, less costs to sell, and its value in use, which is the present value of estimated future cash flows expected to arise from the continuing operation of the unit generating financial flows and from its disposal at the end of its useful life. When the incremental costs on buildings that are not owned and not leased under financial leasing agreements do not regard independently identifiable property and equipment, they are recognised in the financial statements as intangible assets when future economic benefits can be derived from them. These costs are recognised in the income statement in relation to the length of the related leases. Expenses regarding the in-house development of software are recognised in the financial statements as intangible assets following verification of the technical feasibility of completion and their ability to generate future economic benefits. During the development phase, these assets are valued at cost, complete with any related direct expenses, including expenses for the personnel involved in the projects. If the verification has a negative outcome, the expenses are recognised in the income statement. Intangible assets, in the form of software that has been developed in-house or purchased from third parties, is amortised on a straight-line basis from the time of its completion and commissioning over its related useful life, which is estimated to be three years. Whenever the recoverable value of these assets is less than their book value, the difference is recognised in the income statement.
SECTION 10
Non-current assets and groups of assets held for saleIndividual non-current assets and groups of assets and liabilities in the process of disposal which it is considered highly likely will be sold are classified as “Non-current assets and groups of assets held for sale” and “Liabilities associated with non current assets held for sale and discontinued operations”. These non-current assets are recognised at the lower of book value and fair value, net of sales costs. Any income and expense regarding groups of assets held for sale is recognised in the income statement net of tax.
SECTION 11
Current and deferred tax assets and liabilitiesIncome taxes, calculated in accordance with national tax legislation, are recognised as costs on an accruals basis in line with the accounting treatment of the costs and income that generated them. They therefore represent the balance of the current and deferred tax assets and liabilities for the year.
The Italian companies in the Banca Fideuram Group avail themselves of the “istituto del consolidato fiscale nazionale” tax consolidation regime introduced by Italian Legislative Decree No. 344 of 12.12.2003 as subsidiaries of parent company Intesa Sanpaolo. This tax consolidation regime provides for the aggregation of the taxable income of all the subsidiaries and a single payment of IRES corporate income tax by the Parent Company.
Deferred tax assets and liabilities are calculated using the balance sheet liability method, taking into account the tax effect of the timing differences between the book values of the assets and liabilities and their tax values which result in taxable or tax-deductible amounts arising in future periods. To this end, “taxable timing differences” are taken to be differences that result in taxable amounts arising in future periods and “deductible timing differences” are taken to be differences that result in tax-deductible amounts arising in future financial years.
Deferred tax assets and liabilities are calculated applying the tax rates specified by current tax legislation, for each consolidated company, to the taxable timing differences for which it is probable that taxes will have to be paid, and to the deductible timing differences for which there is reasonable certainty of recovery.
When the deferred tax assets and liabilities refer to components recognised in the income statement, they are recorded in a balancing entry under income taxes.
Whereas when the deferred tax assets and liabilities regard transactions that have had a direct effect on shareholders’ equity without influencing the income statement (such as the valuation of available-for-sale financial instruments and derivative contracts hedging financial flows), they are recorded as a balancing entry under shareholders’ equity, in respect of the related reserves, if any.
SECTION 12
Provisions for risks and chargesThe Provisions for risks and charges are liabilities of uncertain amount or due date that are recognised in the financial statements for the following reasons:• There is a present obligation (legal or implicit) arising from a past
event.• It is probable that financial resources will have to be disbursed to
fulfil the obligation.
Consol idated F inancia l Statements Notes 107
• It is possible to make a reliable estimate of the probable future disbursement.
These provisions include the provisions set aside to cover losses on litigation, including claims from receivers, estimated disbursements arising from customer complaints regarding the brokerage of securities, and contractual indemnity payments due to Personal Financial Advisers, as well as the provisions set aside for the Network Loyalty Schemes.
The contractual indemnity payments due to Personal Financial Advisers, which are calculated using actuarial valuations, include the provisions for Personal Financial Advisers’ severance indemnities and the “meritocratic indemnity” set aside under the “New Collective Economic Agreement for Agents in the Commerce Sector”, which came into force on 2 April 2002.
The Network Loyalty Schemes - long-term incentive plans which entitle the Personal Financial Advisers to a bonus that is linked to the stock of financial assets under their management - involve setting aside provisions under “other provisions” that are the best estimate of the amounts due to the Personal Financial Advisers calculated using actuarial valuations.
The provision for personnel expenses includes early retirement incentives and the provision set aside to pay seniority bonuses to employees, determined on the basis of an independent actuary’s report, using the methods specified in IAS 19.
When the effect of deferring meeting the estimated obligation becomes a significant factor, the Group calculates the amount of the provisions as being equal to the present value of the expenses it is envisaged will be necessary to discharge the obligations.
In those cases where the provisions are discounted, the total for the provisions recorded in the financial statements increases in each financial year to reflect the passing of time. The provisions set aside are reassessed at every accounting reference date and adjusted to reflect the best current estimate.
The provision is reversed when it becomes unlikely that it will be necessary to use resources that are suitable for generating economic benefits to fulfil the obligation.
SECTION 13
Debts and debt on issueThe items Due to banks and Due to customers cover all the technical forms of borrowing from said counterparties.
Debt on issue are recognised net of any portion repurchased.
These financial liabilities are initially recognised in the balance sheet at fair value, which is usually the amount collected, adjusted for any transaction costs directly attributable to their issue.
The debts and debt on issue, with the exception of on-demand and short-term items, are subsequently valued at cost, amortised using the effective interest rate method.
The difference between the repurchase price of the debt securities in issue and their book value is recognised in the income statement from the following year. Any subsequent sale of repurchased debt securities in issue is, for accounting purposes, considered a new sale with a consequent change to the average book value of the related liabilities.
SECTION 14
Financial liabilities held for tradingFinancial liabilities held for trading include any negative valuations of derivative contracts held for trading and liabilities regarding technical short positions in securities. The same accounting policies as for financial assets held for trading are used.
SECTION 18
Other informationTreasury sharesTreasury shares that have been repurchased are recognised at cost in a specific item deducted from Group’s shareholders’ equity and are not therefore subject to valuation. If they are sold on the market, any difference between the purchase price and sale price is recognised in the components of shareholders’ equity.
Employment termination indemnitiesWith the introduction of the 2007 Finance Act, which brought forward to 1 January 2007 the complementary social security reform provided for by Italian Legislative Decree No. 252/2005, the employment termination indemnity contributions accrued up until 31.12.2006 will continue to be recognised in the provision for employment termination indemnities. The provision for employment termination indemnities accrued up until 31.12.2006 therefore continues to be considered a “defined benefit” scheme, consequently making it necessary to perform an actuarial valuation which, however, differs from the calculation method adopted up until 31 December 2006 in no longer making the benefit proportional to the period of employment. This is because the employment period to be taken into account is considered to have been accrued in full as a result of the change to the accounting treatment of the provision from 1 January 2007. The discount rate used is set with reference to the average market interest rate at the valuation dates, weighted in relation to the percentage of the amount paid and advanced, for each maturity, with respect to the total amount to be paid and advanced for the entire obligation to be discharged in full. The service costs of the plan are recognised under personnel expenses as the net total of accrued interest, any anticipated income on the assets held for the purposes of the plan and actuarial gains and losses.

108 Annua l Repor t 2009
The latter are calculated using the “corridor method”, which is to say as the portion of cumulative actuarial gains and losses at the end of the previous financial year that exceeds 10% of the present value of the benefits generated by the plan. This portion is recognised in the income statement in relation to the expected average working life of the participants in the plan.Following the reform, the employment termination indemnity contributions accrued from 1 January 2007 constitute a “defined contribution” scheme whether the employee opts for complementary social security or for the contributions to be paid to the Treasury fund managed by Italy’s Department of Social Security. The value of the contributions - which is recorded under personnel expenses - is calculated on the basis of the contributions due without applying any actuarial calculation methods.
Provisions for guarantees and commitmentsThe individual and collective provisions set aside to cover the estimated possible disbursements connected with the credit risk of guarantees and commitments, determined adopting the same accounting treatment for loans above, are stated under Other liabilities.
Revaluation reservesThis item includes the revaluation reserves for available-for-sale financial assets and property and equipment for which the revaluation method was applied during the first-time application of the IAS/IFRS, as well as the revaluation reserves stated in accordance with special laws.
Payment in sharesThe Group applies the accounting treatment provided for by IFRS 2 regarding payments based on shares for the Group’s stock option plans. The options granted are designated at fair value as at the day they were assigned, which is the date when the plan was approved by the competent bodies. This fair value is a component of fee and commission expense distributed over the period in which the entitlements assigned accrue, recorded as a balancing entry for an unavailable component of shareholders’ equity. The total cost recorded in the financial statements for the stock option plans is reversed in the income statement with a balancing entry in respect of the specific unavailable component of shareholders’ equity if the options are not exercised for reasons that are independent of market trends.If the options are not exercised as a result of market conditions, the total cost is not reversed, but rather the component of shareholders’ equity recorded as a balancing entry to fee and commission expense in the period when the plan entitlements accrued becomes available.
Recognition of costs and revenues Costs are recognised in the income statement in the periods in which the related income is recognised. If the association of costs and revenues can only be made in a generic and indirect manner, the costs are recognised over more than one period following rational, systematic procedures.
Income is recognised at the time it becomes receivable. Commission income and other income from the provision of services is recognised in the periods when the services themselves are provided. Other income is recognised on an accrual basis.
In particular:• Interest income is recognised on an accrual basis that takes the
actual return into account.• Default interest is recognised at the time of collection.• Dividends are recognised in the income statement at the time
their distribution is decided.• For transactions in financial instruments, the difference between
the fair value of the instruments and the amount paid or received is recognised in the income statement only in cases where the fair value can be reliably determined.
• The revenues deriving from the sale of non-financial assets are recognised at the time their sale is completed.
Purchases and sales of financial assets The Group recognises purchases and sales of financial assets at their settlement date, taking said purchases and sales to be those conducted on the basis of contracts that require the asset to be delivered within a period of time that is in accordance with market regulations or conventions. Write-off policyFinancial assets are written off the financial statements when the contractual rights to the financial flows derived from said assets expire or when the financial assets are sold, effectively transferring all the risks/benefits connected with them. Financial liabilities are written off when they mature or are settled. Liabilities are also written off when securities previously issued are repurchased.
Business combinationsThe transfer of control of a company (or of an integrated group of businesses and assets that is run and managed jointly) constitutes a business combination transaction. IFRS 3 requires an acquirer to be identified for all business combination transactions. The acquirer is normally identified as the entity obtaining control of another entity or group of assets. The acquisition and therefore the initial consolidation of the acquired entity is recognised at the date when the acquirer effectively obtains control of the entity or assets acquired. The cost of a business combination transaction must be calculated as the sum of the following: • The fair value at the transaction date of the assets sold, of the
liabilities incurred or assumed and of the capital instruments issued by the acquirer in exchange for control.
• Any additional charges directly attributable to the business combination.
Business combination transactions are recorded using the purchase method, which involves recognising:• The assets, liabilities and contingent liabilities of the acquired
entity at their respective fair values on the date of acquisition, including any intangible assets identifiable not already recognised in the financial statements of the acquired entity.
• Minority interest in the acquired entity in proportion to the related interest in the net fair values.
• The goodwill held by the Group, calculated as the difference between the cost of the business combination and the interest in the net fair value of the identifiable assets, liabilities and contingent liabilities. Any positive difference between the Group’s interest in the net fair value of the assets, liabilities

Consol idated F inancia l Statements Notes 109
and contingent liabilities acquired and the cost of the business combination is recognised in the income statement.
The fair value of the assets, liabilities and contingent liabilities of the acquired entity may be calculated on a provisional basis before the end of the financial year in which the business combination takes place and must be finalised within twelve months of the date of acquisition.Transactions for the purposes of reorganisation or between two or more entities or company assets which are already members of the Banca Fideuram Group or which belong to the Intesa Sanpaolo Group and do not involve changes in the control structures irrespective of the percentage of minority interests before and after the transaction (referred to as business combinations of entities subject to joint control) do not constitute business combinations, being outside the scope of IFRS 3. Such transactions are considered to have no economic substance unless they result in a significant change in cash flows. Hence, in the absence of any specific IAS/IFRS Standard or Interpretation, and in accordance with IAS 8 - which requires a company, in the absence of any specific Standard or Interpretation, to use its own judgment in applying an accounting policy which provides relevant, reliable and prudent information that reflects the economic substance of the transaction - these transactions are recognised maintaining the continuity of the values stated by the acquired entity in the financial statements of the acquiring entity. In accordance with this policy, the same values are recorded in the balance sheet as if the companies (or company divisions) involved in the business combination had always been combined. The assets acquired are stated in the financial statements of the acquiring company at the same values that they had in the financial statements of the transferor company. Any difference between the price paid/collected and the net book value of the assets transferred is recorded directly as a balancing entry under shareholders’ equity net of any deferred tax assets and liabilities (if necessary).
Use of estimates and assumptions in the preparation of the financial statementsThe preparation of financial statements may also require the use of estimates and assumptions that can have significant effects on the amounts stated in the balance sheet and income statement, and on the information on assets and contingent liabilities provided in the financial statements. The preparation of these estimates involves using the information available and adopting subjective valuations, which are also based on historical experience, to formulate reasonable assumptions for reporting management performance. The estimates and assumptions used may by their nature vary from year to year, such that one cannot rule out the possibility of the values currently stated in the financial statements differing, even significantly, in subsequent years as a result of changes in the subjective valuations used. Subjective valuations are mainly required for:• quantifying loan losses and, as a rule, other financial assets;• the valuation models used for the fair value measurement of
financial instruments not listed on active markets;• quantifying staff provisions and provisions for risks and charges;• making estimates and assumptions regarding the recoverability of
deferred tax assets;
• calculating the prepaid expenses on the Personal Financial Adviser Network bonuses linked to specified inflow targets.
Fair value measurementsThe fair value of an asset or liability is the value for which it can be traded in a transaction between independent counterparties with a reasonable knowledge of market conditions and the relevant facts regarding the subject of the transaction. Fundamental to the definition of fair value is the assumption that the entity is fully operational and that there is no need for it wind up or significantly reduce its business, or to undertake operations under unfavourable conditions. The fair value reflects the loan quality of the instrument in that it takes counterparty risk into account.
The fair value of financial instruments is measured using financial market prices for instruments listed on active markets, or using internal valuation models for other financial instruments.
A market is considered to be active when the quoted prices representing effective, standard market transactions that have occurred over an appropriate reference period are readily and regularly available through stock exchanges, dealers, brokers, sector companies, pricing services or authorised bodies. If the instrument is not quoted on an active market or if the market is not operating normally, which is to say when there is an insufficient number of continuous transactions and the bid/ask spread and volatility are not sufficiently low, the fair value of the financial instruments is mainly determined using valuation techniques that aim to establish the price of a hypothetical independent transaction, motivated by normal market considerations at the valuation date.
These techniques include:• Reference to market values that can be indirectly linked to the
financial instrument being valued and can be obtained from products with similar risk characteristics (comparable approach).
• Valuations performed using - even only partially - inputs that are not obtained from observable market parameters, using estimates and assumptions formulated by the valuer (Mark-to-Model).
There is no choice regarding which of these methodologies is chosen, since they have to be applied in hierarchical order and specified in the financial statements by level. Absolute priority is given to the quoted active market prices of the assets and liabilities being measured (Level 1 - effective market quotes) or of similar assets and liabilities (Level 2 - comparable approach) and the lowest priority to unobservable inputs, which are accordingly more discretional (Level 3 - Mark-to-Model Approach).The following are considered to be instruments quoted in listed markets (Level 1): mutual funds, spot exchange rate transactions, futures, options and shares listed on regulated markets, bonds for which a pricing service has provided at least two executable quotes with an appropriate bid-ask spread continuously, and hedge funds where the units are redeemable monthly. If the prices of the financial instruments are not quoted on active markets, the fair value is measured using the comparable approach (Level 2), which adopts valuation models that mainly use

110 Annua l Repor t 2009
market parameters. In these cases the valuations are not based on the prices of the instrument being valued, but on prices or credit spreads obtained from the quoted prices of instruments that are broadly similar in terms of risk, using a given pricing model. This approach consists in researching transactions on active markets in instruments which are comparable in terms of risk with the instrument being valued. Lastly, the fair value measurement of certain financial instruments requires the use of valuation models that use parameters which
cannot be observed directly on the market and therefore involve estimates and assumptions by the valuer (Level 3). The valuation method adopted for a given financial instrument is maintained over time and only changed if there are substantial changes in market conditions or subjective changes regarding the issuer of the financial instrument. The fair value disclosures incorporated in the notes to the financial statements use this fair value measurement hierarchy to provide analyses of the financial assets and liabilities by fair value level.
Consol idated F inancia l Statements Notes 111
A.3.1.1 Reclassified financial assets: book value, fair value and effect on total comprehensive income
Type of financial instrument
Source category
Destination category
Book value at
31.12.2009
Fair value at 31.12.2009
Comprehensive income without transfer
(before tax)
Comprehensive income for the year(before tax)
Estimations Other Estimations (*) Other
Debt securitiesFinancial assetsavailable for sale Due from banks 21,207 20,365 (50) 315 1,633 315
Debt securitiesFinancial assetsavailable for sale Loans to customers 792,989 706,555 (91,487) 36,636 (51,785) 36,636
(*) Includes changes in fair value attributable to interest-rate hedging.
A.3.2.1 Accounting categories: fair value analysis
31.12.2009 31.12.2008
Level 1 Level 2 Level 3 Level 1 Level 2 Level 3
1. Financial assets held for trading 20,401 36,279 - 25,036 71,709 -
2. Financial assets designated at fair value 1,009 217,714 - 988 182,990 -
3. Financial assets available for sale 2,858,241 82 9 2,495,610 117,855 9
4. Hedging derivatives - 236 - - - -
Total 2,879,651 254,311 9 2,521,634 372,554 9
1. Financial liabilities held for trading - 39,503 - 25 82,835 -
2. Financial liabilities designated at fair value - - - - - -
3. Hedging derivatives - 276,024 - - 307,357 -
Total - 315,527 - 25 390,192 -
A.3.1.4 Effective interest rate and anticipated financial flows of reclassified assets
Type of financial instrument
Source category
Destination category
Effective interest rate
Anticipated financial flows
Debt securities
Financial assetsavailable for sale
Due from banks and loans to customers 5.5% 1,341,376
A.3 FAIR VALUE DISCLOSURES
A.3.1 Transfers between categories
In accordance with the related compulsory disclosure requirements, the Group states that it availed itself of the amendment to IAS 39 introduced by EC Regulation No. 1004/2008 and reclassified €668.5m available-for-sale bonds as Loans & Receivables in the third quarter of 2008. If the Group had not availed itself of the option of reclassifying
these bonds, they would have suffered a further loss of approximately €91,537,000 as the difference between the theoretical total negative reserve at 31 December 2009 (€135,640,000) and the total negative reserve recorded under shareholders’ equity at the reclassification date (€44,103,000).
A.3.2 Fair value hierarchy
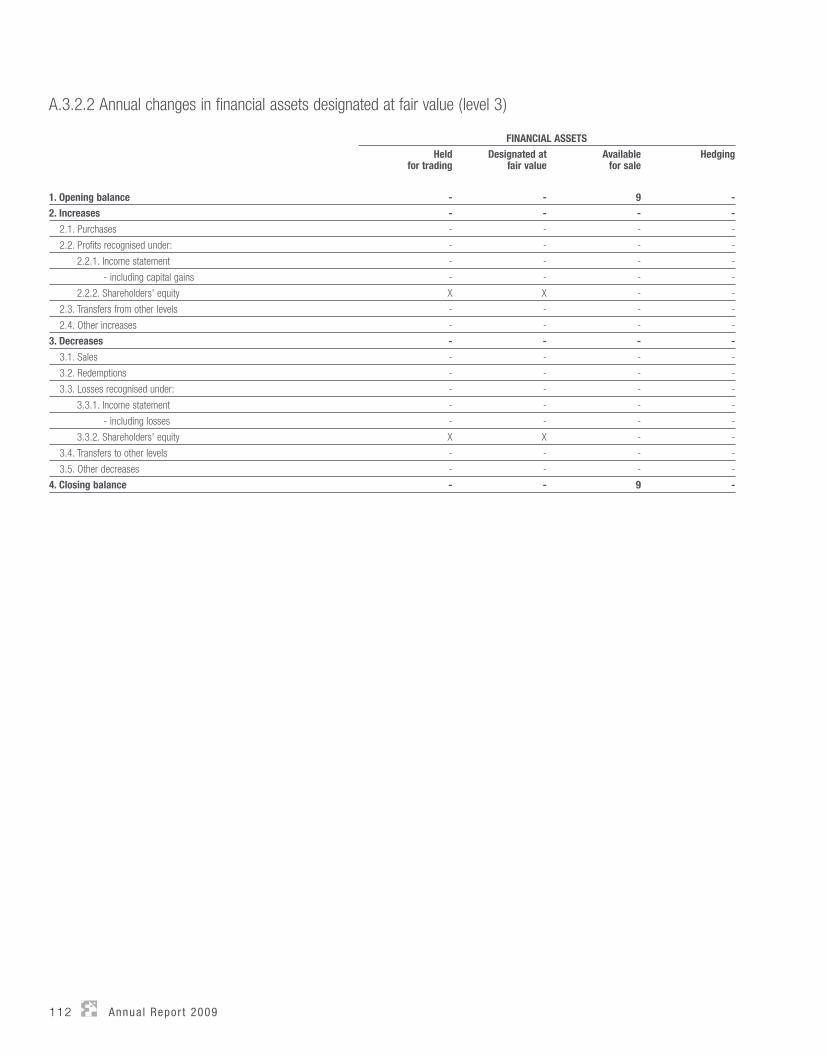
112 Annua l Repor t 2009
A.3.2.2 Annual changes in financial assets designated at fair value (level 3)
FINANCIAL ASSETS
Held for trading
Designated at fair value
Availablefor sale
Hedging
1. Opening balance - - 9 -
2. Increases - - - -
2.1. Purchases - - - -
2.2. Profits recognised under: - - - -
2.2.1. Income statement - - - -
- including capital gains - - - -
2.2.2. Shareholders' equity X X - -
2.3. Transfers from other levels - - - -
2.4. Other increases - - - -
3. Decreases - - - -
3.1. Sales - - - -
3.2. Redemptions - - - -
3.3. Losses recognised under: - - - -
3.3.1. Income statement - - - -
- including losses - - - -
3.3.2. Shareholders' equity X X - -
3.4. Transfers to other levels - - - -
3.5. Other decreases - - - -
4. Closing balance - - 9 -
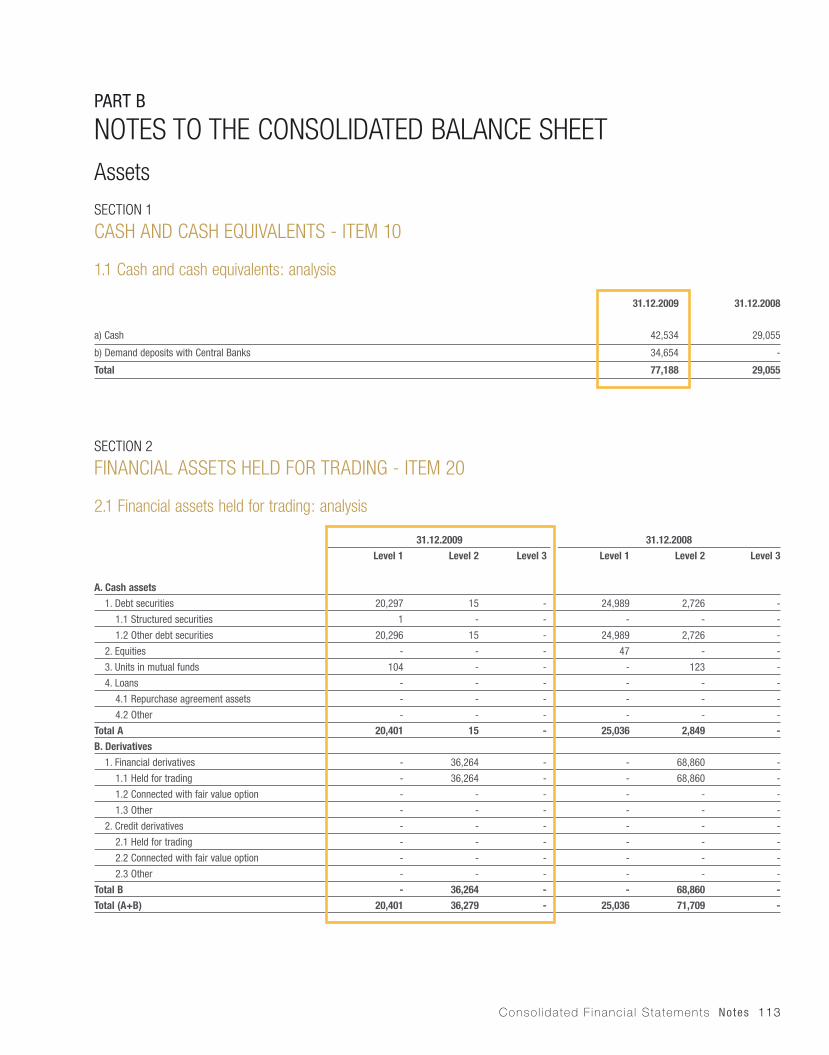
Consol idated F inancia l Statements Notes 113
PART B
NOTES TO THE CONSOLIDATED BALANCE SHEETAssets
SECTION 1
CASH AND CASH EQUIVALENTS - ITEM 10
1.1 Cash and cash equivalents: analysis
31.12.2009 31.12.2008
a) Cash 42,534 29,055
b) Demand deposits with Central Banks 34,654 -
Total 77,188 29,055
SECTION 2
FINANCIAL ASSETS HELD FOR TRADING - ITEM 20
2.1 Financial assets held for trading: analysis
31.12.2009 31.12.2008
Level 1 Level 2 Level 3 Level 1 Level 2 Level 3
A. Cash assets
1. Debt securities 20,297 15 - 24,989 2,726 -
1.1 Structured securities 1 - - - - -
1.2 Other debt securities 20,296 15 - 24,989 2,726 -
2. Equities - - - 47 - -
3. Units in mutual funds 104 - - - 123 -
4. Loans - - - - - -
4.1 Repurchase agreement assets - - - - - -
4.2 Other - - - - - -
Total A 20,401 15 - 25,036 2,849 -
B. Derivatives
1. Financial derivatives - 36,264 - - 68,860 -
1.1 Held for trading - 36,264 - - 68,860 -
1.2 Connected with fair value option - - - - - -
1.3 Other - - - - - -
2. Credit derivatives - - - - - -
2.1 Held for trading - - - - - -
2.2 Connected with fair value option - - - - - -
2.3 Other - - - - - -
Total B - 36,264 - - 68,860 -
Total (A+B) 20,401 36,279 - 25,036 71,709 -

114 Annua l Repor t 2009
2.2 Financial assets held for trading: analysis by debtors/issuers
31.12.2009 31.12.2008
A. Cash assets
1. Debt securities 20,312 27,715
a) Governments and Central Banks 19,841 23,578
b) Other public entities - -
c) Banks 441 4,089
d) Other issuers 30 48
2. Equities - 47
a) Banks - -
b) Other issuers: - 47
- Insurance companies - -
- Financial Institutions - -
- Non-financial companies - 47
- Other - -
3. Units in mutual funds 104 123
4. Loans - -
a) Governments and Central Banks - -
b) Other public entities - -
c) Banks - -
d) Other parties - -
Total A 20,416 27,885
B. Derivatives
a) Banks 7,535 51,096
- fair value 7,535 51,096
b) Customers 28,729 17,764
- fair value 28,729 17,764
Total B 36,264 68,860
Total (A+B) 56,680 96,745
2.3 Cash financial assets held for trading: changes in the year
Debt securities
Equities Units in mutual funds
Loans Total
A. Opening balance 27,715 47 123 - 27,885
B. Increases 5,973,930 4,328 398 - 5,978,656
B1. Purchases 5,968,545 4,311 380 - 5,973,236
B2. Increases in fair value 43 - 15 - 58
B3. Other increases 5,342 17 3 - 5,362
C. Decreases 5,981,333 4,375 417 - 5,986,125
C1. Sales 5,960,771 4,115 416 - 5,965,302
C2. Redemptions 17,330 - - - 17,330
C3. Decreases in fair value - - - - -
C4. Transfers to other categories - - - - -
C5. Other decreases 3,232 260 1 - 3,493
D. Closing balance 20,312 - 104 - 20,416
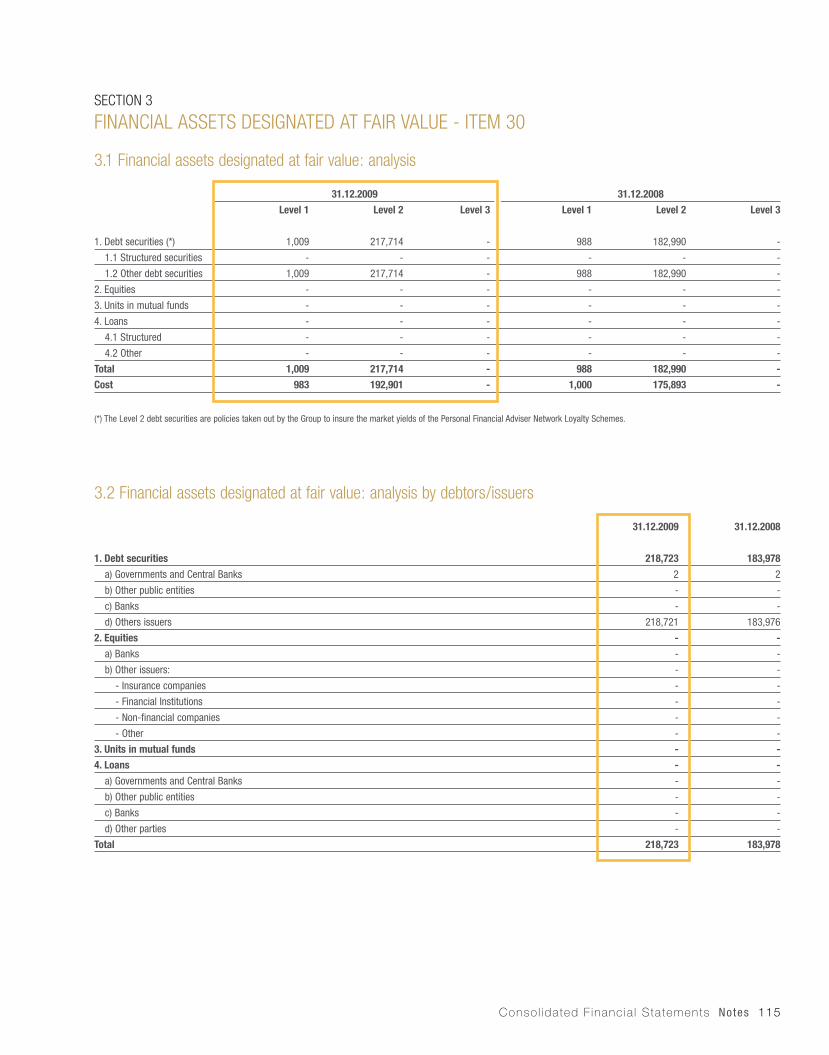
Consol idated F inancia l Statements Notes 115
SECTION 3
FINANCIAL ASSETS DESIGNATED AT FAIR VALUE - ITEM 30
3.1 Financial assets designated at fair value: analysis
31.12.2009 31.12.2008
Level 1 Level 2 Level 3 Level 1 Level 2 Level 3
1. Debt securities (*) 1,009 217,714 - 988 182,990 -
1.1 Structured securities - - - - - -
1.2 Other debt securities 1,009 217,714 - 988 182,990 -
2. Equities - - - - - -
3. Units in mutual funds - - - - - -
4. Loans - - - - - -
4.1 Structured - - - - - -
4.2 Other - - - - - -
Total 1,009 217,714 - 988 182,990 -
Cost 983 192,901 - 1,000 175,893 -
(*) The Level 2 debt securities are policies taken out by the Group to insure the market yields of the Personal Financial Adviser Network Loyalty Schemes.
3.2 Financial assets designated at fair value: analysis by debtors/issuers
31.12.2009 31.12.2008
1. Debt securities 218,723 183,978
a) Governments and Central Banks 2 2
b) Other public entities - -
c) Banks - -
d) Others issuers 218,721 183,976
2. Equities - -
a) Banks - -
b) Other issuers: - -
- Insurance companies - -
- Financial Institutions - -
- Non-financial companies - -
- Other - -
3. Units in mutual funds - -
4. Loans - -
a) Governments and Central Banks - -
b) Other public entities - -
c) Banks - -
d) Other parties - -
Total 218,723 183,978
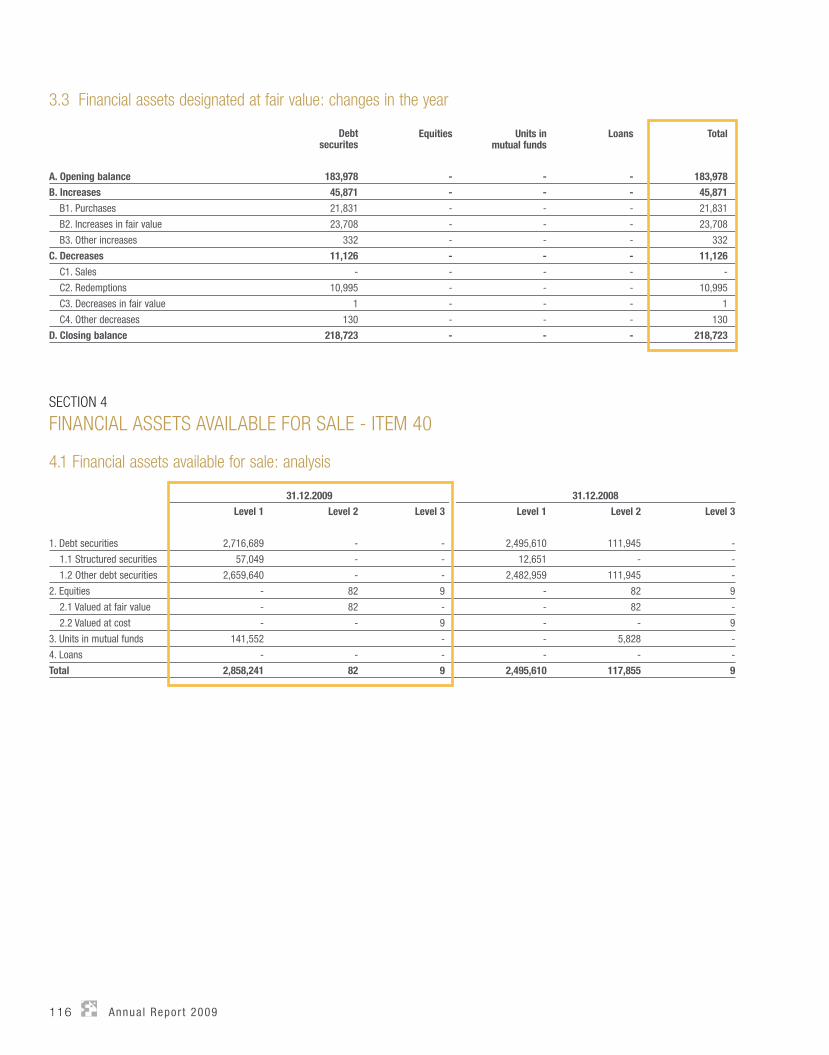
116 Annua l Repor t 2009
3.3 Financial assets designated at fair value: changes in the year
Debtsecurites
Equities Units inmutual funds
Loans Total
A. Opening balance 183,978 - - - 183,978
B. Increases 45,871 - - - 45,871
B1. Purchases 21,831 - - - 21,831
B2. Increases in fair value 23,708 - - - 23,708
B3. Other increases 332 - - - 332
C. Decreases 11,126 - - - 11,126
C1. Sales - - - - -
C2. Redemptions 10,995 - - - 10,995
C3. Decreases in fair value 1 - - - 1
C4. Other decreases 130 - - - 130
D. Closing balance 218,723 - - - 218,723
SECTION 4
FINANCIAL ASSETS AVAILABLE FOR SALE - ITEM 40
4.1 Financial assets available for sale: analysis
31.12.2009 31.12.2008
Level 1 Level 2 Level 3 Level 1 Level 2 Level 3
1. Debt securities 2,716,689 - - 2,495,610 111,945 -
1.1 Structured securities 57,049 - - 12,651 - -
1.2 Other debt securities 2,659,640 - - 2,482,959 111,945 -
2. Equities - 82 9 - 82 9
2.1 Valued at fair value - 82 - - 82 -
2.2 Valued at cost - - 9 - - 9
3. Units in mutual funds 141,552 - - 5,828 -
4. Loans - - - - - -
Total 2,858,241 82 9 2,495,610 117,855 9

Consol idated F inancia l Statements Notes 117
4.2 Financial assets available for sale: analysis by debtors/issuers
31.12.2009 31.12.2008
1. Debt securities 2,716,689 2,607,555
a) Governments and Central Banks 847,827 822,200
b) Other public entities - -
c) Banks 988,584 971,429
d) Other issuers 880,278 813,926
2. Equities 91 91
a) Banks - -
b) Other issuers: 91 91
- Insurance companies - -
- Financial Institutions - -
- Non-financial companies 91 91
- Other - -
3. Units in mutual funds 141,552 5,828
4. Loans - -
a) Governments and Central Banks - -
b) Other public entities - -
c) Banks - -
d) Other parties - -
Total 2,858,332 2,613,474
4.3 Financial assets available for sale: assets hedged with micro-hedging
31.12.2009 31.12.2008
1. Financial assets hedged with fair value micro-hedging 865,937 743,801
a) Interest rate risk 865,937 743,801
b) Price risk - -
c) Exchange rate risk - -
d) Credit risk - -
e) Other risks - -
2. Financial assets hedged with micro-hedging of financial flows - -
a) Interest rate - -
b) Exchange risk - -
c) Other - -
Total 865,937 743,801
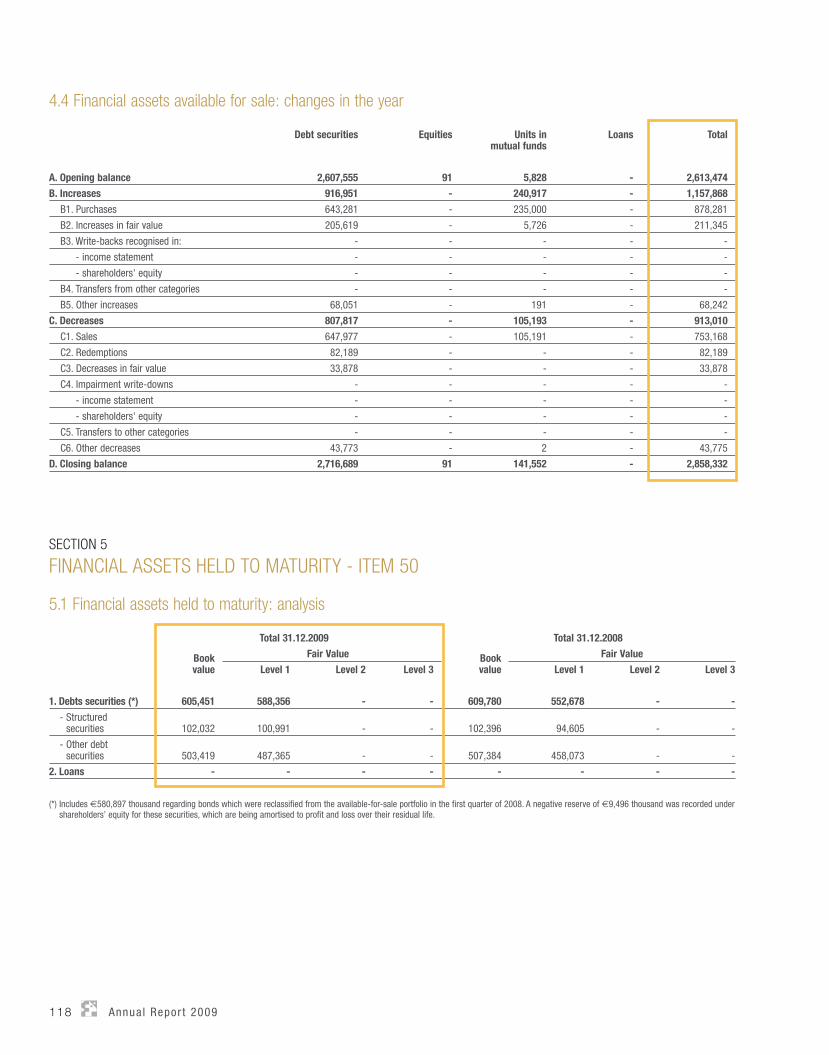
118 Annua l Repor t 2009
4.4 Financial assets available for sale: changes in the year
Debt securities Equities Units inmutual funds
Loans Total
A. Opening balance 2,607,555 91 5,828 - 2,613,474
B. Increases 916,951 - 240,917 - 1,157,868
B1. Purchases 643,281 - 235,000 - 878,281
B2. Increases in fair value 205,619 - 5,726 - 211,345
B3. Write-backs recognised in: - - - - -
- income statement - - - - -
- shareholders' equity - - - - -
B4. Transfers from other categories - - - - -
B5. Other increases 68,051 - 191 - 68,242
C. Decreases 807,817 - 105,193 - 913,010
C1. Sales 647,977 - 105,191 - 753,168
C2. Redemptions 82,189 - - - 82,189
C3. Decreases in fair value 33,878 - - - 33,878
C4. Impairment write-downs - - - - -
- income statement - - - - -
- shareholders' equity - - - - -
C5. Transfers to other categories - - - - -
C6. Other decreases 43,773 - 2 - 43,775
D. Closing balance 2,716,689 91 141,552 - 2,858,332
SECTION 5
FINANCIAL ASSETS HELD TO MATURITY - ITEM 50
5.1 Financial assets held to maturity: analysis
Total 31.12.2009 Total 31.12.2008
Bookvalue
Fair Value Bookvalue
Fair Value
Level 1 Level 2 Level 3 Level 1 Level 2 Level 3
1. Debts securities (*) 605,451 588,356 - - 609,780 552,678 - -
- Structured securities 102,032 100,991 - - 102,396 94,605 - -
- Other debt securities 503,419 487,365 - - 507,384 458,073 - -
2. Loans - - - - - - - -
(*) Includes €580,897 thousand regarding bonds which were reclassified from the available-for-sale portfolio in the first quarter of 2008. A negative reserve of €9,496 thousand was recorded under shareholders’ equity for these securities, which are being amortised to profit and loss over their residual life.
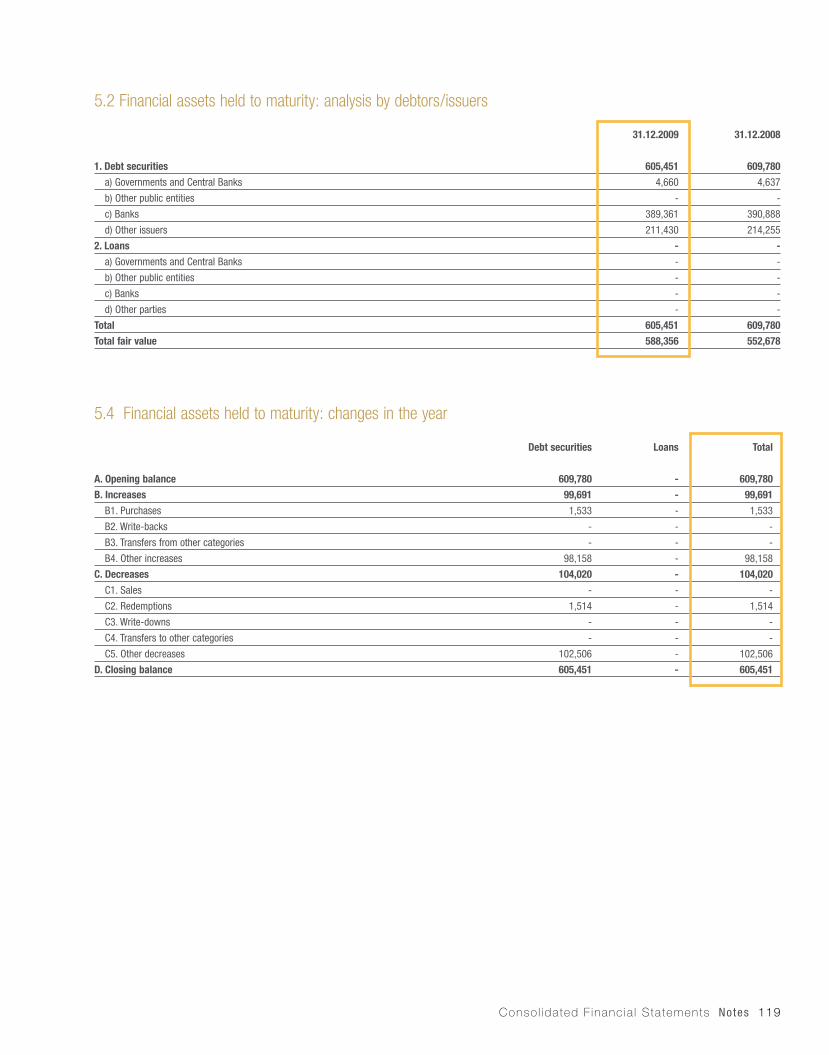
Consol idated F inancia l Statements Notes 119
5.2 Financial assets held to maturity: analysis by debtors/issuers
31.12.2009 31.12.2008
1. Debt securities 605,451 609,780
a) Governments and Central Banks 4,660 4,637
b) Other public entities - -
c) Banks 389,361 390,888
d) Other issuers 211,430 214,255
2. Loans - -
a) Governments and Central Banks - -
b) Other public entities - -
c) Banks - -
d) Other parties - -
Total 605,451 609,780
Total fair value 588,356 552,678
5.4 Financial assets held to maturity: changes in the year
Debt securities Loans Total
A. Opening balance 609,780 - 609,780
B. Increases 99,691 - 99,691
B1. Purchases 1,533 - 1,533
B2. Write-backs - - -
B3. Transfers from other categories - - -
B4. Other increases 98,158 - 98,158
C. Decreases 104,020 - 104,020
C1. Sales - - -
C2. Redemptions 1,514 - 1,514
C3. Write-downs - - -
C4. Transfers to other categories - - -
C5. Other decreases 102,506 - 102,506
D. Closing balance 605,451 - 605,451

120 Annua l Repor t 2009
SECTION 6
DUE FROM BANKS - ITEM 60
6.1 Due from banks: analysis
31.12.2009 31.12.2008
A. Due from Central Banks: analysis 456,205 79,231
1. Term deposits 227,500 -
2. Statutory reserve 228,705 79,231
3. Repurchase agreement assets - -
4. Other - -
B. Due from banks 3,242,710 4,383,125
1. Current accounts and demand deposits 495,811 398,643
2. Term deposits 1,690,371 1,964,925
3. Other 1,046 1,819
3.1 Repurchase agreement assets - -
3.2 Finance leases - -
3.3 Other 1,046 1,819
4. Debt securities 1,055,482 2,017,738
4.1 Structured securities 268,709 110,765
4.2 Other debt securities 786,773 1,906,973
Total (book value) 3,698,915 4,462,356
Total (fair value) (*) 3,682,269 4,412,069
(*) The difference with respect to the book value was due to losses on debt securities.
6.2 Due from banks hedged with micro-hedging
31.12.2009 31.12.2008
1. Loans hedged with fair value micro-hedging 83,591 82,507
a) Interest rate risk 83,591 82,507
b) Exchange rate risk - -
c) Credit risk - -
d) Other risks - -
2. Loans hedged with micro-hedging of financial flows - -
a) Interest rate - -
b) Exchange rate - -
c) Other - -
Total 83,591 82,507
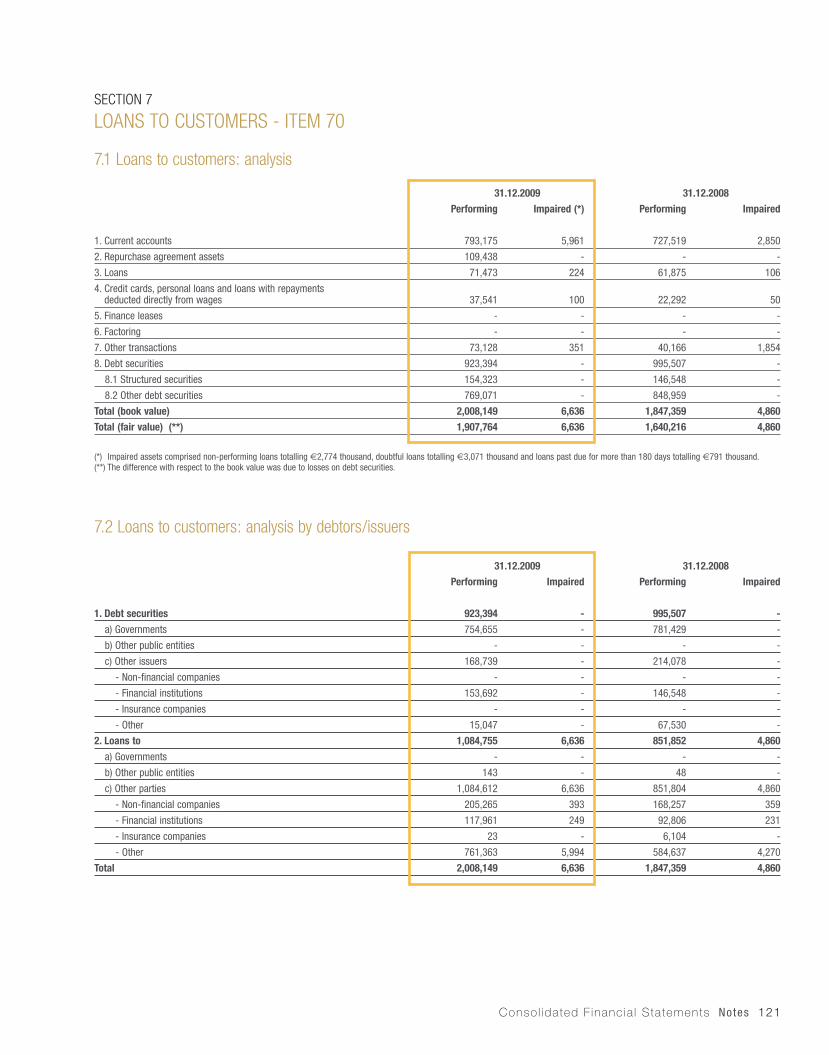
Consol idated F inancia l Statements Notes 121
SECTION 7
LOANS TO CUSTOMERS - ITEM 70
7.1 Loans to customers: analysis
31.12.2009 31.12.2008
Performing Impaired (*) Performing Impaired
1. Current accounts 793,175 5,961 727,519 2,850
2. Repurchase agreement assets 109,438 - - -
3. Loans 71,473 224 61,875 106
4. Credit cards, personal loans and loans with repaymentsdeducted directly from wages 37,541 100 22,292 50
5. Finance leases - - - -
6. Factoring - - - -
7. Other transactions 73,128 351 40,166 1,854
8. Debt securities 923,394 - 995,507 -
8.1 Structured securities 154,323 - 146,548 -
8.2 Other debt securities 769,071 - 848,959 -
Total (book value) 2,008,149 6,636 1,847,359 4,860
Total (fair value) (**) 1,907,764 6,636 1,640,216 4,860
(*) Impaired assets comprised non-performing loans totalling €2,774 thousand, doubtful loans totalling €3,071 thousand and loans past due for more than 180 days totalling €791 thousand.(**) The difference with respect to the book value was due to losses on debt securities.
7.2 Loans to customers: analysis by debtors/issuers
31.12.2009 31.12.2008
Performing Impaired Performing Impaired
1. Debt securities 923,394 - 995,507 -
a) Governments 754,655 - 781,429 -
b) Other public entities - - - -
c) Other issuers 168,739 - 214,078 -
- Non-financial companies - - - -
- Financial institutions 153,692 - 146,548 -
- Insurance companies - - - -
- Other 15,047 - 67,530 -
2. Loans to 1,084,755 6,636 851,852 4,860
a) Governments - - - -
b) Other public entities 143 - 48 -
c) Other parties 1,084,612 6,636 851,804 4,860
- Non-financial companies 205,265 393 168,257 359
- Financial institutions 117,961 249 92,806 231
- Insurance companies 23 - 6,104 -
- Other 761,363 5,994 584,637 4,270
Total 2,008,149 6,636 1,847,359 4,860
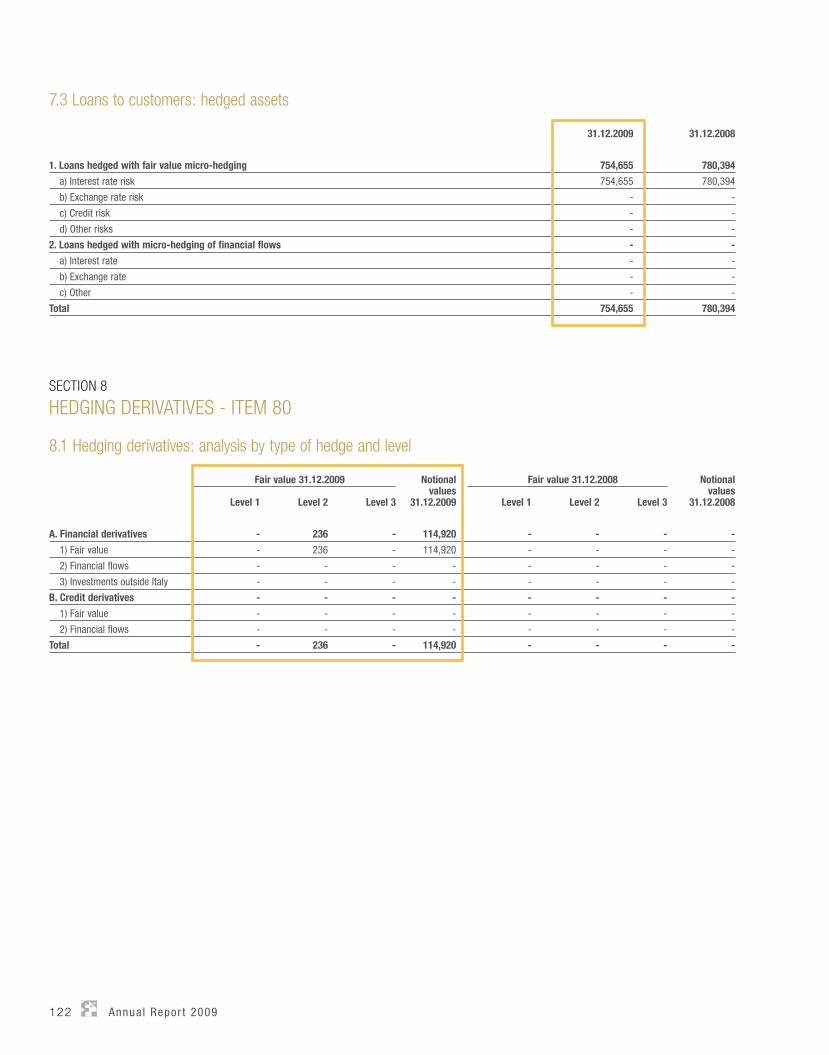
122 Annua l Repor t 2009
7.3 Loans to customers: hedged assets
31.12.2009 31.12.2008
1. Loans hedged with fair value micro-hedging 754,655 780,394
a) Interest rate risk 754,655 780,394
b) Exchange rate risk - -
c) Credit risk - -
d) Other risks - -
2. Loans hedged with micro-hedging of financial flows - -
a) Interest rate - -
b) Exchange rate - -
c) Other - -
Total 754,655 780,394
SECTION 8
HEDGING DERIVATIVES - ITEM 80
8.1 Hedging derivatives: analysis by type of hedge and level
Fair value 31.12.2009 Notional values
31.12.2009
Fair value 31.12.2008 Notionalvalues
31.12.2008Level 1 Level 2 Level 3 Level 1 Level 2 Level 3
A. Financial derivatives - 236 - 114,920 - - - -
1) Fair value - 236 - 114,920 - - - -
2) Financial flows - - - - - - - -
3) Investments outside Italy - - - - - - - -
B. Credit derivatives - - - - - - - -
1) Fair value - - - - - - - -
2) Financial flows - - - - - - - -
Total - 236 - 114,920 - - - -
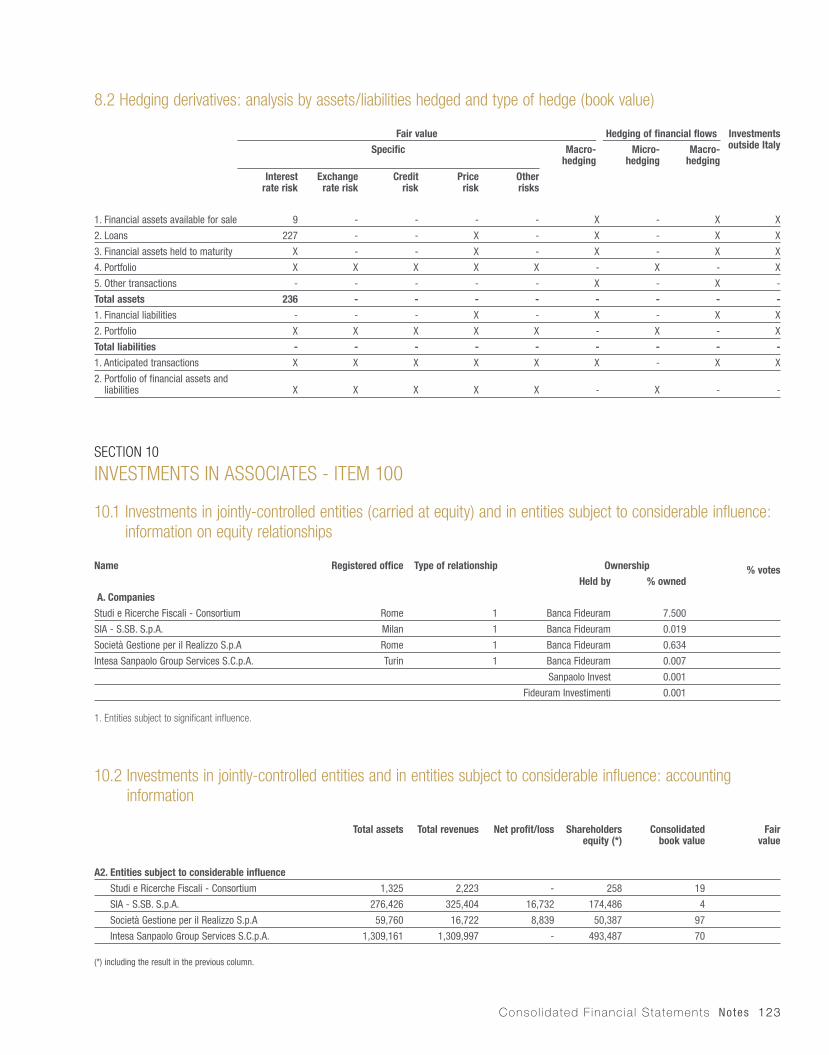
Consol idated F inancia l Statements Notes 123
8.2 Hedging derivatives: analysis by assets/liabilities hedged and type of hedge (book value)
Fair value Hedging of financial flows Investments outside ItalySpecific Macro-
hedgingMicro-
hedgingMacro-
hedging
Interestrate risk
Exchange rate risk
Creditrisk
Pricerisk
Otherrisks
1. Financial assets available for sale 9 - - - - X - X X
2. Loans 227 - - X - X - X X
3. Financial assets held to maturity X - - X - X - X X
4. Portfolio X X X X X - X - X
5. Other transactions - - - - - X - X -
Total assets 236 - - - - - - - -
1. Financial liabilities - - - X - X - X X
2. Portfolio X X X X X - X - X
Total liabilities - - - - - - - - -
1. Anticipated transactions X X X X X X - X X
2. Portfolio of financial assets and liabilities X X X X X - X - -
SECTION 10
INVESTMENTS IN ASSOCIATES - ITEM 100
10.1 Investments in jointly-controlled entities (carried at equity) and in entities subject to considerable influence: information on equity relationships
Name Registered office Type of relationship Ownership % votesHeld by % owned
A. Companies
Studi e Ricerche Fiscali - Consortium Rome 1 Banca Fideuram 7.500
SIA - S.SB. S.p.A. Milan 1 Banca Fideuram 0.019
Società Gestione per il Realizzo S.p.A Rome 1 Banca Fideuram 0.634
Intesa Sanpaolo Group Services S.C.p.A. Turin 1 Banca Fideuram 0.007
Sanpaolo Invest 0.001
Fideuram Investimenti 0.001
1. Entities subject to significant influence.
10.2 Investments in jointly-controlled entities and in entities subject to considerable influence: accounting information
Total assets Total revenues Net profit/loss Shareholders equity (*)
Consolidated book value
Fairvalue
A2. Entities subject to considerable influence
Studi e Ricerche Fiscali - Consortium 1,325 2,223 - 258 19
SIA - S.SB. S.p.A. 276,426 325,404 16,732 174,486 4
Società Gestione per il Realizzo S.p.A 59,760 16,722 8,839 50,387 97
Intesa Sanpaolo Group Services S.C.p.A. 1,309,161 1,309,997 - 493,487 70
(*) including the result in the previous column.

124 Annua l Repor t 2009
10.3 Investments in associates: changes in the year
31.12.2009 31.12.2008
A. Opening balance 120 120
B. Increases 770 -
B1. Purchases 770 -
B2. Write-backs - -
B3. Revaluations - -
B4. Other increases - -
C. Decreases 700 -
C1. Sales 700 -
C2. Write-downs - -
C3. Other decreases - -
D. Closing balance 190 120
E. Total revaluations - -
F. Total adjustments - -
SECTION 12
PROPERTY AND EQUIPMENT - ITEM 120
12.1 Property and equipment: analysis of assets valued at cost
31.12.2009 31.12.2008
A. Functional assets
1.1 Owned 31,541 31,757
a) land 21,323 21,323
b) buildings 4,160 4,343
c) furniture 2,604 2,848
d) electronic equipment 1,036 533
e) other 2,418 2,710
1.2 Purchased under financial leasing agreements - -
a) land - -
b) buildings - -
c) furniture - -
d) electronic equipment - -
e) other - -
Total A 31,541 31,757
B. Investment assets
2.1 Owned - -
a) land - -
b) buildings - -
2.2 Purchased under financial leasing agreements - -
a) land - -
b) buildings - -
Total B - -
Total (A+B) 31,541 31,757
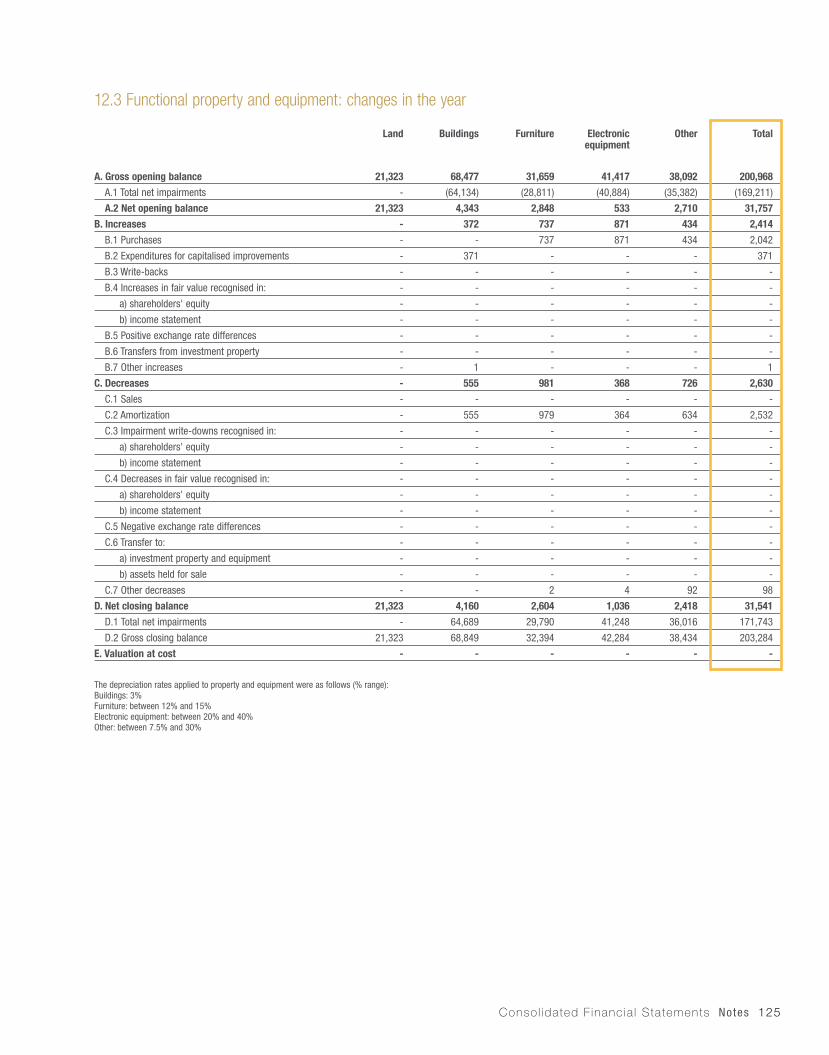
Consol idated F inancia l Statements Notes 125
12.3 Functional property and equipment: changes in the year
Land Buildings Furniture Electronic equipment
Other Total
A. Gross opening balance 21,323 68,477 31,659 41,417 38,092 200,968
A.1 Total net impairments - (64,134) (28,811) (40,884) (35,382) (169,211)
A.2 Net opening balance 21,323 4,343 2,848 533 2,710 31,757
B. Increases - 372 737 871 434 2,414
B.1 Purchases - - 737 871 434 2,042
B.2 Expenditures for capitalised improvements - 371 - - - 371
B.3 Write-backs - - - - - -
B.4 Increases in fair value recognised in: - - - - - -
a) shareholders' equity - - - - - -
b) income statement - - - - - -
B.5 Positive exchange rate differences - - - - - -
B.6 Transfers from investment property - - - - - -
B.7 Other increases - 1 - - - 1
C. Decreases - 555 981 368 726 2,630
C.1 Sales - - - - - -
C.2 Amortization - 555 979 364 634 2,532
C.3 Impairment write-downs recognised in: - - - - - -
a) shareholders' equity - - - - - -
b) income statement - - - - - -
C.4 Decreases in fair value recognised in: - - - - - -
a) shareholders' equity - - - - - -
b) income statement - - - - - -
C.5 Negative exchange rate differences - - - - - -
C.6 Transfer to: - - - - - -
a) investment property and equipment - - - - - -
b) assets held for sale - - - - - -
C.7 Other decreases - - 2 4 92 98
D. Net closing balance 21,323 4,160 2,604 1,036 2,418 31,541
D.1 Total net impairments - 64,689 29,790 41,248 36,016 171,743
D.2 Gross closing balance 21,323 68,849 32,394 42,284 38,434 203,284
E. Valuation at cost - - - - - -
The depreciation rates applied to property and equipment were as follows (% range):Buildings: 3%Furniture: between 12% and 15%Electronic equipment: between 20% and 40%Other: between 7.5% and 30%
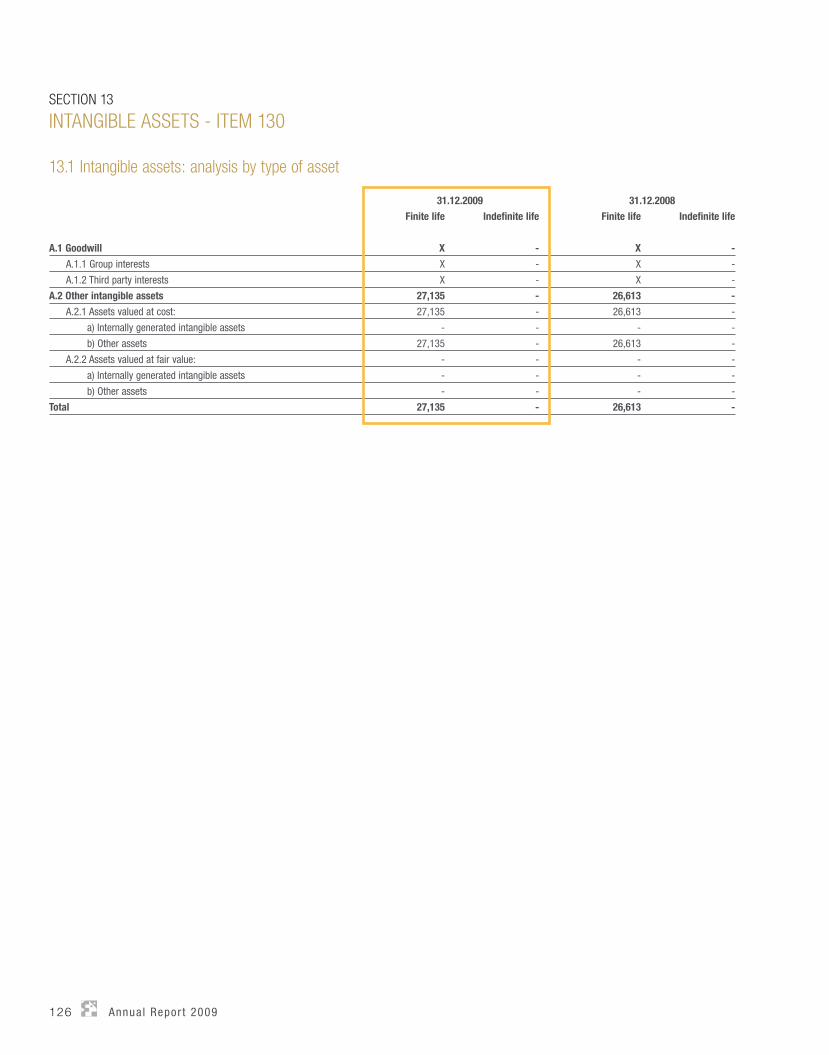
126 Annua l Repor t 2009
SECTION 13
INTANGIBLE ASSETS - ITEM 130
13.1 Intangible assets: analysis by type of asset
31.12.2009 31.12.2008
Finite life Indefinite life Finite life Indefinite life
A.1 Goodwill X - X -
A.1.1 Group interests X - X -
A.1.2 Third party interests X - X -
A.2 Other intangible assets 27,135 - 26,613 -
A.2.1 Assets valued at cost: 27,135 - 26,613 -
a) Internally generated intangible assets - - - -
b) Other assets 27,135 - 26,613 -
A.2.2 Assets valued at fair value: - - - -
a) Internally generated intangible assets - - - -
b) Other assets - - - -
Total 27,135 - 26,613 -
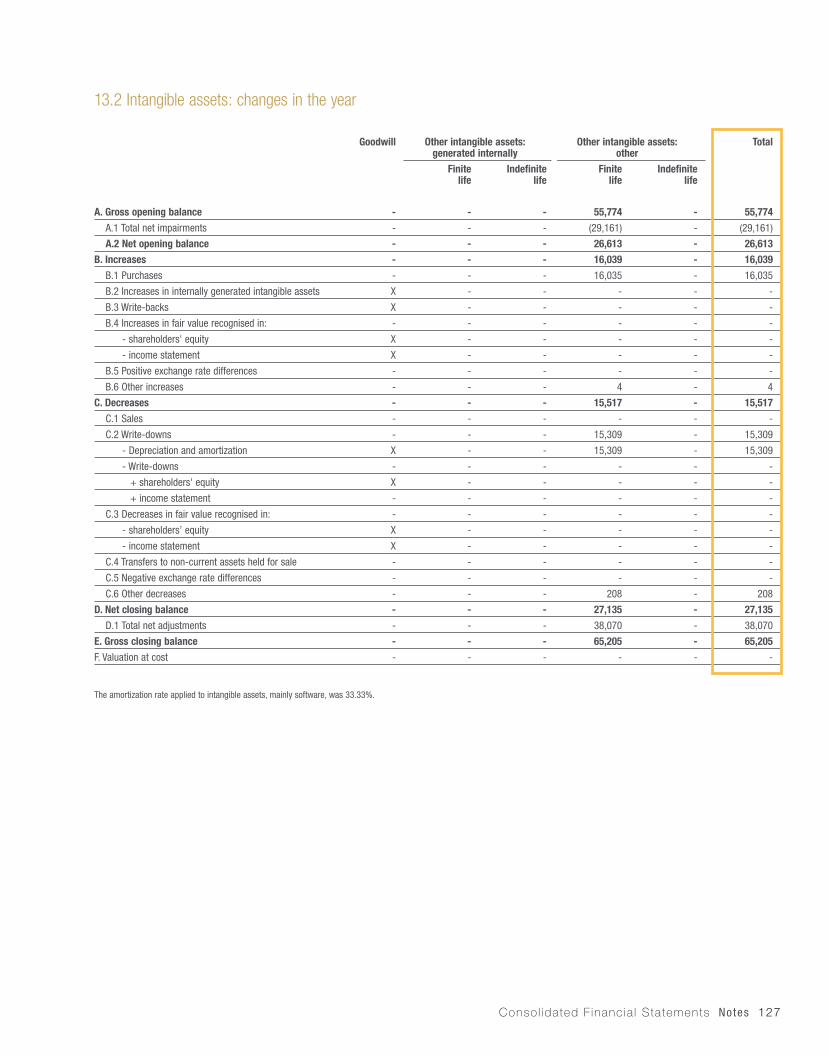
Consol idated F inancia l Statements Notes 127
13.2 Intangible assets: changes in the year
Goodwill Other intangible assets: generated internally
Other intangible assets:other
Total
Finitelife
Indefinitelife
Finitelife
Indefinitelife
A. Gross opening balance - - - 55,774 - 55,774
A.1 Total net impairments - - - (29,161) - (29,161)
A.2 Net opening balance - - - 26,613 - 26,613
B. Increases - - - 16,039 - 16,039
B.1 Purchases - - - 16,035 - 16,035
B.2 Increases in internally generated intangible assets X - - - - -
B.3 Write-backs X - - - - -
B.4 Increases in fair value recognised in: - - - - - -
- shareholders' equity X - - - - -
- income statement X - - - - -
B.5 Positive exchange rate differences - - - - - -
B.6 Other increases - - - 4 - 4
C. Decreases - - - 15,517 - 15,517
C.1 Sales - - - - - -
C.2 Write-downs - - - 15,309 - 15,309
- Depreciation and amortization X - - 15,309 - 15,309
- Write-downs - - - - - -
+ shareholders' equity X - - - - -
+ income statement - - - - - -
C.3 Decreases in fair value recognised in: - - - - - -
- shareholders’ equity X - - - - -
- income statement X - - - - -
C.4 Transfers to non-current assets held for sale - - - - - -
C.5 Negative exchange rate differences - - - - - -
C.6 Other decreases - - - 208 - 208
D. Net closing balance - - - 27,135 - 27,135
D.1 Total net adjustments - - - 38,070 - 38,070
E. Gross closing balance - - - 65,205 - 65,205
F. Valuation at cost - - - - - -
The amortization rate applied to intangible assets, mainly software, was 33.33%.
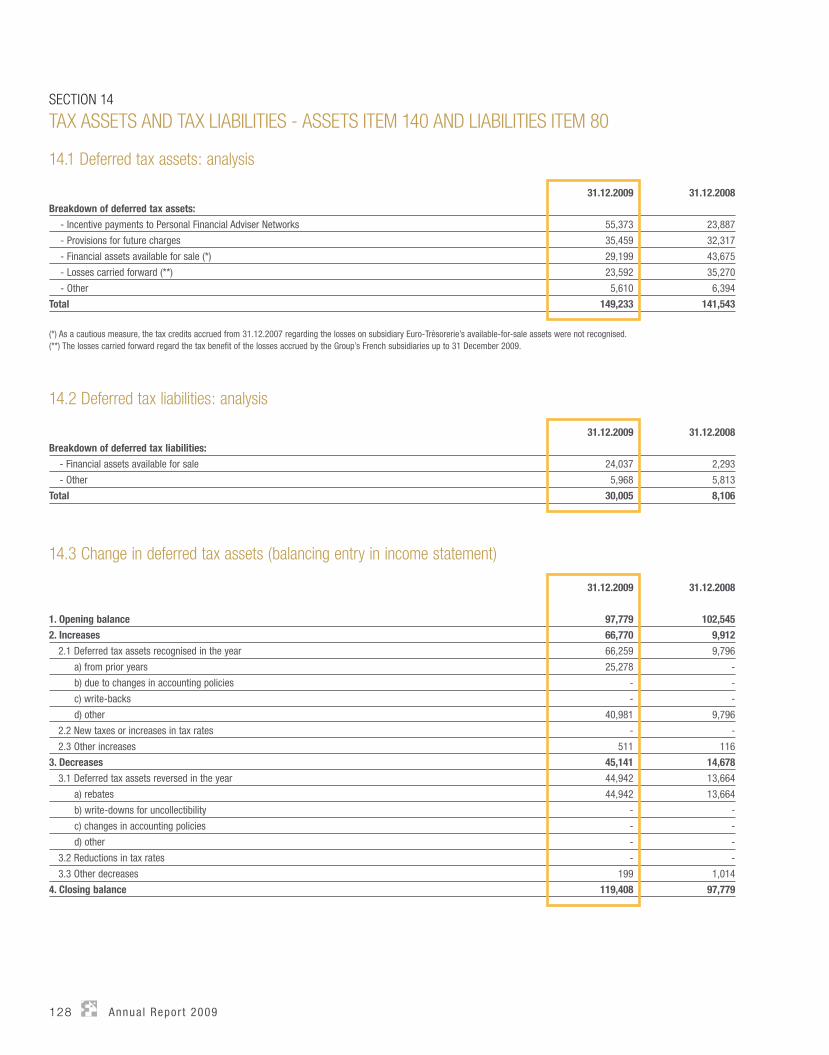
128 Annua l Repor t 2009
14.3 Change in deferred tax assets (balancing entry in income statement)
31.12.2009 31.12.2008
1. Opening balance 97,779 102,545
2. Increases 66,770 9,912
2.1 Deferred tax assets recognised in the year 66,259 9,796
a) from prior years 25,278 -
b) due to changes in accounting policies - -
c) write-backs - -
d) other 40,981 9,796
2.2 New taxes or increases in tax rates - -
2.3 Other increases 511 116
3. Decreases 45,141 14,678
3.1 Deferred tax assets reversed in the year 44,942 13,664
a) rebates 44,942 13,664
b) write-downs for uncollectibility - -
c) changes in accounting policies - -
d) other - -
3.2 Reductions in tax rates - -
3.3 Other decreases 199 1,014
4. Closing balance 119,408 97,779
SECTION 14
TAX ASSETS AND TAX LIABILITIES - ASSETS ITEM 140 AND LIABILITIES ITEM 80
14.1 Deferred tax assets: analysis
31.12.2009 31.12.2008
Breakdown of deferred tax assets:
- Incentive payments to Personal Financial Adviser Networks 55,373 23,887
- Provisions for future charges 35,459 32,317
- Financial assets available for sale (*) 29,199 43,675
- Losses carried forward (**) 23,592 35,270
- Other 5,610 6,394
Total 149,233 141,543
(*) As a cautious measure, the tax credits accrued from 31.12.2007 regarding the losses on subsidiary Euro-Trèsorerie’s available-for-sale assets were not recognised.(**) The losses carried forward regard the tax benefit of the losses accrued by the Group’s French subsidiaries up to 31 December 2009.
14.2 Deferred tax liabilities: analysis
31.12.2009 31.12.2008
Breakdown of deferred tax liabilities:
- Financial assets available for sale 24,037 2,293
- Other 5,968 5,813
Total 30,005 8,106

Consol idated F inancia l Statements Notes 129
14.4 Change in deferred tax liabilities (balancing entry in income statement)
31.12.2009 31.12.2008
1. Opening balance 5,535 5,693
2. Increases 3,762 4,431
2.1 Deferred tax liabilities recognised in the year 3,761 3,135
a) from prior years 7 -
b) due to changes in accounting policies - -
c) other 3,754 3,135
2.2 New taxes or increases in tax rates - -
2.3 Other increases 1 1,296
3. Decreases 3,600 4,589
3.1 Deferred tax liabilities reversed in the year 740 463
a) rebates 667 456
b) due to changes in accounting policies - -
c) other 73 7
3.2 Reductions in tax rates - -
3.3 Other decreases 2,860 4,126
4. Closing balance 5,697 5,535
14.5 Change in deferred tax assets (balancing entry in shareholders’ equity)
31.12.2009 31.12.2008
1. Opening balance 43,764 13,013
2. Increases 7,538 33,575
2.1 Deferred tax liabilities recognised in the year 7,246 31,755
a) from prior years - 2,222
b) due to changes in accounting policies - -
c) other 7,246 29,533
2.2 New taxes or increases in tax rates - -
2.3 Other increases 292 1,820
3. Decreases 21,477 2,824
3.1 Deferred tax liabilities reversed in the year 21,388 323
a) rebates 2,606 323
b) write-downs for uncollectibility - -
c) due to changes in accounting policies - -
d) other 18,782 -
3.2 Reductions in tax rates - -
3.3 Other decreases 89 2,501
4. Closing balance (*) 29,825 43,764
(*) Principally deferred tax assets regarding losses on available-for-sale debt securities.
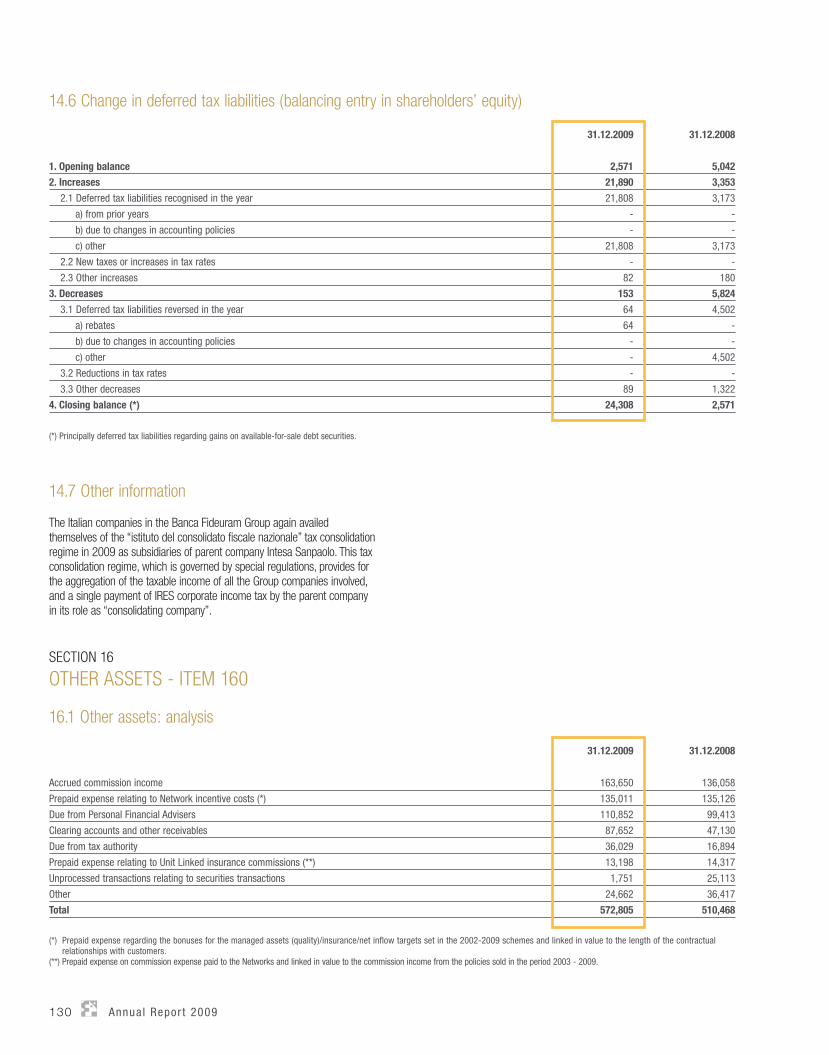
130 Annua l Repor t 2009
14.6 Change in deferred tax liabilities (balancing entry in shareholders’ equity)
31.12.2009 31.12.2008
1. Opening balance 2,571 5,042
2. Increases 21,890 3,353
2.1 Deferred tax liabilities recognised in the year 21,808 3,173
a) from prior years - -
b) due to changes in accounting policies - -
c) other 21,808 3,173
2.2 New taxes or increases in tax rates - -
2.3 Other increases 82 180
3. Decreases 153 5,824
3.1 Deferred tax liabilities reversed in the year 64 4,502
a) rebates 64 -
b) due to changes in accounting policies - -
c) other - 4,502
3.2 Reductions in tax rates - -
3.3 Other decreases 89 1,322
4. Closing balance (*) 24,308 2,571
(*) Principally deferred tax liabilities regarding gains on available-for-sale debt securities.
SECTION 16
OTHER ASSETS - ITEM 160
16.1 Other assets: analysis
31.12.2009 31.12.2008
Accrued commission income 163,650 136,058
Prepaid expense relating to Network incentive costs (*) 135,011 135,126
Due from Personal Financial Advisers 110,852 99,413
Clearing accounts and other receivables 87,652 47,130
Due from tax authority 36,029 16,894
Prepaid expense relating to Unit Linked insurance commissions (**) 13,198 14,317
Unprocessed transactions relating to securities transactions 1,751 25,113
Other 24,662 36,417
Total 572,805 510,468
(*) Prepaid expense regarding the bonuses for the managed assets (quality)/insurance/net inflow targets set in the 2002-2009 schemes and linked in value to the length of the contractual relationships with customers.
(**) Prepaid expense on commission expense paid to the Networks and linked in value to the commission income from the policies sold in the period 2003 - 2009.
14.7 Other information
The Italian companies in the Banca Fideuram Group again availed themselves of the “istituto del consolidato fiscale nazionale” tax consolidation regime in 2009 as subsidiaries of parent company Intesa Sanpaolo. This tax consolidation regime, which is governed by special regulations, provides for the aggregation of the taxable income of all the Group companies involved, and a single payment of IRES corporate income tax by the parent company in its role as “consolidating company”.
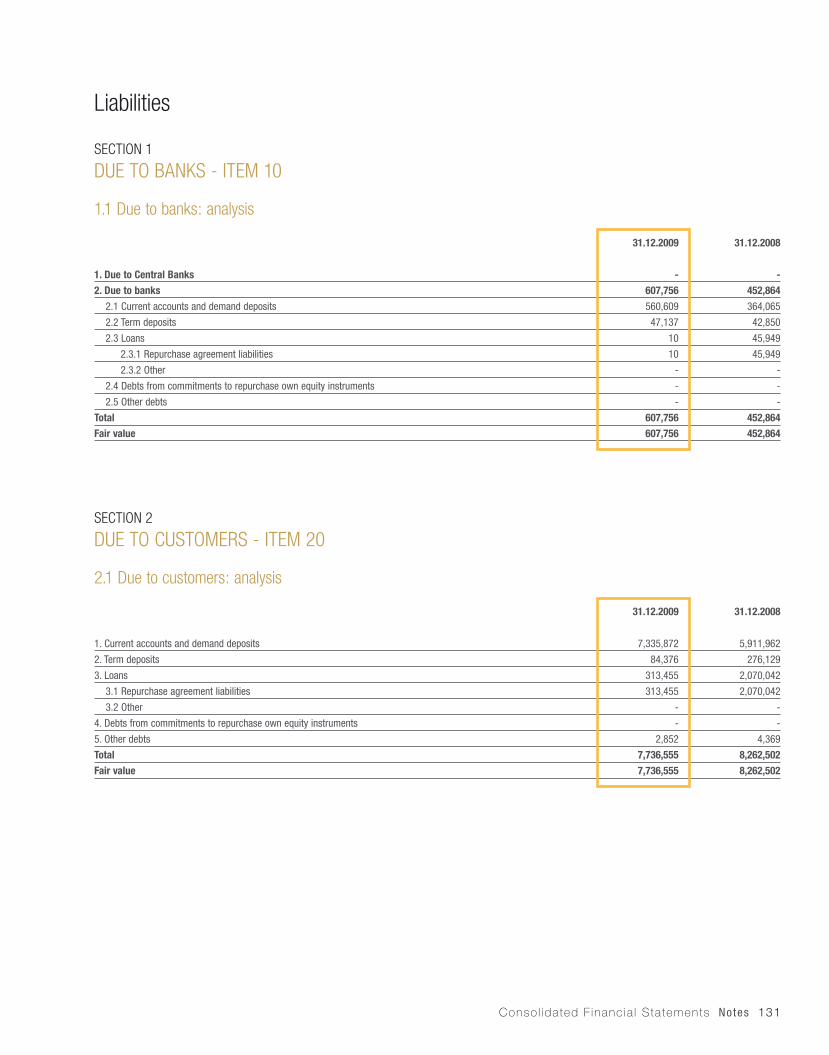
Consol idated F inancia l Statements Notes 131
Liabilities
SECTION 2
DUE TO CUSTOMERS - ITEM 20
2.1 Due to customers: analysis
31.12.2009 31.12.2008
1. Current accounts and demand deposits 7,335,872 5,911,962
2. Term deposits 84,376 276,129
3. Loans 313,455 2,070,042
3.1 Repurchase agreement liabilities 313,455 2,070,042
3.2 Other - -
4. Debts from commitments to repurchase own equity instruments - -
5. Other debts 2,852 4,369
Total 7,736,555 8,262,502
Fair value 7,736,555 8,262,502
SECTION 1
DUE TO BANKS - ITEM 10
1.1 Due to banks: analysis
31.12.2009 31.12.2008
1. Due to Central Banks - -
2. Due to banks 607,756 452,864
2.1 Current accounts and demand deposits 560,609 364,065
2.2 Term deposits 47,137 42,850
2.3 Loans 10 45,949
2.3.1 Repurchase agreement liabilities 10 45,949
2.3.2 Other - -
2.4 Debts from commitments to repurchase own equity instruments - -
2.5 Other debts - -
Total 607,756 452,864
Fair value 607,756 452,864
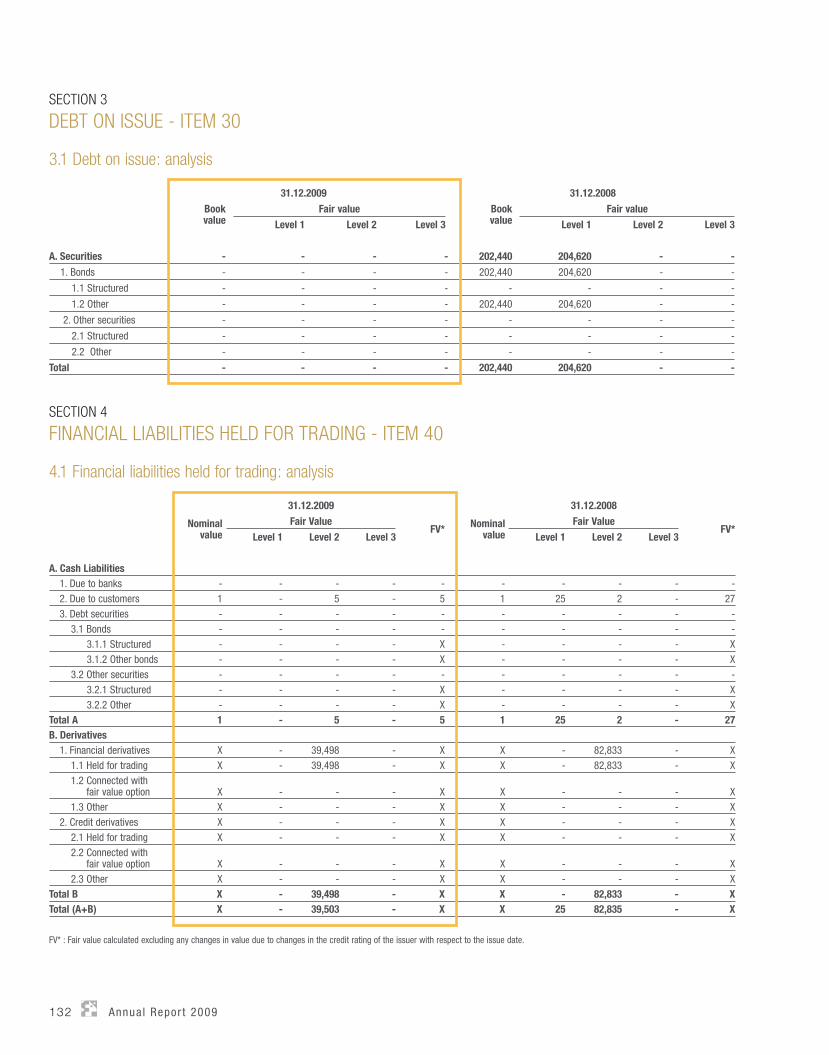
132 Annua l Repor t 2009
SECTION 3
DEBT ON ISSUE - ITEM 30
3.1 Debt on issue: analysis
31.12.2009 31.12.2008
Bookvalue
Fair value Bookvalue
Fair value
Level 1 Level 2 Level 3 Level 1 Level 2 Level 3
A. Securities - - - - 202,440 204,620 - -
1. Bonds - - - - 202,440 204,620 - -
1.1 Structured - - - - - - - -
1.2 Other - - - - 202,440 204,620 - -
2. Other securities - - - - - - - -
2.1 Structured - - - - - - - -
2.2 Other - - - - - - - -
Total - - - - 202,440 204,620 - -
SECTION 4
FINANCIAL LIABILITIES HELD FOR TRADING - ITEM 40
4.1 Financial liabilities held for trading: analysis
31.12.2009 31.12.2008
Nominal value
Fair Value FV* Nominal
valueFair Value
FV* Level 1 Level 2 Level 3 Level 1 Level 2 Level 3
A. Cash Liabilities 1. Due to banks - - - - - - - - - - 2. Due to customers 1 - 5 - 5 1 25 2 - 27 3. Debt securities - - - - - - - - - - 3.1 Bonds - - - - - - - - - - 3.1.1 Structured - - - - X - - - - X 3.1.2 Other bonds - - - - X - - - - X 3.2 Other securities - - - - - - - - - - 3.2.1 Structured - - - - X - - - - X 3.2.2 Other - - - - X - - - - XTotal A 1 - 5 - 5 1 25 2 - 27B. Derivatives 1. Financial derivatives X - 39,498 - X X - 82,833 - X 1.1 Held for trading X - 39,498 - X X - 82,833 - X 1.2 Connected with
fair value option X - - - X X - - - X 1.3 Other X - - - X X - - - X 2. Credit derivatives X - - - X X - - - X 2.1 Held for trading X - - - X X - - - X 2.2 Connected with
fair value option X - - - X X - - - X 2.3 Other X - - - X X - - - XTotal B X - 39,498 - X X - 82,833 - XTotal (A+B) X - 39,503 - X X 25 82,835 - X
FV* : Fair value calculated excluding any changes in value due to changes in the credit rating of the issuer with respect to the issue date.
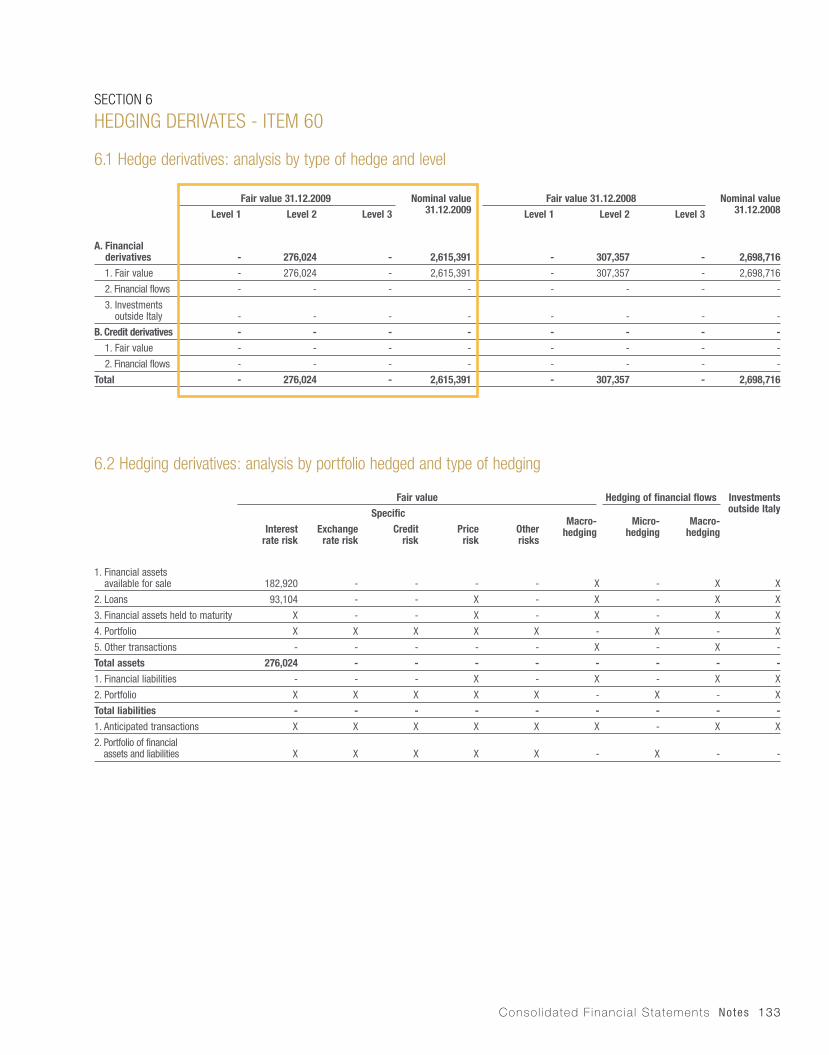
Consol idated F inancia l Statements Notes 133
SECTION 6
HEDGING DERIVATES - ITEM 60
6.1 Hedge derivatives: analysis by type of hedge and level
Fair value 31.12.2009 Nominal value 31.12.2009
Fair value 31.12.2008 Nominal value 31.12.2008Level 1 Level 2 Level 3 Level 1 Level 2 Level 3
A. Financial derivatives - 276,024 - 2,615,391 - 307,357 - 2,698,716
1. Fair value - 276,024 - 2,615,391 - 307,357 - 2,698,716
2. Financial flows - - - - - - - -
3. Investments outside Italy - - - - - - - -
B. Credit derivatives - - - - - - - -
1. Fair value - - - - - - - -
2. Financial flows - - - - - - - -
Total - 276,024 - 2,615,391 - 307,357 - 2,698,716
6.2 Hedging derivatives: analysis by portfolio hedged and type of hedging
Fair value Hedging of financial flows Investments outside ItalySpecific
Macro-hedging
Micro-hedging
Macro-hedgingInterest
rate riskExchange
rate riskCredit
riskPrice
riskOtherrisks
1. Financial assetsavailable for sale 182,920 - - - - X - X X
2. Loans 93,104 - - X - X - X X
3. Financial assets held to maturity X - - X - X - X X
4. Portfolio X X X X X - X - X
5. Other transactions - - - - - X - X -
Total assets 276,024 - - - - - - - -
1. Financial liabilities - - - X - X - X X
2. Portfolio X X X X X - X - X
Total liabilities - - - - - - - - -
1. Anticipated transactions X X X X X X - X X
2. Portfolio of financial assets and liabilities X X X X X - X - -
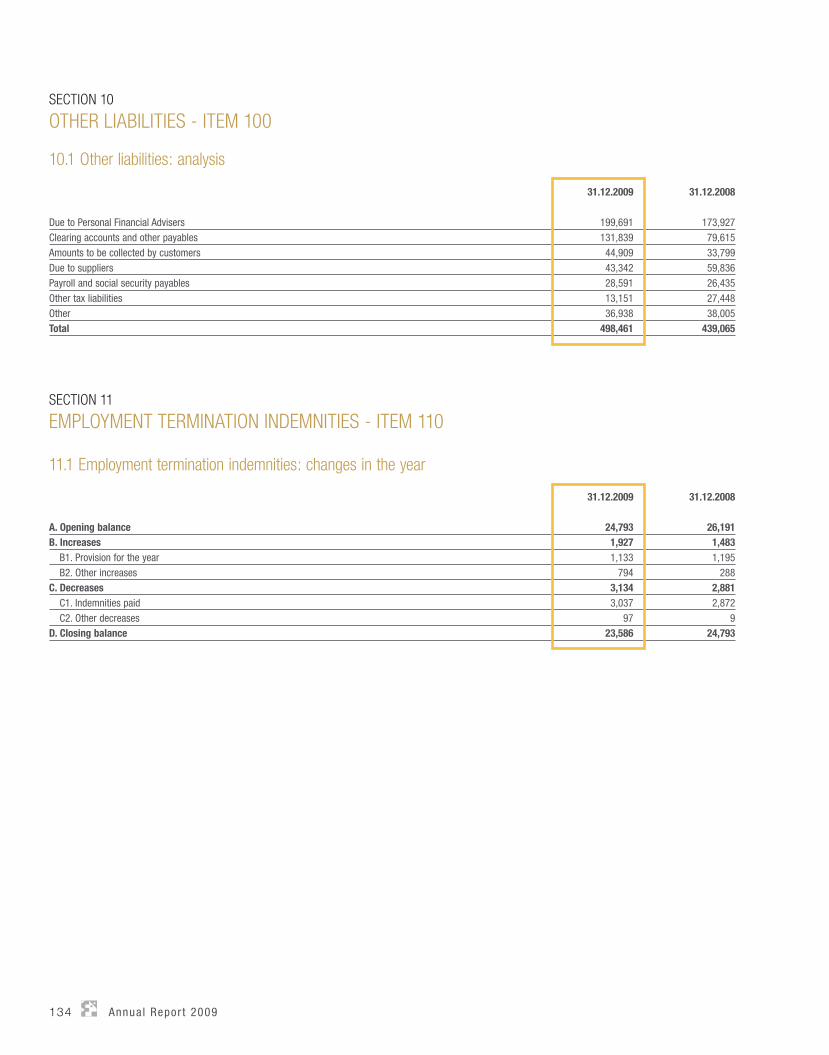
134 Annua l Repor t 2009
SECTION 10
OTHER LIABILITIES - ITEM 100
10.1 Other liabilities: analysis
31.12.2009 31.12.2008
Due to Personal Financial Advisers 199,691 173,927 Clearing accounts and other payables 131,839 79,615 Amounts to be collected by customers 44,909 33,799 Due to suppliers 43,342 59,836 Payroll and social security payables 28,591 26,435 Other tax liabilities 13,151 27,448 Other 36,938 38,005 Total 498,461 439,065
SECTION 11
EMPLOYMENT TERMINATION INDEMNITIES - ITEM 110
11.1 Employment termination indemnities: changes in the year
31.12.2009 31.12.2008
A. Opening balance 24,793 26,191B. Increases 1,927 1,483 B1. Provision for the year 1,133 1,195 B2. Other increases 794 288C. Decreases 3,134 2,881 C1. Indemnities paid 3,037 2,872 C2. Other decreases 97 9D. Closing balance 23,586 24,793

Consol idated F inancia l Statements Notes 135
SECTION 12
PROVISIONS FOR RISKS AND CHARGES - ITEM 120
12.1 Provisions for risks and charges: analysis
31.12.2009 31.12.2008
1. Company pension funds - -2. Other provisions for risks and charges 310,527 248,941 2.1 Litigation 91,071 86,651 2.2 Provision for restructuring plan and other 15,633 21,514 2.3 Personal Financial Advisers’ termination indemnities and incentives 56,376 51,217 2.4 Network Loyalty Schemes 128,816 89,559 2.5 Other provisions 18,631 - Total 310,527 248,941
2.1 The provisions for litigation comprise the provisions set aside to cover potential losses on litigation, including claims from receivers and the provisions connected with the Group policy regarding corporate securities in default.
2.2 The provision for restructuring plan and other comprise early retirement incentives and the provisions set aside to pay seniority bonuses to employees.
2.3 The Provision for Personal Financial Advisers’ termination indemnities and incentives were calculated using actuarial valuations that take the indemnities actually accrued into account, together with the composition of the Network and the indemnities paid to those Personal Financial Advisers that had left the Group in the previous 5 financial years. The Provision also included the incentive compensation payable upon the achievement of performance targets set aside under the “New Collective Economic Agreement for Agents in the Commerce Sector” of 26 February 2002.
2.4 The Provisions for the Network Loyalty Schemes represent the best estimate of the amount required to discharge the obligation at the accounting reference date, calculated using actuarial valuations.
2.5 The item other provisions principally consisted of a €17,275 thousand provision for the estimated expense that the Group could be required to incur to settle a dispute with the Italian Inland Revenue regarding the tax deduction of the Banca Fideuram Personal Financial Adviser Network Loyalty Schemes.
12.2 Provisions for risks and charges: changes in the year
Total
Pension funds Other provisions
A. Opening balance - 248,941
B. Increases - 91,905
B1. Provisions for the year - 82,437
B2. Changes due to the passage of time - 4,345
B3. Changes due to changes in the discount rate - 104
B4. Other increases - 5,019
C. Decreases - 30,319
C1. Utilisation in the year - 17,530
C2. Changes due to changes in the discount rate - -
C3. Other decreases - 12,789
D. Closing balance - 310,527
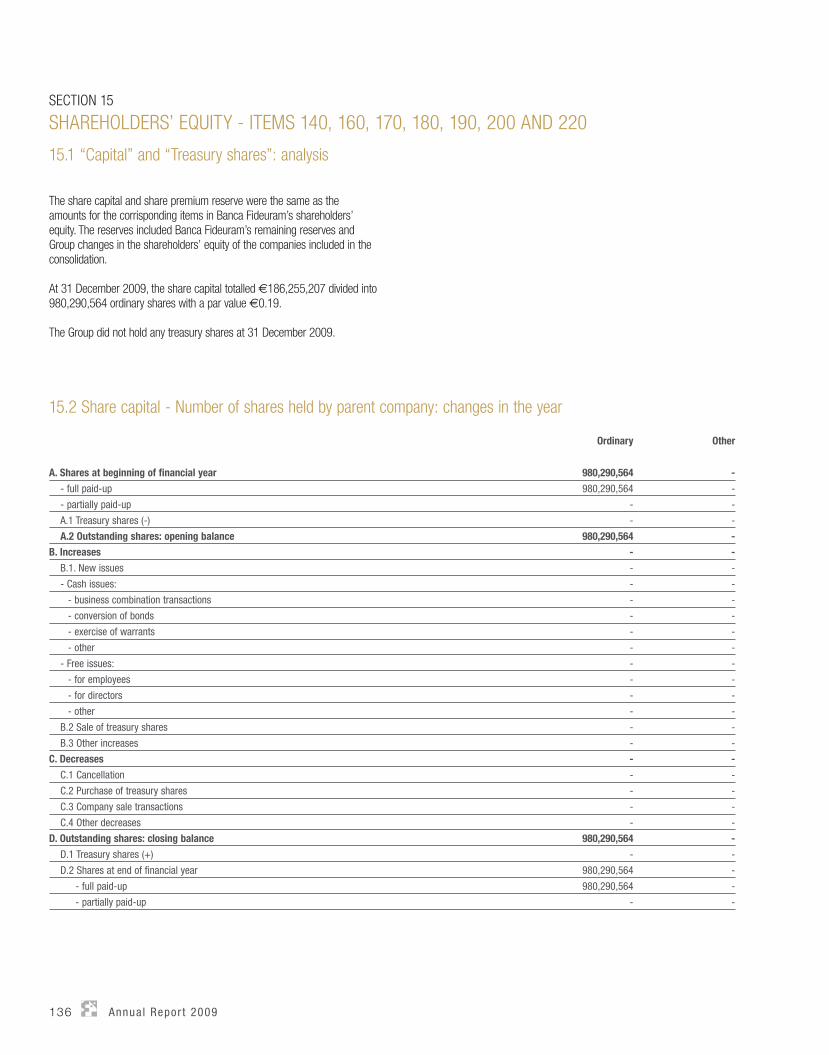
136 Annua l Repor t 2009
SECTION 15
SHAREHOLDERS’ EQUITY - ITEMS 140, 160, 170, 180, 190, 200 AND 220
15.1 “Capital” and “Treasury shares”: analysis
The share capital and share premium reserve were the same as the amounts for the corrisponding items in Banca Fideuram’s shareholders’ equity. The reserves included Banca Fideuram’s remaining reserves and Group changes in the shareholders’ equity of the companies included in the consolidation.
At 31 December 2009, the share capital totalled €186,255,207 divided into 980,290,564 ordinary shares with a par value €0.19.
The Group did not hold any treasury shares at 31 December 2009.
15.2 Share capital - Number of shares held by parent company: changes in the year
Ordinary Other
A. Shares at beginning of financial year 980,290,564 -
- full paid-up 980,290,564 -
- partially paid-up - -
A.1 Treasury shares (-) - -
A.2 Outstanding shares: opening balance 980,290,564 -
B. Increases - -
B.1. New issues - -
- Cash issues: - -
- business combination transactions - -
- conversion of bonds - -
- exercise of warrants - -
- other - -
- Free issues: - -
- for employees - -
- for directors - -
- other - -
B.2 Sale of treasury shares - -
B.3 Other increases - -
C. Decreases - -
C.1 Cancellation - -
C.2 Purchase of treasury shares - -
C.3 Company sale transactions - -
C.4 Other decreases - -
D. Outstanding shares: closing balance 980,290,564 -
D.1 Treasury shares (+) - -
D.2 Shares at end of financial year 980,290,564 -
- full paid-up 980,290,564 -
- partially paid-up - -

Consol idated F inancia l Statements Notes 137
OTHER INFORMATION
1. Guarantees and commitments
31.12.2009 31.12.2008
1. Financial guarantees 86,691 78,769
a) Banks (*) 13,287 14,070
b) Customers 73,404 64,699
2. Commercial guarantees 5,957 8,870
a) Banks - -
b) Customers 5,957 8,870
3. Commitments to grant finance 7,502 18,090
a) Banks 6,023 17,607
i) certain to be called on 6,023 17,607
ii) not certain to be called on - -
b) Customers 1,479 483
i) certain to be called on 1,240 418
ii) not certain to be called on 239 65
4. Commitments underlying credit derivatives: protection sales - -
5. Assets pledged as security for third-party liabilities - -
6. Other commitments 384 314
Total 100,534 106,043
(*) As of 31.12.2009, the commitments to the Italian deposit guarantee systems are recognised under financial guarantees to banks. As of 31.12.2008 a total of €11,968 thousand were consequently reclassified under Commitments to grant finance (not certain to be called on) to ensure consistency of presentation.
2. Assets pledged as security for own liabilities and commitments
31.12.2009 31.12.2008
1. Financial assets held for trading - -
2. Financial assets designated at fair value - -
3. Financial assets available for sale 68,979 203,426
4. Financial assets held to maturity - 98,707
5. Due from banks 266,232 1,396,702
6. Loans to customers 4,450 151,447
7. Property and equipment - -

138 Annua l Repor t 2009
5. Administration and trading on behalf of third parties
31.12.2009
1. Execution of customer instructions 1,257,835
a) Purchases 539,186
1. Settled 538,168
2. Not settled 1,018
b) Sales 718,649
1. Settled 712,935
2. Not settled 5,714
2. Portfolio management 237,561
a) Individual 237,561
b) Collective -
3. Custody and administration of securities
a) Third-party securities held on deposit: connected with activities as depositary bank (excluding portfolio management) 53,365,696
1. Securities issued by companies included in the consolidation -
2. Other securities 53,365,696
b) Third-party securities held on deposit (excluding portfolio management): other 36,915,097
1. Securities issued by companies included in the consolidation -
2. Other securities 36,915,097
c) Third-party securities deposited with third parties 22,197,993
d) Portfolio securities deposited with third parties 6,011,037
4. Other transactions 13,403,388

Consol idated F inancia l Statements Notes 139
PART C
NOTES TO THE CONSOLIDATED INCOME STATEMENT
SECTION 1
INTEREST - ITEMS 10 AND 20
1.1 Interest income and similar income: analysis2009 2008
Debtsecurities
Loans Other transactions
Total Total
1. Financial assets held for trading 582 - - 582 785
2. Financial assets designated at fair value 24 - - 24 49
3. Financial assets available for sale 96,028 - - 96,028 154,209
4. Financial assets held to maturity 9,642 - - 9,642 27,943
5. Due from banks 57,113 46,834 - 103,947 222,657
6. Loans to customers 37,030 24,903 - 61,933 73,053
7. Hedging derivatives X X - - 5,164
8. Other assets X X 410 410 485
Total 200,419 71,737 410 272,566 484,345
1.2 Interest income and similar income: hedging gains and losses
2009 2008
A. Hedging gains - 124,934
B. Hedging losses - 119,770
C. Net gains / losses (A-B) - 5,164
1.3 Interest income and similar income: other information
1.3.1 Interest income on financial assets denominated in foreign currencies
2009 2008
On financial assets denominated in foreign currencies 7,246 18,778
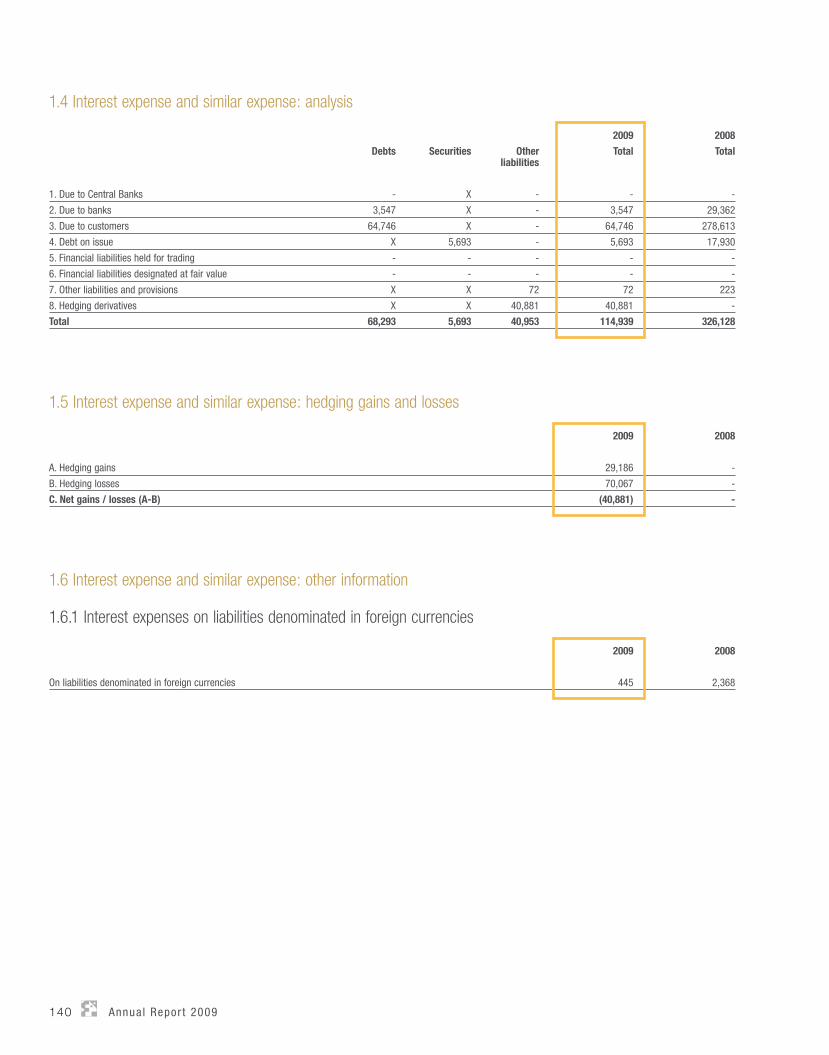
140 Annua l Repor t 2009
1.4 Interest expense and similar expense: analysis
2009 2008
Debts Securities Otherliabilities
Total Total
1. Due to Central Banks - X - - -
2. Due to banks 3,547 X - 3,547 29,362
3. Due to customers 64,746 X - 64,746 278,613
4. Debt on issue X 5,693 - 5,693 17,930
5. Financial liabilities held for trading - - - - -
6. Financial liabilities designated at fair value - - - - -
7. Other liabilities and provisions X X 72 72 223
8. Hedging derivatives X X 40,881 40,881 -
Total 68,293 5,693 40,953 114,939 326,128
1.5 Interest expense and similar expense: hedging gains and losses
2009 2008
A. Hedging gains 29,186 -
B. Hedging losses 70,067 -
C. Net gains / losses (A-B) (40,881) -
1.6 Interest expense and similar expense: other information
1.6.1 Interest expenses on liabilities denominated in foreign currencies
2009 2008
On liabilities denominated in foreign currencies 445 2,368
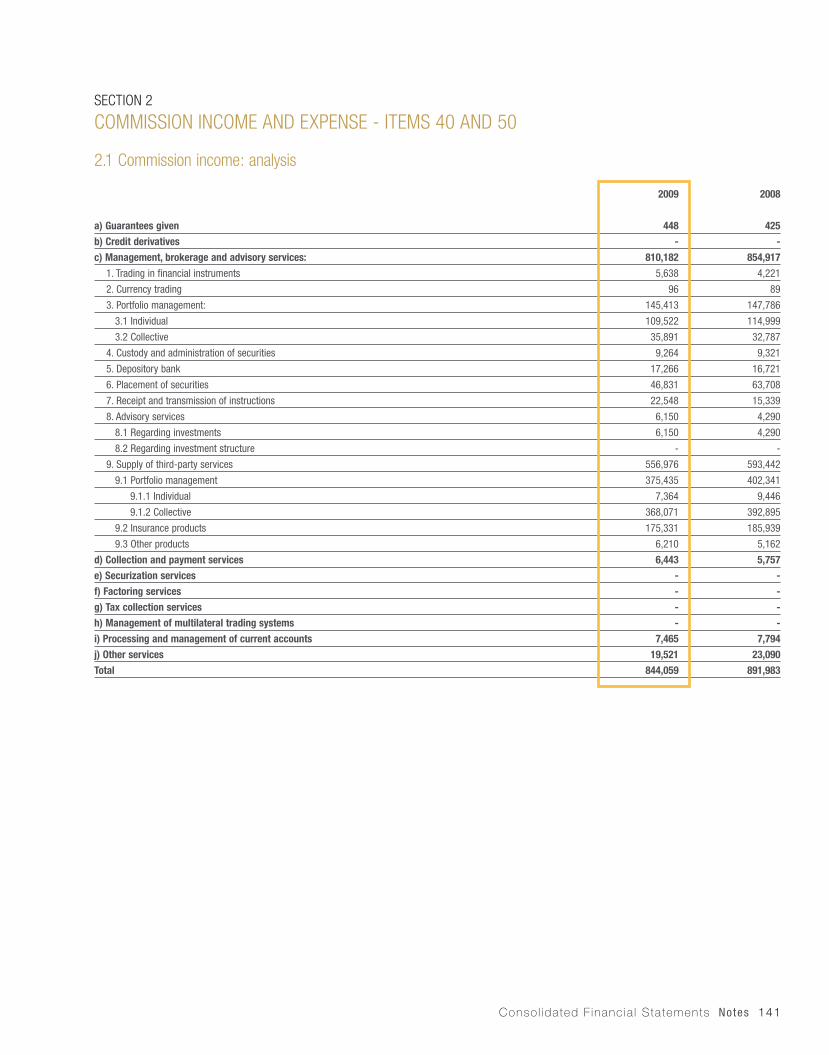
Consol idated F inancia l Statements Notes 141
SECTION 2
COMMISSION INCOME AND EXPENSE - ITEMS 40 AND 50
2.1 Commission income: analysis
2009 2008
a) Guarantees given 448 425
b) Credit derivatives - -
c) Management, brokerage and advisory services: 810,182 854,917
1. Trading in financial instruments 5,638 4,221
2. Currency trading 96 89
3. Portfolio management: 145,413 147,786
3.1 Individual 109,522 114,999
3.2 Collective 35,891 32,787
4. Custody and administration of securities 9,264 9,321
5. Depository bank 17,266 16,721
6. Placement of securities 46,831 63,708
7. Receipt and transmission of instructions 22,548 15,339
8. Advisory services 6,150 4,290
8.1 Regarding investments 6,150 4,290
8.2 Regarding investment structure - -
9. Supply of third-party services 556,976 593,442
9.1 Portfolio management 375,435 402,341
9.1.1 Individual 7,364 9,446
9.1.2 Collective 368,071 392,895
9.2 Insurance products 175,331 185,939
9.3 Other products 6,210 5,162
d) Collection and payment services 6,443 5,757
e) Securization services - -
f) Factoring services - -
g) Tax collection services - -
h) Management of multilateral trading systems - -
i) Processing and management of current accounts 7,465 7,794
j) Other services 19,521 23,090
Total 844,059 891,983
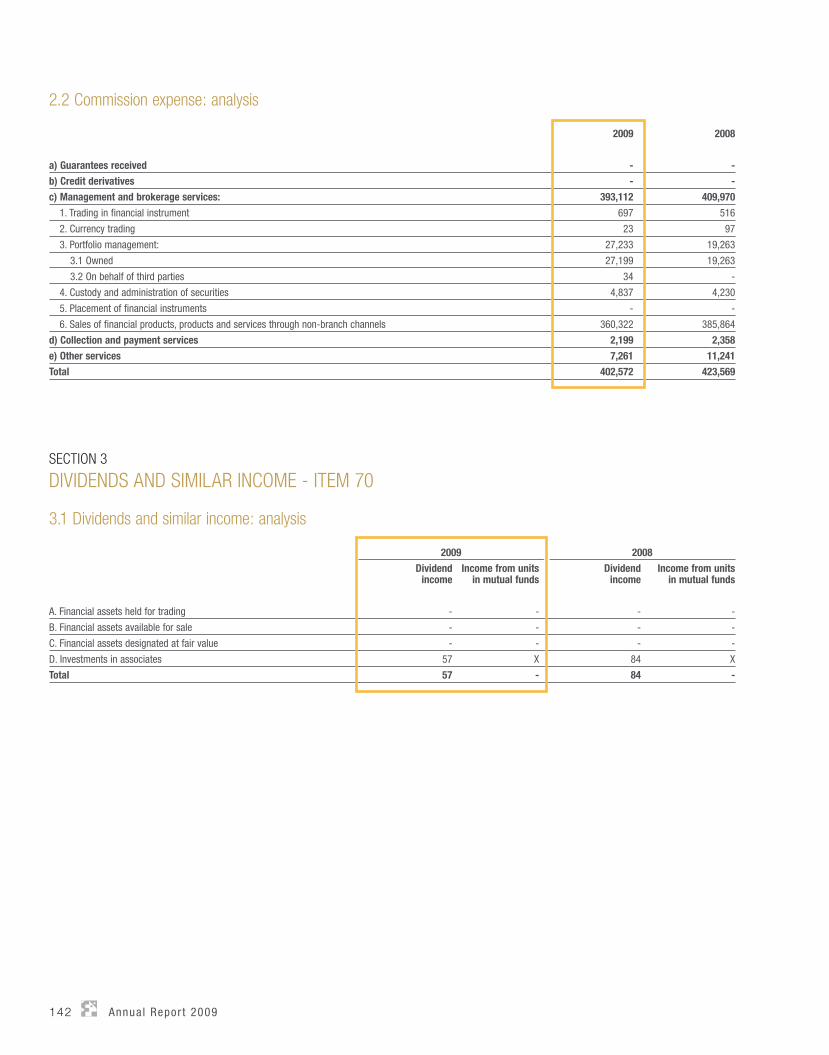
142 Annua l Repor t 2009
2.2 Commission expense: analysis
2009 2008
a) Guarantees received - -
b) Credit derivatives - -
c) Management and brokerage services: 393,112 409,970
1. Trading in financial instrument 697 516
2. Currency trading 23 97
3. Portfolio management: 27,233 19,263
3.1 Owned 27,199 19,263
3.2 On behalf of third parties 34 -
4. Custody and administration of securities 4,837 4,230
5. Placement of financial instruments - -
6. Sales of financial products, products and services through non-branch channels 360,322 385,864
d) Collection and payment services 2,199 2,358
e) Other services 7,261 11,241
Total 402,572 423,569
SECTION 3
DIVIDENDS AND SIMILAR INCOME - ITEM 70
3.1 Dividends and similar income: analysis
2009 2008
Dividendincome
Income from units in mutual funds
Dividendincome
Income from unitsin mutual funds
A. Financial assets held for trading - - - -
B. Financial assets available for sale - - - -
C. Financial assets designated at fair value - - - -
D. Investments in associates 57 X 84 X
Total 57 - 84 -
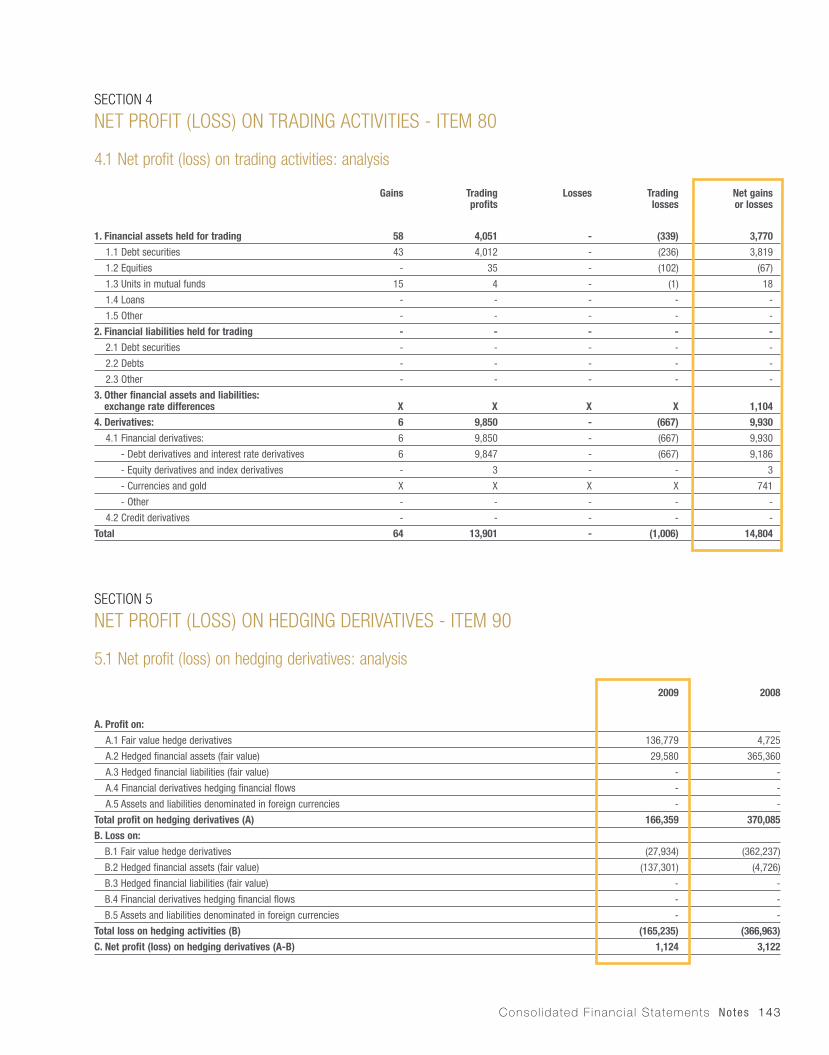
Consol idated F inancia l Statements Notes 143
SECTION 4
NET PROFIT (LOSS) ON TRADING ACTIVITIES - ITEM 80
4.1 Net profit (loss) on trading activities: analysis
Gains Tradingprofits
Losses Tradinglosses
Net gainsor losses
1. Financial assets held for trading 58 4,051 - (339) 3,770
1.1 Debt securities 43 4,012 - (236) 3,819
1.2 Equities - 35 - (102) (67)
1.3 Units in mutual funds 15 4 - (1) 18
1.4 Loans - - - - -
1.5 Other - - - - -
2. Financial liabilities held for trading - - - - -
2.1 Debt securities - - - - -
2.2 Debts - - - - -
2.3 Other - - - - -
3. Other financial assets and liabilities:exchange rate differences X X X X 1,104
4. Derivatives: 6 9,850 - (667) 9,930
4.1 Financial derivatives: 6 9,850 - (667) 9,930
- Debt derivatives and interest rate derivatives 6 9,847 - (667) 9,186
- Equity derivatives and index derivatives - 3 - - 3
- Currencies and gold X X X X 741
- Other - - - - -
4.2 Credit derivatives - - - - -
Total 64 13,901 - (1,006) 14,804
SECTION 5
NET PROFIT (LOSS) ON HEDGING DERIVATIVES - ITEM 90
5.1 Net profit (loss) on hedging derivatives: analysis
2009 2008
A. Profit on:
A.1 Fair value hedge derivatives 136,779 4,725
A.2 Hedged financial assets (fair value) 29,580 365,360
A.3 Hedged financial liabilities (fair value) - -
A.4 Financial derivatives hedging financial flows - -
A.5 Assets and liabilities denominated in foreign currencies - -
Total profit on hedging derivatives (A) 166,359 370,085
B. Loss on:
B.1 Fair value hedge derivatives (27,934) (362,237)
B.2 Hedged financial assets (fair value) (137,301) (4,726)
B.3 Hedged financial liabilities (fair value) - -
B.4 Financial derivatives hedging financial flows - -
B.5 Assets and liabilities denominated in foreign currencies - -
Total loss on hedging activities (B) (165,235) (366,963)
C. Net profit (loss) on hedging derivatives (A-B) 1,124 3,122
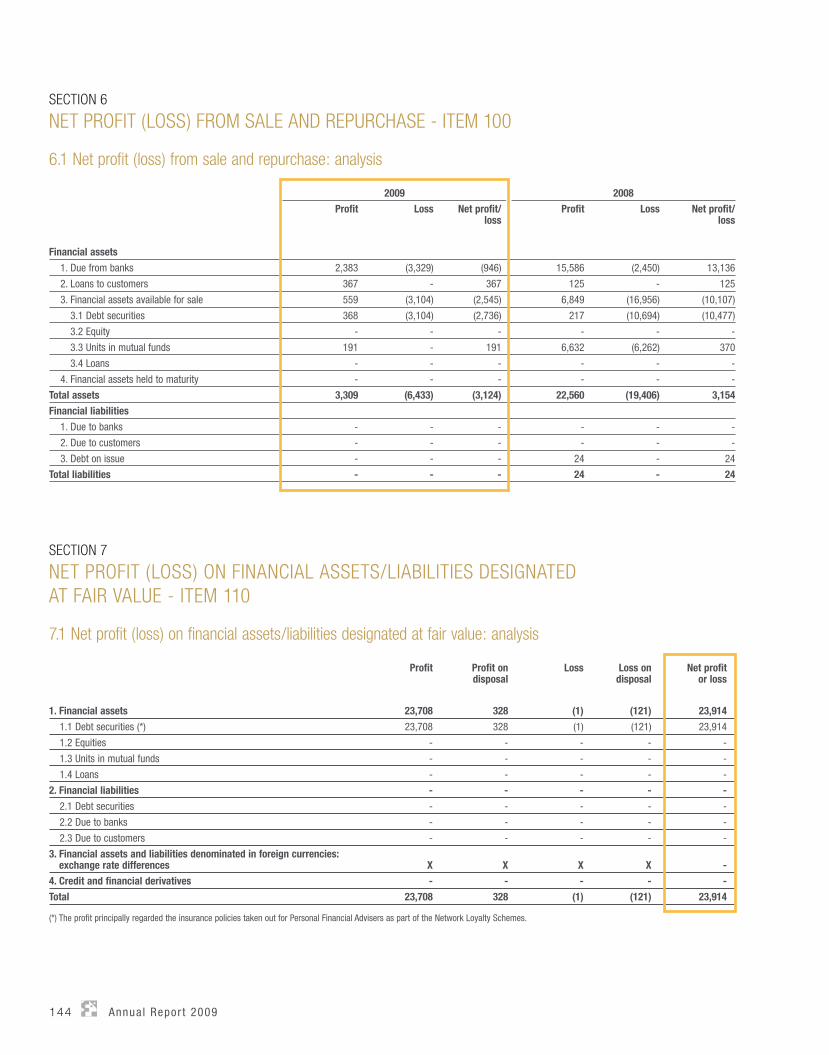
144 Annua l Repor t 2009
SECTION 6
NET PROFIT (LOSS) FROM SALE AND REPURCHASE - ITEM 100
6.1 Net profit (loss) from sale and repurchase: analysis
2009 2008
Profit Loss Net profit/ loss
Profit Loss Net profit/ loss
Financial assets
1. Due from banks 2,383 (3,329) (946) 15,586 (2,450) 13,136
2. Loans to customers 367 - 367 125 - 125
3. Financial assets available for sale 559 (3,104) (2,545) 6,849 (16,956) (10,107)
3.1 Debt securities 368 (3,104) (2,736) 217 (10,694) (10,477)
3.2 Equity - - - - - -
3.3 Units in mutual funds 191 - 191 6,632 (6,262) 370
3.4 Loans - - - - - -
4. Financial assets held to maturity - - - - - -
Total assets 3,309 (6,433) (3,124) 22,560 (19,406) 3,154
Financial liabilities
1. Due to banks - - - - - -
2. Due to customers - - - - - -
3. Debt on issue - - - 24 - 24
Total liabilities - - - 24 - 24
SECTION 7
NET PROFIT (LOSS) ON FINANCIAL ASSETS/LIABILITIES DESIGNATEDAT FAIR VALUE - ITEM 110
7.1 Net profit (loss) on financial assets/liabilities designated at fair value: analysis
Profit Profit ondisposal
Loss Loss on disposal
Net profitor loss
1. Financial assets 23,708 328 (1) (121) 23,914
1.1 Debt securities (*) 23,708 328 (1) (121) 23,914
1.2 Equities - - - - -
1.3 Units in mutual funds - - - - -
1.4 Loans - - - - -
2. Financial liabilities - - - - -
2.1 Debt securities - - - - -
2.2 Due to banks - - - - -
2.3 Due to customers - - - - -
3. Financial assets and liabilities denominated in foreign currencies: exchange rate differences X X X X -
4. Credit and financial derivatives - - - - -
Total 23,708 328 (1) (121) 23,914
(*) The profit principally regarded the insurance policies taken out for Personal Financial Advisers as part of the Network Loyalty Schemes.
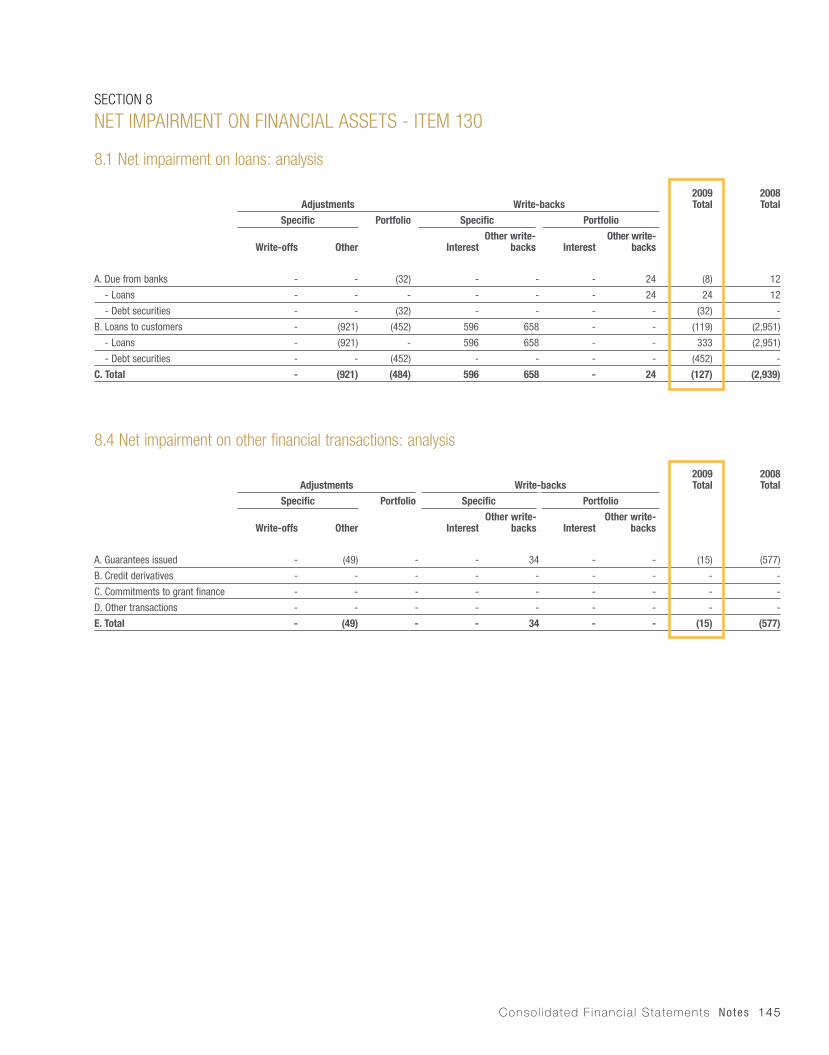
Consol idated F inancia l Statements Notes 145
SECTION 8
NET IMPAIRMENT ON FINANCIAL ASSETS - ITEM 130
8.1 Net impairment on loans: analysis
Adjustments Write-backs2009Total
2008Total
Specific Portfolio Specific Portfolio
Write-offs Other InterestOther write-
backs InterestOther write-
backs
A. Due from banks - - (32) - - - 24 (8) 12
- Loans - - - - - - 24 24 12
- Debt securities - - (32) - - - - (32) -
B. Loans to customers - (921) (452) 596 658 - - (119) (2,951)
- Loans - (921) - 596 658 - - 333 (2,951)
- Debt securities - - (452) - - - - (452) -
C. Total - (921) (484) 596 658 - 24 (127) (2,939)
8.4 Net impairment on other financial transactions: analysis
Adjustments Write-backs2009Total
2008Total
Specific Portfolio Specific Portfolio
Write-offs Other InterestOther write-
backs InterestOther write-
backs
A. Guarantees issued - (49) - - 34 - - (15) (577)
B. Credit derivatives - - - - - - - - -
C. Commitments to grant finance - - - - - - - - -
D. Other transactions - - - - - - - - -
E. Total - (49) - - 34 - - (15) (577)
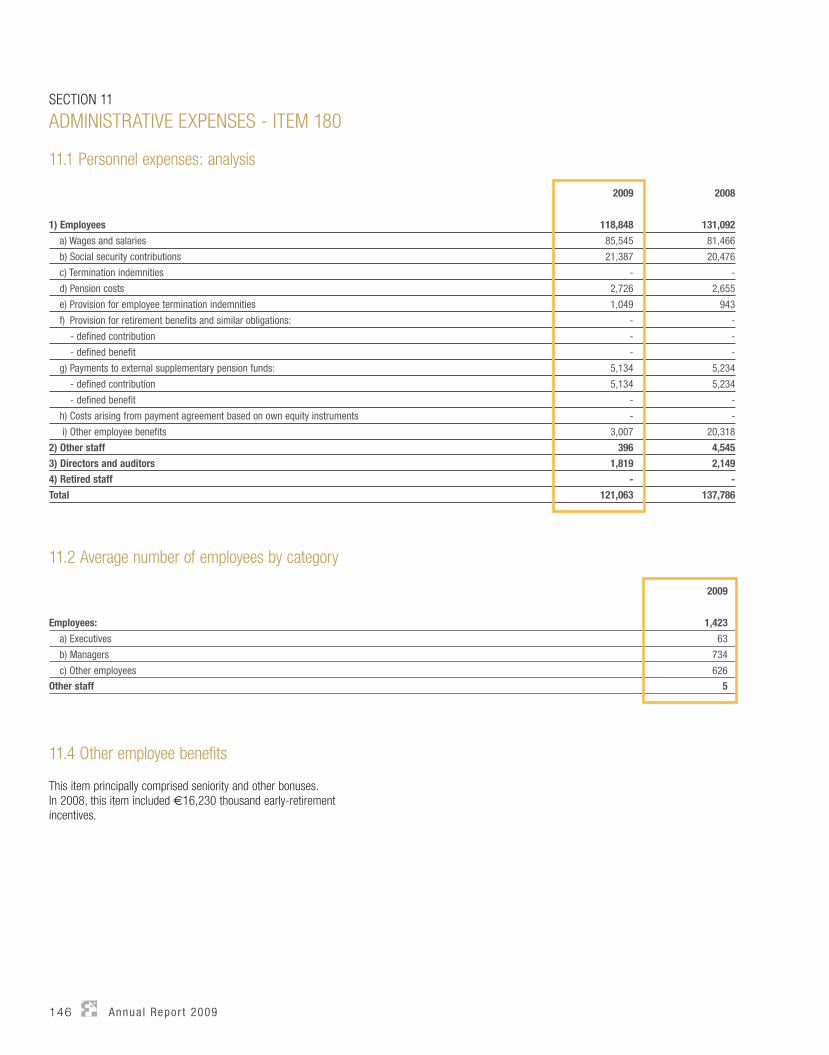
146 Annua l Repor t 2009
SECTION 11
ADMINISTRATIVE EXPENSES - ITEM 180
11.1 Personnel expenses: analysis
2009 2008
1) Employees 118,848 131,092
a) Wages and salaries 85,545 81,466
b) Social security contributions 21,387 20,476
c) Termination indemnities - -
d) Pension costs 2,726 2,655
e) Provision for employee termination indemnities 1,049 943
f) Provision for retirement benefits and similar obligations: - -
- defined contribution - -
- defined benefit - -
g) Payments to external supplementary pension funds: 5,134 5,234
- defined contribution 5,134 5,234
- defined benefit - -
h) Costs arising from payment agreement based on own equity instruments - -
i) Other employee benefits 3,007 20,318
2) Other staff 396 4,545
3) Directors and auditors 1,819 2,149
4) Retired staff - -
Total 121,063 137,786
11.2 Average number of employees by category
2009
Employees: 1,423
a) Executives 63
b) Managers 734
c) Other employees 626
Other staff 5
11.4 Other employee benefits
This item principally comprised seniority and other bonuses.In 2008, this item included €16,230 thousand early-retirement incentives.

Consol idated F inancia l Statements Notes 147
11.5 Other administrative expenses: analysis
2009 2008
IT costs 11,497 10,782
- Software maintenance and upgrades 6,214 6,097
- Maintenance and rental of electronic equipment 942 305
- Data transmission 1,178 1,326
- Rental of office equipment 1,872 581
- Telephone 1,522 2,776
- Recovery of IT costs (231) (303)
Property management costs 37,639 34,683
- Property rent 30,155 27,804
- Maintenance of rented property 663 480
- Maintenance of own property 88 163
- Security 1,117 892
- Cleaning 1,438 1,382
- Power 2,387 2,333
- Miscellaneous building costs 2,230 2,191
- Recovery of property management costs (439) (562)
General expenses 26,814 22,589
- Postage and telegraphic expenses 3,887 2,579
- Office supplies 1,851 2,159
- Transport and counting of valuables 507 610
- Couriers and transport 2,233 2,355
- Search and information services 4,708 3,812
- Other expenses 13,715 11,169
- Recovery of general expenses (87) (95)
Professional and insurance costs 13,808 19,250
- Professional fees 8,099 13,256
- Legal advice and court fees 4,990 4,363
- Bank and customer insurance premiums 757 1,661
- Recovery of professional and insurance costs (38) (30)
Promotional and advertising expenses 5,279 10,477
- Advertising and entertainment 5,956 10,914
- Recovery of promotional and advertising expenses (677) (437)
Indirect personnel expenses 5,990 7,033
- Indirect personnel expenses 6,039 7,033
- Recovery of indirect personnel expenses (49) -
Services by third parties 82,675 86,410
- Expenses for services by third parties 15,001 7,842
- Expenses for outsourcing within the Group 67,683 78,569
- Recovery of services by third parties (9) (1)
Total other administrative costs net of indirect taxes 183,702 191,224
Indirect taxes
- Stamp duty 21,085 20,387
- Substitute tax (Italian Presidential Decree. 601/73) 180 48
- Local council property tax 200 202
- Other indirect taxes 1,856 1,882
- Recovery of indirect taxes (*) (44) (247)
Total Indirect taxes 23,277 22,272
Total other administrative expenses 206,979 213,496
(*) As of the financial statements at 31.12.2009, the recovery of indirect taxes is recognised in item 220: Other income (expense).A total of €19,891 thousand regarding 31.12.2008 was consequently reclassified in this item to ensure consistency of presentation.

148 Annua l Repor t 2009
SECTION 12
NET PROVISIONS FOR RISKS AND CHARGES - ITEM 190
12.1 Net provisions for risks and charges: analysis
2009 2008
Litigation and claims from receivers 16,561 16,812
Contractual indemnities due to Personal Financial Advisers 5,730 6,586
Costs relating to the Personal Financial Adviser Networks' Loyalty Schemes (*) 41,117 5,936
Other (**) 18,461 -
Total 81,869 29,334
(*) Included €21,532 thousand gains on the insurance policies taken out under the Personal Financial Advisers Networks’ Loyalty Schemes. At 31.12.2008 this item included losses totalling €16,006 thousand.
(**) Included €17,275 thousand to cover the estimated expense that the Group could be required to incur to settle a dispute with the Italian Inland Revenue regarding the tax deductions of the Banca Fideuram Personal Financial Adviser Networks’ Loyalty Schemes.
SECTION 13
DEPRECIATION OF PROPERTY AND EQUIPMENT - ITEM 200
13.1 Depreciation of property and equipment: analysis
Depreciation Net adjustments for impairment losses
Write-backs Netadjustments
A. Property and equipment
A.1 Owned 2,532 - - 2,532
- Functional property and equipment 2,532 - - 2,532
- Investment property and equipment - - - -
A.2 Purchased under finance lease arrangements - - - -
- Functional property and equipment - - - -
- Investment property and equipment - - - -
Total 2,532 - - 2,532
SECTION 14
AMORTIZATION OF INTANGIBLE ASSETS - ITEM 210
14.1 Amortization of intangible assets: analysis
Depreciation Net adjustments for impairment losses
Write-backs Netadjustments
A. Intangible assets
A.1 Owned 15,309 - - 15,309
- Generated internally - - - -
- Other 15,309 - - 15,309
A.2 Purchased under finance lease arrangements - - - -
Total 15,309 - - 15,309
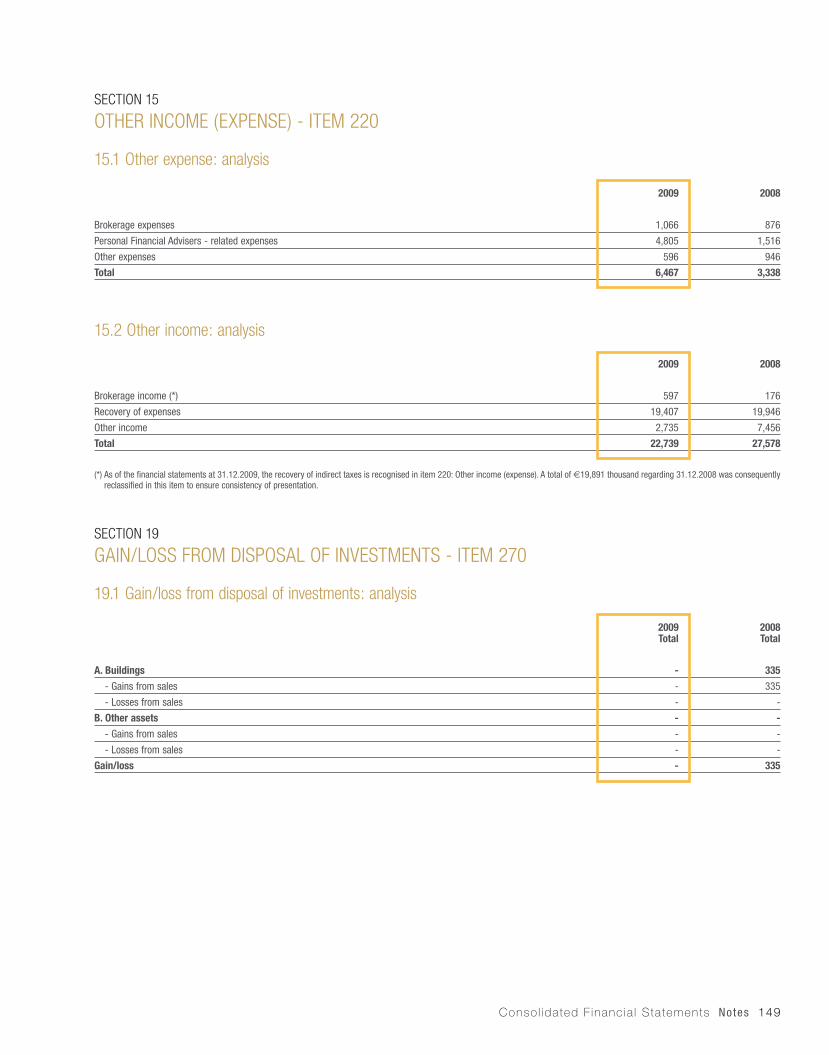
Consol idated F inancia l Statements Notes 149
SECTION 15
OTHER INCOME (EXPENSE) - ITEM 220
15.1 Other expense: analysis
2009 2008
Brokerage expenses 1,066 876
Personal Financial Advisers - related expenses 4,805 1,516
Other expenses 596 946
Total 6,467 3,338
15.2 Other income: analysis
2009 2008
Brokerage income (*) 597 176
Recovery of expenses 19,407 19,946
Other income 2,735 7,456
Total 22,739 27,578
(*) As of the financial statements at 31.12.2009, the recovery of indirect taxes is recognised in item 220: Other income (expense). A total of €19,891 thousand regarding 31.12.2008 was consequently reclassified in this item to ensure consistency of presentation.
SECTION 19
GAIN/LOSS FROM DISPOSAL OF INVESTMENTS - ITEM 270
19.1 Gain/loss from disposal of investments: analysis
2009Total
2008Total
A. Buildings - 335
- Gains from sales - 335
- Losses from sales - -
B. Other assets - -
- Gains from sales - -
- Losses from sales - -
Gain/loss - 335
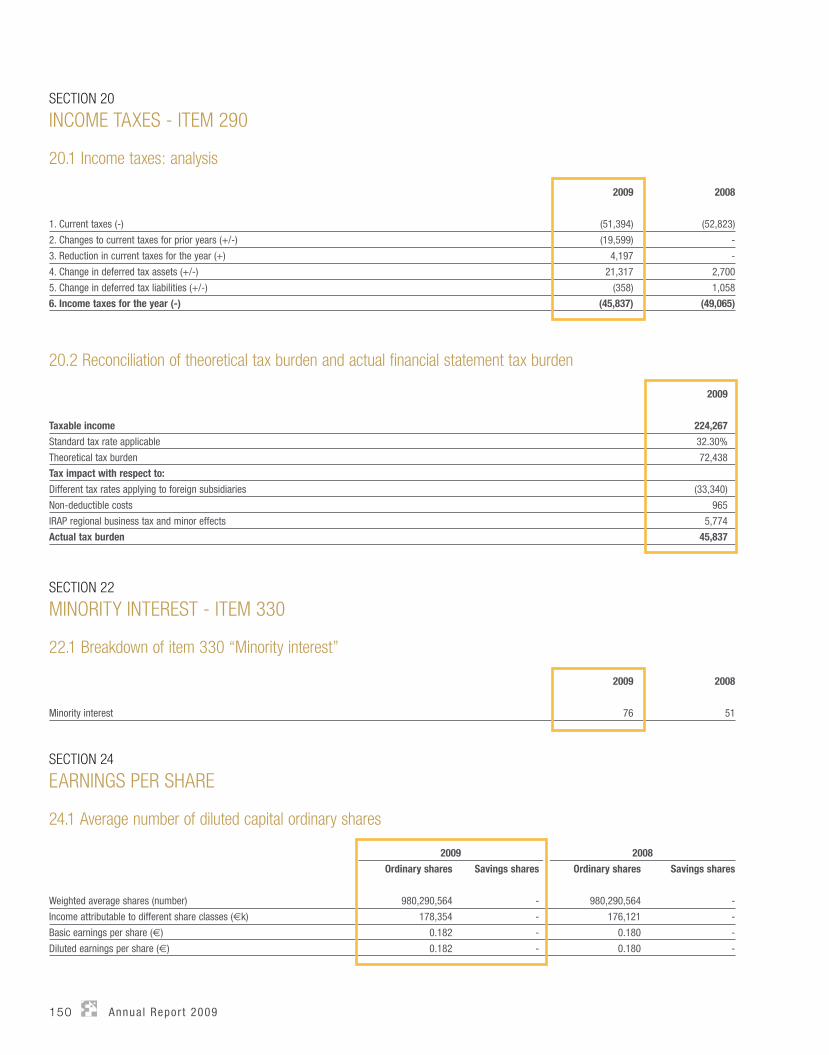
150 Annua l Repor t 2009
SECTION 20
INCOME TAXES - ITEM 290
20.1 Income taxes: analysis
2009 2008
1. Current taxes (-) (51,394) (52,823)
2. Changes to current taxes for prior years (+/-) (19,599) -
3. Reduction in current taxes for the year (+) 4,197 -
4. Change in deferred tax assets (+/-) 21,317 2,700
5. Change in deferred tax liabilities (+/-) (358) 1,058
6. Income taxes for the year (-) (45,837) (49,065)
20.2 Reconciliation of theoretical tax burden and actual financial statement tax burden
2009
Taxable income 224,267
Standard tax rate applicable 32.30%
Theoretical tax burden 72,438
Tax impact with respect to:
Different tax rates applying to foreign subsidiaries (33,340)
Non-deductible costs 965
IRAP regional business tax and minor effects 5,774
Actual tax burden 45,837
SECTION 22
MINORITY INTEREST - ITEM 330
22.1 Breakdown of item 330 “Minority interest”
2009 2008
Minority interest 76 51
SECTION 24
EARNINGS PER SHARE
24.1 Average number of diluted capital ordinary shares
2009 2008
Ordinary shares Savings shares Ordinary shares Savings shares
Weighted average shares (number) 980,290,564 - 980,290,564 -
Income attributable to different share classes (€k) 178,354 - 176,121 -
Basic earnings per share (€) 0.182 - 0.180 -
Diluted earnings per share (€) 0.182 - 0.180 -
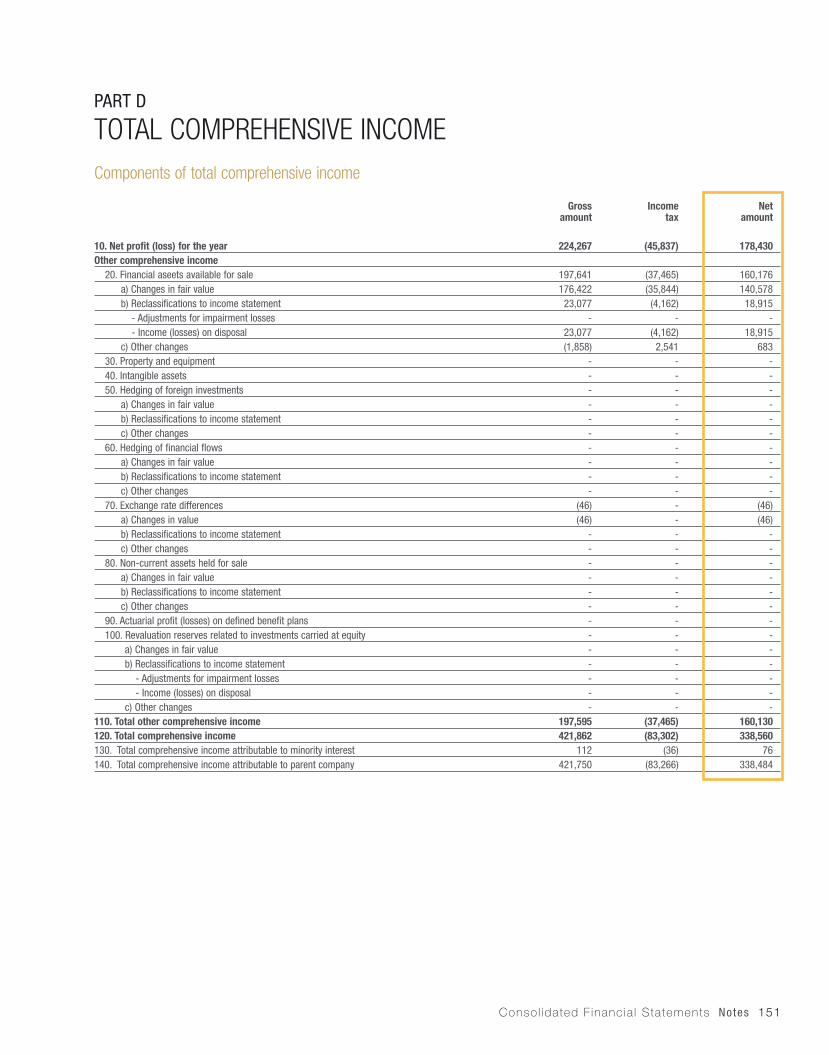
Consol idated F inancia l Statements Notes 151
PART D
TOTAL COMPREHENSIVE INCOMEComponents of total comprehensive income
Grossamount
Incometax
Netamount
10. Net profit (loss) for the year 224,267 (45,837) 178,430Other comprehensive income 20. Financial aseets available for sale 197,641 (37,465) 160,176 a) Changes in fair value 176,422 (35,844) 140,578 b) Reclassifications to income statement 23,077 (4,162) 18,915 - Adjustments for impairment losses - - - - Income (losses) on disposal 23,077 (4,162) 18,915 c) Other changes (1,858) 2,541 683 30. Property and equipment - - - 40. Intangible assets - - - 50. Hedging of foreign investments - - - a) Changes in fair value - - - b) Reclassifications to income statement - - - c) Other changes - - - 60. Hedging of financial flows - - - a) Changes in fair value - - - b) Reclassifications to income statement - - - c) Other changes - - - 70. Exchange rate differences (46) - (46) a) Changes in value (46) - (46) b) Reclassifications to income statement - - - c) Other changes - - - 80. Non-current assets held for sale - - - a) Changes in fair value - - - b) Reclassifications to income statement - - - c) Other changes - - - 90. Actuarial profit (losses) on defined benefit plans - - - 100. Revaluation reserves related to investments carried at equity - - - a) Changes in fair value - - - b) Reclassifications to income statement - - - - Adjustments for impairment losses - - - - Income (losses) on disposal - - - c) Other changes - - -110. Total other comprehensive income 197,595 (37,465) 160,130 120. Total comprehensive income 421,862 (83,302) 338,560 130. Total comprehensive income attributable to minority interest 112 (36) 76 140. Total comprehensive income attributable to parent company 421,750 (83,266) 338,484
152 Annua l Repor t 2009
PART E
INFORMATION ON RISKS AND RELATED HEDGING POLICIES
1.1 CREDIT RISK
Qualitative information
General information
The Banca Fideuram Group’s lending activities essentially support its core business of providing investment services to private customers. In line with Group strategies, loans to customers as a rule consist of short-term loans, are supported by collateral or bank guarantees and are to counterparties who are generally also customers of the Banca Fideuram Group’s investment services.
Analysis of the item Due from banks shows that it predominantly comprised short-term interbank loans, mainly to leading banks in the Eurozone. Loans to customers largely consisted of short-term loans, mostly current account overdrafts linked directly to the Banca Fideuram Group’s private banking business.
In order to manage the credit risk of loans to customers, the Group generally obtains collateral or bank guarantees, principally bonds or shares listed on major regulated markets or products sold by the Banca Fideuram Group (mutual funds, discretionary accounts or insurance products).The Group loan portfolio therefore has a low overall exposure to credit risk.
Committed to continually improving the services we offer our customers, the Group is engaged in a process of steadily developing its lending business, while continuing to target private banking customers who hold investment instruments and maintaining highly-effective risk management.
Credit risk management policies
Organisational aspectsThe Group’s overall lending business and management of the loan portfolio risk profile in particular are governed by internal Lending Policy regulations that follow the guidelines issued by parent company Intesa Sanpaolo. These internal regulations specify the decision-making powers of those authorised to grant loans, doing so in detail for each individual type of risk and applicant category, while also specifying the organisational units responsible for managing credit risk and for managing the risks associated with problem loans and impaired loans.
The offering and granting of level one loans is carried out in accordance with said scheme of delegated authority at the Group’s main branches located in 7 different areas, whereas the offering and granting of higher-level loans is managed in the Group’s central offices. Credit risk management is carried out by a central unit that is separate from those in charge of granting and managing loans.
Management, measurement and control systemsThe Group’s credit strategies are directed towards the efficient selection of individual loans through an appropriate creditworthiness analysis and towards systematic monitoring and constant supervision of relations designed to promptly detect any symptoms of impairment regarding either the loans or supporting collateral/guarantees.This activity, which is carried out during every stage in the lending process (enquiry, granting and monitoring) consists of a critical analysis of all the relevant indicators, the periodic review of every position and the systematic evaluation of the adequacy of any credit risk guarantees obtained. Further checks are carried out by our central departments on both the nature and quality of the overall exposures. In addition, specific checks are carried out to limit the concentration of exposure within the Intesa Sanpaolo Group. Risk monitoring and measurement tools and techniques developed within the Intesa Sanpaolo Group are also used to this end.
Credit risk mitigation techniquesThe Group generally obtains collateral or bank guarantees to mitigate the credit risk of loans to customers. Loans secured by collateral or bank guarantees accounted for 73% of loans to customers at 31.12.2009.
The types of collateral obtained are generally financial instruments listed on regulated markets and products distributed by the Banca Fideuram Group (funds, discretionary accounts and insurance policies) which meet previously specified liquidity requirements. Bonds are only accepted as collateral if the issuer or loan satisfies a minimum rating (by a leading rating agency). The value of the financial instruments obtained as collateral is discounted differentially as a precautionary measure when calculating the credit limit to be granted, with a view to protecting the Group against any fluctuations in market value.The concentration of collateral in issuers is very low, excepting for funds and other products distributed by the Banca Fideuram Group.There were no obligations at the time this report was prepared capable of undermining the legal validity of the collateral or guarantees, which is moreover subject to periodic verification.
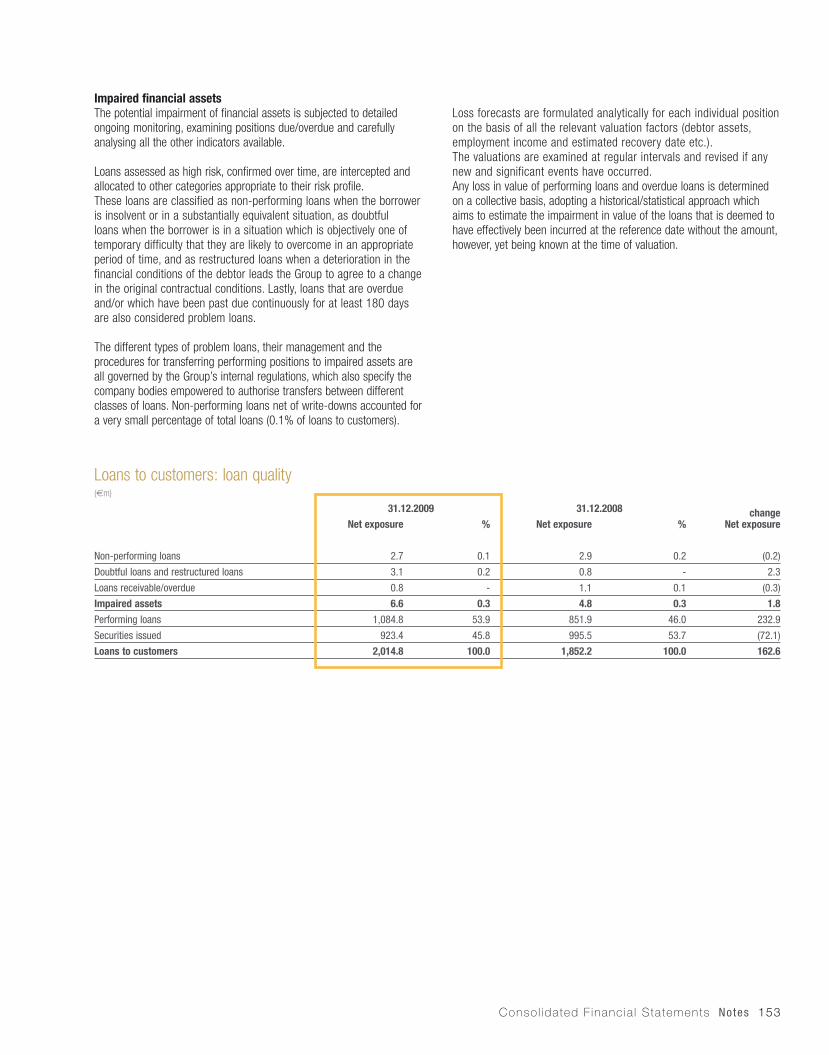
Consol idated F inancia l Statements Notes 153
Impaired financial assetsThe potential impairment of financial assets is subjected to detailed ongoing monitoring, examining positions due/overdue and carefully analysing all the other indicators available.
Loans assessed as high risk, confirmed over time, are intercepted and allocated to other categories appropriate to their risk profile. These loans are classified as non-performing loans when the borrower is insolvent or in a substantially equivalent situation, as doubtful loans when the borrower is in a situation which is objectively one of temporary difficulty that they are likely to overcome in an appropriate period of time, and as restructured loans when a deterioration in the financial conditions of the debtor leads the Group to agree to a change in the original contractual conditions. Lastly, loans that are overdue and/or which have been past due continuously for at least 180 days are also considered problem loans.
The different types of problem loans, their management and the procedures for transferring performing positions to impaired assets are all governed by the Group’s internal regulations, which also specify the company bodies empowered to authorise transfers between different classes of loans. Non-performing loans net of write-downs accounted for a very small percentage of total loans (0.1% of loans to customers).
Loss forecasts are formulated analytically for each individual position on the basis of all the relevant valuation factors (debtor assets, employment income and estimated recovery date etc.).The valuations are examined at regular intervals and revised if any new and significant events have occurred.Any loss in value of performing loans and overdue loans is determined on a collective basis, adopting a historical/statistical approach which aims to estimate the impairment in value of the loans that is deemed to have effectively been incurred at the reference date without the amount, however, yet being known at the time of valuation.
Loans to customers: loan quality (€m)
31.12.2009 31.12.2008 changeNet exposureNet exposure % Net exposure %
Non-performing loans 2.7 0.1 2.9 0.2 (0.2)
Doubtful loans and restructured loans 3.1 0.2 0.8 - 2.3
Loans receivable/overdue 0.8 - 1.1 0.1 (0.3)
Impaired assets 6.6 0.3 4.8 0.3 1.8
Performing loans 1,084.8 53.9 851.9 46.0 232.9
Securities issued 923.4 45.8 995.5 53.7 (72.1)
Loans to customers 2,014.8 100.0 1,852.2 100.0 162.6
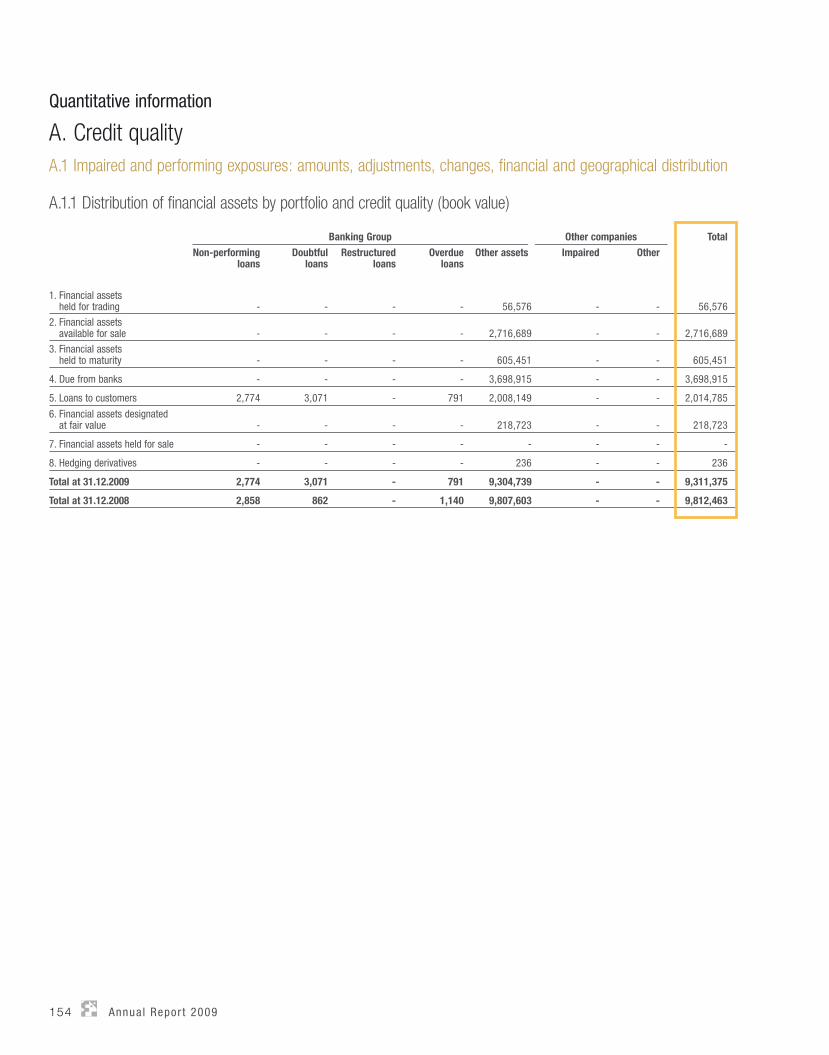
154 Annua l Repor t 2009
Quantitative information
A. Credit qualityA.1 Impaired and performing exposures: amounts, adjustments, changes, financial and geographical distribution
A.1.1 Distribution of financial assets by portfolio and credit quality (book value)
Banking Group Other companies Total
Non-performing loans
Doubtfulloans
Restructured loans
Overdueloans
Other assets Impaired Other
1. Financial assetsheld for trading - - - - 56,576 - - 56,576
2. Financial assetsavailable for sale - - - - 2,716,689 - - 2,716,689
3. Financial assetsheld to maturity - - - - 605,451 - - 605,451
4. Due from banks - - - - 3,698,915 - - 3,698,915
5. Loans to customers 2,774 3,071 - 791 2,008,149 - - 2,014,785
6. Financial assets designatedat fair value - - - - 218,723 - - 218,723
7. Financial assets held for sale - - - - - - - -
8. Hedging derivatives - - - - 236 - - 236
Total at 31.12.2009 2,774 3,071 - 791 9,304,739 - - 9,311,375
Total at 31.12.2008 2,858 862 - 1,140 9,807,603 - - 9,812,463

Consol idated F inancia l Statements Notes 155
A.1.2 Analysis of exposures by portfolio and credit quality (gross and net values)
Impaired assets Performing assets Total (net exposure)Gross
exposureSpecific
adjustmentsNet
ExposureGross
exposurePortfolio
adjustmentsNet
Exposure
A. Banking Group
1. Financial assets held for trading - - - X X 56,576 56,576
2. Financial assets available for sale - - - 2,716,689 - 2,716,689 2,716,689
3. Financial assets held to maturity - - - 605,451 - 605,451 605,451
4. Due from banks - - - 3,698,975 (60) 3,698,915 3,698,915
5. Loans to customers 18,657 (12,021) 6,636 2,010,912 (2,763) 2,008,149 2,014,785
6. Financial assets designated at fair value - - - X X 218,723 218,723
7. Financial assets held for sale - - - - - - -
8. Hedging derivatives - - - X X 236 236
Total A 18,657 (12,021) 6,636 9,032,027 (2,823) 9,304,739 9,311,375
B. Other companies includedin the consolidation
1. Financial assets held for trading - - - X X - -
2. Financial assets available for sale - - - - - - -
3. Financial assets held to maturity - - - - - - -
4. Due from banks - - - - - - -
5. Loans to customers - - - - - - -
6. Financial assets designated at fair value - - - X X - -
7. Financial assets held for sale - - - - - - -
8. Hedging derivatives - - - X X - -
Total B - - - - - - -
Total at 31.12.2009 18,657 (12,021) 6,636 9,032,027 (2,823) 9,304,739 9,311,375
Total at 31.12.2008 17,260 (12,400) 4,860 9,529,768 (2,718) 9,807,603 9,812,463
A.1.3 Banking Group - Cash and off-balance-sheet exposures to banks: gross and net values
Grossexposure
Specificadjustments
Portfolioadjustments
NetExposure
A. Cash exposures
a) Non-performing loans - - X -
b) Doubtful loans - - X -
c) Restructured loans - - X -
d) Overdue loans - - X -
e) Other assets 5,077,361 X (60) 5,077,301
Total A 5,077,361 - (60) 5,077,301
B. Off-balance-sheet exposures
a) Impaired - - X -
b) Other 27,465 X - 27,465
Total B 27,465 - - 27,465
Total A+B 5,104,826 - (60) 5,104,766
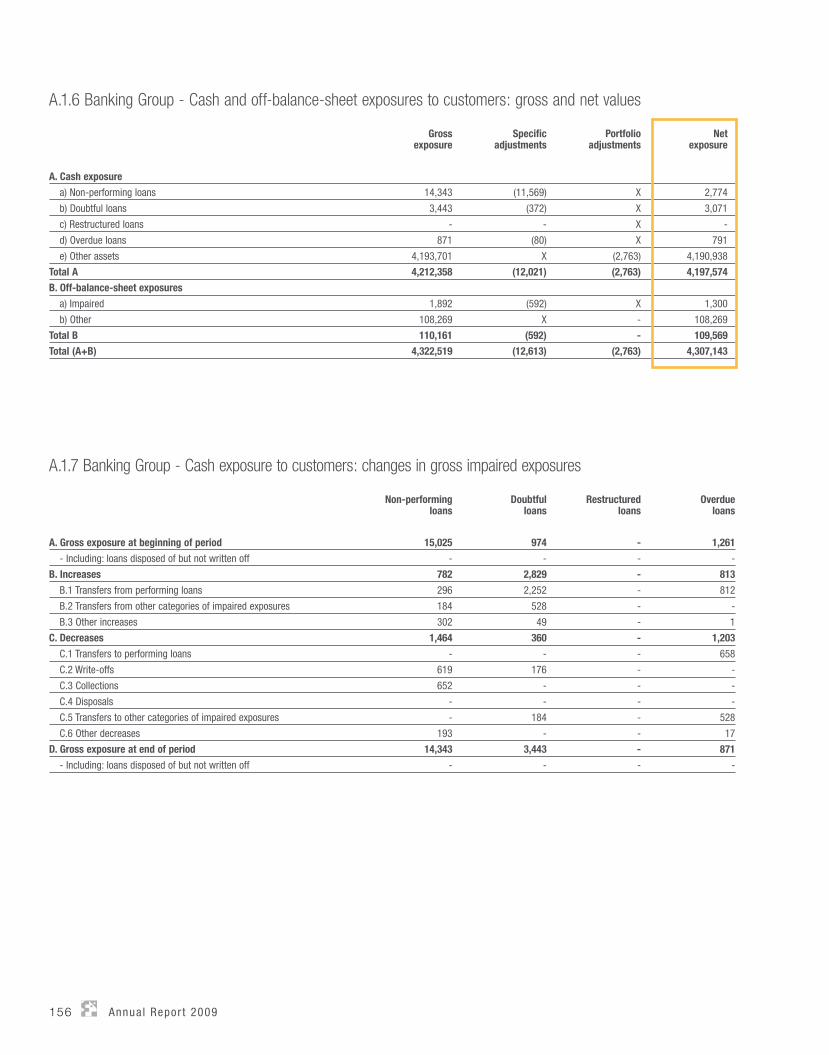
156 Annua l Repor t 2009
A.1.7 Banking Group - Cash exposure to customers: changes in gross impaired exposures
Non-performingloans
Doubtfulloans
Restructuredloans
Overdueloans
A. Gross exposure at beginning of period 15,025 974 - 1,261
- Including: loans disposed of but not written off - - - -
B. Increases 782 2,829 - 813
B.1 Transfers from performing loans 296 2,252 - 812
B.2 Transfers from other categories of impaired exposures 184 528 - -
B.3 Other increases 302 49 - 1
C. Decreases 1,464 360 - 1,203
C.1 Transfers to performing loans - - - 658
C.2 Write-offs 619 176 - -
C.3 Collections 652 - - -
C.4 Disposals - - - -
C.5 Transfers to other categories of impaired exposures - 184 - 528
C.6 Other decreases 193 - - 17
D. Gross exposure at end of period 14,343 3,443 - 871
- Including: loans disposed of but not written off - - - -
A.1.6 Banking Group - Cash and off-balance-sheet exposures to customers: gross and net values
Grossexposure
Specificadjustments
Portfolioadjustments
Netexposure
A. Cash exposure
a) Non-performing loans 14,343 (11,569) X 2,774
b) Doubtful loans 3,443 (372) X 3,071
c) Restructured loans - - X -
d) Overdue loans 871 (80) X 791
e) Other assets 4,193,701 X (2,763) 4,190,938
Total A 4,212,358 (12,021) (2,763) 4,197,574
B. Off-balance-sheet exposures
a) Impaired 1,892 (592) X 1,300
b) Other 108,269 X - 108,269
Total B 110,161 (592) - 109,569
Total (A+B) 4,322,519 (12,613) (2,763) 4,307,143

Consol idated F inancia l Statements Notes 157
A.1.8 Banking Group - Cash exposure to customers: changes in total adjustments
Non-performingloans
Doubtfulloans
Restructuredloans
Overdueloans
A. Total adjustments at beginning of period 12,167 112 - 121
- Including: loans disposed of but not written off - - - -
B. Increases 1,219 398 - 97
B.1 Adjustments 448 398 - 75
B.2 Transfers from other categories of impaired exposures - - - -
B.3 Other increases 771 - - 22
C. Decreases 1,817 138 - 138
C.1 Write-backs from period-end valuations 744 37 - 138
C.2 Write-backs on collections 335 - - -
C.3 Write-offs 620 101 - -
C.4 Transfers to other categories of impaired exposures - - - -
C.5 Other decreases 118 - - -
D. Total adjustments at end of period 11,569 372 - 80
- Including: loans disposed of but not written off - - - -
A.2 Classification of exposures by external rating
A.2.1 Banking Group - Analysis of cash and off-balance-sheet exposures by external rating (book values)
External rating class No rating Total
Class 1 Class 2 Class 3 Class 4 Class 5 Class 6
A. Cash exposures 3,481,062 1,903,350 669,620 30,983 - 116 3,189,744 9,274,875
B. Derivatives 885 1,889 - - - - 33,726 36,500
B.1 Financial derivatives 885 1,889 - - - - 33,726 36,500
B.2 Credit derivatives - - - - - - - -
C. Guarantees issued 1,632 - - - - 1,300 89,716 92,648
D. Commitments to grant finance 2,439 - - - - - 5,447 7,886
Total 3,486,018 1,905,239 669,620 30,983 - 1,416 3,318,633 9,411,909
Credit rating
Class 1 Class 2 Class 3 Class 4 Class 5 Class 6
Ratingagency(ECAI)
Standard & Poor’s from AAA to AA- from A+ to A- from BBB+
to BBB- from BB+
to BB- from B+
to B- CCC+
and below
Moody’s from Aaa to Aa3 from A1 to A3 from Baa1
to Baa3 from Ba1
to Ba3 from B1
to B3 Caa1
and below
Fitch from AAA to AA- from A+ to A- from BBB+
to BBB- from BB+
to BB- from B+
to B- CCC+
and below
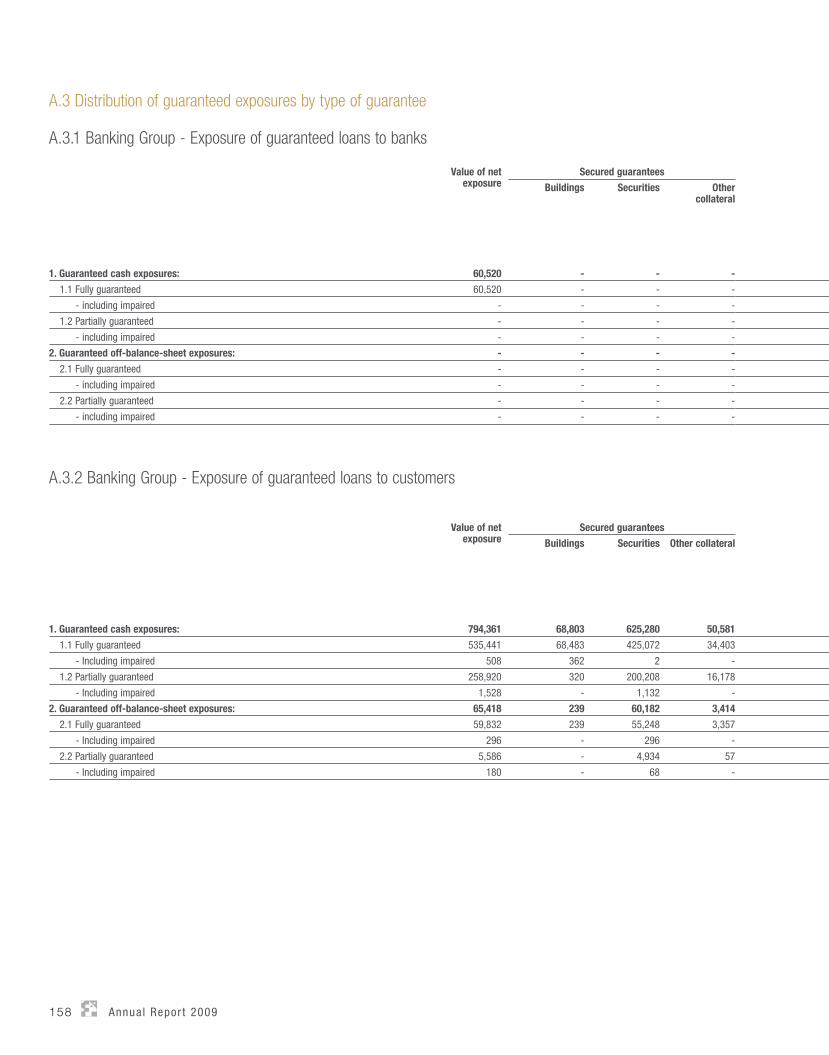
158 Annua l Repor t 2009
A.3 Distribution of guaranteed exposures by type of guarantee
A.3.1 Banking Group - Exposure of guaranteed loans to banks
Value of net exposure
Secured guarantees
Buildings Securities Othercollateral
1. Guaranteed cash exposures: 60,520 - - -
1.1 Fully guaranteed 60,520 - - -
- including impaired - - - -
1.2 Partially guaranteed - - - -
- including impaired - - - -
2. Guaranteed off-balance-sheet exposures: - - - -
2.1 Fully guaranteed - - - -
- including impaired - - - -
2.2 Partially guaranteed - - - -
- including impaired - - - -
A.3.2 Banking Group - Exposure of guaranteed loans to customers
Value of net exposure
Secured guarantees
Buildings Securities Other collateral
1. Guaranteed cash exposures: 794,361 68,803 625,280 50,581
1.1 Fully guaranteed 535,441 68,483 425,072 34,403
- Including impaired 508 362 2 -
1.2 Partially guaranteed 258,920 320 200,208 16,178
- Including impaired 1,528 - 1,132 -
2. Guaranteed off-balance-sheet exposures: 65,418 239 60,182 3,414
2.1 Fully guaranteed 59,832 239 55,248 3,357
- Including impaired 296 - 296 -
2.2 Partially guaranteed 5,586 - 4,934 57
- Including impaired 180 - 68 -
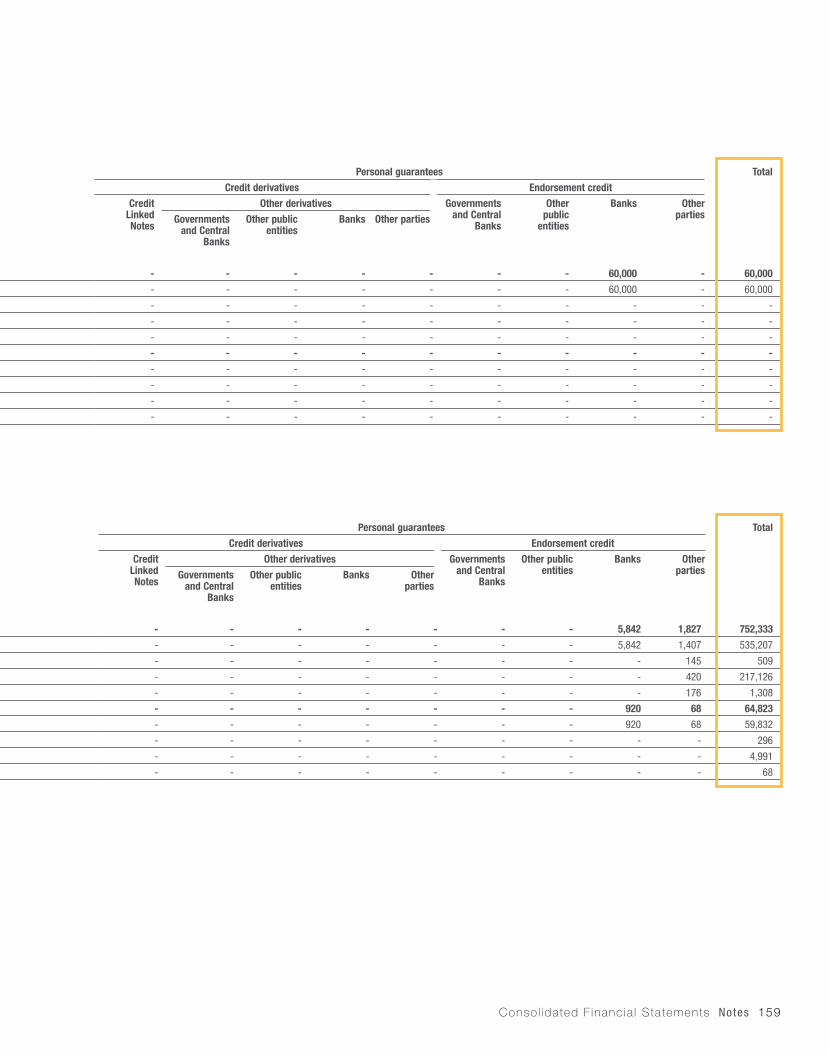
Consol idated F inancia l Statements Notes 159
Personal guarantees Total
Credit derivatives Endorsement credit
CreditLinkedNotes
Other derivatives Governments and Central
Banks
Otherpublic
entities
Banks OtherpartiesGovernments
and Central Banks
Other public entities
Banks Other parties
- - - - - - - 60,000 - 60,000
- - - - - - - 60,000 - 60,000
- - - - - - - - - -
- - - - - - - - - -
- - - - - - - - - -
- - - - - - - - - -
- - - - - - - - - -
- - - - - - - - - -
- - - - - - - - - -
- - - - - - - - - -
Personal guarantees Total
Credit derivatives Endorsement credit
CreditLinkedNotes
Other derivatives Governments and Central
Banks
Other public entities
Banks OtherpartiesGovernments
and Central Banks
Other public entities
Banks Otherparties
- - - - - - - 5,842 1,827 752,333
- - - - - - - 5,842 1,407 535,207
- - - - - - - - 145 509
- - - - - - - - 420 217,126
- - - - - - - - 176 1,308
- - - - - - - 920 68 64,823
- - - - - - - 920 68 59,832
- - - - - - - - - 296
- - - - - - - - - 4,991
- - - - - - - - - 68
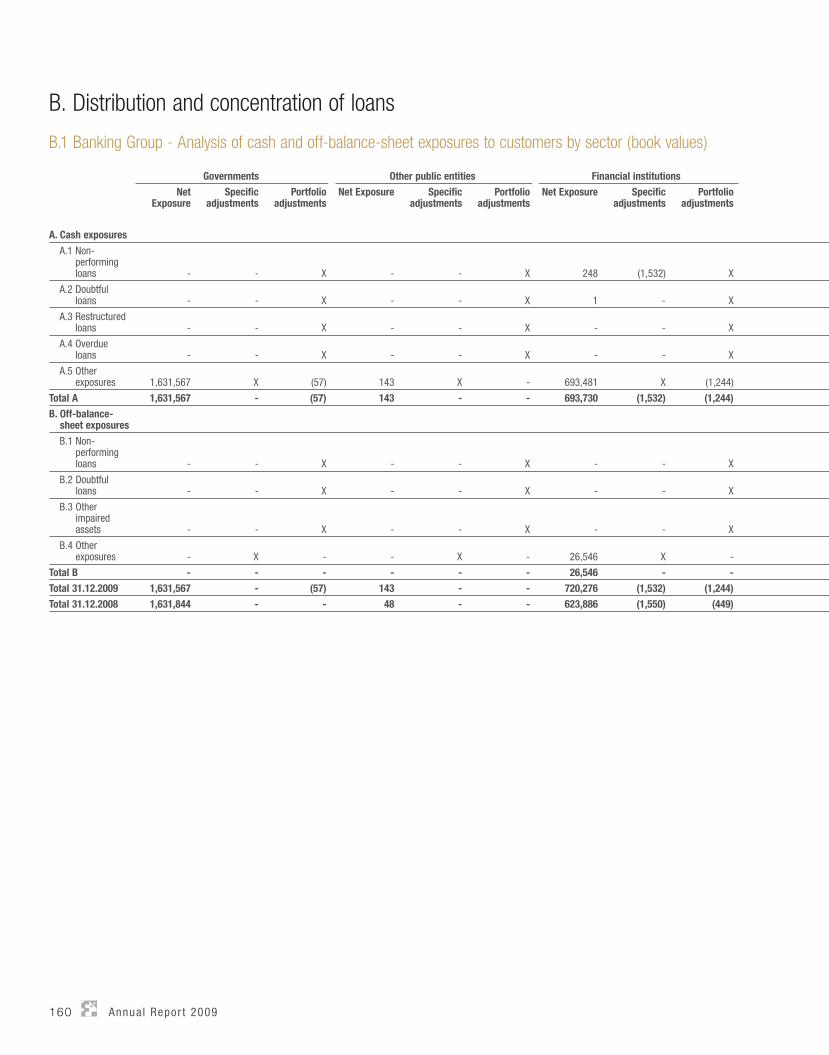
160 Annua l Repor t 2009
B. Distribution and concentration of loans
B.1 Banking Group - Analysis of cash and off-balance-sheet exposures to customers by sector (book values)
Governments Other public entities Financial institutions
Net Exposure
Specific adjustments
Portfolio adjustments
Net Exposure Specific adjustments
Portfolio adjustments
Net Exposure Specific adjustments
Portfolio adjustments
A. Cash exposures
A.1 Non-performing loans - - X - - X 248 (1,532) X
A.2 Doubtful loans - - X - - X 1 - X
A.3 Restructured loans - - X - - X - - X
A.4 Overdue loans - - X - - X - - X
A.5 Other exposures 1,631,567 X (57) 143 X - 693,481 X (1,244)
Total A 1,631,567 - (57) 143 - - 693,730 (1,532) (1,244)
B. Off-balance-sheet exposures
B.1 Non-performing loans - - X - - X - - X
B.2 Doubtful loans - - X - - X - - X
B.3 Other impaired assets - - X - - X - - X
B.4 Other exposures - X - - X - 26,546 X -
Total B - - - - - - 26,546 - -
Total 31.12.2009 1,631,567 - (57) 143 - - 720,276 (1,532) (1,244)
Total 31.12.2008 1,631,844 - - 48 - - 623,886 (1,550) (449)

Consol idated F inancia l Statements Notes 161
Insurance companies Non-financial companies Other parties
Net Exposure Specific adjustments
Portfolio adjustments
Net Exposure Specific adjustments
Portfolio adjustments
Net Exposure Specific adjustments
Portfolio adjustments
- - X 351 (2,337) X 2,175 (7,700) X
- - X 39 (8) X 3,031 (364) X
- - X - - X - - X
- - X 3 - X 788 (80) X
325,659 X - 440,747 X (312) 1,099,341 X (1,150)
325,659 - - 441,140 (2,345) (312) 1,105,335 (8,144) (1,150)
- - X - - X - - X
- - X 1,031 (566) X 59 (6) X
- - X 194 (19) X 16 (1) X
3,420 X - 39,507 X - 38,796 X -
3,420 - - 40,732 (585) - 38,871 (7) -
329,079 - - 481,872 (2,930) (312) 1,144,206 (8,151) (1,150)
282,127 - - 429,991 (3,151) (499) 1,038,761 (8,276) (1,718)
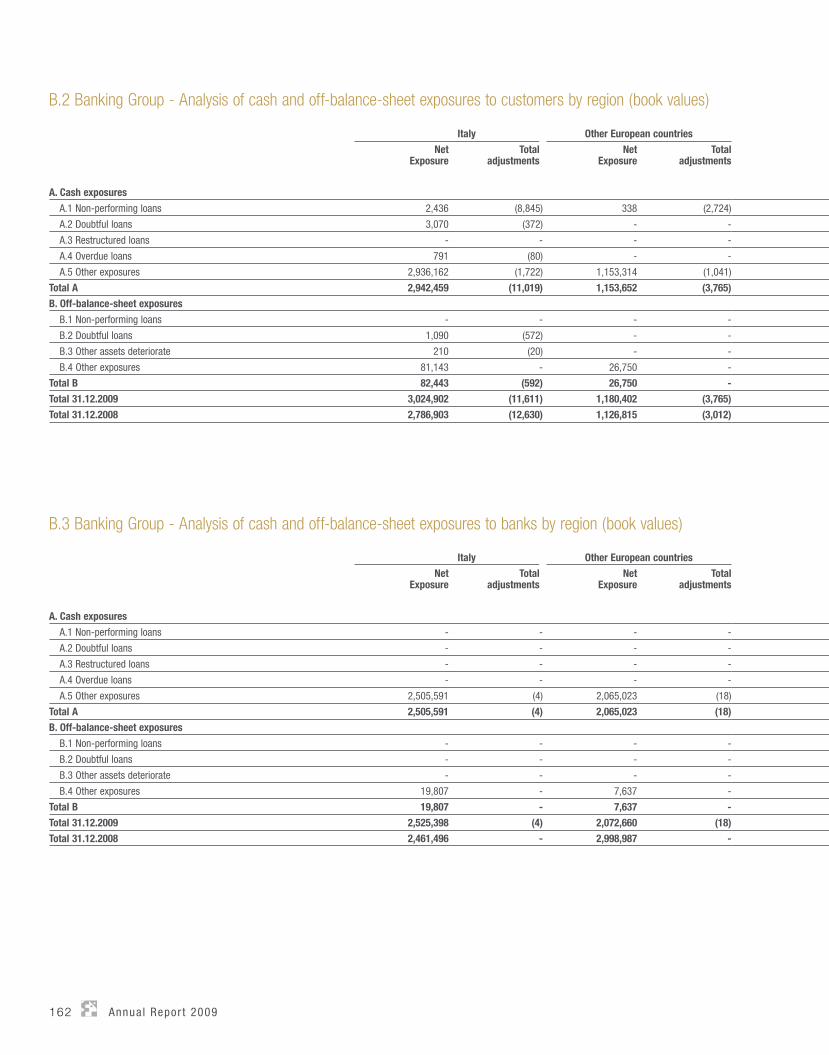
162 Annua l Repor t 2009
B.2 Banking Group - Analysis of cash and off-balance-sheet exposures to customers by region (book values)
Italy Other European countries
NetExposure
Totaladjustments
NetExposure
Totaladjustments
A. Cash exposures
A.1 Non-performing loans 2,436 (8,845) 338 (2,724)
A.2 Doubtful loans 3,070 (372) - -
A.3 Restructured loans - - - -
A.4 Overdue loans 791 (80) - -
A.5 Other exposures 2,936,162 (1,722) 1,153,314 (1,041)
Total A 2,942,459 (11,019) 1,153,652 (3,765)
B. Off-balance-sheet exposures
B.1 Non-performing loans - - - -
B.2 Doubtful loans 1,090 (572) - -
B.3 Other assets deteriorate 210 (20) - -
B.4 Other exposures 81,143 - 26,750 -
Total B 82,443 (592) 26,750 -
Total 31.12.2009 3,024,902 (11,611) 1,180,402 (3,765)
Total 31.12.2008 2,786,903 (12,630) 1,126,815 (3,012)
B.3 Banking Group - Analysis of cash and off-balance-sheet exposures to banks by region (book values)
Italy Other European countries
NetExposure
Totaladjustments
NetExposure
Totaladjustments
A. Cash exposures
A.1 Non-performing loans - - - -
A.2 Doubtful loans - - - -
A.3 Restructured loans - - - -
A.4 Overdue loans - - - -
A.5 Other exposures 2,505,591 (4) 2,065,023 (18)
Total A 2,505,591 (4) 2,065,023 (18)
B. Off-balance-sheet exposures
B.1 Non-performing loans - - - -
B.2 Doubtful loans - - - -
B.3 Other assets deteriorate - - - -
B.4 Other exposures 19,807 - 7,637 -
Total B 19,807 - 7,637 -
Total 31.12.2009 2,525,398 (4) 2,072,660 (18)
Total 31.12.2008 2,461,496 - 2,998,987 -
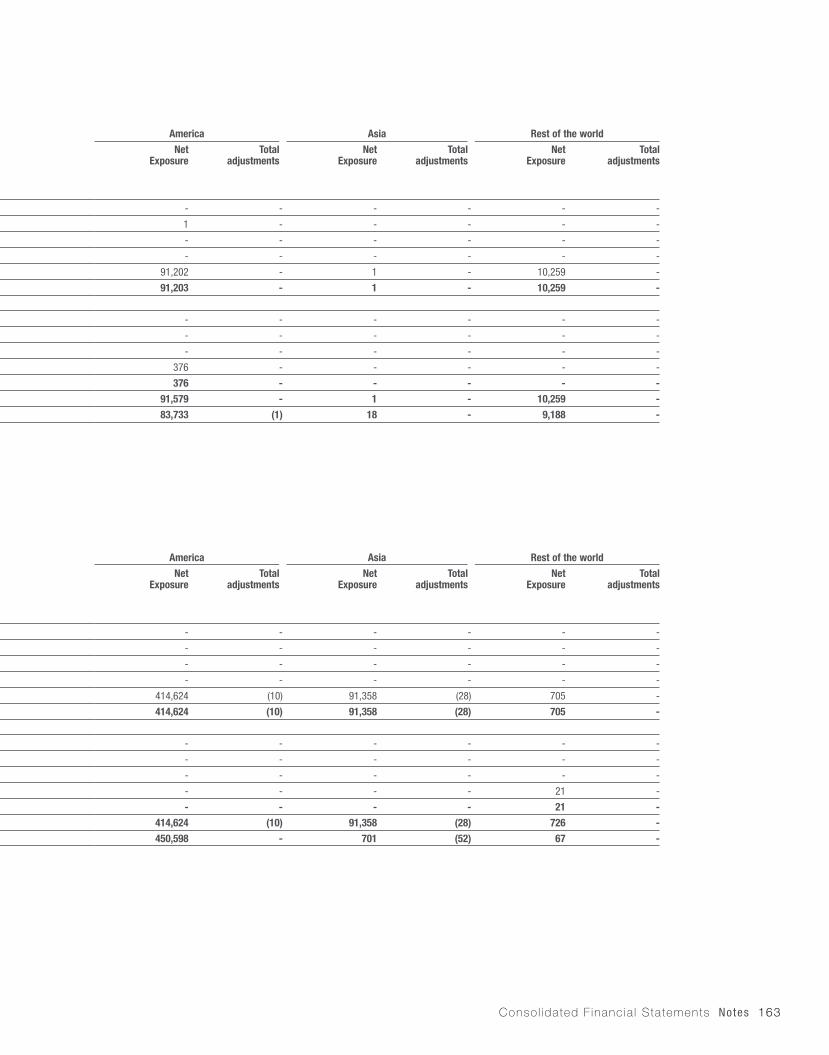
Consol idated F inancia l Statements Notes 163
America Asia Rest of the world
NetExposure
Totaladjustments
NetExposure
Totaladjustments
NetExposure
Totaladjustments
- - - - - -
1 - - - - -
- - - - - -
- - - - - -
91,202 - 1 - 10,259 -
91,203 - 1 - 10,259 -
- - - - - -
- - - - - -
- - - - - -
376 - - - - -
376 - - - - -
91,579 - 1 - 10,259 -
83,733 (1) 18 - 9,188 -
America Asia Rest of the world
NetExposure
Totaladjustments
NetExposure
Totaladjustments
NetExposure
Totaladjustments
- - - - - -
- - - - - -
- - - - - -
- - - - - -
414,624 (10) 91,358 (28) 705 -
414,624 (10) 91,358 (28) 705 -
- - - - - -
- - - - - -
- - - - - -
- - - - 21 -
- - - - 21 -
414,624 (10) 91,358 (28) 726 -
450,598 - 701 (52) 67 -
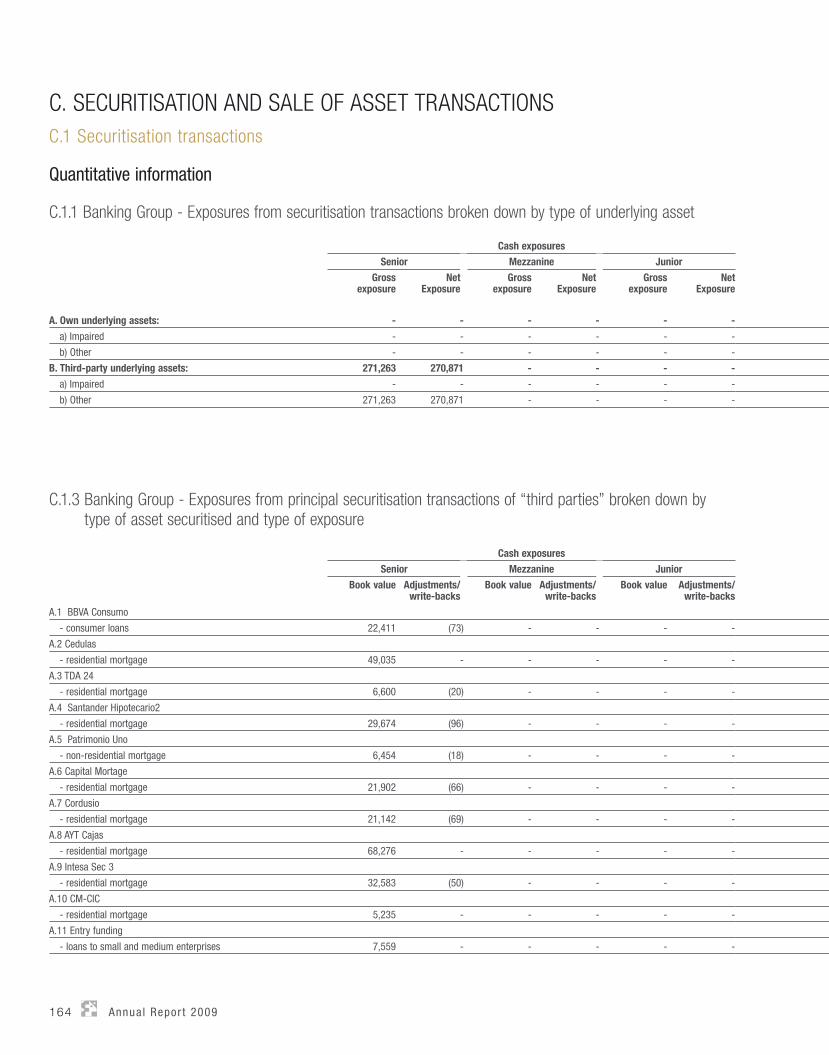
164 Annua l Repor t 2009
C. SECURITISATION AND SALE OF ASSET TRANSACTIONSC.1 Securitisation transactions
Quantitative information
C.1.1 Banking Group - Exposures from securitisation transactions broken down by type of underlying asset
Cash exposures
Senior Mezzanine Junior
Grossexposure
NetExposure
Gross exposure
NetExposure
Gross exposure
NetExposure
A. Own underlying assets: - - - - - -
a) Impaired - - - - - -
b) Other - - - - - -
B. Third-party underlying assets: 271,263 270,871 - - - -
a) Impaired - - - - - -
b) Other 271,263 270,871 - - - -
C.1.3 Banking Group - Exposures from principal securitisation transactions of “third parties” broken down by type of asset securitised and type of exposure
Cash exposures
Senior Mezzanine Junior
Book value Adjustments/write-backs
Book value Adjustments/write-backs
Book value Adjustments/write-backs
A.1 BBVA Consumo
- consumer loans 22,411 (73) - - - -
A.2 Cedulas
- residential mortgage 49,035 - - - - -
A.3 TDA 24
- residential mortgage 6,600 (20) - - - -
A.4 Santander Hipotecario2
- residential mortgage 29,674 (96) - - - -
A.5 Patrimonio Uno
- non-residential mortgage 6,454 (18) - - - -
A.6 Capital Mortage
- residential mortgage 21,902 (66) - - - -
A.7 Cordusio
- residential mortgage 21,142 (69) - - - -
A.8 AYT Cajas
- residential mortgage 68,276 - - - - -
A.9 Intesa Sec 3
- residential mortgage 32,583 (50) - - - -
A.10 CM-CIC
- residential mortgage 5,235 - - - - -
A.11 Entry funding
- loans to small and medium enterprises 7,559 - - - - -
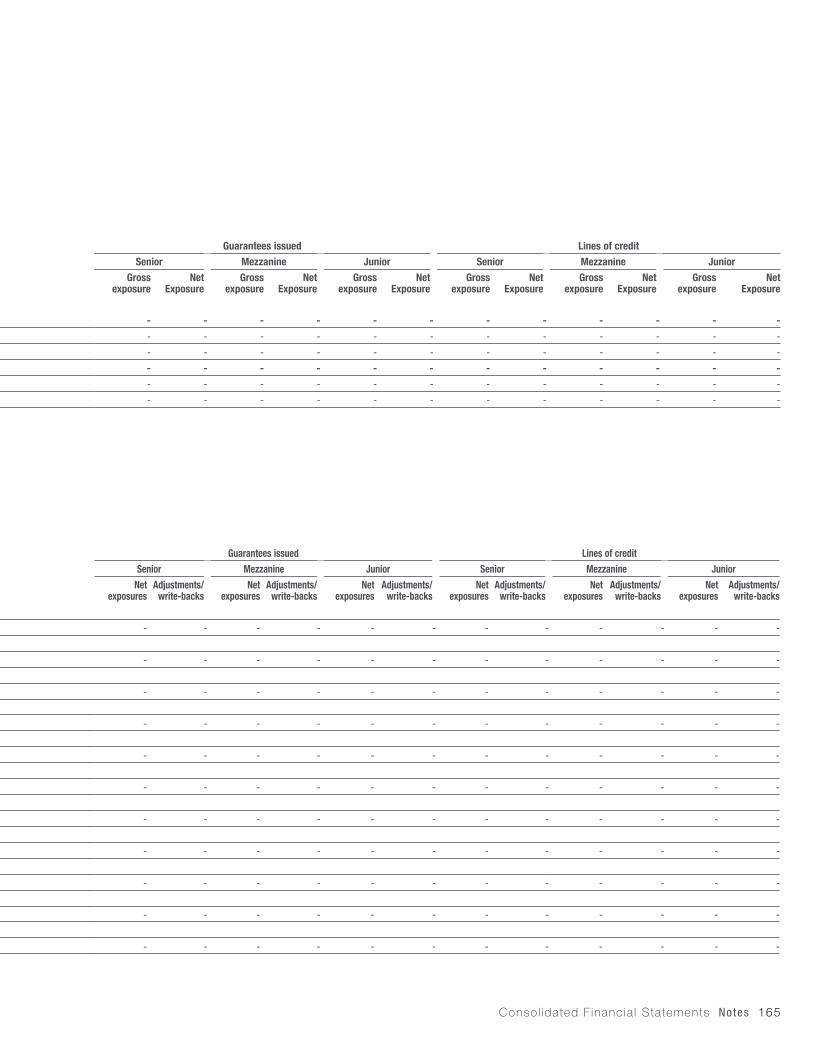
Consol idated F inancia l Statements Notes 165
Guarantees issued Lines of credit
Senior Mezzanine Junior Senior Mezzanine Junior
Gross exposure
Net Exposure
Gross exposure
Net Exposure
Gross exposure
Net Exposure
Gross exposure
Net Exposure
Gross exposure
Net Exposure
Gross exposure
NetExposure
- - - - - - - - - - - -
- - - - - - - - - - - -
- - - - - - - - - - - -
- - - - - - - - - - - -
- - - - - - - - - - - -
- - - - - - - - - - - -
Guarantees issued Lines of credit
Senior Mezzanine Junior Senior Mezzanine Junior
Netexposures
Adjustments/write-backs
Net exposures
Adjustments/write-backs
Netexposures
Adjustments/write-backs
Net exposures
Adjustments/write-backs
Netexposures
Adjustments/write-backs
Net exposures
Adjustments/write-backs
- - - - - - - - - - - -
- - - - - - - - - - - -
- - - - - - - - - - - -
- - - - - - - - - - - -
- - - - - - - - - - - -
- - - - - - - - - - - -
- - - - - - - - - - - -
- - - - - - - - - - - -
- - - - - - - - - - - -
- - - - - - - - - - - -
- - - - - - - - - - - -

166 Annua l Repor t 2009
C.1.4 Banking Group - Exposures from securitisations broken down by portfolio and exposures
Financial assets heldfor trading
Financialassets
designated atfair value
Financialassets
availablefor sale
Financialassets heldto maturity
Loans31.12.2009
Total31.12.2008
Total
1. Cash exposures - - 5,235 117,311 148,325 270,871 339,351
- Senior - - 5,235 117,311 148,325 270,871 339,351
- Mezzanine - - - - - - -
- Junior - - - - - - -
2. Off-balance-sheet exposures - - - - - - -
- Senior - - - - - - -
- Mezzanine - - - - - - -
- Junior - - - - - - -
C.2 Disposal Transactions
C.2.1 Banking Group - Assets disposed of but not written off
Financial assetsheld for trading
Financial assets designatedat fair value
Financial assetsavailable for sale
A B C A B C A B C
A. Cash assets - - - - - - 711,532 - -
1. Debt securities - - - - - - 711,532 - -
2. Equities - - - - - - - - -
3. Units in mutual funds - - - - - - - - -
4. Loans - - - - - - - - -
B. Derivatives - - - X X X X X X
Total 31.12.2009 - - - - - - 711,532 - -
Including impaired - - - - - - - - -
Total 31.12.2008 - - - - - - 1,641,557 - -
Including impaired - - - - - - - - -
Legend:A = Financial assets disposed of recognised in full (book value)B = Financial assets disposed of and partially recognised (book value)C = Financial assets disposed of and partially recognised (full value)

Consol idated F inancia l Statements Notes 167
Financial assetsheld to maturity
Duefrom banks
Loansto customers
Total
A B C A B C A B C 31.12.2009 31.12.2008
- - - 266,233 - - 4,450 - - 982,215 3,545,142
- - - 266,233 - - 4,450 - - 982,215 3,545,142
X X X X X X X X X - -
X X X X X X X X X - -
- - - - - - - - - - -
X X X X X X X X X - -
- - - 266,233 - - 4,450 - - 982,215 -
- - - - - - - - - - -
98,707 - - 1,630,464 - - 174,414 - - - 3,545,142
- - - - - - - - - - -

168 Annua l Repor t 2009
C.2.2 Banking Group - Financial liabilities regarding financial assets disposed of but not written off
Financial assets held for trading
Financialassets
designatedat fair value
Financialassets
available for sale
Financial assets held to maturity
Due frombanks
Loans to customers
Total
1. Due to customers - - 36,530 - 273,445 3,480 313,455
a) regarding assets recognised in full - - 36,530 - 273,445 3,480 313,455
b) regarding assets partially recognised - - - - - - -
2. Due to banks - - 10 - - - 10
a) regarding assets recognised in full - - 10 - - - 10
b) regarding assets partially recognised - - - - - - -
3. Debt on issue - - - - - - -
a) regarding assets recognised in full - - - - - - -
b) regarding assets partially recognised - - - - - - -
Total 31.12.2009 - - 36,540 - 273,445 3,480 313,465
Total 31.12.2008 - - 261,900 90,409 1,389,964 150,100 1,892,373

Consol idated F inancia l Statements Notes 169
1.2 MARKET RISK
Qualitative information
Banca Fideuram has formulated the risk and capital consumption policies of the bank and its subsidiaries in accordance with the guidelines issued by parent company Intesa Sanpaolo, acts as treasury manager for the Banca Fideuram Group and plays a central role in managing market risk. The business areas and companies in the Banca Fideuram Group that generate market risk operate independently, within clearly-defined and closely-governed limits which are set out in an Investment Policy that is approved and regularly reviewed by the Board of Directors.
The Board of Directors draws on the support of an Investment Committee, composed of the following permanent members: the Managing Director (who is also the Chairman of the Committee), the Chief Financial Officer (CFO), the Finance Director, the Banca Fideuram Risk Management Director, and the Risk Management and General Manager of subsidiary Euro-Trésorerie. The following may also be invited to participate depending on the matters under consideration: the Banca Fideuram Administration and Reporting Director, the Banca Fideuram Marketing and Products Director, The Banca Fideuram Network Director and the Economic Research Director of subsidiary Fideuram Investimenti. The Committee meets at least quarterly to analyse the performance of the Banca Fideuram Group’s investments, proposing strategic guidelines to the Managing Director. The Managing Director provides quarterly reports to the Board of Directors on the investment choices made and on the performance of the Group’s portfolios. The Finance Director informs the Managing Director and CFO about the investment choices made and the profitability of the portfolios at monthly intervals and likewise keeps the Investment Committee periodically informed at regular intervals. The Risk Management Manager informs the Managing Director, CFO and Finance Director on the use of the operating limits monthly and likewise keeps the Investment Committee informed at regular intervals.
The Investment Policy is applied both to the bank portfolio and to the trading book, specifying limits for containing financial risk with a view to optimising profitability and maintaining financial solidity. The policy splits investments in securities into a liquidity portfolio and an investment portfolio. The former has a cautious minimum size and financial characteristics which limit risk to ensure immediate liquidity. The Investment Portfolio varies in size depending on the structure of the Group’s inflows, investments and shareholders’ equity. The composition of the securities holdings is governed by limits with respect to asset allocation, rating, currency area, geographical area, sector concentration and counterparty. Market risk and stop loss limits are likewise specified.A dedicated Risk Management Unit, independent of the operating unit concerned, is responsible for monitoring that the limits specified are respected and for measuring market risk.
Trading bookThe trading book is tailored to support the requirements of the Group’s retail customer transactions, is marginal in size and has a very low risk level in terms of Value at Risk. It includes a securities component resulting from secondary market transactions with customers, and foreign exchange and exchange rate derivative transactions, which are likewise engaged in to meet the needs of our customers and of the managed assets companies in the Group. The trading book risk measured in terms of 10-day Value at Risk with a confidence level of 99% was extremely low at the end of the year (€1.4m at 31 December 2009).
Bank portfolio The bank portfolio comprises long-term investment securities and interest rate hedge derivatives. The market risk of this portfolio mainly regards the management of investments in securities. The Group’s exposure to interest rate risk is, moreover, also influenced by other typical banking balance sheet items (customer deposits and loans). The financial risk of the bank portfolio is measured using the following methods:• Value at Risk (VaR)• Sensitivity analysis.
The Value at Risk is the maximum potential amount that the portfolio could lose over the subsequent 20 working days with a confidence interval of 99%, and is calculated in relation to the volatility and the historical correlations observed between the individual risk factors over the previous 500 working days. VaR is a risk measurement applied to securities holdings which takes interest rates, credit spreads and volatility into account. At the end of December 2009, the Value at Risk was €70m (€89m at 31 December 2008), with the main components being credit spread risk and the increase in the fixed rate portfolio.
(€m)
Q1 2009
Q2 2009
Q3 2009
Q4 2009
20-day VaR (diversified) 100.43 109.40 124.14 100.31
- Interest rate VaR 22.51 27.02 28.64 29.04
- Credit spread VaR 87.61 93.38 104.41 79.88
- Volatility VaR 2.76 2.41 5.04 4.35
The Group used derivatives (mainly interest rate swaps) to hedge interest rate risk following a strategy that involved buying swaps linked to the individual fixed-coupon bonds in the portfolio. This strategy provided our long-term securities holdings with very effective protection against interest rate risk.
We maintained a strategy of not hedging over a short-to-medium-term time horizon in the year, increasing the portfolio’s exposure to interest rate fluctuations. This strategy exposed our securities holdings positively to the falling interest rates that had been considered highly probable following the expansionary monetary policy decisions of the monetary authorities. The risk of the loan issuer spread widening was not hedged and the Group’s investment choices were moreover focused on issuers of high credit standing.
170 Annua l Repor t 2009
The table of credit spread VaR over time above clearly shows the stressed scenario of this risk factor. There was a steady increase in credit-spread volatility in all the sectors and rating categories in which the bank portfolio is diversified under the Group’s investment policy. This high variability affected all the primary issuers of the Banca Fideuram Group’s securities holdings. VaR in the last quarter shows this risk factor returning to less extreme levels.
Analysis of the securities holdings reveals high loan quality, with 28% of the investments involving securities with triple and double A ratings, 54% involving securities with A ratings and 17% securities with BBB ratings. The remainder were mainly unrated bank securities.Where risk concentration is concerned, the securities holdings are highly-diversified as a result of the stringent limits specified by the Investment Policy, which limits the maximum exposure to any single group to 5% of the total holdings.
Asset Liability ManagementThe Group’s total exposure to interest rate risk is monitored using Asset Liability Management (ALM) techniques to determine the shift sensitivity and sensitivity of net interest income.The shift sensitivity, which measures the change in fair value of the bank portfolio resulting from an upward parallel movement of 100 basis points in the interest rate curve, is calculated taking into account the risk generated by customer demand deposits and other assets and liabilities of the bank portfolio sensitive to shifts in the interest rate curve. This sensitivity was -€33m at the end of December.
Fair Value measurement of financial assets and liabilitiesThe Group has developed a pricing methodology for the valuation of financial products which rigorously implements the provisions of the IAS/IFRS international accounting standards.The Group consistently calculates the fair value of financial instruments directly from their market value. Wherever possible, the official prices on active markets are adopted as this market value, otherwise the value is obtained using pricing models based on the values of comparable securities and on market parameters.In situations where the market is not operating normally, which is to say when there is an insufficient number of continuous transactions and the bid/ask spread and volatility are not sufficiently low, it is however necessary to abandon the principle of obtaining the fair value directly from market prices and to apply models that mostly use market parameters to calculate an appropriate fair value for the financial instruments. The following are considered in assessing whether a market is operating normally:• Constant availability of price contributions• Constant reliability of price contributions• Size of the bid/offer spread.
In the absence of an active market, the fair value is determined using valuation techniques which ultimately aim to establish the price that the financial instrument would have had on the measurement date in an arm’s-length exchange motivated by normal business considerations. These techniques include: • Reference to market values that can be indirectly linked to the
financial instrument being valued and can be obtained from products with similar risk characteristics (comparable approach).
• Valuations performed using - even only partially - inputs that are not obtained from observable market parameters, using estimates and assumptions formulated by the valuer (mark-to-model).
There is no choice regarding which of these methodologies is chosen, with priority being given to market information, which has to take precedence. The priority of market prices is put into practice through an automatic process based on market maker prices. The valuation price is calculated as the average of the prices available, selected using objectively identified criteria. The number of contributions, the bid/ask spread and the reliability of the contributors are monitored daily, enabling the Group to keep market prices as the appropriate prime parameter for measuring fair value.
All the Group’s securities holdings are valued at market bid prices (mark to market) to ensure the maximum transparency of the values in the financial statements. This ensures the overall holdings meet the ready liquidity criteria for items in the financial statements.A mark to model automatically fed by market data providers and based on commonly-accepted valuation processes is used for the valuation of derivatives. The derivatives in the bank portfolio consisted entirely of Interest Rate Swaps.
Fair value hedgesThe Group used fair value hedge derivatives to reduce its exposure to adverse changes in fair value caused by interest rate fluctuations, mainly using interest rate swaps and derivative contracts to hedge its investments in fixed rate bonds in particular.The Risk Management Unit is responsible for assessing hedge effectiveness, carrying out prior assessments of the conditions that make hedge accounting applicable and formally documenting each hedging relationship. Hedge effectiveness is assessed using prospective tests when the hedges are taken out, followed by retrospective tests at monthly intervals.

Consol idated F inancia l Statements Notes 171
Exposure to securitised products The securitised products in the bank portfolio were mainly issues with high ratings and almost all met central bank eligibility criteria. These securitised products accounted for 19.4% of held-to-maturity assets, 7.3% of securities in the loan portfolio and 0.2% of available-for-sale financial assets. The geographical distribution of these instruments, which was focused in the Eurozone, prioritised mortgage-backed securities.No particular pricing tensions emerged regarding the instruments in the portfolio during the year.
Exchange rate riskExchange rate risk is defined as the possibility of fluctuations in market exchange rates generating either positive or negative changes in the value of the Group’s net assets. The principle sources of exchange rate risk are:• Loans to and deposits by corporate and/or retail customers in foreign
currencies.• Purchases of securities and/or shares or other financial instruments in
foreign currencies.• Conversion of foreign subsidiaries’ assets, liabilities and income into
the functional currency.• Buying and selling of foreign currencies.• Collection and/or payment of interest, commission, dividends or
administrative costs in foreign currencies.
Name Type Rating Face value(€)
Assets securitised Eligible IAS Portfolio Book Value (thousands of
euros)
SANTANDER HIPOTECARIO 2 MBS AA 30,270,490 Spanish residential mortgages YES L&R 29,674
TDA 24 MBS AAA 6,937,878 Spanish residential mortgages NO L&R 6,600
CORDUSIO MBS AAA 21,445,417 Italian residential mortgages YES L&R 21,142
CAPITAL MORTGAGE MBS AAA 23,212,980 Italian residential mortgages YES L&R 21,902
INTESA SEC. 3 MBS AAA 33,033,872 Italian residential mortgages YES L&R 32,583
PATRIMONIO UNO CMBS AAA 6,629,408 Italian non-residential mortgages YES L&R 6,454
BBVA CONSUMO CLO AAA 22,574,143 Spanish consumer loans YES L&R 22,411
ENTRY FUNDING CLO BBB- 9,033,287 German business loans NO L&R 7,559
CM-CIC COVERED AAA 5,000,000 French residential mortgages YES AFS 5,235
AYT CAJAS COVERED AAA 70,000,000 Spanish residential mortgages YES HTM 68,276
CEDULAS COVERED AAA 50,000,000 Spanish residential mortgages YES HTM 49,035
Legend:MBS = Mortgage-Backed SecurityCMBS = Commercial Mortgage-Backed SecurityCLO = Collateralized Loan ObbligationCOVERED = Covered BondL&R = Loans & ReceivablesAFS = Financial assets available for saleHTM = Financial assets held to maturity
Spot and forward transactions on foreign exchange markets were mainly entered into with the aim of optimising proprietary risk arising in relation to the buying and selling of foreign currencies to and from customers. A minority of these transactions were entered into by subsidiary Fideuram Bank Luxembourg, which executes hedging transactions for institutional customers (Group Funds). Exchange rate risk is mitigated by the practice of funding in the same currency as the assets, while the residual exposures are included in the trading book, where exchange rate risk is measured in terms of Value at Risk.The financial instruments concerned were mainly spot and forward exchange rate transactions, forex swaps and currency options.

172 Annua l Repor t 2009
1.2.3 EXCHANGE RATE RISK
Quantitative information
1. Distribution by currency of denomination of assets and liabilities and derivatives
Currency
US dollar Sterling Yen Australiandollar
Swiss franc
Othercurrencies
A. Financial assets 40,700 970 11,575 2 57,354 92,313
A.1 Debt securities - - - - - -
A.2 Equities - - - - - -
A.3 Due from banks 37,339 887 10,368 2 56,202 92,179
A.4 Loans to customers 3,361 83 1,207 - 1,152 134
A.5 Other financial assets - - - - - -
B. Other assets 1,551 246 13 - 969 235
C. Financial liabilities 304,121 12,418 80,894 27,910 28,920 39,746
C.1 Due to banks 94,176 67 20,698 23 48 2,217
C.2 Due to customers 209,945 12,351 60,196 27,887 28,872 37,529
C.3 Debt securities - - - - - -
C.4 Other financial liabilities - - - - - -
D. Other liabilities 215 173 - - 4,053 204
E. Financial derivatives 2,694,826 1,008,545 193,772 78,477 130,342 459,880
- Options - 907 - - - 11,197
+ Long positions - 907 - - - 5,564
+ Short positions - - - - - 5,633
- Other derivatives 2,694,826 1,007,638 193,772 78,477 130,342 448,683
+ Long positions 1,484,194 522,297 126,752 45,766 50,543 194,034
+ Short positions 1,210,632 485,341 67,020 32,711 79,799 254,649
Total assets 1,526,445 524,420 138,340 45,768 108,866 292,146
Total liabilities 1,514,968 497,932 147,914 60,621 112,772 300,232
Balance (+/-) 11,477 26,488 (9,574) (14,853) (3,906) (8,086)
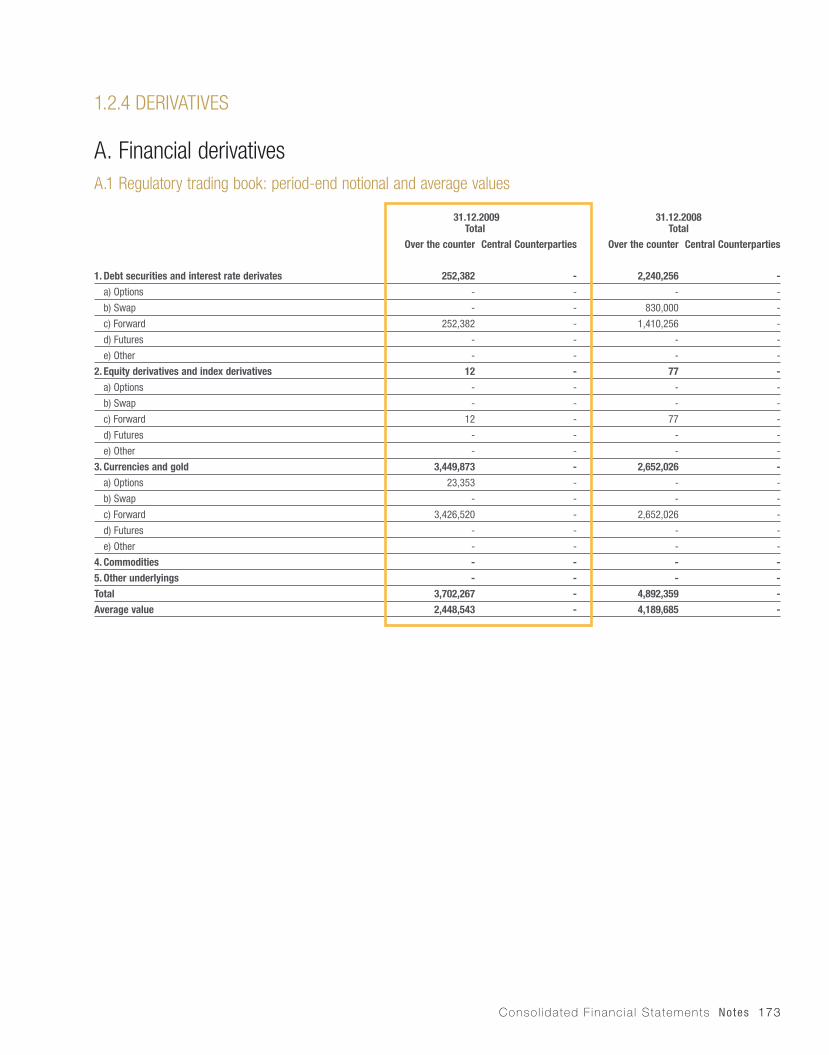
Consol idated F inancia l Statements Notes 173
1.2.4 DERIVATIVES
A. Financial derivativesA.1 Regulatory trading book: period-end notional and average values
31.12.2009 Total
31.12.2008 Total
Over the counter Central Counterparties Over the counter Central Counterparties
1. Debt securities and interest rate derivates 252,382 - 2,240,256 -
a) Options - - - -
b) Swap - - 830,000 -
c) Forward 252,382 - 1,410,256 -
d) Futures - - - -
e) Other - - - -
2. Equity derivatives and index derivatives 12 - 77 -
a) Options - - - -
b) Swap - - - -
c) Forward 12 - 77 -
d) Futures - - - -
e) Other - - - -
3. Currencies and gold 3,449,873 - 2,652,026 -
a) Options 23,353 - - -
b) Swap - - - -
c) Forward 3,426,520 - 2,652,026 -
d) Futures - - - -
e) Other - - - -
4. Commodities - - - -
5. Other underlyings - - - -
Total 3,702,267 - 4,892,359 -
Average value 2,448,543 - 4,189,685 -
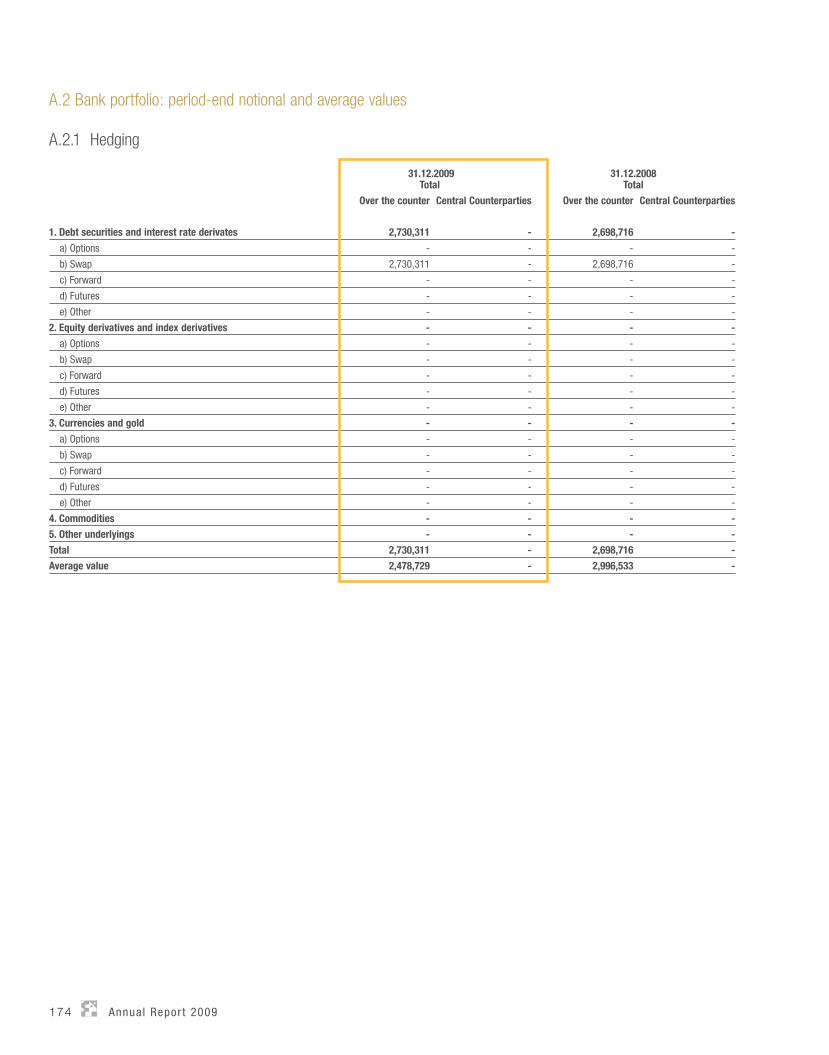
174 Annua l Repor t 2009
A.2 Bank portfolio: period-end notional and average values
A.2.1 Hedging
31.12.2009 Total
31.12.2008 Total
Over the counter Central Counterparties Over the counter Central Counterparties
1. Debt securities and interest rate derivates 2,730,311 - 2,698,716 -
a) Options - - - -
b) Swap 2,730,311 - 2,698,716 -
c) Forward - - - -
d) Futures - - - -
e) Other - - - -
2. Equity derivatives and index derivatives - - - -
a) Options - - - -
b) Swap - - - -
c) Forward - - - -
d) Futures - - - -
e) Other - - - -
3. Currencies and gold - - - -
a) Options - - - -
b) Swap - - - -
c) Forward - - - -
d) Futures - - - -
e) Other - - - -
4. Commodities - - - -
5. Other underlyings - - - -
Total 2,730,311 - 2,698,716 -
Average value 2,478,729 - 2,996,533 -
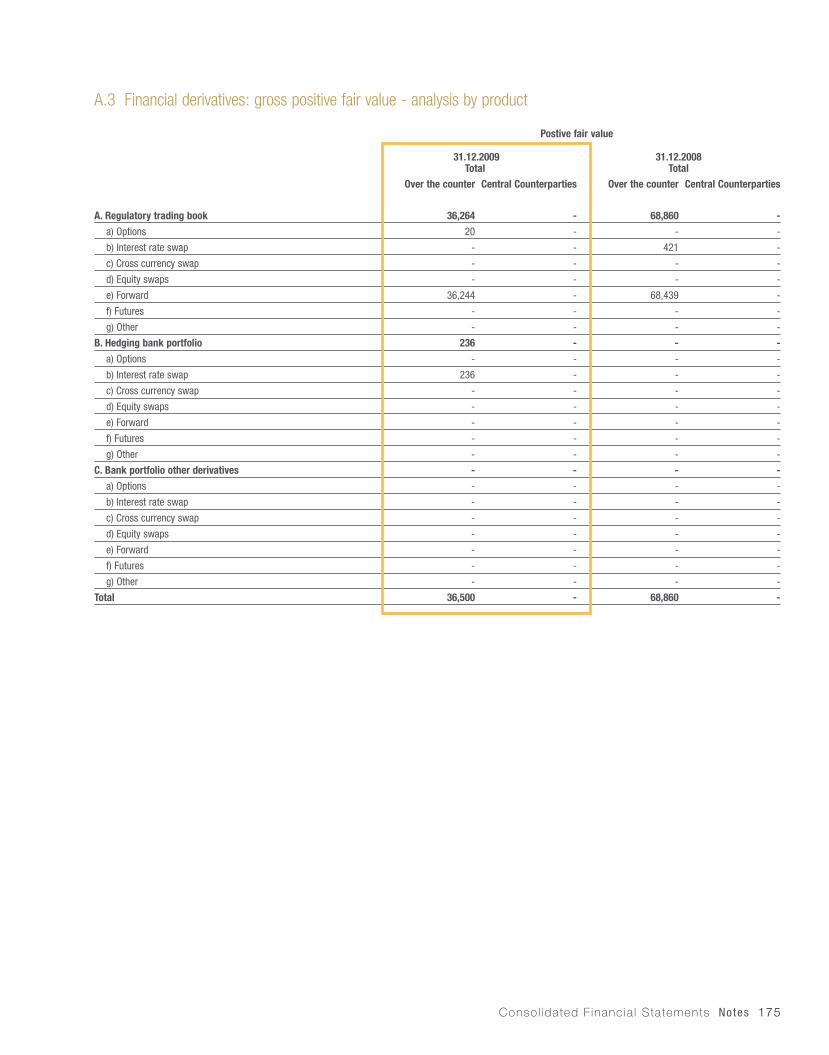
Consol idated F inancia l Statements Notes 175
A.3 Financial derivatives: gross positive fair value - analysis by product
Postive fair value
31.12.2009 Total
31.12.2008 Total
Over the counter Central Counterparties Over the counter Central Counterparties
A. Regulatory trading book 36,264 - 68,860 -
a) Options 20 - - -
b) Interest rate swap - - 421 -
c) Cross currency swap - - - -
d) Equity swaps - - - -
e) Forward 36,244 - 68,439 -
f) Futures - - - -
g) Other - - - -
B. Hedging bank portfolio 236 - - -
a) Options - - - -
b) Interest rate swap 236 - - -
c) Cross currency swap - - - -
d) Equity swaps - - - -
e) Forward - - - -
f) Futures - - - -
g) Other - - - -
C. Bank portfolio other derivatives - - - -
a) Options - - - -
b) Interest rate swap - - - -
c) Cross currency swap - - - -
d) Equity swaps - - - -
e) Forward - - - -
f) Futures - - - -
g) Other - - - -
Total 36,500 - 68,860 -
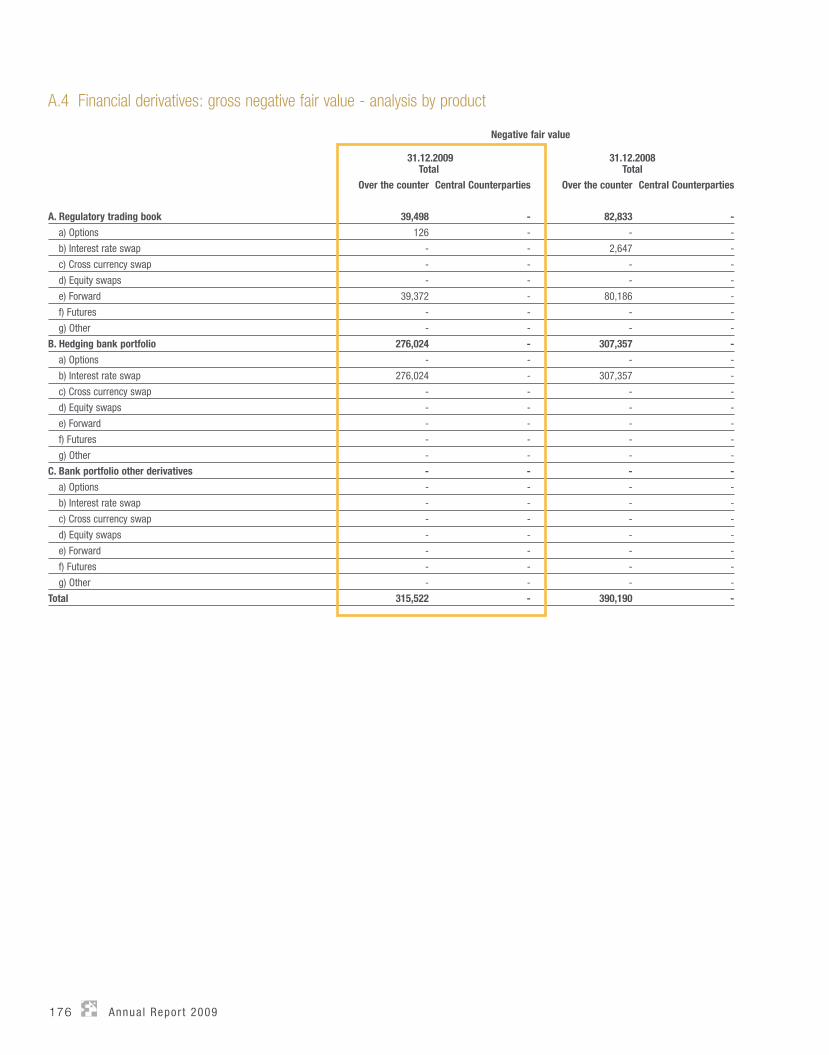
176 Annua l Repor t 2009
A.4 Financial derivatives: gross negative fair value - analysis by product
Negative fair value
31.12.2009 Total
31.12.2008 Total
Over the counter Central Counterparties Over the counter Central Counterparties
A. Regulatory trading book 39,498 - 82,833 -
a) Options 126 - - -
b) Interest rate swap - - 2,647 -
c) Cross currency swap - - - -
d) Equity swaps - - - -
e) Forward 39,372 - 80,186 -
f) Futures - - - -
g) Other - - - -
B. Hedging bank portfolio 276,024 - 307,357 -
a) Options - - - -
b) Interest rate swap 276,024 - 307,357 -
c) Cross currency swap - - - -
d) Equity swaps - - - -
e) Forward - - - -
f) Futures - - - -
g) Other - - - -
C. Bank portfolio other derivatives - - - -
a) Options - - - -
b) Interest rate swap - - - -
c) Cross currency swap - - - -
d) Equity swaps - - - -
e) Forward - - - -
f) Futures - - - -
g) Other - - - -
Total 315,522 - 390,190 -
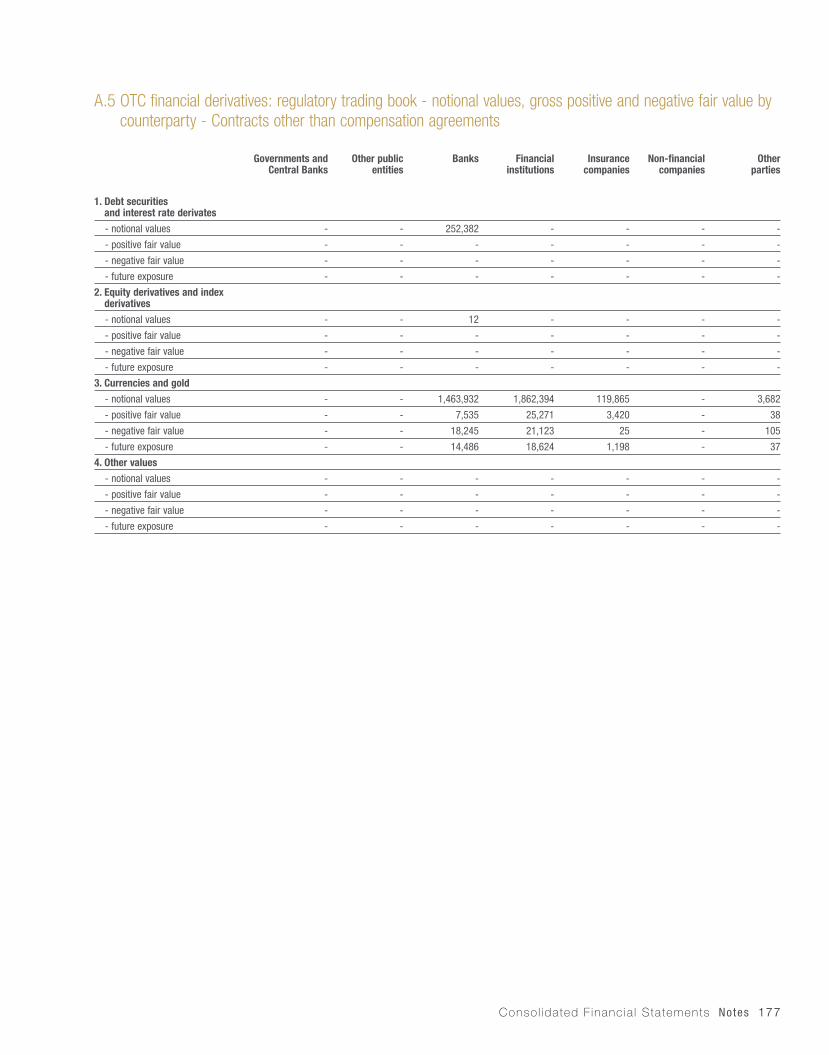
Consol idated F inancia l Statements Notes 177
A.5 OTC financial derivatives: regulatory trading book - notional values, gross positive and negative fair value by counterparty - Contracts other than compensation agreements
Governments and Central Banks
Other public entities
Banks Financial institutions
Insurance companies
Non-financial companies
Otherparties
1. Debt securitiesand interest rate derivates
- notional values - - 252,382 - - - -
- positive fair value - - - - - - -
- negative fair value - - - - - - -
- future exposure - - - - - - -
2. Equity derivatives and index derivatives
- notional values - - 12 - - - -
- positive fair value - - - - - - -
- negative fair value - - - - - - -
- future exposure - - - - - - -
3. Currencies and gold
- notional values - - 1,463,932 1,862,394 119,865 - 3,682
- positive fair value - - 7,535 25,271 3,420 - 38
- negative fair value - - 18,245 21,123 25 - 105
- future exposure - - 14,486 18,624 1,198 - 37
4. Other values
- notional values - - - - - - -
- positive fair value - - - - - - -
- negative fair value - - - - - - -
- future exposure - - - - - - -
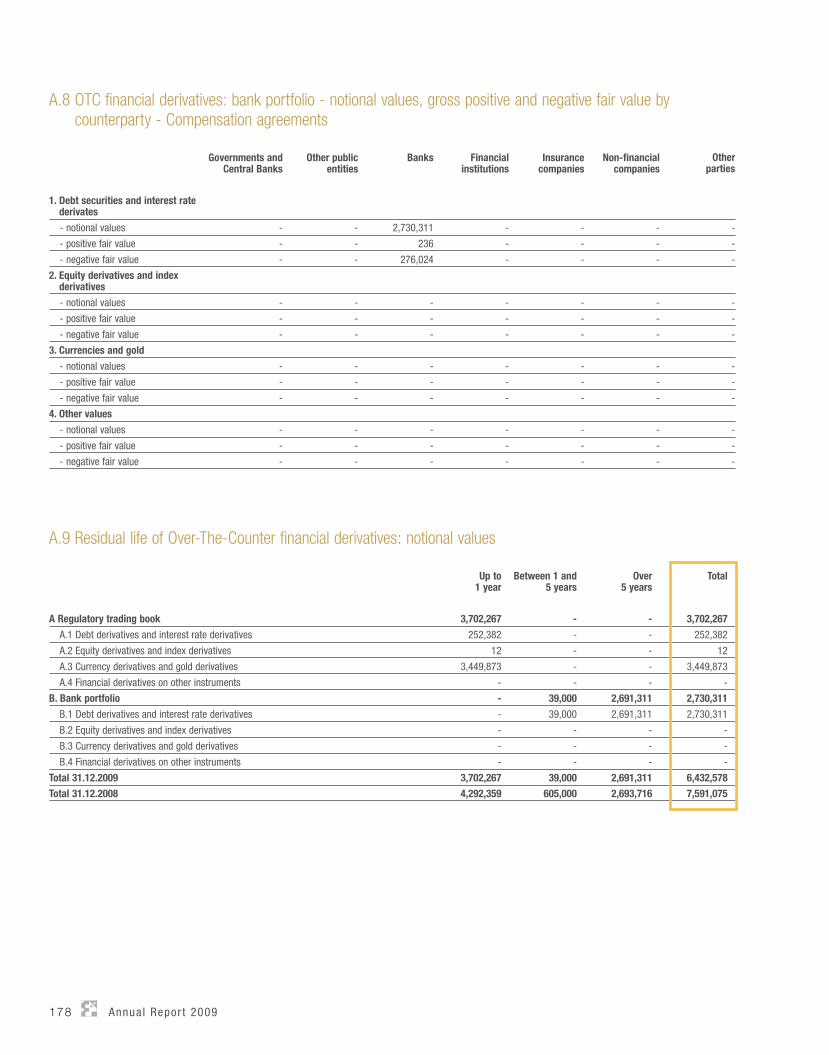
178 Annua l Repor t 2009
A.9 Residual life of Over-The-Counter financial derivatives: notional values
Up to1 year
Between 1 and 5 years
Over5 years
Total
A Regulatory trading book 3,702,267 - - 3,702,267
A.1 Debt derivatives and interest rate derivatives 252,382 - - 252,382
A.2 Equity derivatives and index derivatives 12 - - 12
A.3 Currency derivatives and gold derivatives 3,449,873 - - 3,449,873
A.4 Financial derivatives on other instruments - - - -
B. Bank portfolio - 39,000 2,691,311 2,730,311
B.1 Debt derivatives and interest rate derivatives - 39,000 2,691,311 2,730,311
B.2 Equity derivatives and index derivatives - - - -
B.3 Currency derivatives and gold derivatives - - - -
B.4 Financial derivatives on other instruments - - - -
Total 31.12.2009 3,702,267 39,000 2,691,311 6,432,578
Total 31.12.2008 4,292,359 605,000 2,693,716 7,591,075
A.8 OTC financial derivatives: bank portfolio - notional values, gross positive and negative fair value bycounterparty - Compensation agreements
Governments and
Central BanksOther public
entitiesBanks Financial
institutionsInsurance
companiesNon-financial
companiesOther
parties
1. Debt securities and interest rate derivates
- notional values - - 2,730,311 - - - -
- positive fair value - - 236 - - - -
- negative fair value - - 276,024 - - - -
2. Equity derivatives and index derivatives
- notional values - - - - - - -
- positive fair value - - - - - - -
- negative fair value - - - - - - -
3. Currencies and gold
- notional values - - - - - - -
- positive fair value - - - - - - -
- negative fair value - - - - - - -
4. Other values
- notional values - - - - - - -
- positive fair value - - - - - - -
- negative fair value - - - - - - -
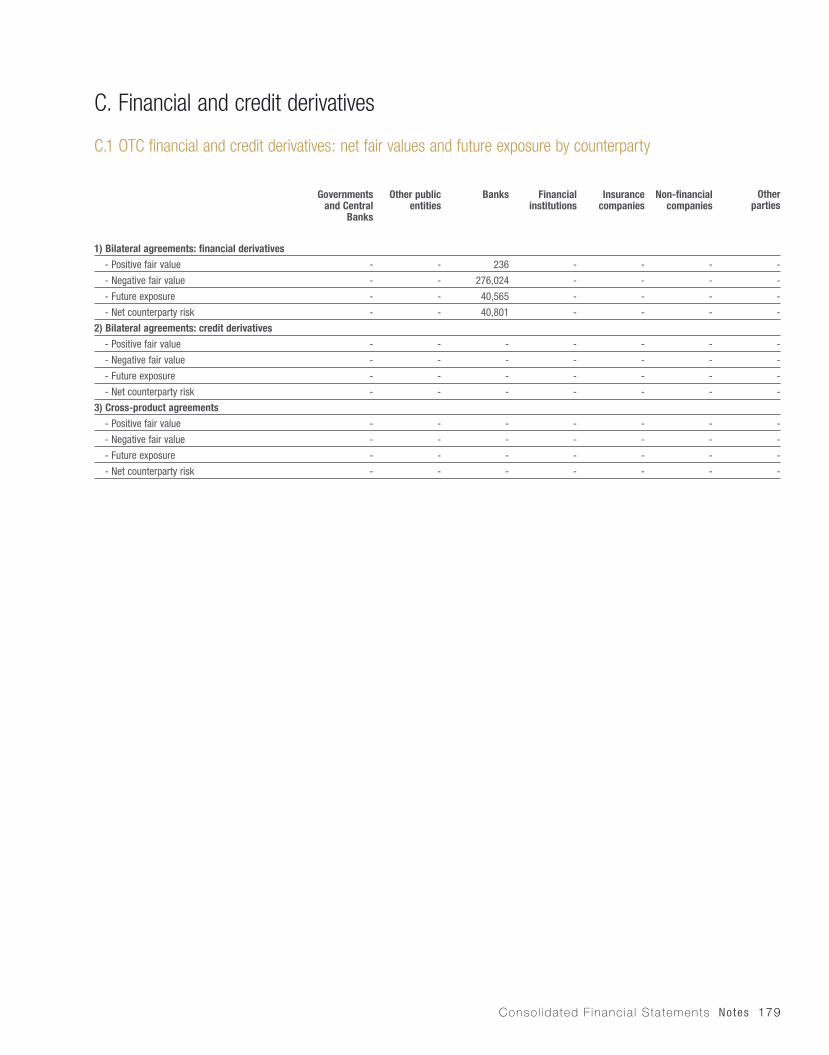
Consol idated F inancia l Statements Notes 179
C. Financial and credit derivatives
C.1 OTC financial and credit derivatives: net fair values and future exposure by counterparty
Governments and Central
Banks
Other public entities
Banks Financial institutions
Insurance companies
Non-financial companies
Otherparties
1) Bilateral agreements: financial derivatives
- Positive fair value - - 236 - - - -
- Negative fair value - - 276,024 - - - -
- Future exposure - - 40,565 - - - -
- Net counterparty risk - - 40,801 - - - -
2) Bilateral agreements: credit derivatives
- Positive fair value - - - - - - -
- Negative fair value - - - - - - -
- Future exposure - - - - - - -
- Net counterparty risk - - - - - - -
3) Cross-product agreements
- Positive fair value - - - - - - -
- Negative fair value - - - - - - -
- Future exposure - - - - - - -
- Net counterparty risk - - - - - - -

180 Annua l Repor t 2009
1.3 LIQUIDITY RISK
Qualitative information
The Banca Fideuram Group benefits from strong structural liquidity, resulting from liquidity from customer deposits and traditionally modest customer lending, the management of which has been developed and consolidated both through operational reorganisation, with the centralisation of the liquidity of our subsidiaries in Banca Fideuram, and through the implementation of operating strategies governed by our risk management regulations.
Analysis of the consolidated financial statements shows the central position of customer deposits in liabilities, which totalled €7.7bn at year end and principally comprised deposits that were highly stable over time. More volatile markets, more exposed to crisis of confidence situations, such as the money market (through interbank loans), play a more limited role in funding the Group’s assets. Liquidity from liabilities is for the most part invested in a bond portfolio, selected paying considerable attention to liquidity risk so that a substantial proportion consists of eligible and readily-negotiable securities. This in particular involves splitting the investments into two main portfolios - a liquidity portfolio and an investment portfolio - in accordance with our Investment Policy, with the aim of always having securities that offer immediate liquidity in the portfolio. The minimum liquidity portfolio level was calculated cautiously, taking the volatility of customer deposits into account.
In accordance with parent company Intesa Sanpaolo’s guidelines, the Group has, moreover, adopted a liquidity monitoring system based on the quantification of inflows and outflows, using appropriate cautious estimates for those balance sheet items which behave differently from contractual items.
Following the implementation of the Intesa Sanpaolo Group’s liquidity risk management guidelines, the Banca Fideuram Group has centred its attention and monitoring both on indicators which quantify short-term risk and on structural liquidity indicators, aiming to monitor and manage mismatch risk regarding the medium-to-long term maturities of assets and liabilities. The short-term liquidity policy amongst other things requires the liquidity balance, calculated as the difference between inflows (or readily-available funds) and outflows, to be positive for short-term maturities (less than 18 months) at all times. The liquidity balance sheet is formed taking into
account the maturities of certain flows, appropriate valuations of readily-liquid assets (including debt securities which could be made eligible irrespective of their contractual maturities) and the quantification of uncertain flows based on an estimate of their behavioural coefficients. The inflows and outflows considered for a time horizon of less than one month produced a positive liquidity balance of €1.8bn, and there were no critical cumulative liquidity gap situations with respect to minimum liquidity thresholds for subsequent periods, with the 18-month cumulative balance at year end being positive to the tune of €1,9bn.
Structural liquidity is analysed using an indicator based on the regulatory requirement concerning the financial statement item regarding the conversion of maturities (Bank of Italy Regulation 2), adjusted in accordance with more stringent concepts regarding the liquidity of securities, which sets internal limits on the conversion of maturities with the aim of preventing medium-long term loan transactions from giving rise to excessive imbalances requiring short-term financing. The value of this indicator was over €0.9bn at the end of December.
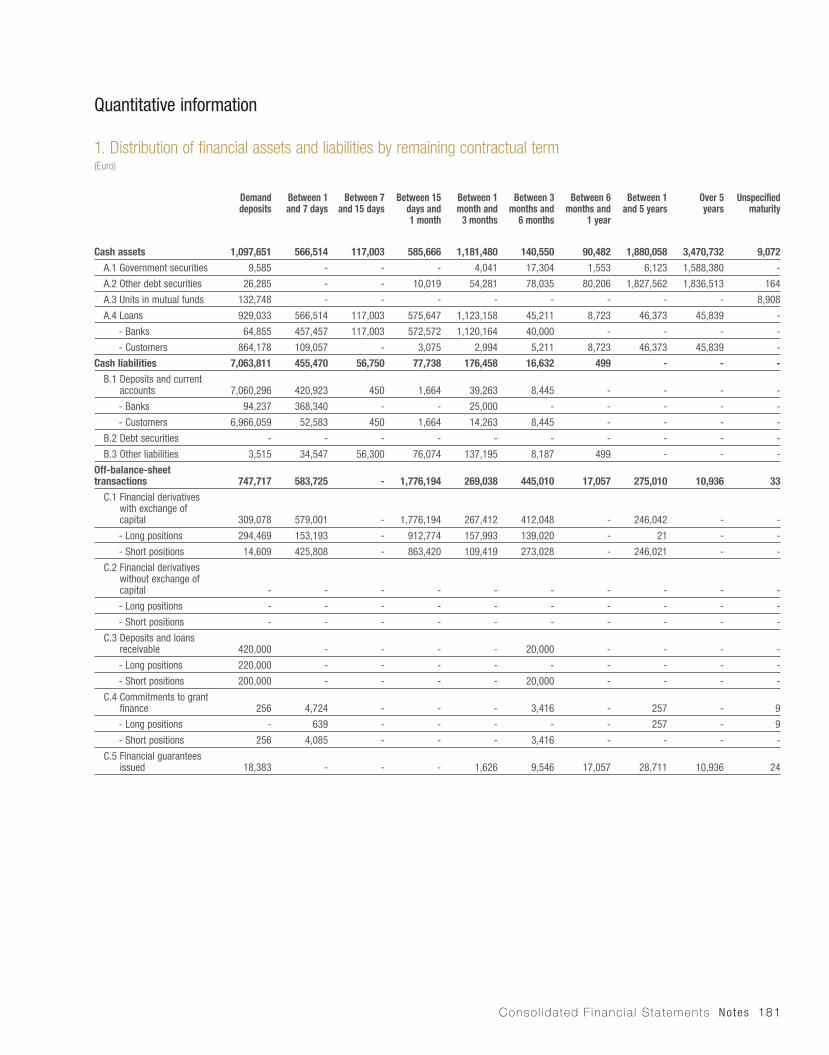
Consol idated F inancia l Statements Notes 181
Quantitative information
1. Distribution of financial assets and liabilities by remaining contractual term (Euro)
Demand deposits
Between 1 and 7 days
Between 7 and 15 days
Between 15 days and1 month
Between 1 month and
3 months
Between 3 months and
6 months
Between 6 months and
1 year
Between 1 and 5 years
Over 5years
Unspecified maturity
Cash assets 1,097,651 566,514 117,003 585,666 1,181,480 140,550 90,482 1,880,058 3,470,732 9,072
A.1 Government securities 9,585 - - - 4,041 17,304 1,553 6,123 1,588,380 -
A.2 Other debt securities 26,285 - - 10,019 54,281 78,035 80,206 1,827,562 1,836,513 164
A.3 Units in mutual funds 132,748 - - - - - - - - 8,908
A.4 Loans 929,033 566,514 117,003 575,647 1,123,158 45,211 8,723 46,373 45,839 -
- Banks 64,855 457,457 117,003 572,572 1,120,164 40,000 - - - -
- Customers 864,178 109,057 - 3,075 2,994 5,211 8,723 46,373 45,839 -
Cash liabilities 7,063,811 455,470 56,750 77,738 176,458 16,632 499 - - -
B.1 Deposits and current accounts 7,060,296 420,923 450 1,664 39,263 8,445 - - - -
- Banks 94,237 368,340 - - 25,000 - - - - -
- Customers 6,966,059 52,583 450 1,664 14,263 8,445 - - - -
B.2 Debt securities - - - - - - - - - -
B.3 Other liabilities 3,515 34,547 56,300 76,074 137,195 8,187 499 - - -
Off-balance-sheet transactions 747,717 583,725 - 1,776,194 269,038 445,010 17,057 275,010 10,936 33
C.1 Financial derivatives with exchange of capital 309,078 579,001 - 1,776,194 267,412 412,048 - 246,042 - -
- Long positions 294,469 153,193 - 912,774 157,993 139,020 - 21 - -
- Short positions 14,609 425,808 - 863,420 109,419 273,028 - 246,021 - -
C.2 Financial derivatives without exchange of capital - - - - - - - - - -
- Long positions - - - - - - - - - -
- Short positions - - - - - - - - - -
C.3 Deposits and loans receivable 420,000 - - - - 20,000 - - - -
- Long positions 220,000 - - - - - - - - -
- Short positions 200,000 - - - - 20,000 - - - -
C.4 Commitments to grant finance 256 4,724 - - - 3,416 - 257 - 9
- Long positions - 639 - - - - - 257 - 9
- Short positions 256 4,085 - - - 3,416 - - - -
C.5 Financial guarantees issued 18,383 - - - 1,626 9,546 17,057 28,711 10,936 24
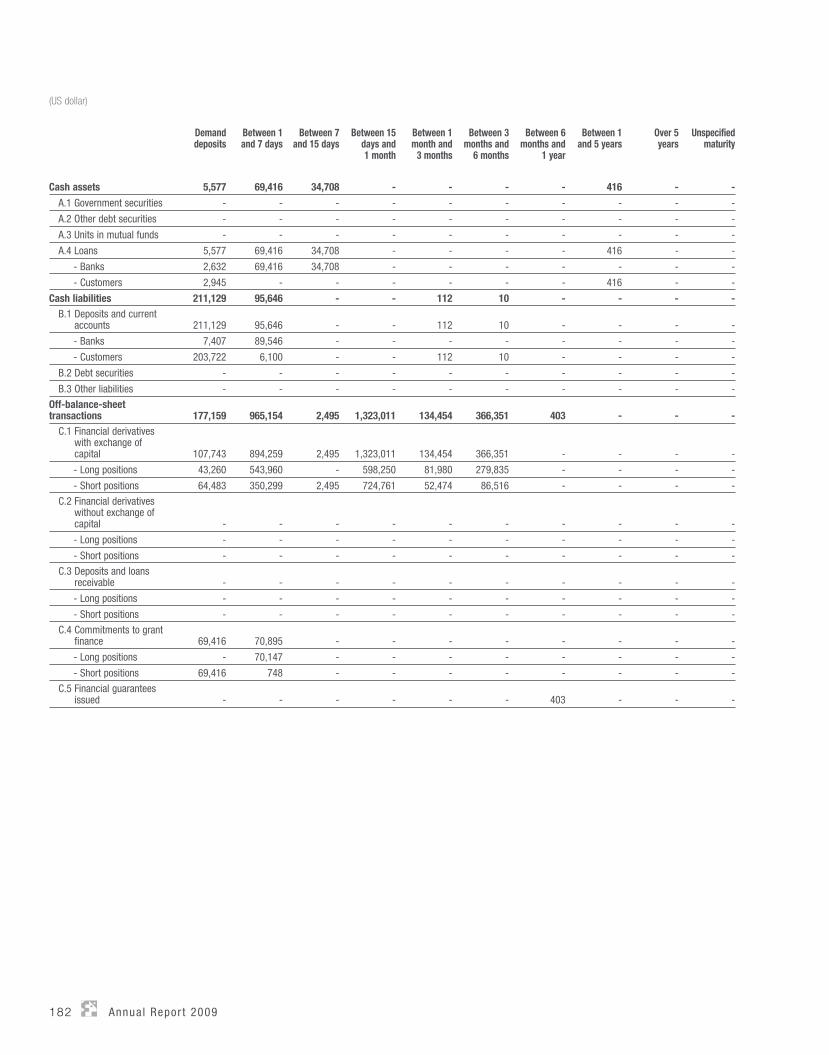
182 Annua l Repor t 2009
(US dollar)
Demand deposits
Between 1 and 7 days
Between 7 and 15 days
Between 15 days and1 month
Between 1 month and
3 months
Between 3 months and
6 months
Between 6 months and
1 year
Between 1 and 5 years
Over 5years
Unspecified maturity
Cash assets 5,577 69,416 34,708 - - - - 416 - -
A.1 Government securities - - - - - - - - - -
A.2 Other debt securities - - - - - - - - - -
A.3 Units in mutual funds - - - - - - - - - -
A.4 Loans 5,577 69,416 34,708 - - - - 416 - -
- Banks 2,632 69,416 34,708 - - - - - - -
- Customers 2,945 - - - - - - 416 - -
Cash liabilities 211,129 95,646 - - 112 10 - - - - B.1 Deposits and current
accounts 211,129 95,646 - - 112 10 - - - -
- Banks 7,407 89,546 - - - - - - - -
- Customers 203,722 6,100 - - 112 10 - - - -
B.2 Debt securities - - - - - - - - - -
B.3 Other liabilities - - - - - - - - - -
Off-balance-sheet transactions 177,159 965,154 2,495 1,323,011 134,454 366,351 403 - - - C.1 Financial derivatives
with exchange of capital 107,743 894,259 2,495 1,323,011 134,454 366,351 - - - -
- Long positions 43,260 543,960 - 598,250 81,980 279,835 - - - -
- Short positions 64,483 350,299 2,495 724,761 52,474 86,516 - - - -
C.2 Financial derivatives without exchange of capital - - - - - - - - - -
- Long positions - - - - - - - - - -
- Short positions - - - - - - - - - -
C.3 Deposits and loans receivable - - - - - - - - - -
- Long positions - - - - - - - - - -
- Short positions - - - - - - - - - -
C.4 Commitments to grant finance 69,416 70,895 - - - - - - - -
- Long positions - 70,147 - - - - - - - -
- Short positions 69,416 748 - - - - - - - -
C.5 Financial guarantees issued - - - - - - 403 - - -
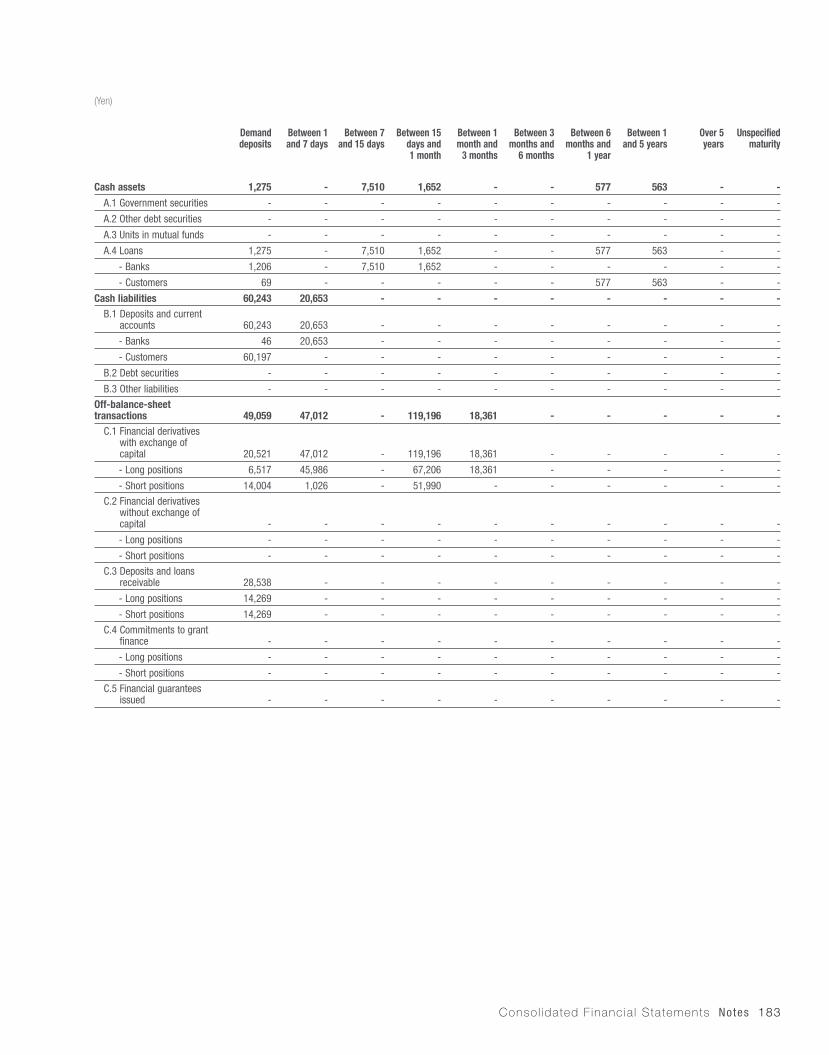
Consol idated F inancia l Statements Notes 183
(Yen)
Demand deposits
Between 1 and 7 days
Between 7 and 15 days
Between 15 days and1 month
Between 1 month and
3 months
Between 3 months and
6 months
Between 6 months and
1 year
Between 1 and 5 years
Over 5years
Unspecified maturity
Cash assets 1,275 - 7,510 1,652 - - 577 563 - -
A.1 Government securities - - - - - - - - - -
A.2 Other debt securities - - - - - - - - - -
A.3 Units in mutual funds - - - - - - - - - -
A.4 Loans 1,275 - 7,510 1,652 - - 577 563 - -
- Banks 1,206 - 7,510 1,652 - - - - - -
- Customers 69 - - - - - 577 563 - -
Cash liabilities 60,243 20,653 - - - - - - - - B.1 Deposits and current
accounts 60,243 20,653 - - - - - - - -
- Banks 46 20,653 - - - - - - - -
- Customers 60,197 - - - - - - - - -
B.2 Debt securities - - - - - - - - - -
B.3 Other liabilities - - - - - - - - - -
Off-balance-sheet transactions 49,059 47,012 - 119,196 18,361 - - - - - C.1 Financial derivatives
with exchange of capital 20,521 47,012 - 119,196 18,361 - - - - -
- Long positions 6,517 45,986 - 67,206 18,361 - - - - -
- Short positions 14,004 1,026 - 51,990 - - - - - -
C.2 Financial derivatives without exchange of capital - - - - - - - - - -
- Long positions - - - - - - - - - -
- Short positions - - - - - - - - - -
C.3 Deposits and loans receivable 28,538 - - - - - - - - -
- Long positions 14,269 - - - - - - - - -
- Short positions 14,269 - - - - - - - - -
C.4 Commitments to grant finance - - - - - - - - - -
- Long positions - - - - - - - - - -
- Short positions - - - - - - - - - -
C.5 Financial guarantees issued - - - - - - - - - -
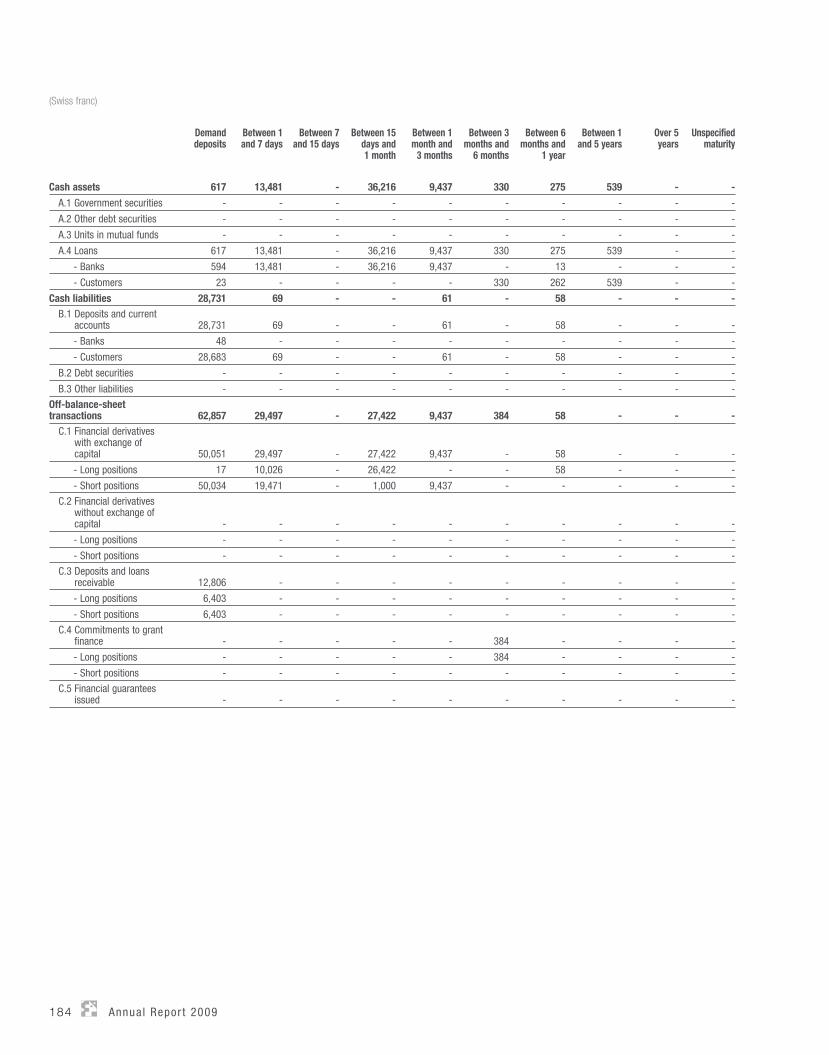
184 Annua l Repor t 2009
(Swiss franc)
Demand deposits
Between 1 and 7 days
Between 7 and 15 days
Between 15 days and1 month
Between 1 month and
3 months
Between 3 months and
6 months
Between 6 months and
1 year
Between 1 and 5 years
Over 5years
Unspecified maturity
Cash assets 617 13,481 - 36,216 9,437 330 275 539 - -
A.1 Government securities - - - - - - - - - -
A.2 Other debt securities - - - - - - - - - -
A.3 Units in mutual funds - - - - - - - - - -
A.4 Loans 617 13,481 - 36,216 9,437 330 275 539 - -
- Banks 594 13,481 - 36,216 9,437 - 13 - - -
- Customers 23 - - - - 330 262 539 - -
Cash liabilities 28,731 69 - - 61 - 58 - - - B.1 Deposits and current
accounts 28,731 69 - - 61 - 58 - - -
- Banks 48 - - - - - - - - -
- Customers 28,683 69 - - 61 - 58 - - -
B.2 Debt securities - - - - - - - - - -
B.3 Other liabilities - - - - - - - - - -
Off-balance-sheet transactions 62,857 29,497 - 27,422 9,437 384 58 - - - C.1 Financial derivatives
with exchange of capital 50,051 29,497 - 27,422 9,437 - 58 - - -
- Long positions 17 10,026 - 26,422 - - 58 - - -
- Short positions 50,034 19,471 - 1,000 9,437 - - - - -
C.2 Financial derivatives without exchange of capital - - - - - - - - - -
- Long positions - - - - - - - - - -
- Short positions - - - - - - - - - -
C.3 Deposits and loans receivable 12,806 - - - - - - - - -
- Long positions 6,403 - - - - - - - - -
- Short positions 6,403 - - - - - - - - -
C.4 Commitments to grant finance - - - - - 384 - - - -
- Long positions - - - - - 384 - - - -
- Short positions - - - - - - - - - -
C.5 Financial guarantees issued - - - - - - - - - -
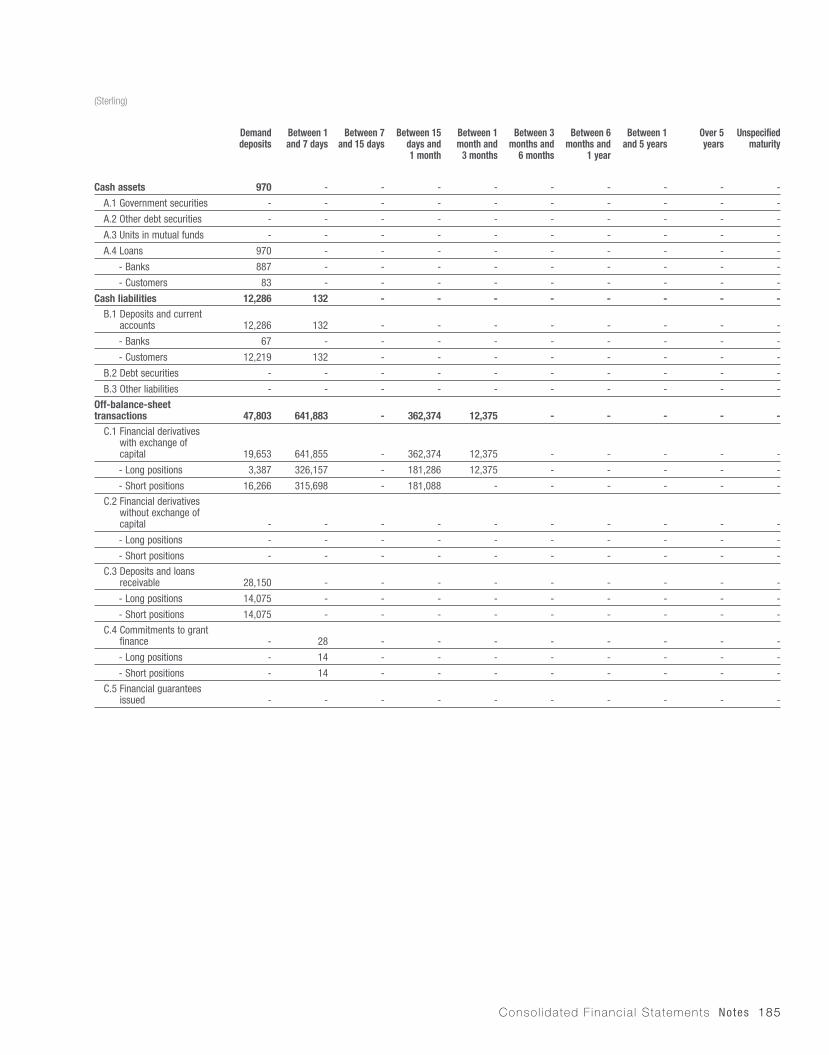
Consol idated F inancia l Statements Notes 185
(Sterling)
Demand deposits
Between 1 and 7 days
Between 7 and 15 days
Between 15 days and1 month
Between 1 month and
3 months
Between 3 months and
6 months
Between 6 months and
1 year
Between 1 and 5 years
Over 5years
Unspecified maturity
Cash assets 970 - - - - - - - - -
A.1 Government securities - - - - - - - - - -
A.2 Other debt securities - - - - - - - - - -
A.3 Units in mutual funds - - - - - - - - - -
A.4 Loans 970 - - - - - - - - -
- Banks 887 - - - - - - - - -
- Customers 83 - - - - - - - - -
Cash liabilities 12,286 132 - - - - - - - - B.1 Deposits and current
accounts 12,286 132 - - - - - - - -
- Banks 67 - - - - - - - - -
- Customers 12,219 132 - - - - - - - -
B.2 Debt securities - - - - - - - - - -
B.3 Other liabilities - - - - - - - - - -
Off-balance-sheet transactions 47,803 641,883 - 362,374 12,375 - - - - - C.1 Financial derivatives
with exchange of capital 19,653 641,855 - 362,374 12,375 - - - - -
- Long positions 3,387 326,157 - 181,286 12,375 - - - - -
- Short positions 16,266 315,698 - 181,088 - - - - - -
C.2 Financial derivatives without exchange of capital - - - - - - - - - -
- Long positions - - - - - - - - - -
- Short positions - - - - - - - - - -
C.3 Deposits and loans receivable 28,150 - - - - - - - - -
- Long positions 14,075 - - - - - - - - -
- Short positions 14,075 - - - - - - - - -
C.4 Commitments to grant finance - 28 - - - - - - - -
- Long positions - 14 - - - - - - - -
- Short positions - 14 - - - - - - - -
C.5 Financial guarantees issued - - - - - - - - - -

186 Annua l Repor t 2009
(Other currencies)
Demand deposits
Between 1 and 7 days
Between 7 and 15 days
Between 15 days and1 month
Between 1 month and
3 months
Between 3 months and
6 months
Between 6 months and
1 year
Between 1 and 5 years
Over 5years
Unspecified maturity
Cash assets 4,444 1,448 50,391 37,481 - - - - - -
A.1 Government securities - - - - - - - - - -
A.2 Other debt securities - - - - - - - - - -
A.3 Units in mutual funds - - - - - - - - - -
A.4 Loans 4,444 1,448 50,391 37,481 - - - - - -
- Banks 4,310 1,448 50,391 37,481 - - - - - -
- Customers 134 - - - - - - - - -
Cash liabilities 65,493 2,065 193 - 11 - 61 - - - B.1 Deposits and current
accounts 65,493 2,065 193 - 11 - 61 - - -
- Banks 777 1,625 - - - - - - - -
- Customers 64,716 440 193 - 11 - 61 - - -
B.2 Debt securities - - - - - - - - - -
B.3 Other liabilities - - - - - - - - - -
Off-balance-sheet transactions 162,716 372,734 12,411 119,215 1,332 531 70 - - - C.1 Financial derivatives
with exchange of capital 134,879 370,295 12,411 119,215 1,332 531 64 - - -
- Long positions 21,268 203,075 12,411 68,049 - - - - - -
- Short positions 113,611 167,220 - 51,166 1,332 531 64 - - -
C.2 Financial derivatives without exchange of capital - - - - - - - - - -
- Long positions - - - - - - - - - -
- Short positions - - - - - - - - - -
C.3 Deposits and loans receivable 25,398 - - - - - - - - -
- Long positions 12,699 - - - - - - - - -
- Short positions 12,699 - - - - - - - - -
C.4 Commitments to grant finance 2,439 2,439 - - - - - - - -
- Long positions - 2,439 - - - - - - - -
- Short positions 2,439 - - - - - - - - -
C.5 Financial guarantees issued - - - - - - 6 - - -

Consol idated F inancia l Statements Notes 187
1.4 OPERATIONAL RISK
Qualitative information
Operational risk is defined as the risk of loss arising from inadequate or dysfunctioning internal processes, human resources or systems, or from external events. Operational risk includes legal risk, which is to say the risk of loss arising from failure to comply with laws or regulations, from contractual or extra-contractual responsibilities or other disputes, but does not include strategic risk or reputational risk.
Organisational structureThe Intesa Sanpaolo Group has drawn up regulations and organisational processes for measuring, managing and controlling operational risk. This sees the Intesa Sanpaolo Group adopting the Advanced Model (internal model) for calculating its capital requirement with respect to operational risk over an initial scope of consolidation which includes banks and companies in its Area Banks Division in particular. Certain companies which currently adopt the Standardised Method will gradually be migrating to Advanced Models from 2010. The Intesa Sanpaolo Group has a centralised operational risk management unit in its Risk Management Department that is responsible for designing, implementing and managing the methodological and organisational framework and for measuring risk profiles, auditing the effectiveness of risk mitigation measures and reporting to company senior management. In accordance with current regulations, the individual companies in the Intesa Sanpaolo Group, including those in the Banca Fideuram Group, are involved in and have been assigned responsibilities for measuring, managing and mitigating risk, identifying the internal units responsible for their related Operational Risk Management processes.
Banca Fideuram has developed its own system of governance for the operational risk management process, within which the Board of Directors is responsible for strategic supervision, ensuring the smooth operation, efficiency and effectiveness of the operational risk management system over time and deciding matters regarding compliance with the criteria for calculating the capital requirement. The Internal Audit Committee is responsible for monitoring the suitability of the operational risk management and control system and ascertaining whether it complies with the related regulatory requirements. The Managing Director is responsible for ensuring the suitability and effectiveness over time of the risk management and control systems and the procedures used for determining the capital requirement. The Internal Audit Department is responsible for periodically auditing the operational risk management system and self-assessment process as well as the information provided to the Company Bodies. The Operational Risk Committee is a consultative body which analyses the reports on the Group’s operational risk profile and if necessary proposes any action required to prevent or mitigate operational risk. The Decentred Operational Risk Management Unit in the Risk Management Department is responsible for organising and maintaining the body of activities provided for by the operational risk management system (collection and structured recording of information on the events which generate
operational losses, scenario analyses and the evaluation of risks associated with the Group’s operating context). The other companies in the Group have also developed suitable Operational Risk Management governance systems in accordance with the parent company’s guidelines.
The Integrated Self-Diagnosis Process, which has been carried out yearly since 2008, supports the following: • The identification, measurement, monitoring and mitigation of
operational risk• The creation of synergies with other control and compliance units
in the company that manage compliance with certain specific laws, regulations and matters (Italian Legislative Decree 231/05 and Law 262/05) or carry out effectiveness tests on the controls on company processes.
Overall, the Self-Diagnosis process showed good operational risk management and contributed to extending the dissemination of a corporate culture focused on continuous operational risk management.The internal model for calculating capital absorption takes all the main sources of quantitative and qualitative information into account (self-diagnosis). The quantitative part is based on analysis of the historical data regarding internal events (monitored, verified and managed by a dedicated IT system) and external events (through the Operational Riskdata eXchange Association). The qualitative part (scenario analyses) is on the other hand focused on the prospective valuation of the risk profile of each unit, and is based on the structured and organised collection of subjective estimates which are provided directly by Management with the aim of measuring the potential financial impact of particularly severe operational risk events.
The capital at risk is therefore considered to be the minimum amount at Group level which would be required to meet the maximum potential loss that could be incurred. The capital at risk is estimated using a Loss Distribution Approach (a statistical model for calculating the Value at Risk of operational losses), which is applied both to the quantitative data and the results of the scenario analysis over a one-year time horizon, with a confidence interval of 99.9%. This method also involves applying a correction factor obtained from qualitative risk analyses of the operating context in order to take the effectiveness of the internal controls in the various different organisational units into account.
Operational risk monitoring is carried out using an integrated reporting system that provides management with the information required to manage and/or mitigate the risks assumed. A structured training programme became fully operational for staff actively involved in the operational risk management and mitigation process in the Banca Fideuram Group to provide continuous support for the risk management process.
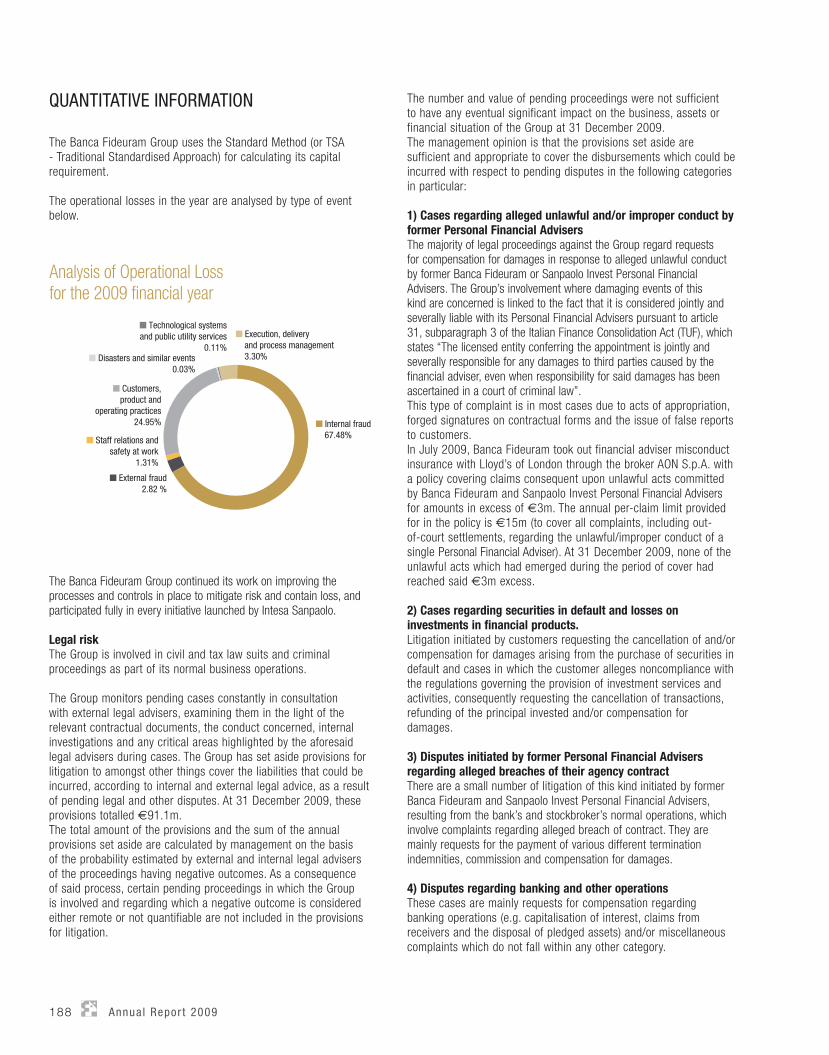
188 Annua l Repor t 2009
The number and value of pending proceedings were not sufficient to have any eventual significant impact on the business, assets or financial situation of the Group at 31 December 2009. The management opinion is that the provisions set aside are sufficient and appropriate to cover the disbursements which could be incurred with respect to pending disputes in the following categories in particular:
1) Cases regarding alleged unlawful and/or improper conduct by former Personal Financial AdvisersThe majority of legal proceedings against the Group regard requests for compensation for damages in response to alleged unlawful conduct by former Banca Fideuram or Sanpaolo Invest Personal Financial Advisers. The Group’s involvement where damaging events of this kind are concerned is linked to the fact that it is considered jointly and severally liable with its Personal Financial Advisers pursuant to article 31, subparagraph 3 of the Italian Finance Consolidation Act (TUF), which states “The licensed entity conferring the appointment is jointly and severally responsible for any damages to third parties caused by the financial adviser, even when responsibility for said damages has been ascertained in a court of criminal law”. This type of complaint is in most cases due to acts of appropriation, forged signatures on contractual forms and the issue of false reports to customers.In July 2009, Banca Fideuram took out financial adviser misconduct insurance with Lloyd’s of London through the broker AON S.p.A. with a policy covering claims consequent upon unlawful acts committed by Banca Fideuram and Sanpaolo Invest Personal Financial Advisers for amounts in excess of €3m. The annual per-claim limit provided for in the policy is €15m (to cover all complaints, including out-of-court settlements, regarding the unlawful/improper conduct of a single Personal Financial Adviser). At 31 December 2009, none of the unlawful acts which had emerged during the period of cover had reached said €3m excess. 2) Cases regarding securities in default and losses on investments in financial products. Litigation initiated by customers requesting the cancellation of and/or compensation for damages arising from the purchase of securities in default and cases in which the customer alleges noncompliance with the regulations governing the provision of investment services and activities, consequently requesting the cancellation of transactions, refunding of the principal invested and/or compensation for damages.
3) Disputes initiated by former Personal Financial Advisers regarding alleged breaches of their agency contractThere are a small number of litigation of this kind initiated by former Banca Fideuram and Sanpaolo Invest Personal Financial Advisers, resulting from the bank’s and stockbroker’s normal operations, which involve complaints regarding alleged breach of contract. They are mainly requests for the payment of various different termination indemnities, commission and compensation for damages.
4) Disputes regarding banking and other operationsThese cases are mainly requests for compensation regarding banking operations (e.g. capitalisation of interest, claims from receivers and the disposal of pledged assets) and/or miscellaneous complaints which do not fall within any other category.
QUANTITATIVE INFORMATION
The Banca Fideuram Group uses the Standard Method (or TSA - Traditional Standardised Approach) for calculating its capital requirement.
The operational losses in the year are analysed by type of event below.
The Banca Fideuram Group continued its work on improving the processes and controls in place to mitigate risk and contain loss, and participated fully in every initiative launched by Intesa Sanpaolo.
Legal riskThe Group is involved in civil and tax law suits and criminal proceedings as part of its normal business operations.
The Group monitors pending cases constantly in consultation with external legal advisers, examining them in the light of the relevant contractual documents, the conduct concerned, internal investigations and any critical areas highlighted by the aforesaid legal advisers during cases. The Group has set aside provisions for litigation to amongst other things cover the liabilities that could be incurred, according to internal and external legal advice, as a result of pending legal and other disputes. At 31 December 2009, these provisions totalled €91.1m. The total amount of the provisions and the sum of the annual provisions set aside are calculated by management on the basis of the probability estimated by external and internal legal advisers of the proceedings having negative outcomes. As a consequence of said process, certain pending proceedings in which the Group is involved and regarding which a negative outcome is considered either remote or not quantifiable are not included in the provisions for litigation.
Analysis of Operational Lossfor the 2009 financial year
■ Internal fraud 67.48%
■ Execution, delivery and process management 3.30%
■ Technological systemsand public utility services
0.11%
■ Customers,product and
operating practices24.95%
■ Staff relations andsafety at work
1.31%
■ Disasters and similar events0.03%
■ External fraud2.82 %
Consol idated F inancia l Statements Notes 189
6) Tax disputesBanca Fideuram received a report from the Latium Regional Tax Police (Polizia Tributaria) concerning the 2003 and 2004 tax years, questioning the tax period adopted by the bank for the tax deduction of the Personal Financial Advisers Network Loyalty Schemes, together with a number of other lesser matters. Following this report, the bank was served a notice of assessment by the competent office of the Italian Inland Revenue regarding Corporate Income Tax (IRPEG) and Regional Business Tax (IRAP) for the year 2003, against which the bank promptly appealed. The hearing before the Provincial Tax Commission on 3 April 2009 found against the bank. The bank filed an appeal in second instance to reverse said current judgement. As a further consequence of the visit by the Tax Police and regarding the same financial statement items as for 2003, the bank received notices of assessment in July of this year regarding IRES corporate income tax and IRAP regional business tax for the 2004 tax year, against which the bank filed an appeal within the required time.The Latium Regional Office of the Italian Inland Revenue subsequently and again with regard to the bonus scheme with the highest value, conducted a specific investigation regarding the 2005 and 2006 tax years. The investigation concluded with a report questioning the tax deduction of the expense over a long-term time horizon in a similar manner as for the prior periods, requiring its deferral to the end of the scheme period.The bank decided to settle the disputes, agreeing to the Latium Regional Office of the Inland Revenue’s objections to avoid a tax dispute over a simple matter of accruals accouting. The Group thus set aside amounts at year-end under the provisions for risks and charges equal to the total penalties and applicable interest required to settle the disputes for all the years in question, from 2003 to 2008, adopting the most appropriate procedures for each year concerned.Lastly, and likewise as a consequence of the report regarding the 2003 and 2004 tax years, the bank was also served a notice of assessment for a smaller amount regarding VAT. The bank is still waiting to present its appeal in this matter to the competent Provincial Tax Commission.
During 2007, following a report prepared by the Latium Regional Tax Police (Polizia Tributaria), the Italian Inland Revenue served Sanpaolo Invest SIM a notice of assessment regarding Corporate Income Tax (IRPEG) and Regional Business Tax (IRAP) for the 2000 tax year. The Rome Provincial Tax Commission largely found in favour of the company’s appeal, with the exception of for one minor amount. The provisions set aside in prior years allow this cost to be met without any charge to the income statement.
5) Disputes regarding supervisory investigationsThis category concerns two pending judgements at the Court of Cassation and Rome Court of Appeal respectively, currently on appeal from the Court of Cassation. These see Sanpaolo Invest opposing the Ministry of the Economy and Finance and the Italian National Commission for Listed Companies and the Stock Exchange (CONSOB), which launched two penalty proceedings following supervisory investigations, the first regarding the years 1992-1997 and the second 2005.In particular:• Sanpaolo Invest and the managers involved contest the imposition
of financial penalties totalling €213,000 in the first case and €296,500 in the second, and more generally the inefficiencies and/or omissions in its management processes alleged by the Supervisory Authority. The CONSOB’s investigations into the years 1992-1997 led to the formulation of a number of objections regarding the alleged inadequacy of the procedures in place with Personal Financial Advisers for the provision of services and, likewise, the alleged inadequacy of the controls on said procedures, failure to notify the Board of Auditors of Personal Financial Advisers irregularities and failure to provide a register of the audits performed. The Rome Court of Appeal found in favour of the defence presented by Sanpaolo Invest and the managers concerned, annulling the penalties. The Court of Cassation overturned the Rome Court of Appeal’s judgment following an appeal by the CONSOB and Italian Ministry of the Economy and Finance, remitting the case to the Rome Court of Appeal, where it is still pending with the hearing set for 20 May 2010. The CONSOB’s 2005 investigation was launched in relation to an audit on the efficiency of the management processes and internal audit system. The penalty proceedings for alleged violations of regulatory provisions, principally regarding internal auditing, led to the imposition of administrative monetary penalties totalling €296,500. Sanpaolo Invest formulated its own conclusions in the course of the proceedings, highlighting the fact that its present procedures comply with the current regulations. An appeal against these penalties at the Rome Court of Appeal was rejected. The company and managers therefore filed an appeal, which is still pending, at the Court of Cassation.
• On 8 October 2009, Banca Fideuram paid an administrative penalty, as jointly responsible, which the Italian Ministry of the Economy and Finance had imposed on the manager of the Rome Area Main Branch. These proceedings regarded a failure to report a financial transaction that took place in 2001 which the investigating authority considered suspicious pursuant to Italian Decree Law 143/1991 converted into Law 197/1991. On 27.09.2004, the bank received a report from the Ravenna Financial Police (Guardia di Finanza) alleging that the bank had failed to report a suspicious transaction which took place in June 2001 and regarding two cash deposits totalling ITL 6.4bn into a current account opened at one of the bank’s branches. The bank requested that the proceedings be terminated, producing rebuttals with which it contested the report and emphasised, among other things, that the deposit came through a relationship established with a Trust Company in the Group. The proceedings were settled with payment of the penalty.
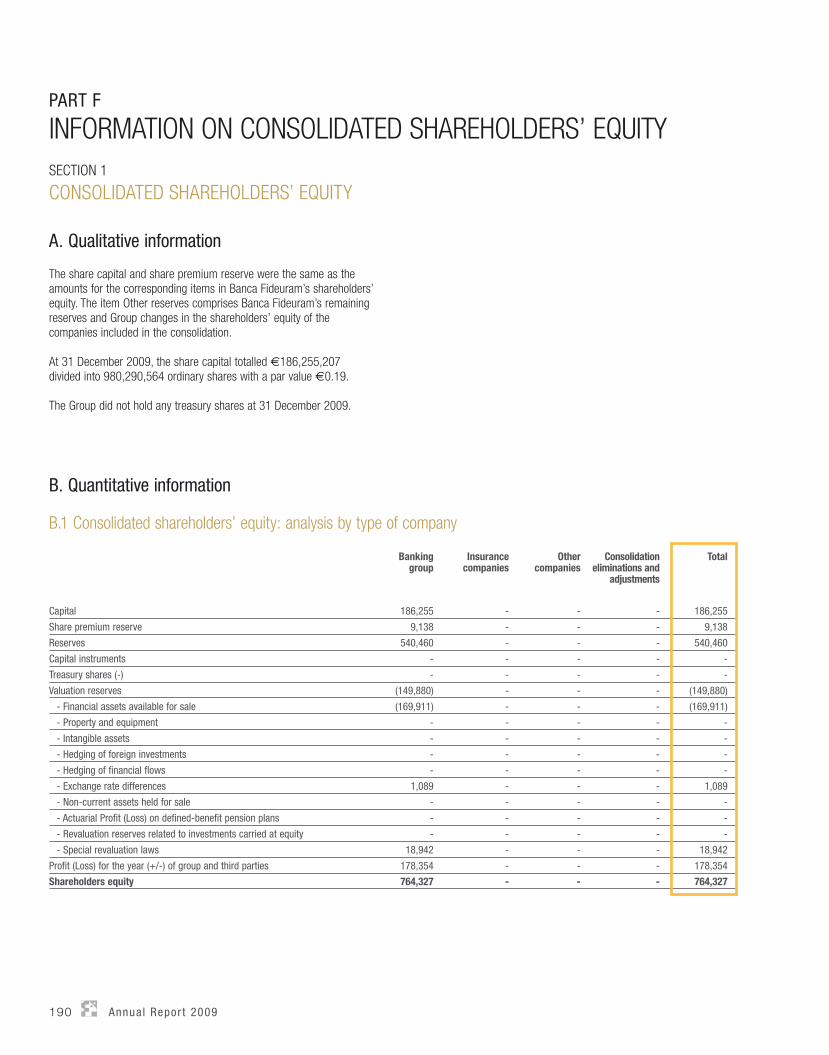
190 Annua l Repor t 2009
SECTION 1
CONSOLIDATED SHAREHOLDERS’ EQUITY
A. Qualitative information
The share capital and share premium reserve were the same as the amounts for the corresponding items in Banca Fideuram’s shareholders’ equity. The item Other reserves comprises Banca Fideuram’s remaining reserves and Group changes in the shareholders’ equity of the companies included in the consolidation.
At 31 December 2009, the share capital totalled €186,255,207divided into 980,290,564 ordinary shares with a par value €0.19.
The Group did not hold any treasury shares at 31 December 2009.
PART F
INFORMATION ON CONSOLIDATED SHAREHOLDERS’ EQUITY
B. Quantitative information
B.1 Consolidated shareholders’ equity: analysis by type of company
Bankinggroup
Insurance companies
Othercompanies
Consolidation eliminations and
adjustments
Total
Capital 186,255 - - - 186,255
Share premium reserve 9,138 - - - 9,138
Reserves 540,460 - - - 540,460
Capital instruments - - - - -
Treasury shares (-) - - - - -
Valuation reserves (149,880) - - - (149,880)
- Financial assets available for sale (169,911) - - - (169,911)
- Property and equipment - - - - -
- Intangible assets - - - - -
- Hedging of foreign investments - - - - -
- Hedging of financial flows - - - - -
- Exchange rate differences 1,089 - - - 1,089
- Non-current assets held for sale - - - - -
- Actuarial Profit (Loss) on defined-benefit pension plans - - - - -
- Revaluation reserves related to investments carried at equity - - - - -
- Special revaluation laws 18,942 - - - 18,942
Profit (Loss) for the year (+/-) of group and third parties 178,354 - - - 178,354
Shareholders equity 764,327 - - - 764,327

Consol idated F inancia l Statements Notes 191
B.2 Valuation reserves for financial assets available for sale: analysis
Bankinggroup
Insurancecompanies
Othercompanies
Consolidation eliminations and adjustments
Total31.12.2009
Positive reserve
Negative reserve
Positive reserve
Negative reserve
Positive reserve
Negative reserve
Positive reserve
Negative reserve
Positive reserve
Negative reserve
1. Debt securities 47,742 (219,779) - - - - - - 47,742 (219,779)
2. Equities 27 - - - - - - - 27 -
3. Units in mutual funds 2,099 - - - - - - - 2,099 -
4. Loans - - - - - - - - - -
Total 31.12.2009 49,868 (219,779) - - - - - - 49,868 (219,779)
Total 31.12.2008 4,719 (334,806) - - - - - - 4,719 (334,806)
B.3 Valuation reserves for financial asset available for sale: changes in the year
Debtsecurities
Equities Units inmutual funds
Loans
1. Opening balance (327,499) 29 (2,617) -
2. Increases 188,201 - 4,716 -
2.1 Increases in fair value 162,888 - 4,716 -
2.2 Reclassifications from negative reserves to the income statement 18,954 - - -
- following impairment - - - -
- following disposal 18,954 - - -
2.3 Other increases 6,359 - - -
3. Decreases 32,739 2 - -
3.1 Reductions in fair value 27,024 2 - -
3.2 Adjustments for impairment losses - - - -
3.3 Reclassifications from positive reservesto the income statement: following disposal 39 - - -
3.4 Other decreases 5,676 - - -
4. Other decreases (172,037) 27 2,099 -
192 Annua l Repor t 2009
PART G
BUSINESS COMBINATION TRANSACTIONS OF COMPANIES OR COMPANY DIVISIONS
Integration of the Banca CR Firenze Personal Financial Adviser NetworkOn 11 May 2009, the Group completed the operation integrating the Banca CR Firenze Personal Financial Adviser Network decided by the Banca Fideuram Board of Directors on 27 January 2009. The company division acquired regarded the agency relationships between Banca CR Firenze and its Personal Financial Advisers, the contractual relationships regarding distribution and sales, the block transfer of the customer banking relationships, a number of lease contracts for Personal Financial Advisers’ offices and certain tangible assets regarding said offices.
This operation involved the following transactions:• The transfer to subsidiary Sanpaolo Invest SIM of the Banca CR
Firenze division handling the activities of its Personal Financial Advisers, through a €284,760 capital increase in kind involving the issue of 2,034 new ordinary shares for a total value of €600,000 (including a share premium component of € 315,240).
• The transfer from Banca CR Firenze to Banca Fideuram, as a Block Transfer in accordance with article 58 of the Italian Banking Consolidation Act, of the banking contractual relationships and contractual relationships with Personal Financial Adviser customers regarding investment services which Sanpaolo Invest is not authorised to provide.
• The subsequent transfer to Banca Fideuram on 26 June of the holding that Banca CR Firenze acquired in Sanpaolo Invest following the transfer, to restore a total controlling interest.
The net amounts paid by Banca Fideuram, on the basis of an independent expert’s valuation, were as follows:• €6.1m for purchasing the Sanpaolo Invest shares from Banca CR
Firenze (including €5.4m deducted from the reserves net of tax in accordance with the Group policy regarding business combinations under common control). These amounts were net of a €3.5m contractual rebate regarding a price adjustment for the reduction in assets under management transferred.
• €1.8m for the block transfer of the contractual relationships (also deducted from the reserves in the amount of €1.2m net of tax).

Consol idated F inancia l Statements Notes 193
Form of remuneration 31.12.2009
(€k)
Short-term benefits (*) 7,289
Post-employment benefits (**) 178
Other long-term benefits -
Employment termination indemnity -
Payment in shares -
Other remuneration (***) 314
Total remuneration paid to senior managers with strategic responsibilities 7,781
(*) Includes the fixed and variable remuneration of Directors since they are considered comparable to the payroll costs and social security contributions borne by the Group for employees.
(**) Includes the Group contribution to the pension funds and employment termination indemnities calculated in accordance with the law and company regulations.(***) Regards remuneration paid to members of the Boards of Auditors and Supervisory Body.
PART H
TRANSACTIONS WITH RELATED PARTIES
1. Information on remuneration of senior managers with strategic responsibilities
194 Annua l Repor t 2009
under common control). These amounts were net of a €3.5m contractual rebate regarding a price adjustment for the reduction in assets under management transferred.
• €1.8m for the block transfer of the contractual relationships (also deducted from the reserves in the amount of €1.2m net of tax).
On 12 May 2009, the Banca Fideuram Board of Directors authorised the subscription of sixteen bonds issued by subsidiary Euro-Trésorerie S.A. with a total nominal value of €414m and maturities between June 2010 and November 2014. On 21 July 2009, the Board consequently approved a change to a line of credit in place for the subscription of bonds, forming part of the loans granted to Euro-Trésorerie, to align it with the total nominal value of the bonds subscribed by the bank. Committed to improving wherever possible the production and operating structure serving the Group’s distribution of investment services and financial, insurance and pension products, the Banca Fideuram Board of Directors’ Meeting of 21 July 2009 approved the adoption of a new distribution model in which Banca Fideuram plays the role of main distributor commissioned by our distribution product companies. Banca Fideuram will make use of the work of Sanpaolo Invest SIM for these activities, with the latter acting as sub-distributor following the prior agreement of the product companies. Sanpaolo Invest SIM will act exclusively on behalf of Banca Fideuram in accordance with a vertical integration model of the product and service distribution processes which will initially be applied to our relations with the product companies in the Banca Fideuram Group and subsequently be extended to our relations with third-party companies as well. The contracts implementing the new distribution model have, moreover, been drafted taking the opportunity to more effectively identify and govern those activities closely connected with and which are instrumental to the provision of said distribution and/or sub-distribution service as well as to the business relations already in place between the companies in the Banca Fideuram Group. The payments under these agreements were determined following criteria of mutually beneficial terms for both parties.
The transfer of Banca Fideuram’s depositary bank activities to Intesa Sanpaolo Servizi Transazionali S.p.A. (ISST), a company wholly owned by Intesa Sanpaolo, was completed on 14 December 2009. Banca Fideuram also entered into a ten-year agreement with ISST on said date to pay monetary compensation for any deviations from the commission projections in the report pursuant to article 2343 ter of the Italian Civil Code by independent expert Rothschild S.p.A., which is to say any early termination of the commission flow connected with the related depositary bank business.
This operation, which was approved by the Banca Fideuram Board of Directors on 27 January 2009, was completed through the following transactions:• The transfer by Banca Fideuram to ISST (with a capital increase
for the transferring company) of the company division responsible for its depositary bank business, comprising the Fideuram Funds and Eurizon Funds current account assets and liabilities and the service agreements in force with EurizonVita and Fideuram Investimenti.
• The subsequent sale to Intesa Sanpaolo on 29 December 2009 of the holding that Banca Fideuram had acquired in ISST, to restore Intesa Sanpaolo’s full control of said company.
TRANSACTIONS WITH RELATED PARTIES
Banca Fideuram is wholly owned and controlled directly by Intesa Sanpaolo S.p.A.
On 17 March 2009, the Banca Fideuram Board of Directors authorised the merger of Fideuram France S.A. and Financière Fideuram S.A., subject to a prior reduction in the share capital of Fideuram France to cover its accrued losses. Following the reduction in the share capital of Fideuram France and the purchase of all minority shareholder shares by Financière Fideuram, the latter’s Board of Directors decided on 2 September 2009 to dissolve the company without winding up Fideuram France by merging it with Financière Fideuram. The transaction was completed with the removal of the companies from the Register of Companies on 16 October 2009. The Banca Fideuram Board of Directors’ meeting of 7 April 2009 approved a capital increase for Intesa Sanpaolo Group Services, a consortium joint-stock company established by Intesa Sanpaolo to provide operating, property and logistics services to Group companies, with an injection of €50,000, simultaneously authorising a new contract with Intesa Sanpaolo, which amends the outsourcing contract currently in force, for the provision of the following services:• Purchase of goods and services.• Provision of financial information.• Organisation and security.• Operating services.• Information systems.
The cost of these services totalled €65.6m in 2009.
Subsidiaries Sanpaolo Invest SIM and Fideuram Investimenti SGR also subscribed to the capital increase of Intesa Sanpaolo Group Services, with an injection of €10,000 each.
On 11 May 2009, the operation integrating the Banca CR Firenze Personal Financial Adviser Network decided at the Banca Fideuram Board of Directors’ Meeting of 27 January 2009 was completed. This operation involved the following transactions:• The transfer to subsidiary Sanpaolo Invest SIM of the Banca CR
Firenze division handling the activities of its Personal Financial Advisers to Sanpaolo Invest SIM, through a €284,760 capital increase in kind involving the issue of 2,034 new ordinary shares for a total value of €600,000 (including a share premium component of €315,240).
• The transfer from Banca CR Firenze to Banca Fideuram, as a Block Transfer in accordance with article 58 of the Italian Banking Consolidation Act, of the banking contractual relationships and contractual relationships with Personal Financial Adviser customers regarding investment services which Sanpaolo Invest is not authorised to provide.
• The subsequent transfer to Banca Fideuram on 26 June of the holding that Banca CR Firenze acquired in Sanpaolo Invest following the transfer, to restore a total controlling interest.
The net amounts paid by Banca Fideuram, on the basis of an independent expert’s valuation, were as follows:• €6.1m for purchasing the Sanpaolo Invest shares from Banca CR
Firenze (including €5.4m deducted from the reserves net of tax in accordance with the Group policy regarding business combinations
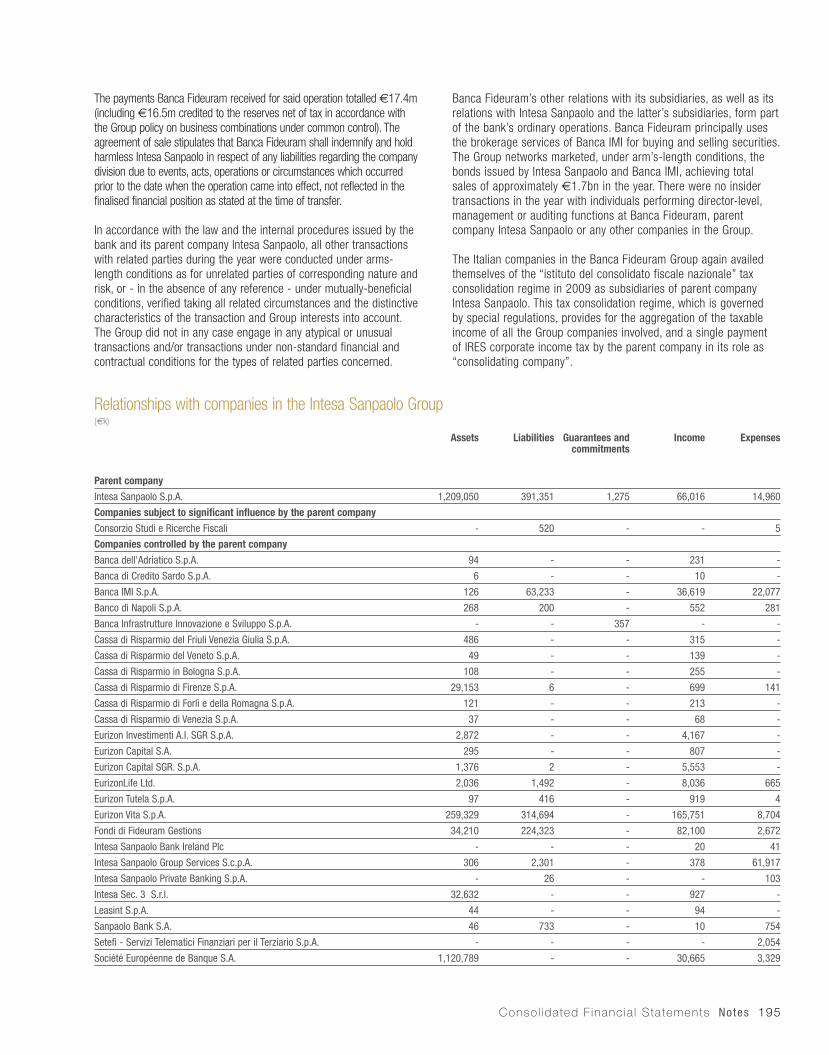
Consol idated F inancia l Statements Notes 195
Relationships with companies in the Intesa Sanpaolo Group(€k)
Assets Liabilities Guarantees and commitments
Income Expenses
Parent company
Intesa Sanpaolo S.p.A. 1,209,050 391,351 1,275 66,016 14,960
Companies subject to significant influence by the parent company
Consorzio Studi e Ricerche Fiscali - 520 - - 5
Companies controlled by the parent company
Banca dell'Adriatico S.p.A. 94 - - 231 -
Banca di Credito Sardo S.p.A. 6 - - 10 -
Banca IMI S.p.A. 126 63,233 - 36,619 22,077
Banco di Napoli S.p.A. 268 200 - 552 281
Banca Infrastrutture Innovazione e Sviluppo S.p.A. - - 357 - -
Cassa di Risparmio del Friuli Venezia Giulia S.p.A. 486 - - 315 -
Cassa di Risparmio del Veneto S.p.A. 49 - - 139 -
Cassa di Risparmio in Bologna S.p.A. 108 - - 255 -
Cassa di Risparmio di Firenze S.p.A. 29,153 6 - 699 141
Cassa di Risparmio di Forlì e della Romagna S.p.A. 121 - - 213 -
Cassa di Risparmio di Venezia S.p.A. 37 - - 68 -
Eurizon Investimenti A.I. SGR S.p.A. 2,872 - - 4,167 -
Eurizon Capital S.A. 295 - - 807 -
Eurizon Capital SGR. S.p.A. 1,376 2 - 5,553 -
EurizonLife Ltd. 2,036 1,492 - 8,036 665
Eurizon Tutela S.p.A. 97 416 - 919 4
Eurizon Vita S.p.A. 259,329 314,694 - 165,751 8,704
Fondi di Fideuram Gestions 34,210 224,323 - 82,100 2,672
Intesa Sanpaolo Bank Ireland Plc - - - 20 41
Intesa Sanpaolo Group Services S.c.p.A. 306 2,301 - 378 61,917
Intesa Sanpaolo Private Banking S.p.A. - 26 - - 103
Intesa Sec. 3 S.r.l. 32,632 - - 927 -
Leasint S.p.A. 44 - - 94 -
Sanpaolo Bank S.A. 46 733 - 10 754
Setefi - Servizi Telematici Finanziari per il Terziario S.p.A. - - - - 2,054
Société Européenne de Banque S.A. 1,120,789 - - 30,665 3,329
The payments Banca Fideuram received for said operation totalled €17.4m (including €16.5m credited to the reserves net of tax in accordance with the Group policy on business combinations under common control). The agreement of sale stipulates that Banca Fideuram shall indemnify and hold harmless Intesa Sanpaolo in respect of any liabilities regarding the company division due to events, acts, operations or circumstances which occurred prior to the date when the operation came into effect, not reflected in the finalised financial position as stated at the time of transfer.
In accordance with the law and the internal procedures issued by the bank and its parent company Intesa Sanpaolo, all other transactions with related parties during the year were conducted under arms-length conditions as for unrelated parties of corresponding nature and risk, or - in the absence of any reference - under mutually-beneficial conditions, verified taking all related circumstances and the distinctive characteristics of the transaction and Group interests into account. The Group did not in any case engage in any atypical or unusual transactions and/or transactions under non-standard financial and contractual conditions for the types of related parties concerned.
Banca Fideuram’s other relations with its subsidiaries, as well as its relations with Intesa Sanpaolo and the latter’s subsidiaries, form part of the bank’s ordinary operations. Banca Fideuram principally uses the brokerage services of Banca IMI for buying and selling securities. The Group networks marketed, under arm’s-length conditions, the bonds issued by Intesa Sanpaolo and Banca IMI, achieving total sales of approximately €1.7bn in the year. There were no insider transactions in the year with individuals performing director-level, management or auditing functions at Banca Fideuram, parent company Intesa Sanpaolo or any other companies in the Group.
The Italian companies in the Banca Fideuram Group again availed themselves of the “istituto del consolidato fiscale nazionale” tax consolidation regime in 2009 as subsidiaries of parent company Intesa Sanpaolo. This tax consolidation regime, which is governed by special regulations, provides for the aggregation of the taxable income of all the Group companies involved, and a single payment of IRES corporate income tax by the parent company in its role as “consolidating company”.
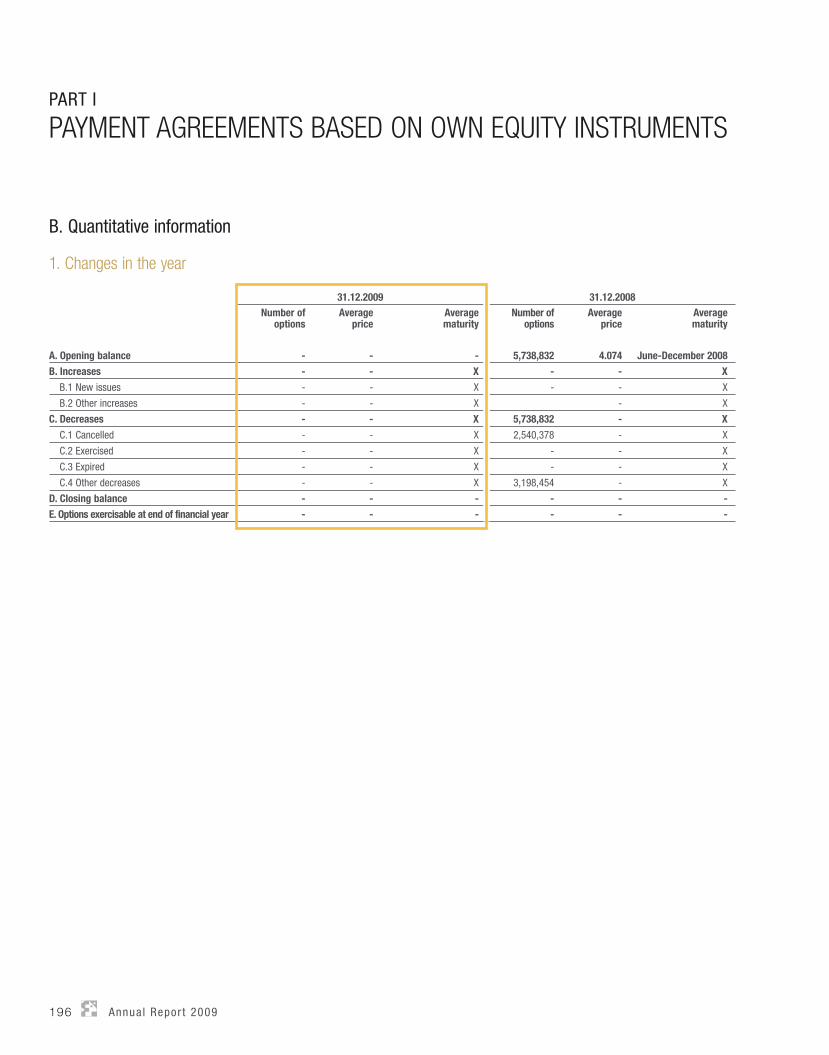
196 Annua l Repor t 2009
PART I
PAYMENT AGREEMENTS BASED ON OWN EQUITY INSTRUMENTS
B. Quantitative information
1. Changes in the year
31.12.2009 31.12.2008Number of
optionsAverage
priceAveragematurity
Number of options
Averageprice
Averagematurity
A. Opening balance - - - 5,738,832 4.074 June-December 2008
B. Increases - - X - - X
B.1 New issues - - X - - X
B.2 Other increases - - X - X
C. Decreases - - X 5,738,832 - X
C.1 Cancelled - - X 2,540,378 - X
C.2 Exercised - - X - - X
C.3 Expired - - X - - X
C.4 Other decreases - - X 3,198,454 - X
D. Closing balance - - - - - -
E. Options exercisable at end of financial year - - - - - -
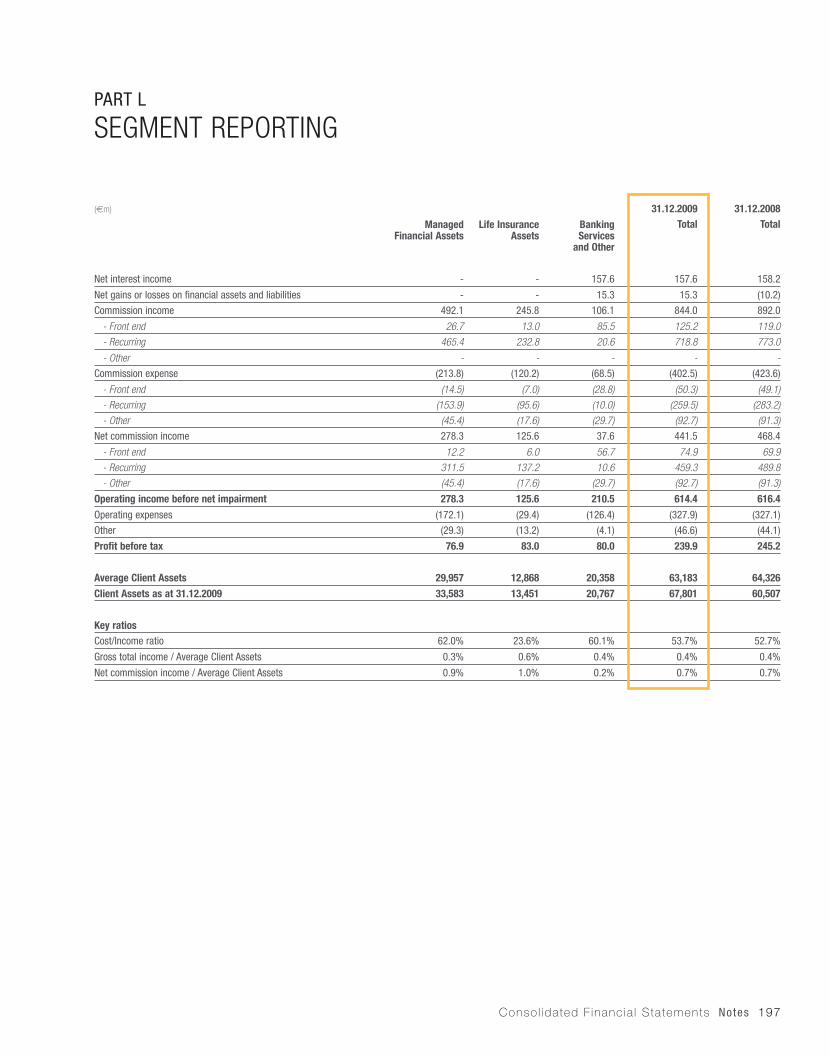
Consol idated F inancia l Statements Notes 197
PART L
SEGMENT REPORTING
(€m) 31.12.2009 31.12.2008
Managed Financial Assets
Life Insurance Assets
Banking Services
and Other
Total Total
Net interest income - - 157.6 157.6 158.2
Net gains or losses on financial assets and liabilities - - 15.3 15.3 (10.2)
Commission income 492.1 245.8 106.1 844.0 892.0
- Front end 26.7 13.0 85.5 125.2 119.0
- Recurring 465.4 232.8 20.6 718.8 773.0
- Other - - - - -
Commission expense (213.8) (120.2) (68.5) (402.5) (423.6)
- Front end (14.5) (7.0) (28.8) (50.3) (49.1)
- Recurring (153.9) (95.6) (10.0) (259.5) (283.2)
- Other (45.4) (17.6) (29.7) (92.7) (91.3)
Net commission income 278.3 125.6 37.6 441.5 468.4
- Front end 12.2 6.0 56.7 74.9 69.9
- Recurring 311.5 137.2 10.6 459.3 489.8
- Other (45.4) (17.6) (29.7) (92.7) (91.3)
Operating income before net impairment 278.3 125.6 210.5 614.4 616.4
Operating expenses (172.1) (29.4) (126.4) (327.9) (327.1)
Other (29.3) (13.2) (4.1) (46.6) (44.1)
Profit before tax 76.9 83.0 80.0 239.9 245.2
Average Client Assets 29,957 12,868 20,358 63,183 64,326
Client Assets as at 31.12.2009 33,583 13,451 20,767 67,801 60,507
Key ratiosCost/Income ratio 62.0% 23.6% 60.1% 53.7% 52.7%
Gross total income / Average Client Assets 0.3% 0.6% 0.4% 0.4% 0.4%
Net commission income / Average Client Assets 0.9% 1.0% 0.2% 0.7% 0.7%


CERTIFICATION OF THE CONSOLIDATED FINANCIAL STATEMENTS IN ACCORDANCE WITH ARTICLE 154 BIS OF ITALIAN LEGISLATIVE DECREE NO. 58OF 24 FEBRUARY 1998


Cert i f icat ion of the consol idated f inancia l s tatements 201
CERTIFICATION OF THE CONSOLIDATED FINANCIAL STATEMENTS IN ACCORDANCE WITH ARTICLE 154 BIS OF ITALIAN LEGISLATIVE DECREE NO. 58 OF 24 FEBRUARY 1998
1. The undersigned Matteo Colafrancesco - as Banca Fideuram Managing Director and General Manager - and Paolo Bacciga - as Banca Fideuram Senior Manager Responsible for the Preparation of the Company Accounts - hereby certify, also taking into consideration the provisions of article 154 bis, subparagraphs 3 and 4, of Italian Legislative Decree No. 58 of 24 February 1998, that said financial statements are:
- suitable for the characteristics of the company and - that the bank has fully applied the administrative and accounting procedures for preparing the consolidated financial statements during 2009.
2. The evaluation of the suitability and effective application of the administrative and accounting procedures for preparing the consolidated financial statements at 31 December 2009 was carried out using methodologies developed in line with the COSO framework and, for the IT part, COBIT, which are widely internationally accepted as reference frameworks for internal control systems1.
3. In addition, the undersigned also certify as follows:
3.1 The consolidated financial statements at 31 December 2009:
- have been prepared in accordance with the applicable international accounting standards recognised in the European Community pursuant to Regulation (EC) No. 1606/2002 of the European Parliament and of the Council of 19 July 2002,
- correspond with the accounting books and records,- have been prepared in accordance with Italian Legislative Decree No. 38/2005 and, where applicable, Italian Legislative Decree No. 87/1992,
as well as the provisions implementing them issued by the Bank of Italy for financial statements and by the Italian National Commission for Listed Companies and the Stock Exchange (CONSOB) for listed issuers,
- are suitable for providing a faithful and proper representation of the financial position of the issuer and of the companies included in the consolidation.
3.2 The Directors’ Report contains a reliable analysis of the performance, operating results and financial situations of the issuer and of the companies included in the consolidation, together with a description of the main risks and uncertainties to which they are exposed.
12 March 2010
1. The COSO Framework was developed by the Committee of Sponsoring Organizations of the Treadway Commission, a US body dedicated to improving the quality of company information by providing
guidance on ethical standards and an effective system of corporate governance and organisation. The COBIT Framework - Control OBjectives for IT and related technology - is a set of guidance materials
developed by the IT Governance Institute, a US body that aims to develop and improve corporate standards in the IT sector.
Matteo Colafrancesco
Managing Director andGeneral Manager
Paolo Bacciga
Senior Manager Responsible for the Preparation of the Company Accounts


INDEPENDENT AUDITORS’ REPORT


SCHEDULES
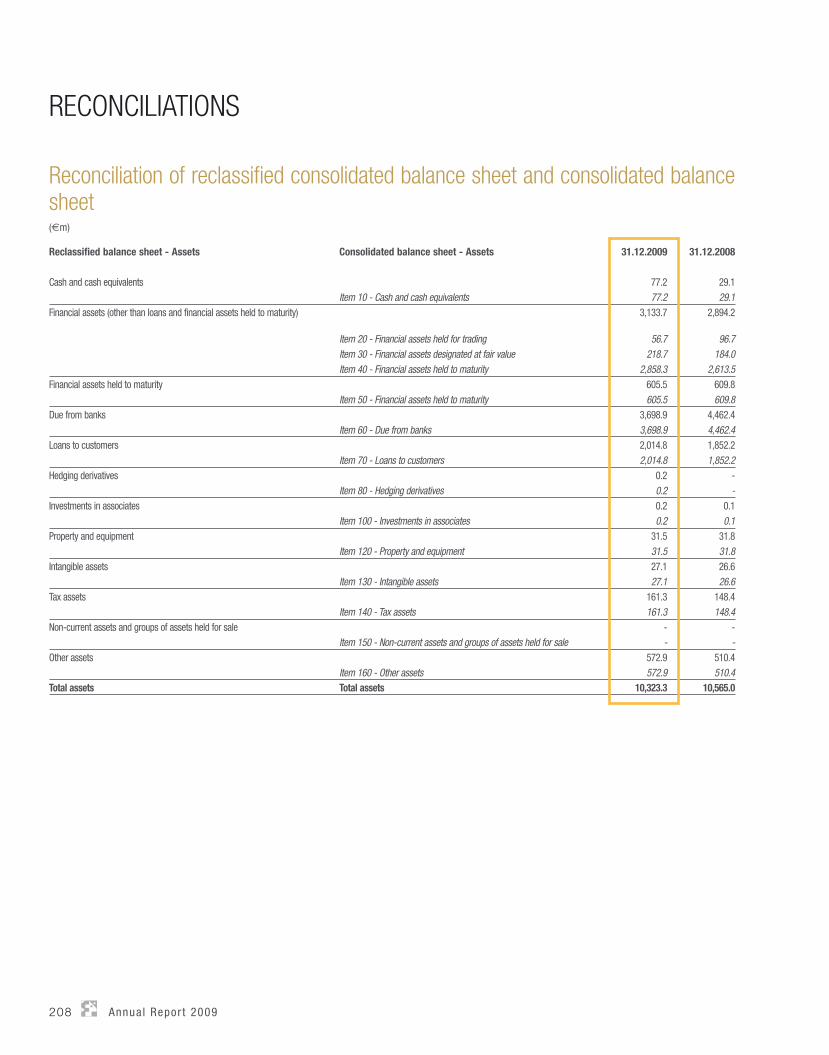
208 Annua l Repor t 2009
RECONCILIATIONS
Reconciliation of reclassified consolidated balance sheet and consolidated balance sheet(€m)
Reclassified balance sheet - Assets Consolidated balance sheet - Assets 31.12.2009 31.12.2008
Cash and cash equivalents 77.2 29.1Item 10 - Cash and cash equivalents 77.2 29.1
Financial assets (other than loans and financial assets held to maturity) 3,133.7 2,894.2
Item 20 - Financial assets held for trading 56.7 96.7Item 30 - Financial assets designated at fair value 218.7 184.0Item 40 - Financial assets held to maturity 2,858.3 2,613.5
Financial assets held to maturity 605.5 609.8Item 50 - Financial assets held to maturity 605.5 609.8
Due from banks 3,698.9 4,462.4Item 60 - Due from banks 3,698.9 4,462.4
Loans to customers 2,014.8 1,852.2Item 70 - Loans to customers 2,014.8 1,852.2
Hedging derivatives 0.2 -Item 80 - Hedging derivatives 0.2 -
Investments in associates 0.2 0.1Item 100 - Investments in associates 0.2 0.1
Property and equipment 31.5 31.8Item 120 - Property and equipment 31.5 31.8
Intangible assets 27.1 26.6Item 130 - Intangible assets 27.1 26.6
Tax assets 161.3 148.4Item 140 - Tax assets 161.3 148.4
Non-current assets and groups of assets held for sale - -Item 150 - Non-current assets and groups of assets held for sale - -
Other assets 572.9 510.4Item 160 - Other assets 572.9 510.4
Total assets Total assets 10,323.3 10,565.0
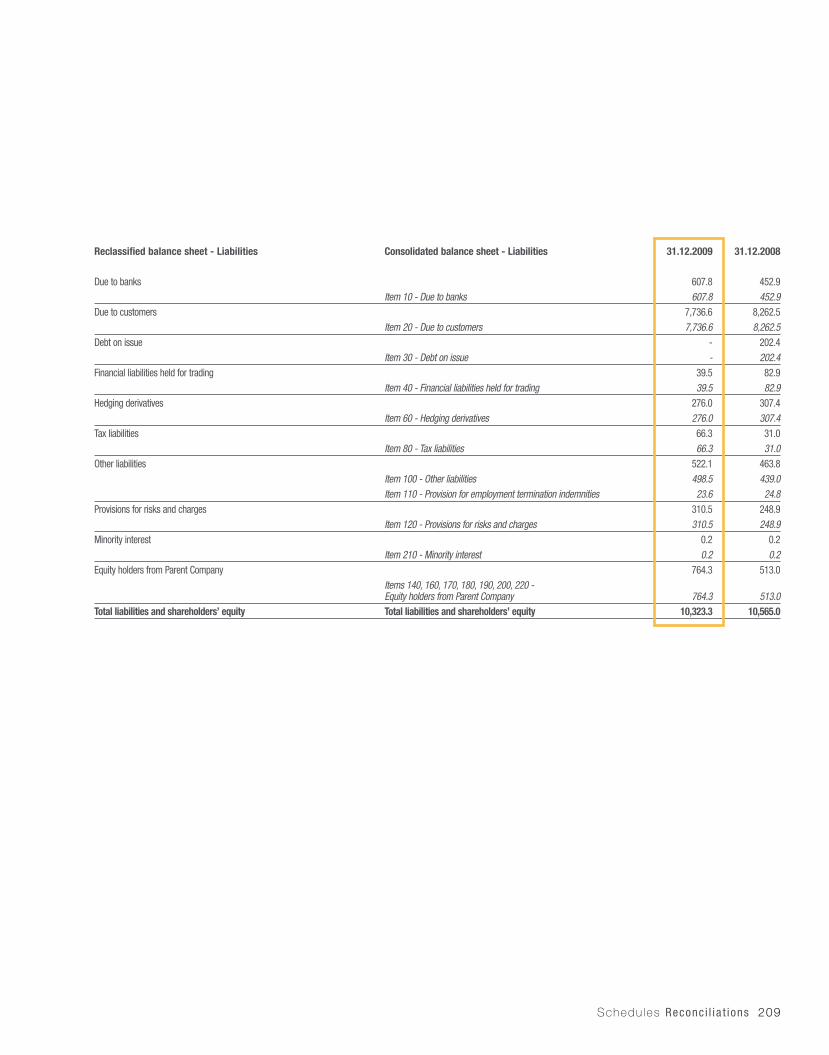
Schedules Reconc i l ia t ions 209
Reclassified balance sheet - Liabilities Consolidated balance sheet - Liabilities 31.12.2009 31.12.2008
Due to banks 607.8 452.9Item 10 - Due to banks 607.8 452.9
Due to customers 7,736.6 8,262.5Item 20 - Due to customers 7,736.6 8,262.5
Debt on issue - 202.4Item 30 - Debt on issue - 202.4
Financial liabilities held for trading 39.5 82.9Item 40 - Financial liabilities held for trading 39.5 82.9
Hedging derivatives 276.0 307.4Item 60 - Hedging derivatives 276.0 307.4
Tax liabilities 66.3 31.0Item 80 - Tax liabilities 66.3 31.0
Other liabilities 522.1 463.8Item 100 - Other liabilities 498.5 439.0Item 110 - Provision for employment termination indemnities 23.6 24.8
Provisions for risks and charges 310.5 248.9Item 120 - Provisions for risks and charges 310.5 248.9
Minority interest 0.2 0.2Item 210 - Minority interest 0.2 0.2
Equity holders from Parent Company 764.3 513.0Items 140, 160, 170, 180, 190, 200, 220 - Equity holders from Parent Company 764.3 513.0
Total liabilities and shareholders’ equity Total liabilities and shareholders’ equity 10,323.3 10,565.0
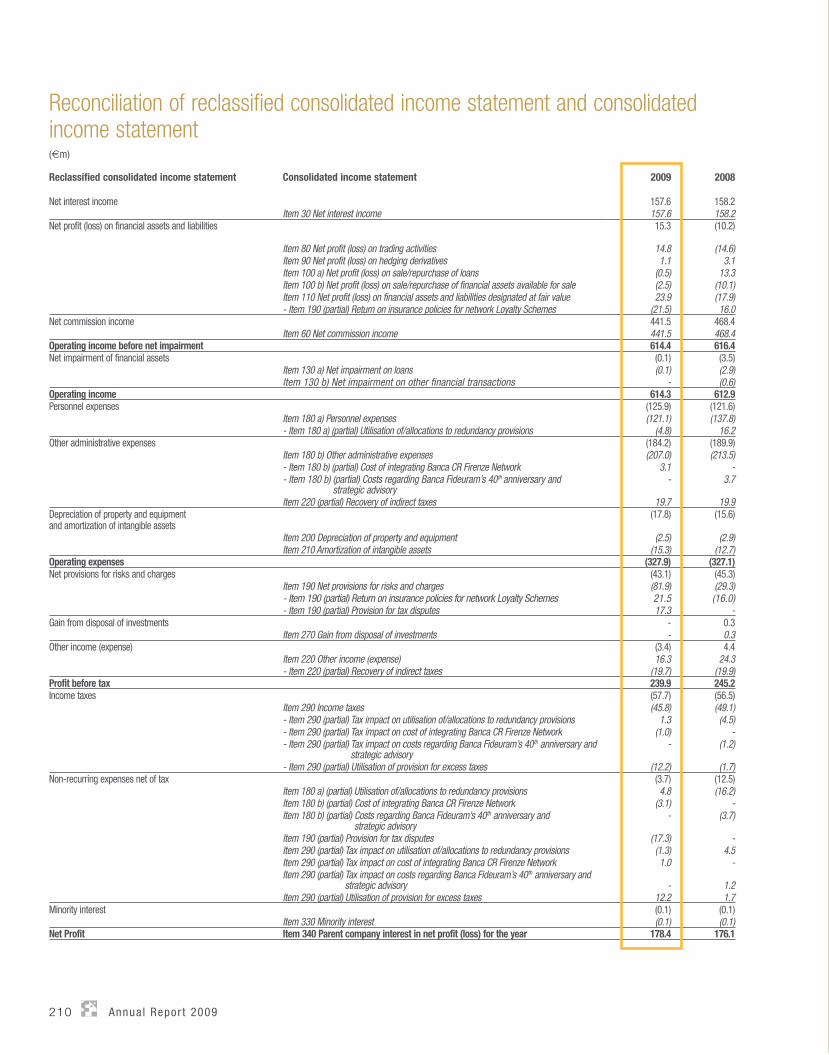
210 Annua l Repor t 2009
Reconciliation of reclassified consolidated income statement and consolidated income statement(€m)
Reclassified consolidated income statement Consolidated income statement 2009 2008
Net interest income 157.6 158.2Item 30 Net interest income 157.6 158.2
Net profit (loss) on financial assets and liabilities 15.3 (10.2)
Item 80 Net profit (loss) on trading activities 14.8 (14.6)Item 90 Net profit (loss) on hedging derivatives 1.1 3.1Item 100 a) Net profit (loss) on sale/repurchase of loans (0.5) 13.3Item 100 b) Net profit (loss) on sale/repurchase of financial assets available for sale (2.5) (10.1)Item 110 Net profit (loss) on financial assets and liabilities designated at fair value 23.9 (17.9)- Item 190 (partial) Return on insurance policies for network Loyalty Schemes (21.5) 16.0
Net commission income 441.5 468.4Item 60 Net commission income 441.5 468.4
Operating income before net impairment 614.4 616.4Net impairment of financial assets (0.1) (3.5)
Item 130 a) Net impairment on loans (0.1) (2.9)Item 130 b) Net impairment on other financial transactions - (0.6)
Operating income 614.3 612.9Personnel expenses (125.9) (121.6)
Item 180 a) Personnel expenses (121.1) (137.8)- Item 180 a) (partial) Utilisation of/allocations to redundancy provisions (4.8) 16.2
Other administrative expenses (184.2) (189.9)Item 180 b) Other administrative expenses (207.0) (213.5)- Item 180 b) (partial) Cost of integrating Banca CR Firenze Network 3.1 -- Item 180 b) (partial) Costs regarding Banca Fideuram’s 40th anniversary and
strategic advisory- 3.7
Item 220 (partial) Recovery of indirect taxes 19.7 19.9Depreciation of property and equipment and amortization of intangible assets
(17.8) (15.6)
Item 200 Depreciation of property and equipment (2.5) (2.9)Item 210 Amortization of intangible assets (15.3) (12.7)
Operating expenses (327.9) (327.1)Net provisions for risks and charges (43.1) (45.3)
Item 190 Net provisions for risks and charges (81.9) (29.3)- Item 190 (partial) Return on insurance policies for network Loyalty Schemes 21.5 (16.0)- Item 190 (partial) Provision for tax disputes 17.3 -
Gain from disposal of investments - 0.3Item 270 Gain from disposal of investments - 0.3
Other income (expense) (3.4) 4.4Item 220 Other income (expense) 16.3 24.3- Item 220 (partial) Recovery of indirect taxes (19.7) (19.9)
Profit before tax 239.9 245.2Income taxes (57.7) (56.5)
Item 290 Income taxes (45.8) (49.1)- Item 290 (partial) Tax impact on utilisation of/allocations to redundancy provisions 1.3 (4.5)- Item 290 (partial) Tax impact on cost of integrating Banca CR Firenze Network (1.0) -- Item 290 (partial) Tax impact on costs regarding Banca Fideuram’s 40th anniversary and
strategic advisory- (1.2)
- Item 290 (partial) Utilisation of provision for excess taxes (12.2) (1.7)Non-recurring expenses net of tax (3.7) (12.5)
Item 180 a) (partial) Utilisation of/allocations to redundancy provisions 4.8 (16.2)Item 180 b) (partial) Cost of integrating Banca CR Firenze Network (3.1) -Item 180 b) (partial) Costs regarding Banca Fideuram’s 40th anniversary and
strategic advisory- (3.7)
Item 190 (partial) Provision for tax disputes (17.3) -Item 290 (partial) Tax impact on utilisation of/allocations to redundancy provisions (1.3) 4.5Item 290 (partial) Tax impact on cost of integrating Banca CR Firenze Network 1.0 -Item 290 (partial) Tax impact on costs regarding Banca Fideuram’s 40th anniversary and
strategic advisory - 1.2Item 290 (partial) Utilisation of provision for excess taxes 12.2 1.7
Minority interest (0.1) (0.1)Item 330 Minority interest (0.1) (0.1)
Net Profit Item 340 Parent company interest in net profit (loss) for the year 178.4 176.1

Al legat i Prospet t i d i Raccordo 211


GLOSSARY

214 Annua l Repor t 2009
AdvisorFinancial advisor who assists companies involved in corporate finance transactions. Their tasks include providing advisory services and preparing valuations.
Affluent customersHigh-income customers.
ALM (Asset & Liability Management)Body of techniques that allow a bank to provide integrated financial statement asset and liability management, typically used for measuring interest rate risk.
Asset allocationProcedure adopted by an asset manager that consists in distributing a portfolio across a variety of financial instrumentsin different investment markets.
Asset gatheringThe activity of collecting savings.
Asset ManagementThe activity of managing and administering assets on behalfof customers.
Client Assets (CA)These assets comprise:- Managed assets, which include mutual funds and pension funds,
discretionary accounts and life insurance technical reserves.- Non-managed assets, which include securities deposited (net
of units in Group funds), accident insurance technical reserves and current account overdrafts.
AuditThe body of activities for checking company processes and accounting, carried out both by internal departments (internal audit) and by independent auditing companies (external audit).
BancassuranceThe offer of insurance products through a bank’s branch network.
Banking bookThe portion of a bank’s securities holdings that is not held for trading purposes.
Banking direct inflowsDeposits by and bonds issued by banks.
Basel II AccordThe common name for the New Capital Accord which came into effect on 1 January 2007.
The Accord is based on three “pillars”:1. Minimum Capital Requirement: 8% of risk-weighted assets. 2. Supervision by the Central Banks, who have been given greater
discretion in evaluating capital requirements and are able to impose higher coverage than the minimum requirements.
3. Market discipline and transparency of information provided to the public on capital levels, risks and their management.
BenchmarkFinancial parameter or indicator or financial instrument with characteristics that brokers consider sufficiently representative to be adopted as a reference for understanding whether a financial instrument with similar characteristics has performed better or worse than the benchmark over a given period.
BondSecurity issued by a legal person who contracts a loan for a given amount and date, undertaking to pay the purchaser a return and to repay the amount upon maturity.
Bp (basis point)Unit of measurement for interest rate spread or changes in interest rates, equal to one hundredth of a percentage point. Example: If rates rise from 9.65% to 9.80%, they have risen by 15 basis points.
BranchesThe bank’s area branches.
Commissione Nazionale per le Società e la Borsa (CONSOB)The Italian National Commission for Listed Companies and the Stock Exchange, an independent administrative body which actsto protect investors’ interests and to ensure the effective operation, transparency and growth of the Italian securities market.
Community DirectivesEuropean Union legal acts directed at member states, which are obliged to achieve the objectives specified in the directives andin their turn issue implementation legislation for application within each individual state.
Core CapitalComprises the paid-in capital plus the reserves minus treasury shares, intangible assets and losses in prior years and/or the current year.
Corporate governanceThe body of rules and regulations that govern the life of a company, in particular with respect to the transparency of its documents and company minutes, and to the completeness of the information it provides the market.

Glossary 215
Cost/Income Ratio:The ratio of administrative expenses and depreciation and amortization on the one hand, to operating income before net impairment on the other (including other revenues, net).
Counterparty riskThe risk of a potential loss due to a counterparty failing to meet their contractual obligations.
Country riskSet of economic, financial and political factors that may make it difficult to obtain the repayment of debts contracted by trusted foreign clients irrespective of their individual solvency.
Credit riskThe risk that a change in the credit rating of a trusted counterparty with whom a bank has an exposure could generate a corresponding change in value of the credit position.
DefaultThe situation in which it is impossible for a party to meet their contracted financial obligations.
DerivativeGeneric term for a type of financial instrument, the price/return of which is based on the price/return of other assets known as underlying assets, which can be financial instruments, indices, interest rates, currencies or raw materials.
Doubtful loanLoan to a party that is in a situation which is objectively one of temporary difficulty that they are likely to overcome in an appropriate period of time.
DurationApplied to bonds, the average time it takes an investor to get their money (principal and interest). An indicator of the interest rate risk to which a bond or a bond portfolio is subject. In its most frequent configuration it is calculated as the weighted average of the due dates for payment of principal and interest on a bond.
ECB (European Central Bank)European community institution responsible for managing monetary policy in the Eurozone with the objective of maintaining price stability. The main governing bodies of the ECB are the Governing Council, Executive Board and General Council.
Embedded ValueThe value of the Group’s adjusted shareholders’ equity plus the value of its business portfolio at the valuation date.Endorsement credit
Operation through which a bank or finance company undertakes to bear or guarantee a customer’s debt to a third-party.
EPS (Earnings per Share)Ratio of net profit for the year to the number of sharesat period end.
EuriborReference interbank rate used in European Union countries. Calculated as the weighted average of the interest rates at which the major banks operating in the European Union grant loans. Calculated daily and used as a parameter for setting the variable interest rates on loans.
European CommissionExecutive body of the European Union responsible for the implementation of European Laws (Directives, Regulations and Decisions), and the financial statements and programmes of the European Parliament and Council. Has power of legislative initiative and negotiates international agreements, mainly regarding commerce and cooperation. The President and members of the European Commission are appointed by the member states following the prior approval of the European Parliament.
European Community regulationsRegulations that are directly applicable and compulsory in all member states of the European Union without any national transposition legislation being required.
European Union (EU)Currently made up of 27 members, the European Union is governed by five institutions: the European Parliament, the European Council, the European Commission, the Court of Justice and the Court of Auditors.
EurozoneThe geographical area covered by the member states of the European Union that have adopted the euro.
E.V.A. (Economic Value Added):An internal financial ratio used to calculate the value created by a company in a given period. It is calculated by subtracting the shareholder’s expected return on consolidated shareholders’ equity from net profit. The expected return is generally taken to equal the net return on 12-month Treasury Bills issued at the beginning of the year, plus a market risk premium which is assumed to be constant at 4.5 percent over the periods concerned.

216 Annua l Repor t 2009
IFRIC (International Financial Reporting Interpretations Committee)The IASB committee that issues the official interpretations of the IAS/IFRS international accounting standards.
ImpairmentA financial asset is considered to be “impaired” when the book value of the asset is higher than its estimated recoverable value.
Index linked policyA life insurance policy where the benefit upon maturity depends on the performance of a reference parameter that can be a share price index, a basket of securities or other indicator.
Indirect inflowsSecurities and other instruments not issued by a depositary bank but received by it in custody, under management or in relation to the management of personal estates.
InflationGeneral growth in prices affecting all products.
Information systemThe system of machines, personnel and procedures used to manage important information for a company. The part of this system which is managed using information technology is generally called the information technology (IT) system.
Insurance consultantsTrainee Personal Financial Advisers.
Interbank deposit market (e-MID)Electronic market for trading in interbank deposits operated by the company e-MID S.p.A..
Interest rate riskThe financial risk to which a bank is exposed as a result of a fluctuation in interest rates, which can be measured in terms of potential changes in future net interest income or in the current value of shareholders’ equity (seen as the difference between the current value of interest-bearing assets and interest-bearing liabilities).
Investment gradeTerm used for high-quality bonds that have received a medium-to-high rating.
LiquidityThe potential of an investment to be converted into cash quickly and without hitch.
Exchange rate riskThe risk that the fair value or future financial flows of a financial instrument will fluctuate as a result of exchange rate fluctuations.
E-bankingThe use of an electronic network (Internet or similar) that allows customers to carry out a vast range of banking and financial transactions online.
E-learningThe distance training of personnel using computer aids.
Fair valueThe purchase price for which an asset can be traded or a liability settled in a free transaction between informed and free parties.
Federal ReserveThe Federal Reserve (Bank) or just FED is the Central bank of the United States.
GDP (Gross Domestic Product)The total value of the end goods and services produced by a country in a given period of time using its own home market input. When calculated at current prices, it is known as nominal GDP, and when calculated at constant prices (base-year prices), it is known as real GDP.
GoodwillThe goodwill paid for the acquisition of an equity investment, equal to the difference between the purchase price and the corresponding portion of shareholders’ equity for the part that cannot be attributed to the separable assets of the company purchased.
Gross inflowsTotal subscriptions gross of disinvestments.
Holding CompanyA financial company that has controlling interests in several companies.
IAS/IFRSThe international accounting standards issued by the International Accounting Standards Board (IASB), adopted by the countries of the European Union from 2005 for companies listed on the stock exchange.
IASB (International Accounting Standards Board)The international body that issues the IAS/IFRS international accounting standards.
Glossary 217
OptionThe entitlement but not the obligation to buy (call option) or sell (put option) a financial instrument at a predetermined price by or on a given future date.
OTC (over the counter)Transactions entered into directly by the parties without using a regulated market.
Overdue loanLoans to parties with loans that are overdue/past due at period end according to Bank of Italy rules.
Par valueThe face value of a security that an issuer undertakes to repay, used for calculating coupon values.
Patti chiariA project formed by a consortium of Italian banks to offer certified, simple, modern tools that enable customers to make a better choice of financial products by ensuring clarity, ease of understanding and ease of comparison.
Pension fundsBodies/management companies (in certain cases with the status of a legal entity) which pay out supplementary pension benefits.
Performing loanLoans to parties that did not present any specific insolvency risks at period end.
Price riskThe risk that the fair value or future financial flows of a financial instrument might fluctuate following fluctuations in market prices (other than fluctuations caused by interest rate risk or exchange-rate risk), irrespective of whether the fluctuations are caused by factors specific to the individual instrument or its issuer, or whether they are due to factors that influence every similar financial instrument traded on the market.
Personal Financial AdvisersProfessionals registered in the Italian National Register of Financial Advisers, including insurance consultants.
Discretionary accountsFinancial services for private customers to provide the global management of their financial requirements.
Liquidity riskThe risk of an entity encountering difficulties in obtaining the funds to meet the obligations resulting from financial instruments.
Market CapitalisationA company’s value on the stock market: the sum of the market price of its different classes of shares, multiplied by the number of shares issued.
Market makingA financial activity carried out by specialist brokers with the aim of ensuring the liquidity and depth of the market, both through their continuous presence and through their function as a competitive guide for determining prices.
Market riskThe risk of losses on balance-sheet and off-balance-sheet positions that could result from unfavourable fluctuations in market prices. The variables that constitute the different types of risks forming market risk are: interest rates (interest rate risk), market prices (price risk) and exchange rates (exchange rate risk).
Mutual fundsIndependent assets in the form of a diversified portfolio of financial assets divided up into units belonging to a large number of holders and managed by a special management company.
NAV (Net Asset Value)The value of net assets. This is the book value plus the fair value of the assets so that a current valuation can be obtained.
Net inflows Total subscriptions minus disinvestments.
Non-performing loanLoan to a party that is insolvent or in a substantially equivalent situation.
Official reservesThe official reserves held by central banks consist of universally-accepted means of payment, mainly dollars and gold, on which they can draw to finance the import of essential goods in the event of a crisis or to intervene on the foreign exchange market to support their own currency.
Operational riskThe risk of loss arising from inadequate or dysfunctioning internal processes, human resources or systems, or from external events. This definition includes legal risk.

218 Annua l Repor t 2009
Risk ManagementThe acquisition, measurement, valuation and global management of the various different types of risk and their respective hedging.
ROE (Return on equity)The ratio of consolidated net profit to average shareholders’ equity for the last two years.
Securitisation Sale of immovable property or other financial assets to a special purpose vehicle which converts them into bonds, with the proceeds immediately being made available to the company which sold the assets.
Segment reportingThe reporting of financial results by business segment and geographical area.
Settlement riskThe risk, arising in securities transactions, of the counterparty not fulfilling their obligation to deliver the securities or pay the amount owed after maturity.
Social ReportA Social Report is the publication a company uses to disseminate information to stakeholders on the social and environmental activities it has carried out, enabling them to evaluate their consistency and effectiveness.
Solvency ratioCalculated as the ratio of Regulatory Capital to risk-weighted assets. Indicates the extent to which a bank’s capital covers its risk-weighted assets.
Spin offThis is when part of the assets of a company are separated from it to form a new legal entity.
StakeholderParties who for various reasons interact with the activities of a company, being involved in its results, influencing its performance, and evaluating its economic, social and environmental impact.
Stock exchange priceThe value of a security in official trading.
Public Purchase Offer (PPO)Transaction by which a substantial number of shares in a listed company is purchased in order to acquire control of said company. The Italian National Commission for Listed Companies and the Stock Exchange (CONSOB) has set the maximum ownership limit for any controlling shareholder at 30%, above which it is obligatory to launch a PPO for the remaining shares on the market.
RatingAn assessment of the quality of a company or of the debt securities it issues on the basis of the financial soundness of the company and of its prospects. This assessment is carried out by specialist agencies.
Rating AgencyIndependent specialist company which assigns a rating to an issuer’s ability to redeem the financial instruments it has issued. These ratings are expressed in a combination of letters or digits (e.g. AAA; A+; BB; B-).
RecessionCommonly used to mean an extended decline in GDP. In economics, means negative GDP growth for at least two consecutive quarters.
Regulatory CapitalThe capital of banks valid for the purposes of compliance with the supervisory regulations, made up of the total of “Core Capital” and “Supplementary Capital”, minus - following specific detailed procedures - equity investments and other interests in banks and/or financial institutions.
Restructured loanLoan in which a pool of banks (or a single-lender bank) grants a deferment of a debt and renegotiates the loan at interest rates that are below market rates.
RetailA customer sector that principally comprises private individuals, professionals, retailers and the owners of small enterprises.
ReturnThe total profit on an investment expressed as a percentage of the capital invested.
Risk factorsThe factors that give rise to a risk for a financial instrument or portfolio (e.g. exchange rates, interest rates etc.).

Glossary 219
VaRCriterion for measuring market risk which follows a probabilistic approach, quantifying the risk in relation to the maximum loss that may be expected with a certain probability, on the basis of historical price fluctuations, with respect to a single position or an entire portfolio of securities for a specific time horizon.
VolatilityStatistical indicator for measuring the price fluctuation of a financial instrument with respect to its average price in a given period. The greater the volatility of a financial instrument, the riskier it is.
Write-downThe writing down or depreciation of assets items in financial statements.
Write-backRestoring (writing back) the value of assets items that were written down in prior financial years.
Stock optionsOption contracts which grant the entitlement to purchase shares in a company within a predetermined time and at a predetermined price. They are used as a form of supplementary remuneration in bonus and Loyalty Schemes.
Strike priceThe exercise price of an option.
Structured securityA security comprising a “fixed” component which is similar to a normal bond and a “derivative” component which is similar to an option, linked to the performance of an external factor.
SubprimeA subprime mortgage is, by definition, a mortgage granted to a party who would not have been able to obtain a more favourable rate on the credit market. Subprime debtors typically have a low credit rating and credit histories of defaults, attachments, bankruptcy and late payment. Because subprime debtors are considered to be at a high risk of insolvency, subprime mortgages typically have less favourable conditions than other types of lending. These conditions include higher interest rates, fees and premiums.
Supplementary CapitalComprises the revaluation reserves, subordinated liabilities and other positive components, minus net losses on securities and other negative components.
Technical formContractual procedure stipulated for a given inflow or investment ratio.
Trading bookThe portion of a bank’s securities holdings that is held for trading purposes.
Unit-linked policiesLife insurance policies where the benefits are linked to the value of investment funds. A policy may provide a capital guarantee or guaranteed minimum return.
Underlying instrumentFinancial instrument that determines the value of a derivative instrument or structured security.
Unemployment rateThe percentage of workers, or rather of the workforce, which is not able to find a job.

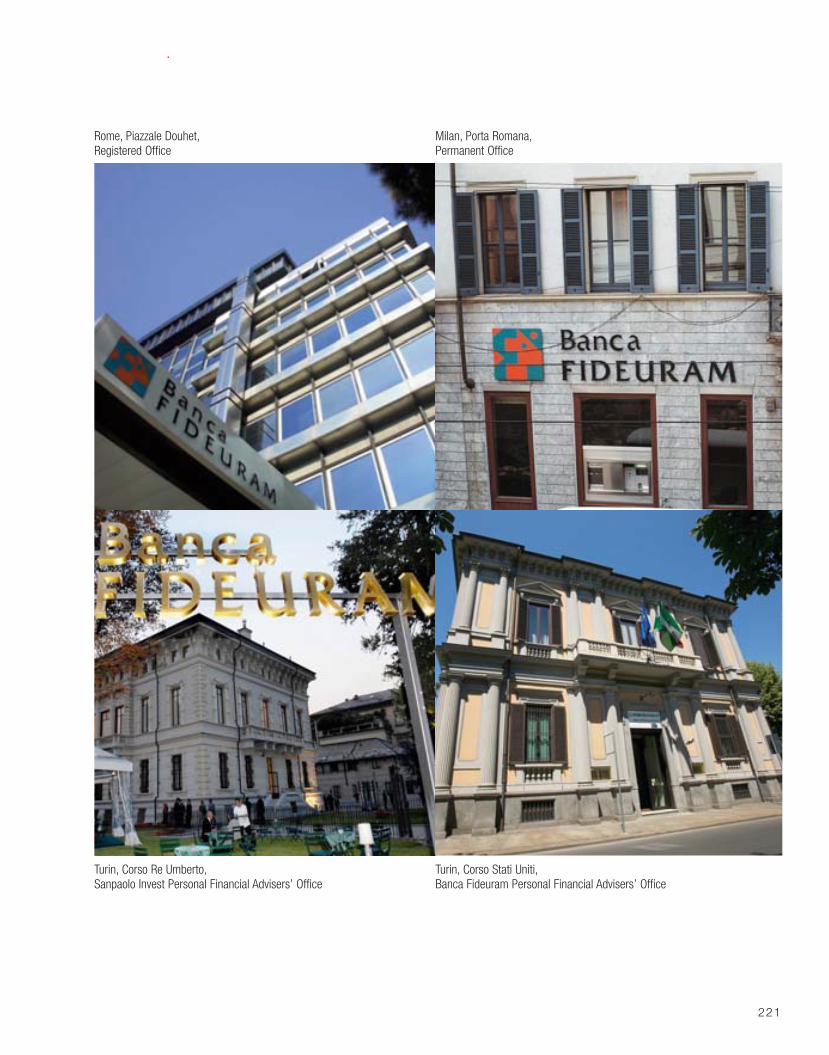
221
Rome, Piazzale Douhet,Registered Office
Milan, Porta Romana,Permanent Office
Turin, Corso Stati Uniti,Banca Fideuram Personal Financial Advisers’ Office
Turin, Corso Re Umberto,Sanpaolo Invest Personal Financial Advisers’ Office

222 Annua l Repor t 2009
This document:
■ has been available in its original Italian version since 12 March 2010, when it was published on our website.
■ was prepared in accordance with the “Decalogo dell’Annual Report” handbook - methodology for identifying a benchmark for the voluntary dissemination of financial information through financial statements.


Graphic Design and Editing by
Mercurio S.r.l. - Milan
www.mercurioitaly.it
English Language version by
Michael Benis BA MITI

R o m e - Registered Office
Piazzale Giulio Douhet, 31
00143 Rome
Tel. +39 06 59021 - Fax +39 06 59022634
M i l a n - Permanent Secondary Office
Corso di Porta Romana, 16 - 20122 Milan
Tel. +39 02 85181 - Fax +39 02 85185235
www.fideuram.it
Bank of Group