Bargaining on a low income - Social Market Foundation · Bargaining on a low income A better deal...
71
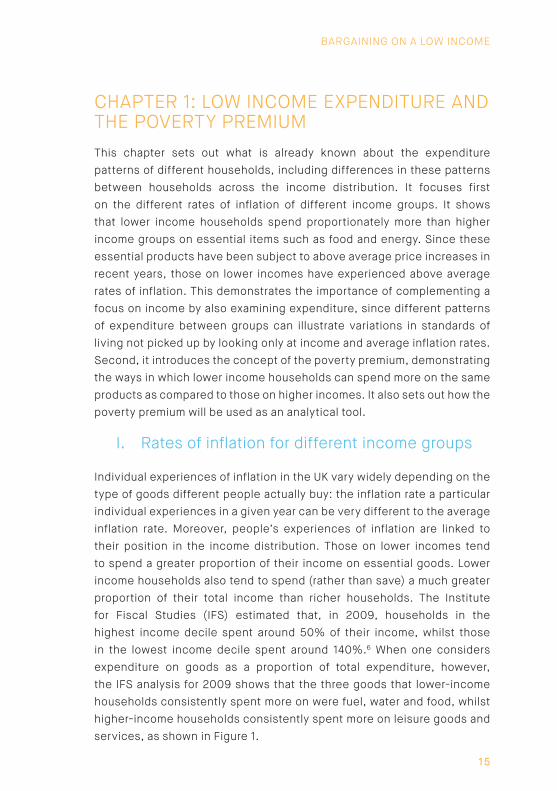
Bargaining on a low income A better deal for consumers Ben Richards
Transcript of Bargaining on a low income - Social Market Foundation · Bargaining on a low income A better deal...
Bargaining on a low
income
A better deal for consum
ers
Bargaining on a low incomeA better deal for consumers
Bargaining on a low incomeGetting a better deal for low income consumers
Standards of living have been falling. Those on low incomes face particular difficulties as the prices of essential goods have risen even faster than average. Low income consumers can face the additional disadvantage of paying more for the same goods and services as compared with higher income consumers. Attempts have been made by regulators and the Government to address some of these problems. But some policies have fallen short because of an incomplete understanding of how low income consumers interact with different markets. Bargaining on a Low Income draws on new data analysis, interviews, focus groups, and a nationally representative poll to provide an in-depth understanding of low income consumers’ experiences of value in different markets. Where there are disadvantages, it sets out why these exist along with the different strategies that low income consumers adopt to overcome them. Based on these insights, it sets out four key areas of policy and regulation that urgently need to be addressed to ensure markets are better tailored to the needs and demands of low income consumers.
Ben Richards
Kindly supported by
A better deal for consumers
Bargaining on a low income
Ben Richards
Kindly Supported By
FIRST PUBLISHED BY
The Social Market Foundation, March 2015
ISBN: 978-1-904899-99-0
11 Tufton Street, London SW1P 3QB
Copyright © The Social Market Foundation, 2015The moral right of the authors has been asserted. All rights reserved. Without limiting the rights under copyright reserved above, no part of this publication may be reproduced, stored or introduced into a retrieval system, or transmitted, in any form or by any means (electronic, mechanical, photocopying, recording, or otherwise), without the prior written permission of both the copyright owner and the publisher of this book.
THE SOCIAL MARKET FOUNDATION
The Foundation’s main activity is to commission and publish original papers by independent academic and other experts on key topics in the economic and social fields, with a view to stimulating public discussion on the performance of markets and the social framework within which they operate. The Foundation is a registered charity and a company limited by guarantee. It is independent of any political party or group and is funded predominantly through sponsorship of research and public policy debates. The views expressed in this publication are those of the authors, and these do not necessarily reflect the views of the sponsors or the Social Market Foundation.
CHAIRMary Ann Sieghart
MEMBERS OF THE BOARDLord Charles FalconerDaniel FranklinBaroness Olly Grender MBENicola HorlickGraham MatherSir Brian Pomeroy CBEPeter ReadmanBaroness Gillian ShepherdProfessor Alison Wolf
DIRECTOR
Emran Mian
DESIGN AND PRODUCTION
Pistachio Design
www.pistachiodesign.com
PRINTED BY
Diversified Global Graphics Group
www.dg3.com

CONTENTS
Acknowledgements 4
About the author 5
Executive summary 6
Introduction 12
Research methodology and focus 13
Chapter 1: Low income expenditure and the poverty premium 15
I. Rates of inflation for different income groups 15
II. The ‘poverty premium’ 18
Chapter 2: Consumer value in different markets 21
I. The variation in expenditure patterns of low
income households 22
II. Consumer value in each key market: attitudes and behaviours of those on low incomes 26
III. The role of information in obtaining value 40
IV. The notion of the ‘active consumer’ 42
V. Budgeting timeframes 44
VI. Common variations across markets: two dimensions of value 46
Chapter 3: Implications for policy and regulation 50
Recommendations 51
Appendix 61
Methodology 61
Results of Cluster Analysis 62
Endnotes 68

SOCIAL MARKET FOUNDATION
4
ACKNOWLEDGEMENTSThis research and publication have been made possible by the generous support of Provident Financial. I would like to thank the group of experts that offered advice during the project: Matthew Oakley, Yvette Hartfree, Carole King, Alison Garnham, Caroline Fletcher, and Jocelyn Pearson. We are grateful to ComRes for carrying out the qualitative research and providing us with rich and illuminating data; and to Populus for carrying out the poll, which enabled us to compare our findings at a national level and across the income distribution. At the SMF, special thanks go to Nigel Keohane, Emran Mian, Amanda Wolthuizen, Nida Broughton, Katie Evans, Gabrielle Leroux and Aman Saggu for their intellectual input and guidance.
BARGAINING ON A LOW INCOME
5
ABOUT THE AUTHORBen Richards is a Researcher at the SMF, where he works on projects in a range of areas including business policy, productivity, and immigration. His other research interests include theories of social justice, and debates on multiculturalism and social solidarity. Ben recently completed a Ph.D. in Social Policy at the London School of Economics, and has previously worked as a Researcher at the Centre for Analysis of Social Exclusion, LSE. He has also conducted research for charities including Oxfam and the Child Poverty Action Group.
SOCIAL MARKET FOUNDATION
6
EXECUTIVE SUMMARYStandards of living have been falling. Prices increased faster than incomes for much of the time since the financial crisis; and, those on low incomes, who spend larger portions of their money on essential goods such as fuel and food, have had to contend with above average inflation.
In recent months inflation has subsided for everyone, but has remained higher than average for those on low incomes, despite welcome falls in the prices of some essential goods. The spending power of those on low incomes is still a long way below its pre-recession level.
Research demonstrates that low income households pay considerably more for the same goods and services compared to higher income households, because they get worse value in markets such as energy, insurance and banking. Save the Children have calculated that a typical lower income household can pay £1,280 more each year for the same goods and services compared to a typical higher income household.1
There is now some movement to start addressing these problems in consumer markets. But, the danger is that policy or regulation is developed without a full understanding of how and why low income consumers behave in the way they do, and regulation is designed that fails to assist them fully. We know that disadvantages exist in some markets, but we need greater understanding of exactly how these disadvantages impact on consumers, and why consumers behave in the way they do in the markets in which they spend money. This greater understanding will enable the design of better policy to help consumers get better value for money.
Drawing on new data analysis, interviews, focus groups and a nationally representative poll we demonstrate that low income households have very different patterns of expenditure compared to higher income households. However, we also show that expenditure patterns vary between different low income households, and highlight how low income consumers are far from being a homogenous group.
Our interviews and focus groups provide new and detailed information about markets that are functioning well. Grocery shopping, in particular,
BARGAINING ON A LOW INCOME
7
was seen as an area in which it is possible to get good value – something that is backed up by research elsewhere showing that low income consumers may actually pay less for identical grocery products, as compared with higher income consumers.2 Low income consumers described reasons why they were able to get good value with the grocery market, including: a large amount of choice in providers; and clear and simple information available from a range of different sources.
Our research also provides information about markets in which there is evidence of poor value for low income consumers. Low income respondents viewed the fees charged for landlines as particularly bad value, and were more likely to do so than higher income consumers. Consumers saw very few strategies available for getting better value with landlines because the cost does not vary significantly across providers, and the landline charge is a fixed monthly cost that does not vary with usage. In addition, concerns were raised over fixed daily charges for those wishing to consume low volumes of gas or electricity – a concern shared by Ofgem (2014) in their recent report on fixed charges affecting value for low income energy customers.3
The way in which scope for achieving value differs between markets, and the way in which different consumer behaviours influence value, can be thought of in terms of two dimensions of value:
• First, the level of choice and flexibility offered by a market. As choice and flexibility in a market increase, so do the possibilities for achieving good value. This choice and flexibility could include a greater number of providers, different options for payment, or scope to have a varied amount of usage without paying more per unit.
• Second, the extent to which consumers are able to access and use information effectively in that market. Where there is an absence of information, or the information that does exist is not used effectively by consumers, the scope for achieving good value is diminished. Possibilities for achieving good value are increased by providing clear and transparent information, and helping consumers to use it.
Generally, the best value for low income consumers can be achieved by having markets that are flexible with a lot of consumer choice; and by
SOCIAL MARKET FOUNDATION
8
having clear information that is well-tailored to the needs and skills of consumers.
POLICY RECOMMENDATIONSBased on these findings, this report makes policy recommendations in four key areas:
1. Increase consumer access to information.
There is more that can be done to provide consumers with clearer, more concise and more transparent information, thereby increasing the second dimension of value. Suggestions include:
• Provide a barcode – or quick-response (QR) code – with each bill consumers receive. Using mobile phone barcode scanning technology, consumers would be able to compare their costs with those of other consumers instantly on price comparison sites. A feasibility study has recently concluded that there are no barriers to the implementation of QR codes on consumer energy bills.4 Barcodes should be added to bills when consumers buy goods including utilities, insurance, and mobile phones.
• Require companies to give comparison information at the point of sale. Examples include requiring mobile phone companies to inform a customer of the average price paid for their tariff before they consent to a contract. This is important since, currently, there is variation between consumers in the amount they are required to pay for a given tariff. Customers would then know whether the price they are being offered is above or below the average paid by other consumers.
There is, however, a limit to how effective information can be as a tool to increase consumer value. As our findings on different attitudes to switching and negotiating demonstrate, there are likely to be some consumers that still do not switch provider, even after information provision has been improved. This policy objective should, therefore, be pursued alongside our other recommendations.
BARGAINING ON A LOW INCOME
9
2. Encourage greater use of collective switching and reverse auction schemes.
Collective switching schemes can improve consumers’ access to information and increase rates of consumer switching, thereby improving the second dimension of value by providing better information and reducing consumer inactivity. They can also increase the bargaining power of consumers by negotiating as a group. Successful collective switching schemes have already taken place in the energy market – but there are opportunities to extend their benefits further, both in the energy market and into other markets.
Collective switching schemes could be implemented by housing associations, local authorities and other trusted intermediaries, to get better deals for tenants. The Department of Energy and Climate Change has recently encouraged local authorities to consider what they can do to provide collective switching schemes.5 The findings of this report would support these proposals – and would encourage speeding up their implementation – since they have the potential to provide better value for low income consumers.
Increasing the bargaining power of consumers could also be achieved in a more ambitious way with even greater potential, through the utilisation of real-time reverse auction schemes. In the energy market, these schemes would give consumers access to an online platform on which they would state their energy requirements. Providers would then compete against each other in bidding for the consumer’s business. It would create a market mechanism whereby providers could directly observe what their competitors are doing and respond accordingly. The consumer would then be provided with a list of quotes from different providers, and be free to pick the one they feel is best value. Schemes such as these allow providers to drive market competition through a bidding process, instead of relying on consumer switching.
Regulators would need to enable markets to implement reverse auction schemes. In the energy market in particular, the current high level of
SOCIAL MARKET FOUNDATION
10
regulation makes it difficult for companies to adopt reverse auctions without regulatory reform. In other markets such as telecommunications, regulators also have an important role in aggregating demand, since providers would be more likely to participate in reverse auction schemes when there are large numbers of consumers using them. Regulators could do this by providing an online platform from which reverse auctions would take place. This could be achieved by providing incentives, raising awareness of the incentives, and encouraging consumers to sign up to the platform.
3. Move towards charging per unit, rather than having fixed cost tariffs.
Fixed cost tariffs – such as daily gas and electricity charges and fixed monthly charges for landlines – penalise low-volume users, who pay more per unit because of their lower levels of consumption. Many low-volume users have lower incomes. Moving towards charging per unit rather than having a fixed charge would give low-volume users the same cost per unit as higher-volume users. This would increase choice and flexibility for low income consumers – improving the first dimension of value. Having a single per-unit charge may also increase the transparency and simplicity of information. Examples include:
• Reducing or eliminating per-day costs for gas and electricity, which result in poor value for those using small quantities of gas and electricity.
• Reducing or eliminating fixed landline charges by passing the costs onto other areas of telecoms pricing, such as broadband tariffs. This is particularly important since landline charges result in poor value for those requiring cheaper and lower speed internet at home.
BARGAINING ON A LOW INCOME
11
4. Provide better value for those budgeting in the short term.
Budgeting over the longer term can increase the value consumers get when buying products and services. Using monthly direct debits for energy bills, paying for insurance premiums annually, and paying for public transport passes over the longer term, can all increase value for money.
Yet many low income consumers budget over the shorter term for good reasons, focused on a desire to keep close control over their budgets. This can lead to greater predictability of outgoings, the avoidance of one-off unmanageable bills, and can help consumers stay free of debt. However, the way in which many markets are structured disadvantages those choosing to budget over the short term.
Policymakers and regulators could do three things to help those budgeting over the short term. First, flexibility should be improved by ensuring companies provide products suitable for those budgeting weekly. An example would be to conduct a review of the feasibility of giving consumers the option to pay by weekly direct debit. Second, development could be supported of innovative products to make those budgeting in the short term less expensive to serve. This could be achieved through the use of tax incentives. An example would be to provide energy companies with greater incentives to make prepayment meters more efficient, such as by allowing automated payment by mobile phone. Third, where low income consumers do wish to budget over the longer term as a way to get better value, they could be helped to achieve this goal, such as by providing financial advice and education.
SOCIAL MARKET FOUNDATION
12
INTRODUCTIONMost research into poverty and living standards has focused on income rather than expenditure. The main poverty threshold in the UK is the internationally accepted standard of 60% of median income, whilst discussions of changes in living standards more broadly since the recession have focused on falling median incomes. Incomes typically provide a good proxy of individuals’ opportunities for consumption, but focusing on their expenditure captures their level and standards of consumption in a more direct way.
The lack of research into expenditure is not a trivial issue, since the relationship between income and expenditure may be complicated. Evidence suggests that households with different levels of income have experienced different levels of inflation in recent years, not least because the prices of certain essential goods – such as energy and food – have increased more rapidly than other goods, and lower income households spend a greater proportion of their income on these items. Additionally, other evidence suggests that lower income consumers may pay a higher price for the same goods and services than higher income consumers – the so-called ‘poverty premium’. Various UK regulators have taken a keen interest in this phenomenon, with some reporting the cross-subsidisation of higher income customers by lower income customers in certain markets. There has also been a focus on the different constraints faced by lower income consumers, including a lack of information and ‘enabling’ products (such as bank accounts and internet access), and a different set of priorities and risks as compared with those on middle or higher incomes.
In the context of widespread concern about falling living standards, particularly for those in the bottom half of the income distribution, understanding consumers’ relationships with different markets – including the extent to which they are able to get good value – is very important. Most current discussions of living standards focus on benefits, earnings and taxes – all of which influence incomes – but an understanding of expenditure is also very important, both for public debate and for suppliers serving lower income consumers. The latter is true in particular since
BARGAINING ON A LOW INCOME
13
several regulators have found products to be unsuitable for the needs and demands of lower income consumers; greater understanding of their needs and demands would improve the market for both supplier and customer.
The key objectives of this project are, therefore, as follows. First, to understand the consumption patterns of low income households, including ascertaining the markets in which they spend most. Second, given we know from research into the poverty premium that low income consumers are disadvantaged in some markets, to ask what the reasons are for this. In particular, it is important to understand exactly how these disadvantages impact on consumers, and why consumers behave in the way they do in the markets in which they spend money. The third task is to ask – based on this understanding of the ways in which low income consumers interact with different markets – what policymakers and regulators can do to further enable low income consumers to get better value.
Research methodology and focus
Our research consists of the following elements:
• A literature review to outline what is already known about the spending patterns of households, the way in which spending patterns relate to households’ position in the income distribution, and what is known about the ‘poverty premium’.
• Analysis of household expenditure across different markets, including how lower income households’ spending patterns differ from other households; and a typology of different low income households based on their expenditure patterns.
• Two focus groups with low income respondents, including a discussion of key markets in which these respondents spend most of their money, and their behaviours and attitudes towards value in different markets.
• 12 paired interviews with low income respondents, focusing on the different attitudes and behaviours of respondents in making purchasing decisions, including exploring a ‘consumer journey’ of key things each respondent has done to get better value.
SOCIAL MARKET FOUNDATION
14
• A nationally representative poll focusing on consumers’ perceptions of value across key markets and usage of different information products and switching or negotiating behaviour, along with an analysis of differences across the income distribution.
• A seminar on policy implications with experts in a range of fields, to guide the development of the options policymakers and regulators might have in responding to the findings of this report.
This report is structured as follows.
Chapter 1 sets out what is already known from the literature on the inflation experiences and spending patterns of low income households, including the way in which they differ from higher income households, and outlines recent research into the poverty premium. Chapter 2 presents an overview of expenditure patterns from our analysis of the Living Costs and Food Survey, in order to show how household expenditure varies by income group, along with the diversity of patterns amongst those on low incomes. It then presents the results of three original pieces of empirical work conducted for this study: 12 paired depth interviews, two focus groups, and a nationally representative poll. It details respondents’ behaviour in different consumer markets, perceptions of the value they get in different key areas of their spending, reasons for these differences, and the strategies they have pursued in order to get better value. Finally, Chapter 3 discusses the implications of the key findings for policy and regulation. It presents different options policymakers and regulators could pursue in order to help low income consumers achieve better value in different markets, based on the insights from the previous chapters.
BARGAINING ON A LOW INCOME
15
CHAPTER 1: LOW INCOME EXPENDITURE AND THE POVERTY PREMIUM This chapter sets out what is already known about the expenditure patterns of different households, including differences in these patterns between households across the income distribution. It focuses first on the different rates of inflation of different income groups. It shows that lower income households spend proportionately more than higher income groups on essential items such as food and energy. Since these essential products have been subject to above average price increases in recent years, those on lower incomes have experienced above average rates of inflation. This demonstrates the importance of complementing a focus on income by also examining expenditure, since different patterns of expenditure between groups can illustrate variations in standards of living not picked up by looking only at income and average inflation rates. Second, it introduces the concept of the poverty premium, demonstrating the ways in which lower income households can spend more on the same products as compared to those on higher incomes. It also sets out how the poverty premium will be used as an analytical tool.
I. Rates of inflation for different income groups
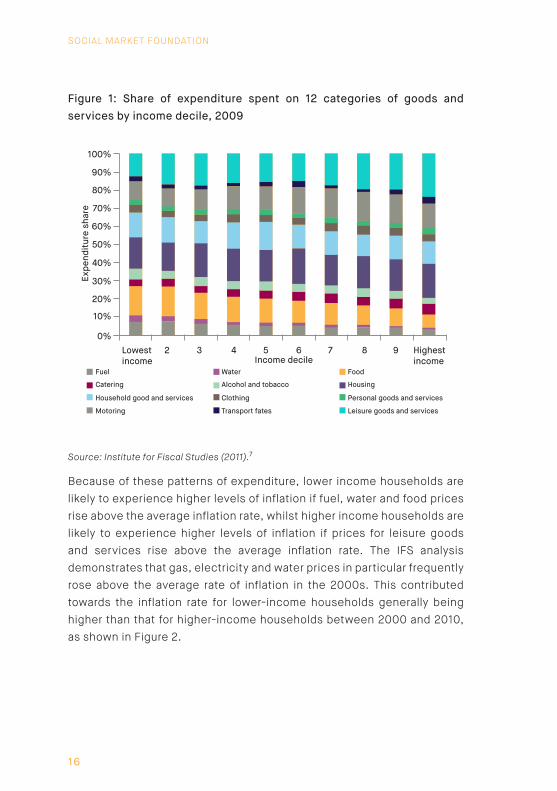
Individual experiences of inflation in the UK vary widely depending on the type of goods different people actually buy: the inflation rate a particular individual experiences in a given year can be very different to the average inflation rate. Moreover, people’s experiences of inflation are linked to their position in the income distribution. Those on lower incomes tend to spend a greater proportion of their income on essential goods. Lower income households also tend to spend (rather than save) a much greater proportion of their total income than richer households. The Institute for Fiscal Studies (IFS) estimated that, in 2009, households in the highest income decile spent around 50% of their income, whilst those in the lowest income decile spent around 140%.6 When one considers expenditure on goods as a proportion of total expenditure, however, the IFS analysis for 2009 shows that the three goods that lower-income households consistently spent more on were fuel, water and food, whilst higher-income households consistently spent more on leisure goods and services, as shown in Figure 1.
SOCIAL MARKET FOUNDATION
16
Figure 1: Share of expenditure spent on 12 categories of goods and services by income decile, 2009
2 3 4 5 6 7 8 9 HighestincomeIncome decile
Fuel
Catering
Household good and services
Motoring
Water
Alcohol and tobacco
Clothing
Transport fates
Food
Housing
Personal goods and services
Leisure goods and services
Expe
ndit
ure
shar
e
Lowestincome
0%
10%
20%
30%
40%
50%
60%
70%
80%
90%
100%
Source: Institute for Fiscal Studies (2011).7
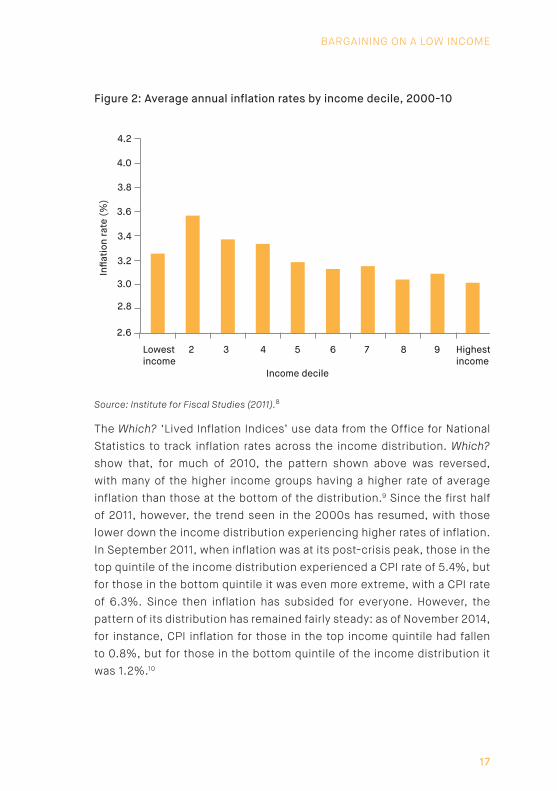
Because of these patterns of expenditure, lower income households are likely to experience higher levels of inflation if fuel, water and food prices rise above the average inflation rate, whilst higher income households are likely to experience higher levels of inflation if prices for leisure goods and services rise above the average inflation rate. The IFS analysis demonstrates that gas, electricity and water prices in particular frequently rose above the average rate of inflation in the 2000s. This contributed towards the inflation rate for lower-income households generally being higher than that for higher-income households between 2000 and 2010, as shown in Figure 2.
BARGAINING ON A LOW INCOME
17
Figure 2: Average annual inflation rates by income decile, 2000-10
2 3 4 5 6 7 8 9
Infla
tion
rate
(%)
2.6
2.8
3.0
3.2
3.4
3.6
3.8
4.0
4.2
Highestincome
Lowestincome
Income decile
Source: Institute for Fiscal Studies (2011).8
The Which? ‘Lived Inflation Indices’ use data from the Office for National Statistics to track inflation rates across the income distribution. Which? show that, for much of 2010, the pattern shown above was reversed, with many of the higher income groups having a higher rate of average inflation than those at the bottom of the distribution.9 Since the first half of 2011, however, the trend seen in the 2000s has resumed, with those lower down the income distribution experiencing higher rates of inflation. In September 2011, when inflation was at its post-crisis peak, those in the top quintile of the income distribution experienced a CPI rate of 5.4%, but for those in the bottom quintile it was even more extreme, with a CPI rate of 6.3%. Since then inflation has subsided for everyone. However, the pattern of its distribution has remained fairly steady: as of November 2014, for instance, CPI inflation for those in the top income quintile had fallen to 0.8%, but for those in the bottom quintile of the income distribution it was 1.2%.10

SOCIAL MARKET FOUNDATION
18
II. The ‘Poverty Premium’
On top of experiencing higher rates of inflation due to steeply rising prices of essential goods such as fuel, lower income households may face an additional disadvantage in that they may pay more for certain goods and services than richer households. This phenomenon has been described as a ‘poverty penalty’ or ‘poverty premium’ for poor households. The historical roots of the concepts derive from the sociological work of David Caplovitz (1963) on the processes by which poorer people in New York may come to pay higher prices for the same products.11 The term ‘poverty penalty’ features predominantly in International Development literatures, referring in particular to the experiences of the global poor, rather than poorer households in richer countries. It describes “the relatively higher cost shouldered by the poor, when compared to the non-poor, in their participation in certain markets”.12
The conceptually similar term ‘poverty premium’ has been taken up over the last ten years by many UK-based organisations – particularly in the charity sector – as part of a campaign to highlight the multiple aspects of disadvantage faced by low income households. It focuses, for instance, on calculating the relatively higher prices paid by low income consumers for a defined basket of essential goods.13
Several UK charities have, in recent years, campaigned to raise awareness of the poverty premium. Save the Children (2011) gave a hypothetical illustration of the poverty premium where a low-income family with two adults and two young children, with one adult in work, would pay a premium of £1,280 per year relative to costs for a typical middle-income household. These higher costs derived, for instance, from higher bank costs through more expensive financial products (such as loans and credit), through higher insurance costs from living in a less ‘desirable’ (and presumably less crime-free) area, and higher fuel bills as a consequence of being on a more expensive tariff, such as a prepayment meter.14

BARGAINING ON A LOW INCOME
19
Definitions of the poverty penalty and poverty premium
Mendoza (2011) identifies the following five forms of a poverty penalty:15
1. Poorer quality, whereby lower-income consumers may obtain a poorer quality product for the same price paid by higher-income consumers;
2. Higher price, whereby lower-income consumers pay a higher price than higher-income consumers for the same products;
3. Non-access, whereby these higher prices for low-income consumers make an item entirely unaffordable;
4. Non-usage, whereby higher prices lead low-income consumers to decide against purchasing a particular product;
5. Catastrophic spending burden, where it is an absolute necessity to purchase a good, but the prices available to low-income consumers are entirely unaffordable – this may particularly be the case in healthcare markets, and can lead to an impossible choice between avoiding the purchase of a necessity and financial ruin.
The Joseph Rowntree Foundation (2013) identifies the following four types of poverty premium:16
1. Paying higher than average for utility tariffs for a given amount of consumption;
2. Paying more per unit of consumption because of being a low user;
3. Paying more because of limited financial and communications capabilities;
4. Paying high interest on consumer credit.

SOCIAL MARKET FOUNDATION
20
The approach taken for this research is to look for evidence of two different types of poverty premium:
1. Differences between low and higher income consumers in paying more for the same products and services than higher income consumers;
2. Differences due to paying more per unit of consumption because of low income consumers wishing, on average, to consume fewer units.
The approach will then look to find explanations for these types of poverty premium in two ways:
1. On the demand-side: consider how constraints and capabilities vary between low and higher income consumers, including skills, availability of time, ways of accessing information, and access (or not) to enabling products such as the internet, a car, or affordable credit.
2. On the supply-side: consider aspects of each market that disadvantage low income consumers (sometimes inadvertently), such as the way in which tariffs are structured, or inflexibility around payment methods.
BARGAINING ON A LOW INCOME
21
CHAPTER 2: CONSUMER VALUE IN DIFFERENT MARKETSChapter 1 showed how a focus on expenditure reveals much higher than average rates of inflation for those on low incomes. It also demonstrated that those on low incomes face an additional disadvantage of paying more for the same goods and services than those on higher incomes. It is clear, therefore, that action may be required to address the disadvantages people on low incomes can face in consumer markets. However, while we know that disadvantages exist in some markets, we need greater understanding of exactly how these disadvantages impact on consumers, and why consumers behave in the way they do in different markets. This more comprehensive understanding will enable the design of better policy to help consumers get better value.
The aim of this chapter, therefore, is to provide a greater understanding of the behaviours and attitudes of low income consumers in terms of the way that they interact with markets in which they spend money, and the reasons for these behaviours and attitudes. It draws on the results of original secondary data analysis, two focus groups, 12 interviews, and a nationally representative poll. It gives information about markets that are functioning well, including consumers’ explanations of why they are able to get good value. It also gives information about markets that are functioning badly, including consumers’ explanations of the barriers they face in getting better value.
The first section gives some context by reporting on the overall expenditure patterns of low income households, using data from the Living Costs and Food Survey. It makes two main points: first, that expenditure patterns vary markedly between low income and higher income households; and second, that there is a large amount of variation between low income households in terms of their expenditure patterns. This point is illustrated by presenting the diversity found amongst different groups of low income households, based on the results of some cluster analysis. The presence of this diversity amongst low income households makes it even more important to use qualitative research

SOCIAL MARKET FOUNDATION
22
in order to better understand the range of consumer behaviours and attitudes across different markets.
The second section analyses each key market discussed in the interviews and focus groups to present the range of attitudes towards value, and behaviours and strategies used to get better value. It shows how attitudes towards value differ depending on the market in question, and presents the reasons for these differences. The third section discusses the importance of sources of information in obtaining value, and shows that the internet in particular – both in terms of access and the skills to use it – is a crucially important ‘enabler’. The fourth section discusses the notion of the ‘active consumer’, and illustrates two attitudes. Some respondents took pride in being ‘active consumers’, and discussed cases where they had switched or negotiated to get better value. Other respondents, however, disliked such behaviour, and preferred relationships with providers based on cooperation and trust. The fifth section explores budgeting timeframes, and argues that there are important differences in perceptions of value depending on whether respondents budget daily, weekly, monthly or yearly. The sixth and final section outlines common variations across different markets. It highlights two dimensions that are particularly important in understanding whether or not consumers get good value: choice and flexibility; and access to information.
I. The variation in expenditure patterns of low income households
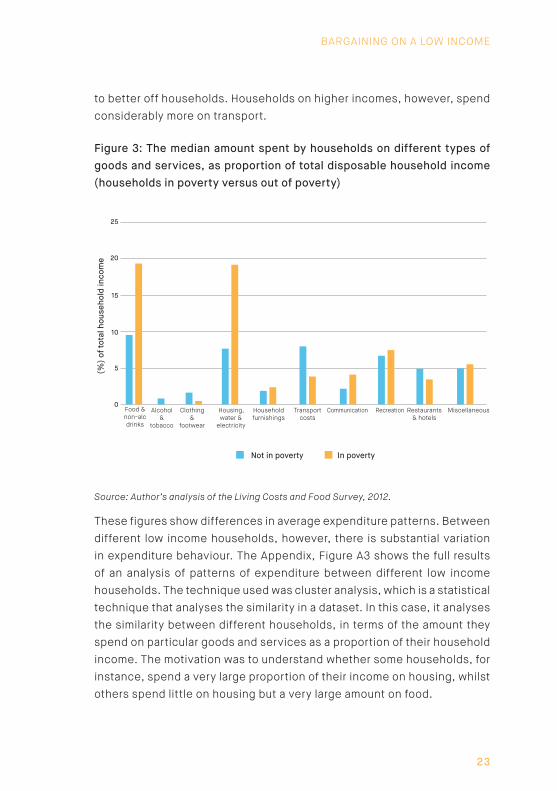
Chapter 1 showed how spending on some goods – notably food and fuel – make up a much greater proportion of total expenditure for households lower in the income distribution. Figure 3 compares households with below 60% median equivalised income – that is those households considered to be in poverty, using the government’s standard definition – with households with greater than 60% median income. Median expenditure as a proportion of household income is shown for the two groups, in each of 10 categories of goods and services. As one can see, low income households spend a much greater proportion of their income on food and non-alcoholic beverages, and housing, water and electricity, compared
BARGAINING ON A LOW INCOME
23
to better off households. Households on higher incomes, however, spend considerably more on transport.
Figure 3: The median amount spent by households on different types of goods and services, as proportion of total disposable household income (households in poverty versus out of poverty)
0Food & non-alc drinks
Alcohol &
tobacco
Clothing &
footwear
Housing, water &
electricity
Householdfurnishings
Transportcosts
Communication Recreation Restaurants& hotels
Miscellaneous
5
10
15
20
25
(%) o
f tot
al h
ouse
hold
inco
me
Not in poverty In poverty
Source: Author’s analysis of the Living Costs and Food Survey, 2012.
These figures show differences in average expenditure patterns. Between different low income households, however, there is substantial variation in expenditure behaviour. The Appendix, Figure A3 shows the full results of an analysis of patterns of expenditure between different low income households. The technique used was cluster analysis, which is a statistical technique that analyses the similarity in a dataset. In this case, it analyses the similarity between different households, in terms of the amount they spend on particular goods and services as a proportion of their household income. The motivation was to understand whether some households, for instance, spend a very large proportion of their income on housing, whilst others spend little on housing but a very large amount on food.
SOCIAL MARKET FOUNDATION
24
The cluster analysis revealed that there are many different expenditure patterns, and a substantial amount of variation between different low income households. Figure A3 in the Appendix shows that low income households can be categorised in terms of nine different groups. Expenditure on housing ranges between the groups from an average of only 10% of household disposable income for Group 7 to a clearly unsustainable level of 113% of disposable income for Group 1. The majority of the nine groups spent, on average, nothing on alcohol and tobacco, but for those in Group 8 spending on alcohol and tobacco made up a quarter of their income.
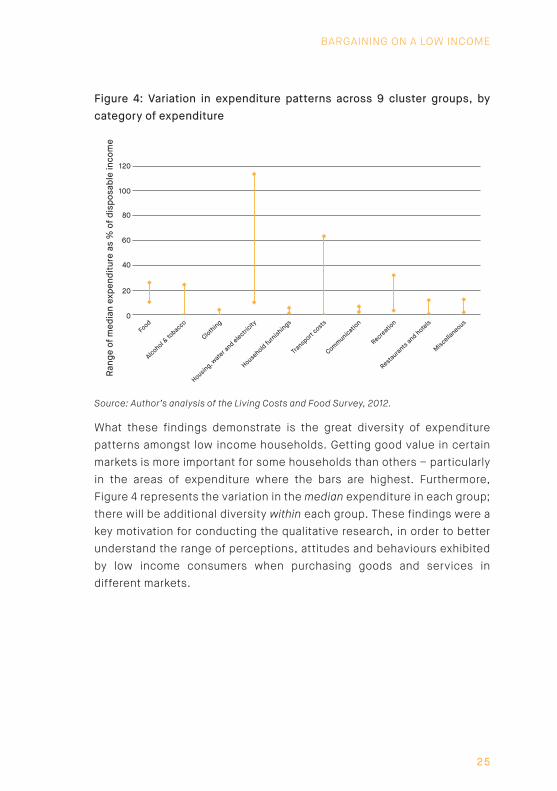
Figure 4 shows the extent of the variation in expenditure across the nine cluster groups. In each category of expenditure, the highest point represents the median amount spent by the group with the highest expenditure in that category, and the lowest point represents the median amount spent by the group with the lowest expenditure in that category, as a proportion of disposable household income. One can see that spending on transport varied a large amount between the groups, with the group spending the least having zero median spend, and the group spending the most having over 60% median spend. Spending on food varied between around 10% to around 25% of disposable income. By contrast, spending on clothing, household furnishings, and communication had much less variation between the different cluster groups.
BARGAINING ON A LOW INCOME
25
Figure 4: Variation in expenditure patterns across 9 cluster groups, by category of expenditure
0
20
40
60
80
100
120
Ran
ge o
f med
ian
expe
ndit
ure
as %
of d
ispo
sabl
e in
com
e
Food
Alcohol & to
bacco
Clothing
Housing, w
ater and electri
city
Household fu
rnish
ings
Transp
ort costs
Communication
Recreatio
n
Restaurants
and hotels
Miscella
neous
Source: Author’s analysis of the Living Costs and Food Survey, 2012.
What these findings demonstrate is the great diversity of expenditure patterns amongst low income households. Getting good value in certain markets is more important for some households than others – particularly in the areas of expenditure where the bars are highest. Furthermore, Figure 4 represents the variation in the median expenditure in each group; there will be additional diversity within each group. These findings were a key motivation for conducting the qualitative research, in order to better understand the range of perceptions, attitudes and behaviours exhibited by low income consumers when purchasing goods and services in different markets.
SOCIAL MARKET FOUNDATION
26
II. Consumer value in each key market: attitudes and behaviours of those on low incomes
This section presents the results of the qualitative research in terms of the range of different perceptions of value in each key area of expenditure discussed by respondents, along with the reasons for these views and differences in self-reported consumer behaviour. Where appropriate it also illustrates each of the issues with results from the nationally representative poll.
GROCERIES
From both the interviews and focus groups there was a strong sense that respondents were very knowledgeable about getting good value for their grocery shopping, and most were able to describe instances where they had got excellent value. Food shopping was generally thought about daily, and most people went shopping at least two or three times a week. Strategies for searching for good deals included shopping at multiple shops and supermarkets – for instance by buying particular products in a shop where they were cheaper or better quality – or by buying in bulk when products they were highly likely to consume were at low prices. The view was frequently expressed that food shopping had become more expensive in recent years, with some respondents highlighting 2007 as a date when prices had started rising faster than incomes. However, respondents thought that there were a great variety of options when people shop for food. Strategies cited for coping with increasing prices included using cheaper supermarkets, online discount deals, or local markets. This gave the impression that the grocery market has a large amount of competition, and that consumers are able and motivated to ‘shop around’ flexibly in order to search for good deals. This finding is substantiated by research elsewhere which shows that low income consumers may actually pay less for identical grocery products, as compared with higher income consumers.17
BARGAINING ON A LOW INCOME
27
Areas where value was perceived to vary included:
1. Age: people thought that older respondents had more experience in finding good deals, backed up by greater knowledge of the places to shop for them. In addition, older people were seen as better able to ‘make the most’ of the food they did buy, with greater cooking skills and more reluctance toward letting food go to waste. These perceptions from the interviews and focus groups were backed up by the findings of the nationally representative poll, and appear to hold true for people of all income groups: older people were more likely to think they got good value when shopping for food (see Figure 5). These advantages were, however, partially offset by the greater internet skills of younger people, although the internet was only a limited source of information for grocery shopping, and only a small number of respondents bought food over the internet. This meant that the internet appeared to have limited capacity to increase value for grocery purchases, at least relative to other areas of spending.
2. Frequency of purchases: people had differences of opinion over whether more or less frequent purchases were beneficial to increasing value in grocery shopping. On the one hand, some respondents took pride in searching for good deals, particularly for non-perishable products, and buying a large quantity – often intended to last many months – in order to save over the long run. On the other hand, other respondents preferred to buy items on a short term basis, often daily. This was sometimes motivated by a reluctance to spend a large amount of money at once, but at other times by a view that buying only what was absolutely necessary each day was the best way to keep control of the grocery budget and minimise waste.
SOCIAL MARKET FOUNDATION
28
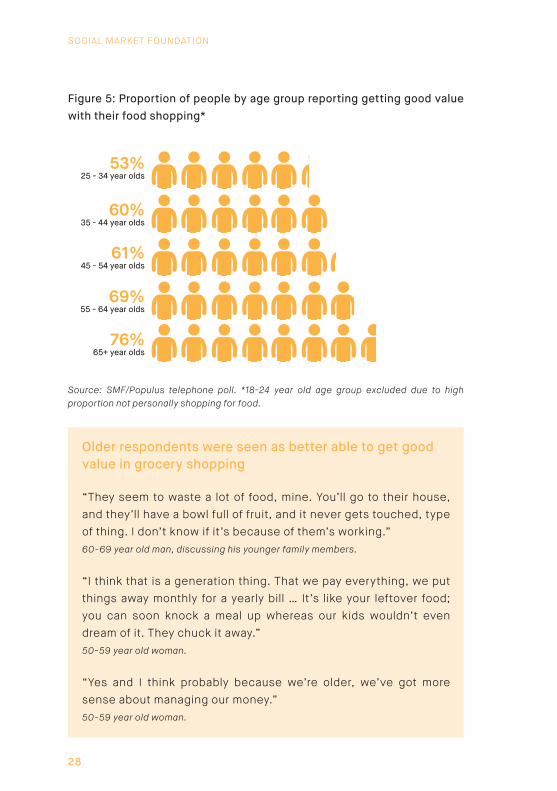
Figure 5: Proportion of people by age group reporting getting good value with their food shopping*
53%25 - 34 year olds
60%35 - 44 year olds
61%45 - 54 year olds
69%55 - 64 year olds
76%65+ year olds
Source: SMF/Populus telephone poll. *18-24 year old age group excluded due to high proportion not personally shopping for food.
Older respondents were seen as better able to get good value in grocery shopping
“They seem to waste a lot of food, mine. You’ll go to their house, and they’ll have a bowl full of fruit, and it never gets touched, type of thing. I don’t know if it’s because of them’s working.”60-69 year old man, discussing his younger family members.
“I think that is a generation thing. That we pay everything, we put things away monthly for a yearly bill … It’s like your leftover food; you can soon knock a meal up whereas our kids wouldn’t even dream of it. They chuck it away.”50-59 year old woman.
“Yes and I think probably because we’re older, we’ve got more sense about managing our money.”50-59 year old woman.

BARGAINING ON A LOW INCOME
29
Respondents had differing opinions on whether shopping daily or occasional bulk buys provided best value
“I’ll have a stack of everything that you generally need, you know, tea, coffee, sugar that’s always in and tinned stuff. But sometimes I find I’m better if I shop daily.”50-59 year old woman.
“Yes, you can find better bargains if you do it that way [daily]. If you go and shop, I find in bulk, I buy things I don’t need.”70-79 year old woman.
“I do look for the offers definitely when shopping [but] I wouldn’t bulk buy that much, you know, enough to last for months sort of thing … They’re bulky, aren’t they?”40-49 year old woman.
“If you see anything, and you think it’s what we could put in the freezer for another time, get it, type of thing, if it’s a reasonable price … But if there’s a bargain there, I’ll take it.”60-69 year old man.
ENERGY
There was widespread acknowledgement that energy prices have increased dramatically in recent years. This was perceived by some as implying that energy bills were bad value, which were described by some respondents as a ‘rip off’. Many respondents described having been on a fixed tariff for a period of time, before being shocked at receiving a very large bill when the fixed tariff ended. Rather than being seen as good value, some respondents instead saw the lack of communication over future changes to their bill when their fixed period ended as problematic and, at times, misleading. Respondents reported a tension between a desire to achieve better ‘value’ as an energy customer and the certainty, security and control that comes from being on a fixed tariff.

SOCIAL MARKET FOUNDATION
30
The views cited above are illustrative of a more widely expressed issue: that the information given by energy providers is confusing and unclear. Understanding the costs associated with a tariff was seen to be difficult, with frustration expressed that meter units and kWh units did not match up, and confusion surrounding daily charges and charges per unit. Concerns were also raised over the cost of fixed daily charges for those wishing to have a low volume of consumption. This is consistent with Ofgem’s (2014) recent report on fixed charges affecting value for low income energy customers, which found that recent energy market reforms have actually increased prices for low volume gas and electricity customers.18
Some respondents expressed a desire to understand ‘how much it costs to put the tumble dryer on’, and frustration that a simple answer was not forthcoming. Many people relied on anecdotal evidence for how to reduce their energy consumption – such as a parent’s advice that a kettle used a lot of electricity – rather than more systematic and detailed information.
Respondents expressed frustration with confusing and unclear pricing and bills
“See I think the only things that you don’t get good value for money for nowadays is your energy companies … We phoned them up the other day … and she said … ‘we’ve changed your tariff’. Now I’d not been informed that the tariff was changing … I mean I shouldn’t be having to phone them up and say, ‘Send me a bill’.”60-69 year old man.
“[I] just go for the cheapest [tariff]. But then some of them, they say they’re the cheapest and then they go up, don’t they. When they’ve had you in for six months it’s the cheapest but then it doubles in price.”30-39 year old woman, discussing gas and electricity deals.

BARGAINING ON A LOW INCOME
31
Many people discussed strategies for managing energy costs effectively. These included:
1. Switching provider: many respondents discussed the importance of switching provider in order to reduce their energy bills. Low income consumers were, however, significantly less likely to switch providers than higher income consumers: Figure 6 shows the proportion of poll respondents having switched telecoms or energy supplier in the last two years, by household income, illustrating the particularly low level of switching amongst the lowest income group.
2. Changing payment methods: in contrast to the confusing nature of tariffs and unit costs, many respondents were aware that direct debit was the cheapest method of payment. Some also valued it as a way of managing bills over the year, as a ‘savings mechanism’ to cope with winter fuel usage. Standard quarterly bills were generally viewed negatively, mainly because of perceptions that they could be unpredictable, but also because switching to direct debit was cheaper. Views were mixed on pre-payment meters (PPMs). Some described the cost savings of switching to direct debit, but others valued the short-term control over budgets implied by PPMs, even when it was acknowledged that this resulted in higher costs overall.
These views highlight a difference in attitude between respondents. Some saw energy prices as fixed – something imposed on them externally and over which they had no control. Others, however, took pride in their yearly switching and, despite acknowledgement of recent price increases, found ways to achieve lower bills. These people saw an active role for themselves in the energy market rather than viewing prices as being imposed upon them. People that had managed to overcome the confusing information presented to them were more likely to be able to find ways of reducing their bills.

SOCIAL MARKET FOUNDATION
32
Figure 6: Proportion of respondents having switched telecoms or energy provider over last 2 years, by household income
<£14k
£14k - £28k
£28k - £41k
£41k - £50k
£50k+
0% 10% 20% 30% 50%40% 60%
Hou
seho
ld in
com
e
Source: SMF/Populus telephone poll.
HOUSING
Out of all markets, housing was seen as the least flexible in terms of the ability to change expenditure and get better value. It was, in a large number of cases, seen as a fixed expense that was impossible to change, and respondents felt few strategies were available to enable them to get better value. This was true in particular for local authority or housing association tenants, who saw decisions over their housing as being ‘made for them’. Reasons for these views included:

BARGAINING ON A LOW INCOME
33
1. Prices being largely determined ‘externally’. Private rents were frequently seen as being imposed by landlords and being non-negotiable. In the context of rising rent prices, there was a sense that negotiating was impossible because there would be no better options elsewhere, and rents in London were particularly likely to be considered unaffordable. Renters appeared to view housing costs as a fact of life, and not something one could do anything about, so the idea of getting value was not really applicable. Social housing rent prices were also seen as being imposed externally. There was, however, more of a feeling of choice amongst homeowners, and there was some limited discussion of the value of switching mortgage providers.
2. Difficulties in moving home. This problem was frequently discussed. Constraints included: children’s access to a particular school; children being unwilling to move as they were ‘settled’; the high financial and time costs involved with moving; and a lack of feasible and affordable alternatives. This latter issue was seen as especially problematic for people in social housing, as the possibility of moving to a different home within the social housing sector was viewed as very difficult, and moving outside the sector was seen as unaffordable.
Rent costs were seen as imposed externally, but a limited number of respondents discussed the flexibility of switching mortgages
“I’ve only got a £10,000 mortgage left now and we’ve just done that on a new deal so it’s at 2.99 per cent, so that’s quite a good deal for two years and then it’ll be gone, crossed fingers … we searched for the best deal, or what we thought was the best deal.”50-59 year old woman.
SOCIAL MARKET FOUNDATION
34
“I was doing a [mortgage] product transfer and it was going through [an] application to apply for a new mortgage again and what have you.”50-59 year old woman.
• “You’re told how much it is and you have to pay it.
• But then you could always move to somewhere that is cheaper to rent.
• You can change every year or 18 months, can’t you, if you want to do that. Most people…
• Just settle.
• If it’s a private let; council you can’t.
• You can if you own a mortgage, can’t you. You can see if there’s any fixed rates or what’s going to work.”
Focus group discussion on rent.
Many different constraints contributed towards a perception that moving home is very difficult
• When you’ve got children, you have to stay where you are, because obviously, schools and friends … with my boys, at the ages they are, they would just not move, so there’s no way.
• I think once you’ve been in a property for so many years, you’ve got your neighbours, your friends are all around you. You don’t want to up sticks and move to somewhere you don’t know. You’ve got to prioritise, I think and just sacrifice.”
Focus group discussion on rent and moving constraints.
BARGAINING ON A LOW INCOME
35
TRANSPORT
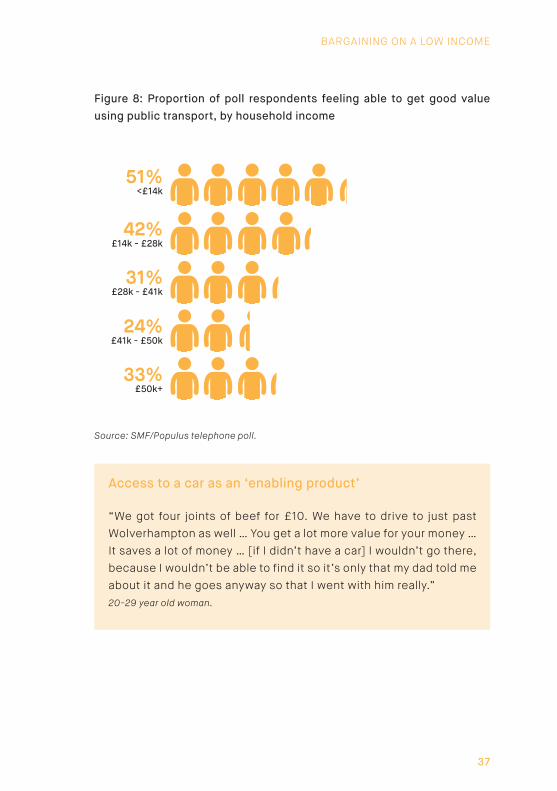
Attitudes towards value and strategies for getting better value with regard to spending on transport varied between respondents. There were inevitably differences in views depending on the mode of transport most often used by respondents: those discussing car ownership and running costs focused on different issues to those that used public transport. There were clear differences in attitudes towards value in public transport and in running a car between income groups. Low income groups were more likely to think public transport was good value, but less likely to think running a car was good value, compared to those on higher incomes (see Figures 7 and 8). What is more, for some respondents car usage was clearly seen as an ‘enabling’ product: car usage could provide value in other areas of spending, as is consistent with the findings of other research.19 For one respondent, the ability to travel with her father by car to a local butcher’s shop allowed her to buy meat at lower prices and better quality than would have been possible otherwise. For respondents with good access to public transport, however, the importance of a car as an ‘enabler’ was reduced.
When discussing strategies to get better value, there was a focus on the importance of reducing car insurance costs, which were seen by some as being prohibitively high. Switching using online services was a common means of improving value. The fact that paying in instalments is often more expensive than paying annually was discussed, and paying annually was a key strategy for reducing costs. However, some respondents lacked the disposable income or access to credit required to pay an annual lump sum. In addition, there was some discussion of ‘downsizing’ in order to get better value, as smaller cars can attract lower rates of vehicle excise duty and can have more efficient fuel consumption. Sharing lifts with other respondents was also a common strategy for reducing costs, and several respondents without access to a car themselves explained how helpful their friends were in providing them with access to a car.
Discussion of public transport mainly focused on bus services. Bus fares were likely to be seen as fixed in cost – and therefore there were few

SOCIAL MARKET FOUNDATION
36
strategies available for low income consumers to negotiate better value. Some respondents had a choice of local bus operators and the option of choosing a better value provider. However most respondents focused only on reducing their use of buses as a way of saving money. Some retired respondents had access to free bus passes, which were generally talked of favourably and were used in some cases as an alternative to car travel, as a means of saving money.
Figure 7: Proportion of poll respondents feeling able to get good value with running a car, by household income
35%<£14k
41%£14k - £28k
41%£28k - £41k
49%£41k -£50k
44%£50k+
Source: SMF/Populus telephone poll.
BARGAINING ON A LOW INCOME
37
Figure 8: Proportion of poll respondents feeling able to get good value using public transport, by household income
51%<£14k
42%£14k - £28k
31%£28k - £41k
24%£41k - £50k
33%£50k+
Source: SMF/Populus telephone poll.
Access to a car as an ‘enabling product’
“We got four joints of beef for £10. We have to drive to just past Wolverhampton as well … You get a lot more value for your money … It saves a lot of money … [if I didn’t have a car] I wouldn’t go there, because I wouldn’t be able to find it so it’s only that my dad told me about it and he goes anyway so that I went with him really.”20-29 year old woman.
SOCIAL MARKET FOUNDATION
38
COMMUNICATIONS
Spending on television services, landlines, internet packages and mobile phones was frequently discussed. There were several key themes:
• Negotiating with mobile providers by phone can result in excellent value deals. Many respondents reported good results when negotiating with mobile providers over new mobile contracts, and these deals were frequently seen as excellent value. The best strategy was often to wait until a contract had ended, then gather information from the internet and from friends and family, then to contact the existing provider to ask for a similar deal.
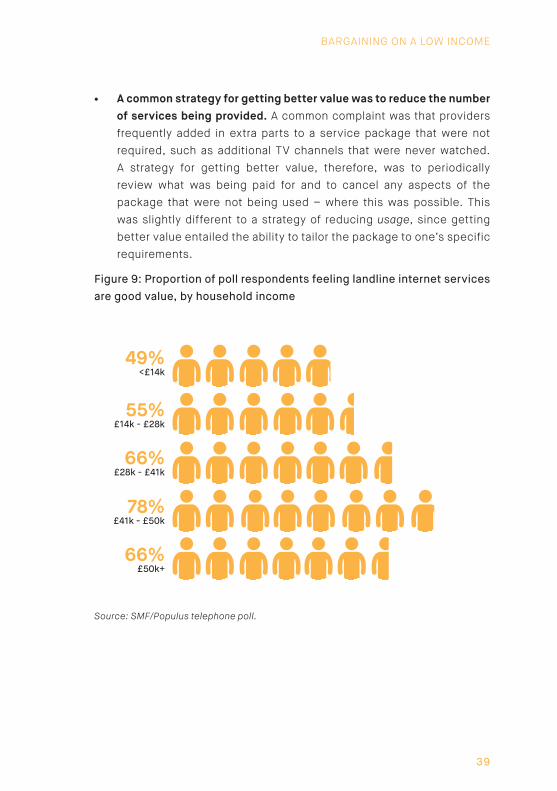
• Charges for landlines were seen as ‘hidden’ and unfair. Particularly when respondents described purchasing (non-mobile) internet services, there were frequent complaints that the accompanying charges for a landline were hidden, a ‘rip-off’ and unfair. Respondents expressed little power to negotiate or get better value with these charges. This may be one of the factors behind the poll finding that lower income respondents were more likely to feel home internet services were poor value: Figure 9 shows a clear trend towards higher income respondents feeling they get better value, aside from a slight dip for the highest income group. This trend contrasts markedly with attitudes to value for mobile phone services, which shows little difference between lower and higher income groups.
• ‘All-in-one’ deals including TV, internet and mobile services were seen as good value. Several respondents expressed satisfaction with packages that combined several services, having often switched from multiple providers previously to a new deal that incorporated each service into a deal that saved money, but provided a comparable level of service.
BARGAINING ON A LOW INCOME
39
• A common strategy for getting better value was to reduce the number of services being provided. A common complaint was that providers frequently added in extra parts to a service package that were not required, such as additional TV channels that were never watched. A strategy for getting better value, therefore, was to periodically review what was being paid for and to cancel any aspects of the package that were not being used – where this was possible. This was slightly different to a strategy of reducing usage, since getting better value entailed the ability to tailor the package to one’s specific requirements.
Figure 9: Proportion of poll respondents feeling landline internet services are good value, by household income
49%<£14k
55%£14k - £28k
66%£28k - £41k
78%£41k - £50k
66%£50k+
Source: SMF/Populus telephone poll.
SOCIAL MARKET FOUNDATION
40
III. The role of information in obtaining value
The source of information used in order to compare products and services was crucially important in framing respondents’ descriptions of whether or not they were able to obtain value, and why. There were a variety of sources that respondents gathered information from, including word of mouth (such as from friends and family), supermarket direct mail, TV advertising, and the internet. In the grocery market direct mail and word of mouth were information sources that were used a large amount. In other markets – notably energy – the internet was an important tool to gather information.
THE INTERNET
As is consistent with the findings of other research, this study found that the internet was a crucially important ‘enabling’ product in terms of access to information. As reported in the interviews and focus groups, there were three main sources of online information for low income consumers:
1. Price comparison sites. These were used by several respondents, particularly for switching their energy or insurance providers.
2. Websites giving expert advice. Two websites that were frequently mentioned were Martin Lewis’ Money Saving Expert, and the Money Advice Service. Respondents found these sites trustworthy and unbiased, with the communication in clear, plain language.
3. Reviews left by other consumers. Some respondents described how, although some reviewers would ‘always complain’, it was possible to get a sense from user reviews about the quality of a product.
Two main things determined whether the internet was a helpful source of information: internet access and skills. With regard to the former, a large majority of interview respondents had access to the internet, although for some this only applied to their mobile phone rather than internet through their landline. With regard to the latter, there was a strong perception that younger people had better internet skills than older people, and that this could be a serious barrier for older people in obtaining information that could enable them to get value. A common strategy to get around this was

BARGAINING ON A LOW INCOME
41
to ask a younger person – often a family member – for help, and some respondents reported having successfully switched providers online when this help was provided. For other respondents a lack of skills put them off using the internet entirely. The poll results shown in Figure 10 illustrate that younger respondents were much more likely than older respondents to use internet comparison sites. Furthermore, usage of comparison sites is strongly related to income, suggesting that low income older respondents are particularly unlikely to use internet comparison sites.
Figure 10: Consumers’ use of internet comparison sites by age and income
39%<£14k
55%£14k - £28k
81%£28k - £41k
78%£41k - £50k
82%£50k+
74%18 - 24 year olds
74%25 - 34 year olds
72%35 - 44 year olds
57%45 - 54 year olds
58%55 - 64 year olds
33%65+ year olds
Source: SMF/Populus telephone poll.
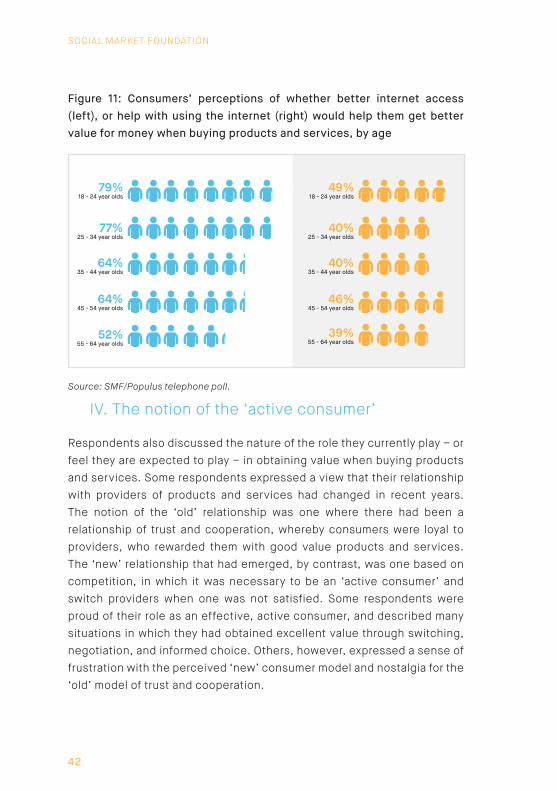
Consumers had differing opinions, however, on whether better internet access, or help with using the internet, would help them get better value. These differences of opinion were related to age. Young people were both more likely to think that better internet access would help them get better value when buying products and services, and more likely to think that help with using the internet would help, as shown in Figure 11.
SOCIAL MARKET FOUNDATION
42
Figure 11: Consumers’ perceptions of whether better internet access (left), or help with using the internet (right) would help them get better value for money when buying products and services, by age
39%55 - 64 year olds
46%45 - 54 year olds
40%35 - 44 year olds
40%25 - 34 year olds
49%18 - 24 year olds
79%18 - 24 year olds
77%25 - 34 year olds
64%35 - 44 year olds
52%55 - 64 year olds
64%45 - 54 year olds
Source: SMF/Populus telephone poll.
IV. The notion of the ‘active consumer’
Respondents also discussed the nature of the role they currently play – or feel they are expected to play – in obtaining value when buying products and services. Some respondents expressed a view that their relationship with providers of products and services had changed in recent years. The notion of the ‘old’ relationship was one where there had been a relationship of trust and cooperation, whereby consumers were loyal to providers, who rewarded them with good value products and services. The ‘new’ relationship that had emerged, by contrast, was one based on competition, in which it was necessary to be an ‘active consumer’ and switch providers when one was not satisfied. Some respondents were proud of their role as an effective, active consumer, and described many situations in which they had obtained excellent value through switching, negotiation, and informed choice. Others, however, expressed a sense of frustration with the perceived ‘new’ consumer model and nostalgia for the ‘old’ model of trust and cooperation.
BARGAINING ON A LOW INCOME
43
This latter view was expressed in several ways:
• A sense of frustration with the way that it was necessary to switch providers to get good value. Some participants, for instance, recounted instances in which they had been offered a product or service at a high price, but when they had threatened to switch providers the company reduced their price to match a competitor’s quote. This led to a frustration with providers, with one respondent remarking: “why couldn’t they just offer me the fair price in the first place?”
• A complaint that there was ‘no loyalty’ from companies. This manifests itself in particular in the idea that companies offer better value deals to new customers, but keep their existing customers on poorer value deals.
Whether or not these ‘old’ and ‘new’ models of the role of a consumer have actually existed at separate times, the distinction raises important questions about precisely the role that is, or should be, expected of consumers in order for markets to deliver competition and value. In some markets, such as grocery shopping, consumers felt that they were able to make choices between different products, and had a good deal of flexibility to get what they wanted. In other markets – such as with payments for landlines – consumers felt they had no choice. If they wanted to have internet at home, they had to pay what was asked of them. Where choice and flexibility is constrained, particularly in markets with ‘natural monopolies’, respondents felt their bargaining power was very limited.
In addition, the two models demonstrate differences in the willingness of consumers to be ‘active’. Some consumers took great pride in searching for deals and better value in a competitive way, but other consumers had a strong preference for relationships with suppliers based on trust and loyalty.
SOCIAL MARKET FOUNDATION
44
V. Budgeting timeframes
Another key dimension that was important in shaping participants’ perceptions of value was the length of time they used for budgeting decisions. Many respondents discussed ways in which better value could be achieved by using monthly or yearly – rather than weekly or fortnightly – budgeting timeframes. However, respondents were split over whether this was a good or bad thing. For some monthly budgeting worked well, and getting better value through the usage of, for instance, paying energy bills by monthly direct debit was viewed favourably.
For others preferring weekly or fortnightly budgeting, however, the way in which longer timeframes were associated with better value was seen as unfair. The way in which many markets are structured can disadvantage those budgeting in the shorter term. Using pre-payment meters for energy, paying for insurance products in instalments rather than annually, and paying for travel passes daily or weekly rather than monthly or yearly, all lead to higher per-unit costs. Some of those with a preference for shorter-term budgeting expressed frustration that their preferences disadvantaged them in terms of their ability to get good value.
Budgeting timeframes varied depending on the market or area of spending in question. Perishable food items, in particular, were often purchased – and budgeted for – on a daily or weekly basis, whilst other non-perishable food items such as toilet paper and washing powder could be bought on a longer timeframe, with some respondents buying in bulk when such products were on offer. The method of payment was also related to the timeframe used in budgeting for energy bills – the payment method could affect the choice of budgeting timeframe, but also the timeframe could affect the choice of payment method. Those with prepayment meters were more likely to budget weekly, but those paying by direct debit were more likely to budget monthly or yearly, with payments in the summer providing a savings mechanism for heating bills in the winter.
Households with low incomes are more likely than those with higher incomes to budget weekly. Figure 12 illustrates how shorter term budgeting
BARGAINING ON A LOW INCOME
45
is more prevalent amongst lower income consumers, with higher income poll respondents more likely to favour monthly budgeting.
Respondents budgeting in the shorter term expressed several reasons for their preference:
1. Keeping close control over one’s budget. Many respondents felt that they could keep much closer control over their finances by budgeting on a short timeframe – often weekly or fortnightly. Some of these respondents expressed a strong reluctance to get into debt, and felt they would be able to budget best on a weekly basis. Many acknowledged some of the implications of this: for those with prepayment meters, some acknowledged the additional expense, but felt it was a price worth paying for the shorter-term control over their budget it entailed, where this stopped them from getting an unexpected ‘huge bill’. Shopping for groceries on a daily basis prevented waste and enabled respondents to ensure everything they bought was needed. Weekly budgeting could also ensure that essential items were paid for before there was any spending on other items.
2. Inability to budget over longer timeframes due to lack of credit or prohibitive cost of credit. Some respondents discussed the limitations their income and credit imposed on their spending, particularly for larger items that were bought less frequently. Some respondents reported simply not buying certain things – such as household furniture – as they were unaffordable at the time. Other respondents had different strategies, however. Some put savings aside on a regular basis so that when, for instance, a washing machine stopped working, they were able to afford another. Several respondents described how their choice of product was limited by the fact that they always needed to use providers also offering finance. Some only reported taking this finance if it was at a 0% interest rate, but others used more expensive providers (and were generally well aware of the fact they were more expensive).

SOCIAL MARKET FOUNDATION
46
3. Fitting into existing income patterns. Many respondents received wages or other income on a weekly basis, which meant that their budgeting was structured around when they received payments. Using a monthly budgeting timeframe made less sense than a weekly timeframe because payments made monthly would fall on irregular days of the week.
Figure 12: Prevalence of weekly budgeting amongst poll respondents of different income groups; % of respondents budgeting weekly
38%£50k+
52%£41k - £50k
48%£28k - £41k
53%£14k - £28k
62%<£14k
25%<£14k
Energy bills Food Shopping
15%£14k - £28k
8%£28k - £41k
4%£41k - £50k
6%£50k+
Source: SMF/Populus telephone poll.
VI. Common variations across markets: two dimensions of value
From the interview and focus group discussions, two key themes emerged that determined the extent to which consumers were able to get good value in different markets.
The first theme is the extent to which respondents felt they had choice and flexibility in each market. Choice and flexibility was crucial in determining whether or not respondents felt able to act to obtain better value for themselves, or whether they felt good or bad value was imposed on them externally. In areas such as grocery shopping participants felt they had a lot of choice of where to shop, options for eating different
BARGAINING ON A LOW INCOME
47
things, and possibilities for obtaining good value. By contrast, housing tended to be a market in which respondents felt cost and quality were imposed on them externally, leaving them little room to negotiate better value. This was especially pronounced with social housing, whilst owner occupancy provided somewhat more scope for negotiating better value. Communications markets were seen as fairly flexible in most aspects, with scope for negotiating with mobile providers and opting for ‘all-in-one’ packages providing better value, although the fixed cost of landline provision was the exception. There was not a great deal of flexibility with transport spending, other than to cut usage, particularly with regard to the high cost of car insurance premiums and fixed public transport options. Some consumers, however, described ‘downsizing’ to smaller cars, or using switching services, in order to save money on their car insurance.
A second theme running through discussions of value in each market was the extent to which respondents felt that information on purchasing choices within that market was easy to access, and also the extent to which they were able to use this information effectively. In markets where information was seen as easy to access and could be used effectively, it was more likely that people felt they achieved good value. In markets where information lacked transparency, was hard to come by, or was difficult to use – either due to an absence of skills on how to use such information, or due to its complexity – it was more likely that people felt they got poor value. Grocery shopping was again a good example, with people feeling able to make use of the clear and easy to understand information they received. Energy tariffs were, however, seen as lacking transparency, with people complaining frequently of confusing and unclear information.
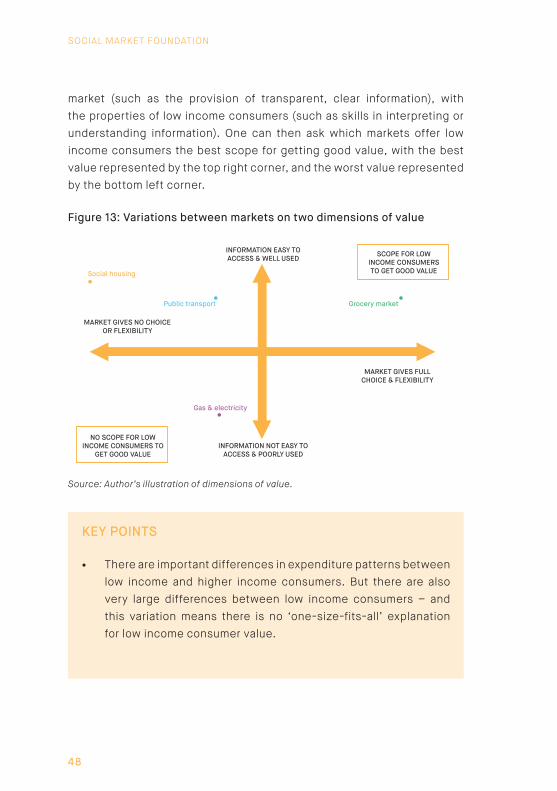
Figure 13 represents these two dimensions. The horizontal axis shows the extent to which a market gives the low income consumer choice and flexibility, with full choice and flexibility at the right hand side, and a complete lack of any choice and flexibility on the left. The vertical axis shows the extent to which there is easy-to-access, well-used and well-understood information available for low income consumers to make purchasing decisions, with the top representing a large amount of clear and well-understood information. This axis combines properties of the
SOCIAL MARKET FOUNDATION
48
market (such as the provision of transparent, clear information), with the properties of low income consumers (such as skills in interpreting or understanding information). One can then ask which markets offer low income consumers the best scope for getting good value, with the best value represented by the top right corner, and the worst value represented by the bottom left corner.
Figure 13: Variations between markets on two dimensions of value
INFORMATION EASY TO ACCESS & WELL USED
INFORMATION NOT EASY TOACCESS & POORLY USED
Social housing
Public transport
Gas & electricity
Grocery market
MARKET GIVES NO CHOICE OR FLEXIBILITY
MARKET GIVES FULLCHOICE & FLEXIBILITY
NO SCOPE FOR LOW INCOME CONSUMERS TO
GET GOOD VALUE
SCOPE FOR LOWINCOME CONSUMERSTO GET GOOD VALUE
Source: Author’s illustration of dimensions of value.
KEY POINTS
• There are important differences in expenditure patterns between low income and higher income consumers. But there are also very large differences between low income consumers – and this variation means there is no ‘one-size-fits-all’ explanation for low income consumer value.

BARGAINING ON A LOW INCOME
49
• Low income consumers highlight reasons why there is scope for getting better or worse value in different markets. Grocery shopping is largely seen as good value because it provides a lot of choice, flexibility and information. Landlines, however, are seen as poor value because there is little choice, with the product not meeting consumers’ demands. Running a car is also seen as bad value, partly due to the high one-off yearly costs.
• Information can be very important in some markets in enabling low income consumers to get good value. Information needs to be good quality and transparent; and the internet is a particularly important source of information.
• Low income consumers have two different types of opinion on being ‘active consumers’: some take great pride in switching, negotiating and haggling; but others dislike such behaviour and prefer relationships with providers based on cooperation and trust.
• The timeframe used in budgeting is important. Increased value can sometimes be attained by budgeting over the longer term, but there are important reasons why some low income consumers budget weekly – in particular the ability to keep close control over their budget.
• The way in which the possibilities for achieving good value vary between different markets can be thought of in terms of two dimensions of value: choice and flexibility; and access to and effective use of information.

SOCIAL MARKET FOUNDATION
50
CHAPTER 3: IMPLICATIONS FOR POLICY AND REGULATIONThis study aims to help policymakers and regulators develop good policy in consumer markets so that low income consumers are able to get good value in the markets in which they spend money. In the context of recent moves to address problems with low income consumers getting poor value in certain markets, this aim is extremely important.
Some recent attempts to improve value for consumers have run into difficulties due to an incomplete understanding of how policy and regulatory reforms might impact on consumers across the income distribution. For instance, the banking inclusion strategy by the Financial Inclusion Taskforce aimed to increase take-up of bank accounts amongst the ‘unbanked’, and was successful in increasing the numbers of people with bank accounts. However, it also resulted in a group of consumers, made up particularly of the lowest income and most vulnerable, falling back out of the banking system again.20 This was primarily due to bank charges for failed direct debits and overdraft fees, and left many consumers worse off than they had been previously. In the energy market there is evidence that Ofgem’s recent reforms have actually increased prices for low income customers due to their lower volume usage.21 Greater understanding of the consumer behaviour and views of those on low incomes would be beneficial in designing policies in the future.
This chapter builds on the findings presented in this paper to provide recommendations for policymakers and regulators that would help low income consumers get a better deal, based on an improved understanding of low income consumer behaviour in different markets.
BARGAINING ON A LOW INCOME
51
Recommendations
1. Increase consumer access to information
There is still more that can be done to provide consumers with clearer and more transparent information. This view emerged from the qualitative part of this study most strongly in the case of the energy market, where information was still seen as confusing, despite attempts to improve simplicity and clarity. Simpler, clearer and more transparent information would, all else being equal, empower consumers to make better choices and get better value when purchasing products and services. Three particular suggestions could be especially beneficial.
First, mobile phone barcode scanning technology could be used to allow consumers to scan a barcode on each bill they receive. Consumers could then use the barcode – or quick-response (QR) code – to compare their bills directly on internet comparison sites with bills and tariffs of other consumers. A feasibility study has recently concluded that there are no barriers to the implementation of QR codes on consumer energy bills.22
Barcodes could be added to bills when consumers buy goods including utilities, insurance, and mobile phones, as a way of allowing instant comparison of the price they are paying; and could also be added to quotes given by providers so that consumers could compare the cost of their quote relative to other offers in the market.
Second, a key area in which information could be improved stems from the importance of internet usage as a particularly important source of information and a switching resource. This, together with the fact that those on low incomes, and older respondents, were less likely to have internet access and internet skills, means that consideration of possible ways to help people who do not frequently use the internet – and older people in particular – is important. The existing Government Digital Inclusion Strategy is an important step towards doing this.23
However, whilst it is clear that the younger respondents in our research were better able to use the internet to get value when buying products and services, it is unclear how best to help older respondents do likewise.

SOCIAL MARKET FOUNDATION
52
The poll results shown in Figures 10 and 11 in Chapter 2 demonstrate that although younger respondents are much more likely to use the internet than older respondents, it is younger respondents who also report that better internet access would help them get better value – older respondents are much less likely to think that better access would help. In addition, older respondents are slightly less likely to think that assistance to enable them to use the internet would help them to get better value.
Perhaps some older consumers are put off using the internet entirely, so providing education or better access would make no difference to them. Perhaps – as was the case with many of the interview respondents – they depend on younger friends and family to pass on the benefits of internet usage, so providing education or improved access would again be irrelevant to them. Alternatively, it may be the case that those already depending most on the internet as a source of information (younger and richer people) would find better internet access and even better internet skills most beneficial. Attempts to help people not frequently using the internet should not, therefore, assume that simply providing internet access and internet skills education is necessarily the best course of action. The best strategy may depend on individual circumstances. For some older people with a preference not to use the internet, it may be more important to ensure they are not socially isolated and have regular access to friends and family to perform internet tasks for them.
Third, companies should be required to give consumers key information before concluding a purchase. In particular, companies could be required to inform consumers how their pricing structure compares with that of other consumers before signing up to buy a product or service. With mobile phone contracts, for instance, it could be obligatory for providers to inform consumers of the median price for their tariff before the consumer agrees to the contract. This is important because there is currently variation in the prices different consumers pay for the same tariff. This information could allow consumers to make an informed decision about the value of the price they are being offered. Other measures to improve transparency for consumer spending on mobiles could include separating information related to handset charges from information related to usage charges in contracts and billing.
BARGAINING ON A LOW INCOME
53
Providing consumers with greater access to information does, however, have some limitations. In particular, it is likely that some consumers will not switch even when given access to improved information, as demonstrated by the contrasting views to switching and negotiating found from the focus group and interview data. This is likely to be most pronounced for the group of consumers that disliked negotiating and ‘haggling’, and preferred relationships based on cooperation and trust. This recommendation should, therefore, be implemented alongside other policy recommendations as a partial solution to increase low income consumer value.
2. Greater use of collective switching and reverse auction models
A complementary strategy that could be beneficial for market competition and consumer value, rather than focusing on consumer switching, is to give greater impetus to suppliers to compete with one another. There are two options that may be particularly advantageous:
(a) Collective switching schemes
Collective switching schemes are designed to provide two main benefits to consumers: to increase consumer bargaining power by negotiating with suppliers as a large group; and to ensure that every consumer signed up to the scheme is getting a good deal, thereby mitigating the problem of some consumers being inactive. The idea is to have a reputable organisation set up a scheme, and to encourage consumers to sign up to give that organisation responsibility for finding them a good value deal. Suppliers are invited to bid for the right to sell their goods or services to the whole group, and compete against each other on the basis of price or quality. The ‘winning’ supplier will, in theory, have the best value offer for that group of consumers.
A number of collective switching schemes have been implemented in the energy market over recent years. Which? held a ‘Big Switch’ campaign in 2012, resulting in more than 36,000 customers switching to the ‘winning’ bid by Co-operative Energy.24 Since then several more collective switching schemes have taken place. The most recent (at the time of writing) is

SOCIAL MARKET FOUNDATION
54
MoneySavingExpert’s October 2014 collective switch, again focused on the energy market, which aimed to attract bids from energy providers to provide consumers with the best value tariff in four different categories.25
The most recent scheme has been an improvement over its predecessors in that it has succeeded in attracting the cheapest deals on the market in each of its targeted categories. Previous collective switching schemes have suffered from the fact that there have been some better deals elsewhere. Following the successful implementation of collective switching schemes in the energy market, this report recommends trying the schemes in other markets. This has the potential to increase the bargaining power of consumers, and also to mitigate, to an extent, the problem of inactive consumers.
In addition to trusted consumer groups, collective switching schemes could be implemented by housing associations and local authorities to get better deals for their tenants. The Department of Energy and Climate Change has recently encouraged local authorities to consider what they can do to provide collective switching schemes.26 The findings of this report would support these proposals – and would encourage speeding up their implementation – since they have the potential to provide better value for low income consumers.
(b) Reverse auction schemes
Another scheme – based on similar principles, but more ambitious – that has the potential to create even greater value for low income consumers, is a reverse auction. Typically, such schemes involve the use of an online software platform to administer the auction, and are most effective in markets where there is only limited variation in the quality of the product supplied.
There is currently a reverse auction scheme operating in the US energy market. Energy Auction House operates a scheme whereby energy suppliers bid against each other in real time, which they claim guarantees “the lowest possible price for your home or business”.27 The model is that consumers state what their energy requirements are (or are expected
BARGAINING ON A LOW INCOME
55
to be), send them to online marketplace software, where energy providers make bids for the custom. Bids are sent to the customer, who can pick their favourite – either on the basis of cost or a quality or customer service appeal.
Similar schemes could operate in the UK energy market by providing a platform that all consumer energy requirements went through. If information on a consumer’s energy usage was sent to the platform, suppliers could compete for each consumer’s business. This could either be done on the basis of yearly contracts or – particularly when more detailed information become available from smart-meter usage – in real time. Importantly, reverse auctions put more responsibility onto companies to generate competition, rather than relying on ‘active’ consumers being willing to switch, creating a market mechanism to drive competition and value. This has the potential to overcome some of the problems of consumers preferring not to switch, and also has the potential to provide all consumers with the deal that is best value for them. This would be particularly beneficial for our group of interview respondents feeling frustrated that it was sometimes necessary to threaten to leave their existing provider before being offered a better value deal (see Chapter 2, part IV).
Auction schemes could be rolled out in other markets, although their operation is simpler and less problematic when there is little variation in quality of a product, such as is the case with suppliers of electricity, gas or water, where quality variations refer to customer service rather than the quality of the product itself. Nevertheless, auctions could be considered in markets such as telecoms, where provision of mobile data and voice calling could be supplied based on real-time competition from suppliers.
Regulators would need to enable markets to implement reverse auction schemes. In the energy market in particular, the current high level of regulation makes it difficult for companies to adopt reverse auctions without regulatory reform. In other markets such as telecommunications, regulators also have an important role in aggregating demand, since providers would be more likely to participate in reverse auction schemes
SOCIAL MARKET FOUNDATION
56
when there are large numbers of consumers using them. Regulators could do this by providing an online platform from which reverse auctions would take place, and by raising awareness of and providing incentives for consumers to sign up to the platform.
3. Move towards charging per unit rather than using fixed charges
One way in which the poverty premium can operate is by there being a lack of products suitable for consumers wanting low usage products or services. This can be the case in particular where there are fixed costs associated with using a particular product, since this makes it better value per unit to consume large quantities. In cases where pricing structures lean towards fixed rather than unit costs, it would be beneficial for low volume users to move, where possible, towards charging per unit.
Consumers with lower levels of consumption tend to be more likely to be on lower incomes. Ofgem (2012) have shown that lower income consumers tend, on average, to have much lower electricity and gas consumption than higher income consumers, with electricity consumption in the highest income quintile nearly double that in the lowest quintile and, amongst those households with gas heating, gas consumption is more than double for those in the highest quintile compared to the lowest quintile.28
The empirical findings of this research clearly show frustration on the part of many low income respondents over fixed charges. Charges for landlines were seen as very bad value, particularly given the fact that they are necessary to purchase non-mobile internet services; and the one-off nature of car insurance policies were seen by some as prohibitively expensive.
Using per-unit charging could be particularly important in the energy and telecommunications markets. In 2014 Ofgem reviewed the recent effects of the new simpler tariff structures, and found that the reduction in the number of tariffs has led to the fixed costs of a tariff being more similar. Because of this, costs have increased for some consumers with lower levels of consumption, and for consumers fitted with gas meters but using no gas at all.29 In the telecoms market, fixed cost charges have
BARGAINING ON A LOW INCOME
57
also increased. Consumer prices for the rental of landlines have increased 39% over the last 6 years.30 BT have announced that line rental will go up further – to £16.99 per month for direct debit customers – from 1st December 2014.31
For reasons such as these, it is recommended to move towards per-unit charges whenever possible. This is likely to increase value for low-volume users, which – on average – would increase value for low income consumers. In many cases this would have the effect of providing more choice and flexibility to low income consumers by allowing them to have low levels of consumption with no per-unit price penalty – that is, the horizontal axis of Figure 13 would be moved to the right. It would also, in some cases, have the effect of increasing simplicity and transparency of information by moving towards one standard unit charge, therefore moving the vertical axis towards the top.
Fixed costs being charged by suppliers of good and services can, however, be justified for a number of reasons, so the costs of abandoning fixed cost charges would have to be considered. They may, for instance, be the simplest way to recoup costs after the installation of infrastructure. Often much of the cost of provision in industries such as telecoms can be attributed to the large infrastructure costs, with relatively little reflecting the immediate cost of provision once the infrastructure is in place. In addition, there is a danger that the increased uncertainty in revenues that may be implied by moving away from a fixed charge structure may decrease incentives for investment.
Whilst these potential downsides to using per-unit charges should be considered, the benefits to consumers in terms of flexibility and simpler information, combined with the benefits in particular to low-volume users, mean that it is important for consumer value to use per-unit charging whenever possible.
4. Provide better value for those budgeting in the short term
As was seen in Chapter 2, respondents to this study’s qualitative research had a perception that longer-term budgeting could lead to getting better
SOCIAL MARKET FOUNDATION
58
value. Examples included paying energy bills by monthly direct debit, bulk buying, and paying for insurance premiums annually. Respondents were split on whether this was a good thing, with those already budgeting monthly likely to look favourably on cheaper energy costs when paying by direct debit. Others, however, expressed frustration that the way markets are structured disadvantages those who budget in the shorter term – with examples including the use of prepayment meters and more expensive insurance costs for those paying in instalments.
Many respondents showed a clear preference for shorter-term budgeting and, in addition, the polling results (see Figure 12) show that those budgeting in the shorter term were disproportionately on low incomes. Often this preference was for very good reasons, focused on an ability to keep close control over one’s budget. Preferences for weekly budgeting are also due to the fact that many low income consumers receive income on a weekly basis: previous SMF research has detailed how four in ten of those in the lowest two income quintiles are paid weekly.32 It would be beneficial for low income consumers’ value when purchasing goods and services, therefore, to be able to balance the benefits which may be obtained from shorter term budgeting with the better per-unit prices available to those budgeting over the longer term.
There are several recommendations that would help:
First, regulators and policymakers should encourage products that are more suitable for those preferring shorter term budgeting. The way in which payment options are currently structured can disadvantage those wishing to budget weekly. However, it should be recognised there are important differences depending on whether consumers use bank accounts or prefer to budget with cash. Different products will be required depending on whether cash or bank accounts are used.
A review should be conducted into the feasibility of providing weekly direct debits, which could provide a balance for some consumers preferring to pay weekly, whilst retaining some of the value savings of paying by direct debit. The review would establish the extent of any additional cost to banks and suppliers from such a scheme, in comparison with

BARGAINING ON A LOW INCOME
59
monthly direct debits and other payment methods. In addition, it would consider the justification for the additional costs associated with paying for insurance premiums in instalments, particularly given that additional costs for paying monthly (rather than annually) do not currently apply for most utility and telecommunications products.
Second, regulators and government should encourage the development of innovative products that make existing schemes targeted at short-timeframe consumers more cost-effective, thereby reducing the cost of serving these consumers. For example, the current system for administering prepayment meters could be updated, such as by enabling text-message payments rather than consumers having to pay in a shop. Government could encourage innovation through tax breaks for companies developing technology aimed at making low income consumers cheaper to serve.
Energy companies could also be allowed to keep more of the cost savings associated with reducing the administrative costs of prepayment meters, to incentivise companies to invest in more efficient systems. The proposal by the Department of Energy and Climate Change that the installation of smart meters should be accompanied by the provision of pay-as-you-go tariffs is welcomed, since this has the potential to lower the administrative costs associated with existing pre-payment meters and lower costs for low income consumers.33
Third, those wishing to budget over the longer term should be helped to do so. This could include providing financial education, and could build upon the recent government initiative to have compulsory financial literacy education in schools. It could also include promoting the take-up of bank accounts amongst lower income consumers, alongside a campaign to raise awareness of the risks posed by bank charges for unpaid direct debits or exceeding overdraft limits.
These recommendations have a dual objective: to help consumers budget over the longer term where they wish to do so; but at the same time to make shorter term budgeting easier and better value when longer term budgeting is difficult. It is recognised that, whilst longer term budgeting

SOCIAL MARKET FOUNDATION
60
can be beneficial for consumer value, this need not be the case and is at least partly a product of the way in which markets are structured. In practice there are often many reasons why low income consumers are more likely to budget on a weekly basis.
These recommendations have implications for the implementation of Universal Credit, a key element of which is a move to a single monthly payment. As pointed out in previous SMF research,34 there are practical difficulties in moving to a monthly payment without also providing the support necessary for consumers currently budgeting on shorter timeframes to adjust.
BARGAINING ON A LOW INCOME
61
APPENDIX
Methodology
Chapter 2 draws on the results of 12 depth interviews, two focus groups, and a nationally representative telephone poll of 1,000 respondents. The interviews and focus groups were carried out with low income consumers from several areas across England by the research consultancy ComRes in August 2014. The poll was carried out between 17th and 20th October 2014 by the research consultancy Populus. Figure A1 below shows the key characteristics of each of the interviews, focus groups, and of the poll.
Low income was defined in each case as having a household income of less than £14,000. This figure was chosen in part for practical reasons, dictated by the standard income bands used by the research consultancies conducting our empirical research, and in part because it corresponds approximately to 60% median household income, meaning that those in low income in this study correspond loosely to those defined as officially ‘in poverty’. A telephone poll was chosen instead of an online poll because of the importance of the internet to consumers as an ‘enabling’ product in getting better value. It is, therefore, important to hear from respondents that are less likely to use the internet.
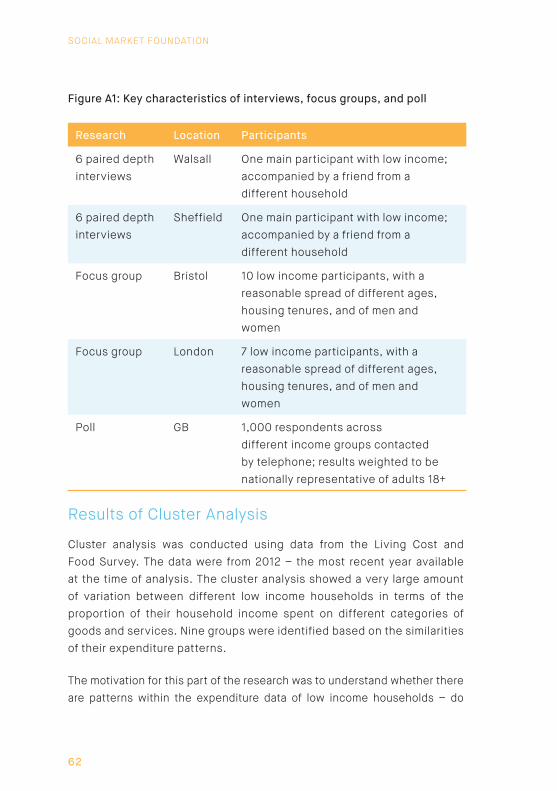
SOCIAL MARKET FOUNDATION
62
Figure A1: Key characteristics of interviews, focus groups, and poll
Research Location Participants
6 paired depth interviews
Walsall One main participant with low income; accompanied by a friend from a different household
6 paired depth interviews
Sheffield One main participant with low income; accompanied by a friend from a different household
Focus group Bristol 10 low income participants, with a reasonable spread of different ages, housing tenures, and of men and women
Focus group London 7 low income participants, with a reasonable spread of different ages, housing tenures, and of men and women
Poll GB 1,000 respondents across different income groups contacted by telephone; results weighted to be nationally representative of adults 18+
Results of Cluster Analysis
Cluster analysis was conducted using data from the Living Cost and Food Survey. The data were from 2012 – the most recent year available at the time of analysis. The cluster analysis showed a very large amount of variation between different low income households in terms of the proportion of their household income spent on different categories of goods and services. Nine groups were identified based on the similarities of their expenditure patterns.
The motivation for this part of the research was to understand whether there are patterns within the expenditure data of low income households – do

BARGAINING ON A LOW INCOME
63
some households, for instance, spend a very large proportion of their income on housing, whilst others spend little on housing but a very large amount on food? The objective is to establish some typologies based on the data, and to identify different household ‘types’ based on their actual expenditure behaviour, whereby each of the households spending a large amount on food but little on anything else are grouped together as ‘type 1’, then households spending a large amount on transport, a moderate amount on housing, but little on anything else are grouped together as ‘type 2’, and so on.
In order to conduct this analysis, a statistical technique is needed that analyses the similarity between different households in terms of the amount they spend on particular goods and services as a proportion of their income. Cluster analysis is appropriate since it is designed to group objects together based on a particular definition of similarity. Expenditure is analysed based on the 12 main categories in the Living Costs and Food Survey, which are:
1. Food and non-alcoholic beverages;
2. Alcohol and tobacco;
3. Clothing and footwear;
4. Housing, water and electricity;
5. Furnishings and household equipment;
6. Health expenditure;
7. Transport;
8. Communication;
9. Recreation;
10. Education;
11. Restaurants and hotels;
12. Miscellaneous goods and services.
In order to understand what cluster analysis does, it can be helpful to visualise the technique. The scatter plot below shows the proportion of
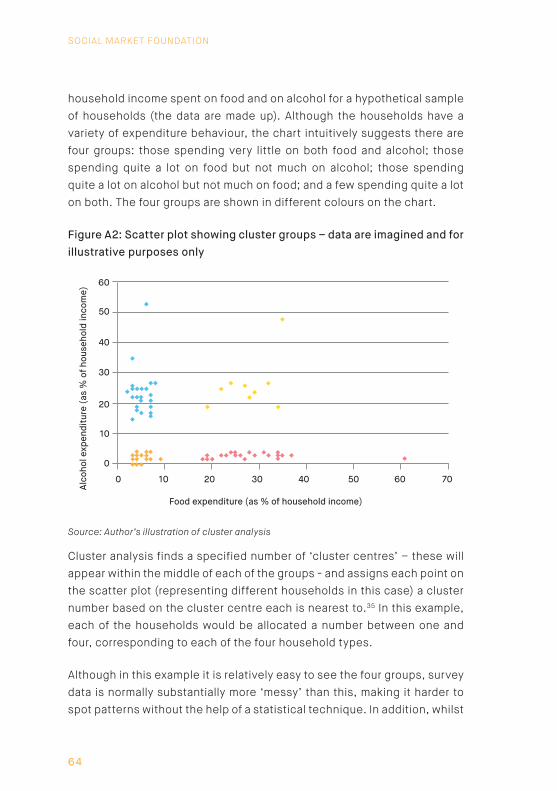
SOCIAL MARKET FOUNDATION
64
household income spent on food and on alcohol for a hypothetical sample of households (the data are made up). Although the households have a variety of expenditure behaviour, the chart intuitively suggests there are four groups: those spending very little on both food and alcohol; those spending quite a lot on food but not much on alcohol; those spending quite a lot on alcohol but not much on food; and a few spending quite a lot on both. The four groups are shown in different colours on the chart.
Figure A2: Scatter plot showing cluster groups – data are imagined and for illustrative purposes only
100 20 30 40 50 60 70
Alco
hol e
xpen
ditu
re (a
s %
of h
ouse
hold
inco
me)
0
10
20
30
40
50
60
Food expenditure (as % of household income)
Source: Author’s illustration of cluster analysis
Cluster analysis finds a specified number of ‘cluster centres’ – these will appear within the middle of each of the groups - and assigns each point on the scatter plot (representing different households in this case) a cluster number based on the cluster centre each is nearest to.35 In this example, each of the households would be allocated a number between one and four, corresponding to each of the four household types.
Although in this example it is relatively easy to see the four groups, survey data is normally substantially more ‘messy’ than this, making it harder to spot patterns without the help of a statistical technique. In addition, whilst

BARGAINING ON A LOW INCOME
65
it is possible to visualise the process when adding a third variable – one could imagine the ways in which households might group if expenditure on housing was added in as a third dimension – it is not possible to visualise data in this way with more than three variables, and 12 variables are used in the cluster analysis conducted here.
FINDINGS
The analysis presented below focuses on households with low income – defined as below 60 per cent median equivalised household income – but as a point of comparison expenditure patterns for the sample of all households are also shown. The cluster analysis divided low income households up into ten groups, based on the similarity of their spending patterns (as a proportion of their household income) across the 12 categories. The tenth group, however, has been disregarded as it is made up of six households with extreme expenditure data – these have been discounted as data ‘outliers’, as the extreme values are most probably because of mistakes in the survey data.
The results of the cluster analysis, therefore, show the nine remaining groups. As a point of comparison, results for all households (regardless of income), and also for all households below 60 per cent of median income, are shown on the left. For each of the nine household ‘types’, the percentages in the table show the proportion of total household income going on each of the 12 spending categories, for the median household in each group.36
A few general remarks can be made on the figures. First, one can see that there are two key categories in which some households spend a very large proportion of their income: housing and transport. By contrast, very few low income households spend anything on education or health, presumably given the fact these services are provided free at the point of use by the state. This is reflected in the fact that the median amount spent by households in each of the nine categories is zero. The ‘Overall’ row shows the total amount spent by the median household in each group, as a proportion of their income. One can see that four of the low income groups spend beyond their means – that is they have an expenditure percentage
SOCIAL MARKET FOUNDATION
66
of over 100% of their income. This is consistent with the findings by the Institute for Fiscal Studies that lower income households spend more than their income, with the bottom decile spending 140 per cent.37 The amount spent on food does not vary very much between groups, ranging from around 10 to 25 per cent of overall expenditure.
Groups 1 and 2 both spend a very large amount on housing, and also spend more than their incomes. Both groups are likely to be in the private rental sector, are likely to have a relatively young head of household, and are likely to have moved into their current residence recently. In the case of Group 2, expenditure is fairly low in all other categories except housing – yet housing costs are such that their income is insufficient to cover it. The story for Group 1 is more problematic, with fairly high expenditure in several categories, and an overall expenditure level over twice that of income.
Groups 3 and 4 spend a large proportion on transport. Both are likely to own a car. Group 3 in particular spends a very large amount on transport, and overall expenditure is more than double their income. However households in this group are relatively likely to be owner-occupiers, leading one to speculate that this group could either be temporarily poor, or be spending previously accumulated wealth. Group 4 is a little different – transport costs are higher than other groups but are a lot lower than Group 3, and this group is able to spend less than their income. Group 3 consists mainly of owner occupiers, or people in social housing.
The other group to spend more than their income is Group 5: these households have relatively high spending across most categories, with a particularly large proportion going on recreation. However these households are relatively likely to own a car and be a pensioner, and are likely to own a house, with some others in social housing, again suggesting – perhaps – that these people are spending wealth rather than getting into debt.
Groups 6, 7, 8 and 9 tend to spend within their means. Of these groups, Group 6 spends a large amount on housing, Group 8 spends a lot on alcohol and tobacco, and Group 9 tends to spend a relatively large amount
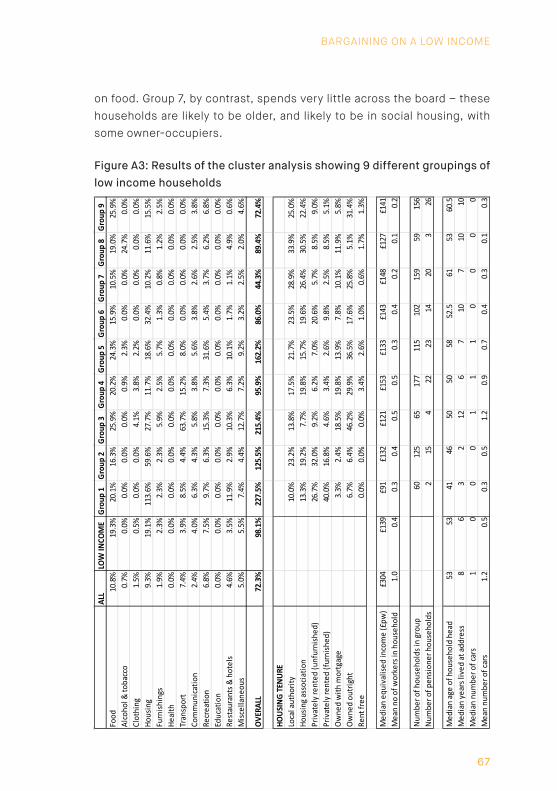
BARGAINING ON A LOW INCOME
67
on food. Group 7, by contrast, spends very little across the board – these households are likely to be older, and likely to be in social housing, with some owner-occupiers.
Figure A3: Results of the cluster analysis showing 9 different groupings of low income households
ALL
LOW
INCO
ME
Gro
up 1
Gro
up 2
Gro
up 3
Gro
up 4
Gro
up 5
Gro
up 6
Gro
up 7
Gro
up 8
Gro
up 9
Food
10.8
%19
.3%
20.1
%16
.3%
25.9
%20
.2%
24.3
%15
.9%
10.5
%19
.0%
25.9
%Al
coho
l & to
bacc
o0.
7%0.
0%0.
0%0.
0%0.
0%0.
9%2.
3%0.
0%0.
0%24
.7%
0.0%
Clot
hing
1.5%
0.5%
0.0%
0.0%
4.1%
3.8%
2.2%
0.0%
0.0%
0.0%
0.0%
Hous
ing
9.3%
19.1
%11
3.6%
59.6
%27
.7%
11.7
%18
.6%
32.4
%10
.2%
11.6
%15
.5%
Furn
ishi
ngs
1.9%
2.3%
2.3%
2.3%
5.9%
2.5%
5.7%
1.3%
0.8%
1.2%
2.5%
Heal
th0.
0%0.
0%0.
0%0.
0%0.
0%0.
0%0.
0%0.
0%0.
0%0.
0%0.
0%Tr
ansp
ort
7.4%
3.9%
8.5%
4.4%
63.7
%15
.2%
8.0%
0.0%
0.0%
0.0%
0.0%
Com
mun
icat
ion
2.4%
4.0%
6.3%
4.3%
5.8%
3.8%
5.6%
3.8%
2.6%
2.5%
3.8%
Recr
eatio
n6.
8%7.
5%9.
7%6.
3%15
.3%
7.3%
31.6
%5.
4%3.
7%6.
2%6.
8%Ed
ucat
ion
0.0%
0.0%
0.0%
0.0%
0.0%
0.0%
0.0%
0.0%
0.0%
0.0%
0.0%
Rest
aura
nts &
hot
els
4.6%
3.5%
11.9
%2.
9%10
.3%
6.3%
10.1
%1.
7%1.
1%4.
9%0.
6%M
isce
llane
ous
5.0%
5.5%
7.4%
4.4%
12.7
%7.
2%9.
2%3.
2%2.
5%2.
0%4.
6%
OVE
RALL
72.3
%98
.1%
227.
5%12
5.5%
215.
4%95
.9%
162.
2%86
.0%
44.3
%89
.4%
72.4
%
HOU
SIN
G T
ENU
RELo
cal a
utho
rity
10.0
%23
.2%
13.8
%17
.5%
21.7
%23
.5%
28.9
%33
.9%
25.0
%Ho
usin
g as
soci
atio
n13
.3%
19.2
%7.
7%19
.8%
15.7
%19
.6%
26.4
%30
.5%
22.4
%Pr
ivat
ely
rent
ed (u
nfur
nish
ed)
26.7
%32
.0%
9.2%
6.2%
7.0%
20.6
%5.
7%8.
5%9.
0%Pr
ivat
ely
rent
ed (f
urni
shed
)40
.0%
16.8
%4.
6%3.
4%2.
6%9.
8%2.
5%8.
5%5.
1%O
wne
d w
ith m
ortg
age
3.3%
2.4%
18.5
%19
.8%
13.9
%7.
8%10
.1%
11.9
%5.
8%O
wne
d ou
trig
ht6.
7%6.
4%46
.2%
29.9
%36
.5%
17.6
%25
.8%
5.1%
31.4
%Re
nt fr
ee0.
0%0.
0%0.
0%3.
4%2.
6%1.
0%0.
6%1.
7%1.
3%
Med
ian
equi
valis
ed in
com
e (£
pw)
£304
£139
£91
£132
£121
£153
£133
£143
£148
£127
£141
Mea
n no
of w
orke
rs in
hou
seho
ld1.
00.
40.
30.
40.
50.
50.
30.
40.
20.
10.
2
Num
ber o
f hou
seho
lds i
n gr
oup
6012
565
177
115
102
159
5915
6N
umbe
r of p
ensi
oner
hou
seho
lds
215
422
2314
203
26
Med
ian
age
of h
ouse
hold
hea
d53
5341
4650
5058
52.5
6153
60.5
Med
ian
year
s liv
ed a
t add
ress
86
32
126
710
710
10M
edia
n nu
mbe
r of c
ars
10
00
11
10
00
0M
ean
num
ber o
f car
s1.
20.
50.
30.
51.
20.
90.
70.
40.
30.
10.
3
SOCIAL MARKET FOUNDATION
68
ENDNOTES1. Save the Children, The UK Poverty Rip-Off: The Poverty Premium 2010, (2011).
2. Broda, Leibtag & Weinstein, ‘The Role of Prices in Measuring the Poor’s Living Standards’. Journal of Economic Perspectives (2009).
3. Ofgem, Open letter – Treatment of low and zero consumers of gas, (2014).
4. Department for Energy and Climate Change, Press Release. https://www.gov.uk/government/news/qr-codes-on-energy-bills-put-consumers-in-control. Accessed 14/11/2014.
5. Community Energy Switching and Bulk Buying, Letter from Edward Davey. https://www.gov.uk/government/uploads/system/uploads/attachment_data/file/48468/5944-letter-from-edward-davey-to-local-authority-ceos-o.pdf. Accessed 14/11/2014.
6. Institute for Fiscal Studies, The spending patterns and inflation experience of low-income households over the past decade, (2011). The fact expenditure is higher than income is explained by the fact that some of these households may have temporarily low income, or be spending their wealth (such as retired people).
7. Institute for Fiscal Studies, The spending patterns and inflation experience of low-income households over the past decade, (2011).
8. Institute for Fiscal Studies, The spending patterns and inflation experience of low-income households over the past decade, (2011).
9. Which? Lived Inflation Indices. http://consumerinsight.which.co.uk/inflation?v=73. Accessed 12/11/2014.
10. Which? Lived Inflation Indices. http://consumerinsight.which.co.uk/inflation?v=73. Accessed 12/11/2014.
11. Caplovitz, David, ‘The poor pay more: consumer practices of low-income families.’ A Report of the Bureau of Applied Social Research, Columbia University, (1963).
12. Mendoza, R., ‘Why do the poor pay more? Exploring the Poverty Penalty Concept.’ Journal of International Development, (2011).
13. Save the Children, The UK Poverty Rip-Off: The Poverty Premium 2010, (2011).
14. Save the Children, The UK Poverty Rip-Off: The Poverty Premium 2010, (2011).
15. Mendoza, R., ‘Why do the poor pay more? Exploring the Poverty Penalty Concept.’ Journal of International Development, (2011).
16. JRF, Consumer Futures, Addressing the poverty premium: approaches to regulation, (2013).
17. Broda, Leibtag & Weinstein, ‘The Role of Prices in Measuring the Poor’s Living Standards’. Journal of Economic Perspectives (2009).
18. Ofgem, Open letter – Treatment of low and zero consumers of gas, (2014).
19. JRF, Consumer Futures, Addressing the poverty premium: approaches to regulation, (2013).
20. Anna Ellison, Claire Whyley and Rob Forster, ‘Realising banking inclusion: The
achievements and challenges’. A report to the financial inclusion taskforce, (2010).
BARGAINING ON A LOW INCOME
69
21. Ofgem, Open letter – Treatment of low and zero consumers of gas, (2014).
22. Department for Energy and Climate Change, Press Release. https://www.gov.uk/government/news/qr-codes-on-energy-bills-put-consumers-in-control. Accessed 14/11/2014.
23. Government Digital Inclusion Strategy. https://www.gov.uk/government/publications/government-digital-inclusion-strategy/government-digital-inclusion-strategy#what-this-strategy-is-about. Accessed 18/11/2014.
24. Which?, The Big Switch secures savings of £123. http://www.which.co.uk/news/2012/05/the-big-switch-secures-savings-of-123-285826/. Accessed 14/11/2014.
25. Money Saving Expert. http://www.moneysavingexpert.com/team-blog/2014/10/15/moneysavingexpert-coms-collective-switch/. Accessed 18/11/2014.
26. Community Energy Switching and Bulk Buying, Letter from Edward Davey. https://www.gov.uk/government/uploads/system/uploads/attachment_data/file/48468/5944-letter-from-edward-davey-to-local-authority-ceos-o.pdf. Accessed 14/11/2014.
27. Energy Auction House. www.energyah.com. Accessed 13/11/2014.
28. Ofgem, ‘Beyond Average Consumption’, Development of a framework for assessing impacts of policy proposals on different consumer groups. Final report to Ofgem, (2012).
29. Ofgem, Open letter – Treatment of low and zero consumers of gas, (2014).
30. The Telegraph, ‘How BT’s line rental cost has soared – and how you can pay less’. 4/3/2014.
31. This Is Money. http://www.thisismoney.co.uk/money/bills/article-2731980/BT-set-hit-millions-customers-price-rises-call-line-rental-charges.html. Accessed 18/11/2014.
32. SMF, Sink or Swim: The impact of the Universal Credit, (2012).
33. Ed Davey: A better deal for people on ‘pre-payment’ energy meters. http://www.libdems.org.uk/ed_davey_a_better_deal_for_people_on_pre_payment_energy_meters#. Accessed 14/11/2014.
34. SMF, Sink or Swim: The impact of the Universal Credit, (2012).
35. Formally, cluster analysis - using k-means clustering - finds k cluster centres such that the squared distances between the centres is minimised. A disadvantage of cluster analysis is that the number of groups needs to be defined in advance, so a certain amount of experimentation is necessary with different numbers of groups.
36. Median refers to the household with the median expenditure in each category. Note that the ‘Overall’ row may not add up to the sum of each of the other rows: this is because the median household is taken within each category, rather than the one household with the overall median expenditure being selected for each category.
37. Institute for Fiscal Studies, The spending patterns and inflation experience of low-income households over the past decade, (2011).
Bargaining on a low
income
A better deal for consum
ers
Bargaining on a low incomeA better deal for consumers
Bargaining on a low incomeGetting a better deal for low income consumers
Standards of living have been falling. Those on low incomes face particular difficulties as the prices of essential goods have risen even faster than average. Low income consumers can face the additional disadvantage of paying more for the same goods and services as compared with higher income consumers. Attempts have been made by regulators and the Government to address some of these problems. But some policies have fallen short because of an incomplete understanding of how low income consumers interact with different markets. Bargaining on a Low Income draws on new data analysis, interviews, focus groups, and a nationally representative poll to provide an in-depth understanding of low income consumers’ experiences of value in different markets. Where there are disadvantages, it sets out why these exist along with the different strategies that low income consumers adopt to overcome them. Based on these insights, it sets out four key areas of policy and regulation that urgently need to be addressed to ensure markets are better tailored to the needs and demands of low income consumers.
Ben Richards
Kindly supported by