![1.3 Sinclair slides Econ Stress[1] - OHSU · Low Income Working Families: Health Concerns • ~25% of US children in low-income working families (median wage: $9/hour). These families](https://static.fdocuments.in/doc/165x107/5ed70a7e62136e72fb7bb8fa/13-sinclair-slides-econ-stress1-ohsu-low-income-working-families-health-concerns.jpg)
Federal Income Tax Cuts and Low-Income Families
42
FEDERAL INCOME TAX CUTS AND LOW-INCOME FAMILIES Frank J. Sammartino January 2001 Urban Institute 2100 M Street, NW Washington, DC 20037 For copies of this report, please contact the Office of Public Affairs, phone: 202/261-5709; e-mail [email protected]. For more publications and general information about the Urban Institute, visit www.urban.org.
-
Upload
truongtuyen -
Category
Documents
-
view
216 -
download
0
Transcript of Federal Income Tax Cuts and Low-Income Families
FEDERAL INCOME TAX CUTS ANDLOW-INCOME FAMILIES
Frank J. Sammartino
January 2001
Urban Institute2100 M Street, NW
Washington, DC 20037
For copies of this report, please contact the Office of Public Affairs,phone: 202/261-5709; e-mail [email protected].
For more publications and general information about the Urban Institute,visit www.urban.org.

1
Acknowledgments
The author wishes to thank the George Gund Foundation for its generous support of thisstudy, as well as Urban Institute researchers Adam Jacobs, Elaine Maag, and Laura Wheaton,who made important contributions to this report. Len Burman, Diane Rogers, Eric Toder, andSheila Zedlewski also provided valuable comments on an earlier draft.
The views expressed here are those of the author and should not be attributed to the UrbanInstitute, its trustees, or its funders.
2
Executive Summary
Recent large federal budget surpluses have spurred debate on how best to use the
money. Some see surpluses as an opportunity to pay down the federal debt, to expand
programs to meet such social needs as health care and education, or to secure the future of
Social Security. Others propose returning some of the money to taxpayers by cutting federal
income taxes, an option championed by President Bush that has widespread support in
Congress.
Proponents of tax cuts emphasize that this option would help all families. Many
popular options for cutting federal income taxes, however, would provide little benefit to
low-income families. This is not surprising, given that these families pay little or no income
tax and thus receive little benefit from proposals that only reduce positive income tax
liabilities. Although most low-income families do not pay federal income taxes, they do work
and pay federal payroll and excise taxes as well as state and local taxes. To benefit these
families, income tax cuts must be refundable, that is, available in excess of the families’
current income tax liability.
Study Focus and Purpose
To better understand the impact of various tax reduction proposals on low-income
families, we identify the overall tax burdens that low-income families currently face and
explain how those tax burdens would change if certain types of federal income tax cuts were
enacted. Using detailed household-level data on incomes and taxes, we show how federal
income and payroll taxes differ for low-income families and how these families benefit from
certain features of the income tax, such as the Earned Income Tax Credit (EITC)—a tax
credit applied to the wages of low-income families.
We examine five tax cut options that are representative of recent proposals and
compare the benefits to low-income families with those for higher-income taxpayers. Each
option is designed to reduce income taxes by approximately the same amount—$34 billion in

3
1998. Because the analysis is concerned with the effects of income tax cuts on the well-being
of different types of families (particularly lower-income families), the analysis focuses on the
effect of such cuts on average tax rates rather than marginal tax rates.
We examine the following generic proposals:
• an across-the-board reduction in marginal tax rates,
• an increase in standard deductions and in the income range for the lowest tax bracket,
• an increase in the child tax credit,
• an expansion of the earned income tax credit, and
• a new refundable payroll tax credit.
Main Findings
For low-income families, the most important element of any tax reduction proposal is
whether the tax relief is refundable—that is, available in excess of their current income tax
liability. For that reason, the options to increase the EITC or create a new refundable payroll
tax credit are most beneficial to low-income working families. Across-the-board cuts in
federal income tax rates or increases in the standard deduction and the width of the lowest tax
bracket provide very little benefit to low-income families. Increasing the child credit as
currently structured also would offer little relief.
Rate Cuts and Other Across-the-Board Tax Cuts: Higher-income families would
receive a large share of the benefits from the rate cut option and the option to increase
standard deductions and the income range for the lowest tax bracket. Almost 40 percent of
the tax cuts from the latter option would go to the 15 percent of people in families with
incomes over $100,000, while over 50 percent of the benefits from an across-the-board cut in
tax rates would go to those families. While the share of benefits from an across-the-board
rate cut exceeds the population share for higher-income families, it is less than their 60
percent share of income taxes and only slightly more than their share of combined income
and payroll taxes.

4
Because higher-income families pay a larger share of their income in taxes, an across-
the-board cut in income taxes benefits higher-income families more than lower-income
families if those benefits are measured in absolute dollars per family or as a share of income,
but not if the benefits are measured as a percentage change in income tax liability. Measuring
the changes in tax burdens as the percentage decrease in tax liability can be misleading,
because it suggests that low-income families would benefit the most from small tax cuts
simply because they pay so little tax in the first place.
Increasing the EITC and a Payroll Tax Credit: The options to increase the EITC or
to create a new refundable payroll tax credit would have the biggest impact on low-income
families by boosting the amount of their refunds. For the proposals simulated here, 18
percent of the benefits from increasing the EITC would go to families with incomes of
$20,000 or less in 1998, while these families would receive 20 percent of the benefits from
the option to create a new refundable payroll tax credit. Over 75 percent of the benefits from
the EITC option would go to families with incomes of $40,000 or less; these families would
receive about 60 percent of the benefits from the payroll tax credit option. About one-fifth of
the population had family income of $20,000 or less in 1998, and about 45 percent of the
population had income of $40,000 or less.
Increasing the Child Tax Credit: We considered two options to increase the child tax
credit—one would increase the credit to $1,300 per child, the other would increase it to
$1,200 per child and make it refundable for all families. Both would provide the largest share
of benefits to middle- and upper-middle-income families. About 65 percent of the benefits
from these options would go to families with incomes between $40,000 and $100,000.
Impacts on Different Family Types: Not all types of families would benefit from the
proposals simulated here. In particular, couples and singles without eligible children under
age 17 would see no change in their taxes from either proposal to increase the child tax
credit. Single adults would benefit the most from more broadly based options, including the
rate cuts, the increase in standard deductions and the income range for the 15 percent tax
bracket, and most of all from the payroll tax credit. Single parents with children would

5
benefit the most from the option to increase the EITC and the least from the option for a
proportional cut in income tax rates.
Other Policy Considerations
Whether or not a tax reduction disproportionately benefits low-income or high-
income families is only one criterion by which to judge its merits. The standard principles of
good tax policy still apply. Other goals, such as economic efficiency, tax simplicity, and
reduction of compliance burdens on taxpayers, are important as well. Proposals aimed at
helping low-income families do not necessarily advance these other goals and may detract
from them. When benefits are targeted to particular taxpayers, there must be rules
determining who is eligible, which in turn increase the complexity of taxes and create
opportunities for errors and abuse.
Clearly, fairness does not dictate that all tax relief should be directed to low-income
families. However, these families should not be left out of the equation. Congress must first
compare tax relief with other options for using the budget surplus, such as paying down the
federal debt or addressing the future insolvency of Social Security and Medicare. If a tax cut
is the best option, lawmakers must consider the merits of targeting relatively more tax relief
to higher-income families who have enjoyed extraordinary prosperity over the past decade
when there are so many other families who work and pay taxes, but do not enjoy the same
economic security.
6
Introduction
The recent “good surprises” of large government budget surpluses have led to
proposals to cut both federal and state income taxes. Many states have already enacted
significant tax reductions, often forced by budgetary tax limitation rules. At the federal level,
Congress recently debated and passed legislation that would have reduced income taxes, but
was unable to reach agreement with President Clinton on the appropriate size of those tax
cuts. Both major party presidential campaigns proposed substantial reductions in the income
tax. With the backing of the new administration and continued widespread support in
Congress, enactment of a major tax cut in the coming year is very likely.
Not all income tax cuts are alike, however, and there is reason for concern that many
families will not share the benefits from future federal tax reductions, despite claims to the
contrary. Some recent proposals, in particular, would fail to provide much tax relief to low-
income working families. The reasons are simple:
1. Low-income families pay little federal income taxes. Many of these families have a
zero or negative income tax burden because of the Earned Income Tax Credit (EITC).
Consequently, even broad-based tax cut proposals that would provide the highest-percentage
cuts in income taxes to taxpayers with the lowest incomes would not be especially helpful to
low-income families. Large-percentage income tax cuts result in little or no change in a
family’s after-tax income when the family has little income tax liability to begin with, and
after-tax income, not taxes paid, determine a family’s economic well-being. It takes only a
few dollars to give low-income families a high-percentage reduction in their federal personal
income taxes.
2. Low-income families do pay federal taxes, but for them, other federal taxes matter
much more than income taxes. Most of the federal taxes that these families pay are payroll
and excise taxes, not income taxes, and those taxes can amount to a sizable fraction of family

7
incomes. Reducing or eliminating positive income tax liabilities has very limited effects on
their overall federal tax burdens.
3. State and local taxes matter. Overall tax burdens on low-income families depend
on state and local taxes as well, and including these further diminishes the significance of
federal income taxes relative to other types of taxes for these families. Retail sales taxes, in
particular, make up about half of state tax revenues and place significant burdens on these
families.
In this paper we identify the overall tax burdens that low-income families currently
face and show how those tax burdens would change if certain types of federal income tax
cuts were enacted. We identify the “low-income” segment of the population and show how
their incomes and taxes compare with those of the rest of the population, based on detailed
household-level data. In doing so, we show how the impact of federal income and payroll
taxes differs for low-income families relative to higher-income families, and how low-
income families benefit from certain features of the income tax (such as the EITC).
We then evaluate several generic types of broad-based income tax cuts, including an
across-the-board reduction in marginal tax rates, an increase in standard deductions and the
income range for tax brackets, higher child credits, an expansion of the earned income tax
credit, and a refundable payroll tax credit. We show the importance of refundable tax relief to
low-income families—that is, relief available in excess of families’ current income tax
liability. We show how much different income tax cuts would benefit low-income families
and compare this with the benefits for higher-income taxpayers.
To provide an appropriate comparison among different forms of tax relief, we
compare options with approximately equal revenue losses. This comparison recognizes that
all tax cuts reduce money available for current and future federal programs, including many
programs that benefit low-income families. Therefore, in determining which tax cuts help
these families the most, it is important to compare proposals that have equal overall
budgetary impacts.
8
Federal Taxes for Low-Income Families
As a percentage of family income, federal income taxes for low-income families are
at a 20-year low (see figure 1, page 41). Indeed, for the 20 percent of families with the lowest
incomes, federal income taxes including refundable tax credits represent a net transfer of
nearly 7 percent of income before tax. Income taxes as a percentage of income are also lower
for middle-income families than at any time in the past 20 years, although the differences are
not as great as for low-income families. Measured as a percentage of family income, upper-
income families now pay about the same income tax as similar families 20 years ago—a
slightly higher percentage than in the mid-to-late 1980s.
Two changes have contributed the most to reducing income taxes paid by low-income
families. First, increases in the personal exemption and standard deductions enacted in 1986
removed many low-income families from the tax rolls. The level of inflation-adjusted income
at which a family of four begins to pay tax is nearly double what it was before 1986 and is
significantly above the poverty level of income. Second, several tax bills, especially in 1990
and 1993, greatly increased the earned income tax credit. The EITC is a tax credit applied to
wages of low-income families; it phases out as income rises above a certain level. It provides
the largest benefits to workers with children, but a small credit is also available to childless
workers.1 Because the EITC is specifically designed to assist low-income working families,
the recent expansions of the credit have had profound effects on the overall tax burdens faced
by such families. About 19 million taxpayers now receive the EITC, claiming nearly $30
billion in credits. About $23 billion of the EITC represents net refunds (credits in excess of
positive income tax liabilities).
1 The maximum EITC for tax year 2000 is $2,353 for working families with one eligible child and $3,888 forworking families with two or more eligible children. Working families with income in excess of $12,690receive a reduced credit; they receive no credit if their income exceeds $27,413 (with one child) or $31,152(with two or more children). Single workers between the ages of 25 and 64 are eligible for a smaller credit of upto $353. Single workers with income in excess of $5,766 receive a reduced credit, and no credit at all if theirincome exceeds $10,380.
9
Increases in the personal exemption and standard deductions also have helped to keep
down federal income taxes for middle-income families. Legislation enacted in 1997 provided
additional tax relief for middle-income families through the introduction of new deductions
and credits. Much of the tax benefits went to families with children—in the form of a new
child tax credit. Beginning in 1998, families could claim a credit of $400 ($500 in subsequent
years) for each eligible child under the age of 17. The credit phases out for higher-income
families with incomes above certain thresholds.2 Credits in excess of income tax liability are
not refundable for families with one or two children. The credit is refundable for families
with three or more children, but only up to the amount by which their Social Security payroll
tax exceeds their EITC.
Because few families qualify for a refundable credit, the child credit provides little
tax relief for many low-income families with children. Families with no income tax liability
(and fewer than three children) receive no benefit from the credit, while families with low
income tax liability receive only partial benefits. A family with two children and income tax
liability of $400, for example, would not receive a full $1,000 in credits; $600 would go
unused. Because the credit applies against income tax liability before subtraction of the
earned income tax credit, however, a family can increase the portion of the EITC that is
refundable by taking the child credit. If a family with income tax liability of $400 were also
eligible for a $2,100 EITC, without the child credit, $400 of the EITC would be used to offset
income tax liability and the family would receive a refund of $1,700. With a child credit of
$400 or more, the family could be refunded the entire $2,100.
In 1998, approximately 25 million families claimed full or partial child credits,
totaling over $15 billion. This was about 65 percent of all families that filed a tax return and
had at least one child under the age of 17. Most of the 35 percent of ineligible families with
children had low incomes and no income tax liability, but a smaller number were high-
income families with incomes above the threshold levels. Few families received refundable
child credits, both because refunds were limited to families with three or more children and
2 The thresholds are $110,000 for married couples and $75,000 for other taxpayers. Total credits received by afamily are reduced by $50 for each $1,000 of income in excess of the thresholds.

10
because, even for those families, the amount of the refund was limited to the amount of their
payroll taxes in excess of the EITC. About 700,000 families received refundable child credits
(reported separately as Additional Child Tax Credits) totaling $0.5 billion.
In contrast to the personal income tax, Social Security payroll taxes are higher for
families at all income levels than they were 20 years ago. Tax rate increases enacted in 1977
and put in place throughout the 1980s raised payroll taxes for all working families. Increases
in the maximum amount of earnings subject to the tax, also enacted in 1977, and the
elimination in 1997 of any maximum for earnings subject to the Hospital Insurance (HI)
portion of the tax further increased payroll taxes for upper-income families.
Unlike income taxes, payroll taxes are about the same percentage of income at most
income levels. Social Security payroll taxes are levied at a single rate paid by both workers
and their employers—currently 6.2 percent of earnings for the Old Age, Survivor, and
Disability Insurance (OASDI) programs (commonly know as Social Security) and 1.45
percent of earnings for the Hospital Insurance program (Medicare). Because there is a single
marginal tax rate (unlike the graduated rates in the income tax) and because there are no
exemptions or deductions, taxes as a percentage of income do not rise as income increases.
Payroll taxes as a percentage of income are somewhat lower for higher-income families than
for lower- and middle-income families because the tax is levied only on earnings, allowing
income from investments to escape the tax, and because the OASDI portion of the tax
exempts earnings above a maximum level ($76,200 in 2000).
Although payroll taxes make up a significant portion of the total federal taxes that
families pay, Social Security payroll taxes for OASDI are sometimes viewed differently from
income and HI taxes. Both current payroll taxes and future retirement benefits rise with
current earnings. Although all taxes are used to pay for government spending of one type or
another, there is no comparable relationship between taxes paid and benefits received for the
income tax or the HI portion of the payroll tax. Thus, an alternative way to measure the
burden of OASDI taxes would be to count net taxes as the difference between the tax and the
expected increase in future Social Security benefits.

11
A dollar of additional payroll taxes, however, does not generally result in a dollar of
additional benefits and produces no benefit increase at all in some cases. The Social Security
program is not a defined contribution plan and payroll tax contributions are not credited to an
individual’s personal account. Current payroll taxes are used to pay current benefits, much
the same as in any spending program. While the benefit formula does give higher benefits to
workers with higher lifetime earnings, the rules relating benefits to earnings are complex.
How much an additional dollar of earnings raises future retirement benefits depends both on
the average monthly earnings of the worker and on whether the worker will receive spouse or
survivor benefits. There is no guarantee the benefit formula will remain fixed. Congress is
free to change these rules and has done so many times in the past, to both the advantage and
disadvantage of future retirees. It may do so again in the future to correct for the imbalance
between projected Social Security benefits and taxes.
About three-fourths of U.S. families pay more in payroll taxes than in income taxes.3
Despite the increased burden of payroll taxes, however, many low-income families pay no
net tax because they receive an EITC that exceeds the sum of their income and payroll tax
liabilities. For example, a four-person family with earnings equal to the federal poverty level
would have received a net income tax refund (in excess of all income taxes paid) of about
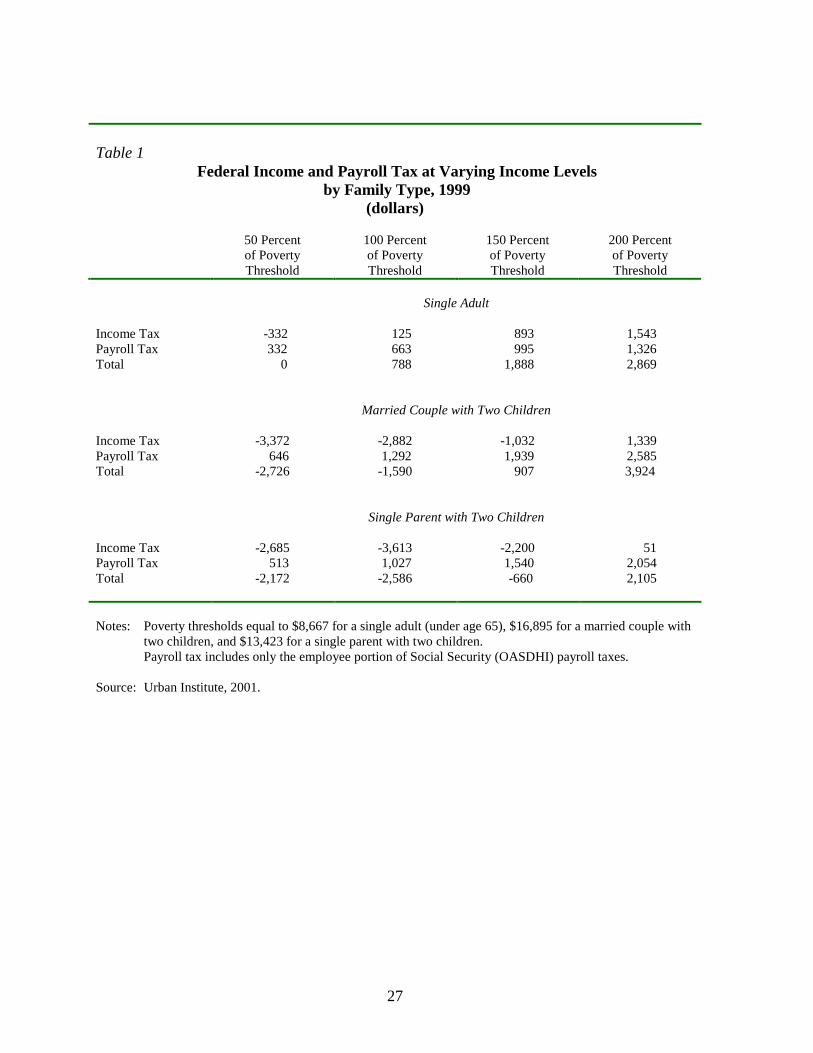
$2,900 in 1999 (table 1, page 27). In comparison, that same family would have paid about
$1,300 in federal payroll taxes, counting only the employee portion of Social Security
(OASDHI) payroll taxes.4 Likewise, a single parent with two children and poverty level
earnings would have received an EITC refund of over $3,600 while paying about $1,000 in
payroll taxes, for a net transfer of almost $2,600. Combined income and payroll taxes are
negative for almost all families with children and poverty level incomes, but single workers
3 See U.S. Congress, Congressional Budget Office, “Estimates of Federal Tax Liabilities for Individuals andFamilies by Income Category and Family Type for 1995 and 1999,” CBO Memorandum, (May 1998); andAndrew Mitrusi and James Poterba, “The Distribution of Payroll and Income Tax Burdens, 1979–1999,”National Bureau of Economic Research, Working Paper 7707, (May 2000).4 Economists generally believe that workers also pay the employer portion of payroll taxes through lowerwages. The net income tax refund for this family would exceed payroll taxes even including the employerportion of the tax.
12
with incomes at the poverty level pay positive income taxes in addition to payroll taxes, in
spite of the small refundable EITC available to them.
The federal government collects other taxes as well, and determining how much of
these other taxes families pay is a thornier task. Corporate income taxes and excise taxes are
imposed on businesses, but economists recognize that the burden of these taxes must
ultimately fall on households in the form of higher prices or lower incomes. The dominant
view in the economics literature is that corporate taxes primarily burden people who own
capital, which makes these taxes less important for lower-income families than for others. In
contrast, economists generally believe that the burden of excise taxes on specific goods, such
as gasoline, alcoholic beverages, and tobacco products, falls disproportionately on low-
income families. This occurs for two reasons. First, low-income families spend a larger
fraction of their income than do higher-income families. Second, the types of goods that are
taxed often make up larger fractions of low-income families’ total expenditures.
The bottom line is that rich and poor people pay different federal taxes. As a share of
income, federal income tax rates are much higher for high-income than for low-income
families (indeed, many low-income families receive refundable credits rather than pay
income tax). In contrast, payroll and excise taxes impose higher burdens relative to income
on low-income families.
The State Tax Burden for Low-Income Families
Although state taxes as a share of personal income are less than one-third of federal
taxes, low-income families in many states pay more state taxes than federal taxes for two
reasons. First, states raise a much larger share of their revenue from expenditure-based taxes
than does the federal government. As mentioned above, expenditure-based taxes (such as
excise taxes) impose a much larger share of the tax burden on low-income families than
income taxes. Second, state income taxes are typically less progressive than federal income
taxes.
13
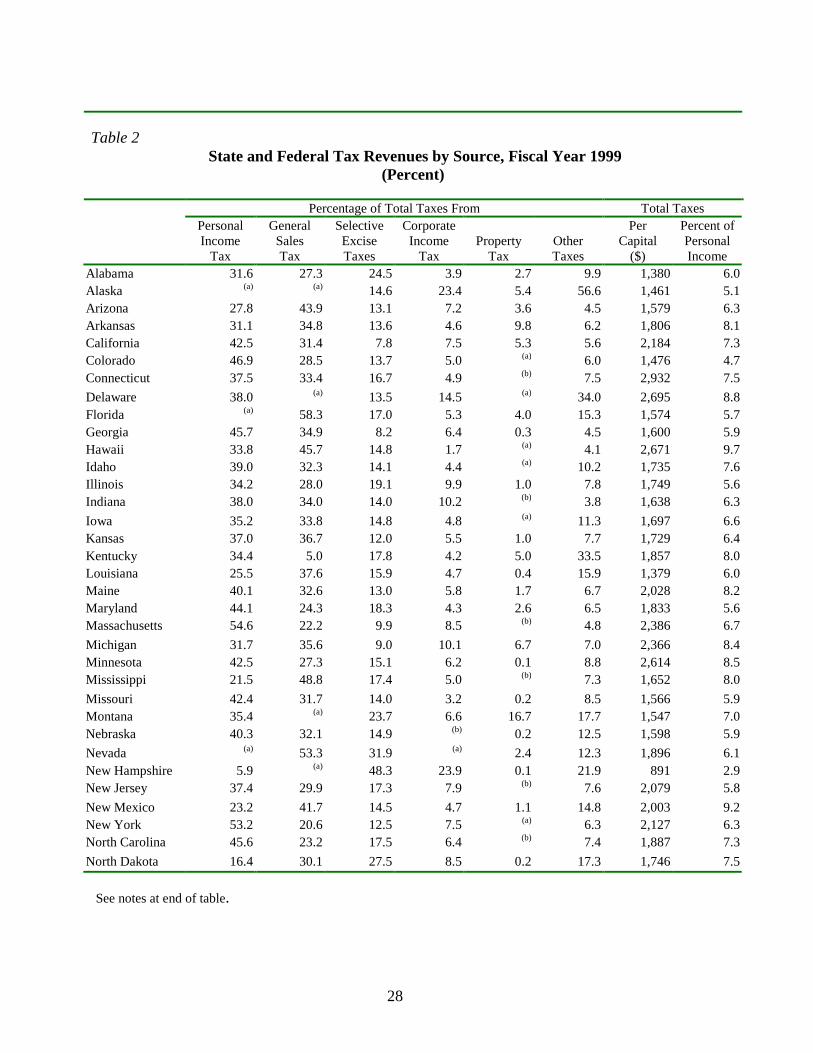
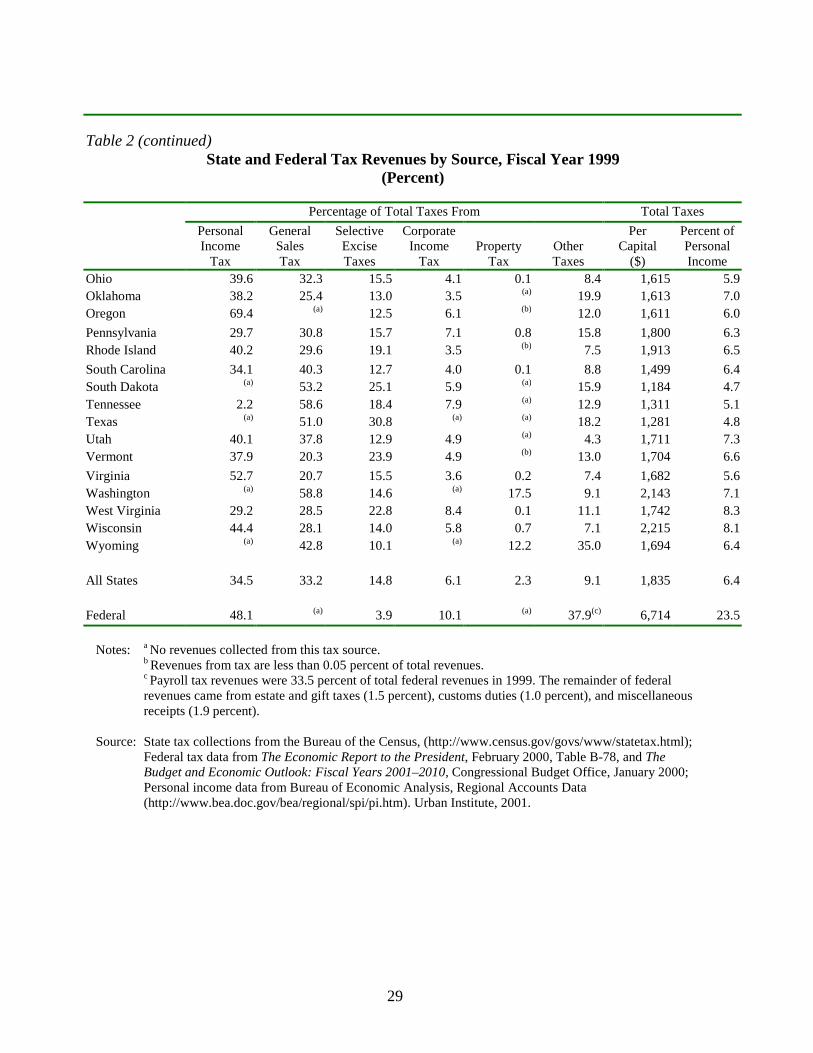
In 1999, states on average collected about one-third of their tax revenues from
personal income taxes, one-third from general sales taxes, and another 15 percent from
selective excise taxes on such items as alcohol, tobacco, and gasoline (table 2, page 28).
Thus, combined taxes on expenditures accounted for nearly one-half of state tax revenues,
compared with only about 4 percent of revenues at the federal level. Seven states had no
personal income tax, while four states (Massachusetts, New York, Oregon, and Virginia)
collected more than half their revenues from the personal income tax. Five states had no
general sales tax, but all the states collected some revenue for selective excise taxes,
including taxes on tobacco, alcohol, and gasoline.
Because of faster-than-expected revenue growth and expanding budget surpluses,
many states have reduced taxes in the past several years. Some have targeted a portion of that
tax relief to low-income families.5 Almost all states with an income tax use some
combination of personal exemptions, standard deductions, and no-tax floors to exempt a base
amount of income from the tax, and many states have increased the combined amount of
these exemptions and deductions. More than half the states with an income tax now have
some type of low-income tax credit. By 2000, 14 states and the District of Columbia had in
place a state earned income tax credit based on the federal credit. The state EITC was
refundable in 10 of those jurisdictions. (Eleven of the 14 states and the District had either
enacted or expanded their EITC since 1997.6) Some states currently provide further income
tax relief to low-income families through tax credits tied to certain expenditures, such as
child care, property taxes, and rents.
Despite increased deductions and expanded use of low-income credits, state income
taxes for low-income families remain higher than federal income taxes in many states. Tables
5 For recent developments regarding state tax reductions and how they affect low-income families see: ElaineMaag and Diane Lim Rogers, “The New Federalism and State Tax Policies Toward the Working Poor,” TheUrban Institute, Assessing the New Federalism Occasional Paper 38, (September 2000); Nicholas Johnson,Robert Zahradnik, and Elizabeth C. McNichol, “State Income Tax Burdens on Low-Income Families in 1999,”Center on Budget and Policy Priorities, (March 2000); and Nicholas W. Jenny, “2000 Tax and BudgetSummary,” State Fiscal Brief, Fiscal Studies Program, The Nelson A. Rockefeller Institute of Government,(September 2000).6 See Nicholas Johnson, “A Hand Up. How State Earned Income Tax Credits Help Working Families EscapePoverty,” Center on Budget and Policy Priorities, (November 2000).

14
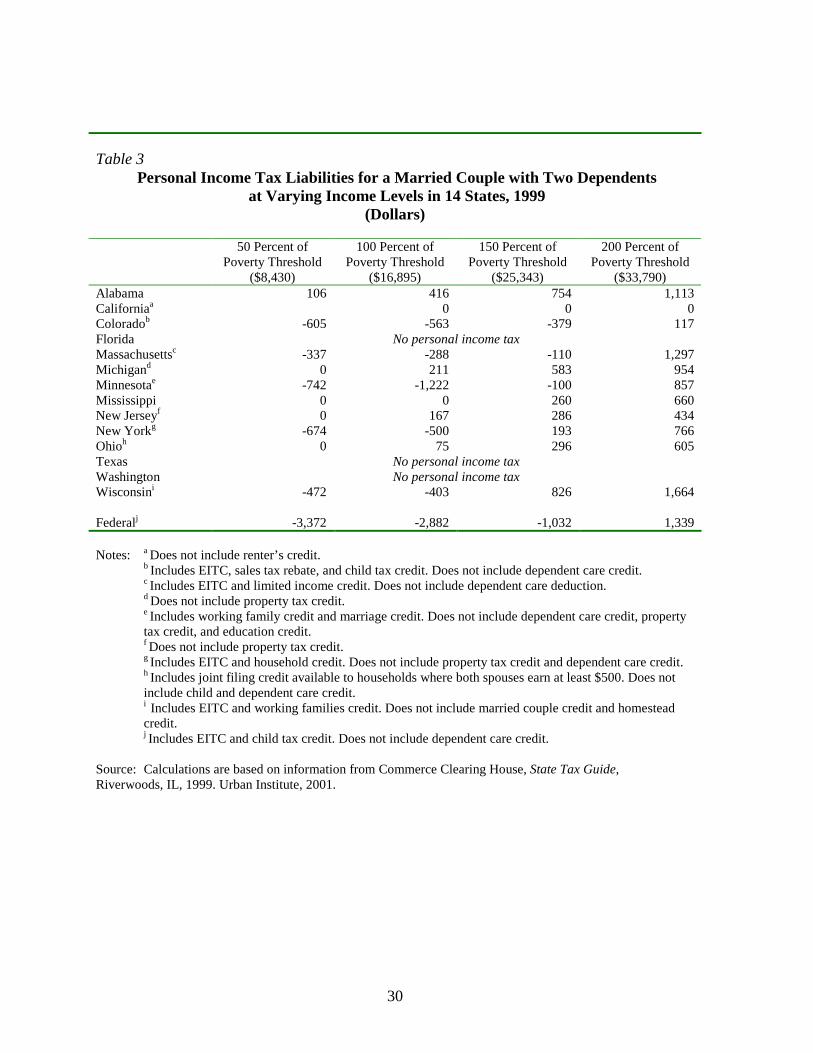
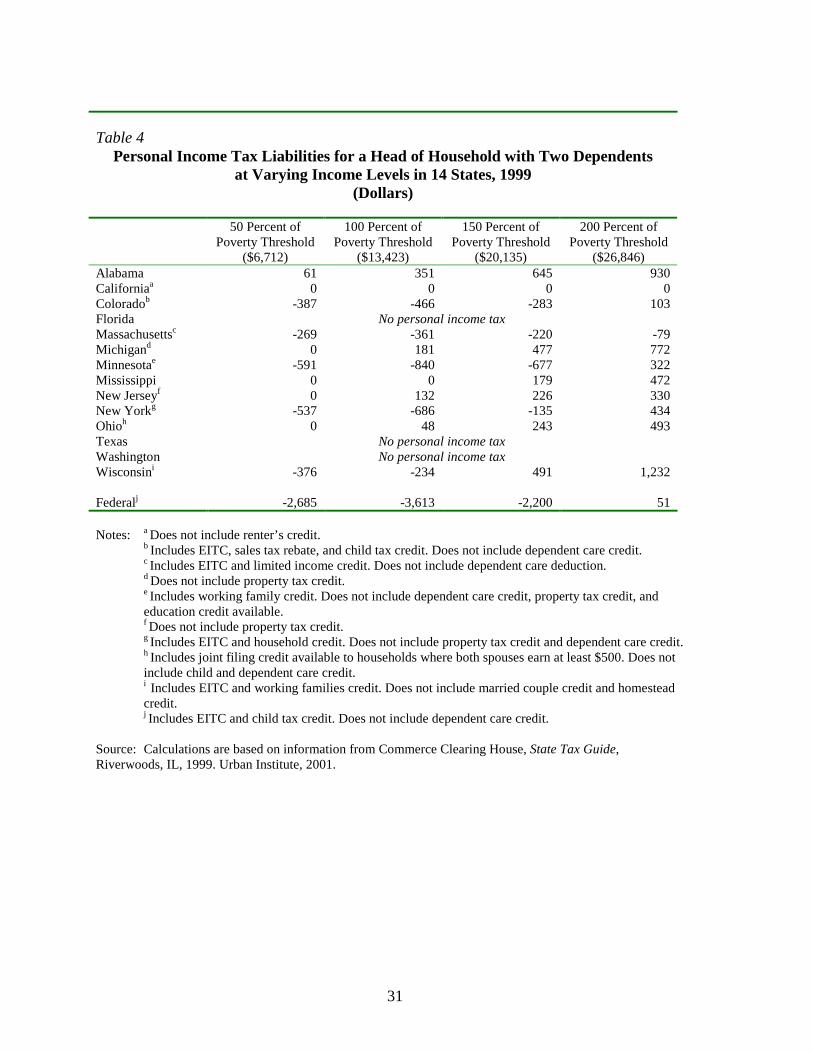
3 and 4 (pages 30-31) show calculations of state income taxes in a number of representative
states for a married couple with two children and a single-parent family with two children at
various income levels. The calculations include income-based tax credits, such as the EITC
and working family credits, but do not include credits based on expenditures. While families
with poverty-level incomes either pay no income tax or receive refundable credits in most of
the selected states, income taxes are positive for both the married-couple family and for the
single-parent family in 4 of the states.7 At 150 percent of the poverty level, taxes in all but 4
of the 11 selected states with income taxes (California, Colorado, Massachusetts, and
Minnesota) are greater than zero for the married-couple family and, in all but 5 states (the
previous 4 plus New York), for the single-parent family. Either type of family with income
equal to 100 or 150 percent of the poverty level would receive a sizeable net rebate from
federal income taxes.
Low-income families often pay more state sales and excise taxes than state income
tax. Most state sales taxes apply to a broad range of retail purchases. Many states exempt
certain “necessities,” such as food, clothing, and medicine, as an attempt to reduce sales taxes
for low-income families. Although these items generally make up a larger portion of the
family budget in low-income households than in others, exemptions are an imprecise way to
target sales tax relief to these families. All families spend some portion of their income on
exempt items and even though budget shares decline with rising income, the absolute amount
spent increases. Some states, including Colorado, Minnesota, and Wisconsin, have provided
income-based sales tax credits.
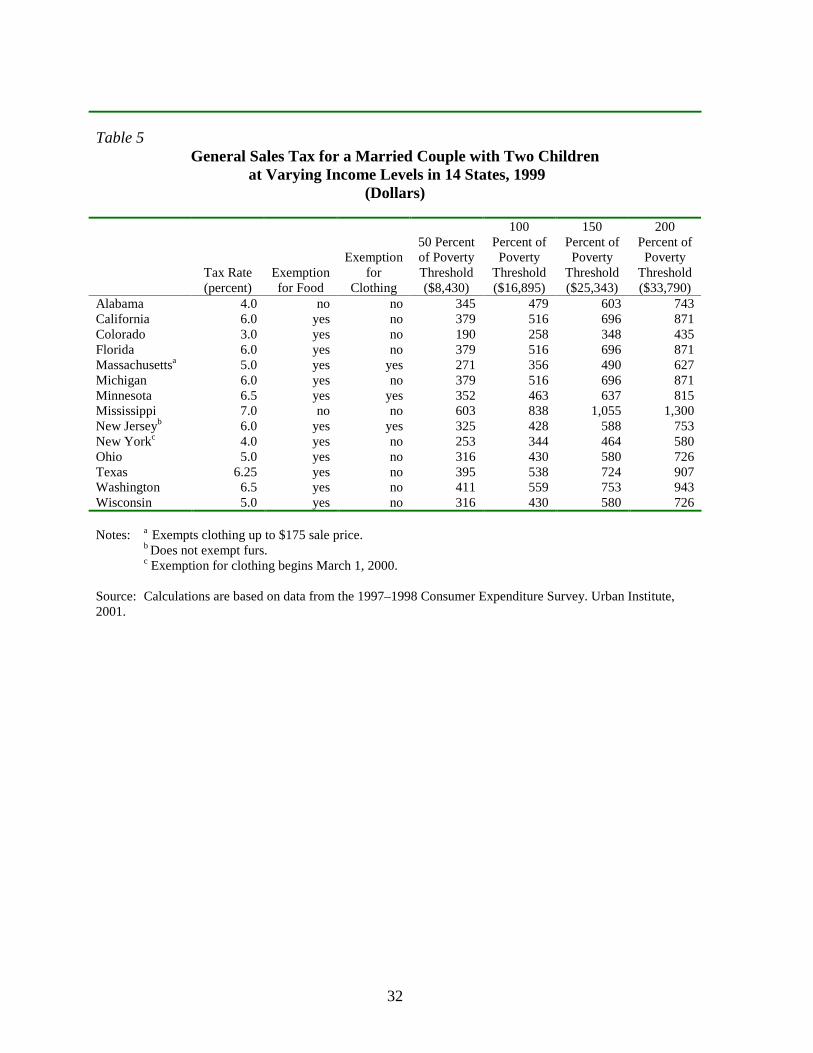
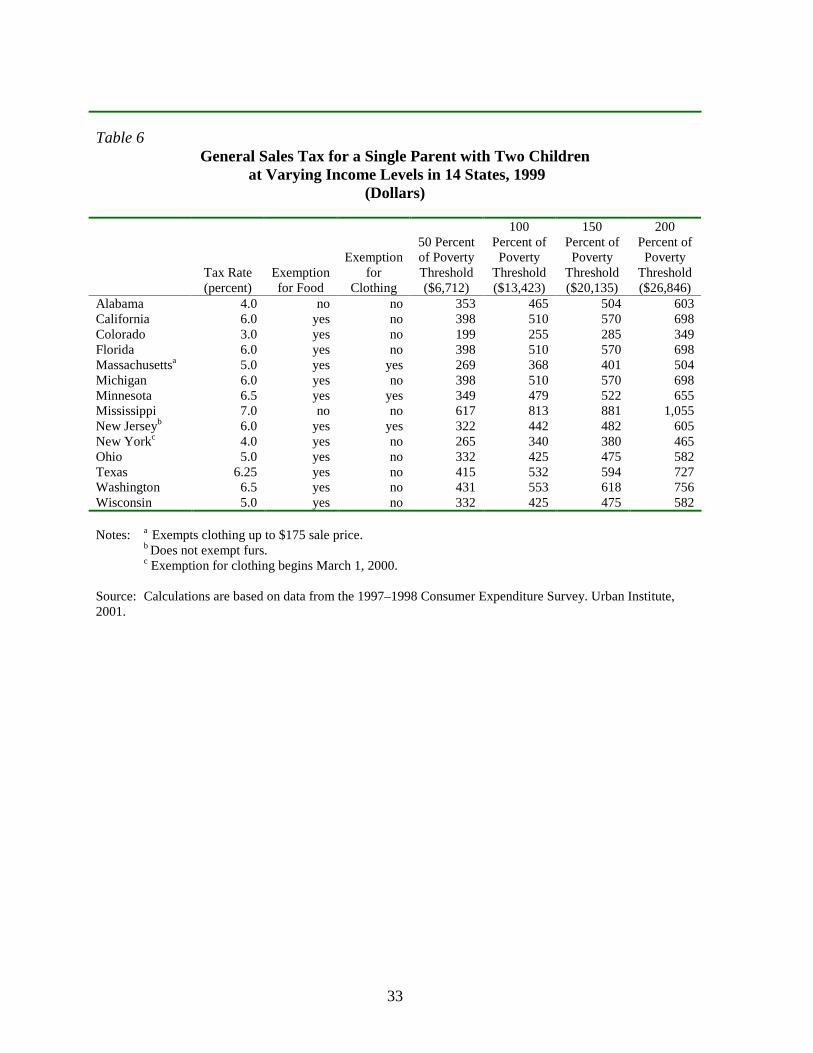
Tables 5 and 6 (pages 32-33) show calculations of 1999 sales tax payments in the
representative states, again for a married couple with two children and a single parent with
two children at various income levels. The calculations are based on national estimates of
average family expenditures by income and family size taken from the Bureau of Labor
Statistics Consumer Expenditure Survey and do not make adjustments for differences in
7 A married couple or a single parent with two children would either have paid no income tax or received arefundable credit in over half of all states with income taxes in 1999. See Johnson et al. (2000).
15
spending across states.8 The calculated amount of tax includes only general sales taxes; it
excludes excise tax payments on such items as tobacco, alcohol, and gasoline. The calculated
amounts also do not include local sales taxes, which are significant in a number of states.
Sales taxes are higher than income taxes in almost all of the selected states for a
couple with income less than 150 percent of the poverty level and for a single parent with
income below 200 percent of poverty. There is much less variation in the amount paid in
sales taxes by families at various income levels than in the amount paid in income taxes.
Even in the selected states that exempt food and clothing, sales taxes are a much larger
percentage of family income for the lowest-income families than for families with higher
incomes.
Comparing Options for Federal Income Tax Relief
Congress last enacted a significant package of income tax cuts in 1997. Most of those
tax reductions were in the form of credits or deductions targeted towards particular families
(families with younger children) or towards particular activities (saving for educational
expenses or retirement). Burgeoning federal budget surpluses provided an impetus for
proposals to further cut federal income taxes, although as the economy slows some tax cut
proposals have been recast as economic stimulus packages. The leading proposals thus far
have called either for broad-based relief through rate reductions or a further round of targeted
credits and deductions, including increases in the child tax credit and the EITC. In addition to
income tax reductions, there is considerable support in Congress for reducing federal estate
and gift taxes, and some federal excise taxes, such as the tax on telecommunications. There
has thus far been little interest in reducing payroll taxes.
We consider several options for reducing federal income taxes that reflect the range
of current proposals. There are a great variety of details associated with specific tax relief
packages, and we do not attempt to simulate actual plans. We instead select representative
options from the types of tax cuts that are characteristic of recent proposals and show how
8 Bureau of Labor Statistics, Consumer Expenditure Survey 1997–1998, (http://stats.bls.gov/csxcross.htm).
16
they would affect low-income families. The options include an across-the-board rate cut, an
increase in standard deductions and a widening of the income range for tax brackets, an
increase in child credits, an increase in the earned income credit, and a new payroll tax credit.
We simulate the effect of each option in tax year 1998. Each option is designed to
reduce revenues by approximately the same amount—$34 billion (table 7, page 39). This
would be about a 2 percent cut in total federal revenues and equal to about 0.4 percent of
Gross Domestic Product (GDP). These tax cuts would use up only a fraction of the projected
federal budget surplus. In July 2000, for example, the Congressional Budget Office projected
that the fiscal year 2001 on-budget federal surplus (the surplus excluding revenues and
spending of the Social Security Trust Funds and transactions of the Postal Service) would
range between 1.0 and 1.6 percent of GDP. More recent estimates project an even larger
surplus.
The six specific options we simulate are:
1. Cut income tax rates by 5 percent. This option would reduce income tax rates on
ordinary income by 5 percent but keep the rates on long-term capital gains the same as under
current law.9 The option assumes that the tax rates for the alternative minimum tax (AMT)
are also cut by 5 percent so that people do not switch over to the AMT (see box).
2. Increase the child credit to $1,300 per child. This option would increase the $400
child credit in 1998 ($500 in later years) to $1,300 per child. The credit would remain
partially refundable for families with three or more children and nonrefundable for families
with fewer than three children. It would continue to phase out for higher-income taxpayers
starting at the income thresholds in current law.
3. Increase the child credit to $1200 per child and make it refundable for all
taxpayers. This option would increase the child credit to $1,200 per child and extend
refundability to families with fewer than three children. Current rules regarding refundability
9 There are currently five tax brackets with corresponding tax rates of 15, 28, 31, 36, and 39.6 percent.

17
would still apply. The amount of the credit in excess of a family’s income tax liability would
still be refundable only up to the amount by which the family’s Social Security payroll taxes
exceeded any EITC. The option would retain the current law credit phase-out for higher-
income taxpayers.
4. Increase the standard deduction and extend the income range for the 15 percent
bracket by 18 percent. This option would increase standard deductions and lengthen the 15
percent tax bracket for single, married, and head-of-household filers.10
5. Increase the EITC phase-in rate by 25 percent and double the phase-out income
threshold. This option would raise the maximum EITC by 25 percent by increasing the
phase-in rates by 25 percent. It would also extend the credit to higher-income families by
doubling the income threshold at which the credit begins to phase out.11
6. Refundable Social Security payroll tax credit capped at $500. This option would
create a new refundable credit equal to the employee share of payroll taxes (7.65 percent of
wages) up to a maximum credit of $500. Each working spouse in a couple filing a joint return
10 Under current rules taxpayers can deduct a standard amount—$7,350 for married couples, $6,450 for heads ofhouseholds, and $4,400 for single filers in tax year 2000—in computing their taxable income. After subtractingpersonal exemptions and the higher of the standard or itemized deductions, a 15 percent tax rate applies to thefirst $43,850 of taxable income for couples, $35,150 for heads of households, and $26,250 for singles. Formarried couples in 2000, for example, the proposal would raise the standard deduction to $8,650 and the incometo which the lowest (15 percent) rate applies to $51,740.11 For example, in tax year 2000, the EITC is 40 percent of the first $9,390 of earnings for families with two ormore eligible children, 34 percent of the first $6,680 of earnings for families with one eligible child, and 7.65percent of the first $4,460 of earnings for single workers. The option would raise the maximum credit forfamilies and singles by increasing those phase-in rates by 25 percent but keep the income level at which themaximum credit applies the same as under current law. Thus, for example, the phase-in rate for families withtwo or more eligible children would rise to 50 percent and maximum credit would go up from $3,765 to$4,695—an increase of $940. Under current rules, families with earnings at or above the level at which the maximum applies but less than$12,260 receive the maximum credit, as do single workers with earnings less than $5,570. The credit is reducedby 21.06 percent of earnings in excess of $12,260 for families with two or more children, 15.98 percent ofincome in excess of $12,260 for families with one child, and 7.65 percent of income in excess of $5,570 forsingles. The option would extend the maximum credit to more families by doubling the income thresholds atwhich the credit begins to phase out. For example, for families with children, the phase-out range would start at$24,520. Because the rates at which the credit phases out would remain the same as under current law, a phase-out range starting at a higher income level means many families who were not eligible for the credit undercurrent law because their income was too high would receive partial credits. The credit for a family with twochildren, for example, would not phase out completely until income reached $46,800.

18
would be able to claim the credit. Thus, a married couple could receive a credit of up to
$1,000. The credit would phase out at a 5 percent rate for couples with adjusted gross income
(AGI) in excess of $42,000 and for other taxpayers with AGI in excess of $25,200.
Methodology for Simulating the Options
In order to evaluate the effects of income tax changes on different types of families,
we determine the distribution of income and taxes using a model that accounts for the
specific socioeconomic characteristics of households. The data in the model come from the
12 See Robert Rebelein and Jerry Tempalski, “Who Pays the Individual AMT?” OTA Working Paper 87, Officeof Tax Analysis, U.S. Treasury Department, (June 2000).13 For a discussion about how the alternative minimum tax would affect the tax reductions proposed by thenGovernor Bush see: Al Davis, “Candidate Bush’s Tax Plan,” Tax Notes, (January 10, 2000), pp. 271–277;Lawrence B. Lindsey, “Governor Bush’s Proposal and the Alternative Minimum Tax,” Tax Notes, (January 24,2000), pp.553–556; and Al Davis, “Further Thoughts on the Bush Tax Cut Plan,” Tax Notes, (February 7,2000), pp. 857–859.
The Alternative Minimum Tax
The Alternative Minimum Tax (AMT) is, as its name suggests, an alternative methodfor taxpayers to compute their income tax liability. Taxpayers must pay the higher ofthe regular tax or the alternative minimum tax.
The AMT differs from the regular tax in some important ways. There are two tax ratesin the AMT calculation, 26 percent and 28 percent, as opposed to the five ratesranging from 15 percent to 39.6 percent in the regular tax. A single income exclusionof $45,000 for couples and $33,750 for other taxpayers replaces the personalexemptions and standard deductions in the regular tax. Most credits allowed under theregular income tax cannot be used to reduce the AMT. By a special provision, thechild tax credit and education credits enacted in 1997 do apply to the AMT, but onlythrough tax year 2001.
Because the income exclusion amounts for the AMT are not indexed for inflation(unlike personal exemptions and the standard deduction under the regular tax), theAMT will exceed the regular income tax for more and more taxpayers over time.12 Iftax relief options reduce regular income tax rates and increase existing exemptionsand credits or add new ones, without corresponding changes to the AMT, manytaxpayers would not get the full benefits promised by those proposals.13
19
March 1999 Current Population Survey (CPS) of the U.S. Census Bureau and are enhanced
by imputations from other government databases. The simulation model used is the Urban
Institute’s Transfer Income Model (TRIM). TRIM computes income and payroll taxes based
on detailed income information from the CPS and on imputations of itemized deductions and
other tax variables using Internal Revenue Service (IRS) data from individual income tax
returns.
We measure baseline taxes and the change in tax burdens for each proposal in 1998.
The current version of TRIM simulates many, but not all, of the provisions enacted in the
Taxpayer Relief Act of 1997. In particular, the model does not simulate the HOPE and
lifetime learning educational expense credits. We show average tax rates (tax liabilities
divided by income before taxes) before and after each reform by income group and family
type. Income before tax includes all cash income reported by the family on the CPS, plus
realized capital gains imputed from tax return data.14 Even with the imputations from tax
return data, the model does not measure the full amount of income reported to the IRS by
higher-income taxpayers. Average income and taxes for the highest income group are thus
lower than the average for the same group computed solely on the basis of tax return data.
Because we measure Social Security payroll taxes as the combined employee and employer
share of the tax, we include the employer share of the tax as part of before-tax income.
In addition to showing changes in effective tax rates for each of the proposals, we
show the share of the benefits going to different income groups and types of families. We
also compare measures of the percentage changes in tax liabilities with the percentage
change in after-tax incomes.
Because our analysis is concerned with the effects of income tax cuts on the well-
being of different types of families (particularly lower-income families), we focus on the
effects on average tax rates rather than marginal tax rates. The marginal tax rate is the tax
imposed on the last dollar of income and is important for assessing the effect of taxes on
incentives to change work effort, saving, and other behaviors.
14 The CPS data were not adjusted for underreported income from cash transfer payments.

20
Some of the options would reduce marginal tax rates or increase marginal tax
subsidies. Cutting statutory tax rates by 5 percent would increase the returns to work and
saving, but the change would be slight and would probably have little measurable effect on
behavior. The after-tax return to work and saving would increase the most for those in the
highest tax bracket, but only by just over 3 percent. For taxpayers in the lowest tax bracket,
after-tax returns would increase by less than 1 percent.15 The option to extend the income
range for the 15 percent tax bracket would increase after-tax returns by a larger amount for
those taxpayers who would otherwise face a marginal tax rate of 28 percent. For them, the
after-tax return to additional work effort or saving would rise by 18 percent. The biggest
change in work incentives for a substantial number of taxpayers would come from the option
to increase the phase-in rate for the EITC by 25 percent. Low-income workers with earnings
below the amount at which they would receive the maximum credit would receive a 25 cents
higher subsidy for each dollar of additional earnings and thus have more of an incentive to
increase their earnings up to the point where they qualified for the maximum EITC. Research
has shown that the existing EITC has had a substantial positive effect on hours worked by
low-income workers, particularly for single mothers.16
Other options would either increase marginal tax rates or at least extend higher
marginal tax rates to more families. Taxpayers’ marginal tax rates depend not only on the
statutory tax rate in each tax bracket but also on whether additional income would cause
them to lose a portion of their tax credits or deductions. Taxpayers in the phase-out range for
the EITC or the child tax credit face higher marginal rates because each additional dollar of
income causes them to lose some portion of those credits. The options to raise the maximum
amount of the EITC or the child credit would maintain the current phase-out rates but would
15 The percentage change in income after tax is calculated as one minus the new marginal tax rate divided byone minus the old marginal tax rate. For taxpayers in the highest tax bracket this is [(1-.396*.95)/(1-.396)] =1.0328, or just over a 3 percent increase in the after-tax return.16 See Bruce D. Meyer and Dan T. Rosenbaum, “Welfare, the Earned Income Tax Credit, and the Labor Supplyof Single Mothers,” Working Paper, Northwestern University, (September 1999); Nada Eissa and Jeffrey B.Liebman, “Labor Supply Response to the Earned Income Tax Credit,” Quarterly Journal of Economics, 112(2),(May 1996); and Jeffrey B. Liebman, “The Impact of the Earned Income Tax Credit on Incentives and IncomeDistribution,” in James M. Poterba, ed., Tax Policy and the Economy, Vol. 12, MIT Press, (1998).

21
extend the phase-out over a much wider income range and thus cause more families to face
the higher marginal rates from the phase-outs.
Overall tax burdens depend on tax rates on all income, not just the last dollar of
income. A policy’s effect on marginal income tax rates is generally not the same as its effect
on average tax rates. Credits such as the EITC or the child tax credit that phase out as income
increases reduce people’s average tax rates even if they increase their marginal tax rates. The
option to extend those credits to more families would increase marginal tax rates for some
families at the same time as it lowered their average tax rate. Thus, the higher marginal tax
rates would not make workers in these families worse off even though their incentives to
work an additional hour or save an additional dollar would be reduced.
How Options Affect Low-Income Families
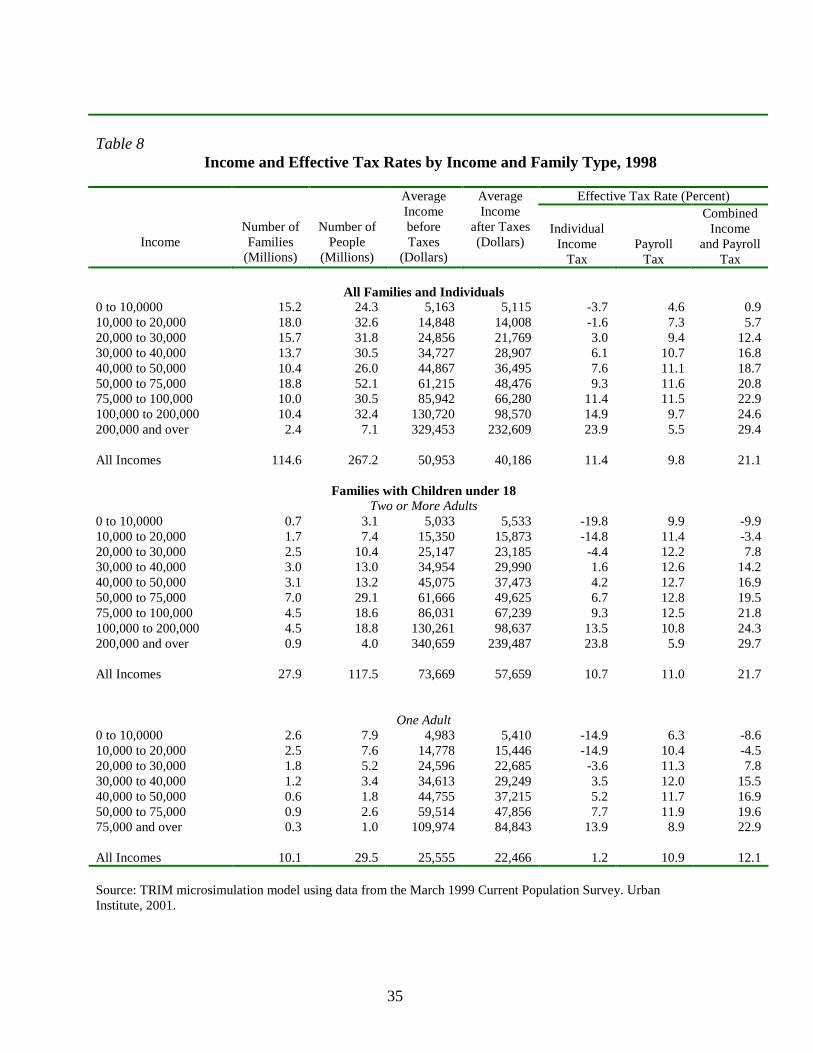
Results from TRIM for 1998 show that families, on average, paid over 11 percent of
their income in federal income taxes and just under another 10 percent in Social Security
payroll taxes (table 8, page 35). As mentioned above, payroll taxes include both the
employee and employer share of the tax. Income taxes for families with incomes under
$20,000 were less than zero, on average, indicating that the EITC was greater than positive
tax liability for these families, resulting in a net refund. Those refunds were not large enough
to offset their payroll taxes, however, and thus combined income and payroll liability for
these families was greater than zero, though still a relatively small percentage of their
income. Payroll taxes were greater than income taxes for the large majority of families.
Average payroll taxes exceeded average income taxes in every income group up through
$75,000.
Taxes for low-income families with children were lower than taxes for other low-
income families. Couples and singles with children and income under $30,000 on average
received net income transfers from the individual income tax, rather than owing any tax.
Those transfers were significant in size, amounting to 15 percent or more of family income
before taxes for families with incomes under $20,000. Although families in those income

22
groups did pay payroll taxes, the combination of income and payroll taxes still resulted in a
net tax refund.
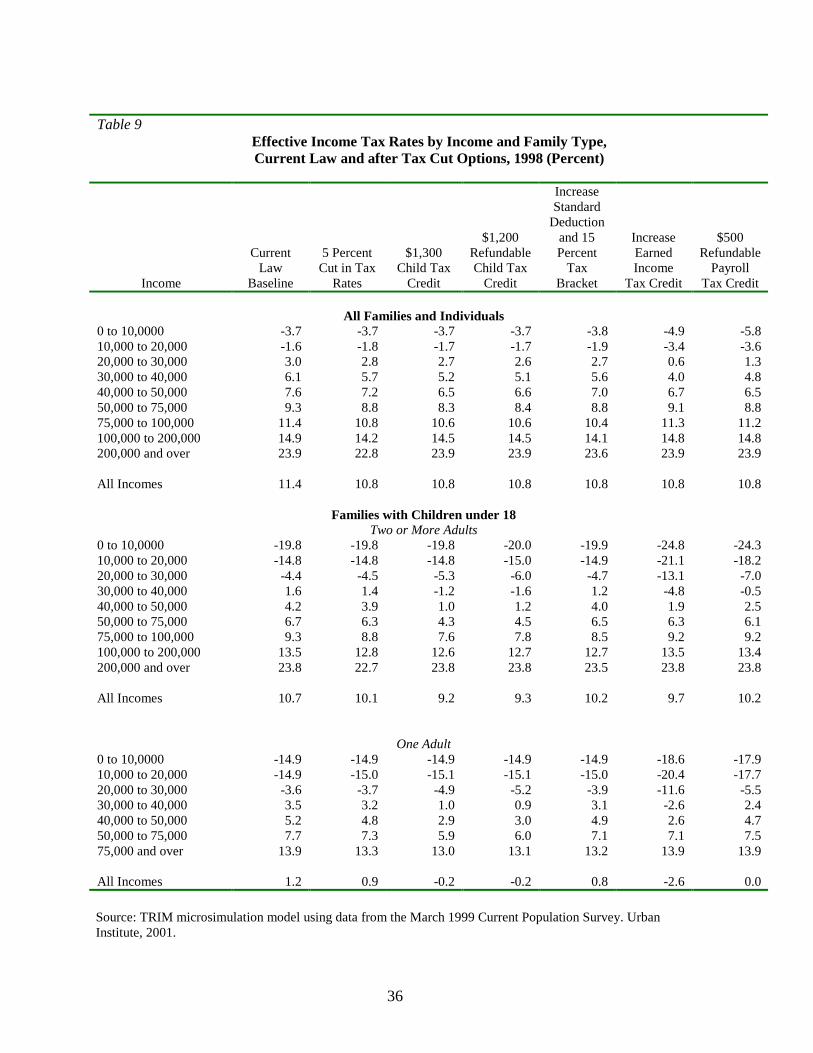
The tax cut options to reduce tax rates, increase the child credit, and increase standard
deductions and extend the length of the 15 percent income tax bracket would have very little
effect on average income tax rates for low-income families (table 9, page 36). This is not
surprising given that these families pay little or no income tax and thus receive little benefit
from proposals that only reduce positive income tax liabilities. Because of the rules limiting
refundability under current law, even the proposal to increase the child credit and extend
refundability to families with fewer than three children would yield almost no benefit to the
lowest-income families with children. Most low-income families who would have child
credits in excess of their income tax liability under the option would also receive an EITC
payment that exceeded their payroll tax and thus would not qualify for a refund of the child
credit. Of course an alternative option would be to make the child credit refundable without
regard to payroll taxes net of EITC, in which case the credit would serve as a flat per-child
payment to all families with children, administered through the tax code. Many more low-
income families would benefit under that option, but refundability would not be limited to
low-income families who work and pay payroll taxes. The refundable child credit option
simulated here would have a sizeable effect on middle-income families. Income taxes paid by
families with children and incomes between $30,000 and $70,000 would decrease on average
by 2 to 3 percent of income.
The proposals to increase the EITC or to create a new refundable payroll tax credit
clearly would have the biggest impact on low-income families, boosting the amount of
refunds received by those families. Both credits apply only to families with earnings, so the
impact on families with children is much greater than the impact on other low-income
families and individuals, about 40 to 50 percent of whom are elderly. Families with children
and income of $20,000 or less would see an increase in their net refunds of 3 to 4 percent of
family income on average, while families with income of $20,000 to $30,000 would see an
increase of about 8 percent.

23
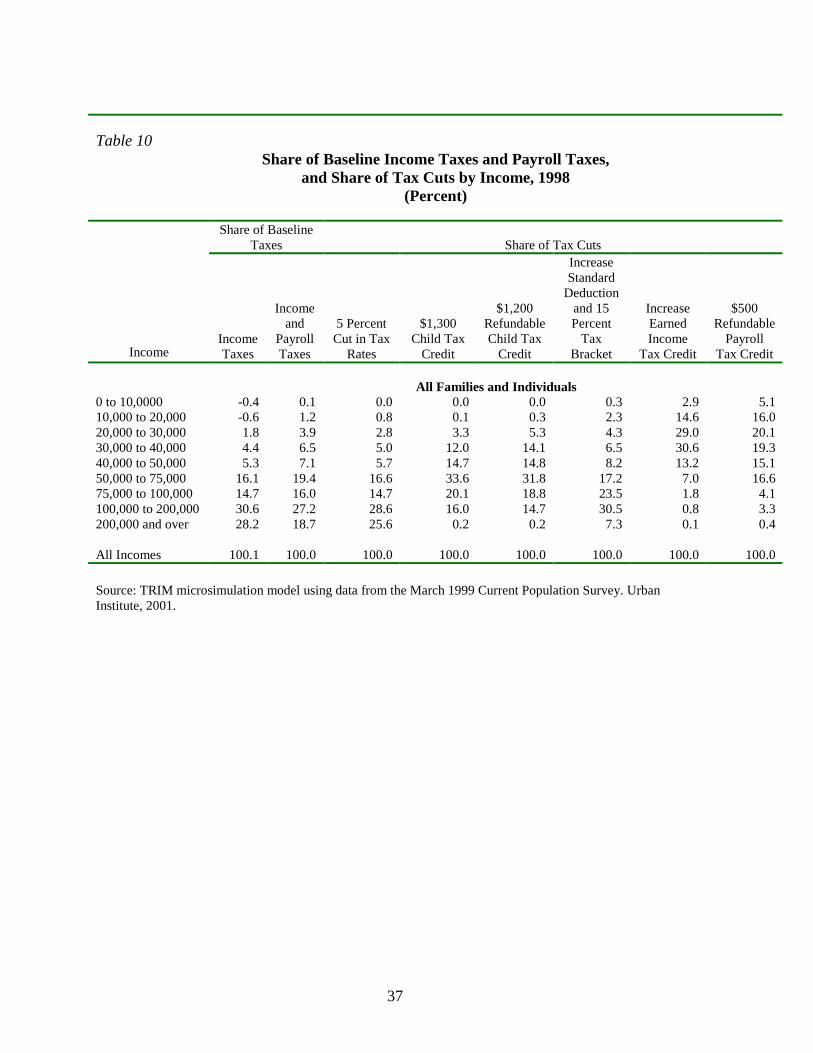
The distribution of benefits from the various tax relief proposals is clearly illustrated
by the share of benefits from each proposal going to different income groups (table 10, page
37). Over 50 percent of the benefits from an across-the-board cut in tax rates would go to the
11 percent of families with incomes of $100,000 or more. This is somewhat less than their
share of baseline income taxes but more than their share of combined income and payroll
taxes.
The bulk of benefits (80 percent) from raising the standard deduction and increasing
the income range for the 15 percent bracket would go to families with incomes between
$50,000 and $200,000. It is not surprising that this proposal tends to benefit middle- and
higher-income families. Increasing standard deductions would not benefit low-income
taxpayers who already have zero income tax liabilities due to the current standard deductions,
personal exemptions, and child credit (but not counting the EITC), nor would it benefit high-
income taxpayers who for the most part itemize deductions. Lengthening the income range
for the 15 percent bracket would benefit only families who are currently taxed at higher rates.
While seemingly aimed at middle-income taxpayers, only about 25 percent of taxpayers, in
fact, currently face statutory rates in excess of 15 percent. Furthermore, taxpayers in the 28
percent bracket who have only a small portion of their income taxed at that higher rate would
receive only a small benefit from the proposal.17
About 60 percent of the benefits from the options to increase child credits would go
to families with incomes between $30,000 and $75,000, with a slightly higher share for
families at the lower end of that income range under the option that would make the credit
refundable. More than 75 percent of the benefits from increasing the EITC would go to
families with incomes of $40,000 or less. On the other hand, about 70 percent of the benefits
from a new refundable payroll tax credit would go to these families. Additionally, under this
17 For example, the proposal would increase the starting point for the 28 percent bracket from $43,850 to$51,750 of taxable income for taxpayers filing joint returns in 2000. Taxpayers in that filing status with taxableincomes equal to or greater than $51,750 would see their taxes reduced by $1,027, because an additional $7,900of taxable income would be taxed at 15 percent rather than 28 percent. Taxpayers with taxable income in excessof $43,850 but less than $51,750 would receive a smaller tax cut. There would be no benefit for taxpayers withtaxable income of $43,850 or less. Because taxable income is measured after subtraction of personalexemptions and deductions, a married couple with two children and taxable income of $43,850 in 2000 wouldhave at least $62,400 of adjusted gross income.
24
option, a larger share of benefits would go to the very lowest-income families than under any
of the other options.
Not all types of families would benefit from the proposals simulated here. In
particular, couples and singles without eligible children under age 17 would see no change in
their taxes from either proposal to increase child credits (table 11, page 38). Single adults
would benefit the most from more broadly based options, including the rate cuts, the increase
in standard deductions and the income range for the 15 percent tax bracket, and, in particular,
the payroll tax credit. Single parents with children would benefit the most from the option to
increase the EITC and the least from the option for a proportional cut in income tax rates.
Higher-income families currently pay a larger share of their income in taxes than
lower-income families. Therefore, an across-the-board cut in income taxes benefits high-
income families relatively more if those benefits are measured in absolute dollars per family
or as a share of income, but not if the benefits are measured as a percentage change in
income tax liability. Measuring the changes in tax burdens as the percentage decrease in tax
liability can be misleading, because it suggests that low-income families would benefit the
most from tax cuts simply because they pay so little of the tax to begin with. For example, if
the tax liability of a family with $20,000 of income drops from $200 to $100, it experiences a
50 percent tax cut, but only a $100 (or 0.5 percent) increase in after-tax income. In contrast,
if a family with $100,000 of income paying $20,000 of tax receives a $4,000 tax cut, it
experiences a 20 percent reduction in taxes. However, its after-tax income increases by 5
percent —10 times the percentage increase (and 40 times the absolute increase) of the low-
income family.
Measured as the percentage change in income taxes, the option for an across-the-
board cut in tax rates appears to be progressive for families with incomes over $20,000—the
percentage reduction in taxes declines as income increases (table 12, page 39). It is not the
same percentage decrease in taxes at all incomes because it is an across-the-board cut in
income taxes not total taxes and, as we have seen, the share of income taxes in total taxes
varies by income level. It is not even the same percentage decrease in income taxes at all

25
income levels. Families would continue to receive the same dollar amount of credits as
before, and thus a 5 percent cut in tax rates results in a more than 5 percent reduction in taxes
after credits. Higher-income families would have less than a 5 percent reduction in income
taxes because the rate cut does not apply to the tax rate on capital gains.
Measured as the percentage increase in income after taxes, the across-the-board cut in
tax rates is not progressive. Benefits from the tax cut increase with family income, with the
largest increases for families with the highest incomes (table 13, page 40). Likewise, the
option to increase standard deductions and extend the income range for the 15 percent tax
bracket appears mostly progressive when measured as a percentage reduction in income
taxes, but not when measured as a percentage change in income after tax.
Conclusions
Alternative types of broad-based tax cuts differ greatly in how they affect low-income
families. Because low-income families pay so little income tax, refundability is the key to
whether future income tax reductions will provide any benefits to them. However, those
benefits will also depend upon whether or not new or expanded credits are refundable in a
meaningful way. For example, extending current rules for refundability of child credits to all
taxpayers does little to help low-income families because those rules would effectively
preclude refunds for most families.
Consequently, across-the-board cuts in federal income tax rates or increases in the
standard deduction and the width of the lowest tax bracket provide very little benefit to low-
income families. Increasing the child credit as currently structured also would provide them
very little assistance. Among the options we considered, the ones that help low-income
families the most are increases in the earned income tax credit and enactment of a new,
refundable payroll tax credit.
Whether or not a tax reduction proposal disproportionately benefits low-income
families is only one criterion by which to judge its merits. The standard principles of good
26
tax policy still apply. Would the proposal increase the economic efficiency of the tax system
by reducing disincentives for work and saving? Would the proposal reduce, or at least not
add to, tax complexity and the compliance burden on taxpayers? Proposals targeted to help
low-income families do not necessarily also advance these other goals and may detract from
them. Income-conditioned tax relief means that benefits must phase-out for families with
higher incomes and thus results in higher marginal tax rates over the income phase-out range.
Benefits targeted to particular taxpayers also mean that there must be rules determining who
is eligible, which increases the complexity of taxes and creates opportunities for errors and
abuse.
Fairness does not dictate that all tax relief should be directed to low-income families.
However, they should not be left out. It is true that most low-income families, in particular
families with children, pay zero or no federal income taxes and many even receive a net
income tax refund. Nevertheless, these families do pay federal payroll and excise taxes along
with state and local taxes. Just as in evaluating changes to spending programs, Congress must
compare tax relief with other options for using surplus revenues, such as paying down the
federal debt or addressing the future insolvency of Social Security and Medicare. If a tax cut
is the best option, should it be targeted to higher-income people who have enjoyed
extraordinary prosperity over the past decade, or to low- and moderate-income families who
work and pay taxes but do not enjoy the same economic security?
27
Table 1 Federal Income and Payroll Tax at Varying Income Levels
by Family Type, 1999(dollars)
50 Percentof PovertyThreshold
100 Percentof PovertyThreshold
150 Percentof PovertyThreshold
200 Percentof PovertyThreshold
Single Adult
Income Tax -332 125 893 1,543Payroll Tax 332 663 995 1,326Total 0 788 1,888 2,869
Married Couple with Two Children
Income Tax -3,372 -2,882 -1,032 1,339Payroll Tax 646 1,292 1,939 2,585Total -2,726 -1,590 907 3,924
Single Parent with Two Children
Income Tax -2,685 -3,613 -2,200 51Payroll Tax 513 1,027 1,540 2,054Total -2,172 -2,586 -660 2,105
Notes: Poverty thresholds equal to $8,667 for a single adult (under age 65), $16,895 for a married couple withtwo children, and $13,423 for a single parent with two children.Payroll tax includes only the employee portion of Social Security (OASDHI) payroll taxes.
Source: Urban Institute, 2001.
28
Table 2 State and Federal Tax Revenues by Source, Fiscal Year 1999
(Percent)
Percentage of Total Taxes From Total TaxesPersonalIncome
Tax
GeneralSalesTax
SelectiveExciseTaxes
CorporateIncome
TaxProperty
TaxOtherTaxes
PerCapital
($)
Percent ofPersonalIncome
Alabama 31.6 27.3 24.5 3.9 2.7 9.9 1,380 6.0Alaska (a) (a) 14.6 23.4 5.4 56.6 1,461 5.1Arizona 27.8 43.9 13.1 7.2 3.6 4.5 1,579 6.3Arkansas 31.1 34.8 13.6 4.6 9.8 6.2 1,806 8.1California 42.5 31.4 7.8 7.5 5.3 5.6 2,184 7.3Colorado 46.9 28.5 13.7 5.0 (a) 6.0 1,476 4.7Connecticut 37.5 33.4 16.7 4.9 (b) 7.5 2,932 7.5Delaware 38.0 (a) 13.5 14.5 (a) 34.0 2,695 8.8Florida (a) 58.3 17.0 5.3 4.0 15.3 1,574 5.7Georgia 45.7 34.9 8.2 6.4 0.3 4.5 1,600 5.9Hawaii 33.8 45.7 14.8 1.7 (a) 4.1 2,671 9.7Idaho 39.0 32.3 14.1 4.4 (a) 10.2 1,735 7.6Illinois 34.2 28.0 19.1 9.9 1.0 7.8 1,749 5.6Indiana 38.0 34.0 14.0 10.2 (b) 3.8 1,638 6.3Iowa 35.2 33.8 14.8 4.8 (a) 11.3 1,697 6.6Kansas 37.0 36.7 12.0 5.5 1.0 7.7 1,729 6.4Kentucky 34.4 5.0 17.8 4.2 5.0 33.5 1,857 8.0Louisiana 25.5 37.6 15.9 4.7 0.4 15.9 1,379 6.0Maine 40.1 32.6 13.0 5.8 1.7 6.7 2,028 8.2Maryland 44.1 24.3 18.3 4.3 2.6 6.5 1,833 5.6Massachusetts 54.6 22.2 9.9 8.5 (b) 4.8 2,386 6.7Michigan 31.7 35.6 9.0 10.1 6.7 7.0 2,366 8.4Minnesota 42.5 27.3 15.1 6.2 0.1 8.8 2,614 8.5Mississippi 21.5 48.8 17.4 5.0 (b) 7.3 1,652 8.0Missouri 42.4 31.7 14.0 3.2 0.2 8.5 1,566 5.9Montana 35.4 (a) 23.7 6.6 16.7 17.7 1,547 7.0Nebraska 40.3 32.1 14.9 (b) 0.2 12.5 1,598 5.9Nevada (a) 53.3 31.9 (a) 2.4 12.3 1,896 6.1New Hampshire 5.9 (a) 48.3 23.9 0.1 21.9 891 2.9New Jersey 37.4 29.9 17.3 7.9 (b) 7.6 2,079 5.8New Mexico 23.2 41.7 14.5 4.7 1.1 14.8 2,003 9.2New York 53.2 20.6 12.5 7.5 (a) 6.3 2,127 6.3North Carolina 45.6 23.2 17.5 6.4 (b) 7.4 1,887 7.3North Dakota 16.4 30.1 27.5 8.5 0.2 17.3 1,746 7.5
See notes at end of table.
29
Table 2 (continued)State and Federal Tax Revenues by Source, Fiscal Year 1999
(Percent)
Percentage of Total Taxes From Total TaxesPersonalIncome
Tax
GeneralSalesTax
SelectiveExciseTaxes
CorporateIncome
TaxProperty
TaxOtherTaxes
PerCapital
($)
Percent ofPersonalIncome
Ohio 39.6 32.3 15.5 4.1 0.1 8.4 1,615 5.9Oklahoma 38.2 25.4 13.0 3.5 (a) 19.9 1,613 7.0Oregon 69.4 (a) 12.5 6.1 (b) 12.0 1,611 6.0Pennsylvania 29.7 30.8 15.7 7.1 0.8 15.8 1,800 6.3Rhode Island 40.2 29.6 19.1 3.5 (b) 7.5 1,913 6.5South Carolina 34.1 40.3 12.7 4.0 0.1 8.8 1,499 6.4South Dakota (a) 53.2 25.1 5.9 (a) 15.9 1,184 4.7Tennessee 2.2 58.6 18.4 7.9 (a) 12.9 1,311 5.1Texas (a) 51.0 30.8 (a) (a) 18.2 1,281 4.8Utah 40.1 37.8 12.9 4.9 (a) 4.3 1,711 7.3Vermont 37.9 20.3 23.9 4.9 (b) 13.0 1,704 6.6Virginia 52.7 20.7 15.5 3.6 0.2 7.4 1,682 5.6Washington (a) 58.8 14.6 (a) 17.5 9.1 2,143 7.1West Virginia 29.2 28.5 22.8 8.4 0.1 11.1 1,742 8.3Wisconsin 44.4 28.1 14.0 5.8 0.7 7.1 2,215 8.1Wyoming (a) 42.8 10.1 (a) 12.2 35.0 1,694 6.4
All States 34.5 33.2 14.8 6.1 2.3 9.1 1,835 6.4
Federal 48.1 (a) 3.9 10.1 (a) 37.9(c) 6,714 23.5
Notes: a No revenues collected from this tax source.b Revenues from tax are less than 0.05 percent of total revenues.c Payroll tax revenues were 33.5 percent of total federal revenues in 1999. The remainder of federalrevenues came from estate and gift taxes (1.5 percent), customs duties (1.0 percent), and miscellaneousreceipts (1.9 percent).
Source: State tax collections from the Bureau of the Census, (http://www.census.gov/govs/www/statetax.html);Federal tax data from The Economic Report to the President, February 2000, Table B-78, and TheBudget and Economic Outlook: Fiscal Years 2001–2010, Congressional Budget Office, January 2000;Personal income data from Bureau of Economic Analysis, Regional Accounts Data(http://www.bea.doc.gov/bea/regional/spi/pi.htm). Urban Institute, 2001.
30
Table 3 Personal Income Tax Liabilities for a Married Couple with Two Dependents
at Varying Income Levels in 14 States, 1999(Dollars)
50 Percent ofPoverty Threshold
($8,430)
100 Percent ofPoverty Threshold
($16,895)
150 Percent ofPoverty Threshold
($25,343)
200 Percent ofPoverty Threshold
($33,790)Alabama 106 416 754 1,113Californiaa 0 0 0Coloradob -605 -563 -379 117Florida No personal income taxMassachusettsc -337 -288 -110 1,297Michigand 0 211 583 954Minnesotae -742 -1,222 -100 857Mississippi 0 0 260 660New Jerseyf 0 167 286 434New Yorkg -674 -500 193 766Ohioh 0 75 296 605Texas No personal income taxWashington No personal income taxWisconsini -472 -403 826 1,664
Federalj -3,372 -2,882 -1,032 1,339
Notes: a Does not include renter’s credit.b Includes EITC, sales tax rebate, and child tax credit. Does not include dependent care credit.c Includes EITC and limited income credit. Does not include dependent care deduction.d Does not include property tax credit.e Includes working family credit and marriage credit. Does not include dependent care credit, propertytax credit, and education credit.f Does not include property tax credit.g Includes EITC and household credit. Does not include property tax credit and dependent care credit.h Includes joint filing credit available to households where both spouses earn at least $500. Does notinclude child and dependent care credit.i Includes EITC and working families credit. Does not include married couple credit and homesteadcredit.j Includes EITC and child tax credit. Does not include dependent care credit.
Source: Calculations are based on information from Commerce Clearing House, State Tax Guide,Riverwoods, IL, 1999. Urban Institute, 2001.
31
Table 4Personal Income Tax Liabilities for a Head of Household with Two Dependents
at Varying Income Levels in 14 States, 1999(Dollars)
50 Percent ofPoverty Threshold
($6,712)
100 Percent ofPoverty Threshold
($13,423)
150 Percent ofPoverty Threshold
($20,135)
200 Percent ofPoverty Threshold
($26,846)Alabama 61 351 645 930Californiaa 0 0 0 0Coloradob -387 -466 -283 103Florida No personal income taxMassachusettsc -269 -361 -220 -79Michigand 0 181 477 772Minnesotae -591 -840 -677 322Mississippi 0 0 179 472New Jerseyf 0 132 226 330New Yorkg -537 -686 -135 434Ohioh 0 48 243 493Texas No personal income taxWashington No personal income taxWisconsini -376 -234 491 1,232
Federalj -2,685 -3,613 -2,200 51
Notes: a Does not include renter’s credit.b Includes EITC, sales tax rebate, and child tax credit. Does not include dependent care credit.c Includes EITC and limited income credit. Does not include dependent care deduction.d Does not include property tax credit.e Includes working family credit. Does not include dependent care credit, property tax credit, andeducation credit available.f Does not include property tax credit.g Includes EITC and household credit. Does not include property tax credit and dependent care credit.h Includes joint filing credit available to households where both spouses earn at least $500. Does notinclude child and dependent care credit.i Includes EITC and working families credit. Does not include married couple credit and homesteadcredit.j Includes EITC and child tax credit. Does not include dependent care credit.
Source: Calculations are based on information from Commerce Clearing House, State Tax Guide,Riverwoods, IL, 1999. Urban Institute, 2001.
32
Table 5General Sales Tax for a Married Couple with Two Children
at Varying Income Levels in 14 States, 1999(Dollars)
Tax Rate(percent)
Exemptionfor Food
Exemptionfor
Clothing
50 Percentof PovertyThreshold($8,430)
100Percent ofPoverty
Threshold($16,895)
150Percent ofPoverty
Threshold($25,343)
200Percent ofPoverty
Threshold($33,790)
Alabama 4.0 no no 345 479 603 743California 6.0 yes no 379 516 696 871Colorado 3.0 yes no 190 258 348 435Florida 6.0 yes no 379 516 696 871Massachusettsa 5.0 yes yes 271 356 490 627Michigan 6.0 yes no 379 516 696 871Minnesota 6.5 yes yes 352 463 637 815Mississippi 7.0 no no 603 838 1,055 1,300New Jerseyb 6.0 yes yes 325 428 588 753New Yorkc 4.0 yes no 253 344 464 580Ohio 5.0 yes no 316 430 580 726Texas 6.25 yes no 395 538 724 907Washington 6.5 yes no 411 559 753 943Wisconsin 5.0 yes no 316 430 580 726
Notes: a Exempts clothing up to $175 sale price.b Does not exempt furs.c Exemption for clothing begins March 1, 2000.
Source: Calculations are based on data from the 1997–1998 Consumer Expenditure Survey. Urban Institute,2001.
33
Table 6General Sales Tax for a Single Parent with Two Children
at Varying Income Levels in 14 States, 1999(Dollars)
Tax Rate(percent)
Exemptionfor Food
Exemptionfor
Clothing
50 Percentof PovertyThreshold($6,712)
100Percent ofPoverty
Threshold($13,423)
150Percent ofPoverty
Threshold($20,135)
200Percent ofPoverty
Threshold($26,846)
Alabama 4.0 no no 353 465 504 603California 6.0 yes no 398 510 570 698Colorado 3.0 yes no 199 255 285 349Florida 6.0 yes no 398 510 570 698Massachusettsa 5.0 yes yes 269 368 401 504Michigan 6.0 yes no 398 510 570 698Minnesota 6.5 yes yes 349 479 522 655Mississippi 7.0 no no 617 813 881 1,055New Jerseyb 6.0 yes yes 322 442 482 605New Yorkc 4.0 yes no 265 340 380 465Ohio 5.0 yes no 332 425 475 582Texas 6.25 yes no 415 532 594 727Washington 6.5 yes no 431 553 618 756Wisconsin 5.0 yes no 332 425 475 582
Notes: a Exempts clothing up to $175 sale price.b Does not exempt furs.c Exemption for clothing begins March 1, 2000.
Source: Calculations are based on data from the 1997–1998 Consumer Expenditure Survey. Urban Institute,2001.

34
Table 7Estimated Annual Cost of Options
(Billions of Dollars)
OptionsCost in 1998
(Billions)1.) 5 Percent Cut in Tax Rates 34.02.) Increase Child Tax Credit to $1,300 per Child 34.53.) Increase Child Tax Credit to $1,200 per Child and Make It Refundable 32.94.) Increase Standard Deduction and Lengthen the 15 Percent Tax Bracket 33.95.) Increase Earned Income Tax Credit 32.86.) Refundable Payroll Tax Credit Capped at $500 33.8
Source: TRIM microsimulation model using data from the March 1999 Current Population Survey. UrbanInstitute, 2001.
35
Table 8 Income and Effective Tax Rates by Income and Family Type, 1998
Effective Tax Rate (Percent)
IncomeNumber ofFamilies
(Millions)
Number ofPeople
(Millions)
AverageIncomebeforeTaxes
(Dollars)
AverageIncome
after Taxes(Dollars)
IndividualIncome
TaxPayroll
Tax
CombinedIncome
and PayrollTax
All Families and Individuals0 to 10,0000 15.2 24.3 5,163 5,115 -3.7 4.6 0.910,000 to 20,000 18.0 32.6 14,848 14,008 -1.6 7.3 5.720,000 to 30,000 15.7 31.8 24,856 21,769 3.0 9.4 12.430,000 to 40,000 13.7 30.5 34,727 28,907 6.1 10.7 16.840,000 to 50,000 10.4 26.0 44,867 36,495 7.6 11.1 18.750,000 to 75,000 18.8 52.1 61,215 48,476 9.3 11.6 20.875,000 to 100,000 10.0 30.5 85,942 66,280 11.4 11.5 22.9100,000 to 200,000 10.4 32.4 130,720 98,570 14.9 9.7 24.6200,000 and over 2.4 7.1 329,453 232,609 23.9 5.5 29.4
All Incomes 114.6 267.2 50,953 40,186 11.4 9.8 21.1
Families with Children under 18Two or More Adults
0 to 10,0000 0.7 3.1 5,033 5,533 -19.8 9.9 -9.910,000 to 20,000 1.7 7.4 15,350 15,873 -14.8 11.4 -3.420,000 to 30,000 2.5 10.4 25,147 23,185 -4.4 12.2 7.830,000 to 40,000 3.0 13.0 34,954 29,990 1.6 12.6 14.240,000 to 50,000 3.1 13.2 45,075 37,473 4.2 12.7 16.950,000 to 75,000 7.0 29.1 61,666 49,625 6.7 12.8 19.575,000 to 100,000 4.5 18.6 86,031 67,239 9.3 12.5 21.8100,000 to 200,000 4.5 18.8 130,261 98,637 13.5 10.8 24.3200,000 and over 0.9 4.0 340,659 239,487 23.8 5.9 29.7
All Incomes 27.9 117.5 73,669 57,659 10.7 11.0 21.7
One Adult0 to 10,0000 2.6 7.9 4,983 5,410 -14.9 6.3 -8.610,000 to 20,000 2.5 7.6 14,778 15,446 -14.9 10.4 -4.520,000 to 30,000 1.8 5.2 24,596 22,685 -3.6 11.3 7.830,000 to 40,000 1.2 3.4 34,613 29,249 3.5 12.0 15.540,000 to 50,000 0.6 1.8 44,755 37,215 5.2 11.7 16.950,000 to 75,000 0.9 2.6 59,514 47,856 7.7 11.9 19.675,000 and over 0.3 1.0 109,974 84,843 13.9 8.9 22.9
All Incomes 10.1 29.5 25,555 22,466 1.2 10.9 12.1
Source: TRIM microsimulation model using data from the March 1999 Current Population Survey. UrbanInstitute, 2001.
36
Table 9Effective Income Tax Rates by Income and Family Type,Current Law and after Tax Cut Options, 1998 (Percent)
Income
CurrentLaw
Baseline
5 PercentCut in Tax
Rates
$1,300Child Tax
Credit
$1,200RefundableChild Tax
Credit
IncreaseStandard
Deductionand 15Percent
TaxBracket
IncreaseEarnedIncome
Tax Credit
$500Refundable
PayrollTax Credit
All Families and Individuals0 to 10,0000 -3.7 -3.7 -3.7 -3.7 -3.8 -4.9 -5.810,000 to 20,000 -1.6 -1.8 -1.7 -1.7 -1.9 -3.4 -3.620,000 to 30,000 3.0 2.8 2.7 2.6 2.7 0.6 1.330,000 to 40,000 6.1 5.7 5.2 5.1 5.6 4.0 4.840,000 to 50,000 7.6 7.2 6.5 6.6 7.0 6.7 6.550,000 to 75,000 9.3 8.8 8.3 8.4 8.8 9.1 8.875,000 to 100,000 11.4 10.8 10.6 10.6 10.4 11.3 11.2100,000 to 200,000 14.9 14.2 14.5 14.5 14.1 14.8 14.8200,000 and over 23.9 22.8 23.9 23.9 23.6 23.9 23.9
All Incomes 11.4 10.8 10.8 10.8 10.8 10.8 10.8
Families with Children under 18Two or More Adults
0 to 10,0000 -19.8 -19.8 -19.8 -20.0 -19.9 -24.8 -24.310,000 to 20,000 -14.8 -14.8 -14.8 -15.0 -14.9 -21.1 -18.220,000 to 30,000 -4.4 -4.5 -5.3 -6.0 -4.7 -13.1 -7.030,000 to 40,000 1.6 1.4 -1.2 -1.6 1.2 -4.8 -0.540,000 to 50,000 4.2 3.9 1.0 1.2 4.0 1.9 2.550,000 to 75,000 6.7 6.3 4.3 4.5 6.5 6.3 6.175,000 to 100,000 9.3 8.8 7.6 7.8 8.5 9.2 9.2100,000 to 200,000 13.5 12.8 12.6 12.7 12.7 13.5 13.4200,000 and over 23.8 22.7 23.8 23.8 23.5 23.8 23.8
All Incomes 10.7 10.1 9.2 9.3 10.2 9.7 10.2
One Adult0 to 10,0000 -14.9 -14.9 -14.9 -14.9 -14.9 -18.6 -17.910,000 to 20,000 -14.9 -15.0 -15.1 -15.1 -15.0 -20.4 -17.720,000 to 30,000 -3.6 -3.7 -4.9 -5.2 -3.9 -11.6 -5.530,000 to 40,000 3.5 3.2 1.0 0.9 3.1 -2.6 2.440,000 to 50,000 5.2 4.8 2.9 3.0 4.9 2.6 4.750,000 to 75,000 7.7 7.3 5.9 6.0 7.1 7.1 7.575,000 and over 13.9 13.3 13.0 13.1 13.2 13.9 13.9
All Incomes 1.2 0.9 -0.2 -0.2 0.8 -2.6 0.0
Source: TRIM microsimulation model using data from the March 1999 Current Population Survey. UrbanInstitute, 2001.
37
Table 10Share of Baseline Income Taxes and Payroll Taxes,
and Share of Tax Cuts by Income, 1998(Percent)
Share of BaselineTaxes Share of Tax Cuts
IncomeIncomeTaxes
Incomeand
PayrollTaxes
5 PercentCut in Tax
Rates
$1,300Child Tax
Credit
$1,200RefundableChild Tax
Credit
IncreaseStandard
Deductionand 15Percent
TaxBracket
IncreaseEarnedIncome
Tax Credit
$500Refundable
PayrollTax Credit
All Families and Individuals0 to 10,0000 -0.4 0.1 0.0 0.0 0.0 0.3 2.9 5.110,000 to 20,000 -0.6 1.2 0.8 0.1 0.3 2.3 14.6 16.020,000 to 30,000 1.8 3.9 2.8 3.3 5.3 4.3 29.0 20.130,000 to 40,000 4.4 6.5 5.0 12.0 14.1 6.5 30.6 19.340,000 to 50,000 5.3 7.1 5.7 14.7 14.8 8.2 13.2 15.150,000 to 75,000 16.1 19.4 16.6 33.6 31.8 17.2 7.0 16.675,000 to 100,000 14.7 16.0 14.7 20.1 18.8 23.5 1.8 4.1100,000 to 200,000 30.6 27.2 28.6 16.0 14.7 30.5 0.8 3.3200,000 and over 28.2 18.7 25.6 0.2 0.2 7.3 0.1 0.4
All Incomes 100.1 100.0 100.0 100.0 100.0 100.0 100.0 100.0
Source: TRIM microsimulation model using data from the March 1999 Current Population Survey. UrbanInstitute, 2001.
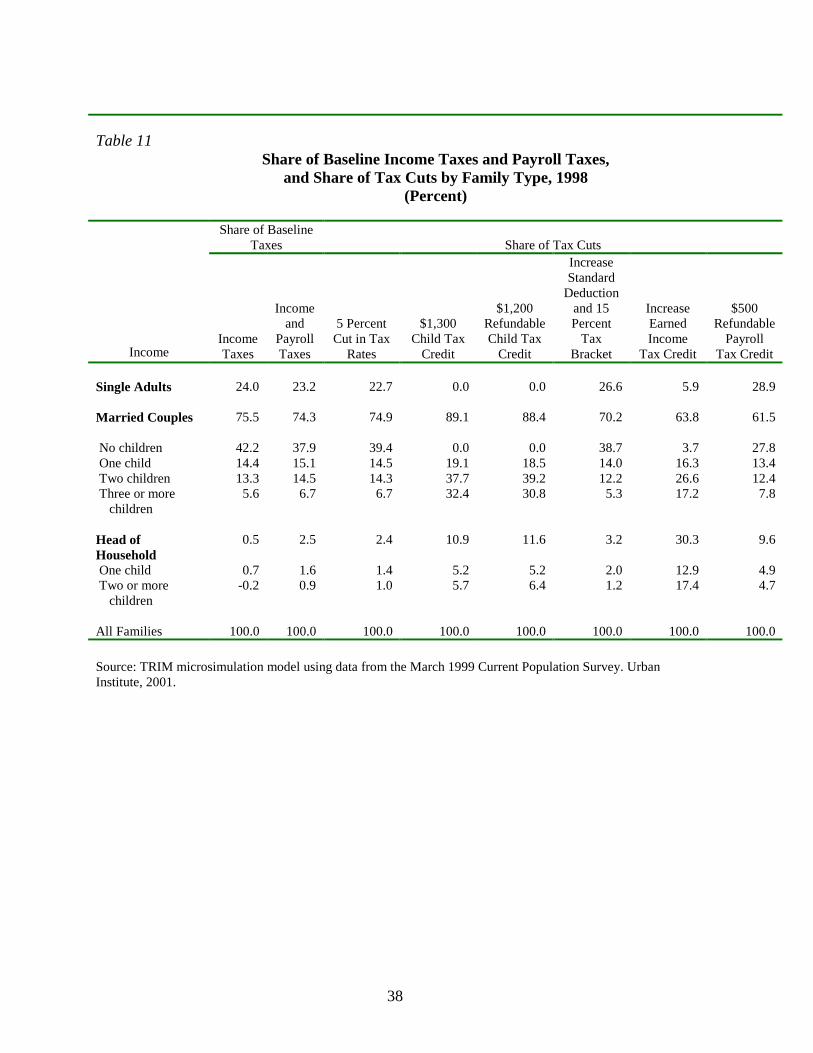
38
Table 11Share of Baseline Income Taxes and Payroll Taxes,
and Share of Tax Cuts by Family Type, 1998(Percent)
Share of BaselineTaxes Share of Tax Cuts
IncomeIncomeTaxes
Incomeand
PayrollTaxes
5 PercentCut in Tax
Rates
$1,300Child Tax
Credit
$1,200RefundableChild Tax
Credit
IncreaseStandard
Deductionand 15Percent
TaxBracket
IncreaseEarnedIncome
Tax Credit
$500Refundable
PayrollTax Credit
Single Adults 24.0 23.2 22.7 0.0 0.0 26.6 5.9 28.9
Married Couples 75.5 74.3 74.9 89.1 88.4 70.2 63.8 61.5
No children 42.2 37.9 39.4 0.0 0.0 38.7 3.7 27.8 One child 14.4 15.1 14.5 19.1 18.5 14.0 16.3 13.4 Two children 13.3 14.5 14.3 37.7 39.2 12.2 26.6 12.4 Three or more 5.6 6.7 6.7 32.4 30.8 5.3 17.2 7.8 children
Head of 0.5 2.5 2.4 10.9 11.6 3.2 30.3 9.6Household One child 0.7 1.6 1.4 5.2 5.2 2.0 12.9 4.9 Two or more -0.2 0.9 1.0 5.7 6.4 1.2 17.4 4.7 children
All Families 100.0 100.0 100.0 100.0 100.0 100.0 100.0 100.0
Source: TRIM microsimulation model using data from the March 1999 Current Population Survey. UrbanInstitute, 2001.
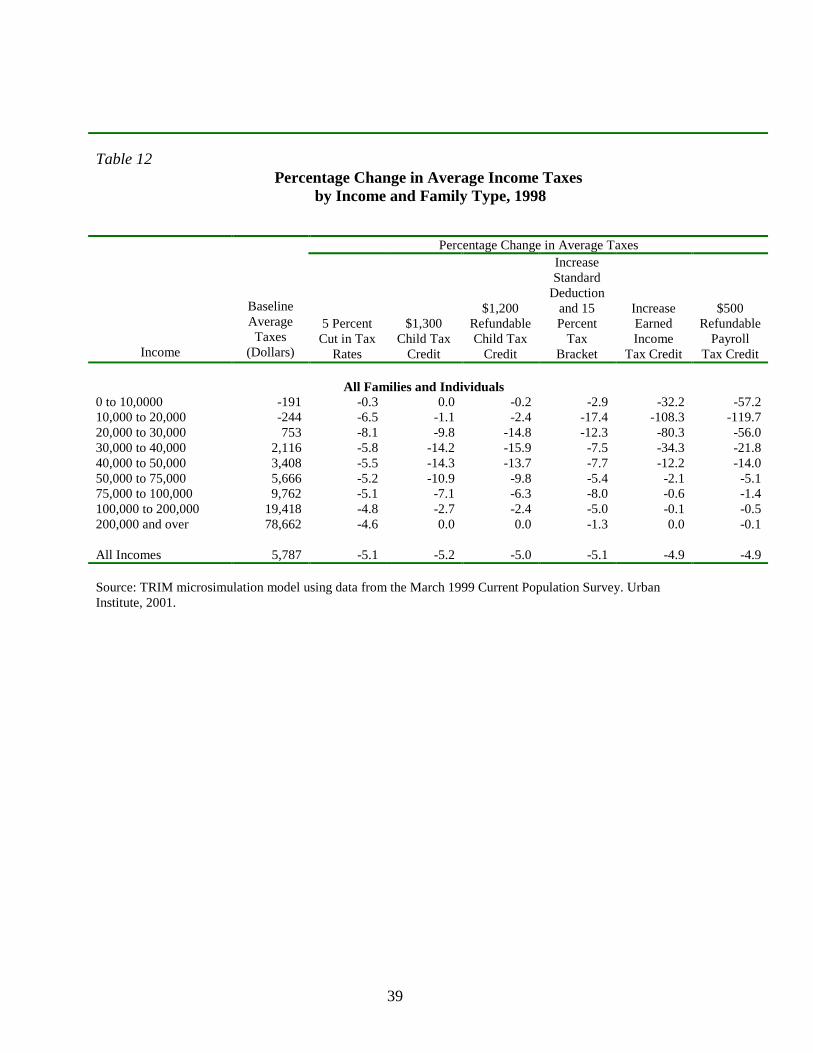
39
Table 12Percentage Change in Average Income Taxes
by Income and Family Type, 1998
Percentage Change in Average Taxes
Income
BaselineAverageTaxes
(Dollars)
5 PercentCut in Tax
Rates
$1,300Child Tax
Credit
$1,200RefundableChild Tax
Credit
IncreaseStandard
Deductionand 15Percent
TaxBracket
IncreaseEarnedIncome
Tax Credit
$500Refundable
PayrollTax Credit
All Families and Individuals0 to 10,0000 -191 -0.3 0.0 -0.2 -2.9 -32.2 -57.210,000 to 20,000 -244 -6.5 -1.1 -2.4 -17.4 -108.3 -119.720,000 to 30,000 753 -8.1 -9.8 -14.8 -12.3 -80.3 -56.030,000 to 40,000 2,116 -5.8 -14.2 -15.9 -7.5 -34.3 -21.840,000 to 50,000 3,408 -5.5 -14.3 -13.7 -7.7 -12.2 -14.050,000 to 75,000 5,666 -5.2 -10.9 -9.8 -5.4 -2.1 -5.175,000 to 100,000 9,762 -5.1 -7.1 -6.3 -8.0 -0.6 -1.4100,000 to 200,000 19,418 -4.8 -2.7 -2.4 -5.0 -0.1 -0.5200,000 and over 78,662 -4.6 0.0 0.0 -1.3 0.0 -0.1
All Incomes 5,787 -5.1 -5.2 -5.0 -5.1 -4.9 -4.9
Source: TRIM microsimulation model using data from the March 1999 Current Population Survey. UrbanInstitute, 2001.

40
Table 13Percentage Change in Average Income after Tax
by Income and Family Type, 1998
Percentage Change in Average After-Tax Income
Income
BaselineAverageIncome
after Tax(Dollars)
5 PercentCut in Tax
Rates
$1,300Child Tax
Credit
$1,200RefundableChild Tax
Credit
IncreaseStandard
Deductionand 15Percent
TaxBracket
IncreaseEarnedIncome
Tax Credit
$500Refundable
PayrollTax Credit
All Families and Individuals0 to 10,0000 5,115 0.0 0.0 0.0 0.1 1.2 2.110,000 to 20,000 14,008 0.1 0.0 0.0 0.3 1.9 2.120,000 to 30,000 21,769 0.3 0.3 0.5 0.4 2.8 1.930,000 to 40,000 28,907 0.4 1.0 1.2 0.6 2.5 1.640,000 to 50,000 36,495 0.5 1.3 1.3 0.7 1.1 1.350,000 to 75,000 48,476 0.6 1.3 1.1 0.6 0.3 0.675,000 to 100,000 66,280 0.8 1.0 0.9 1.2 0.1 0.2100,000 to 200,000 98,570 0.9 0.5 0.5 1.0 0.0 0.1200,000 and over 232,609 1.6 0.0 0.0 0.4 0.0 0.0
All Incomes 40,186 0.7 0.8 0.7 0.7 0.7 0.7
Source: TRIM microsimulation model using data from the March 1999 Current Population Survey. UrbanInstitute, 2001.
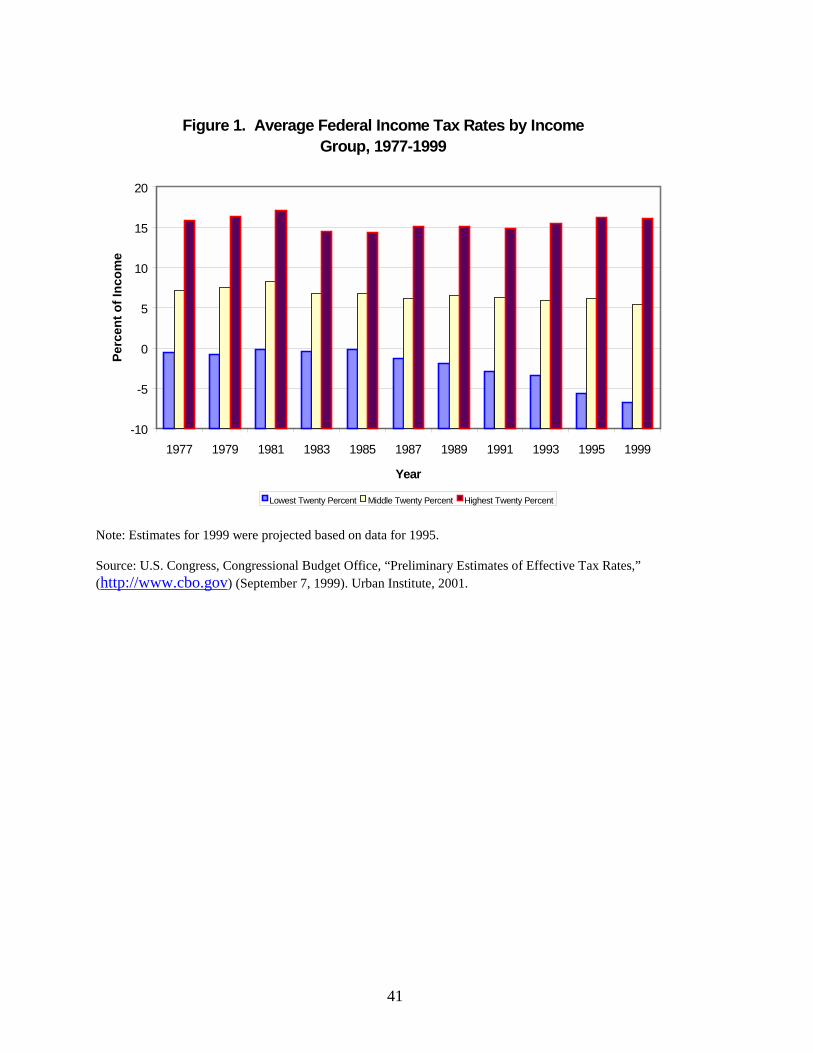
41
Note: Estimates for 1999 were projected based on data for 1995.
Source: U.S. Congress, Congressional Budget Office, “Preliminary Estimates of Effective Tax Rates,”(http://www.cbo.gov) (September 7, 1999). Urban Institute, 2001.
Figure 1. Average Federal Income Tax Rates by Income Group, 1977-1999
-10
-5
0
5
10
15
20
1977 1979 1981 1983 1985 1987 1989 1991 1993 1995 1999
Year
Perc
ent o
f Inc
ome
Lowest Twenty Percent Middle Twenty Percent Highest Twenty Percent