Investment banking project on Bank of America -Merrill Lynch

Bank of America Merrill Lynch
Banking & Financial Services Conference
November 12, 2013
Citi | Investor Relations
Manuel Medina-Mora
Co-President, Citigroup
CEO, Global Consumer Banking
Highlights
Our Consumer Strategy
– Customer-centric franchise
– Focused on top cities and target clients
– Well-positioned for organic growth
– Leveraging our globality
Our Key Execution Priorities
– Deepening client relationships
– Improving operating efficiency
– Focusing on risk management
Our Financial Results
– Increasing contribution to Citicorp
– Maintained efficiency in challenging environment
– Favorable credit trends
– Attractive returns
2
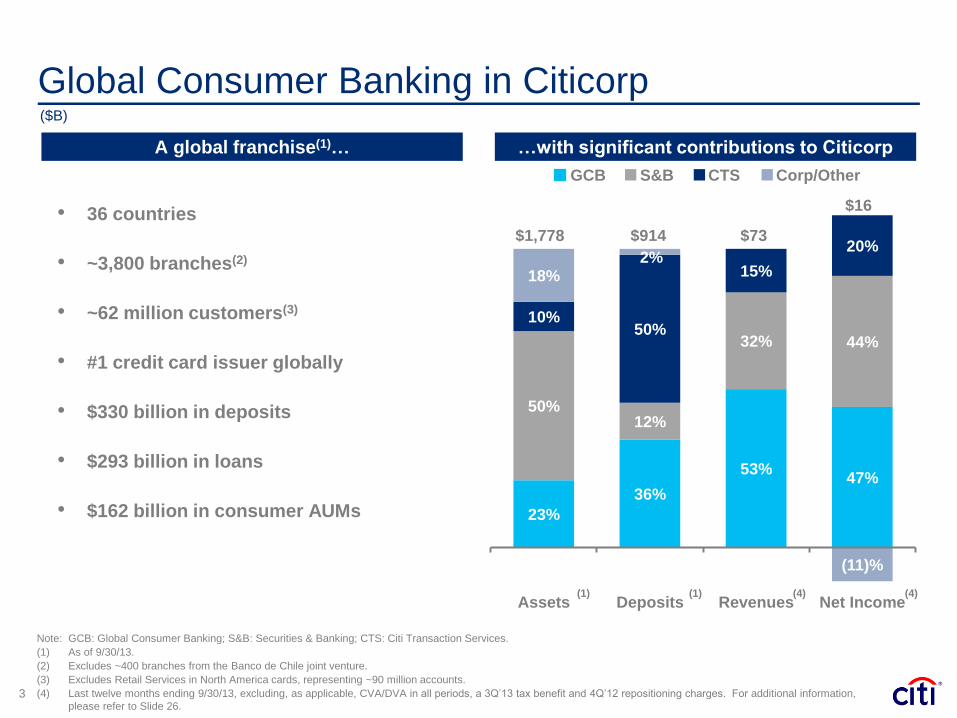
Global Consumer Banking in Citicorp
23%
36%
53% 47%
50% 12%
32% 44%
10% 50%
15%
20%
18% 2%
(11)%
Assets Deposits Revenues Net Income(4) (4)
$1,778 $73
$16
$914
• 36 countries
• ~3,800 branches(2)
• ~62 million customers(3)
• #1 credit card issuer globally
• $330 billion in deposits
• $293 billion in loans
• $162 billion in consumer AUMs
…with significant contributions to Citicorp A global franchise(1)…
($B)
GCB S&B CTS
Note: GCB: Global Consumer Banking; S&B: Securities & Banking; CTS: Citi Transaction Services.
(1) As of 9/30/13.
(2) Excludes ~400 branches from the Banco de Chile joint venture.
(3) Excludes Retail Services in North America cards, representing ~90 million accounts.
(4) Last twelve months ending 9/30/13, excluding, as applicable, CVA/DVA in all periods, a 3Q’13 tax benefit and 4Q’12 repositioning charges. For additional information,
please refer to Slide 26. 3
Corp/Other
(1) (1)
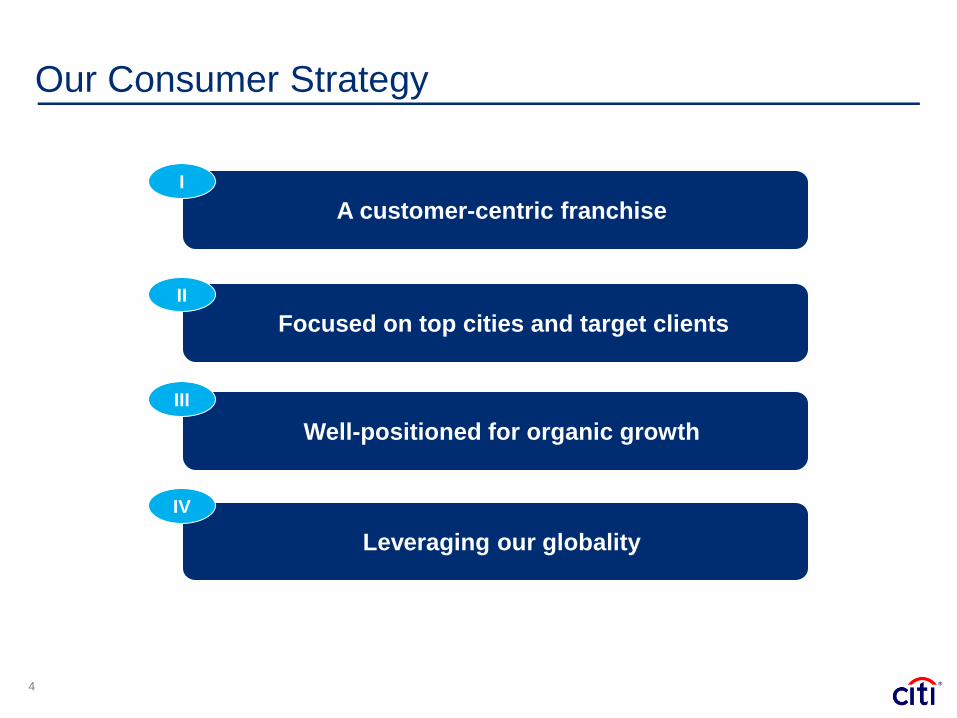
Our Consumer Strategy
A customer-centric franchise
I
Focused on top cities and target clients
II
Well-positioned for organic growth
III
Leveraging our globality
IV
4
Focused on high credit quality consumer segments with similar financial needs across markets
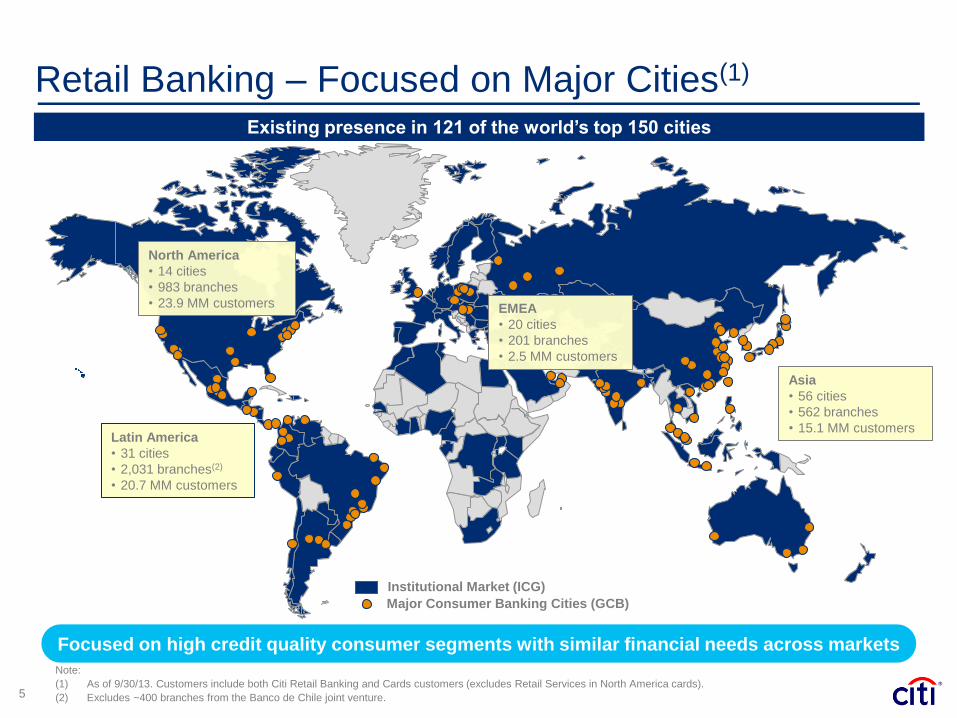
Retail Banking – Focused on Major Cities(1)
Institutional Market (ICG)
Major Consumer Banking Cities (GCB)
5
Existing presence in 121 of the world’s top 150 cities
North America
• 14 cities
• 983 branches
• 23.9 MM customers
Latin America
• 31 cities
• 2,031 branches(2)
• 20.7 MM customers
Asia
• 56 cities
• 562 branches
• 15.1 MM customers
EMEA
• 20 cities
• 201 branches
• 2.5 MM customers
Note:
(1) As of 9/30/13. Customers include both Citi Retail Banking and Cards customers (excludes Retail Services in North America cards).
(2) Excludes ~400 branches from the Banco de Chile joint venture.
Share of Purchase Sales by Country(2)
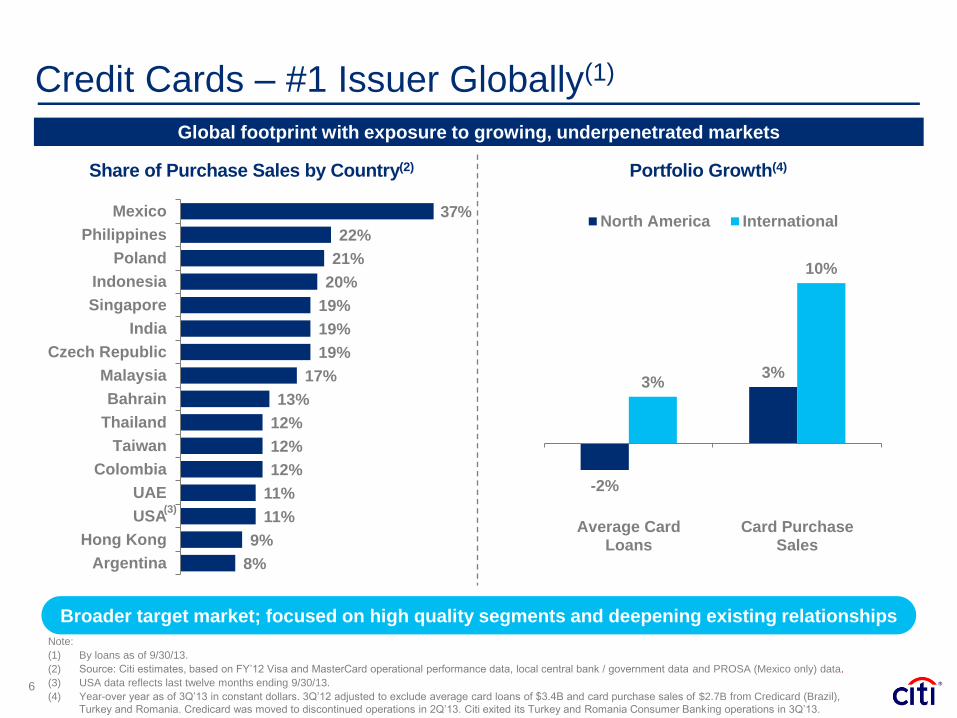
Credit Cards – #1 Issuer Globally(1)
Broader target market; focused on high quality segments and deepening existing relationships
Global footprint with exposure to growing, underpenetrated markets
Portfolio Growth(4)
-2%
3% 3%
10%
Average CardLoans
Card PurchaseSales
North America International
6
8%
9%
11%
11%
12%
12%
12%
13%
17%
19%
19%
19%
20%
21%
22%
37%
Argentina
Hong Kong
USA
UAE
Colombia
Taiwan
Thailand
Bahrain
Malaysia
Czech Republic
India
Singapore
Indonesia
Poland
Philippines
Mexico
(3)
Note:
(1) By loans as of 9/30/13.
(2) Source: Citi estimates, based on FY’12 Visa and MasterCard operational performance data, local central bank / government data and PROSA (Mexico only) data.
(3) USA data reflects last twelve months ending 9/30/13.
(4) Year-over year as of 3Q’13 in constant dollars. 3Q’12 adjusted to exclude average card loans of $3.4B and card purchase sales of $2.7B from Credicard (Brazil),
Turkey and Romania. Credicard was moved to discontinued operations in 2Q’13. Citi exited its Turkey and Romania Consumer Banking operations in 3Q’13.

Focused on Target Clients in Top Cities
High penetration in more resilient, growing consumer segments
Focused on high credit quality segments where we have a competitive advantage
Presence in Emerging Affluent and Affluent(1) Presence with Global Clients(2)
7
50%
47%
36%
32%
30%
30%
28%
25%
25%
21%
19%
18%
18%
14%
13%
11%
Mexico
Singapore
India
Colombia
USA
Taiwan
China
UAE
Korea
Poland
Argentina
Russia
Indonesia
Brazil
Hong Kong
Australia
50%
44%
39%
37%
36%
32%
32%
26%
25%
25%
24%
23%
19%
16%
16%
Singapore
India
USA
China
Korea
Colombia
Taiwan
UAE
Russia
Japan
Poland
Brazil
Indonesia
Australia
Hong Kong
Note:
(1) Customers who hold at least one Citi product. Source: Citi primary research, 2013 and PRM for Mexican data. Emerging affluent defined as urban-based customers with
investable assets of $25-100K/annual income of $75-125K; affluent segment defined as urban-based customers with investable assets of $100K+/annual income of
$125K+ (local definitions may vary).
(2) Customers who hold at least one Citi product. Source: Citi primary research, 2013. Global client defined as an urban-based client exhibiting any one of five “international”
behaviors: 1) personal bank account outside country of residence; 2) own home outside primary country of residence; 3) child living/studying abroad; 4) travel
internationally 6+ times/2 years; or 5) expatriate.
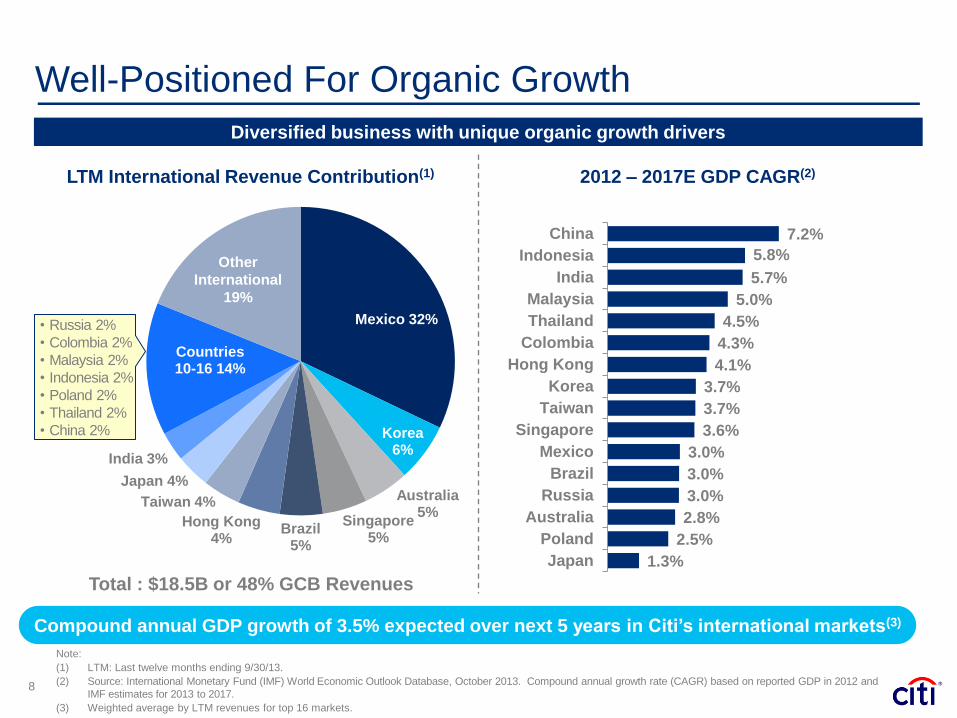
Well-Positioned For Organic Growth
Compound annual GDP growth of 3.5% expected over next 5 years in Citi’s international markets(3)
Diversified business with unique organic growth drivers
LTM International Revenue Contribution(1) 2012 – 2017E GDP CAGR(2)
7.2%
5.8%
5.7%
5.0%
4.5%
4.3%
4.1%
3.7%
3.7%
3.6%
3.0%
3.0%
3.0%
2.8%
2.5%
1.3%
China
Indonesia
India
Malaysia
Thailand
Colombia
Hong Kong
Korea
Taiwan
Singapore
Mexico
Brazil
Russia
Australia
Poland
Japan
8
Note:
(1) LTM: Last twelve months ending 9/30/13.
(2) Source: International Monetary Fund (IMF) World Economic Outlook Database, October 2013. Compound annual growth rate (CAGR) based on reported GDP in 2012 and
IMF estimates for 2013 to 2017.
(3) Weighted average by LTM revenues for top 16 markets.
Total : $18.5B or 48% GCB Revenues
Other
International
19%
Mexico 32%
Korea 6%
Australia 5%
Singapore 5%
Brazil 5%
Hong Kong 4%
Taiwan 4%
Japan 4%
India 3%
Countries 10-16 14%
• Russia 2%
• Colombia 2%
• Malaysia 2%
• Indonesia 2%
• Poland 2%
• Thailand 2%
• China 2%
Other
International
19%

Leveraging Our Globality
9
2009 2013
Regional
Consumer
Businesses
Global
Consumer
Council
Global
Consumer
Bank
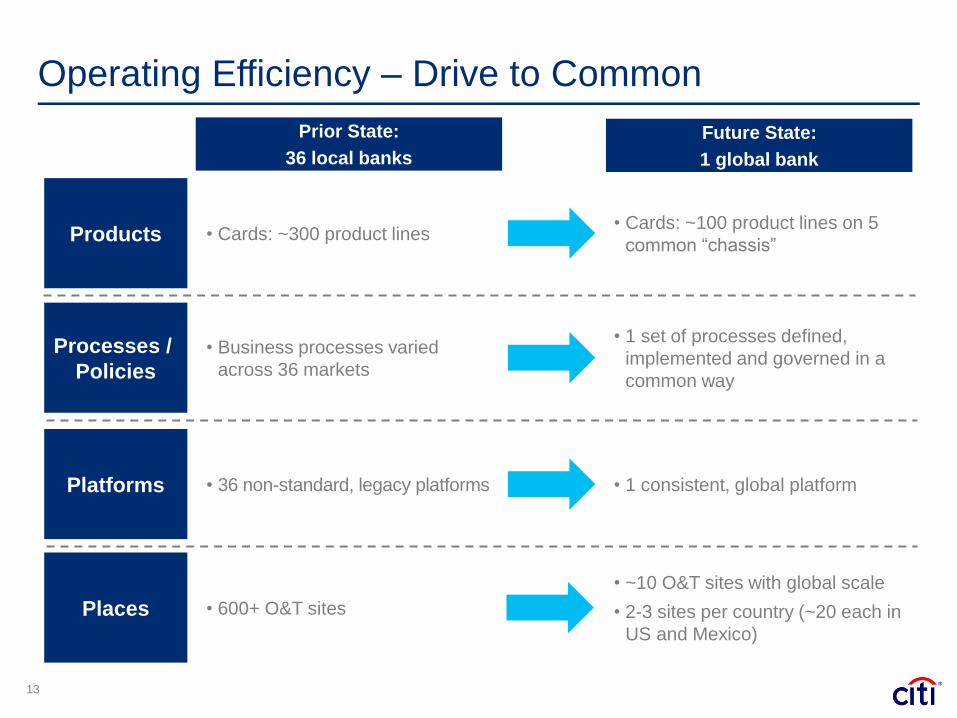
Achieving scale across markets by standardizing products, processes and systems
Strategy Business Model Evolution
• Serving consumers with similar financial
needs across markets
• Leveraging our significant global scale in
cards
• Implementing best practices across
markets
• Streamlining and centralizing operations for
scale
• Diversification of earnings and risk
• Source of significant local deposit funding

• Focus on priority markets
• Drive to common
– Products
– Processes
– Platforms
– Places
• Network optimization
• Drive to digital
Deepening Client
Relationships
Improving
Operating Efficiency
Focusing on
Risk Management
• Client selection & retention
• Multi-product relationships
• Global value propositions
• Sales productivity
• Strong risk management
• Risk appetite framework
• Embedded controls &
processes
• Effective governance
1 3 2
Execution Priorities
Building a culture of execution and accountability
10

Deepening Client Relationships
…while improving productivity Deepening client relationships…
Growing both our client base and the depth of our existing relationships
2%
8%
Total Customers MultiproductCustomers
YoY Growth(1) North America Consumer Example (Marginal Contribution per Customer)
Bank only Bank +Mortgage
Bank +Cards
Bank +Mortgage +
Cards
2.0x 2.5x
4.0x
1.0x
11 Note:
(1) Based on number of customers as of 9/30/13, excluding Retail Services in North America cards.

Operating Efficiency – Focus on Priority Markets
12
59% 57%
55%
YTD'11 YTD'12 YTD'13
47% 46% 48%
YTD'11 YTD'12 YTD'13
73%
81% 78%
YTD'11 YTD'12 YTD'13
Re-allocating resources to core priority markets
GCB Efficiency Ratios
Core International
37% of YTD Revenues(1)
North America
53% of YTD Revenues(1)
Optimize / Restructure + Exit
10% of YTD Revenues(1)
Total GCB
YTD’13: 54%
Note: Efficiency ratio defined as operating expenses divided by revenues. Each period reflects year-to-date results through September. Excludes revenues and expenses not
directly attributable to individual markets.
(1) As of 9/30/13.
13
Products
Processes /
Policies
Platforms
Places
• Cards: ~300 product lines
• Business processes varied
across 36 markets
• 36 non-standard, legacy platforms
• 600+ O&T sites
Prior State:
36 local banks
• Cards: ~100 product lines on 5
common “chassis”
• 1 set of processes defined,
implemented and governed in a
common way
• 1 consistent, global platform
• ~10 O&T sites with global scale
• 2-3 sites per country (~20 each in
US and Mexico)
Future State:
1 global bank
Operating Efficiency – Drive to Common

2010 2013
Operating Efficiency – Network Optimization
Leveraging smart branches, digital banking
and perceptual scale
Smart Banking Ecosystem Retail Network
Fewer branches, more touch points and more bankers
# of Branches # of Citigold Bankers
2010 2013
(10)% 18%
Productivity per square foot has
improved by 20% since 2010
14
~4,200
~3,800
~4,000
~3,400
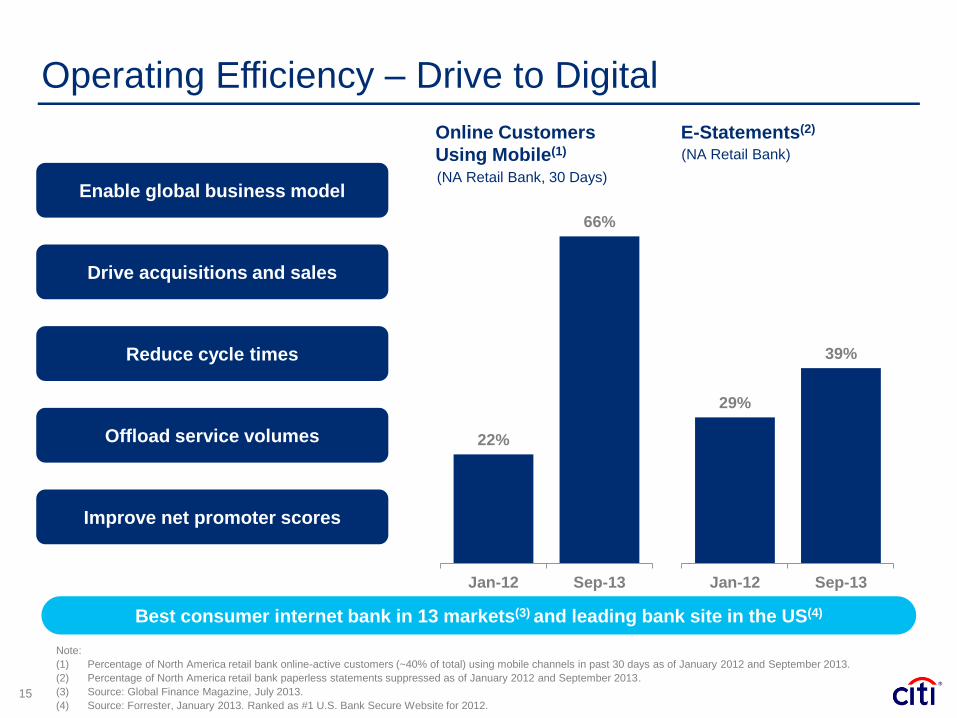
22%
66%
Jan-12 Sep-13
15
Enable global business model
Drive acquisitions and sales
Reduce cycle times
Offload service volumes
Improve net promoter scores
Operating Efficiency – Drive to Digital
29%
39%
Jan-12 Sep-13
Online Customers
Using Mobile(1)
(NA Retail Bank, 30 Days)
E-Statements(2)
(NA Retail Bank)
Note:
(1) Percentage of North America retail bank online-active customers (~40% of total) using mobile channels in past 30 days as of January 2012 and September 2013.
(2) Percentage of North America retail bank paperless statements suppressed as of January 2012 and September 2013.
(3) Source: Global Finance Magazine, July 2013.
(4) Source: Forrester, January 2013. Ranked as #1 U.S. Bank Secure Website for 2012.
Best consumer internet bank in 13 markets(3) and leading bank site in the US(4)
Revenue Growth “Customer Centricity”
Operating Efficiency “Drive to Common”
Risk Management “Path to Strong”
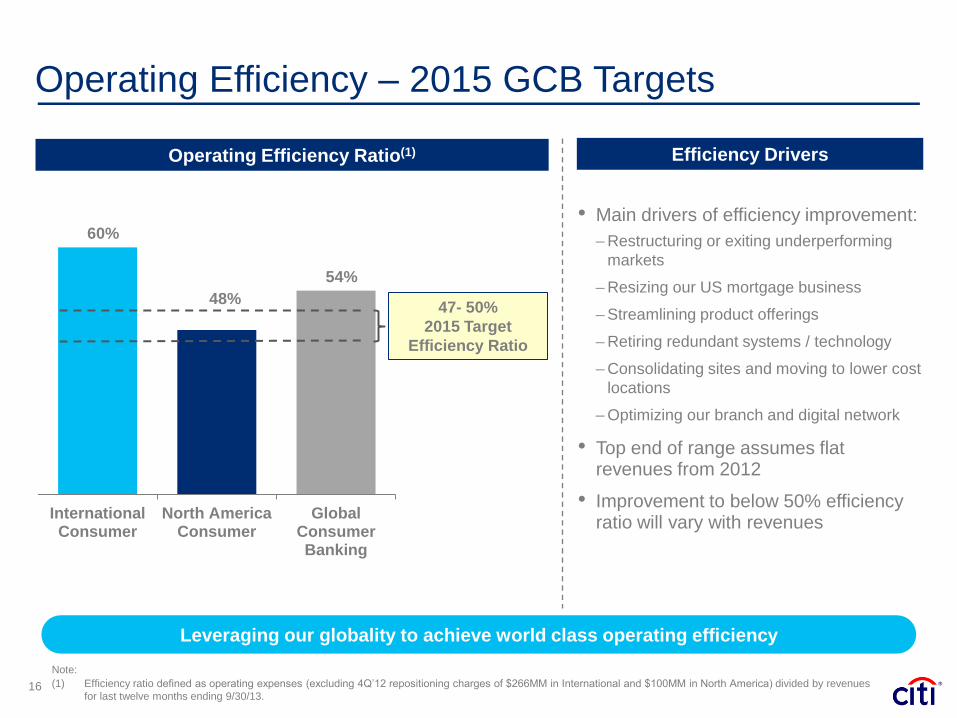
Operating Efficiency – 2015 GCB Targets
Leveraging our globality to achieve world class operating efficiency
47- 50%
2015 Target
Efficiency Ratio
60%
48%
54%
InternationalConsumer
North AmericaConsumer
GlobalConsumerBanking
16
Note:
(1) Efficiency ratio defined as operating expenses (excluding 4Q’12 repositioning charges of $266MM in International and $100MM in North America) divided by revenues
for last twelve months ending 9/30/13.
Operating Efficiency Ratio(1) Efficiency Drivers
• Main drivers of efficiency improvement:
– Restructuring or exiting underperforming
markets
– Resizing our US mortgage business
– Streamlining product offerings
– Retiring redundant systems / technology
– Consolidating sites and moving to lower cost
locations
– Optimizing our branch and digital network
• Top end of range assumes flat revenues from 2012
• Improvement to below 50% efficiency ratio will vary with revenues

Risk appetite model fully integrated into business planning
Risk Management
17
Integrated risk management framework across businesses, products and regions
EMEA
North America
Latin America
Asia
Product
Chief Risk
Officers
Regional
Risk
Officers Accountability
Business Chief Risk Officers
Global Commercial
Global Consumer
Corporate Risk Functions
Unsecured
Operational
Risk
Collections /
Fraud
Secured
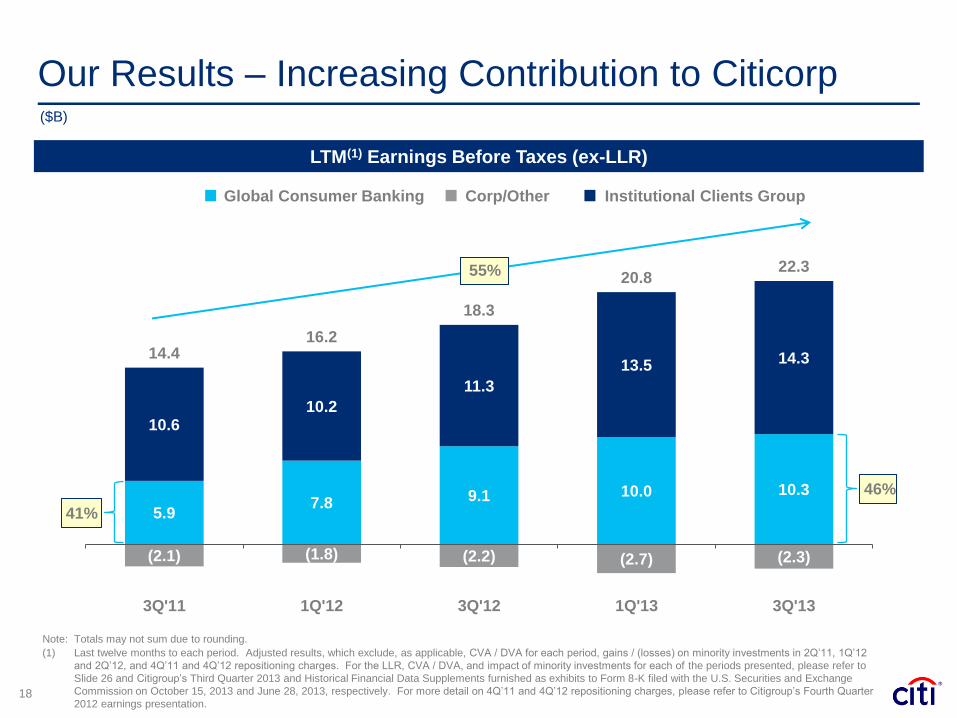
Our Results – Increasing Contribution to Citicorp
18
5.9 7.8 9.1 10.0 10.3
10.6 10.2
11.3
13.5 14.3
(2.1) (1.8) (2.2) (2.7) (2.3)
14.4 16.2
18.3
20.8 22.3
3Q'11 1Q'12 3Q'12 1Q'13 3Q'13
LTM(1) Earnings Before Taxes (ex-LLR)
55%
($B)
46%
41%
Note: Totals may not sum due to rounding.
(1) Last twelve months to each period. Adjusted results, which exclude, as applicable, CVA / DVA for each period, gains / (losses) on minority investments in 2Q’11, 1Q’12
and 2Q’12, and 4Q’11 and 4Q’12 repositioning charges. For the LLR, CVA / DVA, and impact of minority investments for each of the periods presented, please refer to
Slide 26 and Citigroup’s Third Quarter 2013 and Historical Financial Data Supplements furnished as exhibits to Form 8-K filed with the U.S. Securities and Exchange
Commission on October 15, 2013 and June 28, 2013, respectively. For more detail on 4Q’11 and 4Q’12 repositioning charges, please refer to Citigroup’s Fourth Quarter
2012 earnings presentation.
Global Consumer Banking Institutional Clients Group Corp/Other

16.7
18.0 20.0
20.2
3Q'11 4Q'11 1Q'12 2Q'12 3Q'12 4Q'12 1Q'13 2Q'13 3Q'13
International Franchise Driving Revenue Growth
19
Volume growth is driving revenues in a challenging global rate environment
EOP Loan Growth(3) LTM Revenues(1)
North America International
EOP Deposit & AUM Growth(3)
104 100
113
3Q'11 4Q'11 1Q'12 2Q'12 3Q'12 4Q'12 1Q'13 2Q'13 3Q'13
Note:
(1) In constant dollars, based on average exchange rates for 3Q’13. Last twelve months (LTM) to each period. For more information, please refer to Slide 27.
(2) LTM revenue CAGR (3Q’11 to 3Q’13).
(3) In constant dollars, based on end of period exchange rates as of 9/30/13. Index: 3Q’11 = 100%.
(4) Operating balances defined as checking and savings deposits.
North America International
AUM Operating Balances(4) Deposits
120
100
107
127
3Q'11 4Q'11 1Q'12 2Q'12 3Q'12 4Q'12 1Q'13 2Q'13 3Q'13
International
CAGR(2) = 4%
Total GCB
CAGR(2) = 2%

1.9 1.7 1.6 1.5 1.4 1.3 1.3 1.2 1.1
0.5 0.6
0.5 0.5
0.6 0.6 0.6 0.6 0.6
$2.4 $2.3 $2.1
$2.0 $1.9 $1.9 $1.9
$1.8 $1.7
(1.0) (0.8) (0.8) (0.7)
(0.5) (0.2) (0.3) (0.2) (0.1)
3Q'11 4Q'11 1Q'12 2Q'12 3Q'12 4Q'12 1Q'13 2Q'13 3Q'13
Net Credit Losses
3.6%
2.4%
5.0%
2.9%
1.9% 1.9%
3Q'11 4Q'11 1Q'12 2Q'12 3Q'12 4Q'12 1Q'13 2Q'13 3Q'13
Normalizing Credit Trends
20
Net Credit Loss Rates NCL and LLR Releases(1)
Total GCB North America International
($B)
Maintaining credit discipline across regions
(28)%
LLR Releases
Note:
(1) Net credit losses and loan loss reserve builds / (releases) in constant dollars. Loan loss reserve builds / (releases) include provision for unfunded lending commitments.
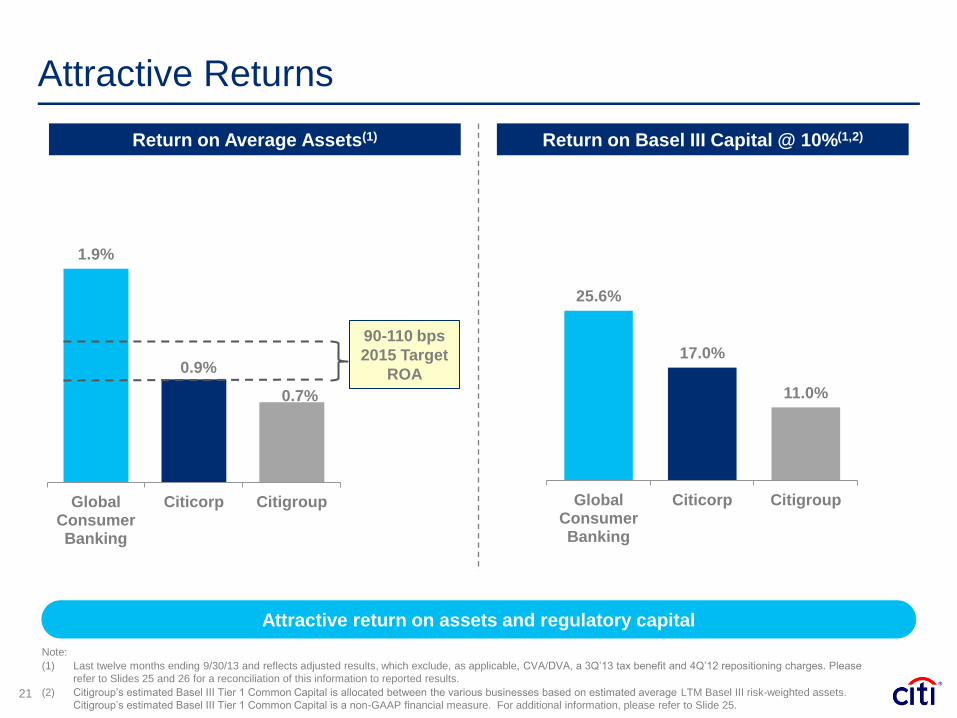
Attractive Returns
Return on Basel III Capital @ 10%(1,2) Return on Average Assets(1)
Attractive return on assets and regulatory capital
25.6%
17.0%
11.0%
GlobalConsumerBanking
Citicorp Citigroup
90-110 bps
2015 Target
ROA
1.9%
0.9%
0.7%
GlobalConsumerBanking
Citicorp Citigroup
21
Note:
(1) Last twelve months ending 9/30/13 and reflects adjusted results, which exclude, as applicable, CVA/DVA, a 3Q’13 tax benefit and 4Q’12 repositioning charges. Please
refer to Slides 25 and 26 for a reconciliation of this information to reported results.
(2) Citigroup’s estimated Basel III Tier 1 Common Capital is allocated between the various businesses based on estimated average LTM Basel III risk-weighted assets.
Citigroup’s estimated Basel III Tier 1 Common Capital is a non-GAAP financial measure. For additional information, please refer to Slide 25.

The Bank We Are Building
World-Class
Efficiency
Improved
Returns
High
Performance
Leveraging our global scale
Strong risk management
Building a culture of execution
Customer-centric franchise Consistent Revenue
Growth
Sustained
Value
Creation
22

Certain statements in this document are “forward-looking statements”
within the meaning of the U.S. Private Securities Litigation Reform Act of
1995. These statements are based on management’s current
expectations and are subject to uncertainty and changes in circumstances.
These statements are not guarantees of future results or occurrences.
Actual results and capital and other financial condition may differ materially
from those included in these statements due to a variety of factors,
including the precautionary statements included in this document and
those contained in Citigroup’s filings with the U.S. Securities and
Exchange Commission, including without limitation the “Risk Factors”
section of Citigroup’s 2012 Form 10-K. Any forward-looking statements
made by or on behalf of Citigroup speak only as to the date they are made,
and Citi does not undertake to update forward-looking statements to reflect
the impact of circumstances or events that arise after the date the forward-
looking statements were made.
23

Non-GAAP Financial Measures – Reconciliations
25
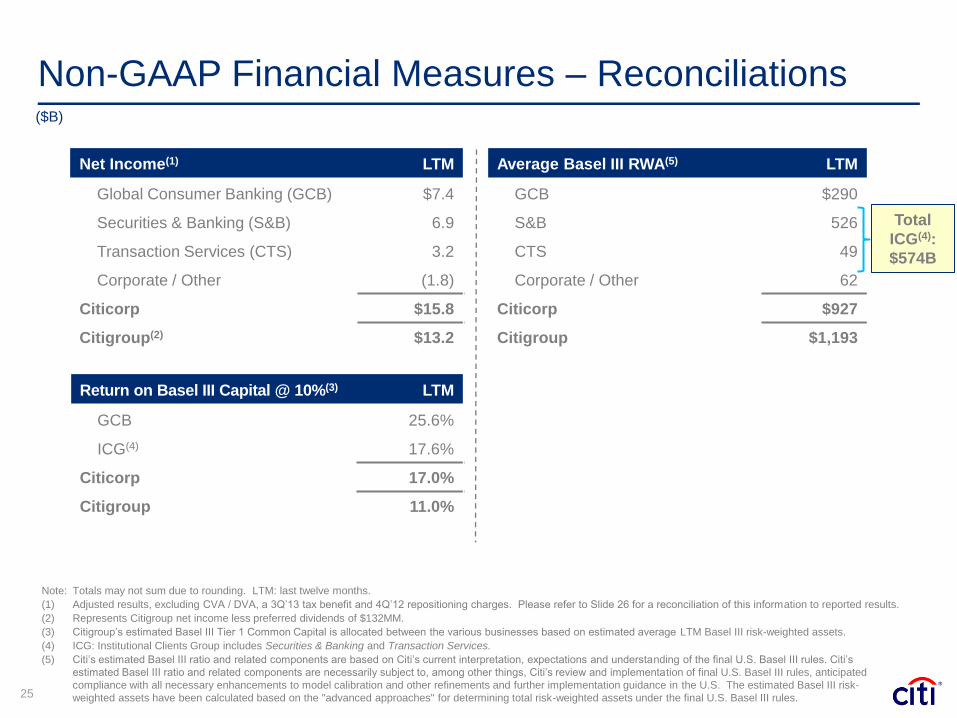
Note: Totals may not sum due to rounding. LTM: last twelve months.
(1) Adjusted results, excluding CVA / DVA, a 3Q’13 tax benefit and 4Q’12 repositioning charges. Please refer to Slide 26 for a reconciliation of this information to reported results.
(2) Represents Citigroup net income less preferred dividends of $132MM.
(3) Citigroup’s estimated Basel III Tier 1 Common Capital is allocated between the various businesses based on estimated average LTM Basel III risk-weighted assets.
(4) ICG: Institutional Clients Group includes Securities & Banking and Transaction Services.
(5) Citi’s estimated Basel III ratio and related components are based on Citi’s current interpretation, expectations and understanding of the final U.S. Basel III rules. Citi’s
estimated Basel III ratio and related components are necessarily subject to, among other things, Citi’s review and implementation of final U.S. Basel III rules, anticipated
compliance with all necessary enhancements to model calibration and other refinements and further implementation guidance in the U.S. The estimated Basel III risk-
weighted assets have been calculated based on the "advanced approaches" for determining total risk-weighted assets under the final U.S. Basel III rules.
Return on Basel III Capital @ 10%(3) LTM
GCB 25.6%
ICG(4) 17.6%
Citicorp 17.0%
Citigroup 11.0%
Average Basel III RWA(5) LTM
GCB $290
S&B 526
CTS 49
Corporate / Other 62
Citicorp $927
Citigroup $1,193
Net Income(1) LTM
Global Consumer Banking (GCB) $7.4
Securities & Banking (S&B) 6.9
Transaction Services (CTS) 3.2
Corporate / Other (1.8)
Citicorp $15.8
Citigroup(2) $13.2
Total
ICG(4):
$574B
($B)
Non-GAAP Financial Measures – Reconciliations ($MM)
26
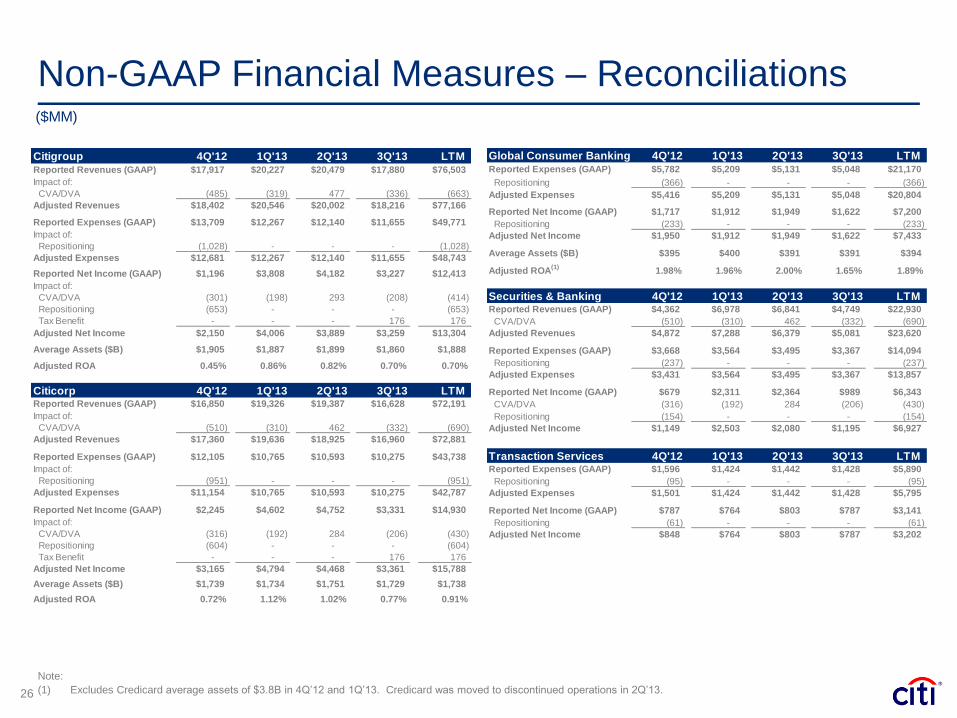
Note:
(1) Excludes Credicard average assets of $3.8B in 4Q’12 and 1Q’13. Credicard was moved to discontinued operations in 2Q’13.
Global Consumer Banking 4Q'12 1Q'13 2Q'13 3Q'13 LTMReported Expenses (GAAP) $5,782 $5,209 $5,131 $5,048 $21,170
Repositioning (366) - - - (366)
Adjusted Expenses $5,416 $5,209 $5,131 $5,048 $20,804
Reported Net Income (GAAP) $1,717 $1,912 $1,949 $1,622 $7,200
Repositioning (233) - - - (233)
Adjusted Net Income $1,950 $1,912 $1,949 $1,622 $7,433
Average Assets ($B) $395 $400 $391 $391 $394$391 $396 $391 $391 $397
Adjusted ROA(1)
1.98% 1.96% 2.00% 1.65% 1.89%
Securities & Banking 4Q'12 1Q'13 2Q'13 3Q'13 LTMReported Revenues (GAAP) $4,362 $6,978 $6,841 $4,749 $22,930
CVA/DVA (510) (310) 462 (332) (690)
Adjusted Revenues $4,872 $7,288 $6,379 $5,081 $23,620
Reported Expenses (GAAP) $3,668 $3,564 $3,495 $3,367 $14,094
Repositioning (237) - - - (237)
Adjusted Expenses $3,431 $3,564 $3,495 $3,367 $13,857
Reported Net Income (GAAP) $679 $2,311 $2,364 $989 $6,343
CVA/DVA (316) (192) 284 (206) (430)
Repositioning (154) - - - (154)
Adjusted Net Income $1,149 $2,503 $2,080 $1,195 $6,927
Transaction Services 4Q'12 1Q'13 2Q'13 3Q'13 LTMReported Expenses (GAAP) $1,596 $1,424 $1,442 $1,428 $5,890
Repositioning (95) - - - (95)
Adjusted Expenses $1,501 $1,424 $1,442 $1,428 $5,795
Reported Net Income (GAAP) $787 $764 $803 $787 $3,141
Repositioning (61) - - - (61)
Adjusted Net Income $848 $764 $803 $787 $3,202
Citigroup 4Q'12 1Q'13 2Q'13 3Q'13 LTMReported Revenues (GAAP) $17,917 $20,227 $20,479 $17,880 $76,503
Impact of:
CVA/DVA (485) (319) 477 (336) (663)
Adjusted Revenues $18,402 $20,546 $20,002 $18,216 $77,166
Reported Expenses (GAAP) $13,709 $12,267 $12,140 $11,655 $49,771
Impact of:
Repositioning (1,028) - - - (1,028)
Adjusted Expenses $12,681 $12,267 $12,140 $11,655 $48,743
Reported Net Income (GAAP) $1,196 $3,808 $4,182 $3,227 $12,413
Impact of:
CVA/DVA (301) (198) 293 (208) (414)
Repositioning (653) - - - (653)
Tax Benefit - - - 176 176
Adjusted Net Income $2,150 $4,006 $3,889 $3,259 $13,304
Average Assets ($B) $1,905 $1,887 $1,899 $1,860 $1,888
Adjusted ROA 0.45% 0.86% 0.82% 0.70% 0.70%
Citicorp 4Q'12 1Q'13 2Q'13 3Q'13 LTMReported Revenues (GAAP) $16,850 $19,326 $19,387 $16,628 $72,191
Impact of:
CVA/DVA (510) (310) 462 (332) (690)
Adjusted Revenues $17,360 $19,636 $18,925 $16,960 $72,881
Reported Expenses (GAAP) $12,105 $10,765 $10,593 $10,275 $43,738
Impact of:
Repositioning (951) - - - (951)
Adjusted Expenses $11,154 $10,765 $10,593 $10,275 $42,787
Reported Net Income (GAAP) $2,245 $4,602 $4,752 $3,331 $14,930
Impact of:
CVA/DVA (316) (192) 284 (206) (430)
Repositioning (604) - - - (604)
Tax Benefit - - - 176 176
Adjusted Net Income $3,165 $4,794 $4,468 $3,361 $15,788
Average Assets ($B) $1,739 $1,734 $1,751 $1,729 $1,738
Adjusted ROA 0.72% 1.12% 1.02% 0.77% 0.91%

Non-GAAP Financial Measures – Reconciliations ($MM)
27
International Consumer Banking 4Q'10 1Q'11 2Q'11 3Q'11 4Q'11 1Q'12 2Q'12 3Q'12 4Q'12 1Q'13 2Q'13 3Q'13
Reported Revenues $4,388 $4,397 $4,616 $4,603 $4,483 $4,555 $4,405 $4,547 $4,664 $4,639 $4,659 $4,497
Impact of FX Translation (246) (317) (434) (296) (113) (221) (75) (130) (170) (195) (121) -
Revenues in Constant Dollars $4,142 $4,080 $4,182 $4,307 $4,370 $4,334 $4,330 $4,417 $4,494 $4,444 $4,538 $4,497
EMEA Consumer Banking 4Q'10 1Q'11 2Q'11 3Q'11 4Q'11 1Q'12 2Q'12 3Q'12 4Q'12 1Q'13 2Q'13 3Q'13
Reported Revenues $389 $414 $403 $371 $341 $369 $358 $374 $384 $368 $364 $359
Impact of FX Translation (21) (30) (43) (24) (5) (14) (1) (2) (10) (8) (1) -
Revenues in Constant Dollars $368 $384 $360 $347 $336 $355 $357 $372 $374 $360 $363 $359
Latin America Consumer Banking 4Q'10 1Q'11 2Q'11 3Q'11 4Q'11 1Q'12 2Q'12 3Q'12 4Q'12 1Q'13 2Q'13 3Q'13
Reported Revenues $2,070 $2,083 $2,183 $2,162 $2,119 $2,188 $2,095 $2,190 $2,285 $2,311 $2,327 $2,276
Impact of FX Translation (147) (182) (250) (145) (26) (103) (5) (41) (56) (106) (79) -
Revenues in Constant Dollars $1,923 $1,901 $1,933 $2,017 $2,093 $2,085 $2,090 $2,149 $2,229 $2,205 $2,248 $2,276
Asia Consumer Banking 4Q'10 1Q'11 2Q'11 3Q'11 4Q'11 1Q'12 2Q'12 3Q'12 4Q'12 1Q'13 2Q'13 3Q'13
Reported Revenues $1,929 $1,900 $2,030 $2,070 $2,023 $1,998 $1,952 $1,983 $1,995 $1,960 $1,968 $1,862
Impact of FX Translation (77) (105) (141) (127) (83) (105) (69) (87) (104) (81) (41) -
Revenues in Constant Dollars $1,852 $1,795 $1,889 $1,943 $1,940 $1,893 $1,883 $1,896 $1,891 $1,879 $1,927 $1,862