B2. Campus Retention and Success Initiatives for Men … filepersistence and involvement theories...
36
#NACAC17 B2. Campus Retention and Success Initiatives for Men of Color William Johnson, Fairfield University, CT Marvin Loiseau, Benjamin Franklin Institute of Technology, MA Leykia Nulan, UMass Amherst, MA Ralph Tavares, Providence College, RI
Transcript of B2. Campus Retention and Success Initiatives for Men … filepersistence and involvement theories...
#NACAC17
B2. Campus Retention and Success Initiatives for Men of ColorWilliam Johnson, Fairfield University, CT
Marvin Loiseau, Benjamin Franklin Institute of Technology, MA
Leykia Nulan, UMass Amherst, MA
Ralph Tavares, Providence College, RI

#NACAC17
Overview
• Data
– Scholarly literature
– Using data
– National data
• Institutional data and programs
• Institutional support
• Creating change
• Q & A

#NACAC17
Scholarly literature
• Hausmanm, et al (2007) sense of belonging is a predictor of intentions to persist for black and white first-year students
• Strayhorn (2012) conceptualized a sense of belonging framework based in student persistence and involvement theories along with Maslow’s (1943) hierarchy of needs framework
• Griffin (2006) stated that many black students have to contend with family and friends along with balancing academic demands
• A study outlined in Broom (2017) found that Black males at predominately white institutions faced challenges that made them feel like outsiders on their own campuses which created burdens for their college experience (e.g., peer relationships, faculty interactions, institutional culture)
#NACAC17
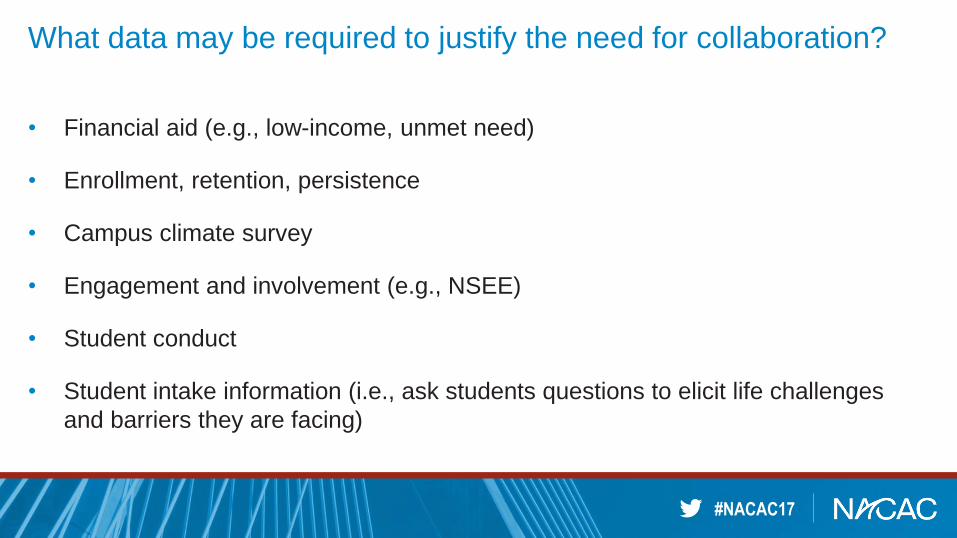
What data may be required to justify the need for collaboration?
• Financial aid (e.g., low-income, unmet need)
• Enrollment, retention, persistence
• Campus climate survey
• Engagement and involvement (e.g., NSEE)
• Student conduct
• Student intake information (i.e., ask students questions to elicit life challenges
and barriers they are facing)

#NACAC17
National data
Six-year graduation rate, all four-year institutions, male and female, by race/ethnicity
Cohort entry year Total White Black Hispanic
Asian/Pacific Islander
American
Indian/
Alaska
Native
Two or
more
racesTotal Asian
Pacific
Islander
2005 58.6 62.0 39.5 51.0 69.2 69.6 48.3 39.3 64.2
2006 59.2 62.5 40.2 51.9 70.1 70.6 48.5 40.2 66.6
2007 59.4 62.9 40.7 52.5 70.0 70.5 49.5 40.6 67.8
2008 59.6 63.2 40.9 53.5 70.6 71.2 50.0 41.0 65.2
2009 59.4 63.3 39.5 53.6 72.3 73.0 48.5 41.2 59.2

#NACAC17
National data
Six-year graduation rate, all four-year institutions, male, by race/ethnicity
Cohort entry year Total White Black Hispanic
Asian/Pacific Islander
American
Indian/
Alaska
Native
Two or
more
racesTotal Asian
Pacific
Islander
2005 56.0 59.4 34.2 47.2 66.3 66.6 48.6 37.9 61.3
2006 56.5 59.8 35.2 47.8 67.4 67.8 46.4 37.2 64.5
2007 56.5 60.0 35.3 48.6 66.7 67.1 50.0 37.3 64.9
2008 56.5 60.1 35.3 48.9 67.6 68.0 49.9 38.6 61.7
2009 56.2 60.0 34.3 49.1 69.2 69.8 48.8 38.1 55.9

#NACAC17
National data
Six-year graduation rate, all four-year institutions, white students vs students of color
comparison, by cohort entry year
Males Females
White Black Hispanic Asian/
Pacific
Islander
American
Indian/
Alaska
Native
64.2 43.0 53.8 71.8 40.3
64.9 43.6 54.9 72.6 42.5
65.4 44.5 55.5 73.0 43.1
65.9 44.8 57.0 73.4 42.8
66.1 43.2 57.0 75.1 43.6
Year White Black Hispanic Asian/
Pacific
Islander
American
Indian/
Alaska
Native
2005 59.4 34.2 47.2 66.3 37.9
2006 59.8 35.2 47.8 67.4 37.2
2007 60.0 35.3 48.6 66.7 37.3
2008 60.1 35.3 48.9 67.6 38.6
2009 60.0 34.3 49.1 69.2 38.1
#NACAC17
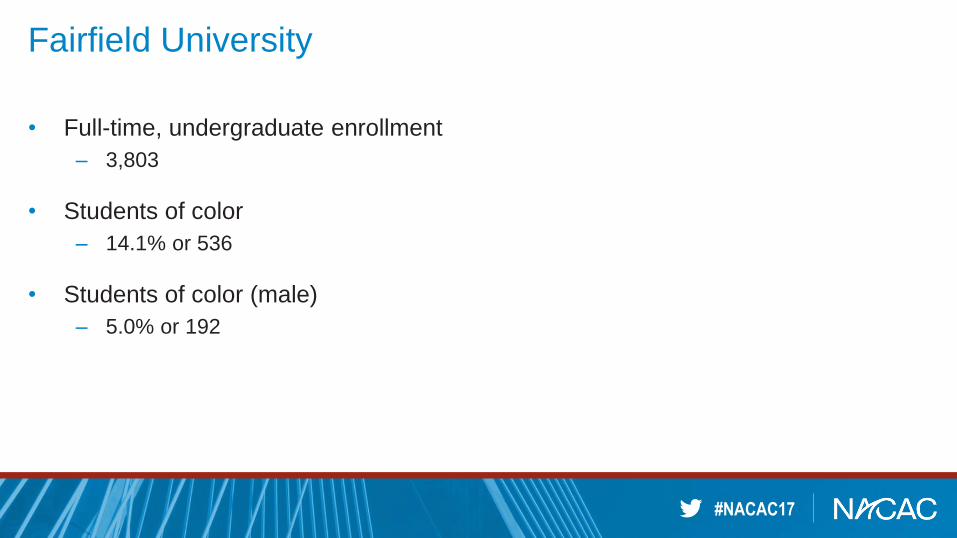
Fairfield University
• Full-time, undergraduate enrollment
– 3,803
• Students of color
– 14.1% or 536
• Students of color (male)
– 5.0% or 192

#NACAC17
Male Retention – Fairfield University
First-year to sophomore retention (all)
First-year to sophomore retention (students of color)
Class
of….
Initial
Census
# of
students
%
2020 60 54 90.0%
2019 60 52 86.7%
2018 52 45 86.5%
2017 48 41 85.4%
Class
of….
Initial
Census
# of
students
%
2020 408 375 91.9%
2019 390 337 88.7%
2018 396 365 92.2%
2017 374 332 88.2%

#NACAC17
Fairfield University
• Black Men’s Discussion Group
– Purpose
Our purpose is to foster a challenging, motivating, and safe environment for men of color to grow
and bond during their college tenure and ignite a fire within each individual to reach his full
academic, civic, and spiritual potential. We will achieve our goal through community building
programs, guest speakers, information sessions and volunteer opportunities. We strive to lead
with the example of boldness, innovation, and professionalism that reflects the image and sense
of identity that we will see amongst men of color enrolled at Fairfield University and abroad.

#NACAC17
Fairfield University
• Black Men’s Discussion Group
– Facilitators
• Student affairs, academic affairs, athletics, TRIO
– Participation
• 12-15 students
– Meeting Frequency
• Monthly

#NACAC17
Fairfield University
• Black Men’s Discussion Group
– Discussion topics covered this year
• Identity
• StrengthsFinder
• Academics
• Choice management
• Career Development
• Networking
• Current events
• Campus climate

#NACAC17
Male Graduation – Fairfield University
Six-year graduation (all)
Class
of….
Initial
Census
# of
students
%
2015 377 304 80.6%
2014 345 271 78.6%
2013 369 291 78.9%
2012 362 276 76.5%
Six-year graduation (students of color)
Class
of….
Initial
Census
# of
students
%
2015 48 32 66.7%
2014 61 45 73.8%
2013 56 43 76.8%
2012 66 47 72.3%

#NACAC17
Providence College
• Full-time, undergraduate enrollment
– 4,345
• Students of color
– 17.1% or 743
• Students of color (male)
– 6.7% or 294
#NACAC17
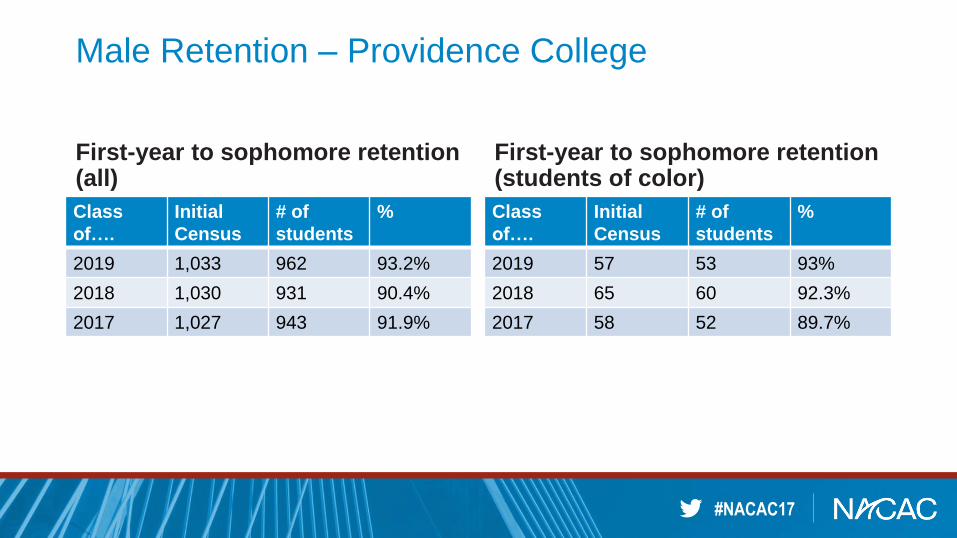
Male Retention – Providence College
First-year to sophomore retention (all)
First-year to sophomore retention (students of color)
Class
of….
Initial
Census
# of
students
%
2019 57 53 93%
2018 65 60 92.3%
2017 58 52 89.7%
Class
of….
Initial
Census
# of
students
%
2019 1,033 962 93.2%
2018 1,030 931 90.4%
2017 1,027 943 91.9%
#NACAC17
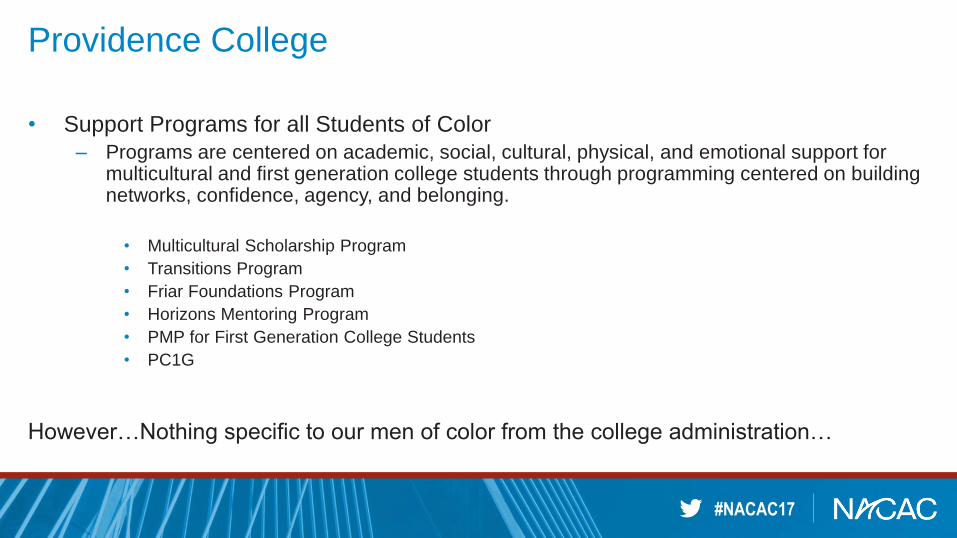
Providence College
• Support Programs for all Students of Color
– Programs are centered on academic, social, cultural, physical, and emotional support for multicultural and first generation college students through programming centered on building networks, confidence, agency, and belonging.
• Multicultural Scholarship Program
• Transitions Program
• Friar Foundations Program
• Horizons Mentoring Program
• PMP for First Generation College Students
• PC1G
However…Nothing specific to our men of color from the college administration…

#NACAC17
Providence College
Men of Color
Achieving
Leadership &
Excellence
Support & Service
Student-led initiative
Mission Statement

#NACAC17
Providence College
• The Brotherhood
– Brotherhood serves as a support group at Providence College offering professional development, academic mentoring and community service in order to fortify the retention rates and increase overall college success of men of color.
– Head Chairman (President), Lieutenant/Chairman of Academic Mentoring, Lieutenant/Chairman of Community Service, Lieutenant/Chairman of Career Development, Chief Financial Officer (Treasurer)
– Meetings are every Thursday from 7:00pm-8:30pm
– Additional Student Led Events/Programming

#NACAC17
Providence College
• Brotherhood Headshots
– Special event for the membership in collaboration with the Center for Career Education and Professional Development
– Gentlemen attend the meeting in business attire and have professional headshots taken for LinkedIn
– Discussion topics include: professionalism, personal branding, resume building, interview skills
• Brotherhood and Women Empowered Joint Retreat
– Special retreat with women of color group on campus to have open discussion and dialogue about issues related to the opposite sex and support for each other.
– Discussion topics: treatment of black and brown women on campus, treatment of black and brown men on campus, relationships and rape culture on college campuses, family

#NACAC17
Providence College
• Brotherhood and Office of Safety and Security BBQ
– Joint welcome luncheon with men of color (students, staff, faculty, and admin) and members of campus security geared towards improving relationships with men of color and law enforcement.
• Brotherhood Membership Meetings
– Discussion topics covered this year
• What it Means to be a Man
• How to be a Gentleman
• Transitions in Life: The Path of a Hero
• Mothers and Their Impressions on Men Like Us
• What Prison Does to a Young Man’s Mind (The New Jim Crow)
• The Movement

#NACAC17
Men of Color Specific Programs
• Has retention at Providence College improved? Yes...
• …but 6-year graduation rate has dropped.
• Administrative Approach? Or Student Led Initiatives?
#NACAC17
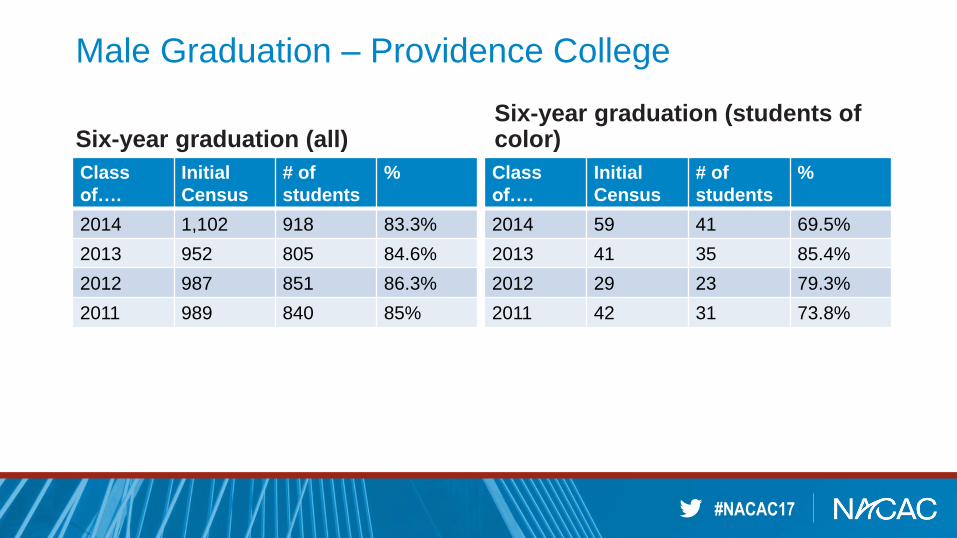
Male Graduation – Providence College
Six-year graduation (all)
Class
of….
Initial
Census
# of
students
%
2014 1,102 918 83.3%
2013 952 805 84.6%
2012 987 851 86.3%
2011 989 840 85%
Six-year graduation (students of color)
Class
of….
Initial
Census
# of
students
%
2014 59 41 69.5%
2013 41 35 85.4%
2012 29 23 79.3%
2011 42 31 73.8%

#NACAC17
University of Massachusetts Amherst
• Full-time, undergraduate enrollment
– 21,640
• Students of color
– 21% or 4,587
• Students of color (male)
– 11% or 2,446

#NACAC17
Male Retention – University of Massachusetts Amherst
First-year to sophomore retention (all)
First-year to sophomore retention (students of color)
Class
of….
Initial
Census
# of
students
%
2019 439 379 86.3%
2018 492 431 87.6%
2017 516 451 87.4%
Class
of….
Initial
Census
# of
students
%
2019 4,641 4,236 91.3%
2018 4,628 4,217 91.1%
2017 4,610 4,144 89.9%

#NACAC17
UMass Amherst Men and Masculinities Center
Programs
• Men Talking
• Men of Color United
• Educational Sanctions
• Fallacies
Task Force
Consists of staff from across various
areas of campus including Student
Affairs Advocacy and Inclusion
Cluster, Center for Counseling and
Psychological Health, Enrollment
Management, UMass Amherst
Police Department, and Dean of
Students/Athletics.

#NACAC17
Male Graduation – University of Massachusetts Amherst
Six-year graduation (all)
Class
of….
Initial
Census
# of
students
%
2014 4,456 3,409 76.5%
2013 4,112 3,215 78.2%
2012 4,131 3,131 75.8%
2011 4,265 3,007 70.5%
Six-year graduation (students of color)
Class
of….
Initial
Census
# of
students
%
2014 353 234 66.3%
2013 317 232 73.2%
2012 365 267 73.2%
2011 358 242 67.6%

#NACAC17
Benjamin Franklin Institute of Technology
• Full-time, undergraduate enrollment
– 520
• Students of color
– 63% or 328 Students
• Students of color (male)
– 60.1% or 278

#NACAC17
Male Retention – Benjamin Franklin Institute of Technology
First-year to sophomore retention (all)
First-year to sophomore retention (students of color)
Class
of….
Initial
Census
# of
students
%
2017 147 80 54%
2016 146 68 47%
Class
of….
Initial
Census
# of
students
%
2017 217 119 55%
2016 241 124 51%

#NACAC17
Benjamin Franklin Institute of Technology
• All of our students have access to our services
– Mostly inner-city students from the greater Boston area
• Success coaches serve as mentors to assist students through the transition
• One on one meetings with success coaches three times per term
• Eliminate any barriers to graduation
• Students of concern weekly meetings
• Financial aid incentives

#NACAC17
Male Graduation – Benjamin Franklin Institute of Technology
Three-year graduation (all)
Class
of….
Initial
Census
# of
students
%
2015 213 106 50%
2014 221 115 52%
2013 201 94 47%
2012 254 108 43%
2011 298 121 41%
2010 260 117 45%
Three-year graduation (students of color)
Class
of….
Initial
Census
# of
students
%
2015 151 68 45%
2014 132 69 52%
2013 124 49 40%
2012 148 50 34%
2011 179 66 37%
2010 155 63 41%

#NACAC17
Positioning Men of Color for Success (Broom, 2017)
• Build community
• Create awareness of campus resources
• Create opportunities for meaningful interactions and connections
• Empower students
• Create space for a holistic focus on male identity
• Improve campus climate and culture

#NACAC17
Institutionalized Support Looks Like…
IDEAL…
• Buy-in from executive leadership
• Fiscal resources adequately provided in
advance of programmatic development
• Human resources (administrative
support and delegation of responsibilities)
is adequate
• Organizational location within institution
is appropriate and more than one office
shares the responsibility
REALITY…
• Buy-in from senior-level leadership
• Chronic underfunding or funding based on
outcomes you have funding to achieve
• “Office of one” too often, or hiring a person
to be the face of the solution
• One office (usually in student affairs)
responsible for providing direct services,
so other offices “check out”

#NACAC17
How to Create the Changes You Want to See
• Get to know your institutional data…
• …and if you don’t know it, access it!
• Build bridges - making the human connection; take a listening tour
across campus to learn more about who might be allies versus not
• Connect with your alumni/trustees to paint the story of your institution

#NACAC17
Recommendations & Additional Resources
• My Brother’s Keeper Initiative: https://www.mbkalliance.org/
• RISE: http://www.risebmoc.org/about
• CUNY BMI: http://www1.cuny.edu/sites/bmi/about/
• Ubuntu Scholars: http://www.massasoit.edu/students-and-parents/student-
services/ubuntu-scholars/

#NACAC17
Contact Us!
• William Johnson, Fairfield University (CT)
• Marvin Loiseau, Benjamin Franklin Institute of Technology (MA)
• Leykia Nulan, UMass Amherst (MA)
• Ralph Tavares, Providence College (RI)

#NACAC17
Sources
Brooms, D. R. (2017) Being black, being male on campus: Understanding and confronting black male collegiate experiences. Albany: SUNY Press.
Griffin, K. (2006). Striving for success: A qualitative exploration of competing theories of high-achieving black college students' academic motivation. Journal of College Student Development, 47(4), 384-400.
Hausmann, L. R.M., Schofield, J. W., Woods, R. L. (2007). Sense of belonging as a predictor of intentions to persist among African American and White first-year college students. Research in Higher Education, 48(7), 803-839.
Maslow, A. H. (1943). A theory of human motivation. Psychological Review, 50, 370-396.
Strayhorn, T. L. (2012). College students’ sense of belonging: A key to educational success for all students. New York, NY: Routeldge.
U.S. Department of Education, National Center for Education Statistics, Integrated Postsecondary Education Data System (IPEDS), Spring 2002 through Spring 2013 and Winter 2013-14 through Winter 2015-16, Graduation Rates component; and IPEDS Fall 2009, Institutional Characteristics component. (This table was prepared October 2016.)