Automatic Generation of Textual Summaries from...
46
1 Automatic Generation of Textual Summaries from Neonatal Intensive Care Data François Portet a,∗ , Ehud Reiter a , Albert Gatt a , Jim Hunter a , Somayajulu Sripada a , Yvonne Freer b, c , Cindy Sykes b a Department of Computing Science, University of Aberdeen, Aberdeen AB24 3UE, UK b Simpson Centre for Reproductive Health, Royal Infirmary of Edinburgh, Edinburgh EH16 4SA, UK c School of Health in Social Science, University of Edinburgh, Edinburgh EH8 9AG, UK ____________________________________________________________________________ Abstract Effective presentation of data for decision support is a major issue when large volumes of data are generated as happens in the Intensive Care Unit (ICU). Although the most common approach is to present the data graphically, it has been shown that textual summarisation can lead to improved decision making. As part of the BabyTalk project, we present a prototype, called BT-45, which generates textual summaries of about 45 minutes of continuous physiological signals and discrete events (e.g.: equipment settings and drug administration). Its architecture brings together techniques from the different areas of signal processing, medical reasoning, knowledge engineering, and natural language generation. A clinical off-ward experiment in a Neonatal ICU (NICU) showed that human expert textual descriptions of NICU data lead to better decision making than classical graphical visualisation, whereas texts generated by BT-45 lead to similar quality decision-making as visualisations. Textual analysis showed that BT-45 texts were inferior to human expert texts in a number of ways, including not reporting temporal information as well and not producing good narratives. Despite these deficiencies, our work shows that it is possible for computer systems to generate effective textual summaries of complex continuous and discrete temporal clinical data. Keywords: Natural language generation; Intelligent data analysis; Intensive care unit; Decision support systems ____________________________________________________________________________ ∗ Corresponding author. Email address: [email protected] François Portet is now a lecturer at Laboratoire d’Informatique de Grenoble, 220 rue de la Chimie, 38400 Saint Martin d’Hères, France and at Grenoble Institute of Technology, 46 avenue Félix Viallet, 38031 Grenoble, France
-
Upload
nguyendang -
Category
Documents
-
view
231 -
download
0
Transcript of Automatic Generation of Textual Summaries from...
1
Automatic Generation of Textual Summaries from Neonatal Intensive Care Data
François Portet a,∗, Ehud Reiter a, Albert Gatt a, Jim Hunter a, Somayajulu Sripada a,
Yvonne Freer b, c, Cindy Sykes b a
Department of Computing Science, University of Aberdeen, Aberdeen AB24 3UE, UK b Simpson Centre for Reproductive Health, Royal Infirmary of Edinburgh, Edinburgh EH16
4SA, UK c School of Health in Social Science, University of Edinburgh, Edinburgh EH8 9AG, UK
____________________________________________________________________________
Abstract
Effective presentation of data for decision support is a major issue when large volumes of data are generated as happens in the Intensive Care Unit (ICU). Although the most common approach is to present the data graphically, it has been shown that textual summarisation can lead to improved decision making. As part of the BabyTalk project, we present a prototype, called BT-45, which generates textual summaries of about 45 minutes of continuous physiological signals and discrete events (e.g.: equipment settings and drug administration). Its architecture brings together techniques from the different areas of signal processing, medical reasoning, knowledge engineering, and natural language generation. A clinical off-ward experiment in a Neonatal ICU (NICU) showed that human expert textual descriptions of NICU data lead to better decision making than classical graphical visualisation, whereas texts generated by BT-45 lead to similar quality decision-making as visualisations. Textual analysis showed that BT-45 texts were inferior to human expert texts in a number of ways, including not reporting temporal information as well and not producing good narratives. Despite these deficiencies, our work shows that it is possible for computer systems to generate effective textual summaries of complex continuous and discrete temporal clinical data.
Keywords: Natural language generation; Intelligent data analysis; Intensive care unit; Decision support systems
____________________________________________________________________________
∗ Corresponding author. Email address: [email protected] François Portet is now a lecturer at Laboratoire d’Informatique de Grenoble, 220 rue de la Chimie, 38400 Saint Martin d’Hères, France and at Grenoble Institute of Technology, 46 avenue Félix Viallet, 38031 Grenoble, France
2
1 Introduction
Doctors and nurses caring for sick babies in a Neonatal Intensive Care Unit (NICU) must make important decisions about how to best treat their patients, sometimes under time pressure. A large amount of data about a baby is available to the clinical staff, including signals from sensors measuring physiological variables (e.g., heart rate, blood pressure) and patient notes which record previous interventions, results of laboratory tests, and so forth. In principle, efficient access to such information should allow more effective decisions to be taken. However, the mode of presentation of that information is crucial: data is only effective to the extent that it is presented in a way that allows key items to be extracted quickly, with reduced chance of error.
Currently, the predominant mode of presentation is visualisation, but this has not been as effective as was hoped [54,76]. While visualisation systems work extremely well in helping experienced users to explore data sets for several patients over a period of hours or days [80], they are not always effective in helping users with a range of expertise (in our case, ranging from junior nurses to experienced consultants) make decisions in a few minutes. Another way of using the data for decision-support is to create a knowledge-based (expert) system which recommends specific interventions to the medical staff. With a few exceptions [22], such systems have not been successfully integrated into medical practice. One possible reason for this is related to the user’s perception of such a system. For example, expert system advice is often ignored, particularly when it is not accompanied by an explanation [20,29,49] even when users acknowledge its global good performance [67].
We believe that an alternative way of using such data for decision-support is to harness knowledge-based methods to identify key items of information in the data, and then present these to the user via a textual summary, produced automatically using Natural Language Generation (NLG) techniques. In short, we are trying to steer a middle ground between presenting the raw data (as classical visualisation systems do) and recommending specific actions to the medical staff (as most expert systems do). Our aim is to provide doctors and nurses with a clear summary which presents the key information to facilitate decision-making, leaving the latter process entirely up to their judgement.
We are realising our vision in the BabyTalk project, which is developing several systems to present NICU data to different audiences and for different purposes. In this paper, we present the first BabyTalk system, BT-45, which generates summaries of around 45 minutes of clinical data (hence the name BT-45), to help doctors and nurses make immediate decisions. We describe how BT-45 works, and then present an evaluation of the system, which suggests that BT-45 texts are at least as effective as existing visualisation methods in supporting intervention decisions, although they are not as effective as human-authored summaries of the data. We expect that subsequent BabyTalk systems will generate texts which are closer in quality to the human-authored texts, and which can serve as a complementary presentation modality to the currently employed visualisations.
1.1 NICU and BabyTalk
A typical patient in a NICU is a premature baby whose bodily systems require artificial support until s/he is ready for independent life. The kind of support a baby receives in a NICU includes the use of ventilators to assist respiration, incubators to provide warmth and humidity, etc.
3
Typically, babies stay in a NICU for a period of weeks, though a stay may range from a few days to a few months. In addition to the treatment of patients, an integral part of the activity in a NICU includes the support of parents or guardians who have to cope with a stressful situation. Along with medical advice, medical staff also help parents to care for and feed their baby, and give recommendations for using medical devices at home when needed.
The BabyTalk project is a collaboration between the NICU at the Edinburgh Royal Infirmary, the universities of Aberdeen and Edinburgh, and Clevermed Ltd. [13] (a company which makes software for NICUs). The main goal of the project as a whole is to understand how textual summaries can be generated for different time scales (minutes to hours to days), different use contexts (e.g., decision support vs. nursing shift summary) and different user groups (e.g., doctors vs. parents). Prior to achieving this, a number of challenges need to be met, not the least of which is the development of techniques to process large volumes of heterogeneous data.
The BT-45 system was a first step towards achieving these goals. It was intended as a demonstration of the feasibility of building a large-scale system that combines techniques from intelligent signal processing and natural language generation. One of the motivations was provided by a study by Law et al [48], who found that NICU staff performed better at a clinical decision-making task when exposed to data that was written by human experts, compared to graphical presentations of the kind they are usually exposed to. Our evaluation attempted to replicate their findings, by comparing both human and computer-generated texts, in addition to graphics. Since the Law et al. study presented subjects with scenarios consisting of 45 minutes of patient data, BT-45 was designed to generate summaries of periods of this length.
1.2 Example
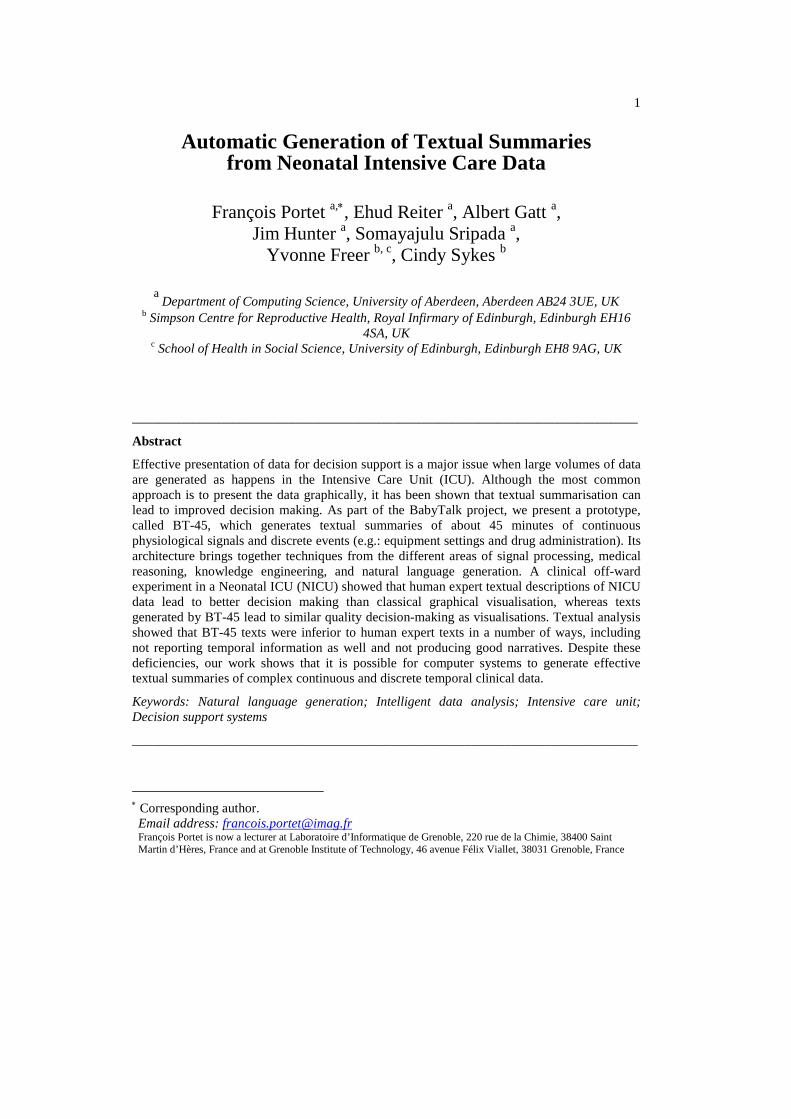
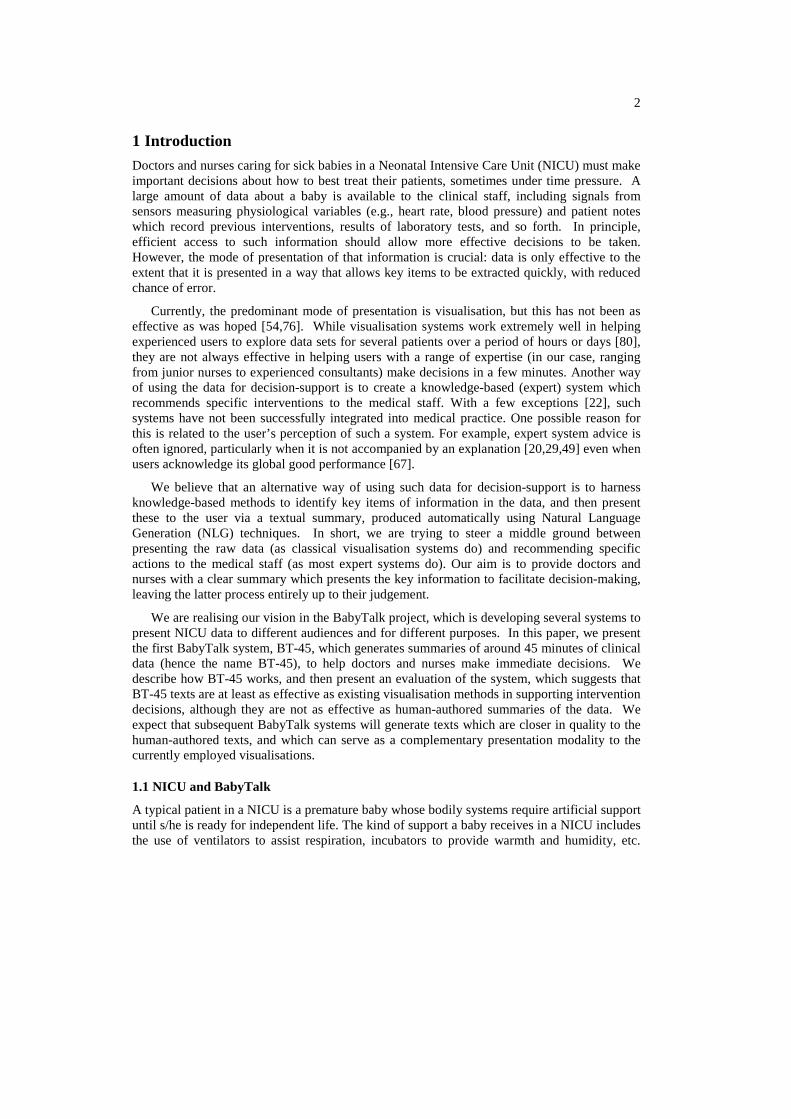
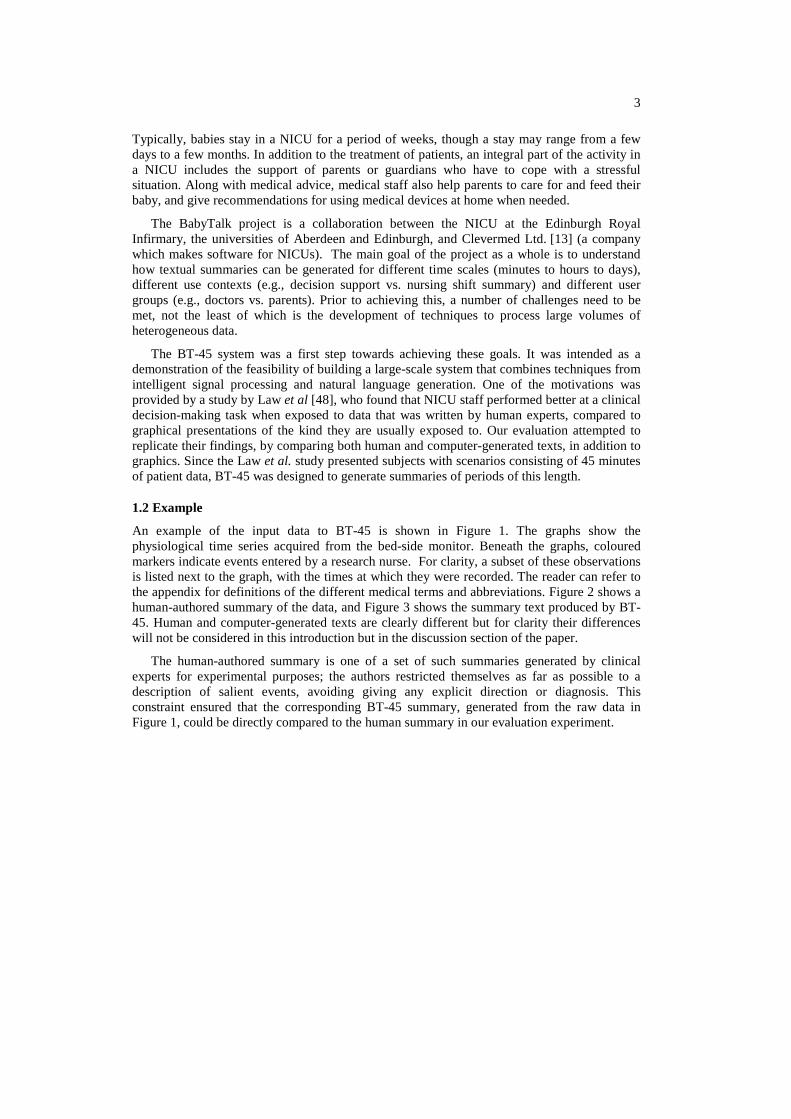
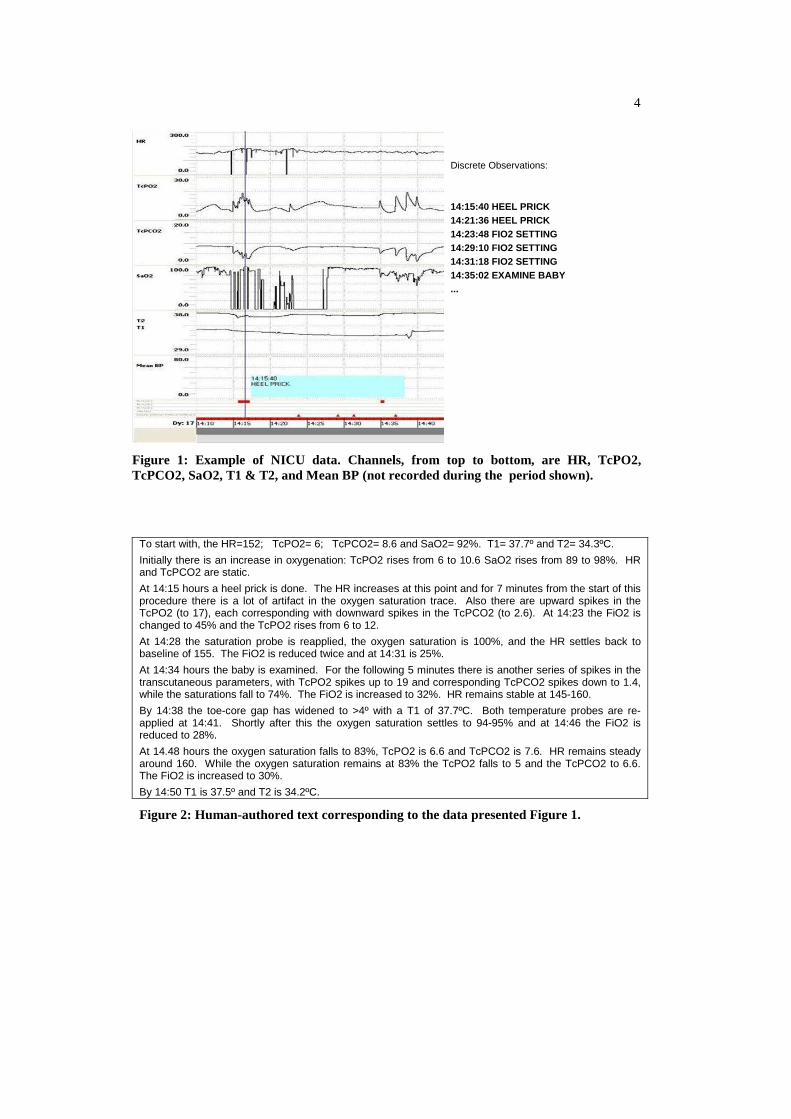
An example of the input data to BT-45 is shown in Figure 1. The graphs show the physiological time series acquired from the bed-side monitor. Beneath the graphs, coloured markers indicate events entered by a research nurse. For clarity, a subset of these observations is listed next to the graph, with the times at which they were recorded. The reader can refer to the appendix for definitions of the different medical terms and abbreviations. Figure 2 shows a human-authored summary of the data, and Figure 3 shows the summary text produced by BT-45. Human and computer-generated texts are clearly different but for clarity their differences will not be considered in this introduction but in the discussion section of the paper.
The human-authored summary is one of a set of such summaries generated by clinical experts for experimental purposes; the authors restricted themselves as far as possible to a description of salient events, avoiding giving any explicit direction or diagnosis. This constraint ensured that the corresponding BT-45 summary, generated from the raw data in Figure 1, could be directly compared to the human summary in our evaluation experiment.
4
14:15:40HEEL PRICK14:21:36HEEL PRICK14:23:48FIO2 SETTING14:29:10FIO2 SETTING14:31:18FIO2 SETTING14:35:02EXAMINE BABY...
Discrete Observations:
Figure 1: Example of NICU data. Channels, from top to bottom, are HR, TcPO2, TcPCO2, SaO2, T1 & T2, and Mean BP (not recorded during the period shown).
To start with, the HR=152; TcPO2= 6; TcPCO2= 8.6 and SaO2= 92%. T1= 37.7º and T2= 34.3ºC.
Initially there is an increase in oxygenation: TcPO2 rises from 6 to 10.6 SaO2 rises from 89 to 98%. HR and TcPCO2 are static.
At 14:15 hours a heel prick is done. The HR increases at this point and for 7 minutes from the start of this procedure there is a lot of artifact in the oxygen saturation trace. Also there are upward spikes in the TcPO2 (to 17), each corresponding with downward spikes in the TcPCO2 (to 2.6). At 14:23 the FiO2 is changed to 45% and the TcPO2 rises from 6 to 12.
At 14:28 the saturation probe is reapplied, the oxygen saturation is 100%, and the HR settles back to baseline of 155. The FiO2 is reduced twice and at 14:31 is 25%.
At 14:34 hours the baby is examined. For the following 5 minutes there is another series of spikes in the transcutaneous parameters, with TcPO2 spikes up to 19 and corresponding TcPCO2 spikes down to 1.4, while the saturations fall to 74%. The FiO2 is increased to 32%. HR remains stable at 145-160.
By 14:38 the toe-core gap has widened to >4º with a T1 of 37.7ºC. Both temperature probes are re-applied at 14:41. Shortly after this the oxygen saturation settles to 94-95% and at 14:46 the FiO2 is reduced to 28%.
At 14.48 hours the oxygen saturation falls to 83%, TcPO2 is 6.6 and TcPCO2 is 7.6. HR remains steady around 160. While the oxygen saturation remains at 83% the TcPO2 falls to 5 and the TcPCO2 to 6.6. The FiO2 is increased to 30%.
By 14:50 T1 is 37.5º and T2 is 34.2ºC.
Figure 2: Human-authored text corresponding to the data presented Figure 1.

5
“You saw the baby between 14:10 and 14:50. Heart Rate (HR) = 159. Core Temperature (T1) = 37.7. Peripheral Temperature (T2) = 34.3. Transcutaneous Oxygen (TcPO2) = 5.8. Transcutaneous CO2 (TcPCO2) = 8.5. Oxygen Saturation (SaO2) = 89.
Over the next 30 minutes T1 gradually increased to 37.3.
By 14:27 there had been 2 successive desaturations down to 56. As a result, Fraction of Inspired Oxygen (FIO2) was set to 45%. Over the next 20 minutes T2 decreased to 32.9. A heel prick was taken. Previously the spo2 sensor had been re-sited.
At 14:31 FIO2 was lowered to 25%. Previously TcPO2 had decreased to 8.4. Over the next 20 minutes HR decreased to 153.
By 14:40 there had been 2 successive desaturations down to 68. Previously FIO2 had been raised to 32%. TcPO2 decreased to 5.0. T2 had suddenly increased to 33.9. Previously the spo2 sensor had been re-sited. The temperature sensor was re-sited.”
Figure 3: BT-45 computer-generated text corresponding to the data presented in Figure 1
These summaries illustrate the main purpose of BT-45, which is to present information in narrative form, highlighting features which an expert would consider as highly salient and warranting clinical attention. Such events are of course implicit in the graphical presentation as well; however, their identification would require a significant amount of analysis and interpretation on the part of a user. For example, the text in Figure 3 mentions successive desaturations at different points in the 45 minute period. These correspond to troughs in the Oxygen Saturation signal (labelled SaO2 in Figure 1), which need to be classified (using knowledge about certain features such as the duration of a trend and the lowest value that needs to be reached in order to qualify as a desaturation). Moreover, there is significant noise in the signals, such as prolonged drops to zero in SaO2, which a user would need to filter out.
In order to generate a text such as that in Figure 3, BT-45 goes through a number of stages. Before turning to a full description of the architecture (Section 4), we first discuss some related work (Section 2) and describe the input data in greater detail, as well as the corpus that informed some of the design decisions (Section 3). We describe a clinical trial in which BT-45 was evaluated (Section 5) and the paper concludes with an extended discussion (Section 6), our intentions for future work (Section 7) and a summary of our conclusions (Section 8).
2 Background
Large data sets are currently available in many domains from sensors, simulations, databases, and so forth. As shown by the examples of geographical information systems (GIS) and meteorological data, this state of affairs is not restricted to the medical domain. Much effort has been invested in the design of effective support systems, permitting a user to sift through the data and focus on relevant bits of information. This work spans many different areas, and in this section we focus on two which are of particular relevance to our domain of inquiry, namely, visualisation and data-to-text (Natural Language Generation) systems.
2.1 Visualisation
Information visualisation has been the focus of intensive research; the aim is to facilitate the process of making abstractions and inferring relations between variables by presenting the user with graphical representations of complex data. One of the main selling-points of
6
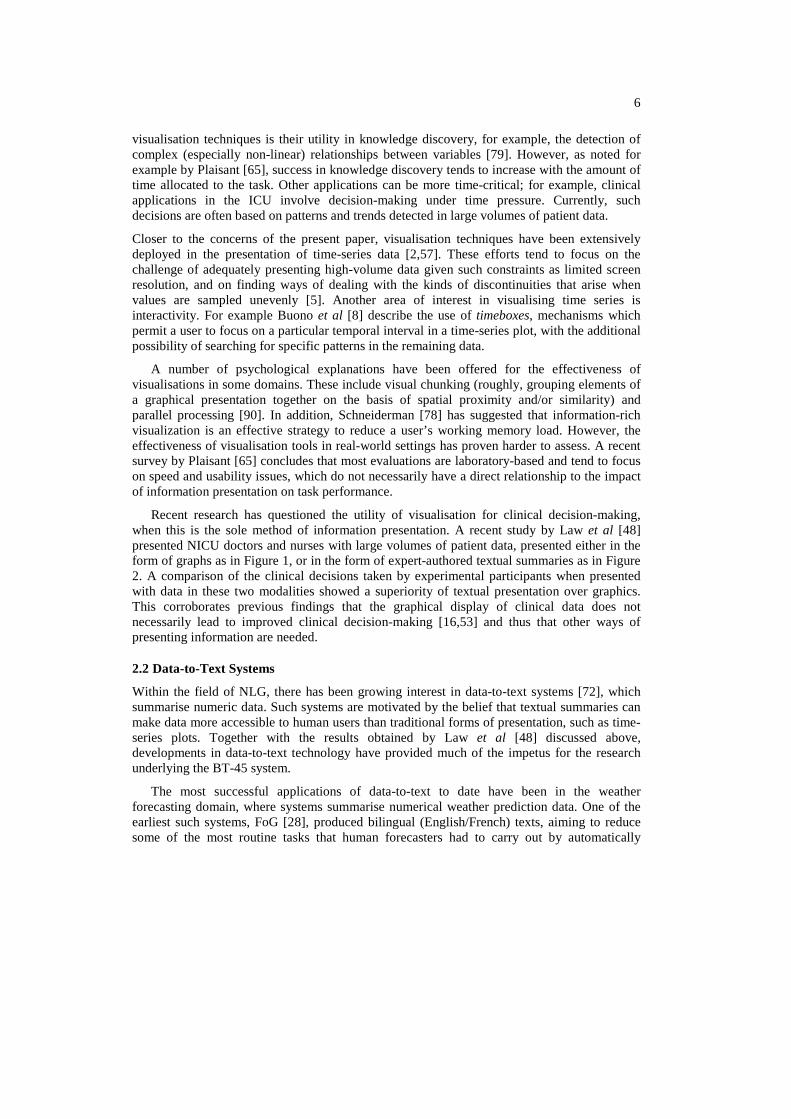
visualisation techniques is their utility in knowledge discovery, for example, the detection of complex (especially non-linear) relationships between variables [79]. However, as noted for example by Plaisant [65], success in knowledge discovery tends to increase with the amount of time allocated to the task. Other applications can be more time-critical; for example, clinical applications in the ICU involve decision-making under time pressure. Currently, such decisions are often based on patterns and trends detected in large volumes of patient data.
Closer to the concerns of the present paper, visualisation techniques have been extensively deployed in the presentation of time-series data [2,57]. These efforts tend to focus on the challenge of adequately presenting high-volume data given such constraints as limited screen resolution, and on finding ways of dealing with the kinds of discontinuities that arise when values are sampled unevenly [5]. Another area of interest in visualising time series is interactivity. For example Buono et al [8] describe the use of timeboxes, mechanisms which permit a user to focus on a particular temporal interval in a time-series plot, with the additional possibility of searching for specific patterns in the remaining data.
A number of psychological explanations have been offered for the effectiveness of visualisations in some domains. These include visual chunking (roughly, grouping elements of a graphical presentation together on the basis of spatial proximity and/or similarity) and parallel processing [90]. In addition, Schneiderman [78] has suggested that information-rich visualization is an effective strategy to reduce a user’s working memory load. However, the effectiveness of visualisation tools in real-world settings has proven harder to assess. A recent survey by Plaisant [65] concludes that most evaluations are laboratory-based and tend to focus on speed and usability issues, which do not necessarily have a direct relationship to the impact of information presentation on task performance.
Recent research has questioned the utility of visualisation for clinical decision-making, when this is the sole method of information presentation. A recent study by Law et al [48] presented NICU doctors and nurses with large volumes of patient data, presented either in the form of graphs as in Figure 1, or in the form of expert-authored textual summaries as in Figure 2. A comparison of the clinical decisions taken by experimental participants when presented with data in these two modalities showed a superiority of textual presentation over graphics. This corroborates previous findings that the graphical display of clinical data does not necessarily lead to improved clinical decision-making [16,53] and thus that other ways of presenting information are needed.
2.2 Data-to-Text Systems
Within the field of NLG, there has been growing interest in data-to-text systems [72], which summarise numeric data. Such systems are motivated by the belief that textual summaries can make data more accessible to human users than traditional forms of presentation, such as time-series plots. Together with the results obtained by Law et al [48] discussed above, developments in data-to-text technology have provided much of the impetus for the research underlying the BT-45 system.
The most successful applications of data-to-text to date have been in the weather forecasting domain, where systems summarise numerical weather prediction data. One of the earliest such systems, FoG [28], produced bilingual (English/French) texts, aiming to reduce some of the most routine tasks that human forecasters had to carry out by automatically
7
generating forecasts from data that had previously been manipulated by human users through a graphical user interface. A different kind of interactive approach was taken in MULTIMETEO [14], another multilingual generator, which generated forecasts based on structured input data, and also provided the user with an interface which enabled editing of the automatically produced output. The potential of this technology has recently been demonstrated in the SumTime system, which produced marine weather forecasts [83]. An evaluation of this system showed that human readers preferred some of the SumTime texts to those authored by professional forecasters [73]. This was probably the first demonstration of this kind for a data-to-text NLG system. A number of other data-to-text systems have been developed to summarise small data sets, including summaries of statistical data [24,41], air quality reports [6], and financial data [18,46].
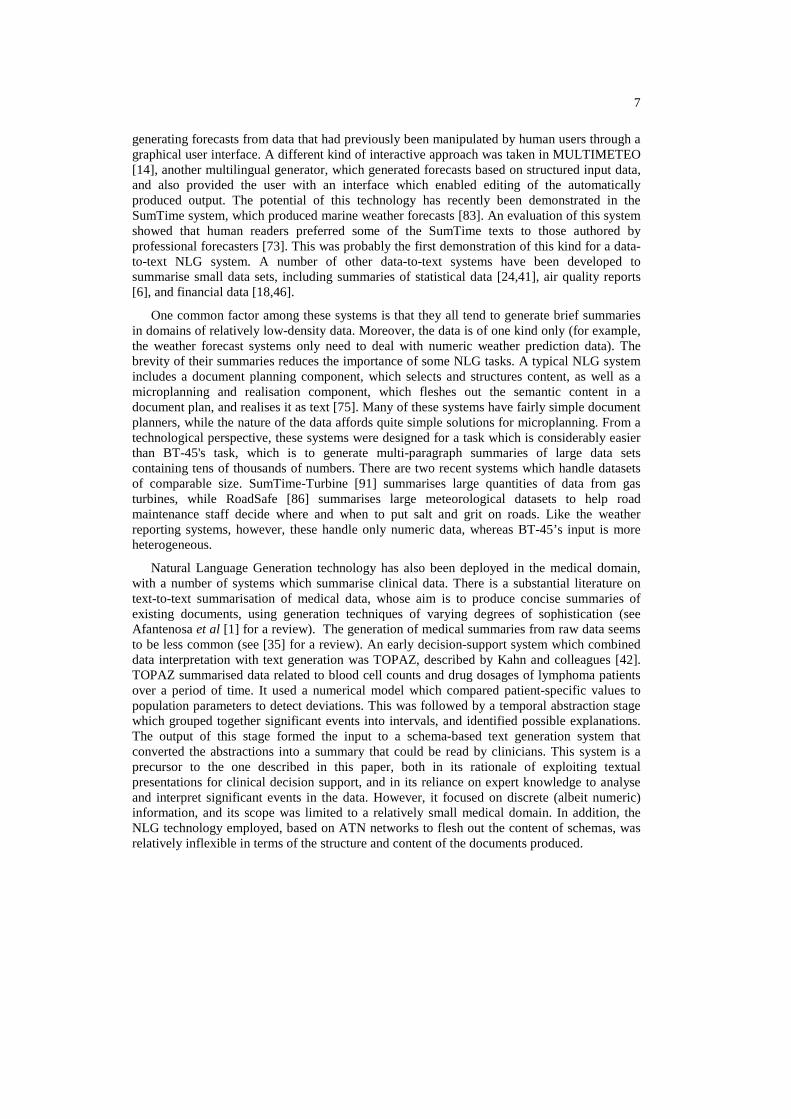
One common factor among these systems is that they all tend to generate brief summaries in domains of relatively low-density data. Moreover, the data is of one kind only (for example, the weather forecast systems only need to deal with numeric weather prediction data). The brevity of their summaries reduces the importance of some NLG tasks. A typical NLG system includes a document planning component, which selects and structures content, as well as a microplanning and realisation component, which fleshes out the semantic content in a document plan, and realises it as text [75]. Many of these systems have fairly simple document planners, while the nature of the data affords quite simple solutions for microplanning. From a technological perspective, these systems were designed for a task which is considerably easier than BT-45's task, which is to generate multi-paragraph summaries of large data sets containing tens of thousands of numbers. There are two recent systems which handle datasets of comparable size. SumTime-Turbine [91] summarises large quantities of data from gas turbines, while RoadSafe [86] summarises large meteorological datasets to help road maintenance staff decide where and when to put salt and grit on roads. Like the weather reporting systems, however, these handle only numeric data, whereas BT-45’s input is more heterogeneous.
Natural Language Generation technology has also been deployed in the medical domain, with a number of systems which summarise clinical data. There is a substantial literature on text-to-text summarisation of medical data, whose aim is to produce concise summaries of existing documents, using generation techniques of varying degrees of sophistication (see Afantenosa et al [1] for a review). The generation of medical summaries from raw data seems to be less common (see [35] for a review). An early decision-support system which combined data interpretation with text generation was TOPAZ, described by Kahn and colleagues [42]. TOPAZ summarised data related to blood cell counts and drug dosages of lymphoma patients over a period of time. It used a numerical model which compared patient-specific values to population parameters to detect deviations. This was followed by a temporal abstraction stage which grouped together significant events into intervals, and identified possible explanations. The output of this stage formed the input to a schema-based text generation system that converted the abstractions into a summary that could be read by clinicians. This system is a precursor to the one described in this paper, both in its rationale of exploiting textual presentations for clinical decision support, and in its reliance on expert knowledge to analyse and interpret significant events in the data. However, it focused on discrete (albeit numeric) information, and its scope was limited to a relatively small medical domain. In addition, the NLG technology employed, based on ATN networks to flesh out the content of schemas, was relatively inflexible in terms of the structure and content of the documents produced.
8
Like TOPAZ, most data-to-text systems in the medical domain to date have focused on summarising discrete (as opposed to high-density sensor) data. For example, Suregen [34] helps hospital doctors write routine reports; and the Narrative Engine [31] helps doctors in small practices and clinics create summaries (which are needed in part for legal reasons) of the symptoms reported by a patient, lab tests, prescriptions, and so forth. A number of NLG systems have also been developed to produce informational texts for patients (rather than medical staff), such as STOP [74], which generated personalised smoking-cessation letters, and PIGLIT [11]. Again these systems only summarised discrete data. To the best of our knowledge, BT-45 is the first medical NLG system which summarises sensor as well as discrete data, and also one of the first medical NLG systems whose primary purpose is decision support.
Another important question for data-to-text technology is related to evaluation. Most data-to-text systems have been evaluated by asking human subjects to rate or compare texts (or indeed by simply seeing if end-users wish to use a system). Few such systems have been evaluated by directly testing whether they achieve their goal. One exception is the STOP system [74], which was evaluated in a randomised controlled clinical trial which measured how effective STOP letters were at actually helping people stop smoking; unfortunately this evaluation showed that STOP letters were no more effective than control material.
3 Input Data and Corpus
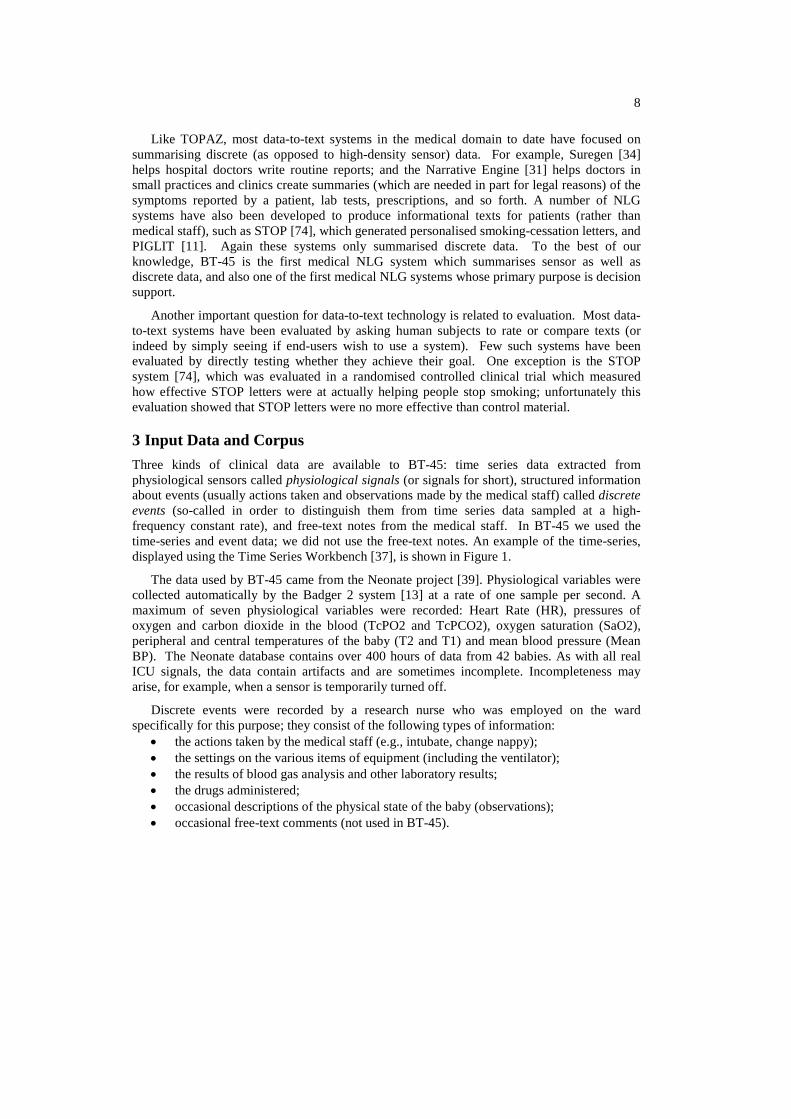
Three kinds of clinical data are available to BT-45: time series data extracted from physiological sensors called physiological signals (or signals for short), structured information about events (usually actions taken and observations made by the medical staff) called discrete events (so-called in order to distinguish them from time series data sampled at a high-frequency constant rate), and free-text notes from the medical staff. In BT-45 we used the time-series and event data; we did not use the free-text notes. An example of the time-series, displayed using the Time Series Workbench [37], is shown in Figure 1.
The data used by BT-45 came from the Neonate project [39]. Physiological variables were collected automatically by the Badger 2 system [13] at a rate of one sample per second. A maximum of seven physiological variables were recorded: Heart Rate (HR), pressures of oxygen and carbon dioxide in the blood (TcPO2 and TcPCO2), oxygen saturation (SaO2), peripheral and central temperatures of the baby (T2 and T1) and mean blood pressure (Mean BP). The Neonate database contains over 400 hours of data from 42 babies. As with all real ICU signals, the data contain artifacts and are sometimes incomplete. Incompleteness may arise, for example, when a sensor is temporarily turned off.
Discrete events were recorded by a research nurse who was employed on the ward specifically for this purpose; they consist of the following types of information:
• the actions taken by the medical staff (e.g., intubate, change nappy); • the settings on the various items of equipment (including the ventilator); • the results of blood gas analysis and other laboratory results; • the drugs administered; • occasional descriptions of the physical state of the baby (observations); • occasional free-text comments (not used in BT-45).
9
BT-45 relies exclusively on the data entered by the research nurse, not on the information entered routinely by the medical staff as, at the time of the Neonate project, both paper and electronic records were being maintained. We realise that future BabyTalk systems that will be used in the real world will only be able to access routinely recorded information (i.e., sensor data acquired automatically and discrete events entered routinely by the medical staff); a specially-employed research nurse will not be available to enter clinical events. However, much of the information used in BT-45 which was recorded by the research nurse is now automatically gathered on the ward (e.g., the Edinburgh NICU makes use of Clevermed’s latest system, Badger-3), though at a lower time accuracy. Part of our research agenda is to explore the extent to which we can reconstruct from the available data the information which was recorded by the research nurse but is either not collected by Badger-3 or recorded with imprecise time-stamps.
In addition to the clinical input data, we needed a corpus of human-authored summaries to provide examples of what our computer-generated summaries should look like. As we aimed at comparing the efficiency of the BT-45 outputs with human expert summaries, colleagues at the Edinburgh NICU wrote 23 summaries of NICU data which supplemented the 18 summaries written for the Neonate Project [48]. The summaries, which describe time periods of between 30 and 50 minutes, were used as the development data for BT-45. A further 26 human-authored summaries were used in the evaluation experiment to compare the benefits to clinical decision-making of human-authored and BT-45 summaries. Figure 2 is an example of one of these. These 26 texts were not available to the BT-45 developers until they had submitted the final texts generated automatically by the system for its final evaluation.
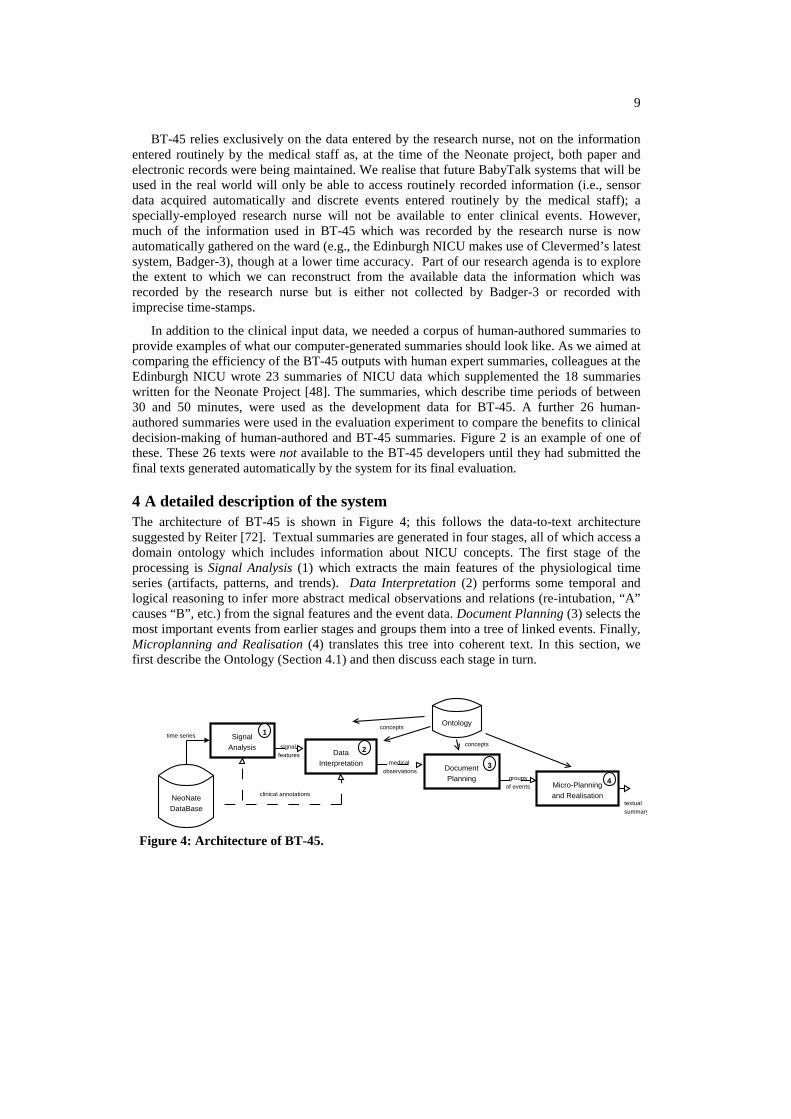
4 A detailed description of the system The architecture of BT-45 is shown in Figure 4; this follows the data-to-text architecture suggested by Reiter [72]. Textual summaries are generated in four stages, all of which access a domain ontology which includes information about NICU concepts. The first stage of the processing is Signal Analysis (1) which extracts the main features of the physiological time series (artifacts, patterns, and trends). Data Interpretation (2) performs some temporal and logical reasoning to infer more abstract medical observations and relations (re-intubation, “A” causes “B”, etc.) from the signal features and the event data. Document Planning (3) selects the most important events from earlier stages and groups them into a tree of linked events. Finally, Microplanning and Realisation (4) translates this tree into coherent text. In this section, we first describe the Ontology (Section 4.1) and then discuss each stage in turn.
NeoNateDataBase
SignalAnalysis
DataInterpretation
DocumentPlanning
Micro-Planningand Realisation
Ontology
time series
clinical annotations
signal features
medical observations
groupsof events
textualsummary
1
2
3
4
concepts
concepts
Figure 4: Architecture of BT-45.
10
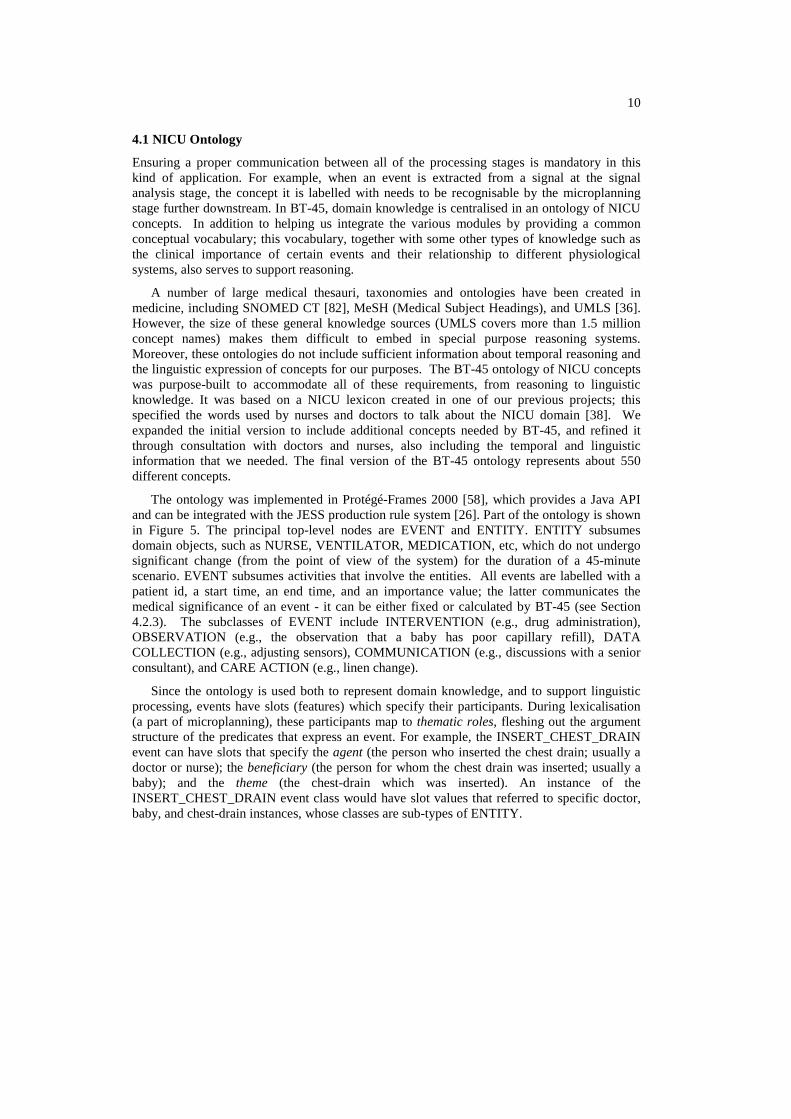
4.1 NICU Ontology
Ensuring a proper communication between all of the processing stages is mandatory in this kind of application. For example, when an event is extracted from a signal at the signal analysis stage, the concept it is labelled with needs to be recognisable by the microplanning stage further downstream. In BT-45, domain knowledge is centralised in an ontology of NICU concepts. In addition to helping us integrate the various modules by providing a common conceptual vocabulary; this vocabulary, together with some other types of knowledge such as the clinical importance of certain events and their relationship to different physiological systems, also serves to support reasoning.
A number of large medical thesauri, taxonomies and ontologies have been created in medicine, including SNOMED CT [82], MeSH (Medical Subject Headings), and UMLS [36]. However, the size of these general knowledge sources (UMLS covers more than 1.5 million concept names) makes them difficult to embed in special purpose reasoning systems. Moreover, these ontologies do not include sufficient information about temporal reasoning and the linguistic expression of concepts for our purposes. The BT-45 ontology of NICU concepts was purpose-built to accommodate all of these requirements, from reasoning to linguistic knowledge. It was based on a NICU lexicon created in one of our previous projects; this specified the words used by nurses and doctors to talk about the NICU domain [38]. We expanded the initial version to include additional concepts needed by BT-45, and refined it through consultation with doctors and nurses, also including the temporal and linguistic information that we needed. The final version of the BT-45 ontology represents about 550 different concepts.
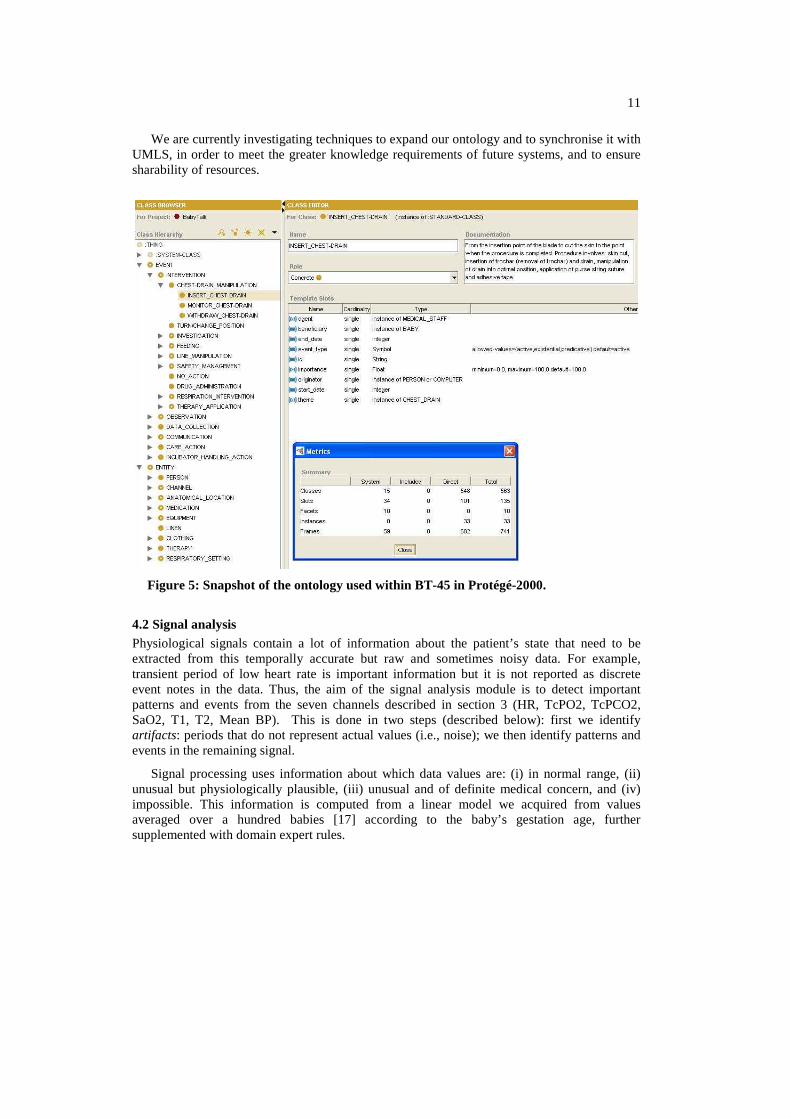
The ontology was implemented in Protégé-Frames 2000 [58], which provides a Java API and can be integrated with the JESS production rule system [26]. Part of the ontology is shown in Figure 5. The principal top-level nodes are EVENT and ENTITY. ENTITY subsumes domain objects, such as NURSE, VENTILATOR, MEDICATION, etc, which do not undergo significant change (from the point of view of the system) for the duration of a 45-minute scenario. EVENT subsumes activities that involve the entities. All events are labelled with a patient id, a start time, an end time, and an importance value; the latter communicates the medical significance of an event - it can be either fixed or calculated by BT-45 (see Section 4.2.3). The subclasses of EVENT include INTERVENTION (e.g., drug administration), OBSERVATION (e.g., the observation that a baby has poor capillary refill), DATA COLLECTION (e.g., adjusting sensors), COMMUNICATION (e.g., discussions with a senior consultant), and CARE ACTION (e.g., linen change).
Since the ontology is used both to represent domain knowledge, and to support linguistic processing, events have slots (features) which specify their participants. During lexicalisation (a part of microplanning), these participants map to thematic roles, fleshing out the argument structure of the predicates that express an event. For example, the INSERT_CHEST_DRAIN event can have slots that specify the agent (the person who inserted the chest drain; usually a doctor or nurse); the beneficiary (the person for whom the chest drain was inserted; usually a baby); and the theme (the chest-drain which was inserted). An instance of the INSERT_CHEST_DRAIN event class would have slot values that referred to specific doctor, baby, and chest-drain instances, whose classes are sub-types of ENTITY.
11
We are currently investigating techniques to expand our ontology and to synchronise it with UMLS, in order to meet the greater knowledge requirements of future systems, and to ensure sharability of resources.
Figure 5: Snapshot of the ontology used within BT-45 in Protégé-2000.
4.2 Signal analysis Physiological signals contain a lot of information about the patient’s state that need to be extracted from this temporally accurate but raw and sometimes noisy data. For example, transient period of low heart rate is important information but it is not reported as discrete event notes in the data. Thus, the aim of the signal analysis module is to detect important patterns and events from the seven channels described in section 3 (HR, TcPO2, TcPCO2, SaO2, T1, T2, Mean BP). This is done in two steps (described below): first we identify artifacts: periods that do not represent actual values (i.e., noise); we then identify patterns and events in the remaining signal.
Signal processing uses information about which data values are: (i) in normal range, (ii) unusual but physiologically plausible, (iii) unusual and of definite medical concern, and (iv) impossible. This information is computed from a linear model we acquired from values averaged over a hundred babies [17] according to the baby’s gestation age, further supplemented with domain expert rules.
12
4.2.1 Artifact analysis NICU sensor data can be affected by a variety of artifacts (sensor problems). For example, a nurse may disconnect a sensor when she picks up a baby; a sensor attached to the baby's foot may only intermittently read correct data if the baby is kicking; a sensor may not have been attached properly in the first place. BT-45 needs to identify which data values reflect the baby's real physiological state, and which are due to sensor problems. It also needs to distinguish short-term transient artifacts, from longer-term artifacts. Transient artifacts do not convey any information and must be removed from the analysis or corrected if possible. Long-term artifacts need further analysis as they can contain important information about what is happening to the baby (e.g., a blood sample acquisition from an arterial line results in a specific pattern on the blood pressure signal). Also, long-term artifacts can motivate certain kinds of intervention by medical staff, such as re-applying or adjusting sensors so that they read more accurate data values (Section 6.2.1).
1410 1415 1420 1425 1430 1435 1440 1445 1450
0
30
60
90Mean Blood Pressure (mmHg)
0
5
10
15
20
0
5
10TcPCO2 (mmHg)
1000 1005 1010 1015 1020
TcPO2 (mmHg)
(a) (b)
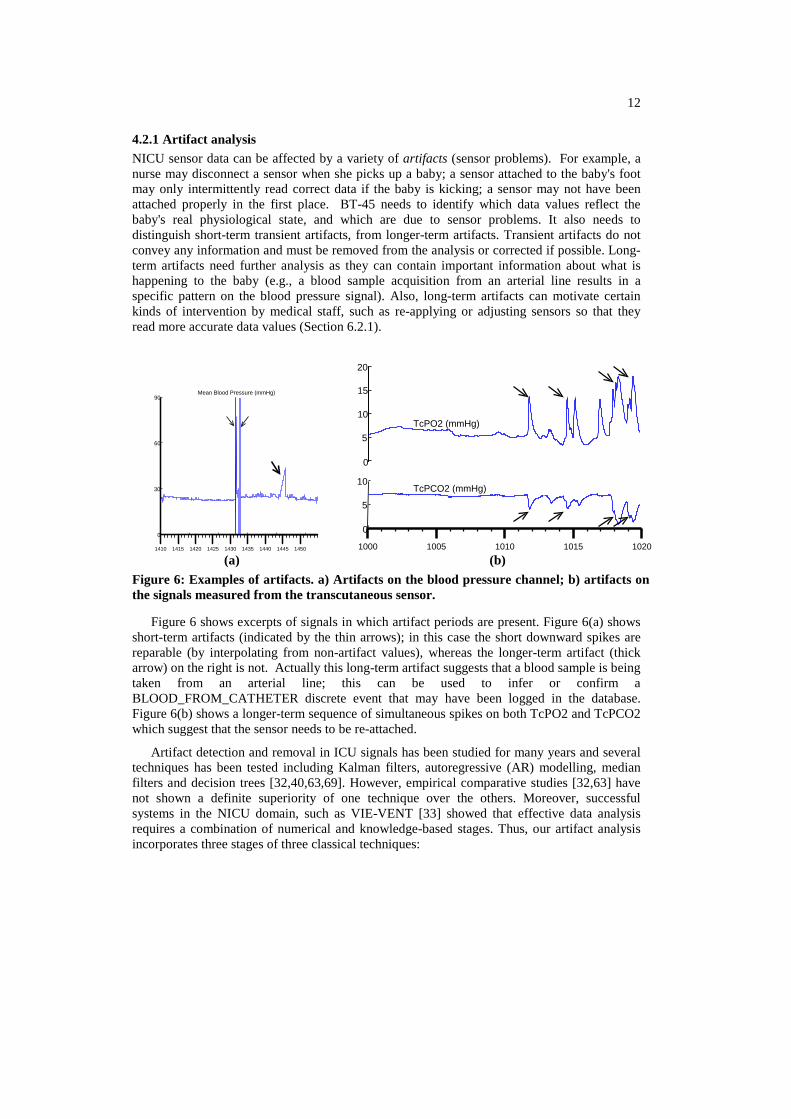
Figure 6: Examples of artifacts. a) Artifacts on the blood pressure channel; b) artifacts on the signals measured from the transcutaneous sensor.
Figure 6 shows excerpts of signals in which artifact periods are present. Figure 6(a) shows short-term artifacts (indicated by the thin arrows); in this case the short downward spikes are reparable (by interpolating from non-artifact values), whereas the longer-term artifact (thick arrow) on the right is not. Actually this long-term artifact suggests that a blood sample is being taken from an arterial line; this can be used to infer or confirm a BLOOD_FROM_CATHETER discrete event that may have been logged in the database. Figure 6(b) shows a longer-term sequence of simultaneous spikes on both TcPO2 and TcPCO2 which suggest that the sensor needs to be re-attached.
Artifact detection and removal in ICU signals has been studied for many years and several techniques has been tested including Kalman filters, autoregressive (AR) modelling, median filters and decision trees [32,40,63,69]. However, empirical comparative studies [32,63] have not shown a definite superiority of one technique over the others. Moreover, successful systems in the NICU domain, such as VIE-VENT [33] showed that effective data analysis requires a combination of numerical and knowledge-based stages. Thus, our artifact analysis incorporates three stages of three classical techniques:
13
1. Range checking: this flags all values that are not physiologically possible;
2. Autoregressive (AR) modelling: this flags all values outside a dynamically updated acceptance interval, and repairs some transient artifacts. AR coefficients were learnt using the biosig toolbox1, using a separate NICU data set where artifacts had been marked up (courtesy of J. Quinn [69]);
3. Correlation checking: a knowledge-based system relates the artifacts in different variables. For example, as the TcPO2 and TcPCO2 signals are derived from the same probe (the transcutaneous probe), if an artifact appears on one signal, it should also appear on the other.
4.2.2 Identifying pattern and events.
This module works in three stages: identification of specific events known to be medically significant, identification of other short-term patterns, and identification of long-term trends. We define pattern as a group of consecutive time points that is the manifestation (observation) of an event. For example, in Figure 6 b), the area around each arrow corresponds to a pattern which is instantiated as a spike event.
The module first looks specifically for patterns that correspond to a known set of medically important events such as bradycardia (rapid decrease in heart rate) and desaturation (fall in oxygen saturation). Many methods can be applied to detect such patterns: thresholding [21], statistical and model based detection methods [15,69], decision trees [66], etc. After a comparison of different techniques [66], we implemented a thresholding method to detect the events, together with an estimate of the baseline using a median filter to find the start and end time of the events.
The module then looks for other short-term patterns (in addition to the ones mentioned above) using a technique based on the rapid-change detector of the SumTime-Turbine project [91]. The algorithm searches for perturbations in a channel; these are cases when the difference between the maximum and minimum values within a short time period (currently 30 seconds) exceeds a threshold (currently 10% of the physiologically possible range of values in the channel). Adjacent perturbations are merged, and then the perturbation interval is classified either as a SPIKE, STEP, or OTHER-PATTERN depending on its starting and ending values.
We need to detect general short-term patterns because it is not possible to explicitly specify all medically important patterns. For example, in the case of a probe lifting as in Figure 6(b), the general pattern is a number of successive spikes of unknown number and magnitude. Creating a specific detector for probe lifting would be difficult, whereas detecting only spikes and reporting them (as in By 10:29 there had been 2 successive spikes in TcPO2 up to 18.1) lets the reader decide whether or not these spikes are related to a probe problem.
Finally, the module looks for long-term trends in the data - in the BT-45 context, "long-term" means on the time-scale of minutes instead of seconds. Currently we only look for value-increasing, value-decreasing, value-stable and value-varying trends; this is done using bottom-up segmentation [43] preceded by an accurate sliding window segmentation to speed up the process. This creates a piecewise linear approximation to the signal. The algorithm
1 http://biosig.sourceforge.net/
14
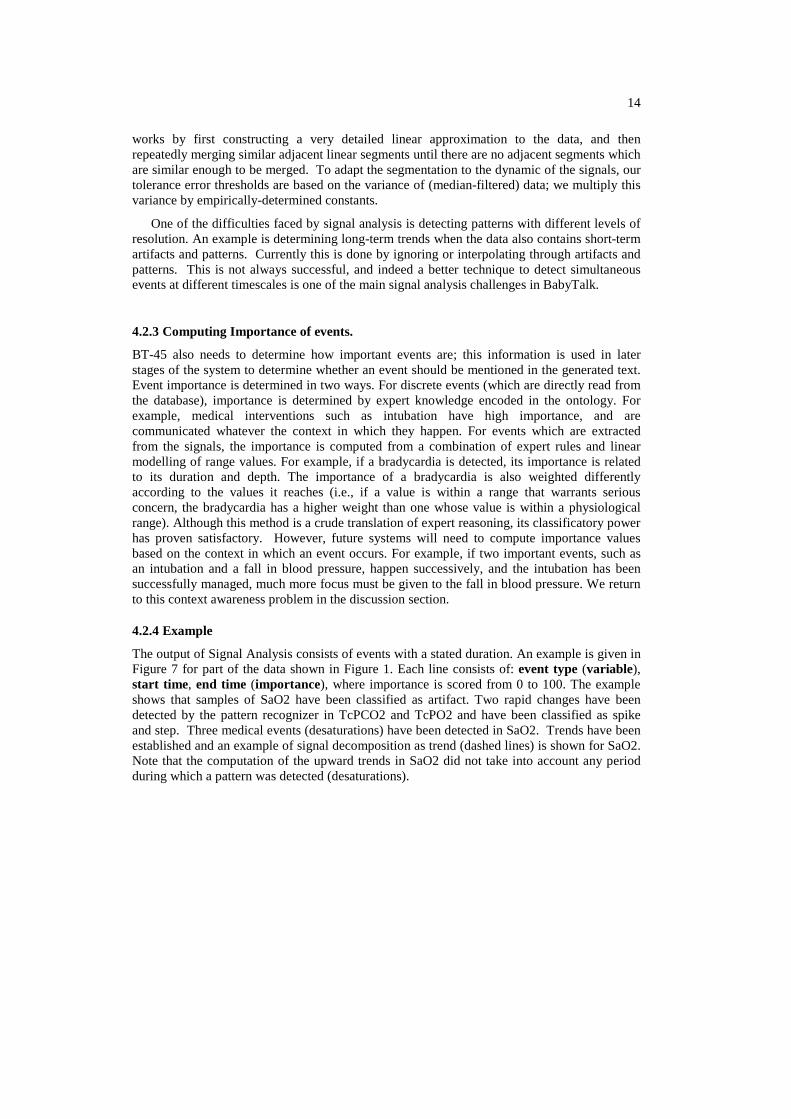
works by first constructing a very detailed linear approximation to the data, and then repeatedly merging similar adjacent linear segments until there are no adjacent segments which are similar enough to be merged. To adapt the segmentation to the dynamic of the signals, our tolerance error thresholds are based on the variance of (median-filtered) data; we multiply this variance by empirically-determined constants.
One of the difficulties faced by signal analysis is detecting patterns with different levels of resolution. An example is determining long-term trends when the data also contains short-term artifacts and patterns. Currently this is done by ignoring or interpolating through artifacts and patterns. This is not always successful, and indeed a better technique to detect simultaneous events at different timescales is one of the main signal analysis challenges in BabyTalk.
4.2.3 Computing Importance of events.
BT-45 also needs to determine how important events are; this information is used in later stages of the system to determine whether an event should be mentioned in the generated text. Event importance is determined in two ways. For discrete events (which are directly read from the database), importance is determined by expert knowledge encoded in the ontology. For example, medical interventions such as intubation have high importance, and are communicated whatever the context in which they happen. For events which are extracted from the signals, the importance is computed from a combination of expert rules and linear modelling of range values. For example, if a bradycardia is detected, its importance is related to its duration and depth. The importance of a bradycardia is also weighted differently according to the values it reaches (i.e., if a value is within a range that warrants serious concern, the bradycardia has a higher weight than one whose value is within a physiological range). Although this method is a crude translation of expert reasoning, its classificatory power has proven satisfactory. However, future systems will need to compute importance values based on the context in which an event occurs. For example, if two important events, such as an intubation and a fall in blood pressure, happen successively, and the intubation has been successfully managed, much more focus must be given to the fall in blood pressure. We return to this context awareness problem in the discussion section.
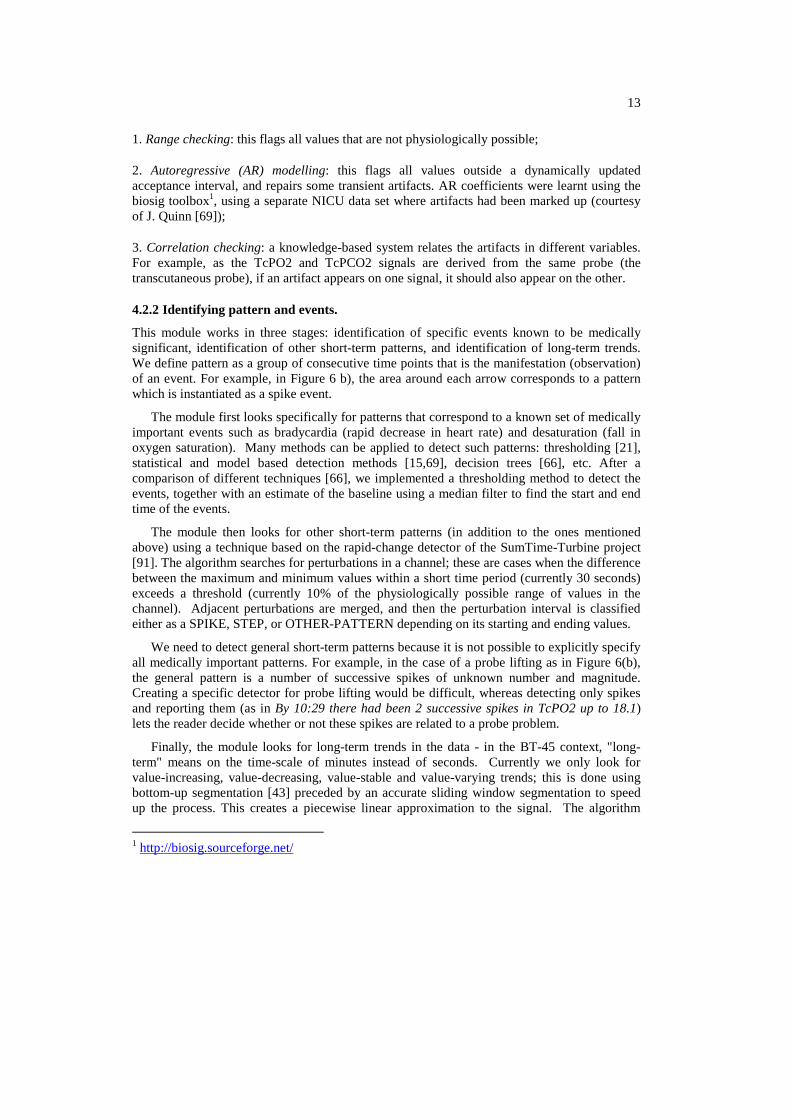
4.2.4 Example
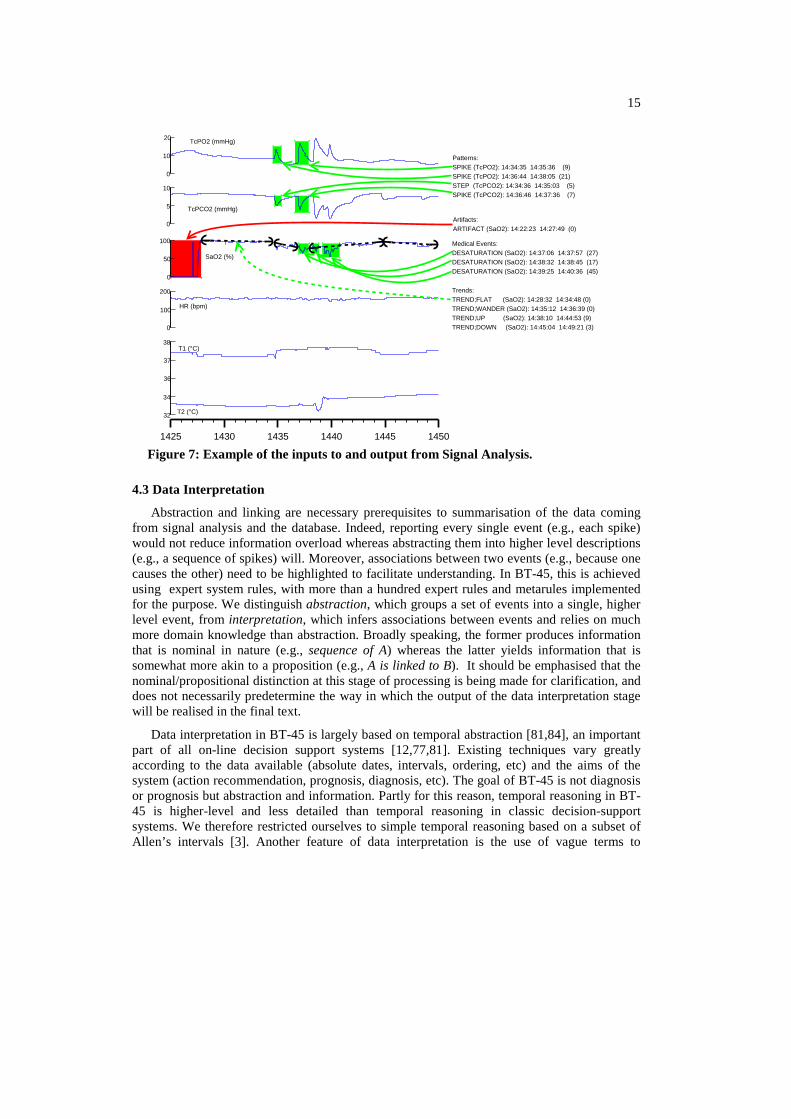
The output of Signal Analysis consists of events with a stated duration. An example is given in Figure 7 for part of the data shown in Figure 1. Each line consists of: event type (variable), start time, end time (importance), where importance is scored from 0 to 100. The example shows that samples of SaO2 have been classified as artifact. Two rapid changes have been detected by the pattern recognizer in TcPCO2 and TcPO2 and have been classified as spike and step. Three medical events (desaturations) have been detected in SaO2. Trends have been established and an example of signal decomposition as trend (dashed lines) is shown for SaO2. Note that the computation of the upward trends in SaO2 did not take into account any period during which a pattern was detected (desaturations).
15
0
100
200
HR (bpm)
36
37
38T1 (°C)
32
34
T2 (°C)
0
10
20 TcPO2 (mmHg)
0
5
10
TcPCO2 (mmHg)
0
50
100
SaO2 (%)
1425 1430 1435 1440 1445 1450
Artifacts:ARTIFACT (SaO2): 14:22:23 14:27:49 (0)
Patterns:SPIKE (TcPO2): 14:34:35 14:35:36 (9)SPIKE (TcPO2): 14:36:44 14:38:05 (21)STEP (TcPCO2): 14:34:36 14:35:03 (5)SPIKE (TcPCO2): 14:36:46 14:37:36 (7)
Medical Events:DESATURATION (SaO2): 14:37:06 14:37:57 (27)DESATURATION (SaO2): 14:38:32 14:38:45 (17)DESATURATION (SaO2): 14:39:25 14:40:36 (45)
Trends:TREND;FLAT (SaO2): 14:28:32 14:34:48 (0)TREND;WANDER (SaO2): 14:35:12 14:36:39 (0)TREND;UP (SaO2): 14:38:10 14:44:53 (9)TREND;DOWN (SaO2): 14:45:04 14:49:21 (3)
Figure 7: Example of the inputs to and output from Signal Analysis.
4.3 Data Interpretation
Abstraction and linking are necessary prerequisites to summarisation of the data coming from signal analysis and the database. Indeed, reporting every single event (e.g., each spike) would not reduce information overload whereas abstracting them into higher level descriptions (e.g., a sequence of spikes) will. Moreover, associations between two events (e.g., because one causes the other) need to be highlighted to facilitate understanding. In BT-45, this is achieved using expert system rules, with more than a hundred expert rules and metarules implemented for the purpose. We distinguish abstraction, which groups a set of events into a single, higher level event, from interpretation, which infers associations between events and relies on much more domain knowledge than abstraction. Broadly speaking, the former produces information that is nominal in nature (e.g., sequence of A) whereas the latter yields information that is somewhat more akin to a proposition (e.g., A is linked to B). It should be emphasised that the nominal/propositional distinction at this stage of processing is being made for clarification, and does not necessarily predetermine the way in which the output of the data interpretation stage will be realised in the final text.
Data interpretation in BT-45 is largely based on temporal abstraction [81,84], an important part of all on-line decision support systems [12,77,81]. Existing techniques vary greatly according to the data available (absolute dates, intervals, ordering, etc) and the aims of the system (action recommendation, prognosis, diagnosis, etc). The goal of BT-45 is not diagnosis or prognosis but abstraction and information. Partly for this reason, temporal reasoning in BT-45 is higher-level and less detailed than temporal reasoning in classic decision-support systems. We therefore restricted ourselves to simple temporal reasoning based on a subset of Allen’s intervals [3]. Another feature of data interpretation is the use of vague terms to
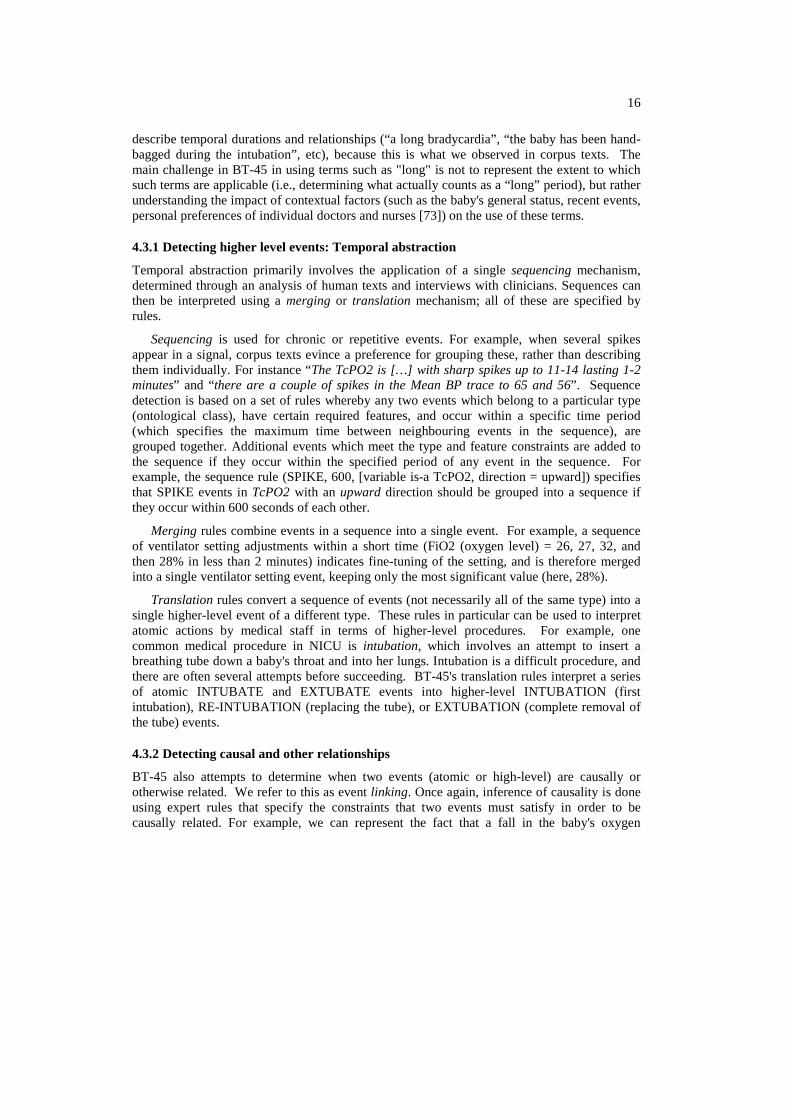
16
describe temporal durations and relationships (“a long bradycardia”, “the baby has been hand-bagged during the intubation”, etc), because this is what we observed in corpus texts. The main challenge in BT-45 in using terms such as "long" is not to represent the extent to which such terms are applicable (i.e., determining what actually counts as a “long” period), but rather understanding the impact of contextual factors (such as the baby's general status, recent events, personal preferences of individual doctors and nurses [73]) on the use of these terms.
4.3.1 Detecting higher level events: Temporal abstraction
Temporal abstraction primarily involves the application of a single sequencing mechanism, determined through an analysis of human texts and interviews with clinicians. Sequences can then be interpreted using a merging or translation mechanism; all of these are specified by rules.
Sequencing is used for chronic or repetitive events. For example, when several spikes appear in a signal, corpus texts evince a preference for grouping these, rather than describing them individually. For instance “The TcPO2 is […] with sharp spikes up to 11-14 lasting 1-2 minutes” and “there are a couple of spikes in the Mean BP trace to 65 and 56”. Sequence detection is based on a set of rules whereby any two events which belong to a particular type (ontological class), have certain required features, and occur within a specific time period (which specifies the maximum time between neighbouring events in the sequence), are grouped together. Additional events which meet the type and feature constraints are added to the sequence if they occur within the specified period of any event in the sequence. For example, the sequence rule (SPIKE, 600, [variable is-a TcPO2, direction = upward]) specifies that SPIKE events in TcPO2 with an upward direction should be grouped into a sequence if they occur within 600 seconds of each other.
Merging rules combine events in a sequence into a single event. For example, a sequence of ventilator setting adjustments within a short time (FiO2 (oxygen level) = 26, 27, 32, and then 28% in less than 2 minutes) indicates fine-tuning of the setting, and is therefore merged into a single ventilator setting event, keeping only the most significant value (here, 28%).
Translation rules convert a sequence of events (not necessarily all of the same type) into a single higher-level event of a different type. These rules in particular can be used to interpret atomic actions by medical staff in terms of higher-level procedures. For example, one common medical procedure in NICU is intubation, which involves an attempt to insert a breathing tube down a baby's throat and into her lungs. Intubation is a difficult procedure, and there are often several attempts before succeeding. BT-45's translation rules interpret a series of atomic INTUBATE and EXTUBATE events into higher-level INTUBATION (first intubation), RE-INTUBATION (replacing the tube), or EXTUBATION (complete removal of the tube) events.
4.3.2 Detecting causal and other relationships
BT-45 also attempts to determine when two events (atomic or high-level) are causally or otherwise related. We refer to this as event linking. Once again, inference of causality is done using expert rules that specify the constraints that two events must satisfy in order to be causally related. For example, we can represent the fact that a fall in the baby's oxygen
17
saturation is likely to lead nurses to increase oxygen levels in the ventilator using the declaration:
CAUSES(TREND, [channel is-a SaO2, direction = decreasing],
INSPIRED_OXYGEN_SETTING, [direction = increasing], 100).
This is translated by the system as: if a decreasing trend in oxygen saturation (SaO2) is followed within 100 seconds by an increase in inspired oxygen setting, then the inspired oxygen has been set because of the trend.
In addition to causal links, rules of this form infer INCLUDES (part-of) and ASSOCIATES (other correlation) relations. The former only play a role in associating events that have not already been linked by temporal abstraction. An example of an ASSOCIATES link is that overlapping spikes in TcPO2 and TcPCO2 are regarded as associated since they come from the same probe and are physiologically inversely correlated (decrease in TcPO2 is usually associated with an increase in TcPCO2, and vice-versa); however we cannot say that one of these spikes causes another (more likely some underlying physiological event has caused both).
BT-45's rules for detecting causal relationships are based on the pairs/follows rules used in the TIGER system for monitoring gas-turbines [91]. The TIGER developers experimented with much more complex causal reasoning mechanisms but eventually decided that simple rules based on the temporal proximity of events worked reasonably well, and could be understood by (and hence discussed with) domain experts. BT-45 differs from TIGER in that it interprets both data generated via sensors from humans, and data recorded by humans (discrete events). While behavioural models of systems being supervised can be constructed in the industrial domain, it is much harder to model patients in the far less controlled environment of the NICU. This means that fixed time limits (such as 100 seconds in the above rule) do not work as well as they did in TIGER. To reason with the uncertainty in the data and with the inaccuracy in their time recording, we are investigating temporal reasoning using Possibility Theory which is well suited to represent uncertainty in expert systems [23].

18
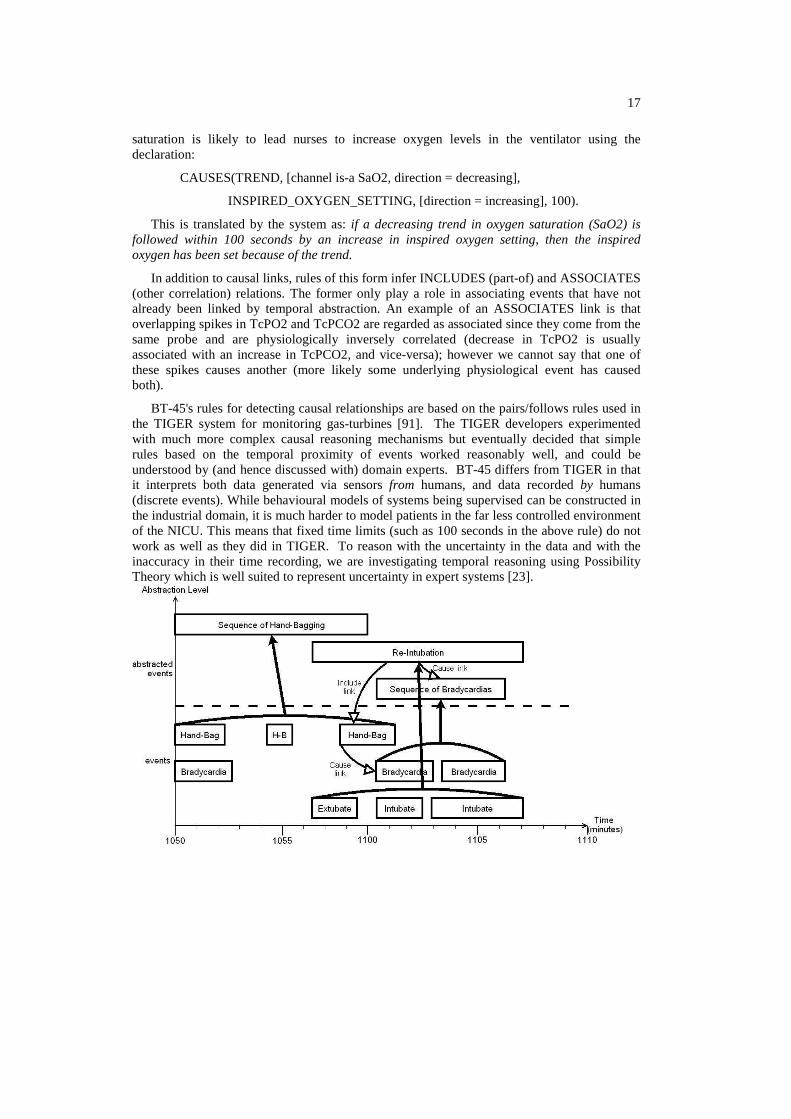
Figure 8: Result of data interpretation in one scenario in BT-45.
4.3.3 Example
Figure 8 shows a graphical time representation of events with their inferred abstractions/interpretations and relationships, with time on the X-axis and abstraction levels on the Y-axis. The first level below the bold dashed line represents non-abstracted events (direct instances from signal analysis and the input data), while the upper level above the dashed line represents events inferred by abstraction and interpretation. Two close bradycardias have been abstracted as a sequence of bradycardias and three hand-bagging events abstracted as a sequence. A RE-INTUBATION event has been interpreted from the sequence of EXTUBATE and INTUBATE events. As hand-bagging and intubation are likely to cause bradycardias, CAUSE links have been detected, and as intubation procedures often include hand-bagging, an INCLUDE link has been instantiated. These links are then used in the further modules to produce: “By 11:00 the baby had been hand-bagged a number of times causing 2 successive bradycardias. After 2 attempts she was re-intubated successfully.” In these sentences, the causal links (causing), the sequence of hand-bagging (hand-bagged a number of times) and the re-intubation interpretation (2 attempts, re-intubated successfully) have been fully exploited.
Figure 9 shows the result of the data interpretation for the example presented in Figure 7. A sequence of DESATURATIONs has been detected and linked to its elements. An adjustment in the oxygen supply (FiO2) is linked to the events in oxygen pressure (TcPO2) and saturation (SaO2). Trends in oxygen pressure (TcPO2) and saturation (SaO2) are associated with the changes in SaO2.
Event1 Link type Event2 SEQ (DESAT): 14:37:06 14:40:36 (55) SEQ (DESAT): 14:37:06 14:40:36 (55) SEQ (DESAT): 14:37:06 14:40:36 (55) FIO2 (32.0): 14:37:01 14:37:01 (21) FIO2 (32.0): 14:37:01 14:37:01 (21) FIO2 (32.0): 14:37:01 14:37:01 (21) FIO2 (32.0): 14:37:01 14:37:01 (21) TREND (SaO2):14:45:04 14:49:21 ( 3) TREND (SaO2):14:38:10 14:44:53 ( 9) STEP (SaO2): 14:34:50 14:35:08 ( 2)
INCLUDE INCLUDE INCLUDE CAUSE CAUSE CAUSE CAUSE CAUSE
ASSOCIATE ASSOCIATE
DESATURATION: 14:38:32 14:38:45 (17) DESATURATION: 14:39:25 14:40:36 (45) DESATURATION: 14:37:06 14:37:57 (27) TREND (TcPO2): 14:38:21 14:39:36 ( 3) TREND (SaO2): 14:38:10 14:44:53 ( 9) DESATURATION: 14:37:06 14:37:57 (27) DESATURATION: 14:38:32 14:38:45 (17) FIO2 (28.0): 14:46:03 14:46:03 (12) TREND (TcPO2): 14:38:21 14:39:36 ( 3) TREND (TcPCO2): 14:35:04 14:38:22 ( 6)
Figure 9: Result of linking for the events in Figure 7.
4.4 Document planning
The document planner takes as input the set of events and links produced by data interpretation, exemplified in Figure 9. Each such event constitutes a unit of information and the document planner decides which among these events should be communicated in the text. We will sometimes refer to the selected events as messages since, once selected, they form part of the communicative content of the text that is eventually realised. The document planner is also responsible for structuring the messages into paragraphs and determining the order within each paragraph. The resulting document plan is a tree whose nodes contain events (messages),
19
document structure information (such as paragraphs), and whose edges are labelled with rhetorical relations.
(root)sequence
(key event)
re-site
re-site
step (T2)
Trend(TcPO2)
FIO2
desat.
desat.
reason
SEQUENCE:DESATURATION:EXAMINE_BABY:TREND (HR): TREND (SaO2):TREND (TcPO2):TREND (T2):DESATURATION:RE-SITE_PROBES:RE-SITE_PROBES:TREND (TcPCO2):STEP (T2): DESATURATION:TREND (TcPO2):TREND (SaO2):FIO2:FIO2:
14:37:0114:37:01(21)14:37:0614:40:36(55)14:37:0614:37:57(27)14:37:0814:37:22(20)14:38:0314:49:16( 1)14:38:1014:44:53( 9)14:38:2114:39:36( 3)14:38:2914:38:56( 1)14:38:3214:38:45(17)14:38:5414:39:51 (20)14:38:5414:39:51 (20)14:38:5414:42:00 ( 5)14:38:5814:39:23 (16)14:39:2514:40:36 (45)14:40:1714:49:21 (12)14:45:0414:49:21 ( 3)14:46:0314:46:03 (12)14:49:3414:49:34 ( 6)
FIO2:
(vent.)
(temp.)
(other)
include
include
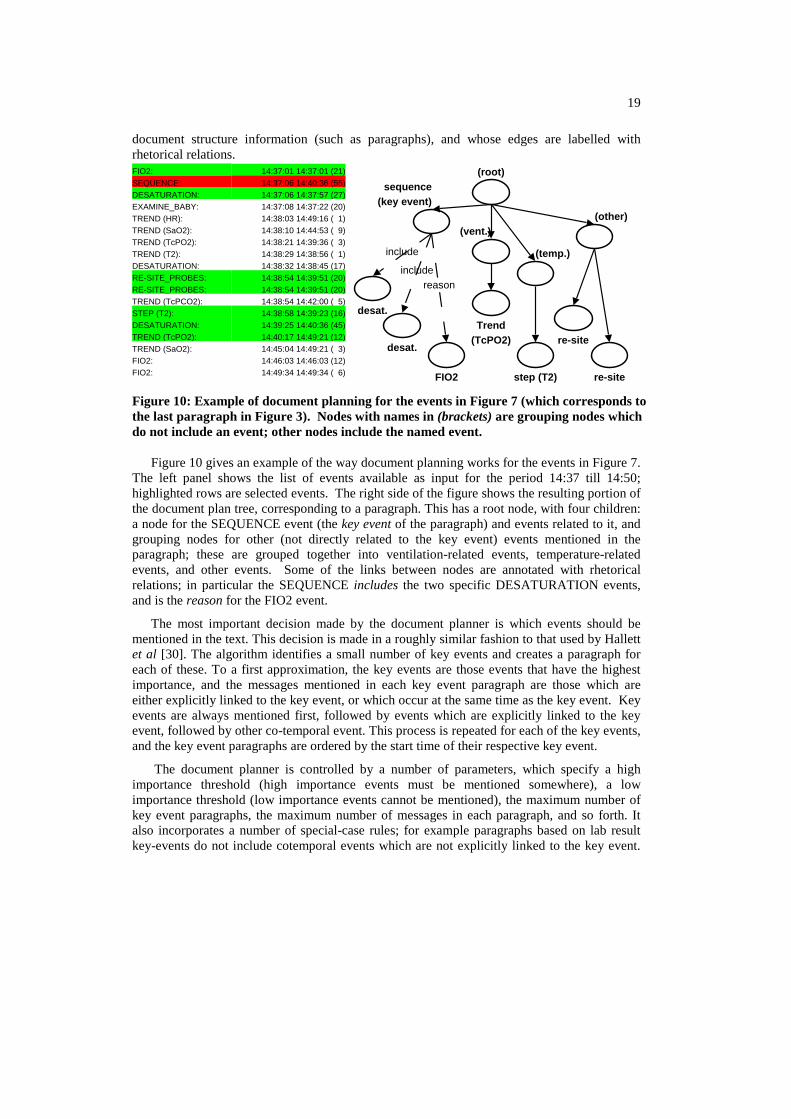
Figure 10: Example of document planning for the events in Figure 7 (which corresponds to the last paragraph in Figure 3). Nodes with names in (brackets) are grouping nodes which do not include an event; other nodes include the named event.
Figure 10 gives an example of the way document planning works for the events in Figure 7. The left panel shows the list of events available as input for the period 14:37 till 14:50; highlighted rows are selected events. The right side of the figure shows the resulting portion of the document plan tree, corresponding to a paragraph. This has a root node, with four children: a node for the SEQUENCE event (the key event of the paragraph) and events related to it, and grouping nodes for other (not directly related to the key event) events mentioned in the paragraph; these are grouped together into ventilation-related events, temperature-related events, and other events. Some of the links between nodes are annotated with rhetorical relations; in particular the SEQUENCE includes the two specific DESATURATION events, and is the reason for the FIO2 event.
The most important decision made by the document planner is which events should be mentioned in the text. This decision is made in a roughly similar fashion to that used by Hallett et al [30]. The algorithm identifies a small number of key events and creates a paragraph for each of these. To a first approximation, the key events are those events that have the highest importance, and the messages mentioned in each key event paragraph are those which are either explicitly linked to the key event, or which occur at the same time as the key event. Key events are always mentioned first, followed by events which are explicitly linked to the key event, followed by other co-temporal event. This process is repeated for each of the key events, and the key event paragraphs are ordered by the start time of their respective key event.
The document planner is controlled by a number of parameters, which specify a high importance threshold (high importance events must be mentioned somewhere), a low importance threshold (low importance events cannot be mentioned), the maximum number of key event paragraphs, the maximum number of messages in each paragraph, and so forth. It also incorporates a number of special-case rules; for example paragraphs based on lab result key-events do not include cotemporal events which are not explicitly linked to the key event.

20
These parameters and special-case rules were determined through a qualitative analysis of a corpus of expert-written texts described in Section 3.
In the example shown in Figure 10, the document planner picks the SEQUENCE event (which represents a sequence of desaturations) as the key event, since it has the highest importance (55). The document planner then adds to the SEQUENCE node the two most important components (DESATURATION) of the sequence, using an include relation; and other linked events, which in this case is just the FIO2 event (this in fact is linked to one of the components of the sequence, but from the document planner’s perspective, SEQUENCE events inherit their constituent’s links). The document planner then looks for other events at least moderate importance which overlap the key event temporally, and finds four such events: a TREND in TCPO2, a STEP in T2, and two RE-SITE_PROBE events. The document planner groups these into three physiological categories (Section 6.2.2): ventilation, temperature, and other. Within each system, events are ordered by their start time.
One of the hardest problems in document planning is dealing with events of very different durations. For example, in an earlier version of the algorithm, if a baby was undergoing phototherapy for an entire 45-minute period, this was mentioned in the first key event paragraph, but some readers thought this meant phototherapy ended when the other events in this paragraph ended, which was not true. We resolved this problem in a fairly straightforward fashion, by modifying the document planner so that long events (longer than a threshold which was in the 10-20 minute range) were expressed together in separate paragraphs. It is interesting that dealing with events of different temporal granularity, which was a major problem in signal analysis, also turned out to be a major problem in document planning.
From an NLG perspective, perhaps the main innovation in the BT-45 document planner is the key-event algorithm, and more generally the fact that the notion of a paragraph was treated as a primitive. In previous NLG systems, paragraphs have tended to either follow very strict patterns (e.g., one paragraph about medication, one paragraph about respiration, etc); or to be treated as an aggregation phenomenon. By contrast, paragraph formation is at the heart of BT-45's key-event algorithm, which dynamically produced paragraphs of varied length and content.
The evaluation of BT-45 pointed out a number of deficiencies in document planning, mostly related to the structure of the narratives it produces as a result of its processing strategy. We defer detailed discussion of these issues to Section 6.
4.5 Microplanning and realisation
The final stage in the BT-45 architecture in Figure 4 is microplanning and realisation. These are often considered to be separate NLG tasks [75]: microplanning “fleshes out” the linguistic content of a document plan (here, events/messages and their rhetorical relations), creating semantic representations which are then rendered into linguistic (syntactic) structures by the realisation module, to be finally linearised as text. However, we combine them into one stage, as in other data-to-text systems [72]. We will not go into details here about realisation, as this is a fairly straightforward mapping from semantic representations to syntax.
21
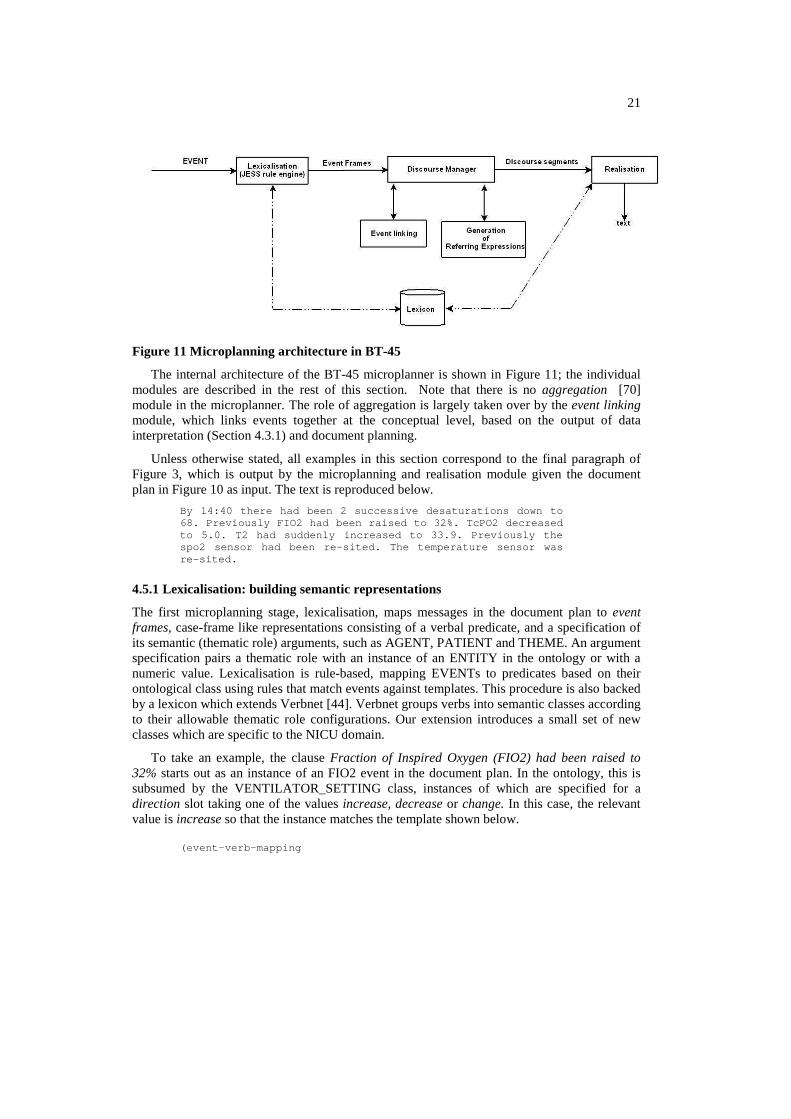
Figure 11 Microplanning architecture in BT-45
The internal architecture of the BT-45 microplanner is shown in Figure 11; the individual modules are described in the rest of this section. Note that there is no aggregation [70] module in the microplanner. The role of aggregation is largely taken over by the event linking module, which links events together at the conceptual level, based on the output of data interpretation (Section 4.3.1) and document planning.
Unless otherwise stated, all examples in this section correspond to the final paragraph of Figure 3, which is output by the microplanning and realisation module given the document plan in Figure 10 as input. The text is reproduced below.
By 14:40 there had been 2 successive desaturations down to 68. Previously FIO2 had been raised to 32%. TcPO2 d ecreased to 5.0. T2 had suddenly increased to 33.9. Previous ly the spo2 sensor had been re-sited. The temperature sens or was re-sited.
4.5.1 Lexicalisation: building semantic representations
The first microplanning stage, lexicalisation, maps messages in the document plan to event frames, case-frame like representations consisting of a verbal predicate, and a specification of its semantic (thematic role) arguments, such as AGENT, PATIENT and THEME. An argument specification pairs a thematic role with an instance of an ENTITY in the ontology or with a numeric value. Lexicalisation is rule-based, mapping EVENTs to predicates based on their ontological class using rules that match events against templates. This procedure is also backed by a lexicon which extends Verbnet [44]. Verbnet groups verbs into semantic classes according to their allowable thematic role configurations. Our extension introduces a small set of new classes which are specific to the NICU domain.
To take an example, the clause Fraction of Inspired Oxygen (FIO2) had been raised to 32% starts out as an instance of an FIO2 event in the document plan. In the ontology, this is subsumed by the VENTILATOR_SETTING class, instances of which are specified for a direction slot taking one of the values increase, decrease or change. In this case, the relevant value is increase so that the instance matches the template shown below. (event-verb-mapping
22
(event-class "VENTILATOR_SETTING") (verb-class "intentional_value_setting") (direction “increase”) (verb "raise"))
This specifies that a VENTILATOR_SETTING event should map to the verb raise in the case where its direction is increase. Other such events with a different direction feature would be covered by other rules (e.g. if the direction is decrease then the verb is lower). The verb belongs to the class intentional_value_setting in the extended Verbnet lexicon, from which it inherits three thematic roles, an AGENT (the person who set the value), a THEME (the thing which is set, here FIO2), and a VALUE (here, 32%). Values for these roles (which are instances of the ENTITY superclass) are specified as slots of the event instance itself (see Section 4.1), as is the numeric value. Event frames also hold information about the start and end times of the event.
Lexicalisation is generalised to deal with sequences of events that have been formed as part of data abstraction, by grouping these into a single event frame. Thus, the two desaturations are specified in the document plan as belonging to a single sequence (see also the example in Figure 10) are realised as there had been 2 successive desaturations down to 68, the result of mapping a sequence to a single frame, specifying the thematic roles, the predicate, and a cardinality of 2.
4.5.2 Event linking
The microplanner seeks to make explicit a number of the relations (links) between events in the document plan. Temporal relations are expressed using adverbials and tenses, a topic to which we turn in Section 4.5.4 below. Other kinds of links, especially causal and part-whole relations, are dealt with by the event linking module. There are a number of ways in which a causal link can be expressed, and the microplanner uses heuristics to choose between these. For example, if the target of a causal link is an event-frame realised as a non-existential, declarative clause, then this will be rendered as a separate clause, with the cue phrase as a result. An example can be seen in paragraph 2 of Figure 3, which contains the sentence As a result, Fraction of Inspired Oxygen (FIO2) was set to 45%. Conversely, existential clauses (e.g., there was a bradycardia) are realised as subordinate clauses (e.g., The baby was given morphine, causing a bradycardia). This is achieved by setting the subordinate event frame as a direct child of its parent, creating a complex event representation which is realised as a single clause (consisting of matrix and subordinate) by the realisation component. Part-whole relations expressed by the microplanner arise when a complex medical procedure is mentioned which involves multiple events. An example is an intubation, which may involve giving a dose of morphine to an infant. Such relations are expressed using adverbial phrases, for example, The baby was intubated. As part of this procedure, she was given 50mg of morphine.
4.5.3 Generation of referring expressions (GRE)
Following lexicalisation and linking, an event frame will contain a number of thematic roles which include pointers to domain entities, for which referring expressions need to be constructed. The GRE module handles four kinds of referring expressions.
23
Named entities: Named entities in the NICU domain include signals such as Heart Rate and Blood Pressure, as well as equipment parameters such as Fraction of Inspired Oxygen. BT-45 adopts the convention of always introducing these entities by their full name together with their acronym, if applicable (see for example paragraph 1 in Figure 3). When an acronym is available, all subsequent references to a named entity use the acronym.
Mass terms: Mass terms refer to substances such as morphine. References to these involve the name of the class (i.e., MORPHINE). If a quantity of the substance is specified (e.g., 50 mg), this is realised as a quantified noun phrase (e.g., 50mg of morphine).
Definite and indefinite noun phrases: These references are constructed by first selecting properties of entities from the ontology. The resulting semantic form is then mapped to a noun phrase (NP) at the realisation stage. The decision of whether or not to refer to an entity using a definite or indefinite NP depends on whether that entity is inherently identifiable or not. Entities such as the baby and the SPO2 sensor are assumed to always be unique in the domain of discourse, hence identifiable by a reader. Other types of entities (e.g., an IV line) in the ontology do not satisfy this criterion, as there are potentially many instances of these classes in the domain. These entities are therefore always introduced via an indefinite NP. For both definite and indefinite NPs, content determination is carried out using a version of Dale and Reiter’s Incremental Algorithm [19], generalised to deal with plurals [27].
Anaphoric reference: A salience-based algorithm [45] is used to determine whether entities should be referred to by pronouns. In practice, pronouns are extremely rare in BT-45 texts. However, salience is also useful in deciding on the use of determiners in indefinite NPs. For example, if a bradycardia is mentioned at a point in the text where a previously-mentioned bradycardia has high salience, then the determiner another is used when introducing the second bradycardia.
4.5.4 Discourse management and temporal coherence
One of the biggest challenges in BT-45 microplanning is the expression of time and temporal relations, which is handled by the discourse manager. Every event described by BT-45 has a start time and an end time, and the reader should be able to reconstruct from the text the order in which events occurred. The complication arises from the fact that narrative order is not isomorphic to temporal order, due to the importance-based (rather than time-based) heuristics which the document planner uses, and which the microplanner tries to respect. For instance, the penultimate clause in our running example (Previously the spo2 sensor had been re-sited) describes an event which was temporally prior to the event mentioned immediately before it. The text needs to convey this temporal information, otherwise it risks conveying false implicatures [59]. For example, should a reader falsely assume that one event occurred before another, their additional domain knowledge might also support the false conclusion that a causal relationship holds between them. It is somewhat surprising that, despite the substantial amount of work on temporal representation and reasoning in natural language understanding [7,51,62], this problem has received very little attention from the generation point of view.
The key event that forms the root of each paragraph is always expressed with an explicit mention of its start time, so that the each paragraph starts with a clear temporal grounding. Tenses and temporal adverbials are then used to indicate the relative temporal order of the events mentioned after the key event.
24
Tenses are computed using an implementation of the model proposed by Reichenbach [71]. Under this model, tense is viewed as anaphoric [61], insofar as the time at which an event is interpreted to have occurred depends not only on the actual event time (E), but also on its relation to the time of utterance, and a third temporal parameter, called the reference time (R). In the BT-45 model, the utterance time is used to determine simple tense distinctions (past/present/future). Since all events happen before the utterance time (the system clock time at the stage when a text is generated), they are always narrated in the past. Stylistically, this distinguishes the BT-45 texts from their human-authored counterparts (Figure 2), which tend to use the narrative present.
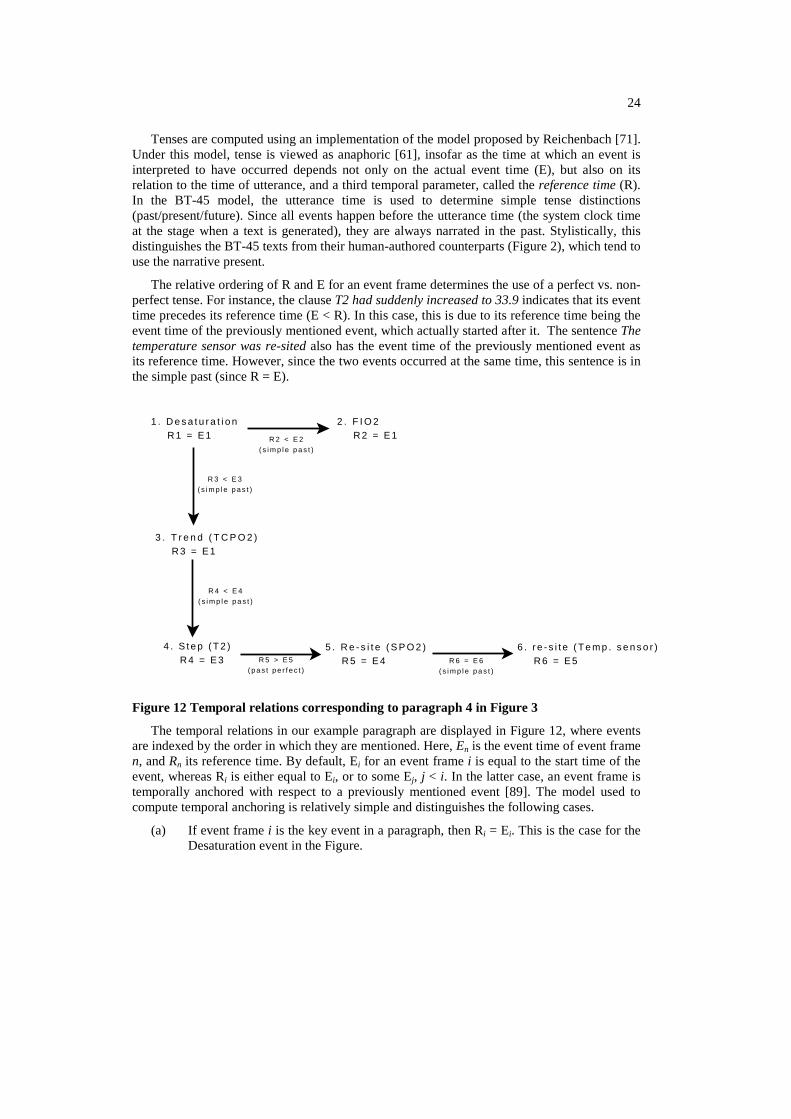
The relative ordering of R and E for an event frame determines the use of a perfect vs. non-perfect tense. For instance, the clause T2 had suddenly increased to 33.9 indicates that its event time precedes its reference time (E < R). In this case, this is due to its reference time being the event time of the previously mentioned event, which actually started after it. The sentence The temperature sensor was re-sited also has the event time of the previously mentioned event as its reference time. However, since the two events occurred at the same time, this sentence is in the simple past (since R = E).
1 . D e s a t u r a t i o n R 1 = E 1
2 . F I O 2 R 2 = E 1R 2 < E 2
( s i m p l e p a s t )
3 . T r e n d ( T C P O 2 ) R 3 = E 1
R 3 < E 3( s i m p l e p a s t )
R 4 < E 4( s i m p l e p a s t )
5 . R e - s i t e ( S P O 2 ) R 5 = E 4
6 . r e - s i t e ( T e m p . s e n s o r ) R 6 = E 5R 5 > E 5
( p a s t p e r f e c t )
4 . S t e p ( T 2 ) R 4 = E 3 R 6 = E 6
( s i m p l e p a s t )
Figure 12 Temporal relations corresponding to paragraph 4 in Figure 3
The temporal relations in our example paragraph are displayed in Figure 12, where events are indexed by the order in which they are mentioned. Here, En is the event time of event frame n, and Rn its reference time. By default, Ei for an event frame i is equal to the start time of the event, whereas Ri is either equal to Ei, or to some Ej, j < i. In the latter case, an event frame is temporally anchored with respect to a previously mentioned event [89]. The model used to compute temporal anchoring is relatively simple and distinguishes the following cases.
(a) If event frame i is the key event in a paragraph, then Ri = Ei. This is the case for the Desaturation event in the Figure.
25
(b) Otherwise, Ri = Ej, where j < i and one of the following conditions is satisfied:
i. j is an event which immediately dominates i in the document plan. For example, the sequence of desaturations dominates the FIO2 event in Figure 10, so that the event frame for FIO2 has the event time of the desaturation as its reference time.
ii. i has been linked to j by the event linking module, so that i is again subordinate to j.
iii. j is the most salient event frame previously mentioned; this is the case for all other events in Figure 12. Typically, the most salient event frame in the discourse is the last one mentioned (i.e., j = i-1).
The computation of reference time did not always result in an optimally coherent text, mainly because the above rules cause the reference time to shift considerably in the course of a paragraph. For example, the final three sentences are temporally ambiguous: the past perfect signals the fact that the step in T2 occurs prior to the TcPO2 trend, but the same tense is also used in the subsequent sentence (The SPO2 sensor had been re-sited). This does not successfully indicate whether the event occurred prior to the step in T2 or prior to the TcPO2 trend. Part of the reason for the continual shift in reference time is the recency-based model of event salience (where the most salient event is usually the previously mentioned one). One of our aims in future work is to refine this model. One plausible alternative is to fix the reference time in a paragraph, restricting it to the key event, to which all other events are related. Whether this will allow the reconstruction of the order of events in the discourse is an empirical question.
The choice of temporal adverbials, which are added to an event frame prior to realisation, is motivated by three considerations, namely, (a) whether the event frame corresponds to a key event (the first mentioned); (b) what type of event the frame represents; (c) whether its temporal anchoring is potentially ambiguous. Key events always have an absolute time-stamp in order to situate the time of the other events mentioned in the same paragraph. In the current example, the time of the key event is expressed as By 14:40 and this reflects the fact that the event is a sequence, so that it makes more sense to signal the time of its completion rather than its start time. Another example of how event type determines choice of adverbial is that of long trends, where the duration of the event is signalled, rather than its exact time (e.g., Over the next 20 minutes T2 decreased to 32.9). Temporal ambiguity can occur when two events mentioned in sequence are expressed using the same tense, but have different temporal anchors. As noted above, this is the case in our example paragraph with the sentences T2 had suddenly increased to 33.9. Previously the spo2 sensor had been re-sited. Here, the adverb previously is inserted to indicate that the re-siting of the SPO2 sensor had occurred prior to the step in T2. Though we do not claim that this is a successful disambiguation strategy, the use of the past perfect alone would arguably lead to even more ambiguity, as the re-siting event would be likely to be interpreted as having occurred after the step in T2.
One issue which is currently under investigation is related to the range of temporal relations handled by the microplanner. The BT-45 microplanner handles before and after temporal relations, but has difficulty in handling other primitive relations of the sort discussed by Allen [3], such as during. Dealing with these issues would require more linguistic knowledge and a finer-grained semantic representation, perhaps along the lines discussed by Vendler [88]. For

26
example, it is necessary to distinguish between different event types, such as occurrences, states and transitions, in order to block the expression of semantically odd temporal relations, such as a during relation holding between a process and a state (e.g., heart rate decreased while the baby was being blue). Moreover, events are frequently non-atomic, and can be decomposed into sub-events. This is especially true of medical interventions, which are usually composed of multiple procedures. Determining the time of such events depends on knowledge about which sub-part corresponds to the core of the event itself [55,68].
5 Experimental evaluation
BT-45 was evaluated during an experiment held between 6th November 2007 and 10th January 2008. For each 45 minute period (scenario), data were presented either graphically or as text. Doctors and nurses were asked to analyse the baby’s situation and to make decisions about the action(s) that should be taken at the end of the period. The experiment was carried out "off-ward" using historical data from babies who had been in the unit several years before; we did not ask clinicians to make decisions about the babies they were currently looking after. This in particular meant that the only information subjects had about the baby was what we told them, they could not visually observe the baby.
This section describes the chosen scenarios, the possible actions, the participants, the experimental set up and the software used for presenting the data. For additional details about the evaluation, see [87].
5.1 Materials We created 24 scenarios in which we tested clinician's decision making (plus two other scenarios which were only used for participant training). Each scenario consisted of approximately 45 minutes of data (both sensor data and event data), which preceded one of the following main target actions:
• adjust ventilation/ FiO2 • check/ adjust CPAP • extubate • manage temperature • (check) monitoring equipment • no action • suction • support blood pressure
These actions were selected to ensure a spread of different types of scenario that appear routinely on the ward. For each scenario, we also identified other appropriate actions (i.e., beneficial to the baby), neutral actions (i.e., useless but harmless), and inappropriate actions (i.e., potentially harmful). In total, 18 possible actions (including ‘no action’) were identified.
Three presentations of each scenario were prepared: graphs (G), human authored text (H) or computer generated text (C). We also asked our human experts to write a short 'background' text giving the age and gestation of the baby and any significant events preceding the start of the scenario.
27
In the graphical presentation (G), physiological data were displayed as line graphs, such as that in Figure 1. In order to avoid presentational overload, only the discrete events mentioned in the human-authored texts were presented. These texts (H) were written by a consultant neonatologist and two experienced neonatal nurses, who initially produced a descriptive summary of each scenario independently, and then produced a single consensus summary. The summaries were written to be descriptive and to avoid explicit direction or medical diagnosis and/or use of any judgmental language (e.g., the heart rate was ‘normal’ or the blood pressure was ‘worrying’). Another project member checked the texts to ensure they did not contain interpretative information. The computerized texts (C) were generated using BT-45 on a database containing all of the data (continuous and discrete) that was available to the human experts in writing their texts. The texts were checked to avoid bugs that could be fixed before the experiment and to verify that all the terms used were consistent with the one used by the experts. No alterations were made to the texts apart from (i) one term that needed to be changed because of changes in medical practice in the NICU (HAND-BAG_BABY had been replaced by GIVE_NEOPUFF_VENTILATION) and (ii) two terms which were not available in the agreed ontology (WIPE_INCUBATOR and ADJUST_VENTILATOR_TUBING).
The mean length of the 26 (24 scenarios+ 2 training scenarios) human authored texts was 135 words (sd = 79); for the computer generated texts it was 119 words (sd = 36). According to the Wilcoxon signed rank test they are not significantly differently distributed, (z = -.588, p = .493). Linear regression shows a positive gradient (1.575), with computer text length explaining 51.1% (R²=0.511) of the variation in human text length. The human texts were therefore overall more wordy than the computer texts but with more variability. The positive gradient shows that they shared the same trend (i.e., when human text is longer, so is the computer text).
5.2 Participants
The participants consisted of 35 staff members working in the NICU at the Royal Infirmary of Edinburgh. They were allocated to one of four groups, depending on role and experience in neonatal care: Senior Doctors SD (n=9), Junior Doctors JD (n=9), Senior Nurses SN (n=9), or Junior Nurses JN (n=8). Those with one year or less of experience in their specialty were classified as junior; those with 8 years or more were classified as senior. Participants were chosen in this way to have a clear separation between juniors and seniors (as designated by years of experience and role within the unit). It is worth emphasising that all participants were qualified in neonatal intensive care and therefore had demonstrated both knowledge and skill in performing the procedures that were listed as possible target actions in the scenarios. For example, while nurses typically do not take the primary decision to extubate an infant (extubation being one of the possible actions among the 18 listed in the experimental scenarios), they are the ones who typically perform the extubation.
5.3 Methodology
The 24 scenarios were divided into three sets; each set contained exactly one scenario for each main target action. Each participant saw one set presented graphically (G), one other set presented using human texts (H), and one other set presented using computer texts (C). The materials were counterbalanced using a Latin square design, so that each scenario was seen by an equal number of participants in each condition. The order of presentation of the individual
28
scenarios within each set was randomized and different for each participant. The participants were not informed of the origin of the texts (i.e., human or computer); nor were they explicitly told that some of the texts might be computer generated. Participants were informed that experimental data would be stored and analysed anonymously and would not be used for staff assessment. The experiment was conducted in a quiet room away from the ward in three sessions. The participants received training at the beginning of each session to ensure that they were familiar with the software, the possible actions and the use of the mouse. For each scenario they were asked to imagine that the period covered led to the present time and that they had to select appropriate action(s) that should be taken. Each scenario had to be analyzed in not more than 3 minutes in order to impose some realistic time pressure and to guarantee the maximum length of the experimental session. Participants were not formally asked to provide feedback but any spontaneous feedback was recorded anonymously.
The data were presented using a modified version of the Time Series Workbench (TSW)[37]. This program was run on a laptop computer under Windows XP Professional, and presented on an external (17 inch) monitor at a resolution of 1280 x 1024 pixels. Figure 13 shows an example screenshot in the G condition (in the C and H conditions, a text would replace the graphic in the right-hand panel). This example corresponds to the data shown in Figure 1. The background texts described in section 5.1 were presented in the left hand panel in the same way for all conditions. In the graphical condition, the user could click with the mouse on the continuous data to generate a ‘pop up’ box displaying the actual value and time. Beneath the time series were coloured icons indicating events that occurred on the ward when the babies were originally observed; the user could click on these icons to see which event it was.
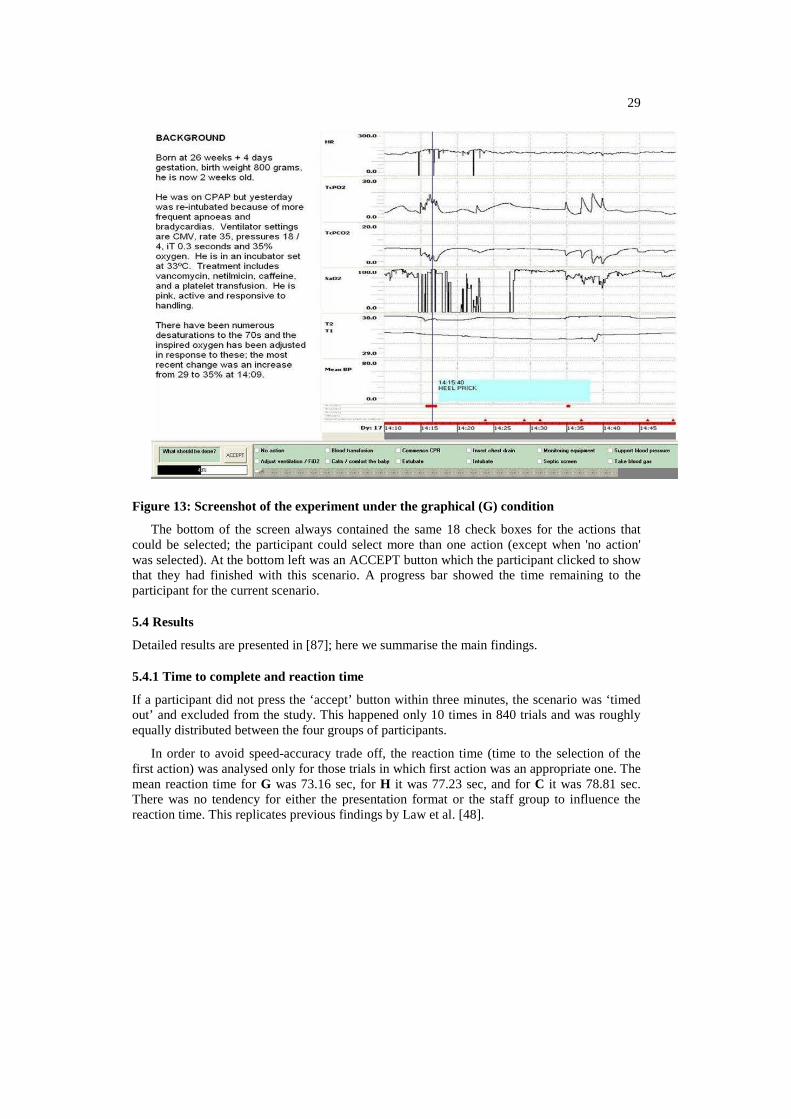
29
Figure 13: Screenshot of the experiment under the graphical (G) condition
The bottom of the screen always contained the same 18 check boxes for the actions that could be selected; the participant could select more than one action (except when 'no action' was selected). At the bottom left was an ACCEPT button which the participant clicked to show that they had finished with this scenario. A progress bar showed the time remaining to the participant for the current scenario.
5.4 Results
Detailed results are presented in [87]; here we summarise the main findings.
5.4.1 Time to complete and reaction time
If a participant did not press the ‘accept’ button within three minutes, the scenario was ‘timed out’ and excluded from the study. This happened only 10 times in 840 trials and was roughly equally distributed between the four groups of participants.
In order to avoid speed-accuracy trade off, the reaction time (time to the selection of the first action) was analysed only for those trials in which first action was an appropriate one. The mean reaction time for G was 73.16 sec, for H it was 77.23 sec, and for C it was 78.81 sec. There was no tendency for either the presentation format or the staff group to influence the reaction time. This replicates previous findings by Law et al. [48].
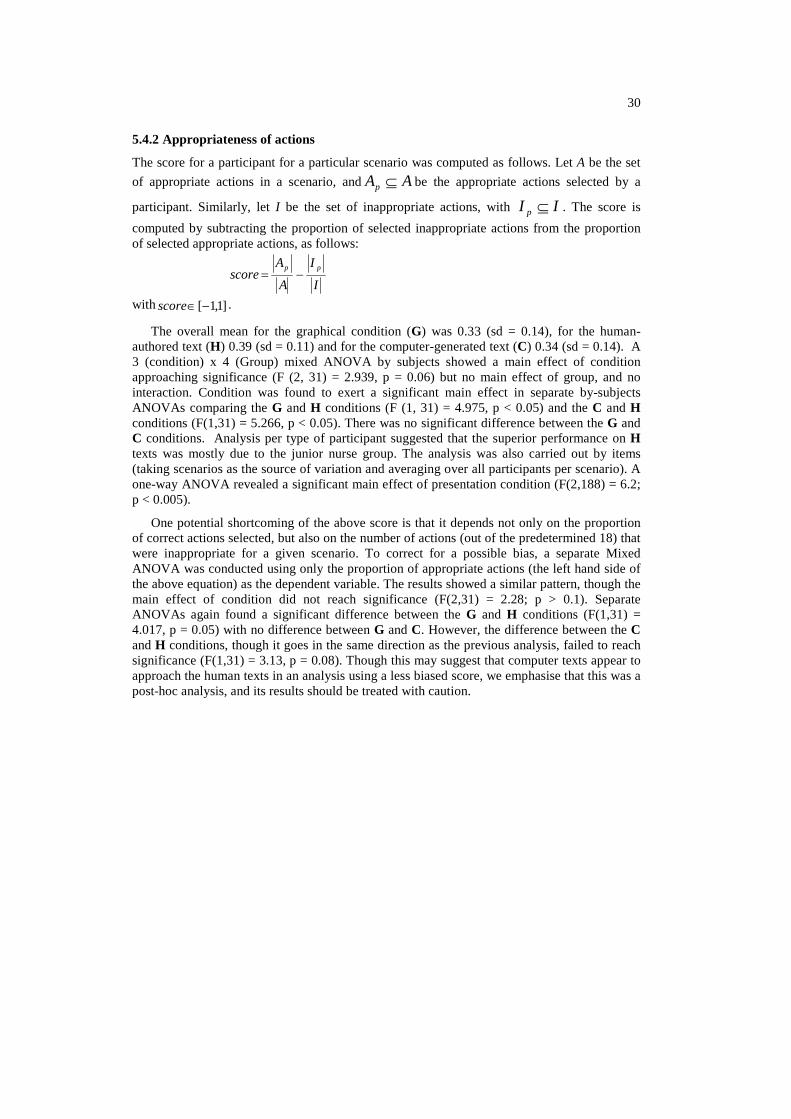
30
5.4.2 Appropriateness of actions
The score for a participant for a particular scenario was computed as follows. Let A be the set
of appropriate actions in a scenario, and AAp ⊆ be the appropriate actions selected by a
participant. Similarly, let I be the set of inappropriate actions, with II p ⊆ . The score is
computed by subtracting the proportion of selected inappropriate actions from the proportion of selected appropriate actions, as follows:
I
I
A
Ascore
pp−=
with ]1,1[−∈score .
The overall mean for the graphical condition (G) was 0.33 (sd = 0.14), for the human-authored text (H) 0.39 (sd = 0.11) and for the computer-generated text (C) 0.34 (sd = 0.14). A 3 (condition) x 4 (Group) mixed ANOVA by subjects showed a main effect of condition approaching significance (F (2, 31) = 2.939, p = 0.06) but no main effect of group, and no interaction. Condition was found to exert a significant main effect in separate by-subjects ANOVAs comparing the G and H conditions (F (1, 31) = 4.975, p < 0.05) and the C and H conditions (F(1,31) = 5.266, p < 0.05). There was no significant difference between the G and C conditions. Analysis per type of participant suggested that the superior performance on H texts was mostly due to the junior nurse group. The analysis was also carried out by items (taking scenarios as the source of variation and averaging over all participants per scenario). A one-way ANOVA revealed a significant main effect of presentation condition (F(2,188) = 6.2; p < 0.005).
One potential shortcoming of the above score is that it depends not only on the proportion of correct actions selected, but also on the number of actions (out of the predetermined 18) that were inappropriate for a given scenario. To correct for a possible bias, a separate Mixed ANOVA was conducted using only the proportion of appropriate actions (the left hand side of the above equation) as the dependent variable. The results showed a similar pattern, though the main effect of condition did not reach significance (F(2,31) = 2.28; p > 0.1). Separate ANOVAs again found a significant difference between the G and H conditions (F(1,31) = 4.017, p = 0.05) with no difference between G and C. However, the difference between the C and H conditions, though it goes in the same direction as the previous analysis, failed to reach significance (F(1,31) = 3.13, p = 0.08). Though this may suggest that computer texts appear to approach the human texts in an analysis using a less biased score, we emphasise that this was a post-hoc analysis, and its results should be treated with caution.
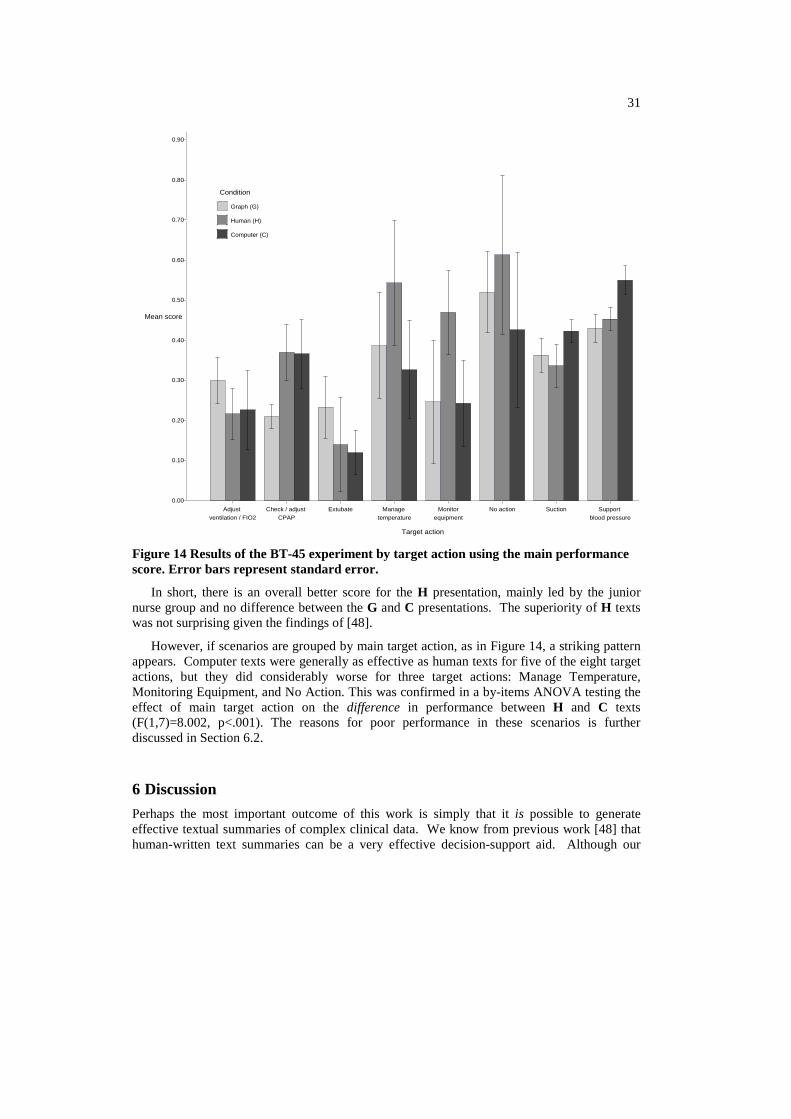
31
Condition
Human (H)
Computer (C)
Graph (G)
0.80
0.60
0.40
0.20
0.00
Adjust ventilation / FIO2
Mean score
Check / adjust CPAP
Extubate
Target action
Manage temperature
Monitorequipment
No action Suction Support blood pressure
0.10
0.30
0.50
0.70
0.90
Figure 14 Results of the BT-45 experiment by target action using the main performance score. Error bars represent standard error.
In short, there is an overall better score for the H presentation, mainly led by the junior nurse group and no difference between the G and C presentations. The superiority of H texts was not surprising given the findings of [48].
However, if scenarios are grouped by main target action, as in Figure 14, a striking pattern appears. Computer texts were generally as effective as human texts for five of the eight target actions, but they did considerably worse for three target actions: Manage Temperature, Monitoring Equipment, and No Action. This was confirmed in a by-items ANOVA testing the effect of main target action on the difference in performance between H and C texts (F(1,7)=8.002, p<.001). The reasons for poor performance in these scenarios is further discussed in Section 6.2.
6 Discussion
Perhaps the most important outcome of this work is simply that it is possible to generate effective textual summaries of complex clinical data. We know from previous work [48] that human-written text summaries can be a very effective decision-support aid. Although our
32
computer-generated textual summaries are not as good as human-written summaries, they are as effective as computer-generated graphical visualisations, which is an encouraging result after only one year of development. Since the technology for generating textual summaries of data sets is still very new, we expect data-to-text systems to approach the effectiveness of human-written text summaries over the next few years.
In order to help us understand which aspects of the computer texts caused them to be less effective than the human texts, we analysed the differences in some depth. Of course we were aware of a large number of ways in which BT-45 could be improved; the goal of this analysis was to identify which of these improvements would be most likely to make the system more effective.
6.1 Comments by Subjects
Subjects were not explicitly asked for free-text comments, but a number of them volunteered comments, which we recorded. Apart from minor issues relating to text layout, the main aspect of the BT-45 texts that was criticised by two or more subjects was related to what we call continuity. BT-45 in some cases described changes in signals in ways which didn't make sense. For example, the BT-45 text in Figure 3 initially states that T1 is 37.7, and that TcPO2 is 5.8, and then states that T1 increased to 37.3, and TcPO2 decreased to 8.4
This problem is mainly caused by BT-45's bottom-up content-determination strategy. If we look at the actual TcPO2 trace in Figure 1, we can see that TcPO2 rose between 14.15 and 14.17, to a peak value of around 20, before it decreased to 8.4. BT-45's importance rules assigned more importance to the fall in TcPO2 than to the preceding rise, which meant that the fall was mentioned in the text but not the rise.
We call this problem continuity, alluding to the phrase used by filmmakers for the problem of ensuring that neighbouring scenes in a film are consistent with each other. Some of the human texts also seemed to have continuity problems, but none of the subjects complained about this; which suggests that some kinds of continuity violations are more problematical than others (perhaps this depends on the proximity of the events in both time and the document structure).
One way of dealing with continuity problems is to explicitly identify and fix them; another is to use a more top-down approach document planning.
6.2 Scenarios where computer texts did badly
We have pointed out that the computer-generated texts did considerably worse than the human texts for three target actions: Manage Temperature, Monitoring Equipment, and No Action. Analysing the reasons for this failure highlights additional problem areas for BT-45.
6.2.1 Too much focus on medical importance
Content-selection in BT-45 is based on rules that assess the medical importance of events and signal changes. BT-45's importance rules de-emphasise signal changes which are probably due to sensor problems, and not physiologically real. While this is appropriate in most cases, one of the target actions (Monitor Equipment) is to check, reapply and adjust sensors in order to reduce sensor problems; in fact this is the target action for the scenario presented in Figure 1,

33
Figure 2, and Figure 3. Note that the human text (Figure 2) explicitly refers to artifacts and mentions spikes to implausible values:
At 14:15 hours a heel prick is done. The HR increases at this point and for 7 minutes from the start of this procedure there is a lot of artifact in the oxygen saturation trace.
The BT-45 text (Figure 3), in contrast, does not mention these because BT-45 has (correctly) identified these as sensor artefacts, and hence decided to ignore them; this means that readers of the BT-45 texts are less likely to realise that equipment must be adjusted.
This is a difficult problem to solve, because in a context where medical intervention was needed, BT-45 would be correct to ignore the sensor problems. One solution would be for BT-45 to perform a top-level diagnosis itself, and adjust its texts based on whether it believed staff should focus on medical intervention or adjusting sensors. Whether this is desirable or even feasible is unclear; it relates to the more general issue of how a data-summarisation system such as BT-45 should be integrated with a medical diagnosis system.
6.2.2 Poor Description of Related Variables
BT-45 describes each physiological variable more or less independently. For temperature, however, it is probably better to describe the two temperature channels together and even contrast them, which is what the human texts do; this probably contributes to BT-45's poor performance in Manage Temperature scenarios. This can be clearly seen in the example texts. The human text shown in Figure 2 either describes T1 and T2 together (e.g., "By 14:50 T1 is 37.5º and T2 is 34.2ºC"), or describes the gap between the two ("By 14:38 the toe-core gap has widened to >4º"); in either case the reader gets an integrated picture of the temperature system. The BT-45 text shown in Figure 3, in contrast, frequently refers to either T1 or T2 without making any reference to the other temperature channel.
BT-45's document planner is mostly driven by medical importance and causal relationships. Although it does try to group together information about related channels, this is done as a secondary optimisation, not as a primary organising principle. The human texts place a much higher priority on grouping 'physiological systems' (to use NICU terminology) of related channels and events together, including the respiratory and cardiac systems as well as the temperature system. We suspect that BT-45 should place more emphasis on systems in its document planning.
6.2.3 Poor Long-Term Overview
BT-45 is better at describing short-term changes and patterns than longer-term ones; it is probably least satisfactory when it tries to summarise what happens to a channel over an entire scenario. This isn't a major problem in eventful scenarios when the key is to describe the events, but it does mean that BT-45 does not do well in uneventful scenarios when the target action is No Action (i.e., do nothing).
This problem is due to deficiencies in both signal analysis and linguistic processing. From a signal analysis perspective, humans do a better job of detecting long-duration patterns. For example, the human text describes the blood pressure data in Figure 15 by saying
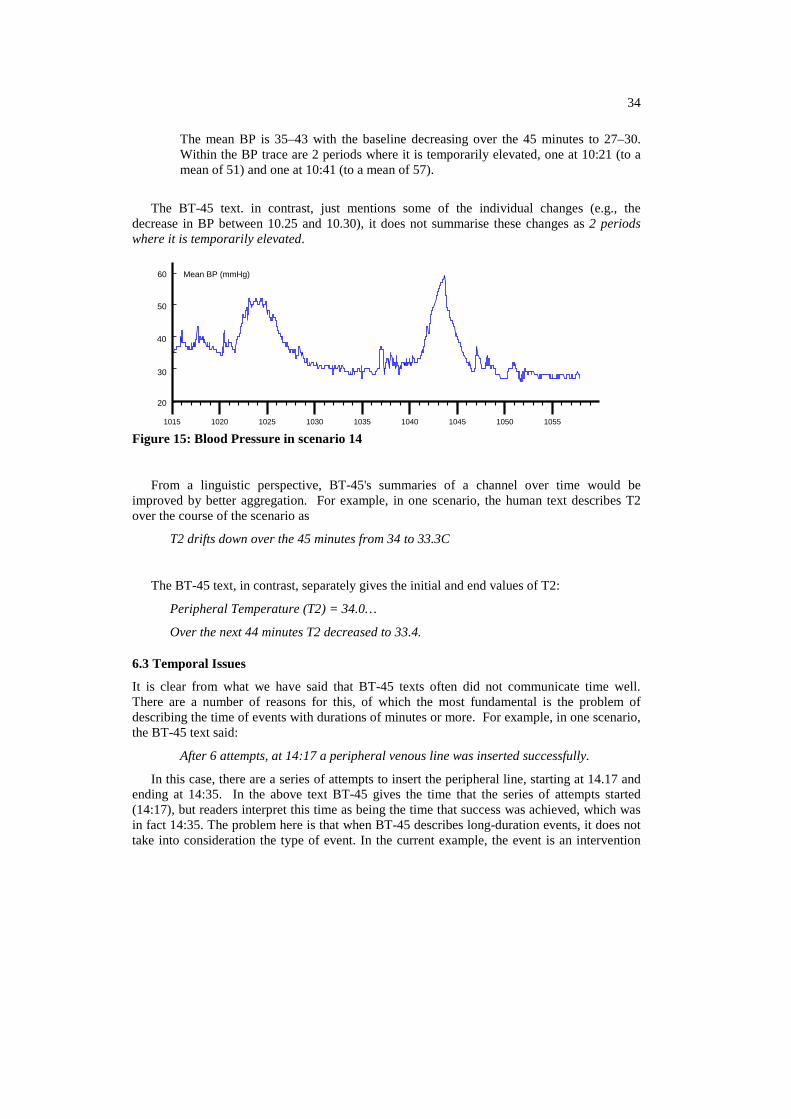
34
The mean BP is 35–43 with the baseline decreasing over the 45 minutes to 27–30. Within the BP trace are 2 periods where it is temporarily elevated, one at 10:21 (to a mean of 51) and one at 10:41 (to a mean of 57).
The BT-45 text. in contrast, just mentions some of the individual changes (e.g., the decrease in BP between 10.25 and 10.30), it does not summarise these changes as 2 periods where it is temporarily elevated.
1015 1020 1025 1030 1035 1040 1045 1050 1055
20
40
60 Mean BP (mmHg)
30
50
Figure 15: Blood Pressure in scenario 14
From a linguistic perspective, BT-45's summaries of a channel over time would be improved by better aggregation. For example, in one scenario, the human text describes T2 over the course of the scenario as
T2 drifts down over the 45 minutes from 34 to 33.3C
The BT-45 text, in contrast, separately gives the initial and end values of T2:
Peripheral Temperature (T2) = 34.0…
Over the next 44 minutes T2 decreased to 33.4.
6.3 Temporal Issues
It is clear from what we have said that BT-45 texts often did not communicate time well. There are a number of reasons for this, of which the most fundamental is the problem of describing the time of events with durations of minutes or more. For example, in one scenario, the BT-45 text said:
After 6 attempts, at 14:17 a peripheral venous line was inserted successfully.
In this case, there are a series of attempts to insert the peripheral line, starting at 14.17 and ending at 14:35. In the above text BT-45 gives the time that the series of attempts started (14:17), but readers interpret this time as being the time that success was achieved, which was in fact 14:35. The problem here is that when BT-45 describes long-duration events, it does not take into consideration the type of event. In the current example, the event is an intervention

35
which is successful; hence, the use of the end time would be justified, as it is in fact the time at which the insertion was achieved. This would not be justified in case the insertion was unsuccessful. It is interesting that the above time phrase would probably have been acceptable if the sequence of attempts was described differently:
At 14:17, 6 attempts were made to insert a peripheral venous line, the last of which was successful.
BT-45 needs a much better model of how to communicate time, and how this communication depends on the semantics and linguistic expression of the events being described. An obvious first step, which we are currently working on, is to include a linguistically-motivated temporal ontology [55], which will be separate from the existing domain ontology. We also need better techniques for communicating the temporal relationships between events in cases where they are not listed in chronological order [59].
One theme which runs through much of the previous discussion is that of temporal granularity. The technology developed for producing textual descriptions of ICU data was aimed at processing around 45 minutes in order to reproduce the previous experiment [48]. We have also tested BT-45 with scenarios spanning a day or a week and the system was able to process this amount of data in a reasonable time (a few minutes). However, the way information was extracted and reported still presupposes a time resolution of 45 minutes. For example, in a report covering a week, details about an intubation (hand-bagging, morphine, etc.) were reported whereas they should be summarised as On May 15th the baby was successfully intubated. This is a well known problem in data abstraction. Rather than fixing the level of abstraction, this needs to be dynamically determined by the period of data to be analysed, reporting low-level abstractions in case a user selects a short period (e.g., FiO2 was increased to 24%, at 14:25 it was decreased to 18%.), with higher-level abstractions for longer periods (FiO2 varied between 18% and 36% over the period).
6.4 Narrative structure
Two discourse analysts from the University of Edinburgh, Dr Andrew McKinlay and Dr Chris McVittie, kindly agreed to examine and compare some of the human and BT-45 texts. Their top-level comment was that the human texts had much better narrative structures than the BT-45 texts. They use the term 'narrative' in the sense of Labov [47]; that is, story-like structures which describe real experiences, and which go beyond just describing the events and include information that helps listeners make sense of what happened, such as abstracts, evaluatives, correlatives, and explicatives.
The above observation might be taken to imply that the narrative superiority of the human texts may be due to their implicitly containing more interpretation than the machine-generated texts, because of superior domain-knowledge. This raises an important issue, namely, the extent to which the superiority of one presentation modality (such as text) over another (such as graphics) may depend in part on the expertise (and hence the interpretive capacity) of an author. Evaluating this could involve, for example, a version of our experimental design which manipulated the level of expertise of the authors of the human-written texts. Though this was beyond the scope of the present study, it remains an interesting avenue for future exploration.
36
Nevertheless, many of the issues raised by Dr McKinlay and Dr McVittie had to do with linguistic and presentational features of the machine-generated texts, including many of those mentioned above. Indeed, it is striking how many of these (continuity, describing related information better, long-term overview, describing time) are aspects of narrative generation. They also pointed out a number of other narrative deficiencies in the BT-45 texts, the most fundamental being that the human texts did a much better job of linking related events into a coherent whole. In addition, BT-45 texts lacked a conclusion, whereas many of the human texts did try to "wrap up" in some fashion, even if only to describe the baby's status at the end of the period. For example, the human text in Figure 2 ends with a description of temperature at the end of the scenario (14:50), while the BT-45 text in Figure 3 says nothing about the state of the baby at 14.50.
This concern with narrative is especially significant in light of the fact that many of our medical collaborators at Edinburgh have told us that they believe stories are valuable when presenting information about the babies, and indeed that a major problem with contemporary data visualisation systems, compared to the older system of written notes, is that neither the visual chart presentation nor the summary generated from form-filling tells stories. This is supported by Strople and Ottani [85] which emphasized that one of the ancillary (but nonetheless important) purposes of medical summaries is education: computerised data management systems must preserve this as much as possible. Junior nurses and doctors are not always aware of causal links between events, and stories make some of the cause-consequence links between events explicit.
We believe that there is a lot of merit in this comment, and indeed that a good top-level summary of BT-45's deficiencies is that it needs to produce better narratives. There has been research on generating narratives in the computational creativity community, although this focused on generating fictional stories, and hence largely addressed issues such as character development [64], which are perhaps not that important in the BT-45 context of generating narratives about non-fictional events, for the purpose of decision support. Regardless, one of our objectives for the future is to establish better links with creativity researchers interested in narrative generation. Previous research on narrative in the NLG community has focused on detailed microplanning issues [9], although unfortunately not on the temporal expression issues which are perhaps the hardest microplanning challenge in BT-45.
7 Future Work
7.1 Future BabyTalk systems
In the remainder of the BabyTalk project, we will try to develop four other systems which will generate texts from NICU data for various users and tasks; these systems will be based on a core software framework (BT-Core) which is largely based on the BT-45 architecture and modules described above. All of the future BabyTalk systems will restrict their input to data that is routinely recorded or automatically acquired in the hospital, in a few cases supplemented by a small amount of additional information about parents, acquired via a questionnaire.

37
BT-Nurse will generate descriptions of NICU data which will be included in end-of-shift nursing summaries. These summaries will describe 12 hours of data, and are intended to give incoming nurses information about what happened on the previous shift.
BT-Doc will provide summaries of several hours of NICU data, on demand, to help medical staff (especially junior doctors) make good decisions about interventions. It has a similar motivation to BT-45, but will generate summaries that describe longer data periods; hence it will probably need to use high-level abstractions of the data.
BT-Parent [50] will generate summaries of NICU data for parents, to help them understand what is happening, possibly reducing anxiety. Parents are quite varied in their information needs, medical expertise, and emotional state (e.g., stress level); BT-Parent will put much more emphasis on user-modelling and adaptation than the systems intended for doctors and nurses. This work builds on the BabyLink system [25] which is currently used at the Edinburgh NICU to generate parent reports, but does not use artificial intelligence or NLG techniques.
BT-Clan [56] will generate texts for friends and family (e.g., grandparents), to encourage them to offer appropriate support to parents and babies. Initial user studies indicate that clan members want to know how the parents are doing, as well as the baby's state; for this reason BT-Clan in particular will probably need more information about parents than is available in the current NICU database.
In addition to BabyTalk, we plan to investigate many of the data-to-text issues raised above in other projects as well. In particular, we have recently started a project on helping children with learning difficulties to write a story for their parents about their day at school, based on sensor data which tracks their location and activities; this project will enable us to explore narrative generation in another context. We would also like to explore using BabyTalk technology in the context of assisted living. There is considerable research in using sensors to monitor elderly people in the home, for the purpose of triggering alarms. We would like to summarise the monitoring data, both to help carers plan future activities (analogous to BT-Nurse), and to help elderly people maintain contact with friends and family (analogous to BT-Clan).
7.2 Temporal reasoning and expression
As should be clear from the body of this paper, many of the research challenges in BT-45 involve temporal information: temporal reasoning, temporal expression, and more generally better techniques for handling events at different time-scales. This problem will become more severe in other Babytalk systems, as they have to summarise longer periods of time.
Temporal reasoning and expression becomes particularly challenging when temporal information is uncertain, and this will be a major factor in the future BabyTalk systems. Input of BT-45 consisted of sensor data (accurate to the second), and notes about discrete actions entered by a research nurse (time-stamped, and generally accurate to within a minute or so). For information about discrete actions, future BabyTalk systems will rely on the standard NICU database, which is generally less temporally accurate (with some exceptions). For example, records of changes in the oxygen level in the incubator may well be inserted on an hourly basis, so that the precise time at which a change was effected is not known.
38
One way to surmount this problem is to use the sensor data to get more accurate timings of events. Many discrete events, such as patient handling, result in observable patterns in the sensor data. Identifying such patterns may reduce the uncertainty in the time of discrete events. Nevertheless, temporal uncertainty will not be fully eliminated, and will need to be expressed. There are many linguistic mechanisms for communicating temporal uncertainty (ranging from explicit adverbials such as roughly at to changing temporal precision, for example from 3.00 to 3PM); we will explore these in the future.
In the long run, these problems can be expected to diminish as a result of more automation in data collection in the NICU. For example, the NICU could record incubator humidity levels on a second-by-second basis. This would enable a signal analysis module to identify the time at which an incubator was opened (for example, to handle a patient), based on fluctuations in humidity. While there is no felt need to do this at the present time, if systems such as BabyTalk gain acceptance, they could provide added motivation for making the necessary changes.
7.3 Additional Information
To date, we have only used structured data in the patient database as input to BT-45. The patient database also contains many free-text records, which in principle contain very valuable information; for example the rationale behind medication and other interventions, information about how parents are coping, and detailed observations which do not fit the database schema. Of course these free texts are often highly unstructured, with lots of abbreviations, grammatical errors. We are currently exploring using Information Extraction (IE) techniques to automatically extract information from these free-text notes.
More speculatively, doctors and nurses have repeatedly told us that they get a lot of useful information by visually observing babies. We wonder if in principle some of this information could be obtained by a computer vision system which is connected to a camera which observes the baby. We intend to discuss this with colleagues in the computer vision area.
7.4 Multimodal presentations
BT-45 is a stand-alone system which generates textual summaries of data. We suspect that this technology would be more effective if it could be integrated into a multimodal system which combined graphical data charts with textual summaries. This could benefit a broader class of users, given that some people are more visually-oriented than others, while the correct interpretation of graphs also tends to depend on level of expertise. For example, junior clinicians could benefit from the textual presentation whereas senior clinicians could quickly retrieves information from graphs. Also, different types of data may be better suited to visualisation or textual summarisation. Offering both types of presentation allows the user to choose the one which best fits her way of thinking and the specific data set being examined. Ideally the two presentation types could be linked with cross-references and otherwise integrated [4]. Multimodal systems could include medical images, videos of the baby as well as graphs.
Ideally, BT-45 should also be interactive, for example, by including hyperlinks [60] which users could click on for more detailed summary texts about particular events, and/or graphical depictions of the sensor data in specific periods. This kind of document organisation could extend the notion of an e-document [10] in which multimedia information is structured
39
according to user annotations. Another example of interaction is given by the KNAVE-II system [52] which enables users to query patient databases to retrieve raw and abstracted low frequency data and display this on the screen for more accurate decision making in the oncology domain. One of the greatest strengths of information visualisation systems is their interactivity; we would like to investigate whether some of the interactivity techniques used in visualisation systems can be adapted to textual or multimodal summaries.
7.5 Decision-Support
Traditional decision support systems (including those informed by computerised clinical guidelines) are oriented towards making recommendations. However, automatic advice generation is still a sensitive subject in medical practice and, apart from some exceptions [22], few systems are actually in use on the ward.
Systems like BT-45, which summarise data and do not attempt to interpret it, provide an interesting starting point for the development of more sophisticated decision support systems. In its current form the amount of advice offered by BT-45 is zero; it does not perform the kind of data interpretation needed to recommend diagnoses and interventions and leaves decision-making completely to the clinician. However one could conceivably increase the amount of advice in some fraction of the text, in order to make it more likely that a reader proceed in a specific direction (or directions); if the fraction reached 100% we would have a classical recommender system. We would like to experiment with allowing users to vary the relative proportions of summary and advice, and see which point on this scale was most acceptable to clinicians and/or most effective in terms of leading to good decision-making.
8 Conclusion
Modern society badly needs better ways of presenting large data sets to human decision-makers, in medicine and also in many other contexts. Currently data sets are almost always presented using information visualisation techniques, but visualisation systems are not always as effective as might be hoped. An alternative (or complement) to visualisation is to use NLG and data-to-text techniques to generate textual summaries of data sets. In this paper, we have presented a data-to-text prototype, BT-45, which generates texts automatically from continuous numerical data and discrete numerical and symbolic data acquired from babies cared for in a neonatal ICU. Although BT-45 has many problems and deficiencies, an off-ward experiment with doctors and nurses suggests that BT-45 texts are as effective for decision support as conventional visualisations.
In short, we have shown that it is possible to generate summary texts of large complex data sets, which are effective decision-support aids; we have done this by combining ideas from many fields of artificial intelligence, including knowledge representation and reasoning, pattern analysis, and natural language processing. We have also identified numerous ways in which the technology could be improved so that generated texts become more effective, some of which draw on yet more areas of artificial intelligence, such as computational creativity and computer vision. We believe that with concerted effort, data-to-text technology can improve markedly, to the point where it is routinely used to help people understand large data sets, not just in medicine but also in engineering, meteorology, finance, and many other areas.
40
9 Acknowledgements
The authors would like to thank the other members of the BabyTalk team (Felix Gao, Robert Logie, Saad Mahamood, Neil McIntosh, Wendy Moncur and Marian van der Meulen) for all their help, and also the doctors and nurses who participated in the evaluation. We would also like to thank Andy McKinlay and Chris McVittie for their help in the analysis of the BT-45 output, and Kees van Deemter, Richard Power, Michel Dojat, Emiel Krahmer, Paolo Terenziani, David Westwater, Graeme Ritchie and the anonymous reviewers for their very helpful comments on earlier drafts of this paper. This work was supported by UK Engineering and Physical Sciences Research Council (EPSRC), under grants EP/D049520/1 and EP/D05057X/1.
10 References [1] S. Afantenosa, V. Karkaletsisa, P. Stamatopoulos, Summarization from medical
documents: a survey, Artificial Intelligence in Medicine, 33 (2) (2005) 157-177. [2] W. Aigner, S. Miksch, W. Mueller, H. Schumann, C. Tominski, Visualizing time-
oriented data: A systematic view, Computers and Graphics, 31 (3) (2007) 401-409. [3] J.F. Allen, Maintaining knowledge about temporal intervals, Communications of the
ACM, 26 (11) (1983) 832-843. [4] E. Andre, T. Rist, Generating coherent presentations employing textual and visual
material, Artificial Intelligence Review, 9 (1994) 147-165. [5] A. Aris, B. Schneiderman, C. Plaisant, G. Shmueli, W. Jonk, Representing unevenly-
spaced time series data for visualization and interactive exploration, in: Proceedings of the 10th International Conference on Human-Computer Interaction (INTERACT-05), Rome, Italy, 2005, pp. 12-16.
[6] B. Bohnet, F. Lareau, L. Wanner, Automatic production of multilingual environmental information, in: Proceedings of the 21st Conference on Informatics for Environmental Protection (EnviroInfo-07), Warsaw, Poland, 2007.
[7] P. Bramsen, P. Deshpande, Y.K. Lee, R. Barzilay, Inducing temporal graphs, in: Proceedings of the Conference on Empirical Methods in Natural Language Processing (EMNLP-06), Sydney, Australia, 2006, pp. 189-198.
[8] P. Buono, A. Aris, C. Plaisant, A. Khella, B. Shneiderman, Interactive pattern search in time series, in: Proceedings of the Conference on Visualization and Data Analysis (VDA-05), Washington, DC, 2005, pp. 175-186.
[9] C.B. Callaway, J.C. Lester, Narrative Prose Generation, Artificial Intelligence, 139 (2) (2002) 213-252.
[10] P. Carrara, D. Fogli, G. Fresta, P. Mussio, Toward overcoming culture, skill and situation hurdles in Human-Computer Interaction, Universal Access in the Information Society, 1 (4) (2002) 288-304.
[11] A. Cawsey, R. Jones, J. Pearson, An evaluation of a personalised health information system for patients with cancer, User Modelling and User-Adapted Interaction, 10 (2000) 47-72.
[12] L. Chittaro, M. Dojat, Using a general theory of time and change in patient monitoring: Experiment and evaluation, Computers in Biology and Medicine, 27 (5) (1997) 435-452.
[13] Clevermed Limited. The bagder system. Available at: http://www.clevermed.com.
41
[14] J. Coch , Interactive generation and knowledge administration in MULTIMETEO, in: Proceedings of the 9th International Workshop on Natural Language Generation (IWNLG-98), Ontario, Canada, 1998, pp. 300-303.
[15] J. Cruz, A.I. Hernández, S. Wong, G. Carrault, A. Beuchee, Algorithm Fusion for the Early Detection of Apnea-Bradycardia in Preterm Infants, in: Proceedings of Computers in Cardiology 2006, Valencia, Spain, 2006, pp. 473-476.
[16] S. Cunningham, S. Deere, A. Symon, R.A. Elton, N. & McIntosh, A randomized, controlled trial of computerized physiologic trend monitoring in an intensive care unit, Critical Care Medicine, 26 (1998) 2053-2059.
[17] S. Cunningham, A.G. Symon, R.A. Elton, C. Zhu, N. McIntosh, Intra-arterial blood pressure reference ranges, death and morbidity in very low birthweight infants during the first seven days of life, Early Human Development, 56 (2-3) (1999) 151-165.
[18] Dale R. StockReporter. 2003; Available at: http://www.ics.mq.edu.au/ lt-gdemo/StockReporter/, May, 2008.
[19] R. Dale, E. Reiter, Computational interpretation of the Gricean maxims in the generation of referring expressions, Cognitive Science, 19 (8) (1995) 233-263.
[20] F.D. Davis, J.E. Kotteman, Determinants of decision rule use in a production planning task, Organisational Behaviour and Human Decision Processes, 63 (2) (1995) 145-157.
[21] J.M. Di Fiore, Neonatal cardiorespiratory monitoring techniques, Seminars in Neonatology, 9 (3) (2004) 195-203.
[22] M. Dojat, F. Pachet, Z. Guessoum, D. Touchard, A. Harf, L. Brochard, NeoGanesh: a working system for the automated control of assisted ventilation in ICUs, Artificial Intelligence in Medicine, 11 (2) (1997) 97-117.
[23] D. Dubois, A.H. Ali, H. Prade, Fuzziness and uncertainty in temporal reasoning, Journal of Universal Computer Science, 9(9) (2003) 1168-1194.
[24] L. Ferres, A. Parush, S. Roberts, G. Lindgaard, Helping people with visual impairments gain access to graphical information through natural language: The iGraph system. in: Proceedings of the 10th International Conference on Computers Helping People with Special Needs (ICCHP-06), Linz, Austria, 2006, pp. 1122-1130.
[25] Y. Freer, A. Lyon, B. Stenson, C. Coyle, BabyLink – improving communication among clinicians and with parents with babies in intensive care, British Journal of Healthcare computing and information Management, 22 (2) (2005) 34-36.
[26] E. Friedman-Hill, Jess in Action: Java Rule-based Systems, Manning Publications Co, USA, 2003.
[27] A. Gatt, K. van Deemter, Incremental generation of plural descriptions: Similarity and partitioning, in: Proceedings of the Conference on Empirical Methods in Natural Language Processing (EMNLP-07), Prague, Czech Republic, 2007, pp. 102-111.
[28] E. Goldberg, N. Driedger, R.I. Kittredge, Using Natural Language Processing to produce weather forecasts, IEEE Expert, 9 (2) (1994) 45-53.
[29] M.S. Gonul, D. Onkal, M. Lawrence, The effects of structural characteristics of explanations on the use of a DSS, Decision Support Systems, 42 (3) (2006) 1481-1493.
[30] C. Hallett, R. Power, D. Scott, Summarisation and visualisation of e-Health data repositories, in: Proceedings of the UK E-Science All-Hands Meeting, Nottingham, UK, 2006.
[31] M. Harris , Building a large-scale commercial NLG system for an EMR, in: Proceedings of the 5th International Conference on Natural Language Generation (INLG-08), Salt Fork, Ohio, 2008, pp. 157-160.
42
[32] S.W. Hoare, P.C. Beatty, Automatic artifact identification in anaesthesia patient record keeping: a comparison of techniques, Medical Engineering & Physics, 22 (8) (2000) 547-553.
[33] W. Horn, S. Miksch, G. Egghart, C. Popow, F. Paky, Effective data validation of high-frequency data: time-point-, time-interval-, and trend-based methods, Computers in biology and medicine, 27 (5) (1997) 389-409.
[34] D. Hueske-Kraus , Suregen-2: A shell system for the generation of clinical documents, in: Proceedings of the 10th Conference of the European Chapter of the Association for Computational Linguistics (EACL-03), Budapest, Hungary, 2003, pp. 215-218.
[35] D. Hueske-Kraus, Text generation in clinical medicine: A review, Methods of Information in Medicine, 42 (1) (2003) 51-60.
[36] B.L. Humphreys, D.A. Lindberg, The UMLS project: Making the conceptual connection between users and the information they need, Bulletin of the Medical Library Association, 81 (2) (1993) 170-177.
[37] J. Hunter , TSNet – A distributed architecture for time series analysis, in: Proceedings of the Workshop on Intelligent Data Analysis in Biomedecine and Pharmacology (IDAMAP-06), Verona, Italy, 2006.
[38] J. Hunter, G. Ewing, L. Ferguson, Y. Freer, R. Logie, P. McCue, N. McIntosh, The NEONATE Database, in: Proceedings of the AIME-03 Workshop on Intelligent Data Analysis in Medicine and Pharmacology and Knowledge-Based Information Management in Anaesthesia and Intensive Care, Protaras, Cyprus, 2003.
[39] J. Hunter, G. Ewing, Y. Freer, R. Logie, P. McCue, N. McIntosh, NEONATE: Decision support in the neonatal intensive care unit - A preliminary report, in: Proceedings of the 9th European Conference on Artificial Intelligence in Medicine (AIME-03), Protaras, Cyprus, 2003, pp. 41-46.
[40] J. Hunter, N. McIntosh, Knowledge-Based Event Detection in Complex Time Series Data, in: Proceedings of the Joint European Conference on Artificial Intelligence in Medicine and Medical Decision Making (AIMDM-99), Aalborg, Denmark, 1999, pp. 271-280.
[41] L. Iordanskaja, M. Kim, R. Kittredge, B. Lavoie, A. Polguere, Generation of extended bilingual statistical reports, in: Proceedings of the 15th International Conference on Computational Linguistics (COLING-92), Nantes, France, 1992, pp. 1019-1023.
[42] M.G. Kahn, L.M. Fagan, L.B. Sheiner, Combining physiologic models and symbolic methods to interpret time-varying patient data. Methods of Information in Medicine, 30 (3) (1991) 167-178.
[43] E. Keogh, S. Chu, D. Hart, M. Pazzani, An online algorithm for segmenting time series, in: Proceedings of the IEEE International Conference on Data Mining (ICDM-01), San Jose, California, 2001, pp. 289-296.
[44] K. Kipper, H.T. Dang, M. Palmer, Class-Based Construction of a Verb Lexicon, in: Proceedings of the 17th National Conference on Artificial Intelligence (AAAI-00), Austin, Texas, 2000, pp. 691-696.
[45] E. Krahmer, M. Theune, Efficient context-sensitive generation of referring expressions, in: K. van Deemter, R. Kibble, (Eds.), Information Sharing: Reference and Presupposition in Language Generation and Interpretation, CSLI, Stanford, Ca., 2002 .
[46] K. Kukich , Design of a Knowledge-Based Report Generator, in: Proceedings of the 21st Annual Meeting of the Association for Computational Linguistics (ACL-83), Cambridge, Massachusetts, 1983, pp. 145-150.
43
[47] W. Labov, Language in the Inner City. University of Pennsylvania Press, Pennsylvania, 1971.
[48] A.S. Law, Y. Freer, J. Hunter, R.H. Logie, N. McIntosh, J. Quinn, A comparison of graphical and textual presentations of time series data to support medical decision making in the neonatal intensive care unit, Journal of clinical monitoring and computing, 19 (3) (2005) 183-194.
[49] J.S. Lim, M. O'Connor, Judgmental forecasting with time series and causal information, International Journal of Forecasting, 12 (1996) 139-153.
[50] S. Mahamood, E. Reiter, C. Mellish, Neonatal intensive care information for parents — An affective approach, in: Proceedings of the Workshop on Personalisation for E-Health, in conjunction with the 21st IEEE International Symposium on Computer-Based Medical Systems (CBMS-08), Jyväskylä, Finland, 2008, pp. 461-463.
[51] I. Mani, M. Verhagen, B. Wellner, C.M. Lee, J. Pustejovksy, Machine learning of temporal relations, in: Proceedings of the 44th Annual Meeting of the Association for Computational Linguistics (ACL-06), Sydney, Australia, 2006, pp. 753-760.
[52] S.B. Martins, Y. Shahar, D. Goren-Bar, M. Galperin, H. Kaizer, L.V. Basso, D. McNaughton, M.K. Goldstein, Evaluation of an architecture for intelligent query and exploration of time-oriented clinical data, Artificial Intelligence in Medicine, 43 (1) (2008) 17-34.
[53] N. McIntosh, A. Lyon, P. Badger, Time trend monitoring in the Neonatal Intensive Care Unit: Why doesn’t it make a difference? Pediatrics, 98 (1996) 540.
[54] N. McIntosh, A.J. Lyon, J. Reiss, J.C. Becher, R. Logie, K. Gilhooley, E. Alberdi, J. Hunter, The cognitive processes of doctors and nurses in the interpretation of physiological monitoring data in the neonate, Early Human Development, 58 (1) (2000) 73.
[55] M. Moens, M. Steedman, Temporal ontology and temporal reference, Computational Linguistics, 14 (2) (1988) 15-28.
[56] W. Moncur, J. Masthoff, E. Reiter, What do you want to know? Investigating the information requirements of patient supporters, in: Proceedings of the Workshop on Personalisation for E-Health, held in conjunction with the 21st IEEE International Symposium on Computer-Based Medical Systems (CBMS-08), Jyväskylä, Finland, 2008, pp. 443-448.
[57] W. Mueller, H. Schumann, Visualization methods for time-dependent data: An overview, in: Proceedings of the 35th Winter Simulation Conference, New Orleans, Louisiana, 2003, pp. 737-745.
[58] N.F. Noy, M. Crubezy, R.W. Fergerson, H. Knublauch, S.W. Tu, J. Vendetti, M.A. Musen, Protege-2000: An open-source ontology-development and knowledge-acquisition environment, in: Proceedings of the Annual Symposium of the American Medical Informatics Association (AMIA-00), Los Angeles, California, 2003.
[59] J. Oberlander, A. Lascarides, Preventing false implicatures: Interactive defaults for text generation, in: Proceedings of the 15th International Conference on Computational Linguistics (COLING-92), Nantes, France, 1992, pp. 721-727.
[60] M. O'Donnel, C. Mellish, J. Oberlander, A. Knott, ILEX: An architecture for a dynamic hypertext generation system, Natural Language Engineering, 7 (3) (2001) 225-250.
[61] B.H. Partee, Some structural analogies between tenses and pronouns in English. Journal of Philosophy, 70 (1973) 601-609.
44
[62] R. Passonneau , Situations and intervals, in: Proceedings of the 25th Annual Meeting of the Association for Computational Linguistics (ACL-87), Stanford, California, 1987, pp. 16-24.
[63] N. Peek, M. Verduijn, E. de Jonge, B. de Mol, An empirical comparison of four procedures for filtering monitoring data, in: Proceedings of the Conference on Intelligent Data Analysis in bioMedecine and Pharmacology (IDAMAP-07), Amsterdam, The Netherlands, 2007, pp. 65-70.
[64] Pérez y Pérez, R., M. Sharples, Three computer-based models of storytelling: BRUTUS, MINSTREL and MEXICA, Knowledge-Based System, 17 (1) (2004) 15-29.
[65] C. Plaisant , The challenge of information visualization evaluation, in: Proceedings of the Conference on Advanced Visual Interfaces (AVI-04), Gallipoli, Italy, 2004.
[66] F. Portet, F. Gao, J. Hunter, S. Sripada, Evaluation of on-line bradycardia boundary detectors from neonatal clinical data, in: Proceedings of the 29th IEEE Annual International Conference of the Engineering in Medicine and Biology Society (EMBS-07), Lyon, France, 2007, pp. 3288-3291.
[67] F. Puppe, M. Atzmueller, G. Buscher, M. Huettig, H. Luehrs, H.-. Buscher, Application and Evaluation of a Medical Knowledge-System in Sonography (SONOCONSULT), in: Proceedings of the 18th European Conference on Artificial Intelligence (ECAI-08), Patras, Greece, 2008, pp. 683-687.
[68] J. Pustejovksy, The syntax of event structure, Cognition, 41 (1991) 47-81. [69] J.A. Quinn, Bayesian Condition Monitoring in Neonatal Intensive Care, PhD Thesis,
University of Edinburgh, UK, 2007. [70] M. Reape, C. Mellish, Just what is aggregation anyway? in: Proceedings of the 7th
European Workshop on Natural Language Generation (ENLG-99), Toulouse, France, 1999.
[71] H. Reichenbach, Elements of Symbolic Logic. Macmillan, New York, 1947/1966. [72] E. Reiter , An architecture for data-to-text systems, in: Proceedings of the 11th
European Workshop on Natural Language Generation (ENLG-07), Schloss-Dagstuhl, Germany, 2007, pp. 97-104.
[73] E. Reiter, S. Sripada, J. Hunter, J. Yu, I. Davy, Choosing words in computer-generated weather forecasts, Artificial Intelligence, 167 (2005) 137-169.
[74] E. Reiter, R. Robertson, L. Osman, Lessons from a failure: Generating tailored smoking cessation letters, Artificial Intelligence, 144 (2003) 41-58.
[75] E. Reiter, R. Dale, Building Natural Language Generation Systems, Cambridge University Press, Cambridge, 2000.
[76] J. Sahuquillo, Does multimodality monitoring make a difference in neurocritical care? European Journal of Anaesthesiology Supplement, 42 (2008) 83-86.
[77] J. Schmitt, W. Reif, A. Seyfang, S. Miksch, Temporal dimension of medical guidelines: The semantics of Asbru time annotations, in: Workshop on AI Techniques in Healthcare: Evidence-based Guidelines and Protocols held in conjunction with European Conference on Artificial Intelligence (ECAI-2006), Trentino, Italy, 2006.
[78] B. Schneiderman, B. Bederson, Maintaining concentration to achieve task completion, in: Proceedings of the Conference on Designing for User Experience (DUX-05), San Francisco, Ca, 2005.
[79] B. Schneiderman, Inventing discovery tools: combining information visualization with data mining, Information Visualization, 1 (2002) 5-12.
45
[80] Y. Shahar, D. Goren-Bar, D. Boaz, G. Tahan, Distributed, intelligent, interactive visualization and exploration of time-oriented clinical data and their abstractions, Artificial Intelligence in Medicine, 38 (2) (2006) 115-135.
[81] Y. Shahar, M.A. Musen, RESUME: a temporal-abstraction system for patient monitoring, Computers and Biomedical Research, 26 (3) (1993) 255-273.
[82] K. Spackman, SNOMED RT and SNOMEDCT. Promise of an international clinical terminology, M.D. Computing: Computers in Medical Practice, 17 (6) (2000) 29.
[83] S. Sripada, E. Reiter, I. Davy, SumTime-Mousam: Configurable marine weather forecast generator, Expert Update, 6 (3) (2003) 4-10.
[84] M. Stacey, C. McGregor, Temporal abstraction in intelligent clinical data analysis: a survey, Artificial Intelligence in Medicine, 39 (1) (2007) 1-24.
[85] B. Strople, P. Ottani, Can technology improve intershift report? What the research reveals, J.Prof.Nurs., 22 (3) (2006) 197-204.
[86] R. Turner, S. Sripada, E. Reiter, I. Davy, Selecting the content of textual descriptions of geographically located events in spatio-temporal weather data, in: Proceedings of the Conference on Applications and Innovations in Intelligent Systems XV, Cambridge, UK, 2007, pp. 75-88.
[87] van der Meulen, M., R.H. Logie, Y. Freer, C. Sykes, N. McIntosh, J. Hunter, When a graph is poorer than 100 words: A comparison of computerised Natural Language Generation, human generated descriptions and graphical displays in neonatal intensive care, Applied Cognitive Psychology, (to appear) .
[88] Z. Vendler, Verbs and times, The Philosophical Review, 66 (2) (1957) 143-160. [89] B.L. Webber , The interpretation of tense in discourse, in: Proceedings of the 25th
Meeting of the Association for Computational Linguistics (ACL-87), Stanford, California, 1987, pp. 147-154.
[90] W.D. Winn, Contributions of perceptual and cognitive processes to the comprehension of graphics, in: W. Schnotz, R. Kulhavy, (Eds.), Comprehension of Graphics, Elsevier, Amsterdam, 1994 , pp. 3-27.
[91] J. Yu, E. Reiter, J. Hunter, C. Mellish, Choosing the content of textual summaries of large time-series data sets, Natural Language Engineering, 13 (2007) 25-49.
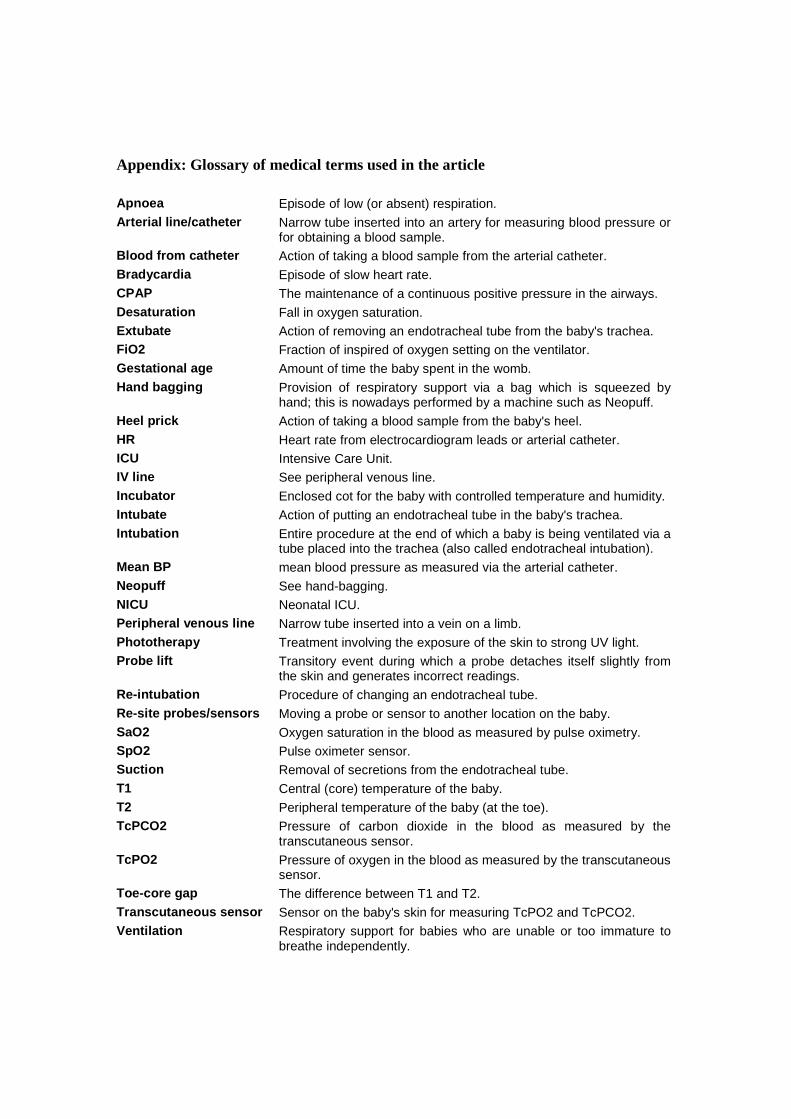
Appendix: Glossary of medical terms used in the article Apnoea Episode of low (or absent) respiration. Arterial line/catheter Narrow tube inserted into an artery for measuring blood pressure or
for obtaining a blood sample. Blood from catheter Action of taking a blood sample from the arterial catheter. Bradycardia Episode of slow heart rate. CPAP The maintenance of a continuous positive pressure in the airways. Desaturation Fall in oxygen saturation. Extubate Action of removing an endotracheal tube from the baby's trachea. FiO2 Fraction of inspired of oxygen setting on the ventilator. Gestational age Amount of time the baby spent in the womb. Hand bagging Provision of respiratory support via a bag which is squeezed by
hand; this is nowadays performed by a machine such as Neopuff. Heel prick Action of taking a blood sample from the baby's heel. HR Heart rate from electrocardiogram leads or arterial catheter. ICU Intensive Care Unit. IV line See peripheral venous line. Incubator Enclosed cot for the baby with controlled temperature and humidity. Intubate Action of putting an endotracheal tube in the baby's trachea. Intubation Entire procedure at the end of which a baby is being ventilated via a
tube placed into the trachea (also called endotracheal intubation). Mean BP mean blood pressure as measured via the arterial catheter. Neopuff See hand-bagging. NICU Neonatal ICU. Peripheral venous line Narrow tube inserted into a vein on a limb. Phototherapy Treatment involving the exposure of the skin to strong UV light. Probe lift Transitory event during which a probe detaches itself slightly from
the skin and generates incorrect readings. Re-intubation Procedure of changing an endotracheal tube. Re-site probes/sensors Moving a probe or sensor to another location on the baby. SaO2 Oxygen saturation in the blood as measured by pulse oximetry. SpO2 Pulse oximeter sensor. Suction Removal of secretions from the endotracheal tube. T1 Central (core) temperature of the baby. T2 Peripheral temperature of the baby (at the toe). TcPCO2 Pressure of carbon dioxide in the blood as measured by the
transcutaneous sensor. TcPO2 Pressure of oxygen in the blood as measured by the transcutaneous
sensor. Toe-core gap The difference between T1 and T2. Transcutaneous sensor Sensor on the baby's skin for measuring TcPO2 and TcPCO2. Ventilation Respiratory support for babies who are unable or too immature to
breathe independently.