
August 2018 - Berry Corporation (bry)
30
Investor Presentation August 2018
Transcript of August 2018 - Berry Corporation (bry)

August 2018
Investor PresentationAugust 2018

August 2018
Disclaimer
1
The information in this presentation includes forward-looking statements that involve risks and uncertainties that could materially affect our expected financial position, liquidity, cash flows, results of operations and business strategy, potential acquisition opportunities, other plans and objectives for operations, maintenance capital requirements, expected production and costs, reserves, hedging activities, capital investments and other guidance. Actual results may differ from anticipated results, sometimes materially, and reported results should not be considered an indication of future performance. You can typically identify forward-looking statements by words such as aim, anticipate, achievable, believe, budget, continue, could, effort, estimate, expect, forecast, goal, guidance, intend, likely, may, might, objective, outlook, plan, potential, predict, project, seek, should, target, will or would and other similar words that reflect the prospective nature of events or outcomes. For any such forward-looking statement that includes a statement of the assumptions or bases underlying such forward-looking statement, we caution that, while we believe such assumptions or bases to be reasonable and make them in good faith, assumed facts or bases almost always vary from actual results, sometimes materially. Material risks that may affect our results of operations and financial position appear in Risk Factors in our final prospectus dated July 25, 2018 as filed with the SEC pursuant to Rule 424(b)(4) of the Securities Act of 1933, as amended, on July 27, 2018 (the "prospectus").
Factors (but not necessarily all the factors) that could cause results to differ include among others:
* volatility of oil, natural gas and NGL prices;* inability to generate sufficient cash flow from operations or to obtain adequate financing to fund capital expenditures and meet working capital requirements;* price and availability of natural gas;* our ability to use derivative instruments to manage commodity price risk;* impact of environmental, health and safety, and other governmental regulations, and of current or pending legislation;* uncertainties associated with estimating proved reserves and related future cash flows;* our inability to replace our reserves through exploration and development activities;* our ability to meet our proposed drilling schedule and to successfully drill wells that produce oil and natural gas in commercially viable quantities;* effects of competition;* our ability to make acquisitions and successfully integrate any acquired businesses;* market fluctuations in electricity prices and the cost of steam;* asset impairments from commodity price declines;* large or multiple customer defaults on contractual obligations, including defaults resulting from actual or potential insolvencies;* geographical concentration of our operations;* our ability to improve our financial results and profitability following our emergence from bankruptcy and other risks and uncertainties related to our emergence from bankruptcy;* changes in tax laws;* impact of derivatives legislation affecting our ability to hedge;* ineffectiveness of internal controls;* concerns about climate change and other air quality issues;* catastrophic events;* litigation;* our ability to retain key members of our senior management and key technical employees; and* information technology failures or cyber attacks.
We undertake no responsibility to publicly release the result of any revision of our forward-looking statements after the date they are made. All forward-looking statements, expressed or implied, included in this report are expressly qualified in their entirety by this cautionary statement. This cautionary statement should also be considered in connection with any subsequent written or oral forward-looking statements that we or persons acting on our behalf may issue.
This presentation includes management’s projections of certain key operating and financial metrics for the year ending December 31, 2018. Key assumptions underlying these projections include, but are not limited to, (i) averaging two drilling rigs in California continuously through 2018 and increasing the pace of drilling modestly throughout the year, (ii) drilling and completion cost for PUD wells in California in 2018 will average less than $450,000 per well, (iii) forecasted average ICE (Brent) oil sales prices based on strip pricing as of May 31, 2018 of $74.59, $72.98 and $69.15 per Bbl for 2018, 2019, and 2020, respectively, and flat pricing assumption for 2021 onward of $66.49 per Bbl, and (iv) forecasted average NYMEX Henry Hub natural gas sales prices based on strip pricing as of May 31, 2018 of $2.94, $2.75 and $2.68 per Bbl for 2018, 2019, and 2020 respectively and flat pricing assumption for 2021 onward of $2.66 per Mcf.

August 2018
Disclaimer (Cont.)
2
Material assumptions also include a consistent and stable regulatory environment; timely and available drilling and completion equipment and crew availability and access to necessary resources for drilling, completing and operating wells; availability of capital; and accessibility to transport and sell oil and natural gas product to available markets. These projections reflect the consistent application of Berry’s accounting policies. While Berry believes that these assumptions are reasonable in light of management’s current expectations concerning future events, the estimates underlying these assumptions are inherently uncertain and speculative and are subject to significant business, economic, regulatory, environmental and competitive risks and uncertainties that could cause actual results to differ materially from those Berry anticipates and many of which are beyond Berry’s control. Any of the risks discussed in the prospectus would cause Berry’s actual operating and financial results to vary significantly from the estimates provided herein.
While Berry currently expects that its actual results will be within the ranges described herein, there will be differences between actual and projected results, and actual results may be materially greater or materially less than those contained in these projections. Inclusion of these projections in this presentation should not be regarded as a representation by any person that the projected operating and financial results will be achieved. In addition, the projected results set forth below are not necessarily indicative of results Berry may achieve in any other period.
This presentation has been prepared by Berry and includes market data and other statistical information from sources believed by it to be reliable, including independent industry publications, government publications or other published independent sources. Some data is also based on Berry’s good faith estimates, which are derived from its review of internal sources as well as the independent sources described above. Although Berry believes these sources are reliable, it has not independently verified the information and cannot guarantee its accuracy and completeness.
Proved reserve data included in this presentation is based on a proved reserve report prepared by DeGoyler and MacNaughton ("D&M") as of December 31, 2017 and addendum prepared as of June 28, 2018 (the "D&M Report"). Unless otherwise noted or suggested by context, reserve estimates were prepared in accordance with current SEC rules and regulations regarding oil, natural gas and NGL reserve reporting.
Berry uses PV-10, a supplemental financial measure that is not presented in accordance with U.S. generally accepted accounting principles (“GAAP”), in this presentation, which reflects the present value of its estimated future net revenues to be generated from the production of proved reserves, determined in accordance with the rules and regulations of the SEC, without giving effect to non-property related expenses such as general and administrative expenses, debt service and depreciation, depletion and amortization expense, exploration expenses and hedging activities, discounted at 10% per year before income taxes. Please see slide 26 for a reconciliation to the standardized measure of discounted future net cash flows.
Berry uses Adjusted EBITDA and Levered Free Cash Flow, financial measures that are not presented in accordance with GAAP, in this presentation. Adjusted EBITDA and Levered Free Cash Flow are used as supplemental non-GAAP financial measures by Berry’s management and by external users of Berry’s financial statements, such as industry analysts, investors, lenders and rating agencies. Berry believes Adjusted EBITDA is useful because it allows management to more effectively evaluate Berry’s operating performance and compare the results of its operations period to period without regard to Berry’s financing methods or capital structure. Levered Free Cash Flow is used by management as a primary metric to plan capital allocation for maintenance and internal growth opportunities, as well as hedging needs. It also serves as a measure for assessing our financial performance and our ability to generate excess cash from operations to service debt and pay dividends.
Berry defines Adjusted EBITDA as earnings before interest expense; income taxes; depreciation, depletion, amortization and accretion; exploration expense; derivative gains or losses, net of cash received or paid for scheduled derivative settlements; impairments; stock compensation expense and other unusual out-of-period and infrequent items, including restructuring and reorganization costs. Berry defines Levered Free Cash Flow as Adjusted EBITDA less capital expenditures, interest expense, and dividends. While Adjusted EBITDA and Levered Free Cash Flow are non-GAAP measures, the amounts included in these calculations were computed in accordance with GAAP. These measures are provided in addition to, and not as an alternative for, income and liquidity measures calculated in accordance with GAAP. Our computations of Adjusted EBITDA and Levered Free Cash Flow may not be comparable to other similarly titled measures used by other companies. Adjusted EBITDA and Levered Free Cash Flow should be read in conjunction with the information contained in our financial statements prepared in accordance with GAAP. Please see slide 25 and 26 for a reconciliations of Adjusted EBITDA and Levered Free Cash Flow to GAAP amounts.
Berry uses Adjusted General and Administrative Expenses ("Adjusted G&A"), a supplemental financial measure that is not presented in accordance with GAAP, in this presentation. We define Adjusted G&A as general and administrative expenses adjusted for non-recurring restructuring and other costs and non-cash stock compensation expense. Management believes Adjusted G&A is a useful measure because it allows management to more effectively compare our performance from period to period. We exclude the items listed because these amounts can vary widely and unpredictably in nature, timing, amount and frequency and stock compensation expense is non-cash in nature. Adjusted G&A should not be considered as an alternative to, or more meaningful than, general and administrative expenses as determined in accordance with GAAP. Adjusted G&A may not be comparable to other similarly titled measures for other companies. Please see slide 27 for a reconciliation of Adjusted G&A to general and administrative expenses.
The type curves provided in this presentation are prepared by Berry's internal reserves engineers by conducting a decline curve analysis of production results from Berry's wells to generate an arithmetic mean of historical production for each project. Berry relied on the production results through February 1, 2018 for its own wells that it submitted to the Division of Oil, Gas and Geothermal Resources of the California Department of Conservation ("DOGGR"), which results are publicly available at maps.conservation.ca.gov/doggr/wellfinder/#openModal, to generate the type curves, and these wells are listed on slides 42-44 of Berry's July 2018 Investor presentation (available at berrypetroleum.com/Investors). These type curves were not relied upon by D&M in preparing the D&M Report, and D&M has not reviewed the type curves included in this presentation. Investors are cautioned not to place undue reliance on Berry's type curves and Berry's actual production and ultimate recoveries may differ substantially.

August 2018
100 %
100 %95%
5%
California UintaPiceance East Texas
89%
10%1%
3
Introductory Overview of Berry Petroleum Conventional properties in California, Utah, Colorado, and Texas
— Q2 2018 Production: 80% Oil— Q2 2018 California Production: 100% Oil
Proven management team— Established track record of leading public companies
Long production history and operational control— Shallow decline curves with highly predictable production profiles — Low-risk development opportunities
Extensive inventory of high-return drilling locations— 18+ years2 of low risk, development opportunities— High average working interest (97%) and net revenue interest (88%) year
to date Largely held-by-production acreage (76%), including 99% of California at
Q2 2018 Brent-influenced oil pricing dynamics in California
Map of Berry Assets1
California 1P Reserves by Commodity3
1 Excludes East Texas Assets and bubble size implies PV-10 value of reserves. | 2 Based on 2018 development pace. | 3 Prepared based on D&M Report using closing monthly futures prices as reported on the ICE (Brent) for oil and NGLs and NYMEX (Henry Hub) for natural gas on May 31, 2018. Please see slides 48-49 of Berry's July 2018 Investor Presentation (available at berrypetroleum.com/Investors) for a comparison to SEC Pricing. Please see slide 2 for a note regarding the non-GAAP financial measure PV-10.
1P PV-10 Value by Area3
CA
COUT
San Joaquin
Uinta Piceance
OilGasNGL
95MMBoe$1.9 bn
2Q18 Production by Commodity 1P Reserves by Commodity3
115MMBoe
Oil Gas NGL Oil Gas NGL
26.5MBoe/d
80%
18%2%
Oil Gas NGL

August 2018
1,200,000
1,300,000
0
100,000
200,000
300,000
400,000
California and U.S. Energy Industry are Intertwined
4
Top Crude Oil Producing Counties in Lower 48 (Feb 2018)2
1 EIA 2017 Total Crude Oil Production.2 DrillingEdge.3 Chevron; 2017 Supplement to the Annual Report, p. 13.4 Los Angeles County Economic Development Corporation; YE 2015.
Top Crude Oil Producing States in Lower 48 (2017)1
0
2,000
4,000
6,000
8,000
10,000
12,000
14,000
California overview— California is the third largest crude oil producer in the
U.S. Lower 48, after Texas and North Dakota1
– Kern County is the third largest oil producing county in the U.S. Lower 482
— Energy consumption ranks among the highest in the nation creating an inherent incentive to maintain and grow a diverse energy production base
— Several major oil and gas companies maintain significant operations in the region including: Chevron, Exxon and Shell
— Chevron is California’s largest producer and keeps its Global Headquarters there3
Total annual economic contribution by oil and gas4
— Oil and gas extraction represents sizeable portion of contribution
— 368,100 direct, indirect and induced jobs— $33 billion in total labor income— $148 billion in total output
Over $26 billion in annual state and local tax revenue contributed by oil and gas overall4
(MBo
)(M
Bo)

August 2018
Oil dominated, low-risk
conventional asset base
Focused on San Joaquin Basin assets on west
side
Long-lived reserves with low and predictable
production decline rates
Stable development
and production cost structures
18+ years1 of identified high
return oil drilling locations
Abundant potential strategic
opportunities in-basin
Brent-influenced crude oil pricing
dynamics
Strong balance sheet and liquidity
Our Key Asset, Operational and Financial Advantages……A Differentiated
Opportunity in E&P
Top-tier corporate level returns
High degree of capital flexibility with low
breakeven oil prices
Positive levered free cash flow through
commodity price cycles
Ability and intention to return capital to
shareholders
Long-term capital efficient growth
The Berry Advantage
…Result in…
5
1 Based on 2018 development pace.

August 2018
Resource / Shale Players The Berry Benefit
Production History Decades of History Still Learning
Production Declines Low High
IP Rates Lower Higher
Capital and Service Cost Intensity Low Higher
(i.e. “Big fracs”) S
Operating Cost Stability/Predictability Stable Experiencing Inflation
Potential GOR Issues No(CA ~100% oil) Yes
Takeaway and Service Capacity Constraints
No(We service CA demand) Yes
Ability to Generate andReturn Capital for
ShareholdersYes Recurring returns of capital
uncommon historically and today
We Are Broadly Advantaged vs. Unconventional Resource Players
6

August 2018
Wel
l Cou
nt
(Wel
ls /
Incl
. Pro
duce
rs &
Inje
ctor
s)Significant Inventory of High Return Development Opportunities
7
Additional
1 IRRs based on Strip Pricing. Berry's Strip Pricing oil, natural gas and NGL reserves were determined using index prices for natural gas and oil, respectively, as of May 31, 2018 without giving effect to derivative transactions. The average future prices for benchmark commodities used in determining Berry's Strip Pricing reserves were $74.59 per Bbl for oil and NGLs for 2018, $72.98 for 2019, $69.15 for 2020 and $66.49 for 2021 thereafter, on the ICE (Brent), and $2.94 per MMBtu for natural gas for 2018, $2.75 for 2019, $2.68 for 2020 and $2.66 for 2021 thereafter, on the NYMEX Henry Hub. For a comparison to SEC Pricing, please see slides 48-49 in Berry's July 2018 Investor Presentation (available at berrypetroleum.com/Investors). | 2 IRRs calculated based on Berry's type curves and management's assumptions. Please see slide 2 for a note regarding Berry's type curves and slides 37-38 of Berry's July 2018 Investor Presentation (available at berrypetroleum.com/Investors) for more detailed information related to those curves.
Tier 1
AdditionalUpside
Extended San Joaquin development
Enhanced production techniques
Enhanced drilling and completion techniques
Cost / efficiencies upside San Joaquin San Joaquin
IRRs1,2
311
774
1,860
452 3,397
585
904
424
793
870 80 7,053
Hill Diatomite(non-thermal)
ThermalDiatomite
ThermalSandstones
Uinta Total Tier 1 Hill Diatomite(non-thermal)
ThermalDiatomite
ThermalSandstones
Uinta Piceance East Texas Total
78 % 359 % 65 %

August 2018
The decline rates from our new conventional oil wells in California are materially lower than those experienced in the top-tier U.S. oily shale plays
The extensive history of development and production in our California fields provides a high degree of confidence and predictability
Our California wells produce little to no gas
With shale well, there is limited visibility around long-term production profiles, including EURs and GORs
The low declining nature of our development wells and PDPs result in a high degree of capital flexibility
Our Low Declining Wells and Production Base Mitigate “Treadmill” Conundrum Experienced in Unconventional Shale Plays
8
% of Initial Rate From Peak Production (New Wells)
Source: Berry internal database, Third-party Company PresentationsNote: Berry Sandstone Steam Flood reaches peak production after approximately 12 months. Time period shown for Sandstone is shown from peak production and onward. The initial rate of production from peak production is determined using Berry's type curves, Please see slide 2 for a note regarding Berry's type curves and slides 37-38 of Berry's July 2018 Investor Presentation (available at berrypetroleum.com/Investors) for more detailed information related to those curves.
Berry Hill Diatomite
Berry SandstoneSteam Flood
MidlandEagle FordSTACKBakken
Ber
ryO
ther
B
asin
s
0%
20%
40%
60%
80%
100%
0 12 24 36 48 60Month

August 2018
California’s Oil Market is Isolated From Rest of Lower 48
9
Source: California Almanac1 Largest Middle Eastern importers are Saudi Arabia, Iraq and Kuwait. | 2 Largest South American importers are Ecuador, Colombia and Brazil.
There are no major crude oil pipelines connectingCalifornia to the rest of the US.
California refiners import ~67% of supplies from waterborne sources, including >50% from non-US sources driving prices to track closely to Brent (ICE)
In 2017, ~46% of supply came from the Middle East1and South America2
2017 Sources of Feedstock for California
California + Alaska
(Domestic) = ~45 %Supply
California32%
Alaska13%Middle East¹
24%
South America²
22%
Mexico2%
Canada2%
Africa1%
Other4%
Refinery
Petroleum Port
WaterborneCrude Imports
Refineries - LA AreaRefinery Name Crude Capacity
(MBbl/d)Chevron El Segundo 269Andeavor Carson 257PBF Torrance 150P66 Wilmington 139Andeavor Wilmington 85Valero Wilmington 85
Refineries - Bay AreaRefinery Name Crude Capacity
(MBbl/d)Chevron Richmond 245
Andeavor Golden Eagle 166
Shell Martinez 156
Valero Benicia 145
P66 Rodeo 78
No Pipelines To California Market
Refineries - San Joaquin / Bakersfield
Refinery Name Crude Capacity (MBbl/d)
P66 Santa Maria 42
Kern Oil Bakersfield 26
SJR Bakersfield 15

August 2018
California Runs on California Crude, With Plenty of Takeaway Capacity
Pipeline Owner
Approx.Capacity (MBbl/d) Description
Bay
Are
a
KLM CPL 90 Common Carrier
San Pablo Shell 210 Common Carrier
Philips 66 P66 75 Common Carrier
LA
Line 20001
Plains 130 / 75 Common Carrier
Line 631 Common Carrier
M70/55 PBF 95 Proprietary
10
Kern County oil production benefits from access to multiple, intra-state pipelines connecting Kern County producers to refineries in Kern County, the Bay Area and L.A.
3 run north to the Bay Area and all are common carriers
2 of the 3 pipelines that run south to L.A. are common carriers
Crude by rail is a permanent feature of supply, but volumes have been limited to date
The California oil market is insulated from the infrastructure bottlenecks in the rest of the North America (Permian, Canada)
1 Plains Line 2000 and 63 currently operate as one line.

August 2018
Trem SmithCEO
Cary BaetzEVP & CFO
Gary GroveEVP & COO
Kurt NeherEVP, Business Development
Ken RoyerEVP, General
Counsel
Broad, diversified and cross-functional experience
Focused on long-term value creation
Culture of trust, honesty and fair-dealing
Employing extensive experience to our basins, which generally lack innovation
Added key individuals to instill a positive, entrepreneurial spirit
Encouraging staff to “think outside the lease” and take an innovative approach to developing our core assets
Implemented initiatives to reverse decline and ramp up production
Our Best-in-Class Senior Executive Team
11
Highlights Experienced Management TeamCore Values
Leadership
Entrepreneurship
Accountability
Communication
Ownership

August 2018
> ~$60 / Bbl Brent Price
Accelerate development program
Pursue accretive acquisition opportunities
Grow dividend / repurchase shares
Prepay debt obligations
We Have Significant Financial Flexibility Across Oil Price Scenarios
12
Our capital allocation priorities are flexible and focused on bringing value to shareholders across cycles
Currently Planned Capital Allocation / Results
We estimate ~$110mm in annual capital to keep production volumes flat over the next three years
~$60 / Bbl Brent Price Fund planned development / growth program
Pay current dividend
Generate positive free cash flow post-dividend
~$50 / Bbl Brent Price Sustain / grow production
Pay current dividend
Achieve levered free cash flow neutrality post-dividend
August 2018
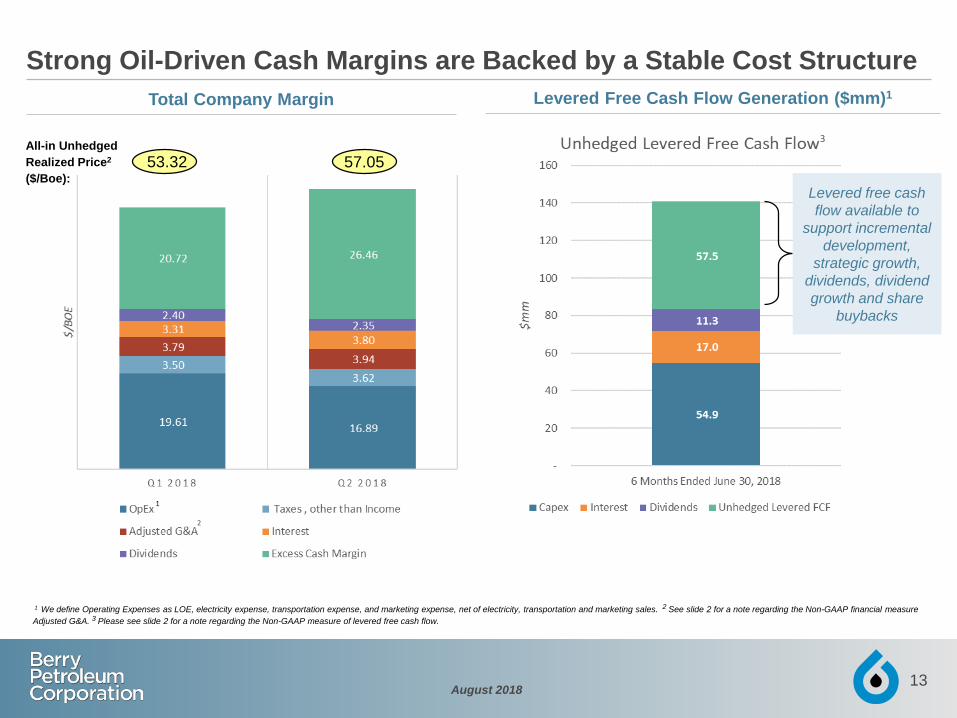
1 We define Operating Expenses as LOE, electricity expense, transportation expense, and marketing expense, net of electricity, transportation and marketing sales. 2 See slide 2 for a note regarding the Non-GAAP financial measure Adjusted G&A. 3 Please see slide 2 for a note regarding the Non-GAAP measure of levered free cash flow.
Strong Oil-Driven Cash Margins are Backed by a Stable Cost Structure
13
All-in Unhedged Realized Price2
($/Boe):
Total Company Margin Levered Free Cash Flow Generation ($mm)1
Levered free cash flow available to
support incremental development,
strategic growth, dividends, dividend growth and share
buybacks
53.32 57.05
2
3

August 2018
Prudent & Proactive Commodity Price Risk Management
14
Note: Prices are weighted average.* Excludes Basis Swaps1 Excludes deferred premiums.2 Through March 31, 2020 but averaged over 366 days.
Hedge Volumes in MMBbls (MBbl/d)
High degree of margin visibility via proactive hedging program and cost stability
3.2
4.2
0.6
0.8
0.4
0.3
1.90.9
2.8
0.5
4.1
5.0
0.4
1.9
3.7
0.5
0.0
1.0
2.0
3.0
4.0
5.0
6.0
2018 2019 2020 2018 2019 2020
Hedge Position Comparison
WTI Swap WTI Call Brent Swap Brent Purchased Puts
Prior as of 4/30/2018 Restructured as of 6/30/2018
$53.29 Weighted Average
As of 4/30/2018 As of 6/30/20182018 2019 2020 2018 2019 2020
WTI Swap $52.04 $52.05 WTI Call $55.00 $57.32 $60.00 Brent Swap $61.20 $75.13 $75.66 Brent Purchased Puts $65.00 $65.00 Weighted Average $53.09 $52.93 $60.00 $75.13 $67.57 $65.00
In the second quarter 2018 we restructured our hedge position to reflect currentmarket pricing and to give the market better visibility into our cash flow generating capabilities.
$69.76 Weighted Average

August 2018
Prudent Balance Sheet Management
Target Net Debt to EBITDA of 1.5 – 2.0x or lower through commodity price cycles
Deleveraging will be achieved through organic growth and excess free cash flow
Return Capital to Shareholders via
Meaningful Quarterly Dividend
Intend to return capital to shareholders quarterly in meaningful quantities
Targeting an attractive dividend payout ratio
Long-Term Hedging
Strategy is to secure revenue stream to fund capital needs
Hedge target is to cover operating expenses and fixed charges 2 years out
Fixing physical gas supply and pricing to correlate to the top line hedging program
Capital Spend
Use levered free cash flow from operations to fund maintenance and organic growth opportunities
Use other sources of capital for acquisitions that support the long-term leverage profile
Maintain capital flexibility; we can and will cut capex in a downturn
Our Financial Policy
15

August 2018
I. Asset Overview
16
A view of Berry’s Homebase acreage in South Midway Sunset

August 2018
Basin
May 2018 Strip Net Proved
Reserves1
(MMBoe) / % PD
2Q18Avg. Net
Production (MBoe/d)
2Q18% Oil
Production
May 2018 Strip 1P PV-101,2
($mm) / % of Total
Avg. WI / NRI3,4
Gross Drilling
Inventory (Identified)
June 2018 Producing
Wells, Gross4,5
2Q18 Net Acreage
115 / 71 % 26.5 80 % $ 1,862 95 % / 88 % 7,053 3,911 116,927
California 95 / 66 % 18.8 100 % $ 1,762 / 95 % 99 % / 94 % 4,858 2,704 7,945
Uinta 15 / 100 % 5.3 44 % $ 91 / 5 % 85 % / 78 % 1,245 920 96,441
Piceance 3 / 100 % 1.6 3 % $ 4 / 0 % 72 % / 63 % 870 170 8,008
East Texas 2 / 100 % 0.8 1 % $ 5 / 0 % 99 % / 74 % 80 117 4,533
1 Prepared based on D&M Report using closing monthly futures prices as reported on the ICE (Brent) for oil and NGLs and NYMEX (Henry Hub) for natural gas on May 31, 2018. Please see slide 2 for a note regarding Berry's type curves and slides 37-38 of Berry's July 2018 Investor Presentation (available at berrypetroleum.com/Investors) for more detailed information related to those curves and slides 48-49 for a comparison to SEC Pricing. | 2 Please see slide 2 for a note regarding the non-GAAP financial measure PV-10. | 3 Weighted average WI across active wells as of June, 2018 and weighted average NRI for through June 2018. | 4 Excludes 91 wells in the Piceance basin each with a 5% working interest and eleven wells in the Permian basin all with less than 0.1% working interest. | 5 Includes steam flood and water flood injection wells in California.
Our Large, Conventional and Diversified Asset Base is Oil-Weighted and Valuable
17

August 2018 18
Operational Areas – Focused in California Super Basin
E. Texas Basin
San Joaquin BasinUinta Basin
Piceance Basin
Corporate & Executive Office
Division Offices
Producing Assets
Basin Boundary
Dallas
BakersfieldSouthern San Joaquin Basin
E. Ventura Basin

August 2018 19
Focused on Our California San Joaquin Basin Assets
Map of Operations

August 2018 20
Key California Operational Activities
Oil Field Boundary
Development is primarily in the San Joaquin Basin
Added a third rig in California in April and expect three rigs through 2018 and an average of four rigs in 2019
Select Second quarter activity: Drilled 16 horizontal wells in the thermal sandstone reservoirs
in Midway-Sunset
Drilled 29 and recompleted 23 thermal diatomite wells in Midway-Sunset
Select Third quarter planned activity: Began bringing the new thermal diatomite wells online in
Midway Sunset
Complete the first package of 30 Hill Diatomite producers in South Belridge
Select Fourth quarter planned activity: Complete the second package of 30 Hill diatomite producers
in South Belridge
Continue drilling in thermal sandstone reservoirs, including additional horizontal producers in Midway Sunset
Re-complete additional thermal Diatomite wells in Midway Sunset
Active Berry Development
Drilling 30+ horizontal wells in thermal sandstones
Adding 80+ new completions in
Thermal Diatomite
Began Completing 60 producers in the Hill Diatomite reservoir
Notable Planned Development Programs in 2018

August 2018
II. Upside Opportunities
Thermal Diatomite Recovery Process
Uinta Opportunity
— Vertical Development
— Horizontal Development
Piceance Opportunities
Infrastructure Value and OpEx Reductions
21
Extended San Joaquin
Development
Core Uinta Development
Hill Diatomite, Thermal Diatomite,
and Thermal Sandstone
Development
Chevron North Midway Sunset
Piceance Development
Extended Uinta Development
(Hz, Vert)
Low Risk, High Return Locations
Near-Term Upside
California UintaMid-Term Upside
Thermal Diatomite Recovery Process

August 2018
Berry is a highly differentiated E&P company with a clear strategic, operational and financial vision
Concluding Remarks
22
Highly Differentiated from Public Conventional and Shale E&P Companies
Positive Levered Free Cash Flow Through the Cycle
Stable Oil-Weighted Asset Base
Long Inventory Life of Highly Economic Oil Locations
Predictable Cost Structure
Strategic and Organic Growth Opportunities
Benefit from Favorable West Coast Crude Pricing Dynamics
Strong Balance Sheet
Capable of Consistent Capital Return to Investors

August 2018
III. Appendix
23
Berry's Poso Creek field, California

August 2018
2018E Guidance(1)
24
1. See Slide 2 for disclosures regarding the risks related to forward-looking statements and an explanation of Adjusted General and Administrative Expenses. The GAAP financial measure, General and Administrative Expense is not accessible for Adjusted General and Administrative Expense on a forward-looking basis. Berry cannot reasonably predict the non-recurring items in General and Administrative Expenses. Because of the uncertainty and variability of the nature and amount of future adjustments, which could be significant, Berry is unable to provide a reconciliation of these measures without unreasonable effort.
Category 2018E Guidance
Low High
Average Daily Production (MBoe/d) 27 30
% Oil ~ 80%
Operating Expenses ($/Boe) $ 17.00 . $ 18.75 .
Taxes, Other than Income Taxes ($/Boe) $ 3.25 . $ 3.50 .
Adjusted General & Administrative Expenses ($/Boe) $ 3.25 . $ 3.75 .

August 2018
Non-GAAP Reconciliation Adjusted EBITDA & Adjusted EBITDA Unhedged
25
The following tables present a reconciliation of the GAAP financial measures of net income (loss) and net cash (used in) provided by operating activities to the non-GAAP financial measures of Adjusted EBITDA and Adjusted EBITDA Unhedged.

August 2018
Non-GAAP Reconciliation - Levered Free Cash Flow
26
Levered free cash flow reflects our financial flexibility; and we use it to plan our internal growth capital expenditures. We define levered free cash flow as Adjusted EBITDA less capital expenditures, interest expense, and dividends. Levered free cash flow is our primary metric used in planning capital allocation for maintenance and internal growth opportunities as well as hedging needs and serves as a measure for assessing our financial performance and measuring our ability to generate excess cash from our operations after servicing indebtedness.

August 2018
Non-GAAP Reconciliation - Adjusted General & Administrative Expenses
27
The following table presents a reconciliation of the GAAP financial measure of general and administrative expenses to the non-GAAP financial measures of Adjusted general and administrative expenses.

August 2018 28
Reconciliation for PV-1028
PV-10 Reconciliation ($ in millions) At December 31, 2017
PV-10 $ 1,114
(-) Present value of future income taxes discounted at 10 % (137)
Standardized measure of discounted future net cash flows $ 977

August 2018 29
Thank you!