Attachment C KANSAS DEPARTMENT OF HEALTH AND · PDF fileAttachment C KANSAS DEPARTMENT OF...
37
DRAFT Page 1 of 37 Attachment C KANSAS DEPARTMENT OF HEALTH AND ENVIRONMENT'S EVALUATION OF ABENGOA BIOENERGY BIOMASS OF KANSAS, LLC PROPOSED GHG BACT OPTIONS I. Greenhouse Gas Emission Units Subject to Best Available Control Technology The following are the greenhouse gas (GHG) best available control technology (BACT) analyses prepared and submitted by the Abengoa Bioenergy Biomass of Kansas (ABBK) to the Kansas Department of Health and Environment (KDHE) for evaluation. The following GHG BACT analyses determine the most effective control of GHG emissions from the proposed biomass-to-ethanol and biomass-to-energy production facility. For more details, please refer to the following document prepared by ABBK: Prevention of Significant Deterioration, Air Quality Construction Permit Application Supplement, Greenhouse Gases Best Available Control Technology Analysis dated May, 2011. The proposed facility will consist of the GHG emissions units listed in Table C-1. Table C-1. Summary of Emission Units Subject to GHG BACT Stack ID Equipment/Process Proposed BACT Emission Limit(s) BACT Device(s) or Operational Limitation(s) EP-08000 HV Circuit Breaker 4.9 short ton CO 2 e/yr State-of-the-art enclosed-pressure SF 6 circuit breaker with leak detection to maintain fugitive SF 6 emissions < 0.5% per yr (by weight); Leak Detection and Repair (LDAR) and density monitor alarm set to 4 psi drop. EP-20001 Biomass-Fired Stoker Boiler 0.34 lb CO 2 e/lb steam produced, averaged over 30 day rolling periods excluding periods of startup, shut- down or malfunction Restriction of the fuel type to biomass that is otherwise considered to have low to no economic value or benefit, and/or is a lower impacting crops; and lower GHG-emitting processes and practices through an energy efficient design, incorporating cogeneration, process integration, combustion of co-products, heat recovery and operational and maintenance monitoring.
Transcript of Attachment C KANSAS DEPARTMENT OF HEALTH AND · PDF fileAttachment C KANSAS DEPARTMENT OF...

DRAFT
Page 1 of 37
Attachment C
KANSAS DEPARTMENT OF HEALTH AND ENVIRONMENT'S EVALUATION OF ABENGOA BIOENERGY BIOMASS OF KANSAS, LLC
PROPOSED GHG BACT OPTIONS
I. Greenhouse Gas Emission Units Subject to Best Available Control Technology
The following are the greenhouse gas (GHG) best available control technology (BACT) analyses prepared and submitted by the Abengoa Bioenergy Biomass of Kansas (ABBK) to the Kansas Department of Health and Environment (KDHE) for evaluation. The following GHG BACT analyses determine the most effective control of GHG emissions from the proposed biomass-to-ethanol and biomass-to-energy production facility. For more details, please refer to the following document prepared by ABBK: Prevention of Significant Deterioration, Air Quality Construction Permit Application Supplement, Greenhouse Gases Best Available Control Technology Analysis dated May, 2011. The proposed facility will consist of the GHG emissions units listed in Table C-1.
Table C-1. Summary of Emission Units Subject to GHG BACT
Stack ID Equipment/Process Proposed BACT
Emission Limit(s)
BACT Device(s) or Operational Limitation(s)
EP-08000 HV Circuit Breaker 4.9 short ton
CO2e/yr
State-of-the-art enclosed-pressure SF6 circuit breaker with leak detection to
maintain fugitive SF6 emissions < 0.5% per yr (by weight); Leak Detection
and Repair (LDAR) and density monitor alarm set to 4 psi drop.
EP-20001 Biomass-Fired Stoker Boiler
0.34 lb CO2e/lb steam produced, averaged over 30
day rolling periods excluding periods of startup, shut-
down or malfunction
Restriction of the fuel type to biomass that is otherwise considered to have low to no economic value or benefit, and/or is a lower impacting crops; and lower GHG-emitting processes and practices
through an energy efficient design, incorporating cogeneration, process
integration, combustion of co-products, heat recovery and operational and
maintenance monitoring.

DRAFT
Page 2 of 37
Table C-1. Summary of Emission Units Subject to GHG BACT
Stack ID Equipment/Process Proposed BACT
Emission Limit(s)
BACT Device(s) or Operational Limitation(s)
EP-18185 EH Fermentation CO2
Scrubber
5.89 lb CO2e/gal anhydrous ethanol
produced, averaged over 30
day rolling periods excluding periods of startup, shut-
down or malfunction
Monitoring enzymatic hydrolysis process efficiency, incorporating
monitoring CO2 production during fermentation, energy efficient heat
integration, water recycling, and co-product production.
EP-09001 Biogas Flare
10,170 lb CO2e/hr and 20,166 short
tons CO2e/yr during any twelve (12) consecutive
month period
Restriction of the fuel type to primarily biogas and pipeline-grade natural gas in the pilot; and to use the most efficient
flare that can perform to the specification required by the facility's
process.
EP-06001 Firewater Pump Engine
24.0 tons CO2e/yr during any twelve (12) consecutive
month period
Fuel-efficient NFPA-20 certified firewater pump engine (20.3±5% gal/hr
fuel consumption limit for a 460 Hp engine with a rated speed of 1760 rpm and an EPA Tier 3 emission rating).
II. High Voltage Circuit Breaker Equipment Leaks GHG BACT Analysis
A. Source Description
One (1) high voltage circuit breaker (EP-08000), rated at 125 kilovolts (kV), will be utilized at the facility. The circuit breaker will use 82 pounds of a sulfur hexafluoride (SF6) dielectric in an enclosed-pressure system. The SF6 has become the predominant insulator and arc quenching substance in circuit breakers today because of its superior capabilities. The SF6’s global warming potential (GWP) over a 100-year period that is 23,900 times greater than CO2.
B. Identify Available Control Options
The following control options have been identified and considered in determining BACT:

DRAFT
Page 3 of 37
1. Use of state-of-the-art SF6 technology with leak detection (baseline);
2. Use of a non-SF6 dielectric oil or compressed air/air blast;
3. Use of an emerging technology that is comparable to the properties of SF6 but without the drawbacks of dielectric oil or air blast; and
4. Development and implementation of a Leak Detection and Repair (LDAR)
program.
C. Eliminate Technically Infeasible Control Options
The use of an emerging technology to replace SF6 was eliminated as a control option because it is technically infeasible. According to ABBK’s BACT analysis, research and development efforts have focused on finding substitutes for SF6 that have comparable insulating and arc quenching properties in high-voltage applications. While some progress has reportedly been made using mixtures of SF6 and other inert gases (e.g., nitrogen or helium) in lower-voltage applications, most studies have concluded, "that there is no replacement gas immediately available to use as an SF6 substitute" for high-voltage applications. According to the most recent report released by the EPA SF6 Partnership, "no clear alternative exists for this gas that is used extensively in circuit breakers, gas-insulated substations, and switch gear, due to its inertness and dielectric properties." Therefore, the alternative to use an emerging technology to replace SF6 was determined to be technically infeasible. The use of dielectric oil or compressed air (air blast) circuit breakers were historically used in high-voltage installations prior to the development of SF6 breakers. Thus, this option is technically feasible. The use state-of-the-art SF6 technology with leak detection to limit fugitive emissions is technically feasible and is the baseline control option. In comparison to older SF6 circuit breakers, modern breakers are designed as a totally enclosed-pressure system with far lower potential for SF6 emissions. The best modern equipment can be guaranteed to leak at a rate of no more than 0.5% per year by weight. In addition, the effectiveness of leak-tight closed systems can be enhanced by equipping them with a density alarm that provides a warning when SF6 (by weight) has leaked from the breaker.
D. Rank Technically Feasible Control Options
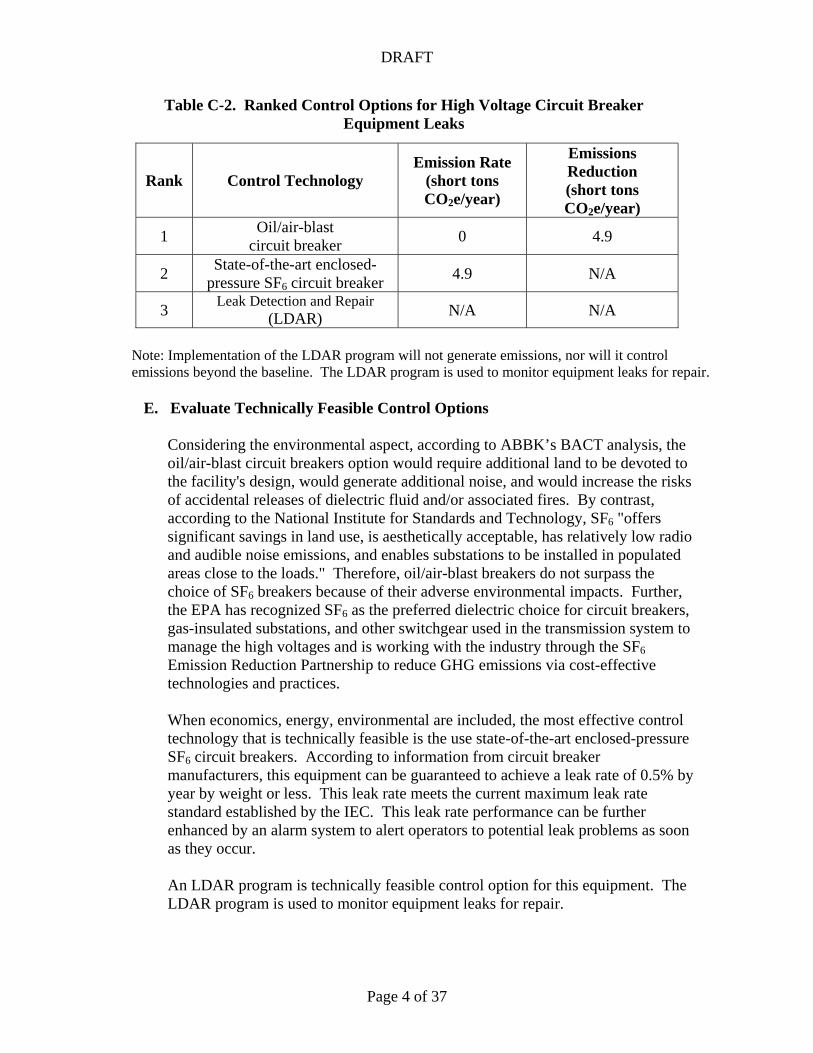
Table C-2 presents the ranked technically feasible control options.
DRAFT
Page 4 of 37
Table C-2. Ranked Control Options for High Voltage Circuit Breaker Equipment Leaks
Rank Control Technology Emission Rate
(short tons CO2e/year)
Emissions Reduction (short tons CO2e/year)
1 Oil/air-blast
circuit breaker 0 4.9
2 State-of-the-art enclosed-
pressure SF6 circuit breaker 4.9 N/A
3 Leak Detection and Repair
(LDAR) N/A N/A
Note: Implementation of the LDAR program will not generate emissions, nor will it control emissions beyond the baseline. The LDAR program is used to monitor equipment leaks for repair.
E. Evaluate Technically Feasible Control Options
Considering the environmental aspect, according to ABBK’s BACT analysis, the oil/air-blast circuit breakers option would require additional land to be devoted to the facility's design, would generate additional noise, and would increase the risks of accidental releases of dielectric fluid and/or associated fires. By contrast, according to the National Institute for Standards and Technology, SF6 "offers significant savings in land use, is aesthetically acceptable, has relatively low radio and audible noise emissions, and enables substations to be installed in populated areas close to the loads." Therefore, oil/air-blast breakers do not surpass the choice of SF6 breakers because of their adverse environmental impacts. Further, the EPA has recognized SF6 as the preferred dielectric choice for circuit breakers, gas-insulated substations, and other switchgear used in the transmission system to manage the high voltages and is working with the industry through the SF6 Emission Reduction Partnership to reduce GHG emissions via cost-effective technologies and practices.
When economics, energy, environmental are included, the most effective control technology that is technically feasible is the use state-of-the-art enclosed-pressure SF6 circuit breakers. According to information from circuit breaker manufacturers, this equipment can be guaranteed to achieve a leak rate of 0.5% by year by weight or less. This leak rate meets the current maximum leak rate standard established by the IEC. This leak rate performance can be further enhanced by an alarm system to alert operators to potential leak problems as soon as they occur.
An LDAR program is technically feasible control option for this equipment. The LDAR program is used to monitor equipment leaks for repair.

DRAFT
Page 5 of 37
F. Establish BACT
Based on this top-down analysis, ABBK proposes that GHG BACT for the onsite circuit breaker consist of the following: 1. State-of-the-art enclosed-pressure SF6 circuit breaker with a guaranteed leak
rate of 0.5% by weight or less by year; 2. Density monitor alarm system; and 3. Develop and implement a written LDAR program.
The ABBK facility will require one (1) breaker using 82 lbs of SF6. At a leak rate of 0.5%, annual SF6 emissions would be a maximum of 0.41 pounds per year, which would equal 4.9 short tons CO2e per year.
G. BACT Compliance
Fugitive SF6 emissions shall be calculated by measuring "top-ups", i.e., the replacement of lost SF6 with new product. The amount of SF6 that has leaked and entered the atmosphere is the amount that has to be topped up to maintain a full SF6 level. Therefore, no direct monitoring of SF6 fugitive emissions will be required. In place of direct monitoring, a surrogate monitoring process through measuring the amount of SF6 lost and using a conversion factor to calculate daily SF6 fugitive emissions in terms of CO2e shall be implemented. For every replacement event of lost SF6 with new product, ABBK shall record the date and quantity of SF6 lost in pounds, and time period in days since the previous addition of SF6. The recorded data shall be converted to pounds CO2e per day.
ABBK shall install a density monitor alarm system to alert controllers when a circuit breaker loses SF6. This alarm shall function as an early leak detector that will bring potential fugitive SF6 emissions problems to light before a substantial portion of the SF6 escapes. In the event of an alarm, ABBK shall investigate the event and take any necessary corrective action to address any problems.
ABBK shall provide construction specifications, operation and maintenance records, and other record keeping documents to KDHE upon request to demonstrate compliance with BACT.

DRAFT
Page 6 of 37
III. Cogeneration Biomass-fired Stoker Boiler GHG BACT Analysis
A. Source Description
The cogeneration plant will employ one (1) water-cooled vibrating grate (stoker) boiler. The boiler will be capable of producing 325,000 pounds per hour of 920 pound-force per square inch gauge (psig) /750 oF steam. The high pressure steam supplies a single condensing-extraction steam turbine generator nominally rated at 22 Megawatts of electricity (MWe). Electrical power will be supplied only to the facility. Power sales to the grid are not foreseen at this time.
Enzymatic hydrolysis process steam is extracted from the turbine at a lower pressure from extraction ports. Boiler feedwater preheater steam and deaeration steam is also extracted from the turbine from extraction ports. Exhaust steam is condensed under vacuum against cooling water in the cooling water tower. The stoker boiler's maximum design heat input is 500 million British thermal units per hour (MMBtu/hr). The stoker boiler is capable of burning a combination of raw biomass (consisting of corn stover, wheat straw, milo (sorghum) stubble, corn stover, switchgrass, and other opportunity feedstocks that are available), enzymatic hydrolysis residuals (including lignin-rich stillage cake and thin stillage syrup), particles collected during biomass grinding, NCG vent streams, wastewater treatment sludge and biogas. Natural gas will be used during start-up periods as required per manufacturer recommendations. The stoker boiler will also be capable of firing on natural gas during normal operations as needed at a limited capacity, as well as firing on a combination of natural gas, liquid fuel (i.e. enzymatic hydrolysis thin stillage syrup) and biogas in the event of a solid fuel failure. The cogeneration process will utilize up to 812 dry tons/day of fuel feedstock. The biomass-fired stoker boiler is the main source of anthropogenic GHG emissions (CO2, CH4, and N2O) at the facility. The total CO2-based emissions from the boiler are 481,652 tons/yr of CO2e. This amount of CO2e-based emissions is over 81% of the total facility-wide CO2e-based emissions.
B. Identify Available Control Options
The following control options have been identified and considered in determining BACT:
1. Use of low-carbon and carbon neutral fuels;
a. Corn stover b. Wheat straw c. Milo stubble d. Wood chips/wood residues e. Switchgrass f. Other opporunity agricultural residues and energy crops
DRAFT
Page 7 of 37
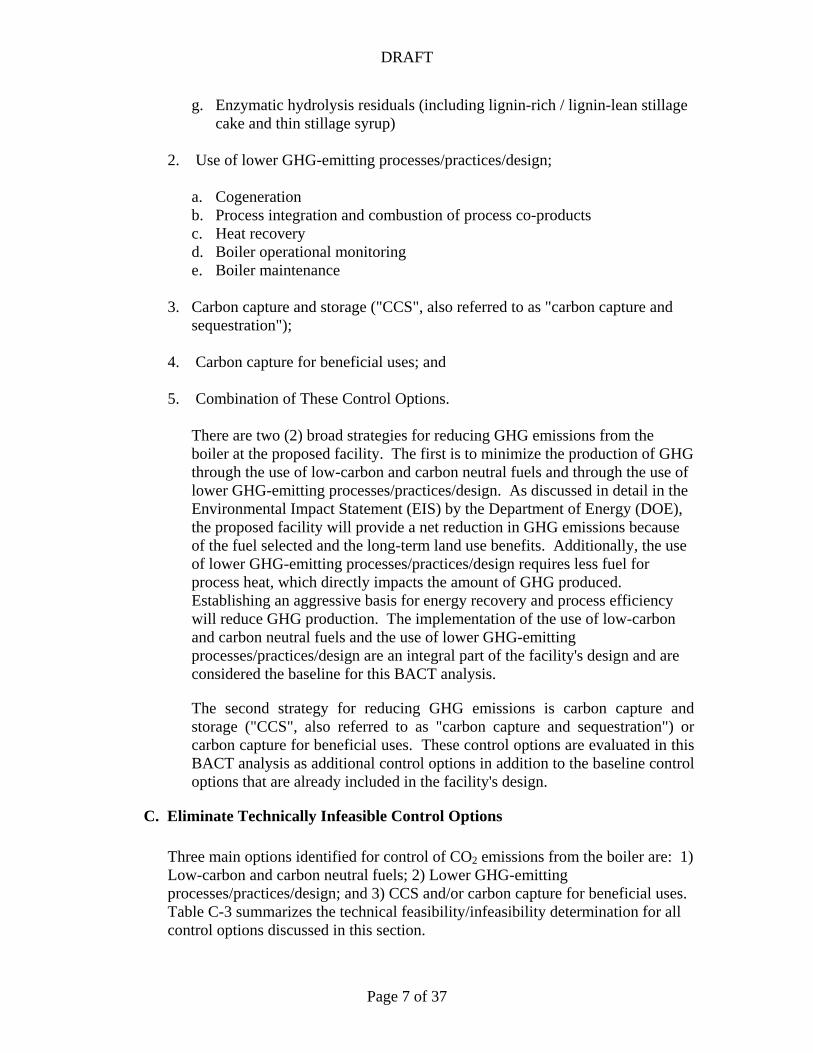
g. Enzymatic hydrolysis residuals (including lignin-rich / lignin-lean stillage cake and thin stillage syrup)
2. Use of lower GHG-emitting processes/practices/design;
a. Cogeneration b. Process integration and combustion of process co-products c. Heat recovery d. Boiler operational monitoring e. Boiler maintenance
3. Carbon capture and storage ("CCS", also referred to as "carbon capture and
sequestration");
4. Carbon capture for beneficial uses; and 5. Combination of These Control Options.
There are two (2) broad strategies for reducing GHG emissions from the boiler at the proposed facility. The first is to minimize the production of GHG through the use of low-carbon and carbon neutral fuels and through the use of lower GHG-emitting processes/practices/design. As discussed in detail in the Environmental Impact Statement (EIS) by the Department of Energy (DOE), the proposed facility will provide a net reduction in GHG emissions because of the fuel selected and the long-term land use benefits. Additionally, the use of lower GHG-emitting processes/practices/design requires less fuel for process heat, which directly impacts the amount of GHG produced. Establishing an aggressive basis for energy recovery and process efficiency will reduce GHG production. The implementation of the use of low-carbon and carbon neutral fuels and the use of lower GHG-emitting processes/practices/design are an integral part of the facility's design and are considered the baseline for this BACT analysis.
The second strategy for reducing GHG emissions is carbon capture and storage ("CCS", also referred to as "carbon capture and sequestration") or carbon capture for beneficial uses. These control options are evaluated in this BACT analysis as additional control options in addition to the baseline control options that are already included in the facility's design.
C. Eliminate Technically Infeasible Control Options
Three main options identified for control of CO2 emissions from the boiler are: 1) Low-carbon and carbon neutral fuels; 2) Lower GHG-emitting processes/practices/design; and 3) CCS and/or carbon capture for beneficial uses. Table C-3 summarizes the technical feasibility/infeasibility determination for all control options discussed in this section.

DRAFT
Page 8 of 37
Table C-3. Technical Feasibility/Infeasibility Determination Summary
Potentially Available Control Option
Determination Result
Determination Reason
Fuel Type Restriction to Low-Carbon and Carbon Neutral
Fuels
Technically Feasible
Inherent part of the facility's design, and considered a baseline control option.
Lower GHG-Emitting Processes/Practices/Design
Technically Feasible
Inherent part of the facility's design, and considered a baseline control option.
Carbon Capture Using Pre-combustion Capture
Technically Infeasible
Technology would redefine the project.
Carbon Capture Using Oxygen-fired Combustion
Technically Infeasible
Technology would redefine the project.
Carbon Capture Using Post-Combustion Capture
Technically Feasible
Chemical absorption has been the most widely used method of commercial CO2 capture
and is the primary CO2 capture technology further analyzed.
Carbon Transportation Technically
Feasible
Technical issues can be addressed through modern pipeline construction and maintenance practices.
Carbon Storage through Geologic Sequestration
Technically Feasible
In Kansas, geologic sequestration of CO2 may be
possible in all five of the geologic formations: deep
saline aquifers, coal seams, oil and natural gas reservoirs, oil-
and gas-rich organic shales, and basalt
Carbon Storage through Terrestrial Sequestration
Technically Feasible
Inherent part of the facility's design, and considered a baseline control option.
Carbon Beneficial Uses Technically
Feasible
The many different technologies being
investigated for the beneficial use of CO2 vary widely in
their stages of development, from those being tested at the bench-scale, to technologies
that are close to commercialization.
Combination of these Control Options
Technically Feasible
See reasons above.
DRAFT
Page 9 of 37
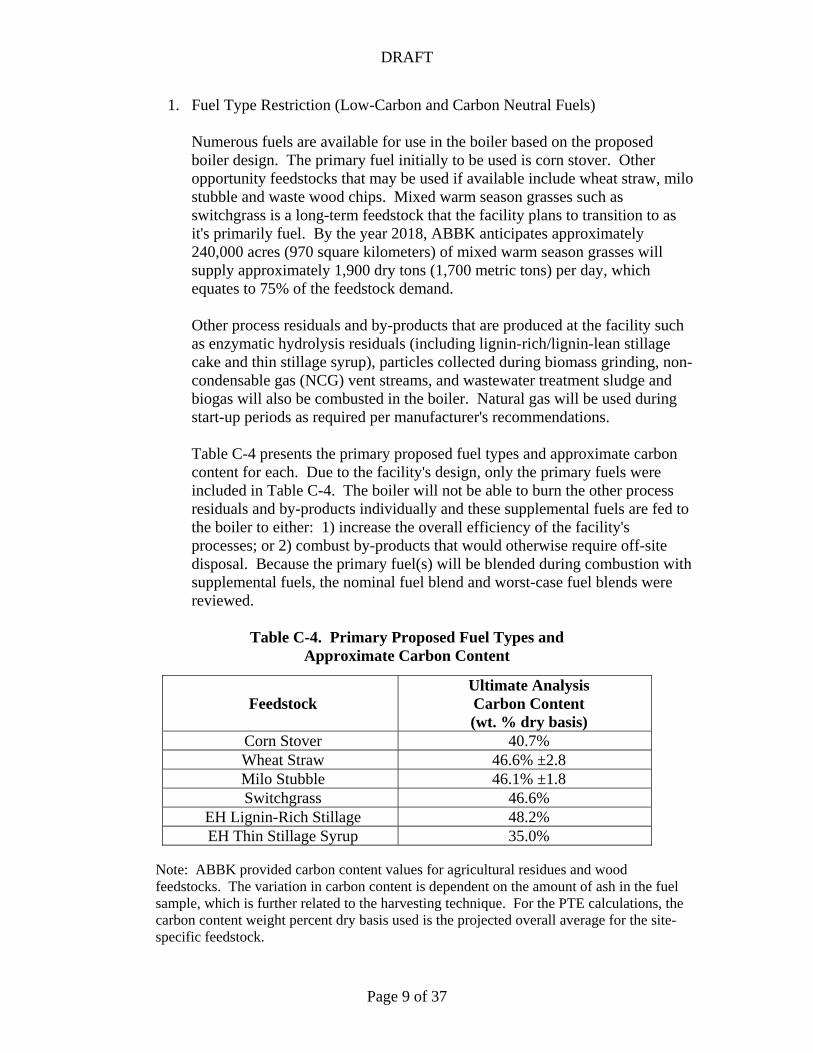
1. Fuel Type Restriction (Low-Carbon and Carbon Neutral Fuels)
Numerous fuels are available for use in the boiler based on the proposed boiler design. The primary fuel initially to be used is corn stover. Other opportunity feedstocks that may be used if available include wheat straw, milo stubble and waste wood chips. Mixed warm season grasses such as switchgrass is a long-term feedstock that the facility plans to transition to as it's primarily fuel. By the year 2018, ABBK anticipates approximately 240,000 acres (970 square kilometers) of mixed warm season grasses will supply approximately 1,900 dry tons (1,700 metric tons) per day, which equates to 75% of the feedstock demand. Other process residuals and by-products that are produced at the facility such as enzymatic hydrolysis residuals (including lignin-rich/lignin-lean stillage cake and thin stillage syrup), particles collected during biomass grinding, non-condensable gas (NCG) vent streams, and wastewater treatment sludge and biogas will also be combusted in the boiler. Natural gas will be used during start-up periods as required per manufacturer's recommendations.
Table C-4 presents the primary proposed fuel types and approximate carbon content for each. Due to the facility's design, only the primary fuels were included in Table C-4. The boiler will not be able to burn the other process residuals and by-products individually and these supplemental fuels are fed to the boiler to either: 1) increase the overall efficiency of the facility's processes; or 2) combust by-products that would otherwise require off-site disposal. Because the primary fuel(s) will be blended during combustion with supplemental fuels, the nominal fuel blend and worst-case fuel blends were reviewed.
Table C-4. Primary Proposed Fuel Types and
Approximate Carbon Content
Feedstock Ultimate Analysis Carbon Content (wt. % dry basis)
Corn Stover 40.7% Wheat Straw 46.6% ±2.8 Milo Stubble 46.1% ±1.8 Switchgrass 46.6%
EH Lignin-Rich Stillage 48.2% EH Thin Stillage Syrup 35.0%
Note: ABBK provided carbon content values for agricultural residues and wood feedstocks. The variation in carbon content is dependent on the amount of ash in the fuel sample, which is further related to the harvesting technique. For the PTE calculations, the carbon content weight percent dry basis used is the projected overall average for the site-specific feedstock.

DRAFT
Page 10 of 37
It should be noted that agricultural residues typically contain very similar amounts of carbon. The potential-to-emit (PTE) was developed with a best case (corn stover) and worst case (maximum wood) fuel blend in mind. Table C-5 presents the CO2 emission rates for the proposed fuel blends compared to other common fossil fuels used for electricity generation.
Table C-5. CO2 Emission Rates for the Proposed Fuel Blends Compared to Other Common Fossil Fuels Used for Electricity Generation
Fuels Emission Factors
(lb/MMBtu) CO2 CH4 N2O
Proposed Fuel Blends
Nominal TYPICAL Fuel Blend Corn Stover: 185.3 dry ton/day
EH Lignin-Rich Stillage: 320.6 dry ton/day EH Thin Stillage Syrup: 209.5 dry ton/day
Biogas: 52.7 dry ton/hr
216.00 0.071 0.009
Maximum WORST CASE Fuel Blend Corn Stover: 109.3 dry ton/day
EH Lignin-Rich Stillage: 384.7 dry ton/day EH Thin Stillage Syrup: 251.4 dry ton/day
Biogas: 63.2 dry ton/hr
215.54 0.071 0.009
Common Fossil Fuels Used for
Electricity Generation
Natural Gas
117.00 0.002 0.0002
Distillate Fuel Oil (#1, #2 and #4)
161.30 0.007 0.001
Electric Power (Coal Combustion)
208.26 0.002 0.004
Note 4: Fossil fuel emissions factors obtained from the California Climate Action Registry, General Reporting Protocol, Version 3.1, January 2009, Tables C.7 and C.8.
The DOE1, 2 and IPCC3, have established that non-fossil fuel-based electricity generation (including both biomass and biogas) is assumed to yield no net
1 Under the carbon accounting protocol of the IPCC, use of biomass fuels for energy does not add to the net amount of carbon in the atmosphere. Multiple DOE laboratories including the National Renewable Energy Laboratory (NREL) and the National Energy Technology Laboratory (NETL), recognize and follow the IPCC carbon accounting protocol.

DRAFT
Page 11 of 37
emissions of CO2 (i.e. these fuels are carbon neutral) because of the sequestration of biomass during the planting cycle. Other carbon reporting protocols, such as the California Climate Action Registry's (CCR), General Reporting Protocol, specifically state that CO2 emissions from burning wood, wood waste and biogas are considered biogenic and should not be included as a direct stationary emissions in CO2 inventories. Therefore, the proposed primary fuels are presented in this BACT as carbon neutral fuels. The natural gas used for the start-up of the boiler is a low carbon fuel as illustrated in Table C-5. BACT based on this control option is the use of biomass as a primary feedstock that is otherwise considered to have low to no economic value or benefit (i.e. crop residuals and waste wood); and/or is a lower impacting crops (i.e. mixed warm season grasses such as switchgrass). BACT based on this control option is also limiting the boiler to using natural gas for start-up. This control option is technically feasible for the biomass-fired boiler, is an inherent part of the facility's design, and is considered a baseline control option.
2. Lower GHG-Emitting Processes/Practices/Design
There are numerous strategies for achieving a highly energy efficient design of a new condensing-extraction steam turbine electrical power generation facility. Energy efficiency in the overall design of the power production process reduces the parasitic load, which in turn requires less fuel for process heat to generate the same amount of electricity, which directly impacts the amount of GHG emissions from the facility. All identified strategies (i.e. control options) listed in this section are technically feasible for application to the biomass-fired boiler, as well as related processes, and all are an inherent part of the facility's design.
a. Cogeneration as a CO2 Reduction Strategy – Cogeneration is the
simultaneous production of electric power and thermal energy from a single fuel. The reduction in CO2 emissions from employing cogeneration comes from the reduced fuel use at electric utility power plants; thus, the amount of CO2 reduction is dependent upon the type of electric utility power generation displaced. The use of the direct-fired boiler system in which biomass feedstocks are burned directly will produce steam. This steam drives a turbine, which turns a generator that converts the power into electricity. The spent steam from the onsite power plant is then used
2 Technical Guidelines, Voluntary Reporting of Greenhouse Gases (1605(b)) Program, Office of Policy and International Affairs, U.S. Department of Energy, January 2007, Page 51 (available at: http://www.pi.energy.gov/documents/January2007_1605bTechnicalGuidelines(1).pdf) 3 National Greenhouse Gas Inventories Program, Eggleston H.S., Buendia L., Miwa K., Ngara T. and Tanabe K. (eds), 2006 IPCC Guidelines for National Greenhouse Gas Inventories, Volume 4: Agriculture, Forestry and Other Land Use (available at: http://www.ipcc-nggip.iges.or.jp/public/2006gl/index.html)

DRAFT
Page 12 of 37
in other process areas at the facility and to heat facility buildings, when feasible. Such combined heat and power systems greatly increase overall energy efficiency which has a direct impact on the amount of GHG emissions from the system.
b. Process Integration and Combustion of Co-products – ABBK will make
use of the most advanced design approaches to integrate the process units and to maximize energy efficiency. Some of the major integration measures of the power generation system with other facility processes include low pressure steam supplied to the enzymatic hydrolysis process and the combustion of process co-products such as enzymatic hydrolysis residuals (including lignin-rich/lignin-lean stillage cake and thin stillage syrup), particles collected during biomass grinding, NCG vent streams, and wastewater treatment sludge and biogas. The largest co-product (on a mass basis and energy basis) is lignin-rich stillage cake, as detailed in the PTE calculations. The lignin-rich stillage cake adds approximately 210 MMBtu/hr to the total boiler system. The next largest co-product (on a mass basis and energy basis) is the thin stillage syrup, which adds approximately 109 MMBtu/hr. Wastewater treatment will consist of anaerobic treatment followed by aerobic treatment for the purpose of generating a biogas that can be added to the boiler as fuel. Anaerobic biogas would be treated to remove sulfur and then burned in the biomass boiler for an additional 42.30 MMBtu/hr of energy.
c. Heat Recovery – Periodically or continuously, some water in the boiler is
removed as a means of avoiding the build-up of water impurities in the boiler. The boiler’s design includes blowdown waste heat exchangers with raw water makeup. The low pressure boiler feedwater will be preheated with a combination of process waste heat and low pressure steam extraction to improve the power cycle efficiency. Also, process steam condensate is recovered from indirect process steam users and returned to the boiler feedwater system. The process condensate will be cooled with reverse osmosis water, in order to meet the temperature requirements on the condensate polishing resin. The energy is recovered in the reverse osmosis makeup water. Air preheat, which is a method of recovering heat from the hot exhaust gas of a combustion process by heat exchange with the combustion air before it enters the combustion chamber, will be included in the boiler's design. In addition to process integration techniques to be utilized, the boiler's design includes economizers to improve power cycle.
d. Boiler Operational Monitoring – Excessive amounts of combustion air
used in results in energy inefficient operation because more fuel combustion is required in order to heat the excess air to combustion temperatures. Using state-of-the-art instrumentation for monitoring and controlling the excess air levels in the combustion process, will reduce the

DRAFT
Page 13 of 37
heat input by minimizing the amount of combustion air needed for safe and efficient combustion. The boiler's design includes an online stack oxygen analyzer. Oxygen levels will be monitored and the inlet air flow will be adjusted for optimal thermal efficiency within the operating limits of the boiler. Additionally, optimized air/fuel ratios, reduce not only CO2 emissions but also NOx emissions. The boiler will be equipped with online stack oxygen analyzers as part of the continuous emission monitoring system (CEMS).
e. Boiler Maintenance – The boiler will be maintained in accordance with
the manufacturer's recommendations. Maintenance of the boiler is performed to increase efficiency, ensure safety and prevent unscheduled shutdowns. Boiler outages for 10 to 14 days each year are planned for scheduled maintenance, cleaning, and "tune-up" to optimize performance.
3. Carbon Capture
Approaches to CO2 capture can be divided into three categories:
a. Pre-Combustion
Pre-combustion capture involves reacting a fuel with oxygen or air, and/or steam to produce a "synthesis gas" or "fuel gas" composed mainly of CO and H2. The CO is reacted with steam in a catalytic reactor, called a shift converter, to give CO2 and more H2. CO2 is then separated from the gas mixture, usually by a physical or chemical absorption process, resulting in a hydrogen-rich fuel which can be used in many applications, such as a combustion turbine or boiler. This approach would require a complete redesign of the boiler so that they would burn a gaseous fuel. The November 2010 EPA GHG guidance clearly states that control technologies with inherently lower polluting processes that would fundamentally redefine the nature of the source do not need to be evaluated.4 The DOE is proposing to provide federal funding to ABBK to support the final design, construction, and startup of a biomass-to-ethanol and biomass-to-energy production facility. The DOE funding is based on the proposed facility design. ABBK's basic or fundamental business purpose or objective for this project is dependent on the biomass-fired boiler as proposed. Therefore, pre-combustion as a control technology is technically infeasible.
b. Oxygen-Fired Combustion
In the oxygen-fired combustion (oxy-combustion) approach, the biomass is combusted in an enriched oxygen environment resulting in a flue gas that is mainly CO2 and H2O. This flue gas stream can directly be fed into
4 PSD and Title V Permitting Guidance for Greenhouse Gases, supra note13, Page 27.

DRAFT
Page 14 of 37
a CO2 compression and dehydration unit. Oxygen-fired combustion is simpler and less chemically intensive than post-combustion CO2 capture, but is less mature and similarly expensive. Because the boiler is designed to use air for combustion, the use of oxygen would require substantial redesign, and as discussed previously. Therefore, oxy-combustion as a control technology is technically infeasible.
c. Post-Combustion Capture
Post-combustion capture methods are applied to conventional combustion processes using air and carbon-containing fuels in order to isolate CO2 from the combustion exhaust gases. Because the air used for combustion contains nearly 80% nitrogen, the CO2 concentration in the exhaust gases is approximately 10% to 15% depending on the amount of excess air and the carbon content of the fuel. Additionally, post-combustion capture of CO2 is a challenging application because:5
The low pressure and dilute concentration dictate a high actual volume
of gas to be treated; Trace impurities in the flue gas tend to reduce the effectiveness of the
CO2 absorbing processes; and Compressing captured CO2 from atmospheric pressure to pipeline
pressure (1200 to 2000 pounds per square inch (psi)) represents a large parasitic load.
Post-combustion capture methods require separating the CO2 from other flue gases because sequestration of combustion gases is not feasible due in part to the cost of gas compression and storage. The most likely options currently identifiable for CO2 separation and capture include: 6
i. Absorption (chemical and physical). Chemical absorption has been
the most widely used method of commercial CO2 capture for over 60 years.7 The main existing commercial applications include enhanced oil recovery (EOR), which involves increasing oil production rates by injecting CO2 into oil wells. Liquid scrubbing is the most common form of chemical absorption, consisting of two contacting towers (one for CO2 absorption and one for CO2 desorption/absorbent regeneration). Chemical absorption is a chemical reaction that forms a loosely bonded intermediate compound. For the CO2 capture application, a chemical solvent is exposed to the flue gas where it
5 NETL, Carbon Sequestration, CO2 Capture website (available at: http://www.netl.doe.gov/technologies/carbon_seq/core_rd/co2capture.html). 6 U.S. DOE, Carbon Capture Research website (available at: http://www.fossil.energy.gov/programs/sequestration/capture). 7 Herzog, H., An Introduction to CO2 Separation and Capture Technologies, MIT Energy Laboratory, August 1999 (available at: http://sequestration.mit.edu/pdf/introduction_to_capture.pdf).

DRAFT
Page 15 of 37
reacts chemically with CO2 separating it from the other gases. The intermediate compound is then isolated and heated causing it to break down into separate streams of CO2 and solvent. The solvent most often used is monoethanolamine (MEA). The primary concerns with MEA and other amine solvents are corrosion in the presence of O2 and other impurities and high solvent degradation rates due to reactions with SO2 and NOx. Degradation and oxidation of the solvents over time produces products that are corrosive and may require hazardous material handling procedures. These difficulties can be overcome, and this capture method is technically feasible. Other chemical absorption methods are at bench and laboratory scales of development. No CO2 absorption technology demonstrations, except for liquid scrubbing using alkanolamines for CO2 removal, have been successfully performed on similar type and sized sources8. Physical absorption processes are commonly used for CO2 rejection from natural gas and operate at high pressure and low temperature. Use of physical absorption for CO2 capture from combustion exhaust gas would entail a significant amount of gas compression capacity and a significant energy penalty. This capture method is presumed for the purposes of this analysis to be technically feasible, but because chemical absorption has been commercially demonstrated for CO2 capture and physical absorption does not offer any capture/control, capital or operating cost benefits, this CO2 capture technique will not be considered further in this analysis.
ii. Adsorption (Physical and Chemical) Adsorption involves ducting the exhaust gas through a bed of solid material with high surface areas, such as zeolites or activated carbon to adsorb CO2 while allowing nitrogen and other gases to pass through. Adsorption would require either a high degree of compression or multiple separation steps to produce high CO2 concentration from exhaust gas.
iii. Low-Temperature Distillation (Cryogenic Separation) Cryogenic separation is based on solidifying the CO2 component of the exhaust stream by freezing it to separate it out.
8 The PCO2R December 2009 report indicated that a technology demonstration project for liquid scrubbing using ammonia as the absorbent was to be conducted at the Basin Electric Power Cooperative for the 125 MW Antelope Valley Power Station. As of December 2010, Basin Electric postponed the CO2 capture project due to technical, operational, regulatory and financial risks for installing carbon-capture technology at the conventional coal-based power plant.

DRAFT
Page 16 of 37
iv. Gas separation membranes Gas separation membranes (or simply membranes) capture CO2 by separating it from the other exhaust gases using different mechanisms of separation including solution-diffusion and molecular sieving.
v. Mineralization and biomineralization (carbon calcification) Mineralization offers a leak-proof, permanent solution, whereby CO2 is fixed into a solid matrix of minerals to form thermodynamically stable carbonate minerals. The large volumes of material involved with mineralization present significant challenges for transportation and capture, these CO2 capture technique will not be considered further in handling. No large-scale demonstrations of most of these technologies have been performed on similar exhaust streams. These capture methods are presumed for the purposes of this analysis to be technically feasible, but because these methods have not been commercially demonstrated for CO2 this analysis. Based on identified post-combustion CO2 separation and capture methods, the only commercially demonstrated method for similar exhaust streams is chemical absorption (liquid scrubbing employing alkanolamines).
4. Carbon Transport
Once captured, CO2 must be transported to a suitable storage site in order to achieve any environmental benefit. CO2 pipelines are the most prevalent means of bulk CO2 transport and are a mature market technology in operation today.9 Pipeline transportation of CO2 is typically accomplished with CO2 that is compressed to its supercritical state, involving pressures of 1200 to 2000 psi. In addition, water must be eliminated from CO2 pipeline systems, as the presence of water results in formation of carbonic acid, which is extremely corrosive to carbon steel pipe. In overall construction, CO2 pipelines are similar to natural gas pipelines, requiring the same attention to design, monitoring for leaks, and protection against overpressure, especially in populated areas. All of these technical issues can be addressed through modern pipeline construction and maintenance practices.
9 Intergovernmental Panel on Climate Change (IPCC) Guidelines for National Greenhouse Gas Inventories, Volume 2: Energy, Chapter 5: Carbon Dioxide Transport, Injection and Geological Storage, § 5.4: CO2 Transport, 2006, Page 5.8 (available at: http://www.ipcc- nggip.iges.or.jp/public/2006gl/pdf/2_Volume2/V2_5_Ch5_CCS.pdf).

DRAFT
Page 17 of 37
5. Carbon Storage
Deploying carbon storage in commercial-scale applications requires adequate geologic formations capable of: 1) sequestering large volumes of CO2; 2) receiving CO2 at an efficient and economic rate of injection; and 3) retaining CO2 safely over extended periods. In south-central and southwest Kansas, potential geologic sequestration sites within saline aquifers and depleted oil reservoirs within the Ozark Plateau Aquifer System (OPAS) are being studied. Starting in December 2009, the University of Kansas, BEREXO Inc., Bittersweet Energy Inc., the Kansas Geological Survey, and the Kansas State University, began to evaluate potential CO2 sequestration sites within saline aquifer and depleted oil reservoirs within the Ozark Plateau Aquifer System (OPAS). The study is focusing on the Wellington Field, with evaluation of the CO2-EOR potential of its Mississippian Chert Reservoir and the sequestration potential in the underlying Cambro-Ordovician Arbuckle Group Saline Reservoir. 10 The purpose of the study is to provide a more detailed analysis of the storage potential of a local area within OPAS (an area covering approximately 17 counties in south-central Kansas) by modeling CO2 injection within the Arbuckle Group Saline Aquifer and Mississippian Chert Oil Reservoir at Wellington Field (Sumner County, Kansas). Currently, CO2 is only captured in Kansas at a few facilities that produce high-purity CO2.
11 In Kansas, geologic sequestration of CO2 may be possible in all five of the geologic formations: deep saline aquifers, coal seams, oil and natural gas reservoirs, oil- and gas-rich organic shales, and basalt (the most problematic because no one knows how much CO2 the ancient rock--deeply buried in parts of Kansas--can hold). Altogether, researchers estimate Kansas has at least 2.7 to 5.4 billion tons of potential geologic sequestration space, enough to hold almost 70 years worth of the state's stationary CO2 production.12 Stevens County, Kansas is located in an area known for oil and gas production, as well as deep saline formations. The proposed facility will be constructed in Section 18, Township 33S, Range 37W. Within this area are the Hugoton Gas Area, Panoma Gas Area and Gentzler oil and gas fields. Table C-6 summarizes the oil and gas production for the state and county in 2009.13, 14
10 U.S. DOE, National Energy Technology Laboratory, Modeling CO2 Sequestration in a Saline Reservoir and Depleted Oil Reservoir to Evaluate The Regional CO2 Sequestration Potential of The Ozark Plateau Aquifer System, South-Central Kansas, FE0002056, May 2010 (available at: http://www.netl.doe.gov/publications/factsheets/project/FE0002056.pdf). 11 Kansas Geological Survey, Geologic Sequestration of Carbon Dioxide in Kansas, Public Information Circular 27, December 2008 (available at: http://www.kgs.ku.edu/Publications/PIC/pic27.html). 12 Geologic Sequestration of Carbon Dioxide in Kansas, supra note 27. 13 Kansas Geological Survey, State Production and Historical Information website (available at: http://www.kgs.ku.edu/PRS/petro/state.html).

DRAFT
Page 18 of 37
Table C-6. Summary of Oil and Gas Production in
State of Kansas and Stevens County For 2010
Oil Production Production (bbls)
No. of Wells Cumulative (bbls)
State-Wide 40,467,966 45,999 6,353,888,940 Stevens County 678,852 139 26,956,160 County Percentage 1.67% 0.30% 0.42% Gas Production Production
(mcf) No. of Wells Cumulative (mcf)
State-Wide 331,539,924 25,232 39,055,863,258 Stevens County 48,758,979 2,195 8,747,453,719 County Percentage 15.0% 8.70% 22.40% Note: Units are barrels (bbls) and 1000 cubic feet (mcf).
In Kansas, concerns have been raised about regulating CO2-EOR and other geologic sequestration activities and whether the CO2 would be trapped in these reservoirs or move back to the surface over time. Because Kansas has long been drilled for oil and gas and some areas have been very densely drilled, concerns also exist that CO2 could move back to the surface through poorly plugged or long-forgotten wells. According to the Kansas Geological Survey, sequestration in Kansas needs to be studied in more detail to determine if oil and natural gas reservoirs and coal beds have the capacity to take and hold CO2. In addition, a variety of legal issues, such as ownership of the underground pore space used for sequestration, would need to be resolved, and a workforce would have to be developed. Ultimately, regulatory decisions, economics, and a well-defined environment for GHG management will highly influence any decisions concerning the feasibility of geologic sequestration.15 In addition to the CO2 storage options already discussed, the other primary storage option available includes using terrestrial applications. Terrestrial sequestration is the enhancement of CO2 uptake by plants that grow on land and in freshwater and, importantly, the enhancement of carbon storage in soils where it may remain more permanently stored. In general, croplands store less carbon than grasslands which store less carbon than forests. Grasslands are particularly good at storing carbon in soils because they often have extensive and deep roots. DOE determined in the EIS that "warm season grass production would likely occur on marginal and non-
14 Kansas Geological Survey, Stevens County – Oil and Gas Production website (available at: http://www.kgs.ku.edu/PRS/County/rs/stevens.html). 15 Geologic Sequestration of Carbon Dioxide in Kansas, supra note 27.

DRAFT
Page 19 of 37
harvested cropland, pasture, and former CRP lands. Bioenergy crops have the potential to reduce atmospheric carbon by building up soil carbon levels, especially when planted on lands where soil carbon levels have been reduced by intensive tillage, such as marginal cropland. In instances where pasture or former CRP lands would be converted to warm season grass production, exchanging one system of perennial vegetation for another would be expected to involve minimal environmental changes, including greenhouse gas emissions. A 2007 study on the Life-Cycle Energy and Greenhouse Gas Emission Impacts of Different Corn Ethanol Plant Types16 concluded that cellulosic ethanol produced from switchgrass [switchgrass is a type of warm season grass] clearly offers the greatest energy and [greenhouse gas] benefits (by far)."17 Based on these considerations, DOE concluded that in the event warm season grasses were to replace corn stover as the dominant feedstock, the net result to greenhouse emissions would be beneficial. By the year 2018, ABBK anticipates approximately 240,000 acres (970 square kilometers) of mixed warm season grasses will supply approximately 1,900 dry tons (1,700 metric tons) per day, which equates to 75% of the feedstock demand. The change from corn stover to grasses is dependent first on the construction of the facility to generate the crop demand, and second on the negotiation of contracts with local farmers to change their farming practices from corn to grasses. ABBK's long-term operational plan for this facility is based on the feedstock change to mixed warm season grasses. Terrestrial sequestration provides an opportunity for low-cost CO2 emissions offsets. Storing carbon in terrestrial ecosystems can be achieved through maintenance of standing aboveground biomass, utilization of aboveground biomass in long-lived products, or protection of carbon (organic and inorganic) compounds present in soils.18 Because the proposed source consists of biomass-fired boiler, this type of CO2 storage is essentially being implemented as part of the facility's design; therefore, terrestrial sequestration is considered a baseline control option.
6. Carbon Beneficial Uses
In addition to using CO2 for enhanced oil recovery (EOR), there are many other possible beneficial and revenue-generating uses for captured CO2 in various stages of development. Technologies are being developed today that synthesize solid materials such as plastics, or carbonates that can be used in cement or glass, from a CO2 feedstock. There are other technologies under
16 Michael Wang, et. al., Center for Transportation Research, Argonne National Laboratory Life-Cycle Energy and Greenhouse Gas Emission Impacts of Different Corn Ethanol Plant Types, first published May 22, 2007 (available at: http://iopscience.iop.org/1748-9326/2/2/024001/pdf/1748-9326_2_2_024001.pdf). 17 Final Environmental Impact Statement for the Proposed Abengoa Biorefinery Project near Hugoton, Stevens County, Kansas, supra note 11, Page 4-30. 18 Gary K. Jacobs, et. al., Oak Ridge National Laboratory, Oak Ridge, TN, Carbon Sequestration in Terrestrial Ecosystems: A Status Report on R&D Progress, August 2000 (available at: http://www.netl.doe.gov/publications/proceedings/01/carbon_seq/3C1.pdf).

DRAFT
Page 20 of 37
development that do not provide long-term storage of CO2, but which still could reduce overall GHG emissions by either 1) using CO2 in a way that displaces the emission of other GHGs, or 2) converting CO2 into a chemical that can in turn displace the emission of other GHGs. An example of the former is using CO2 as a refrigerant that substitutes for chemicals currently used in refrigeration that are far more potent greenhouse gases than CO2, such as hydrofluorocarbons (HFCs). An example of the latter is the wide array of "CO2-to-fuel" technologies being researched with the goal of producing liquid fuels ranging from methanol or ethanol to gasoline or diesel out of CO2 and water, along with an energy input (preferably from a CO2-free source such as solar or wind). Fuels produced from waste CO2 could displace the use of petroleum-derived fuels, which would result in reduced net GHG emissions. Some of the better-known types of CO2-to-fuel technologies are biologically based and use algae and other photosynthetic microorganisms in the conversion of CO2, water, and sunlight into liquid fuel. A number of different companies are trying to commercialize technologies that use photosynthetic microbes to convert CO2 to fuel. Some other uses of CO2 that are being researched do not clearly reduce GHG emissions directly or indirectly, but still provide some other public benefit such as displacing the use of the toxic chemicals or saving water. Examples include using CO2 as a solvent in place of perchlorethlyene for dry cleaning, or using CO2 as a non-toxic grain silo fumigant. The many different technologies being investigated for the beneficial use of CO2 vary widely in their stages of development, from those being tested at the bench-scale, to technologies that are close to commercialization. They also vary widely in their potential to impact overall GHG emissions. There is a need to better understand the viability of the various technological options for CO2 use and their potential to incentivize industrial carbon capture and provide substantive GHG emissions reductions. The majority of CO2 in the merchant market19 is used for EOR (approximately 70-80%),20 along with a significant portion used in the food processing industry. CO2 currently being utilized that has been separated from flue gas or chemical process streams is generally either captured from relatively pure flue gas streams or from process streams where CO2 capture and separation is necessitated by a need for product purity (e.g., natural gas pipelines or ammonia production).21
19 Market in which CO2 is bought and sold competitively by multiple market participants. 20 Tiina Koljonen, Hanne Siikavirta, Ron Zevenhoven, CO2 Capture, Storage and Utilization in Finland, Project Report, VTT Processes, Systems and Models, August 29, 2002 (available at: www.vtt.fi/inf/julkaisut/muut/2002/co2capt.pdf). 21 Reed, John, California Carbon Capture and Storage Review Panel, Technical Advisory Committee Report – Beneficial Use of Carbon Dioxide, October 4, 2010, Page 1 (available at: http://www.climatechange.ca.gov/carbon_capture_review_panel/meetings/2010-10-21/white_papers/Beneficial_Use_of_Carbon_Dioxide.pdf)

DRAFT
Page 21 of 37
For the purposes of this BACT analysis, the feasibility of CO2 capture, including economic, energy and environmental impacts, must first be established before storage and beneficial use options can be fully explored.
D. Rank Technically Feasible Options
Table C-7 presents the ranked technically feasible control options.
Table C-7. Ranked Control Options
The use of low-carbon and carbon neutral fuels, use of an aggressive lower GHG-emitting processes and practices through an energy-efficient design to reduce CO2 emissions, and terrestrial sequestration control options are an inherent part of the facility's design and considered baseline control options. No emissions reduction credit is taken for the implementation of the baseline control options. The baseline presented above represents the design with the highest efficiency improvements limited to the maximum worst-case fuel blend discussed in Section 2.4.2.2. of the GHG BACT analysis prepared by ABBK. A detailed analysis of the baseline CO2 control option(excluding terrestrial sequestration benefits)and three different operational cases (Case 1, Case 2 and Case 3) are shown in Table C-8.
Control Technology
Emission Rate (tons
CO2/year, excludes CH4
and N2O)
Reduction Efficiency
Emissions Reduction
(tons CO2/year, excludes CH4
and N2O)
Carbon Capture and Storage (CCS) ~ 48,000 90% ~ 433,500 Carbon Capture for Beneficial Uses ~ 48,000 90% ~ 433,500
Baseline (Fuel Type Restriction, Use of Lower GHG-emitting
Processes/Practices/Design and Terrestrial Sequestration
481,652 N/A N/A

DRAFT
Page 22 of 37
Table C-8. Detailed Comparison of the Impacts of Certain Heat Recovery Strategies on the Cogeneration System
Heat Recovery Strategies on the Cogeneration System
Heat Recovery Strategy Implemented
(Yes/No)
Baseline Case
(Proposed System)
Case 1 Case 2 Case 3
Biomass Boiler (Fuel Type Restriction) Yes Yes Yes Yes Air Preheat Yes Yes Yes No Economizer Yes Yes Yes No
High Pressure Boiler Feedwater Preheater Yes Yes No No Low Pressure Boiler Feedwater Preheaters Yes Yes No No
Process Waste Heat Integration Yes No No No Impacts from Implementing Each Heat Recovery Strategy
Gross Power Production, MWe 21.8 19.3 20.8 20.8 Estimated Net Power to Grid, MWe 2.8 0.3 1.8 1.8
Heat Rate, Btu/kW-hr 21,431.2 24,207.3 23,802.9 27,543.3 Cycle Efficiency, % 15.92% 14.10% 14.33% 12.39%
Overall Efficiency, % 183.6 183.6 183.6 183.6 Boiler Steam Production, lb steam/hr 325,000 325,000 325,000 325,000 CO2e Production (Maximum WORST
CASE Fuel Blend), lb CO2e/hr 109,966 109,966 116,645 135,165
CO2e/Steam Ratio (Maximum WORST CASE Fuel Blend), lb CO2e/lb steam
produced 0.34 0.34 0.36 0.42
The technically feasible control options for further controlling CO2 emissions or reducing overall CO2 impacts from the biomass-fired stoker boiler is carbon capture with either long term storage through geologic sequestration or beneficial use of the CO2 as a consumer product. For the purposes of this BACT analysis, chemical absorption is assumed to represent the best post-combustion CO2 capture option that has been commercially demonstrated. The evaluation of the control options in this BACT analysis focuses first on the effectiveness of CO2 capture, including economic, energy and environmental impacts; and then if CO2 capture is determined to be cost-effective, storage and beneficial use options will be evaluated.
E. Evaluate Technically Feasible Control Options
CCS in biomass-fired power plants may result in net CO2 removal from the atmosphere. However, biomass plants are typically small (25 to 50 MWe verses

DRAFT
Page 23 of 37
500 to1000 MWe coal power plants). Thus the CCS cost per kW is roughly twice as high as the cost in coal plants.22 For the purposes of this BACT analysis, the feasibility of CO2 capture, including economic, energy and environmental impacts will be evaluated first. If CO2 capture is determined to be cost-effective, storage and beneficial use options will be evaluated. As established above, the only commercially demonstrated post-combustion CO2 separation and capture method for similar exhaust streams is chemical absorption. The general method involves exposing a gas stream to an aqueous amine solution which reacts with the CO2 in the gas by an acid-base neutralization reaction to form a soluble carbonate salt:
2RNH2 + CO2 + H2O = (RHN3)2CO3 This reaction is reversible, allowing the CO2 gas to be liberated by heating in a separate stripping column. Therefore, the major advantage to this technique is that, in the ideal situation, the amine is not consumed and may be continuously recycled through the process. The amine used in this process is most commonly one of several alkanolamines including monoethanolamine (MEA). The technology was originally developed not for the purpose of carbon sequestration, but in order to "sweeten" natural gas streams by removing CO2. More recently, it was successfully adapted for recovery of CO2 from flue gas of coal-fired electric power generating plants. Currently, there are three (3) electric power generating stations in the U.S. that capture CO2 from flue gas and six (6) other major flue gas CO2 capture facilities worldwide. All nine (9) use MEA as the chemical sorbent.23
The disadvantage of the chemical absorption process is that it would consume a significant amount of the energy produced. A typical "energy penalty", which is defined as the percentage of the net power output consumed for the chemical absorption process installed on a conventional coal-fired power plant is between 25%-37%.24 This does not include transportation and injection costs, which would increase the economic burden even further. It is expected that the energy penalty for the biomass-fired boiler would be equivalent to that of a coal-fired power plant due to the similar CO2 emission rates. Certain factors affect the chemical absorption process implementation costs. These factors include the following: 1. The primary concerns with MEA and other amine solvents are corrosion in the
presence of O2 and other impurities and high solvent degradation rates due to reactions with SO2 and NOx. Post-combustion control of SO2 and NOx
22 International Energy Agency (IEA), IEA Energy Technology Essentials, CO2 Capture and Storage, ETE01, December 2006, Page 3 (available at: http://www.iea.org/techno/essentials1.pdf). 23 National Energy Technology Laboratory, Degradation of Monoethanolamine Used in Carbon Dioxide Capture from Flue Gas of a Coal-fired Electric Power Generating Station (available at: http://www.netl.doe.gov/publications/proceedings/01/carbon_seq/4b3.pdf) 24 Technical Overview of Carbon Dioxide Capture Technologies for Coal-Fired Power Plants, supra note 18, Page 5.

DRAFT
Page 24 of 37
before the chemical absorption system can reduce the affects of these pollutants.
2. The flue gas should be cooled to around 40 ºC for the CO2 absorption to take
place. This requires additional cooling water. 3. Steam heat is required to heat the solvent to release the CO2 during
regeneration. 4. Parasitic power is required for pumping the fluids through the chemical
absorption system. 5. Heat exchangers, scrubber towers, absorption towers, and heaters are required
for the process. 6. Replacement cost of the chemical solvent is high because regeneration is only
for few cycles. 7. Degradation and oxidation of the solvents over time produces products that
are corrosive and may require hazardous material handling procedures. 8. Work to date has used chemical absorption on a small scale. Issues involved
with scaling up the existing technology will need to be addressed. 9. Reliable operation of packed towers used in chemical absorption systems will
need to be demonstrated.
F. Economic and Energy Impacts
Another shortcoming of the chemical absorption process is that it has a relatively high capital cost. The large size of the major components significantly influences the capital cost. The footprint of the biomass-fired boiler footprint is expected to increase approximately 60% with the addition of chemical absorption-based CO2 capture. Because post-combustion CO2 capture has not been commercially demonstrated on biomass-fired electricity generating systems, there are no specific reference documents or demonstration projects that can be relied upon. Site-specific cost estimates for the purpose of constructing a commercial scale CO2 capture system would require significant time and engineering investment, as well as an initial bench-scale/pilot test prior to full scale application. Therefore, for the purposes of this BACT analysis, the Plains CO2 Reduction (PCOR) Partnership, the PCOR report, Regional Emissions and Capture Opportunities Assessment – Plains CO2 Reduction (PCOR) Partnership (Phase II) was relied upon for comparison purposes of the estimates CO2 capture costs presented herein. A copy of the PCOR report has been included in the application.

DRAFT
Page 25 of 37
Although the state of Kansas is not specifically included in the PCOR report, ABBK is a member of the PCOR Partnership and the cost analyses presented in the report were assumed comparable as the PCOR report included the neighboring states: Missouri and Nebraska. Capture and compression costs and power requirements for ethanol plants, gas-processing plants, and electricity-generating facilities were estimated in the PCOR report using the Integrated Environmental Control Model (IECM), Version 5.22 (released January 28, 2008) (IECM, 2008). The IECM is a desktop computer model that was developed at Carnegie Mellon University with funding from NETL, which is design to support a variety of technology assessment and strategic planning activities for the fossil fuel-fired power plants: pulverized coal plant, natural gas combined-cycle (NGCC) plant, coal-based integrated gasification combined-cycle (IGCC) plant, and oxyfuel combustion plant. The results from the IECM simulations conducted for the PCOR report show a significant cost and energy penalty for capturing 90% of the CO2 emitted from electricity-generating facilities. The PCOR report used a minimum 100 MW limit primarily because the economics and power requirements of capturing CO2 at units smaller than 100 MW would make electric generation at these units no longer feasible. In addition, the IECM has a lower estimation boundary level of 100 MW, meaning that values calculated using the IECM for units smaller than 100 MW may not depict the true costs and power requirements. For the purposes of the GHG BACT analysis, the data contained in the PCOR report was relied upon to fully demonstrate to KDHE that the cost of add-on CO2 control at the proposed biomass-to-energy system is not economically feasible. The PCOR report estimated the costs associated with capture, drying, compression separately from the cost of CO2 transportation by pipeline for sequestration or EOR. Injection costs for sequestration or any monetary value assigned to the CO2 for EOR have not been included in the cost or energy estimates.25 Including the cost of replacement power, the per-ton cost associated with CO2 capture, drying, and compression of 90% of the CO2 produced at the PCOR region's power plants would be $71 per short ton CO2 avoided.26 The increase in the cost of producing electricity caused by the capture, compression, and transport of the CO2 was estimated in the PCOR report to be 159% to 189% with CO2 capture, drying, and compression of 90% of the CO2 produced.27 The nearest commercial CO2 pipeline terminus is at Guymon Oklahoma, approximately 40 miles south of the proposed facility at the Mobil Exploration and Producing U.S. Postle Field Unit. ABBK estimated that the capital investment to install a CO2 pipeline to connect to the Mobil Exploration and
25 Regional Emissions and Capture Opportunities Assessment – Plains CO2 Reduction (PCOR) Partnership Phase II, supra note 26, Pages vi through viii. 26 Regional Emissions and Capture Opportunities Assessment – Plains CO2 Reduction (PCOR) Partnership Phase II, supra note 26, Table 12. 27 Regional Emissions and Capture Opportunities Assessment – Plains CO2 Reduction (PCOR) Partnership Phase II, supra note 26, Table 13.

DRAFT
Page 26 of 37
Producing U.S. Postle Field Unit would be $35 per linear foot, or $7,392,000, excluding right-of-way acquisitions, dehydration equipment, compressors, surge storage tanks, booster pumps, and operation and maintenance. The preparation of the CO2 for transport via pipeline will result in additional energy penalties, as well as additional emissions (including CO2). Because evaluations of the OPAS are ongoing,28 it has not been fully demonstrated that geologic sequestration in Kansas is technically feasible, therefore, transportation via pipeline for EOR is currently the only commercially demonstrated control option available. The CO2 value of $45 per metric ton ($41 per short ton) delivered at pressure to the field is presented as the base case in the NETL report, Storing CO2 with Enhanced Oil Recovery.29 Other estimates indicate that the CO2 costs with EOR as low as $10 per short ton. Based on the costs presented in the PCOR report, the per-ton cost associated with CO2 capture, drying, and compression of 90% of the CO2 produced would be $71 per short ton CO2 avoided. It is assumed that because the proposed biomass-to-energy system will be sized will be nominally rated at 22 MW and because the flue gases from biomass combustion will be similar to coal combustion (similar CO2 concentration, pollutants and control technologies (SO2 scrubber and SNCR), the PCOR costs are similar to the expected costs for CO2 capture, drying and compression at the proposed facility. Comparing the CO2 value of $41 per short ton for EOR to the CO2 capture cost of $71 per short ton, the implementation of CO2 capture at the ABBK facility is not cost effective. Further, CO2 capture would result significant and adverse energy and environmental impacts due to the parasitic consumption of steam and electricity, additional emissions generated during CO2 dehydration and compression and raw material usage.
G. Environmental Impacts
The EPA's PSD and Title V Permitting Guidance for Greenhouse Gases, states that, "EPA believes that it is appropriate for permitting authorities to account for both existing federal and state policies and their underlying objectives in evaluating the environmental, energy and economic benefits of biomass fuel. Based on these considerations, permitting authorities might determine that, with respect to the biomass component of a facility's fuel stream, certain types of biomass by themselves are BACT for GHGs. Under the Energy Policy Act of 2005 (EPAct 2005), Congress directed the DOE to carry out a program to demonstrate the commercial application of integrated biorefineries for the production of biofuels, in particular ethanol, from lignocellulosic feedstocks. Accordingly, in February 2006, DOE issued a funding
28 Kansas Geologic Survey, South-central Kansas CO2 Project website (available at: http://www.kgs.ku.edu/PRS/Ozark/index.html). 29 NETL, Storing CO2 with Enhanced Oil Recovery, DOE/NETL-402/1312/02-07-08, February 7, 2008 (available at: http://www.netl.doe.gov/energy-analyses/pubs/Storing%20CO2%20w%20EOR_FINAL.pdf)

DRAFT
Page 27 of 37
opportunity announcement for the design and construction of commercial-scale integrated biorefineries intended to demonstrate the use of a wide variety of lignocellulosic feedstocks to produce combinations of liquid transportation fuels (biofuels), bio-based chemicals, substitutes for petroleum-based feedstocks and products, and energy in the form of electricity or useful heat (biopower). In that announcement, DOE also encouraged the use of a wide variety of lignocellulosic feedstocks, but not those biomass components specifically grown for food, and encouraged the use of various technologies to collect and treat the wide variety of biomass feedstocks. On February 28, 2007, DOE, announced the selection of six biorefinery projects for negotiation of financial assistance awards, one of which was the ABBK biomass-to-ethanol and biomass-to-energy production facility. ABBK proposed an innovative approach to biorefinery operations that would involve production of a biofuel and energy in the form of steam that can be used to meet energy needs and displace fossil fuels, such as coal and natural gas. ABBK proposed to locate the facility in Kansas to qualify for state tax credits for the construction of cellulosic ethanol facilities (Kansas Energy Development Act of 2006; Kansas Senate Bill 303), which would make the biorefinery a more viable commercial operation.
H. Establish BACT
ABBK proposes that GHG BACT for the biomass-fired stoker boiler consist of the following: 1. Restriction of the fuel type to biomass that is otherwise considered to have
low to no economic value or benefit (i.e. crop residuals and waste wood); and/or is a lower impacting crops (i.e. mixed warm season grasses such as switchgrass);
2. Energy efficient design, incorporating cogeneration, process integration, combustion of co-products, heat recovery and operational and maintenance monitoring.
These control options are technically feasible for the biomass-fired stoker boiler and are an inherent part of the facility's design. ABBK proposes that the BACT limit for the biomass-fired boiler be 0.34 lb CO2e /lb of steam produced. This limit is based on the following: Steam production rate = 325,000 lb of steam/hr CO2e emission rate based on the fuel specifications = 109,965 lb CO2e/hr
hr/steamoflb325,000
hr/eCOlb109,965LimitBACTeCO 2
2

DRAFT
Page 28 of 37
producedsteamlb/eCOlb0.40torounded
produced;steamlb/eCOlb0.34LimitBACTeCO
2
22
ABBK proposes the use of the top performing control technology to control GHG emissions from the biomass-fired boiler. ABBK will to record the fuel type and quantity combusted in the boiler. Feedstock properties, unburned carbon in ash and sorbent reactivity will be tested weekly. Fuel blends will be reviewed for compliance with the established emission limits prior to combustion and gas parameters: percent oxygen, flow rate, temperature, and pressure.
The BACT limit proposed is based on a "lb CO2e/lb steam produced" limit instead of the engineering estimate which used "lb CO2e/MMBtu" because the steam pressure produced will continuously monitored. ABBK proposes that that simplest compliance method be based on steam produced, not the boiler heat input rate. Therefore, all fuel combinations will be reviewed for compliance with the BACT limit prior to combustion using the fuel specifications (as completed in the potential to emit calculations for the current fuel combinations) and the calculation detailed above. CO2e-based emissions were determined based on feedstock consumption records using the emission factors presented in the application. The emission limit is based on a maximum potential to emit, expressed in pounds of CO2e per pound of steam produced, averaged over 30 day rolling periods.
III. Fermentation and Distillation GHG BACT Analysis
A. Source Description
The CO2 generated from the biomass co-fermentation process (Area 16000) and beer well (T-18101) will be routed through the enzymatic hydrolysis fermentation CO2 scrubber (S-18185). The rated control efficiency will be equal to or greater than 99 percent. The CO2 generated from the biomass ethanol recovery process (Area 18000) will be routed through the enzymatic hydrolysis distillation vent scrubber (S-18180). The distillation vent scrubber vent feeds into the enzymatic hydrolysis fermentation CO2 scrubber (S-18185) for further control efficiency. The vent streams routed to the scrubbers are expected to be saturated with water since the process tanks contain primarily CO2, other gases (O2/N2) and water. These vent streams also are expected to contain trace amounts of contaminants such as ethyl alcohol (ethanol), fusel oils, H2S, NOx, etc. Table C-9 presents a comparison of the enzymatic hydrolysis CO2 scrubber (S-18185) vent stream to a traditional starch fermentation scrubber vent stream.

DRAFT
Page 29 of 37
Table C-9. Fermentation / CO2 Scrubber Comparison
Constituents in Scrubber Vent
Streams
Typical Starch Fermentation Scrubber
( 84 MMGPY)
ABBK Scrubber (S-18185)(30 MMGPY)
lb/hr wt.% lb/hr wt.% Total 49,199 100.0% 23,424.48 100% Water 747 1.5% 255.48 1.1%
Alcohol 2 0.0% 1.28 0.005% Byproducts 5 0.0% 0.65 0.003%
CO2 46,993 95.5% 20,387 ~88% Air 1,453 3.0% 2,548 ~11%
Note: The typical starch fermentation scrubber information was obtained from ABBK’s scrubber vendor, Vogelbusch.
The enzymatic hydrolysis CO2 scrubber (S-18185) CO2 concentration is significantly lower than a typical starch plant, due to the addition of air during fermentation. Additional air is needed for the particular organism used in the enzymatic hydrolysis fermentation process. The typical starch fermentation scrubber information was obtained from the facility's scrubber vendor, Vogelbusch. Vogelbusch engineering data indicates that a typical starch fermentation scrubber will have a CO2 concentration of 95.5% by weight. Abengoa Bioenergy of Nebraska, LLC has documented it's starch fermentation scrubber's typical CO2 concentration is greater than 98% by weight. The scrubbers will be packed-tower wet scrubbers, which allow for ethanol vapors to be collected in order to produce a higher product yield, and consequently the units control emissions of VOCs, HAPs, organic acids, furfural and higher alcohols. The scrubber systems will recover more than 99% of the ethanol from the vapor stream and return the ethanol to the process downstream. The water from the wet scrubbers is pumped back into the process for recycling. The distillation vent scrubber vent feeds into the enzymatic hydrolysis fermentation CO2 scrubber (S-18185) for further control efficiency.
B. Identify Available Control Options
The following control options were identified and considered in determining BACT:
1. Monitoring enzymatic hydrolysis process efficiency;
2. Carbon capture and storage ("CCS", also referred to as "carbon capture and
sequestration");
3. Carbon capture for beneficial uses;

DRAFT
Page 30 of 37
4. Develop and implement an LDAR program, in accordance with NSPS, Subpart VVa (40 CFR §60.480a through §60.489a), as proposed for the other fugitive HAR pollutants: VOC and HAP; and
5. Combination of these control options.
There are two (2) broad strategies for reducing GHG emissions from the two enzymatic hydrolysis scrubbers at the proposed facility. The first is to minimize the production of GHG through monitoring enzymatic hydrolysis process efficiency. The EH process efficiency is an integral part of the facility's design and is considered the baseline for this BACT analysis. The second strategy for reducing GHG emissions is carbon capture and storage ("CCS", also referred to as "carbon capture and sequestration") or carbon capture for beneficial uses. Because of the low CO2 concentration in the scrubber vent streams (88%), the CCS and carbon capture for beneficial uses discussion presented in the biomass-fired boiler section #2 is applicable. Although the CO2 concentration is 88%, this stream is still not considered a "high purity CO2 Stream" like other traditional starch plant fermentation vent streams, where the CO2 concentration is greater than 95% and usually 98% to 99% before CO2 capture is performed for commercial applications. Implementation of an LDAR program is not intended to control emissions beyond the baseline. The LDAR program is used to monitor equipment leaks for repair. For the fermentation and distillation operations, CO2 emissions from equipment leaks were estimated to be less than 1 lb/hr.
C. Eliminate Technically Infeasible Control Options Two main options identified for control of CO2 emissions from the two enzymatic hydrolysis scrubbers: 1) monitoring enzymatic hydrolysis process efficiency; and 2) CCS and/or carbon capture for beneficial uses. Table C-10 summarizes the technical feasibility/infeasibility determination discussed in this section.
Table C-10. Technical Feasibility/Infeasibility Determination Summary
Potentially Available
Control Option Determination
Result Determination Reason
Monitoring Enzymatic Hydrolysis Process Efficiency
Technically Feasible
Inherent part of the facility's design, and considered a baseline control option.
Carbon Capture Using Post-Equipment Capture
Technically Feasible
Chemical absorption has been the most widely used method of commercial CO2 capture and is the primary CO2 capture
technology further analyzed.
Carbon Transportation Technically
Feasible
Technical issues can be addressed through modern pipeline construction / maintenance
practices.

DRAFT
Page 31 of 37
Table C-10. Technical Feasibility/Infeasibility Determination Summary
Potentially Available Control Option
Determination Result
Determination Reason
Carbon Storage through Geologic Sequestration
Technically Feasible
In Kansas, geologic sequestration of CO2 may be possible in all five of the geologic
formations: deep saline aquifers, coal seams, oil ad natural gas reservoirs, oil- and gas-rich
organic shales, and basalt Carbon Storage through Terrestrial Sequestration
Technically Feasible
Inherent part of the facility's design; considered a baseline control option.
Carbon Beneficial Uses Technically
Feasible
The many different technologies being investigated for the beneficial use of CO2
vary widely in their stages of development; from those in bench-scale, to those close to
commercialization. Combination of these
Control Options Technically
Feasible See reasons above.
The technical feasibility of the control options are discussed below.
1. Monitoring Enzymatic Hydrolysis Process Efficiency
There are numerous strategies for achieving a highly efficient enzymatic hydrolysis process. All identified strategies (i.e. control options) listed in this section are technically feasible for application to the scrubbers, and all are an inherent part of the facility's design.
a. Monitoring the Enzymatic Hydrolysis Process Efficiency Related to CO2
Production in Fermentation – This strategy is the primary GHG BACT control technology option. CO2 production in fermentation is a function of the yeast, and selected micro-organism. A healthy and optimized organism will produce more ethanol and less CO2.
b. Energy Efficient Heat Integration – The enzymatic hydrolysis process is integrated with the cogeneration facility to maximize energy efficiency. This integration is discussed in Section 2.4 of the GHG BACT analysis prepared by ABBK. Energy efficient heat integration is more important to the boiler GHG than the CO2 scrubber (EP-18185) and distillation vent scrubber (EP-18180) GHG.
c. Water Recycling – Process-related water will be recycled whenever
possible to reduce the facility's consumption. d. Co-product Production – Valuable co-products will be generated during
the enzymatic hydrolysis process. The valuable co-products include products such as enzymatic hydrolysis residuals (including lignin-rich/lignin-lean stillage cake and thin stillage syrup) and wastewater

DRAFT
Page 32 of 37
treatment biogas. These products can either be sold as a consumable product or combusted as a supplemental fuel in the biomass-fired boiler.
2. Carbon Capture
Section II of Appendix D (or Section 2.4 of GHG BACT analysis prepared by ABBK) details the carbon capture control option technical feasibility determination. The information presented in the biomass-fired boiler section is not repeated herein. For the fermentation and distillation scrubbers, the pre-combustion and oxy-combustion approaches are not applicable. Carbon capture using post-equipment capture is equivalent to post-combustion capture. The only commercially demonstrated method for similar exhaust streams (low CO2 concentrations) is chemical absorption.
3. Carbon Transport and Storage
Section II of Appendix D (or Section 2.4 of GHG BACT analysis prepared by ABBK) details the carbon transport and storage technical feasibility determination. The information presented in Section II above is not repeated herein. Terrestrial sequestration applies to the fermentation and distillation scrubbers because the emissions associated with these scrubbers are biogenic CO2 emissions. Because the proposed source will utilize biomass in the production of ethanol, this type of CO2 storage is essentially being implemented as part of the facility's design; therefore, terrestrial sequestration is considered a baseline control option.
3. Carbon Beneficial Uses
Section II of Appendix D (or Section 2.4 of GHG BACT analysis prepared by ABBK) details the carbon beneficial uses control option technical feasibility determination. The information presented in Section II above is not repeated herein.
D. Rank Technically Feasible Options
Table C-11 presents the ranked technically feasible control options. The use of monitoring enzymatic hydrolysis process efficiency to reduce CO2 emissions, and terrestrial sequestration control options are an inherent part of the facility's design and considered baseline control options. No emissions reduction credit is taken for the implementation of the baseline control options. The baseline presented in Table C-11 represents the design with the highest efficiency improvements.

DRAFT
Page 33 of 37
Table C-11. Ranked Control Options
Control Technology Expected
Emission Rate (tons CO2/year)
Reduction Efficiency
Expected Emissions Reduction
(tons CO2/year)
Carbon Capture and Storage (CCS)
~ 8,800 90% 80,000
Carbon Capture for Beneficial Uses
~ 8,800 90% 80,000
Baseline (Monitoring Enzymatic Hydrolysis Process
Efficiency and Terrestrial Sequestration)
88,360 N/A N/A
E. Evaluate Technically Feasible Control Options
The implementation of CCS and carbon capture for beneficial uses on the fermentation and distillation scrubbers is similar to the implementation of these control options on the biomass-fired boiler. The CO2 concentrations in the scrubber's vent streams are similar to the CO2 concentrations expected in the biomass-fired boiler’s flue gases. The low purity (88% CO2 concentration) in the fermentation and distillation vents makes these vent streams undesirable for CO2 processing companies. Because the largest CO2 emission sources at the facility are the biomass-fired boiler, the implementation of a CCS control option (excluding terrestrial sequestration) is based on the cost-effectiveness of such a system applied to the boiler. As discussed in detail in the biomass-fired boiler section, using CCS or carbon beneficial uses to reduce CO2 emissions from the boiler is technically feasible but would entail significant, adverse economic, environmental and energy impacts due to increased fuel usage in order to meet the steam and electric load requirements of the CCS systems. Therefore, the use of CCS and carbon beneficial uses technologies were determined not to be cost effective for control of CO2 from the boiler and subsequently, are not cost effective for the fermentation and distillation CO2 emissions, which are less than 88,360 tons/yr CO2e.
F. Establish BACT
ABBK proposes that GHG BACT for the fermentation scrubber vent stream consist of an efficient design, incorporating energy efficient heat integration,

DRAFT
Page 34 of 37
water recycling, and co-product production that make the overall process efficient and economical. These control options are technically feasible for the enzymatic hydrolysis process and are an inherent part of the facility's design. ABBK proposes that the BACT limit be 5.89 lb CO2e/gal anhydrous ethanol produced for the enzymatic hydrolysis fermentation CO2 scrubber stack (EP-18185), averaged over a 30-day rolling period. These proposed emission limits are based on the average continuous flow CO2 concentrations. CO2e emissions will be determined based on the required stack testing to be completed upon startup. Continuous stack monitoring equipment will be installed to monitor operational indicators and CO2. Emissions will be averaged over a 30-day rolling period for compliance.
IV. Flare GHG BACT Analysis
A. Source Description
The facility design will incorporate a flare (EP-09001) for control of process vents flow, biogas and product loadout vapors. The vent streams will normally be vented to the biomass-fired boiler for combustion; however these streams may be vented to the flare as needed for up to 3,960 hours per year.
The flare will have the PTE of biogenic and anthropogenic GHG emissions (CO2, CH4, and N2O) because it is used to combust process vent streams, biogas, and product loadout vapors. Combustion of the process vent streams, biogas, ethanol, natural gas and gasoline in the flare results in the emissions of NOx, SO2, CO, VOC, PM/PM10/PM2.5 and biogenic and anthropogenic GHG emissions (CO2, CH4, and N2O). Flaring destroys 2,119 lb/hr CH4 (44,503 lb/hr CO2e), and generates 10,170 lb/hr CO2, for a total net reduction of CO2e equal to 34,333 lb/hr. Total CO2e emissions from this source (including emissions from natural gas combustion in the flare's pilot) are 10,185 lb/hr.
B. Identify Available Control Options
The flare is incorporated in the process design as a type of control technology. Because the combustion of biogas in a flare was selected as BACT for all other NSR pollutants, there was no consideration of other combustion controls performed in this analysis. The following control options have been identified and considered in determining BACT: 1. Installation of a flare. There are no effective combustion controls to reduce the
GHG emissions from flares, and there are currently no available post-combustion controls. The only achievable technological approach to reducing

DRAFT
Page 35 of 37
GHG emissions from the flare is to use the most efficient flare that meets the final design requirements.
2. Develop and implementation of an LDAR program, similar to NSPS, Subpart
VVa (40 CFR §60.480a through §60.489a), and modified to be source- and pollutant-type specific.
C. Eliminate Technically Infeasible Control Options
There were two (2) options identified for control of CO2 emissions from the flare: 1) low-carbon fuel; and 2) energy efficient design. These control options are technically feasible for the flare and are an inherent part of the facility's design.
The following discusses each of these control options.
1. Fuel Type Restriction (Low-Carbon Fuel)
The biogas flare will combust biogas as the primary fuel and natural gas in the
pilot. Biogas has the lowest direct GHG emissions of all common fuels. 30 Natural gas is defined as a "clean fuel" under the CAA. 31 Natural gas has the lowest direct GHG emissions of all common fuels, excluding biogas. Carbon dioxide is a common impurity in natural gas which must be removed by the supplier to improve the heating value of the gas or to meet pipeline specifications. It is expected that natural gas utilized at the facility would not benefit significantly from additional pre-combustion CO2 removal activities such as membrane or cryogenic separation. Therefore, no further analysis of natural gas treatment options will be performed.
2. Energy Efficient Design There are numerous strategies for achieving a highly energy efficient design
of a new flare. Design of the flare is dependent on the final process design of the facility. Specifically, the flare will be equipped with an electric igniter, will be a smoke-less design.
D. Rank Technically Feasible Options
The only achievable technological approach to reducing GHG emissions from the flare is to use the most efficient flare that can perform to the specification required by the facility's process. There is no effective combustion or post-combustion controls to reduce the GHG emissions from the 51.10 MMBtu/hr flare.
30 General Reporting Protocol, Version 3.1, supra note 39. 31 Supra note 38.

DRAFT
Page 36 of 37
As there are no other control technologies to choose from, no additional steps in the top-down BACT analysis are required for the selection of these control technologies as BACT.
E. Establish BACT
ABBK proposes that GHG BACT for the flare consist of the following:
1. Use of lower GHG-emitting processes and practices through an energy-
efficient design design, incorporating a fuel efficient flare pilot; and 2. Develop and implement a written LDAR program.
ABBK proposes that the process vents flow, biogas flow and product loadout vapors will be inferred based on flow measurements upstream of the flare diverting valve and diverting valve position. ABBK further proposes that the pilot natural gas usage records be based on the vendor engineering calculations for the pilot's natural gas demand. No additional natural gas monitoring at the flare is proposed. These control options are technically feasible for the flare and are an inherent part of the facility's design The proposed BACT limit is 10,170 pounds CO2e per hour (20,166 short tons CO2e per year).
V. Firewater Pump GHG BACT Analysis
A. Source Description
One (1) 460 horsepower (hp) (343 kilowatt (kW)) firewater pump engine will be installed at the facility to protect personnel and equipment in the event of a fire. The firewater pump engine will combust diesel fuel and meet the New Source Performance Standard (NSPS) regulation, 40 CFR Part 60, Subpart IIII, Standards of Performance for Stationary Compression Ignition (CI) Internal Combustion Engines (ICEs). The emergency engine is assumed to operate less than 100 hours per year for maintenance checks and readiness testing to qualify as emergency engines under NSPS Subpart IIII (40 CFR §60.4211(e)). The emergency diesel firewater pump engine will have the PTE of biogenic and anthropogenic GHG emissions (CO2, CH4, and N2O) because it combusts a hydrocarbon fuel (diesel).

DRAFT
Page 37 of 37
B. Identify Available Control Options
There are no effective combustion controls to reduce the GHG emissions from internal combustion engines, and there are currently no available post-combustion controls. The only achievable technological approach to reducing GHG emissions from the firewater pump engine is to use the most efficient engine that meets the stringent National Fire Protection Association (NFPA) standards for reserve horsepower capacity, engine cranking systems, engine cooling systems, fuel type's instrumentation and control and exhaust systems.
C. Eliminate Technically Infeasible Control Options
The only achievable technological approach to reduce GHG emissions from the firewater pump engine is to select the most fuel-efficient NFPA-20 certified firewater pump engine available. As there is only one control technology to choose from, no additional steps in the top-down BACT analysis are required for the selection of that control technology.
D. Establish BACT
The firewater pump engine to be selected for use at the facility will be the most fuel-efficient NFPA-20 certified firewater pump engine available. The specific make and model has not been established; however, a review of similar sized engines has indicated that a fuel consumption rate of no more than 20.3±5% gallons per hour is the most efficient rating available for a 460 Hp engine with a rated speed of 1760 rpm and an EPA Tier 3 emission rating. The firewater pump engine may be used for up to 100 hours per year for reliability testing and maintenance purposes. Use of the engine at 20.3±5% gallons of diesel fuel per hour for up to 100 hours per year would result in total GHG emissions of 480 pounds CO2e per hour (24.0 tons CO2e per yr CO2e). ABBK requests that the fuel consumption GHG BACT limit include a 5% variability to allow for selection of the engine with lowest overall EPA Tier 3 emissions at the time of purchased. The facility will demonstrate compliance with the BACT limit by recording fuel usage and using the emissions factors approved by KDHE to determine resulting CO2e emissions.