Association Between Life's Simple 7 and Noncardiovascular ...
30
Florida International University FIU Digital Commons Department of Biostatistics Faculty Publications Robert Stempel College of Public Health & Social Work 10-20-2016 Association Between Life's Simple 7 and Noncardiovascular Disease: e Multi‐Ethnic Study of Atherosclerosis Oluseye Ogunmoroti Department of Epidemiology, Florida International University; Baptist Health South Florida, oogunmar@fiu.edu Norrina B. Allen Northwestern University Mary Cushman University of Vermont Erin D. Michos John Hopkins University Tatjana Rundek University of Miami See next page for additional authors Follow this and additional works at: hps://digitalcommons.fiu.edu/biostatistics_fac Part of the Medicine and Health Sciences Commons is work is brought to you for free and open access by the Robert Stempel College of Public Health & Social Work at FIU Digital Commons. It has been accepted for inclusion in Department of Biostatistics Faculty Publications by an authorized administrator of FIU Digital Commons. For more information, please contact dcc@fiu.edu. Recommended Citation Ogunmoroti, Oluseye; Allen, Norrina B.; Cushman, Mary; Michos, Erin D.; Rundek, Tatjana; Rana, Jamal S.; Blankenstein, Ron; Blumenthal, Roger S.; Blaha, Michael J.; Veledar, Emir; and Nasir, Khurram, "Association Between Life's Simple 7 and Noncardiovascular Disease: e Multi‐Ethnic Study of Atherosclerosis" (2016). Department of Biostatistics Faculty Publications. 14. hps://digitalcommons.fiu.edu/biostatistics_fac/14
Transcript of Association Between Life's Simple 7 and Noncardiovascular ...

Florida International UniversityFIU Digital Commons
Department of Biostatistics Faculty Publications Robert Stempel College of Public Health & SocialWork
10-20-2016
Association Between Life's Simple 7 andNoncardiovascular Disease: The Multi‐EthnicStudy of AtherosclerosisOluseye OgunmorotiDepartment of Epidemiology, Florida International University; Baptist Health South Florida, [email protected]
Norrina B. AllenNorthwestern University
Mary CushmanUniversity of Vermont
Erin D. MichosJohn Hopkins University
Tatjana RundekUniversity of Miami
See next page for additional authors
Follow this and additional works at: https://digitalcommons.fiu.edu/biostatistics_fac
Part of the Medicine and Health Sciences Commons
This work is brought to you for free and open access by the Robert Stempel College of Public Health & Social Work at FIU Digital Commons. It hasbeen accepted for inclusion in Department of Biostatistics Faculty Publications by an authorized administrator of FIU Digital Commons. For moreinformation, please contact [email protected].
Recommended CitationOgunmoroti, Oluseye; Allen, Norrina B.; Cushman, Mary; Michos, Erin D.; Rundek, Tatjana; Rana, Jamal S.; Blankenstein, Ron;Blumenthal, Roger S.; Blaha, Michael J.; Veledar, Emir; and Nasir, Khurram, "Association Between Life's Simple 7 andNoncardiovascular Disease: The Multi‐Ethnic Study of Atherosclerosis" (2016). Department of Biostatistics Faculty Publications. 14.https://digitalcommons.fiu.edu/biostatistics_fac/14

AuthorsOluseye Ogunmoroti, Norrina B. Allen, Mary Cushman, Erin D. Michos, Tatjana Rundek, Jamal S. Rana, RonBlankenstein, Roger S. Blumenthal, Michael J. Blaha, Emir Veledar, and Khurram Nasir
This article is available at FIU Digital Commons: https://digitalcommons.fiu.edu/biostatistics_fac/14

Association Between Life’s Simple 7 and Noncardiovascular Disease:The Multi-Ethnic Study of AtherosclerosisOluseye Ogunmoroti, MD, MPH; Norrina B. Allen, PhD; Mary Cushman, MD, MSc; Erin D. Michos, MD, MHS; Tatjana Rundek, MD, PhD;Jamal S. Rana, MD, PhD; Ron Blankstein, MD; Roger S. Blumenthal, MD; Michael J. Blaha, MD, MPH; Emir Veledar, PhD;Khurram Nasir, MD, MPH
Background-—The American Heart Association introduced the Life’s Simple 7 (LS7) metrics to assess and promote cardiovascularhealth. We examined the association between the LS7 metrics and noncardiovascular disease.
Methods and Results-—We studied 6506 men and women aged between 45 and 84 years, enrolled in the Multi-Ethnic Study ofAtherosclerosis. Median follow-up time was 10.2 years. Each component of the LS7 metrics (smoking, body mass index, physicalactivity, diet, total cholesterol, blood pressure, and blood glucose) was assigned points, 0 indicates “poor” category; 1,“intermediate,” and 2, “ideal.” The LS7 score, ranged from 0 to 14, was created from the points and categorized as optimal (11–14), average (9–10), and inadequate (0–8). Hazard ratios and event rates per 1000 person-years were calculated for outcomesbased on self-reported hospitalizations with the International Classification of Diseases, 9th Revision, diagnoses of cancer, chronickidney disease, pneumonia, deep venous thromboembolism/pulmonary embolism, chronic obstructive pulmonary disease,dementia, and hip fracture. Analyses were adjusted for age, sex, race/ethnicity, income, and education. Overall, noncardiovasculardisease event rates were lower with increasing LS7 scores. With the inadequate LS7 score as reference, an optimal score wasassociated with a decreased risk for noncardiovascular disease events. The hazard ratio for cancer was, 0.80 (0.64–0.98); chronickidney disease, 0.38 (0.27–0.54); pneumonia, 0.57 (0.40–0.80); deep venous thromboembolism/pulmonary embolism, 0.52(0.33–0.82), and chronic obstructive pulmonary disease, 0.51 (0.31–0.83).
Conclusions-—The American Heart Association’s LS7 score identified individuals who were vulnerable to multiple chronicnonvascular conditions. These results suggest that improving cardiovascular health will also reduce the burden of cancer and otherchronic diseases. ( J Am Heart Assoc. 2016;5:e003954 doi: 10.1161/JAHA.116.003954)
Key Words: epidemiology • Life’s Simple 7 • prevention • risk factor
I n the United States (US), the burden of noncardiovasculardiseases (non-CVDs) such as cancers and chronic obstruc-
tive pulmonary disease (COPD) is substantial.1 According tothe Centers for Disease Control and Prevention, non-CVDswere responsible for over 1 500 000 deaths combined in2011.2 Cancer is the second leading cause of death in the USbehind cardiovascular diseases (CVDs),2 and the age-
standardized prevalence of COPD in some US states is ashigh as 9%.3
The American Heart Association’s (AHA’s) 2020 impactgoal is to improve the cardiovascular health (CVH) of allAmericans by 20% by 2020, while reducing deaths from CVDand stroke by 20%.4 Implicit in this goal is improvement for allAmericans including underserved racial groups and across the
From the Center for Healthcare Advancement and Outcomes (O.O., E.V., K.N.) and Miami Cardiac & Vascular Institute (K.N.), Baptist Health South Florida, Miami, FL;Departments of Epidemiology (O.O., K.N.) and Biostatistics (E.V.), Robert Stempel College of Public Health and Social Work, and Department of Medicine, HerbertWertheim College of Medicine (K.N.), Florida International University, Miami, FL; Department of Preventive Medicine, Feinberg School of Medicine, NorthwesternUniversity, Chicago, IL (N.B.A.); Department of Medicine, Cardiovascular Research Institute, University of Vermont, Burlington, VT (M.C.); Ciccarone Center for thePrevention of Heart Disease, Johns Hopkins University, Baltimore, MD (E.D.M., R.S.B., M.J.B., K.N.); Department of Neurology, Miller School of Medicine, University ofMiami, FL (T.R.); Division of Cardiology and Division of Research, Kaiser Permanente Northern California, Oakland, CA (J.S.R.); Department of Medicine, University ofCalifornia, San Francisco, CA (J.S.R.); Departments of Medicine and Radiology, Brigham and Women’s Hospital, Boston, MA (R.B.).
Accompanying Tables S1, S2 and Figures S1 through S12 are available at http://jaha.ahajournals.org/content/5/10/e003954/DC1/embed/inline-supplementary-material-1.pdf
Correspondence to: Khurram Nasir, MD, MPH, 1500 San Remo Avenue, Suite 340, Coral Gables, FL 33146. E-mail: [email protected]
Received June 1, 2016; accepted September 23, 2016.
ª 2016 The Authors. Published on behalf of the American Heart Association, Inc., by Wiley Blackwell. This is an open access article under the terms of the CreativeCommons Attribution-NonCommercial License, which permits use, distribution and reproduction in any medium, provided the original work is properly cited and isnot used for commercial purposes.
DOI: 10.1161/JAHA.116.003954 Journal of the American Heart Association 1
ORIGINAL RESEARCH

age spectrum. To achieve this goal, a new concept, ideal CVH,was introduced as a means to assess, monitor, and promoteCVH and wellness.4 Ideal CVH is defined as the presence of 4ideal health behaviors (nonsmoking, body mass index [BMI]<25 kg/m2, physical activity at goal levels, and diet consis-tent with recommended guidelines) and 3 ideal health factors(untreated total cholesterol <200 mg/dL, blood pressure (BP)<120/80 mm Hg, and fasting blood glucose <100 mg/dL).These 7 health behaviors and factors have been termed Life’sSimple 7 (LS7) metrics.4 The inverse relationship betweenideal CVH and CVD incidence is well documented.4–14
However, research exploring the association between idealCVH and non-CVDs has just begun.15–19
Our aim in this study was to examine the associationbetween the AHA’s LS7 metrics and non-CVDs amongparticipants of the Multi-Ethnic Study of Atherosclerosis(MESA), an ethnically diverse study population. We hypothe-sized that participants with optimal LS7 scores would be lesslikely to develop non-CVDs.
Methods
Study PopulationMESA is a multicenter, prospective cohort study that started in2000. Individuals between the ages of 45 and 84 years, free ofclinical CVD at baseline, were recruited to investigate theprevalence, correlates, and progression of subclinical CVD.Details of the study design have been previously described.20
The sample size was 6814 participants of whom 38% ofparticipants were white, 28% Black, 23% Hispanic, and 11%Chinese-American. Recruitment from 6 field centers (Balti-more, MD; Chicago, IL; Forsyth County, NC; Los Angeles, CA;New York, NY; and St Paul, MN) occurred between July 2000and September 2002. Informed consent was obtained fromstudy participants and the study protocol was approved by theinstitutional review boards of the 6 field centers. The presentstudy included 6506 MESA participants. Our exclusion criteriawere incomplete baseline data on education, income, or theLS7 metrics (n=308). Data collection was between 2000 and2015 while analysis was conducted in 2015.
Measurement of LS7 MetricsBetween 2000 and 2002, baseline levels of LS7 metrics(smoking, BMI, physical activity, diet, BP, total cholesterol,and blood glucose) were measured and categorized into ideal,intermediate, and poor according to the AHA criteria4
(Table S1) with modifications in MESA as previouslyreported.21 Smoking status was assessed using question-naires developed by the National Health and NutritionExamination Survey III, the National Health Interview Survey,
and Atherosclerosis Risk in Communities (ARIC). Participantswere classified as current smokers, former smokers if theyquit within the past 12 months, or never smokers if they quitmore than 12 months ago. BMI was calculated from heightand weight measurements. Physical activity was measuredusing a detailed questionnaire adapted from the Cross-Cultural Activity Participation Study.22 The questionnaireidentifies the time and frequency spent in activities during atypical week in the previous month using 28 questionsincluding household chores, lawn/yard/garden/farm, care ofchildren/adults, transportation, walking (not at work), dancingand sport activities, conditioning activities, leisure activities,and occupational and volunteer activities. Minutes of walking,conditioning, and leisure activities were also included asexercise, and the minutes of moderate and vigorous exercisewere calculated from the questionnaire. Diet assessment wasperformed using a validated 120-item food frequency ques-tionnaire modified from the Insulin Resistance AtherosclerosisStudy instrument.23,24 Diet was defined according to AHAcriteria using 5 components of healthy diet (high intake offruits and vegetables, fish, whole grains, low intake of sodiumand sugar-sweetened beverages).4 For BP, 3 measurementswere taken after participants had rested for 5 minutes. Theaverage of the last 2 measurements was recorded and usedfor analysis. Total cholesterol and blood glucose levels wereobtained from fasting blood samples.
We used a previously defined scoring system21 wherepoints were assigned to each category of the LS7 metrics andsummed: ideal=2 points, intermediate=1 point, and poor=0point, for a total score ranging from 0 to 14 points.25 Studyparticipants who scored 0 to 8 points were classified asinadequate, those who scored 9 or 10 points were classifiedas average, and participants who scored 11 to 14 points wereclassified as optimal.21 Table S1 presents the proportion ofMESA participants who fall into each category of the metrics.
Non-CVD OutcomesParticipants of MESA were followed up every 9 to 12 monthsfor a median of 10.2 years (mean=9.5 years, interquartilerange 9.7–10.7 years) and self-reported any hospitalizationsthat had occurred since the last follow-up. Upon report of ahospitalization, medical records were requested. The proto-cols and criteria for verification and diagnosis of non-CVDevents have been previously reported.20 Non-CVD diagnoseswere extracted from inpatient records using the InternationalClassification of Diseases, 9th Revision (ICD-9). For this study,we included ICD-9 codes related to the following categories:any malignant neoplasm, chronic kidney disease (CKD) andindicators of end-stage kidney disease, pneumonia, deepvenous thrombosis (DVT) or pulmonary embolism (PE), COPD,dementia, and hip fracture. A complete list of the codes used
DOI: 10.1161/JAHA.116.003954 Journal of the American Heart Association 2
Life’s Simple 7 and Noncardiovascular Disease Ogunmoroti et alORIG
INALRESEARCH

is presented in Table S2. Coronary heart disease (CHD) andCVD events were adjudicated by the MESA mortality andmorbidity review committee.
Statistical AnalysisCharacteristics of study participants such as sex, race/ethnicity, and socioeconomic status (education and income)were reported by the LS7 score. Categorical variables werepresented as frequency and percentages while continuousvariables were presented as mean and standard deviation(SD). Comparison between the characteristics of participantsand the LS7 score were tested using chi-square tests forcategorical variables and ANOVA for continuous variables. Theevent rate per 1000 person-years for each non-CVD diagnosiswas calculated. In a multivariable-adjusted model, we calcu-lated the hazard ratios (HRs) and 95% CIs for each non-CVDdiagnosis analyzed separately by the categories of the LS7score (inadequate LS7 score served as reference) and the HR(95% CI) of the aggregate measure of the first occurrence ofany of the non-CVD diagnoses. Covariates included age, sex,race/ethnicity, and socioeconomic status. We constructedKaplan–Meier curves for non-CVD-free survival. Two separatesensitivity analyses were performed where participants withany nonfatal CHD event or nonfatal CVD event at or beforethe time of the non-CVD diagnosis were excluded from thestudy sample. These accounted for the potential identificationbias of a comorbid illness during admission for CHD or CVD.A P<0.05 was considered statistically significant. All analyseswere conducted in SAS 9.3 (SAS Institute, Cary, NC) with theexception of the Kaplan–Meier curves, which were con-structed using Stata 12.1 (StataCorp, College Station, TX).
Results
Baseline Characteristics of the Study PopulationBaseline characteristics are presented in Table 1. Among the6506 study participants, 20.1% had optimal LS7 scores,32.6% had average scores, and 47.3% had inadequate scores.The distribution of the LS7 score is presented in Figure 1.Participants with optimal scores were more likely to beCaucasian or have more than a college education while thosewith inadequate scores were more likely to be on medicationfor hypercholesterolemia, hypertension, or diabetes mellitus(Table 1). Approximately 0.1% of participants met the idealcriteria for all 7 components of the LS7 metrics.
CancerCancer diagnosis codes (Table S2) were observed in 764(11.7%) participants. The event rate of cancer per
1000 person-years by LS7 score was 9.2, 11.5, and 13.3for optimal, average, and inadequate scores, respectively(Figure 2). Those with inadequate LS7 scores accounted for51.4% of cancer cases. Unadjusted and adjusted HRs arepresented in Table 2. In multivariable-adjusted models, withthe inadequate scores serving as reference, participants withoptimal scores had a 20% lower risk for developing cancer,and while not statistically significant, those with averagescores had a 10% lower risk.
Chronic Kidney DiseaseCKD was documented in 454 (7.0%) participants. The eventrate of CKD was 2.9 cases per 1000 person-years for optimalLS7 scores, 5.3 cases per 1000 person-years for averagescores, and 9.8 cases per 1000 person-years for inadequatescores (Figure 2). The risk for developing CKD was 40% and62% lower for those with average and optimal LS7 scores,respectively (Table 2). After excluding participants with esti-mated glomerular filtration rate ≤60 mL/min at baseline, HRwas 0.49 (0.32–0.76) for participants with average scores and0.29 (0.14–0.59) for those with optimal scores.
PneumoniaPneumonia was identified in 334 (5.1%) participants. Theevent rate was 6.1 cases per 1000 person-years for partic-ipants with inadequate LS7 scores. Those with average scoreshad an event rate of 4.9 cases per 1000 person-years(Figure 2) and the HR for developing pneumonia was 0.82(0.64–1.04) (Table 2). Participants with optimal scores had amuch lower event rate, 3.0 cases per 1000 person-years, anda 43% lower risk for developing pneumonia.
DVT or PEThere were 215 (3.3%) cases of DVT or PE, with over half ofthe diagnoses made in participants with inadequate LS7scores and 11% in participants with optimal scores. Eventrates were 4.0, 3.1, and 1.7 per 1000 person-years forparticipants with inadequate, average, and optimal scores,respectively (Figure 2). HRs for developing DVT or PE forparticipants with average and optimal scores were 0.82(0.60–1.11) and 0.52 (0.33–0.82), respectively (Table 2).
Chronic Obstructive Pulmonary DiseaseCOPD was identified in 174 (2.7%) participants. The majorityof the diagnoses (61%) were in participants with inadequatescores. The event rate was �3 times higher in participantswith inadequate scores compared with those with optimalscores, 3.5 cases versus 1.4 cases per 1000 person-years
DOI: 10.1161/JAHA.116.003954 Journal of the American Heart Association 3
Life’s Simple 7 and Noncardiovascular Disease Ogunmoroti et alORIG
INALRESEARCH

(Figure 2). Participants with average and optimal scores had a35% and 49% lower risk for developing COPD (Table 2).Similarly, the associations remained essentially unchangedafter the exclusion of participants with a diagnosis of COPD atbaseline. The HR was 0.60 (0.41–0.89) for participants withan average score and 0.48 (0.28–0.83) for those with optimalscores.
DementiaDementia was documented in 156 (2.4%) study participants.The event rates per 1000 person-years were 1.8, 2.0, and 2.8
for the optimal, average, and inadequate LS7 scores, respec-tively (Figure 2). Participants with inadequate scoresaccounted for 55.8% of the diagnoses. For participants withoptimal scores, the HR for developing dementia was 0.80(0.50–1.27), while for those with average scores, the HR was0.67 (0.46–0.98) (Table 2).
Hip FracturesHip fractures were observed in 61 (0.9%) study participants.Most of the cases (47.5%) were diagnosed in participants withinadequate LS7 scores while only 18% were in participants
Table 1. Baseline Characteristics of Participants by Life’s Simple 7 Score
CharacteristicsAll Participants(N=6506)
Inadequate (0–8)(n=3080)
Average (9–10)(n=2120)
Optimal (11–14)(n=1306) P Value
Age, y, mean (SD) 62.0 (10.2) 62.7 (9.8) 62.0 (10.5) 60.3 (10.5) <0.001*
Sex
Women 3432 (52.8%) 1615 (52.4%) 1118 (52.7%) 699 (53.5%) 0.80
Men 3074 (47.2%) 1465 (47.6%) 1002 (47.3%) 607 (46.5%)
Race/ethnicity <0.001*
Caucasian 2539 (39.0%) 979 (31.8%) 908 (42.8%) 652 (49.9%)
Chinese 795 (12.2%) 216 (7.00%) 318 (15.0%) 261 (20.0%)
Black 1716 (26.4%) 1043 (33.9%) 474 (22.4%) 199 (15.2%)
Hispanic 1456 (22.4%) 842 (27.3%) 420 (19.8%) 194 (14.9%)
Education <0.001*
<High school education 1157 (17.8%) 691 (22.4%) 341 (16.1%) 125 (9.6%)
High school education 1166 (17.9%) 660 (21.4%) 350 (16.5%) 156 (11.9%)
Some college education 1852 (28.5%) 993 (30.3%) 595 (28.1%) 324 (24.8%)
College education 1142 (17.6%) 413 (13.4%) 411 (19.4%) 318 (24.4%)
>College education 1189 (18.3%) 383 (12.4%) 423 (20.0%) 383 (29.3%)
Income <0.001*
<$40 000 3292 (50.6%) 1808 (58.7%) 995 (46.9%) 489 (37.4%)
≥$40 000 3214 (49.4%) 1272 (41.3%) 1125 (53.1%) 817 (62.6%)
BMI, kg/m2 28 (5) 31 (5) 27 (5) 24 (3)
Systolic BP, mm Hg 126.2 (21) 134 (21) 123.9 (20) 111.3 (15) <0.001*
Diastolic BP, mm Hg 72 (10) 74 (10) 71 (10) 66.9 (8) <0.001*
Antihypertensive therapy 2113 (32%) 1470 (48%) 549 (26%) 94 (7%) <0.001*
Total cholesterol, mg/dL 194 (36) 200 (39) 193 (33) 183 (28) <0.001*
Antihypercholesterolemia therapy 1050 (16%) 704 (23%) 273 (13%) 73 (6%) <0.001*
Diabetes mellitus 756 (12%) 598 (19%) 134 (6%) 24 (2%) <0.001*
Antidiabetic therapy 622 (10%) 549 (18%) 60 (3%) 13 (1%) <0.001*
Total number of medications 3.2 (2.9) 3.8 (3.0) 2.9 (2.7) 2.5 (2.6) <0.001*
No health insurance 581 (9%) 288 (9%) 175 (8%) 118 (9%) 0.39
BMI indicates body mass index; BP, blood pressure; SD, standard deviation. Mean and SD were reported for BMI, BP, total cholesterol and total number of medications.*Statistical significance (P<0.05).
DOI: 10.1161/JAHA.116.003954 Journal of the American Heart Association 4
Life’s Simple 7 and Noncardiovascular Disease Ogunmoroti et alORIG
INALRESEARCH

with optimal scores. The event rate for hip fractures was 0.9cases per 1000 person-years for both participants withinadequate and average scores. For those with optimalscores, the event rate was 0.8 per 1000 person-years(Figure 2). Although not statistically significant, average andoptimal scores were associated with a lower risk for
developing hip fractures (HR 0.82 [0.46–1.45] and HR 0.71[0.34–1.48], respectively (Table 2).
Sensitivity AnalysesIn the stratified analyses presented in Table 3, the risk fordeveloping non-CVDs was lower irrespective of age, sex, andrace/ethnicity for participants with optimal and averagescores compared with those with inadequate scores. How-ever, many of the associations were not statistically signif-icant. In addition, there was little difference between theresults before and after the exclusion of participants with aninterim or concurrent nonfatal CHD event or nonfatal CVDevent. Although some results were not statistically significant,the risk for developing non-CVD events remained lower forthose with average and optimal scores (Tables 4 and 5). Asillustrated in Table 6, the ideal and intermediate categories ofthe health behaviors and factors of the LS7 metrics,particularly smoking, physical activity, BP, and blood glucosewere associated with a lower risk of developing non-CVDs,although some of the associations were not statisticallysignificant. Event rates per 1000 person-years by age, sex,and race/ethnicity are presented in Figures S1 through S12.Overall, optimal LS7 scores were associated with a lower riskand event rates of non-CVDs.
05
1015
20S
tudy
Par
ticip
ants
%
0 5 10 15Life's Simple 7 Score
Figure 1. Distribution of the Life’s Simple 7 (LS7) score. TheLS7 score ranged from 0 to 14 and was classified into inadequate(0–8), average (9–10), and optimal (11–14) based on pointsassigned to each category of the LS7 metrics.
Figure 2. Event rate per 1000 person-years of study participants with noncardiovascular disease byLife’s Simple 7 (LS7) score. The LS7 score ranged from 0 to 14 and was classified into inadequate (0–8),average (9–10), and optimal (11–14) based on points assigned to each category of the LS7 metrics. CKDindicates chronic kidney disease; COPD, chronic obstructive pulmonary disease; DVT/PE, deep venousthromboembolism/pulmonary embolism.
DOI: 10.1161/JAHA.116.003954 Journal of the American Heart Association 5
Life’s Simple 7 and Noncardiovascular Disease Ogunmoroti et alORIG
INALRESEARCH

Discussion
Summary of FindingsIn this multiethnic prospective cohort study, participants whohad average and optimal LS7 scores were less likely todevelop non-CVDs when compared with participants withinadequate scores. Overall, the risk for developing non-CVDswere particularly lower for those with optimal scores.However, the HRs for dementia and hip fractures were notstatistically significant. Moreover, similar associations wereobserved across age, sex, and race/ethnic subgroups.
Comparison With Previous StudiesThe LS7 metrics were introduced as a means of assessing,monitoring, and promoting CVH at both the individual andpopulation levels. Numerous studies have established thathigher numbers of ideal LS7 metrics or higher LS7 scores arestrongly associated with favorable outcomes.4–14 Our resultsare comparable to the findings of prior studies that haveshown an inverse relationship between higher LS7 scores andthe incidence of non-CVD.15–19 In the ARIC study, Rasmussen-Torvik et al demonstrated that participants with 6 or 7 idealmetrics had a 51% lower risk of cancer compared with thosewith 0 to 2 ideal metrics.15
Studies including the Reasons for Geographic and RacialDifferences in Stroke (REGARDS) study demonstrated thatparticipants with intermediate and high LS7 scores have alower incidence of cognitive impairment when compared withparticipants with inadequate LS7 scores.17–19 Muntner et alin the REGARDS study reported a significantly lower risk ofdeveloping end-stage renal disease with increasing numbersof ideal LS7 metrics. In the same cohort, Olson et al found afavorable prognosis for the risk of incident VTE amongparticipants with ideal CVH status. In our study we found that
optimal and average LS7 scores were associated with lowerevent rates for non-CVD outcomes such as COPD, pneumonia,and hip fracture. However, some of our results were notstatistically significant.
It has been established that some components of the LS7metrics such as smoking are known risk factors for COPD,pneumonia, and hip fractures while physical inactivity andnutritional deficiencies contribute to the pathophysiology ofhip fractures.26–28 It is also of interest that obesity (BMI≥30 kg/m2) may reduce the risk of hip fractures in women.29
Additionally, the prognosis of COPD is worsened by thepresence of comorbid illnesses such as hypertension anddiabetes mellitus.30 Although research showing the associa-tion between the LS7 metrics and the aforementioned non-CVD outcomes is sparse, prior studies have demonstratedthat having higher numbers of ideal LS7 metrics areassociated with a lower risk of mortality from allcauses.10,31–33
Furthermore, our study highlights the association betweeneach LS7 metric and non-CVD events. For example, achievingthe ideal category for smoking and physical activity wasassociated with a lower risk for developing most of the non-CVDs measured. In contrast, participants in the ideal categoryfor diet and total cholesterol were more likely to have some ofthe non-CVDs such as dementia and hip fracture, although theassociations were not statistically significant. Detailed anal-ysis from pooled studies will be required to further clarify theimpact of the individual LS7 metrics on non-CVD outcomes.
ImplicationsHealthcare expenditures have been continuously increasingover the years. In 2013, �$3 trillion was spent on healthcarein the US, an increase of 3.6% from the previous year and anestimated $9000 per person.34 Most of these expenses gotowards the management of preventable diseases.35 The LS7
Table 2. Unadjusted and Multivariable Adjusted HRs for Non-Cardiovascular Diseases
Non-Cardiovascular Diseases
Unadjusted HR, 95% CI Multivariable Adjusted HR, 95% CI
Average (9–10)(n=2120)
Optimal (11–14)(n=1306)
Average (9–10)(n=2120)
Optimal (11–14)(n=1306)
Cancer 0.87 (0.74–1.01) 0.69 (0.56–0.84) 0.90 (0.77–1.06) 0.80 (0.64–0.98)
CKD 0.53 (0.43–0.66) 0.29 (0.21–0.40) 0.60 (0.48–0.74) 0.38 (0.27–0.54)
Pneumonia 0.79 (0.63–1.01) 0.49 (0.35–0.69) 0.82 (0.64–1.04) 0.57 (0.40–0.80)
DVT/PE 0.76 (0.56–1.02) 0.42 (0.27–0.66) 0.82 (0.60–1.11) 0.52 (0.33–0.82)
COPD 0.62 (0.44–0.87) 0.41 (0.25–0.66) 0.65 (0.46–0.92) 0.51 (0.31–0.83)
Dementia 0.69 (0.48–0.99) 0.62 (0.40–0.96) 0.67 (0.46–0.98) 0.80 (0.50–1.27)
Hip fracture 1.00 (0.57–1.76) 0.83 (0.42–1.67) 0.82 (0.46–1.45) 0.71 (0.34–1.48)
Multivariable model was adjusted for age, sex, race/ethnicity, income, and education. Inadequate score (0–8) served as reference. CKD indicates chronic kidney disease; COPD, chronicobstructive pulmonary disease; DVT/PE, deep venous thrombosis/pulmonary embolism; HR, hazard ratio.
DOI: 10.1161/JAHA.116.003954 Journal of the American Heart Association 6
Life’s Simple 7 and Noncardiovascular Disease Ogunmoroti et alORIG
INALRESEARCH

Table3.
MultivariableAd
justed
HRs
forNon-CardiovascularDiseasesStratifi
edby
Age,
Sex,
andRa
ce/E
thnicity
Characteristics
Cancer
CKD
Pneumonia
DVT
/PE
COPD
Dem
entia
Hip
Fracture
Adjusted
HR
Adjusted
HR
Adjusted
HR
Adjusted
HR
Adjusted
HR
Adjusted
HR
Adjusted
HR
Average
Optimal
Average
Optimal
Average
Optimal
Average
Optimal
Average
Optimal
Average
Optimal
Average
Optimal
Age,
y
<65
0.83
(0.62
–1.09)
0.93
(0.67
–1.28)
0.47
(0.31
–0.72)
0.34
(0.19
–0.63)
0.70
(0.46
–1.08)
0.51
(0.29
–0.92)
0.79
(0.48
–1.31)
0.62
(0.31
–1.21)
0.76
(0.42
–1.37)
0.38
(0.15
–0.98)
—0.39
(0.04
–3.99)
0.68
(0.19
–2.40)
0.49
(0.09
–2.55)
≥65
0.96
(0.78
–1.17)
0.71
(0.54
–0.95)
0.66
(0.51
–0.85)
0.39
(0.26
–0.59)
0.89
(0.66
–1.20)
0.58
(0.37
–0.90)
0.86
(0.57
–1.27)
0.47
(0.25
–0.87)
0.63
(0.41
–0.98)
0.58
(0.32
–1.04)
0.72
(0.49
–1.05)
0.82
(0.51
–1.32)
0.87
(0.45
–1.66)
0.81
(0.36
–1.83)
Sex Female
0.93
(0.73
–1.20)
0.83
(0.60
–1.15)
0.53
(0.37
–0.75)
0.25
(0.14
–0.46)
0.76
(0.52
–1.10)
0.37
(0.20
–0.70)
0.62
(0.40
–0.95)
0.43
(0.23
–0.82)
0.49
(0.28
–0.84)
0.42
(0.19
–0.92)
0.52
(0.30
–0.90)
0.44
(0.19
–1.00)
0.74
(0.36
–1.53)
0.79
(0.33
–1.90)
Male
0.88
(0.71
–1.09)
0.74
(0.56
–0.98)
0.62
(0.47
–0.83)
0.45
(0.30
–0.67)
0.88
(0.64
–1.21)
0.71
(0.46
–1.08)
1.14
(0.74
–1.76)
0.63
(0.33
–1.20)
0.81
(0.51
–1.27)
0.57
(0.30
–1.09)
0.85
(0.51
–1.41)
1.13
(0.64
–2.01)
0.93
(0.36
–2.41)
0.55
(0.15
–2.09)
Race/ethnicity
White
0.84
(0.66
–1.07)
0.89
(0.67
–1.18)
0.55
(0.39
–0.78)
0.37
(0.23
–0.61)
0.74
(0.52
–1.05)
0.57
(0.36
–0.91)
0.75
(0.48
–1.18)
0.63
(0.36
–1.09)
0.77
(0.47
–1.26)
0.64
(0.33
–1.24)
0.71
(0.42
–1.22)
0.81
(0.42
–1.53)
0.86
(0.44
–1.68)
0.70
(0.29
–1.68)
Black
0.91
(0.67
–1.23)
0.76
(0.47
–1.22)
0.53
(0.34
–0.83)
0.57
(0.29
–1.09)
1.06
(0.61
–1.84)
0.57
(0.20
–1.60)
0.86
(0.51
–1.47)
0.47
(0.17
–1.31)
0.39
(0.18
–0.88)
0.30
(0.07
–1.27)
0.70
(0.34
–1.44)
0.37
(0.09
–1.60)
1.50
(0.25
–9.06)
—
Hispanic
1.07
(0.73
–1.58)
0.39
(0.18
–0.86)
0.64
(0.41
–0.99)
0.30
(0.13
–0.70)
0.88
(0.53
–1.46)
0.57
(0.24
–1.33)
1.01
(0.48
–2.11)
—0.73
(0.28
–1.88)
0.26
(0.03
–1.99)
0.47
(0.18
–1.26)
0.47
(0.11
–2.02)
—0.55
(0.06
–5.06)
Chinese
American
1.12
(0.59
–2.14)
0.82
(0.39
–1.70)
0.78
(0.40
–1.53)
0.21
(0.07
–0.63)
0.99
(0.43
–2.27)
0.67
(0.25
–1.79)
0.66
(0.16
–2.67)
0.22
(0.03
–2.01)
0.71
(0.26
–1.89)
0.61
(0.20
–1.89)
0.47
(0.10
–2.18)
1.52
(0.42
–5.49)
——
Multivariablemodelwas
adjusted
forage,sex,race/e
thnicity,incom
e,andeducation.Inadequate
scoreserved
asreference.—
indicatesinsufficientd
ata;CKD
,chronickidney
disease;COPD
,chronicobstructivepulmonarydisease;DVT
/PE,
deep
venous
thrombosis/pulmon
aryem
bolism;HR,
hazard
ratio
.
DOI: 10.1161/JAHA.116.003954 Journal of the American Heart Association 7
Life’s Simple 7 and Noncardiovascular Disease Ogunmoroti et alORIG
INALRESEARCH

metrics may provide an effective avenue for reducinghealthcare expenditure. The strategy of the concept isprimordial prevention where efforts are directed at preventingthe development of risk factors in contrast to primary orsecondary prevention where the focus is on the prevention ofthe first occurrence or recurrence of a disease.4,36 In a studyon the association of ideal CVH and long-term healthcarecost, Willis et al found that having more ideal components ofthe LS7 metrics in middle age was associated with lower CVDand non-CVD healthcare costs in later life.37
Strengths and LimitationsThe major strengths of this study include the large popula-tion-based sample, the diverse ethnicity of participants, thedetailed and validated collection of data, and the sensitivity
analyses performed. Our study also has limitations. The useof self-administered questionnaires for data collection onsmoking, diet, and physical may be subject to recall bias.Because MESA uses self-reported hospitalization and ICDhospital codes for identifying new cases of non-CVDs,interpretation of time-to-non-CVD events should be time-to-diagnosis and not time-to-disease onset.38 The use of ICDhospital codes may have led to under-ascertainment of non-CVD events and sampling bias towards the inclusion ofsevere cases of non-CVDs, while inadvertently excluding mildcases that were managed in an outpatient setting.38 Also,confirmation of non-CVD diagnosis was administrative and sodoes not represent systematically adjudicated events.20 Wemade reference to event rates because non-CVD events werenot excluded at baseline. Nevertheless, the results of thesensitivity analyses showed small changes in HRs after the
Table 4. HRs for Non-Cardiovascular Diseases After Exclusion of Participants With Interim or Concurrent Nonfatal Coronary HeartDisease Events
Non-CardiovascularDiseases
Number ofParticipants Excluded Average (9–10) Optimal (11–14)
Cancer 55 0.90 (0.76–1.07) 0.82 (0.66–1.02)
CKD 72 0.60 (0.47–0.76) 0.37 (0.26–0.54)
Pneumonia 54 0.87 (0.67–1.13) 0.60 (0.41–0.87)
DVT/PE 20 0.86 (0.63–1.19) 0.59 (0.37–0.94)
COPD 28 0.63 (0.43–0.93) 0.52 (0.30–0.89)
Dementia 12 0.62 (0.42–0.91) 0.82 (0.51–1.32)
Hip fracture 6 0.83 (0.45–1.53) 0.80 (0.38–1.68)
Any non-CVD event 173 0.66 (0.59–0.74) 0.55 (0.48–0.64)
Hazard ratios (HRs) were adjusted for age, sex, race/ethnicity, income, and education. Inadequate score (0–8) served as reference. CKD indicates chronic kidney disease; COPD, chronicobstructive pulmonary disease; CVD, cardiovascular disease; DVT/PE, deep venous thrombosis/pulmonary embolism.
Table 5. HRs for Non-Cardiovascular Diseases After Exclusion of Participants With Interim or Concurrent Nonfatal CVD
Non-CardiovascularDiseases
Number of ParticipantsExcluded Inadequate (9–10) Optimal (11–14)
Cancer 78 0.90 (0.76–1.07) 0.84 (0.68–1.05)
CKD 91 0.60 (0.47–0.76) 0.39 (0.27–0.56)
Pneumonia 65 0.84 (0.64–1.10) 0.61 (0.42–0.89)
DVT/PE 29 0.87 (0.63–1.21) 0.63 (0.40–1.00)
COPD 32 0.66 (0.45–0.96) 0.54 (0.31–0.92)
Dementia 28 0.59 (0.39–0.90) 0.88 (0.54–1.45)
Hip fracture 10 0.80 (0.42–1.51) 0.84 (0.39–1.79)
Any non-CVD event 243 0.67 (0.59–0.74) 0.57 (0.49–0.66)
Hazard ratios (HRs) were adjusted for age, sex, race/ethnicity, income, and education. Inadequate score (0–8) served as reference. CKD indicates chronic kidney disease; COPD, chronicobstructive pulmonary disease; CVD, cardiovascular disease; DVT/PE, deep venous thrombosis/pulmonary embolism.
DOI: 10.1161/JAHA.116.003954 Journal of the American Heart Association 8
Life’s Simple 7 and Noncardiovascular Disease Ogunmoroti et alORIG
INALRESEARCH

exclusion of participants with estimated glomerular filtrationrates <60 mL/min and those with a diagnosis of COPD atbaseline.
ConclusionsThe present study shows that favorable CVH status issignificantly associated with lower rates of non-CVD events.Encouraging individuals to optimize their CVH will serve as ameans to improve overall well-being at both the individualand population levels and may also curtail healthcareexpenditures.
AcknowledgmentsThe authors thank the other investigators, the staff, and theparticipants of MESA for their valuable contributions. A full list ofparticipating MESA investigators and institutions can be found athttp://www.mesa-nhlbi.org.
Sources of FundingMESA is supported by contracts N01-HC-95159, N01-HC-95160, N01-HC-95161, N01-HC-95162, N01-HC-95163,N01-HC-95164, N01-HC-95164, N01-HC-95165, N01-HC-95166, N01-HC-95167, N01-HC-95168, and N01-HC-95169
Table 6. HRs for Noncardiovascular Diseases by Baseline Levels of Life’s Simple 7 Metrics
Cancer CKD Pneumonia DVT/PE COPD Dementia Hip Fracture
Smoking
Poor 1 (Ref) 1 (Ref) 1 (Ref) 1 (Ref) 1 (Ref) 1 (Ref) 1 (Ref)
Intermediate 0.65 (0.32–1.33) 0.49 (0.15–1.56) 0.86 (0.37–2.00) 0.60 (014–2.53) 1.13 (0.51–2.49) — 2.00 (0.43–9.33)
Ideal 0.63 (0.51–0.78) 0.84 (0.62–1.56) 0.50 (0.37–0.67) 0.71 (0.48–1.06) 0.22 (0.16–0.32) 0.54 (0.32–0.92) 0.35 (0.17–0.73)
Body mass index
Poor 1 (Ref) 1 (Ref) 1 (Ref) 1 (Ref) 1 (Ref) 1 (Ref) 1 (Ref)
Intermediate 0.85 (0.72–1.01) 0.62 (0.50–0.77) 0.69 (0.53–0.89) 0.65 (0.48–0.88) 1.00 (0.68–1.47) 0.99 (0.66–1.49) 1.18 (0.58–2.41)
Ideal 0.88 (0.72–1.07) 0.57 (0.44–0.74) 0.69 (0.51–0.92) 0.53 (0.36–0.78) 1.38 (0.93–2.07) 1.27 (0.82–1.97) 1.64 (0.80–3.36)
Physical activity
Poor 1 (Ref) 1 (Ref) 1 (Ref) 1 (Ref) 1 (Ref) 1 (Ref) 1 (Ref)
Intermediate 0.77 (0.61–0.98) 0.96 (0.73–1.26) 0.79 (0.57–1.11) 0.66 (0.43–1.02) 0.56 (0.36–0.88) 0.80 (0.48–1.32) 0.94 (0.44–2.00)
Ideal 0.82 (0.69–0.97) 0.66 (0.53–0.82) 0.71 (0.55–0.91) 0.70 (0.52–0.95) 0.45 (0.33–0.63) 0.73 (0.50–1.07) 0.65 (0.35–1.21)
Diet
Poor 1 (Ref) 1 (Ref) 1 (Ref) 1 (Ref) 1 (Ref) 1 (Ref) 1 (Ref)
Intermediate 0.88 (0.76–1.02) 0.90 (0.75–1.09) 1.07 (0.86–1.34) 0.81 (0.61–1.07) 0.80 (0.58–1.09) 1.10 (0.56–1.65) 0.96 (0.56–1.65)
Ideal 0.89 (0.44–1.81) 0.39 (0.10–1.58) — 0.98 (0.31–3.11) 0.44 (0.06–3.21) 1.03 (0.25–4.26) 1.03 (0.14–7.73)
Total cholesterol
Poor 1 (Ref) 1 (Ref) 1 (Ref) 1 (Ref) 1 (Ref) 1 (Ref) 1 (Ref)
Intermediate 1.03 (0.81–1.30) 1.04 (0.77–1.40) 1.39 (0.94–2.04) 0.90 (0.60–1.36) 1.29 (0.77–2.16) 1.49 (0.85–2.62) 1.39 (0.57–3.38)
Ideal 1.13 (0.90–1.42) 1.05 (0.78–1.41) 1.59 (1.09–2.33) 0.99 (0.66–1.50) 1.38 (0.83–2.31) 1.32 (0.75–2.32) 1.69 (0.69–4.11)
Blood pressure
Poor 1 (Ref) 1 (Ref) 1 (Ref) 1 (Ref) 1 (Ref) 1 (Ref) 1 (Ref)
Intermediate 0.90 (0.75–1.07) 0.68 (0.55–0.85) 0.72 (0.55–0.94) 1.09 (0.79–1.51) 1.06 (0.74–1.52) 0.78 (0.53–1.14) 0.97 (0.54–1.75)
Ideal 0.92 (0.76–1.10) 0.42 (0.32–0.56) 0.68 (0.51–0.91) 1.01 (0.71–1.44) 0.90 (0.60–1.34) 0.78 (0.50–1.22) 0.69 (0.34–1.38)
Blood glucose
Poor 1 (Ref) 1 (Ref) 1 (Ref) 1 (Ref) 1 (Ref) 1 (Ref) 1 (Ref)
Intermediate 1.03 (0.79–1.35) 0.53 (0.40–0.70) 0.81 (0.56–1.18) 0.72 (0.44–1.18) 0.83 (0.49–1.40) 0.81 (0.48–1.38) 0.46 (0.16–1.33)
Ideal 0.93 (0.74–1.18) 0.36 (0.29–0.46) 0.65 (0.47–0.89) 0.72 (0.48–1.07) 0.72 (0.47–1.12) 0.70 (0.45–1.09) 0.65 (0.30–1.41)
Hazard ratios (HRs) were adjusted for age, sex, race/ethnicity, education, and income.— indicates extremely small HR; CKD, chronic kidney disease; COPD, chronic obstructive pulmonarydisease; DVT/PE, deep venous thrombosis/pulmonary embolism.
DOI: 10.1161/JAHA.116.003954 Journal of the American Heart Association 9
Life’s Simple 7 and Noncardiovascular Disease Ogunmoroti et alORIG
INALRESEARCH
from the National Heart, Lung, and Blood Institute and bygrants UL1-RR-024156 and UL1-RR-025005 from theNational Center for Research Resources.
DisclosuresNone.
References1. Murray CJ, Atkinson C, Bhalla K; U.S. Burden of Disease Collaborators. The
state of US health, 1990–2010: burden of diseases, injuries, and risk factors.JAMA. 2013;310:591–608.
2. Hoyert DL, Xu J. Deaths: preliminary data for 2011. Natl Vital Stat Rep.2012;61:1–51.
3. Zhang X, Holt JB, Lu H, Wheaton AG, Ford ES, Greenlund KJ, Croft JB. Multilevelregression and poststratification for small-area estimation of population healthoutcomes: a case study of chronic obstructive pulmonary disease prevalenceusing the behavioral risk factor surveillance system. Am J Epidemiol.2014;179:1025–1033.
4. Lloyd-Jones DM, Hong Y, Labarthe D, Mozaffarian D, Appel LJ, Van Horn L,Greenlund K, Daniels S, Nichol G, Tomaselli GF, Arnett DK, Fonarow GC, Ho PM,Lauer MS, Masoudi FA, Robertson RM, Roger V, Schwamm LH, Sorlie P, YancyCW, Rosamond WD; American Heart Association Strategic Planning Task F,Statistics C. Defining and setting national goals for cardiovascular healthpromotion and disease reduction: the American Heart Association’s strategicImpact Goal through 2020 and beyond. Circulation. 2010;121:586–613.
5. Stamler J, Stamler R, Neaton JD, Wentworth D, Daviglus ML, Garside D, DyerAR, Liu K, Greenland P. Low risk-factor profile and long-term cardiovascularand noncardiovascular mortality and life expectancy: findings for 5 largecohorts of young adult and middle-aged men and women. JAMA.1999;282:2012–2018.
6. Stampfer MJ, Hu FB, Manson JE, Rimm EB, Willett WC. Primary prevention ofcoronary heart disease in women through diet and lifestyle. N Engl J Med.2000;343:16–22.
7. Chiuve SE, McCullough ML, Sacks FM, Rimm EB. Healthy lifestyle factors inthe primary prevention of coronary heart disease among men benefits amongusers and nonusers of lipid-lowering and antihypertensive medications.Circulation. 2006;114:160–167.
8. Folsom AR, Yatsuya H, Nettleton JA, Lutsey PL, Cushman M, Rosamond WD;Investigators AS. Community prevalence of ideal cardiovascular health, by theAmerican Heart Association definition, and relationship with cardiovasculardisease incidence. J Am Coll Cardiol. 2011;57:1690–1696.
9. Dong C, Rundek T, Wright CB, Anwar Z, Elkind MS, Sacco RL. Idealcardiovascular health predicts lower risks of myocardial infarction, stroke, andvascular death across whites, blacks, and hispanics: the Northern ManhattanStudy. Circulation. 2012;125:2975–2984.
10. Ford ES, Greenlund KJ, Hong Y. Ideal cardiovascular health and mortality fromall causes and diseases of the circulatory system among adults in the UnitedStates. Circulation. 2012;125:987–995.
11. Wu S, Huang Z, Yang X, Zhou Y, Wang A, Chen L, Zhao H, Ruan C, Wu Y, Xin A.Prevalence of ideal cardiovascular health and its relationship with the 4-yearcardiovascular events in a northern Chinese industrial city. Circ CardiovascQual Outcomes. 2012;5:487–493.
12. Kulshreshtha A, Vaccarino V, Judd SE, Howard VJ, McClellan WM, Muntner P,Hong Y, Safford MM, Goyal A, Cushman M. Life’s Simple 7 and risk of incidentstroke: the reasons for geographic and racial differences in stroke study.Stroke. 2013;44:1909–1914.
13. Miao C, BaoM, Xing A, Chen S,Wu Y, Cai J, Chen Y, Yang X. Cardiovascular healthscore and the risk of cardiovascular diseases. PLoS One. 2015;10:e0131537.
14. Folsom AR, Shah AM, Lutsey PL, Roetker NS, Alonso A, Avery CL, MiedemaMD, Konety S, Chang PP, Solomon SD. American Heart Association’s Life’sSimple 7: avoiding heart failure and preserving cardiac structure and function.Am J Med. 2015;128:970–976.
15. Rasmussen-Torvik LJ, Shay CM, Abramson JG, Friedrich CA, Nettleton JA,Prizment AE, Folsom AR. Ideal cardiovascular health is inversely associatedwith incident cancer: the Atherosclerosis Risk in Communities study.Circulation. 2013;127:1270–1275.
16. Muntner P, Judd SE, Gao L, Gutierrez OM, Rizk DV, McClellan W, Cushman M,Warnock DG. Cardiovascular risk factors in CKD associate with both ESRD andmortality. J Am Soc Nephrol. 2013;24:1159–1165.
17. Crichton GE, Elias MF, Davey A, Alkerwi A. Cardiovascular health and cognitivefunction: the Maine-Syracuse Longitudinal Study. PLoS One. 2014;9:e89317.
18. Thacker EL, Gillett SR, Wadley VG, Unverzagt FW, Judd SE, McClure LA,Howard VJ, Cushman M. The American Heart Association Life’s Simple 7 andincident cognitive impairment: the REasons for Geographic And RacialDifferences in Stroke (REGARDS) study. J Am Heart Assoc. 2014;3:e000635doi: 10.1161/JAHA.113.000635.
19. Reis JP, Loria CM, Launer LJ, Sidney S, Liu K, Jacobs DR, Zhu N, Lloyd-JonesDM, He K, Yaffe K. Cardiovascular health through young adulthood andcognitive functioning in midlife. Ann Neurol. 2013;73:170–179.
20. Bild DE, Bluemke DA, Burke GL, Detrano R, Roux AVD, Folsom AR, GreenlandP, Jacobs DR Jr, Kronmal R, Liu K. Multi-Ethnic Study of Atherosclerosis:objectives and design. Am J Epidemiol. 2002;156:871–881.
21. Unger E, Diez-Roux AV, Lloyd-Jones DM, Mujahid MS, Nettleton JA, Bertoni A,Badon SE, Ning H, Allen NB. Association of neighborhood characteristics withcardiovascular health in the Multi-Ethnic Study of Atherosclerosis. CircCardiovasc Qual Outcomes. 2014;7:524–531.
22. Ainsworth BE, Irwin ML, Addy CL, Whitt MC, Stolarczyk LM. Moderate physicalactivity patterns of minority women: the Cross-Cultural Activity ParticipationStudy. J Womens Health Gend Based Med. 1999;8:805–813.
23. Block G, Woods M, Potosky A, Clifford C. Validation of a self-administered diethistory questionnaire using multiple diet records. J Clin Epidemiol.1990;43:1327–1335.
24. Mayer-Davis EJ, Vitolins MZ, Carmichael SL, Hemphill S, Tsaroucha G, RushingJ, Levin S. Validity and reproducibility of a food frequency interview in a multi-cultural epidemiologic study. Ann Epidemiol. 1999;9:314–324.
25. Lloyd-Jones DM. Improving the cardiovascular health of the US population.JAMA. 2012;307:1314–1316.
26. Mannino DM, Buist AS. Global burden of COPD: risk factors, prevalence, andfuture trends. Lancet. 2007;370:765–773.
27. Pripp AH, Dahl OE. The population attributable risk of nutrition and lifestyle onhip fractures. Hip Int. 2015;25:277–281.
28. Almirall J, Bolibar I, Balanz�o X, Gonzalez C. Risk factors for community-acquired pneumonia in adults: a population-based case–control study. EurRespir J. 1999;13:349–355.
29. Johansson H, Kanis JA, Od�en A, McCloskey E, Chapurlat RD, Christiansen C,Cummings SR, Diez-Perez A, Eisman JA, Fujiwara S. A meta-analysis of theassociation of fracture risk and body mass index in women. J Bone Miner Res.2014;29:223–233.
30. Mannino DM, Thorn D, Swensen A, Holguin F. Prevalence and outcomes ofdiabetes, hypertension and cardiovascular disease in COPD. Eur Respir J.2008;32:962–969.
31. Kim JY, Ko YJ, Rhee CW, Park BJ, Kim DH, Bae JM, Shin MH, Lee MS, Li ZM, AhnYO. Cardiovascular health metrics and all-cause and cardiovascular diseasemortality among middle-aged men in Korea: the Seoul male cohort study. JPrev Med Public Health. 2013;46:319–328.
32. Liu Y, Chi HJ, Cui LF, Yang XC, Wu YT, Huang Z, Zhao HY, Gao JS, Wu SL, Cai J.The ideal cardiovascular health metrics associated inversely with mortalityfrom all causes and from cardiovascular diseases among adults in a NorthernChinese industrial city. PLoS One. 2014;9:e89161.
33. Yang Q, Cogswell ME, Flanders WD, Hong Y, Zhang Z, Loustalot F, Gillespie C,Merritt R, Hu FB. Trends in cardiovascular health metrics and associationswith all-cause and CVD mortality among US adults. JAMA. 2012;307:1273–1283.
34. Centers for Medicaid & Medicare Services. 2015. Available at: https://www.cms.gov/. Accessed April 1, 2015.
35. Schroeder SA. Shattuck Lecture. We can do better–improving the health of theAmerican people. N Engl J Med. 2007;357:1221–1228.
36. Strasser T. Reflections on cardiovascular diseases. Interdiscip Sci Rev.1978;3:225–230.
37. Willis BL, DeFina LF, Bachmann JM, Franzini L, Shay CM, Gao A, Leonard D,Berry JD. Association of ideal cardiovascular health and long-term healthcarecosts. Am J Prev Med. 2015;49:678–685.
38. Handy CE, Desai CS, Dardari ZA, Al-Mallah MH, Miedema MD, Ouyang P,Budoff MJ, Blumenthal RS, Nasir K, Blaha MJ. The association of coronaryartery calcium with noncardiovascular disease: the Multi-Ethnic Study ofAtherosclerosis. JACC Cardiovasc Imaging. 2016;9:568–576.
DOI: 10.1161/JAHA.116.003954 Journal of the American Heart Association 10
Life’s Simple 7 and Noncardiovascular Disease Ogunmoroti et alORIG
INALRESEARCH

1
SUPPLEMENTAL MATERIAL

2
Table S1. Components of the LS7 Score
LS7 Metrics Score Definition % MESA
Participants
(N=6506)
Smoking
0 Current smoker 12.9
1 Former smoker, quit ≤12 mo ago 1.2
2 Never smoker or quit >12 mo ago 85.9
BMI
0 ≥30 kg/m2 31.9
1 25.0–29.99 kg/m2 39.3
2 <25.0 kg/m2 28.8
Physical activity*
0 No exercise 22.8
1 1–149 min of moderate exercise or 1–74 min of
vigorous exercise/week
17.3
2 150+ min of moderate exercise or 75+ min of vigorous
exercise/week
59.8
Diet
0 0–1 components of healthy diet 45.2
1 2–3 components of healthy diet 53.7
2 4–5 components of healthy diet 1.1
Blood pressure
0 SBP ≥140 mmHg or DBP ≥90 mmHg 37.5
1 SBP 120–139 mmHg or DBP 80–89 mmHg or treated
to <120/80 mmHg
28.0
2 <120/80 mm Hg, unmedicated 34.6
Total cholesterol
0 ≥240 mg/dL 13.4
1 200–239 mg/dL or treated to <200 mg/dL 39.1
2 <200 mg/dL, unmedicated 47.5
Blood glucose
0 ≥126 mg/dL fasting 10.8
1 100–125 mg/dL fasting or treated to <100 mg/dL 15.2
2 <100 mg/dL fasting, unmedicated 74.1
Adapted from Lloyd Jones et al 1 and Unger et al 2, BMI indicates body mass index; DBP, diastolic blood pressure; SBP, systolic blood pressure; MESA, Multi-Ethnic
Study of Atherosclerosis. Poor=0 point, Intermediate=1 point, ideal =2 points *When combining vigorous and moderate exercise, vigorous exercise was weighted double.

3
Table S2. ICD-9 codes of non-CVD diagnosis of interest
Non-Cardiovascular Disease
Diagnosis of Interest ICD9 Code ICD9 Diagnosis Description
Chronic kidney disease and
indicators of end stage renal
failure
585. CHRONIC KIDNEY DISEASE (CKD)
Cancer (malignant neoplasms
only)
140. to 208.92 MALIGNANT NEOPLASMS
Dementia (Senile dementia,
including vascular dementia,
Alzheimer’s, and Pick's disease)
290. DEMENTIAS
Pneumonia
480. to 487.8 VIRAL PNEUMONIA, BACTERIAL
PNEUMONIA etc
Chronic obstructive pulmonary
disease (COPD)
490. CHRONIC BRONCHITIS, EMPHYSEMA etc
Hip fracture 820. FRACTURE OF NECK OF FEMUR,
FRACTURE OF BASE OF NECK OF
FEMUR, CLOSED etc
Deep vein thrombosis or
Pulmonary embolism
415.1 PULMONARY EMBOLISM AND
INFARCTION, EMBOLISM AND
THROMBOSIS OF UNSPECIFIED SITE etc
A more detailed version can be found online at: https://www.cms.gov/medicare-coverage-
database/staticpages/icd-9-code-lookup.aspx

4
Figure S1. Event rate per 1000 person-years of participants <65 years with Non-CVD by LS7 Score
Event rate per 1000 person-years of participants <65 years with Non-CVD by LS7 Score
The Life’s Simple 7 (LS7) score ranged from 0-14 and was classified into inadequate (0-8), average (9-10) and optimal (11-14) based
on points assigned to each category of the LS7 metrics
Abbreviations: CKD, Chronic Kidney Disease, DVT/PE, Deep Venous Thromboembolism/Pulmonary Embolism; COPD, Chronic
Obstructive Pulmonary Disease
5
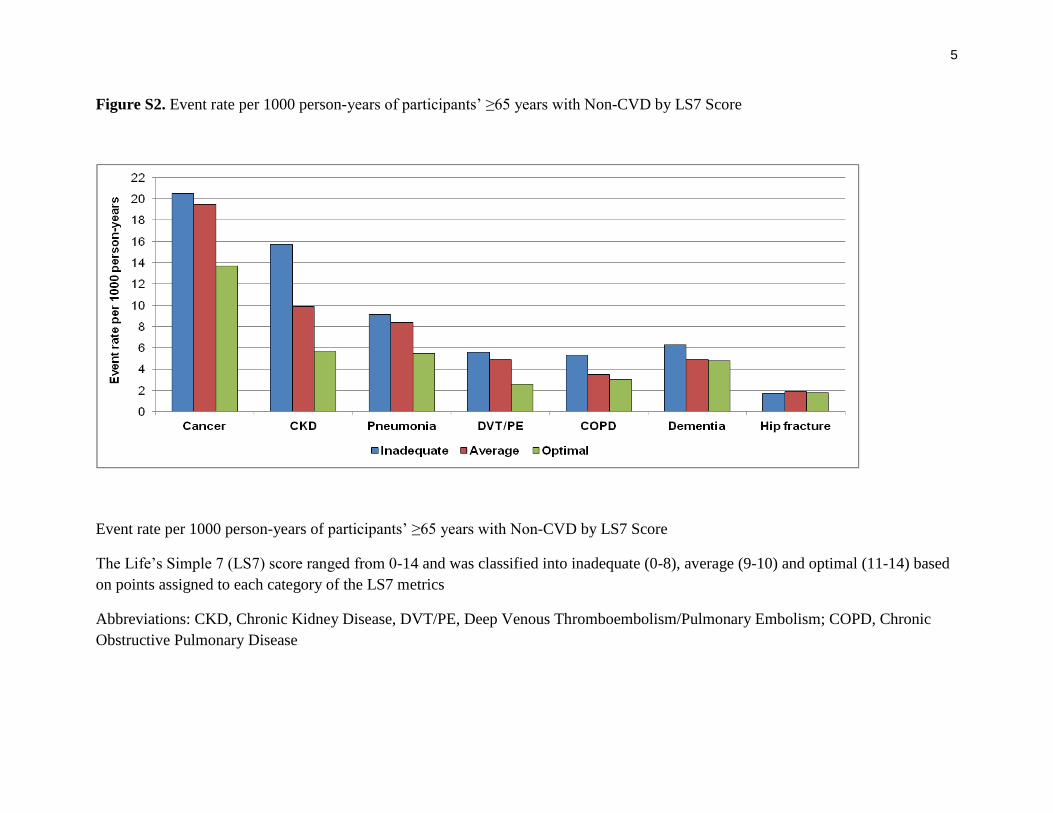
Figure S2. Event rate per 1000 person-years of participants’ ≥65 years with Non-CVD by LS7 Score
Event rate per 1000 person-years of participants’ ≥65 years with Non-CVD by LS7 Score
The Life’s Simple 7 (LS7) score ranged from 0-14 and was classified into inadequate (0-8), average (9-10) and optimal (11-14) based
on points assigned to each category of the LS7 metrics
Abbreviations: CKD, Chronic Kidney Disease, DVT/PE, Deep Venous Thromboembolism/Pulmonary Embolism; COPD, Chronic
Obstructive Pulmonary Disease

6
Figure S3.Event rate per 1000 person-years of women with Non-CVD by LS7 Score
Event rate per 1000 person-years of women with Non-CVD by LS7 Score
The Life’s Simple 7 (LS7) score ranged from 0-14 and was classified into inadequate (0-8), average (9-10) and optimal (11-14) based
on points assigned to each category of the LS7 metrics
Abbreviations: CKD, Chronic Kidney Disease, DVT/PE, Deep Venous Thromboembolism/Pulmonary Embolism; COPD, Chronic
Obstructive Pulmonary Disease

7
Figure S4. Event rate per 1000 person-years of men with Non-CVD by LS7 Score
Event rate per 1000 person-years of men with Non-CVD by LS7 Score
The Life’s Simple 7 (LS7) score ranged from 0-14 and was classified into inadequate (0-8), average (9-10) and optimal (11-14) based
on points assigned to each category of the LS7 metrics
Abbreviations: CKD, Chronic Kidney Disease, DVT/PE, Deep Venous Thromboembolism/Pulmonary Embolism; COPD, Chronic
Obstructive Pulmonary Disease

8
Figure S5. Event rate per 1000 person-years of White participants with Non-CVD by LS7 Score
Event rate per 1000 person-years of White participants with Non-CVD by LS7 Score
The Life’s Simple 7 (LS7) score ranged from 0-14 and was classified into inadequate (0-8), average (9-10) and optimal (11-14) based
on points assigned to each category of the LS7 metrics.
Abbreviations: CKD, Chronic Kidney Disease, DVT/PE, Deep Venous Thromboembolism/Pulmonary Embolism; COPD, Chronic
Obstructive Pulmonary Disease

9
Figure S6. Event rate per 1000 person-years of African-American participants with Non-CVD by LS7 Score
Event rate per 1000 person-years of African-American participants with Non-CVD by LS7 Score
The Life’s Simple 7 (LS7) score ranged from 0-14 and was classified into inadequate (0-8), average (9-10) and optimal (11-14) based
on points assigned to each category of the LS7 metrics
Abbreviations: CKD, Chronic Kidney Disease, DVT/PE, Deep Venous Thromboembolism/Pulmonary Embolism; COPD, Chronic
Obstructive Pulmonary Disease

10
Figure S7. Event rate per 1000 person-years of Hispanic participants with Non-CVD by LS7 Score
Event rate per 1000 person-years of Hispanic participants with Non-CVD by LS7 Score
The Life’s Simple 7 (LS7) score ranged from 0-14 and was classified into inadequate (0-8), average (9-10) and optimal (11-14) based
on points assigned to each category of the LS7 metrics
Abbreviations: CKD, Chronic Kidney Disease, DVT/PE, Deep Venous Thromboembolism/Pulmonary Embolism; COPD, Chronic
Obstructive Pulmonary Disease
11
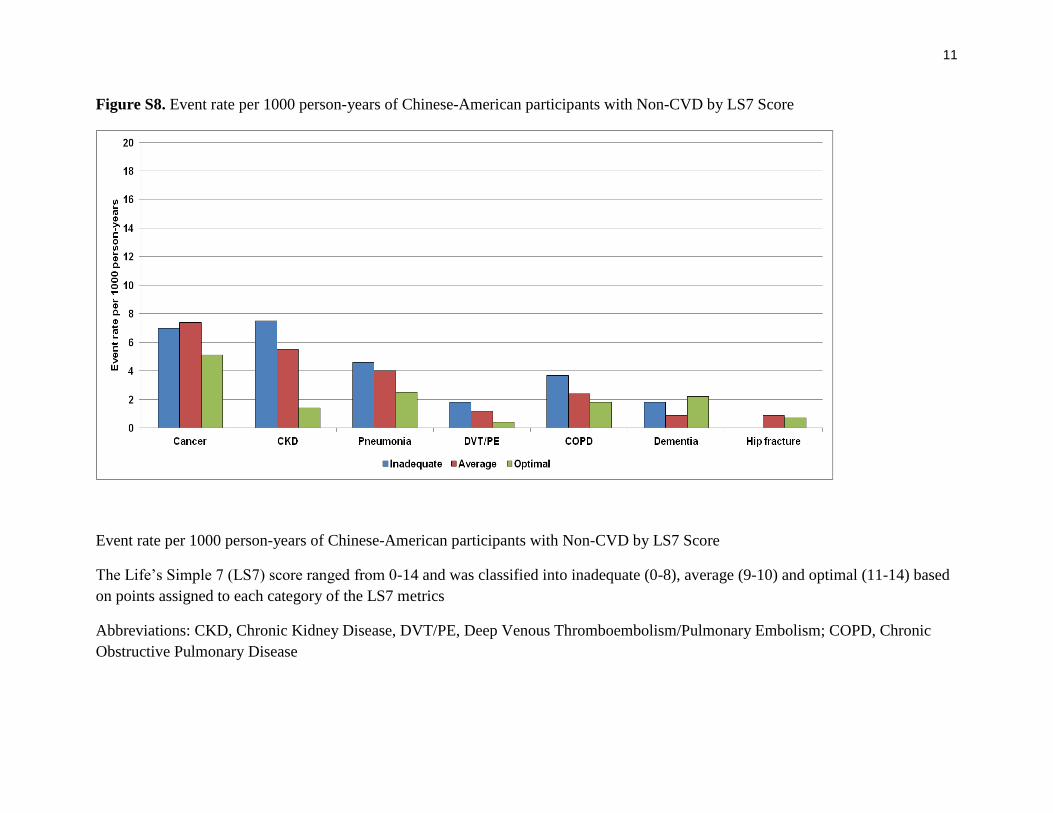
Figure S8. Event rate per 1000 person-years of Chinese-American participants with Non-CVD by LS7 Score
Event rate per 1000 person-years of Chinese-American participants with Non-CVD by LS7 Score
The Life’s Simple 7 (LS7) score ranged from 0-14 and was classified into inadequate (0-8), average (9-10) and optimal (11-14) based
on points assigned to each category of the LS7 metrics
Abbreviations: CKD, Chronic Kidney Disease, DVT/PE, Deep Venous Thromboembolism/Pulmonary Embolism; COPD, Chronic
Obstructive Pulmonary Disease

12
Figure S9. Kaplan Meier curves for non-CVD events and the aggregate outcome of any non-CVD diagnosis 0
.50
1.0
0
0 5 10 15Time in years
Inadequate
Average
Optimal
LS7 Score
Cancer
0.5
01
.00
0 5 10 15Time in years
Inadequate
Average
Optimal
LS7 Score
Chronic Kidney Disease
0.9
01
.00
0 5 10 15Time in years
Inadequate
Average
Optimal
LS7 Score
Chronic Obstructive Pulmonary Disease
0.9
01
.00
0 5 10 15Tme in years
Inadequate
Average
Optimal
LS7 Score
Dementia

13
0.9
01
.00
0 5 10 15Tme in years
Inadequate
Average
Optimal
LS7 Score
Deep Venous Thrombosis or Pulmonary Embolism
0.9
01
.00
0 5 10 15Time in years
Inadequate
Average
Optimal
LS7 Score
Pneumonia
0.9
01
.00
0 5 10 15Time in years
Inadequate
Average
Optimal
LS7 Score
Hip Fracture
0.5
01
.00
0 5 10 15Time in years
Inadequate
Adequate
Optimal
LS7 Score
Aggregate Outcome of Any Non-CVD event

14
Figure S10. Event rate per 1000 person-years of study participants with any Non-CVD event by LS7 Score
Inadequate Average Optimal
Unadjusted HR 1.0 0.61 (0.55-0.67) 0.43 (0.38-0.50)
Adjusted HR 1.0 0.66 (0.60-0.73) 0.53 (0.46-0.61)
Hazard ratios were adjusted for age, sex, race/ethnicity, income and education

15
Figure S11. Event rate per 1000 person-years of participants with income <$40,000 with Non-CVD by LS7 Score
Event rate per 1000 person-years of participants with income <$40,000 with Non-CVD by LS7 Score
The Life’s Simple 7 (LS7) score ranged from 0-14 and was classified into inadequate (0-8), average (9-10) and optimal (11-14) based
on points assigned to each category of the LS7 metrics
Abbreviations: CKD, Chronic Kidney Disease, DVT/PE, Deep Venous Thromboembolism/Pulmonary Embolism; COPD, Chronic
Obstructive Pulmonary Disease

16
Figure S12. Event rate per 1000 person-years of participants with income ≥$40,000 with Non-CVD by LS7 Score
Event rate per 1000 person-years of participants with income ≥$40,000 with Non-CVD by LS7 Score
The Life’s Simple 7 (LS7) score ranged from 0-14 and was classified into inadequate (0-8), average (9-10) and optimal (11-14) based
on points assigned to each category of the LS7 metrics
Abbreviations: CKD, Chronic Kidney Disease, DVT/PE, Deep Venous Thromboembolism/Pulmonary Embolism; COPD, Chronic
Obstructive Pulmonary Disease

17
References:
1. Lloyd-Jones DM, Hong Y, Labarthe D, Mozaffarian D, Appel LJ, Van Horn L, Greenlund K,
Daniels S, Nichol G, Tomaselli GF, Arnett DK, Fonarow GC, Ho PM, Lauer MS, Masoudi FA,
Robertson RM, Roger V, Schwamm LH, Sorlie P, Yancy CW, Rosamond WD; American Heart
Association Strategic Planning Task Force and Statistics Committee. Defining and setting
national goals for cardiovascular health promotion and disease reduction: the American Heart
Association's strategic Impact Goal through 2020 and beyond. Circulation. 2010;121:586-613.
2. Unger E, Diez-Roux AV, Lloyd-Jones DM, Mujahid MS, Nettleton JA, Bertoni A, Badon SE,
Ning H, Allen NB. Association of neighborhood characteristics with cardiovascular health in the
Multi-Ethnic Study of Atherosclerosis. Circ Cardiovasc Qual Outcomes. 2014;7:524-531.

Rana, Ron Blankstein, Roger S. Blumenthal, Michael J. Blaha, Emir Veledar and Khurram NasirOluseye Ogunmoroti, Norrina B. Allen, Mary Cushman, Erin D. Michos, Tatjana Rundek, Jamal S.
of AtherosclerosisEthnic Study−Association Between Life's Simple 7 and Noncardiovascular Disease: The Multi
Online ISSN: 2047-9980 Dallas, TX 75231
is published by the American Heart Association, 7272 Greenville Avenue,Journal of the American Heart AssociationThe doi: 10.1161/JAHA.116.003954
2016;5:e003954; originally published October 20, 2016;J Am Heart Assoc.
http://jaha.ahajournals.org/content/5/10/e003954World Wide Web at:
The online version of this article, along with updated information and services, is located on the
for more information. http://jaha.ahajournals.orgAccess publication. Visit the Journal at is an online only OpenJournal of the American Heart AssociationSubscriptions, Permissions, and Reprints: The