Assessment of Factors Influencing Consumer Satisfaction: A .... Bello.pdf · Assessment of Factors...
14
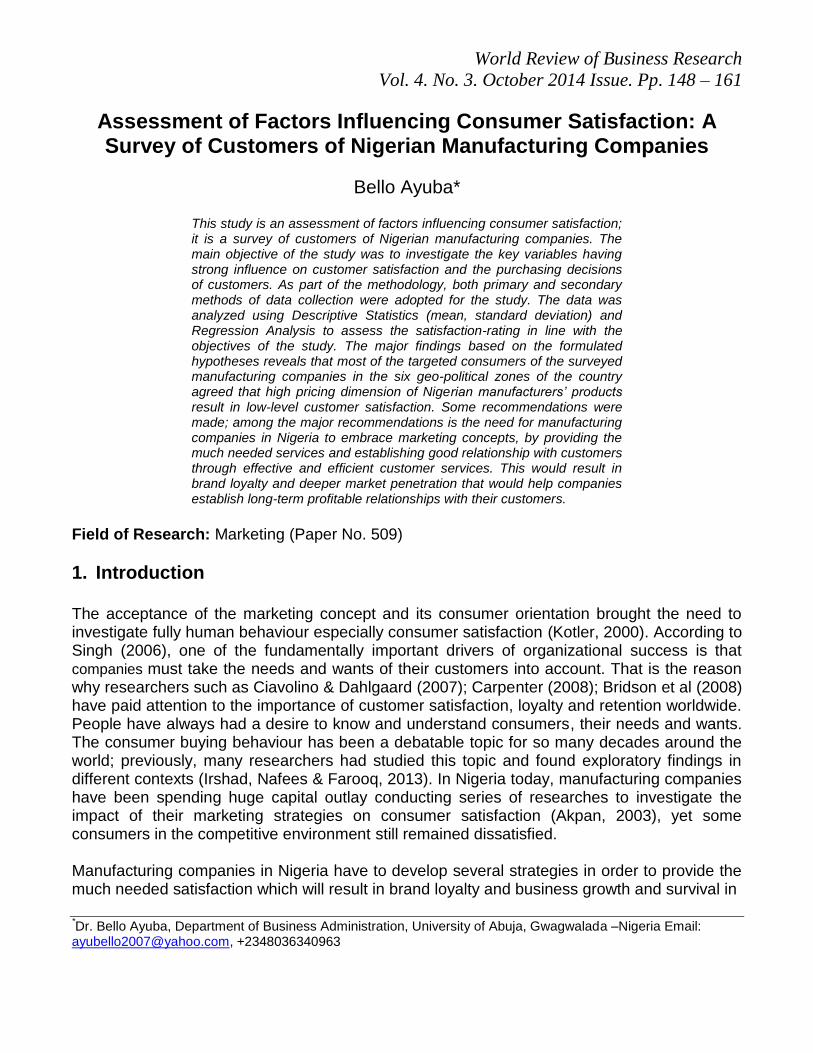
World Review of Business Research Vol. 4. No. 3. October 2014 Issue. Pp. 148 – 161 Assessment of Factors Influencing Consumer Satisfaction: A Survey of Customers of Nigerian Manufacturing Companies Bello Ayuba* This study is an assessment of factors influencing consumer satisfaction; it is a survey of customers of Nigerian manufacturing companies. The main objective of the study was to investigate the key variables having strong influence on customer satisfaction and the purchasing decisions of customers. As part of the methodology, both primary and secondary methods of data collection were adopted for the study. The data was analyzed using Descriptive Statistics (mean, standard deviation) and Regression Analysis to assess the satisfaction-rating in line with the objectives of the study. The major findings based on the formulated hypotheses reveals that most of the targeted consumers of the surveyed manufacturing companies in the six geo-political zones of the country agreed that high pricing dimension of Nigerian manufacturers’ products result in low-level customer satisfaction. Some recommendations were made; among the major recommendations is the need for manufacturing companies in Nigeria to embrace marketing concepts, by providing the much needed services and establishing good relationship with customers through effective and efficient customer services. This would result in brand loyalty and deeper market penetration that would help companies establish long-term profitable relationships with their customers. Field of Research: Marketing (Paper No. 509) 1. Introduction The acceptance of the marketing concept and its consumer orientation brought the need to investigate fully human behaviour especially consumer satisfaction (Kotler, 2000). According to Singh (2006), one of the fundamentally important drivers of organizational success is that companies must take the needs and wants of their customers into account. That is the reason why researchers such as Ciavolino & Dahlgaard (2007); Carpenter (2008); Bridson et al (2008) have paid attention to the importance of customer satisfaction, loyalty and retention worldwide. People have always had a desire to know and understand consumers, their needs and wants. The consumer buying behaviour has been a debatable topic for so many decades around the world; previously, many researchers had studied this topic and found exploratory findings in different contexts (Irshad, Nafees & Farooq, 2013). In Nigeria today, manufacturing companies have been spending huge capital outlay conducting series of researches to investigate the impact of their marketing strategies on consumer satisfaction (Akpan, 2003), yet some consumers in the competitive environment still remained dissatisfied. Manufacturing companies in Nigeria have to develop several strategies in order to provide the much needed satisfaction which will result in brand loyalty and business growth and survival in * Dr. Bello Ayuba, Department of Business Administration, University of Abuja, Gwagwalada –Nigeria Email: [email protected], +2348036340963
Transcript of Assessment of Factors Influencing Consumer Satisfaction: A .... Bello.pdf · Assessment of Factors...
World Review of Business Research
Vol. 4. No. 3. October 2014 Issue. Pp. 148 – 161
Assessment of Factors Influencing Consumer Satisfaction: A Survey of Customers of Nigerian Manufacturing Companies
Bello Ayuba*
This study is an assessment of factors influencing consumer satisfaction; it is a survey of customers of Nigerian manufacturing companies. The main objective of the study was to investigate the key variables having strong influence on customer satisfaction and the purchasing decisions of customers. As part of the methodology, both primary and secondary methods of data collection were adopted for the study. The data was analyzed using Descriptive Statistics (mean, standard deviation) and Regression Analysis to assess the satisfaction-rating in line with the objectives of the study. The major findings based on the formulated hypotheses reveals that most of the targeted consumers of the surveyed manufacturing companies in the six geo-political zones of the country agreed that high pricing dimension of Nigerian manufacturers’ products result in low-level customer satisfaction. Some recommendations were made; among the major recommendations is the need for manufacturing companies in Nigeria to embrace marketing concepts, by providing the much needed services and establishing good relationship with customers through effective and efficient customer services. This would result in brand loyalty and deeper market penetration that would help companies establish long-term profitable relationships with their customers.
Field of Research: Marketing (Paper No. 509)
1. Introduction The acceptance of the marketing concept and its consumer orientation brought the need to investigate fully human behaviour especially consumer satisfaction (Kotler, 2000). According to Singh (2006), one of the fundamentally important drivers of organizational success is that companies must take the needs and wants of their customers into account. That is the reason why researchers such as Ciavolino & Dahlgaard (2007); Carpenter (2008); Bridson et al (2008) have paid attention to the importance of customer satisfaction, loyalty and retention worldwide. People have always had a desire to know and understand consumers, their needs and wants. The consumer buying behaviour has been a debatable topic for so many decades around the world; previously, many researchers had studied this topic and found exploratory findings in different contexts (Irshad, Nafees & Farooq, 2013). In Nigeria today, manufacturing companies have been spending huge capital outlay conducting series of researches to investigate the impact of their marketing strategies on consumer satisfaction (Akpan, 2003), yet some consumers in the competitive environment still remained dissatisfied. Manufacturing companies in Nigeria have to develop several strategies in order to provide the much needed satisfaction which will result in brand loyalty and business growth and survival in *Dr. Bello Ayuba, Department of Business Administration, University of Abuja, Gwagwalada –Nigeria Email: [email protected], +2348036340963
Ayuba
149
the long run. Since a satisfied customer is the core concern of any marketing organization, manufacturers must pay close attention to the factors that influence consumers‟ buying behaviours as understanding consumer behavior is central to competition (Haque, Khitabi & Rahman, 2009). Marketers should note that consumers are always eager to go for the kind of product that will enhance their standards of living, a product that is hygienic, reasonably of high quality and affordable at a much reduced cost; thus, manufacturers must analyze the consumer buying behaviour both in terms of specific product features such as the product attributes, price, packaging, style, customer service, or a combination of other features. With better understanding of customers' perceptions, manufacturing companies can determine the actions required to meet the customers' needs. It is in recognition of the importance of consumer satisfaction in marketing that this study was conducted to help Nigerian manufacturing companies in identifying the factors influencing consumer satisfaction which will go a long way in retaining existing customers and attracting more customers necessary for companies to remain competitive in the environment. Even though previous researches have investigated the influence of general individual factors such as income level, user status and social class on customer satisfaction (Gustafsson, Johnson & Roos, 2005), there are limited studies focusing on the factors influencing consumer satisfaction of customers of Nigerian manufacturing companies which this study is designed to accomplish. The study will be of immense benefit to Nigerian manufacturing companies; as it significantly contributed to the better understanding of those major factors that are unique to the Nigerian environment. It is hoped that the study will enhance the national and global competitiveness of Nigerian manufacturing companies. It is in view of the foregoing that the following research questions were raised: (1) To what extent is the relationship between pricing dimension and product quality? (2) Is there any significant relationship between pricing dimension and consumer buying behaviour? (3) How significant is the relationship between product quality and consumer buying behaviour? 1.1 Objectives of the Study The main objective of the study is to investigate the key variables, having strong influence on customer satisfaction and purchasing decisions of customers. Other specific objectives are:
To examine the impact of the various factors on consumption pattern of manufacturers‟ products in Nigeria.
To use different product attributes and assess the satisfaction rating of customers in the Nigerian manufacturing sector.
To determine the extent of customer loyalty in a highly competitive Nigerian manufacturing sector.
The paper is divided into six sections with an introduction to the study provided in this section. The next section is the literature review on the concept of consumer satisfaction and its measurement variables. Research methodology and the results and discussions are the next. Conclusion and recommendations are provided in section five and the final section deals with the managerial implications and suggestions for further studies. The findings of the present
Ayuba
150
study are consistent with the previous studies in concluding that high pricing dimension of Nigerian manufacturer‟s products result in low-level of customer satisfaction and consumers derive maximum satisfaction from a fair price.
2. Literature Review 2.1 Consumer Satisfaction Consumer satisfaction is a measure of how products and services supplied by a company meet or surpass consumer expectations. It is defined as "the number of consumers or percentage of total consumers, whose reported experience with a firm, its products, or its services (ratings) exceeds specified satisfaction goals" (Chauhan and Limbad, 2013). Satisfied customers are central to optimal performance and financial returns. Placing a high priority on customer satisfaction is critical to improved organizational performance in a global marketplace. Any business is likely to lose market share, customers and investors if it fails to satisfy customers as effectively and efficiently as its competitors is doing; customer satisfaction is customer‟s reaction to the state of satisfaction, and customer‟s judgment of satisfaction level (Anderson, Fornell, and Mazvancheryl, 2004). Kotler (2000) also define satisfaction as a person‟s feelings of pleasure, excitement, delight or disappointment which results from comparing a product‟s perceived performance to his or her expectations. Satisfaction means the contentment one feels when one has fulfilled a desire, need or expectation. Furthermore, Customer satisfaction can be a measure of how happy customers are with the services and products of a supermarket. Keeping customers happy is of tremendous benefit to companies. Satisfied customers are more likely to stay loyal, consume more and are more likely to recommend their friends to the business. Customer satisfaction is very important in today‟s business world as according to Deng et al., (2009) the ability of a service provider to create high degree of satisfaction is crucial for product differentiation and developing strong relationship with customers. Previous researchers have found that satisfaction of the customers can help the brands to build long and profitable relationships with their customers (Eshghi, Haughton and Topi, 2007). Though, it is costly to generate satisfied and loyal customers that would prove profitable in the long run for a company (Anderson, Fornell and Mazvancheryl, 2004), a company should concentrate on the improvement of product quality and charge appropriate fair price in order to satisfy customers who would ultimately help the firm to retain its customers (Gustafsson, Johnson and Roos, 2005). Customer satisfaction is actually how a customer evaluates the product performance (Gustafsson, Johnson and Roos, 2005). A deeper understanding regarding the product quality is very important for every marketer. Customer satisfaction and quality products are parallel in relationships with price, expertise, timeliness, service and the physical environment. Zeithaml, (1988) found that perception of consumers of quality change over a time as a result of added information, increased by changing expectations and competition in a product category. Consumers base their purchasing decision on information indications and signals like product name, design & price.
Ayuba
151
It is a common phenomenon that the services a brand offers and the price it charges actually determine the level of satisfaction among its customers, than any other measure. This satisfaction may influence the concerned company by repurchase, purchase of more products, positive word of mouth and willingness of customer to pay more for the particular brand. Most of the consumers need convenience and quality products that strongly motivate them to buy the same product more frequently in the future (Ahuja, Gupta, & Raman, 2003). Ahmad, & Vays, (2011) found that the pre-decision time of consumer purchasing behavior recognized solid link with the desire purchasing behaviour of the consumers. Customer satisfaction is a key and valued outcome of competitive marketing practice. The smart competitor must design and deliver offerings for well defined target markets, companies should see themselves as a value delivering process resulting in effective customer satisfaction (Kotler, 2009). Increasing customer satisfaction has been found to lead to higher future profitability (Singh (2006)), lower costs related to defective goods and services, increased buyer willingness to pay price premiums, provide referrals, and use more of the product (Anderson and Mittal 2000), and higher levels of customer retention and loyalty. Increasing loyalty, in turn, has been found to lead to increases in future revenue and reductions in the cost of future transactions (Deng et al., 2009). All of this empirical evidence suggests that consumer satisfaction is valuable from both a customer goodwill perspective and an organization‟s perspective. From the empirical evidence, it is clear that the researches done by Akpan (2003), Zeithaml (1988), Singh (2006) and Gustafsson, Johnson and Roos (2005) have failed to specifically provide the relationship between pricing dimension and consumer buying behaviour; the relationship between product quality and consumer buying behavior. This study demonstrates the relationship between pricing dimension, product quality and consumer buying behaviour as significant factors to customer satisfaction.
2.2 Dimensions of Customer Satisfaction
Satisfaction according to Singh (2006) is affected by many factors which include friendly employees, courteous employees, knowledgeable employees, and helpful employees, consumer buying behavior, accuracy of billing, expertise, timeliness, physical environment, competitive pricing, product quality, good value and quick service. The limitation of this study is that the study concentrates only on three dimensions of customer satisfaction which are Pricing dimension, Product quality and consumer buying behaviour.
3. Methodology The study consists of a population of 145 current and potential customers of the manufacturing companies listed on the Nigerian Stock Exchange (NSE) as at December 2013. To ensure accuracy and reliability of data, a time period under review of 4 years, from 2009 to 2013, was chosen because it is believed that there was serious transformation of the Nigerian manufacturing sector. This is in view of the on-going reform agenda of the Federal Government as encapsulated in the National Economic Empowerment Development Strategies (NEEDS) document. However, the customers cut across the six geo-political zones
Ayuba
152
of the country namely; North-Central (NC), North-East (NE), North-West (NW), South-East (SE), South-West (SW) and South-South (SS). The population cuts across the ten (10) manufacturing sub-sectors namely; Building Materials, Construction, Emerging Market, Food and Beverages, Textiles, Agriculture, Domestic Products, Automobile, Petroleum and Healthcare. The choice of the 10 sub-sectors is in view of their strategic contributions to the country‟s economic growth and development (Borodo, 2008). The sample of the study is 100 selected based on stratified random sampling technique; the writer distributed the sampled questionnaires directly to randomly selected 100 respondents of the manufacturing companies scattered within the six geo-political zones of the Nigerian federation which represented 69% of the study population. Customer groups such as students, employees, low income earners, distributors and other chains of marketing intermediaries completed samples of the questionnaires. This method of meeting customers face-to-face accounted for the 100 percent response rate recorded. The method of data collection involved both the primary and secondary sources. The primary data were sourced from the questionnaires where respondents are categorized according to age, gender, marital status, educational qualifications, income level and post-purchase behaviour, while the secondary data were sourced from a number of literature books, journal articles, and related studies conducted by other researchers. The analysis was conducted using different types of statistical techniques. These are Descriptive Statistics (mean, standard deviation) and Regression Analysis to assess the satisfaction-rating in line with the objectives of the study. 3.1 Validity and Reliability of Research Instruments The reliability assessment of our indicator variables was conducted using Cronbach Alpha (Table 3). The result of the test was already confirmed in previous studies relating to factors influencing consumer satisfaction (Meng, 2009; Dutti, 2009; Morley, 2004 & Arnold & Reynolds, 2005). 3.2 Theoretical Bases In order to assess the factors influencing consumer satisfaction the researches reviewed here made use of a variety of theories, including theory on the application of marketing concepts (Kotler, 2000), theory of customer based antecedents of satisfaction and dissatisfaction (Morley, 2004), the theory of consumer satisfaction (Deng et al, 2009) and some blends of cognitive model of the antecedents and consequence of customer satisfaction (Arnold & Reynolds, 2005). 3.3 Hypothesis Statement
Hypothesis One (H1): High pricing dimension of Nigerian manufacturer’s products would result in low-level of customer satisfaction. Hypothesis Two (H2): Effective customer services enhance customer satisfaction and increase in the number of satisfied customers.
Ayuba
153
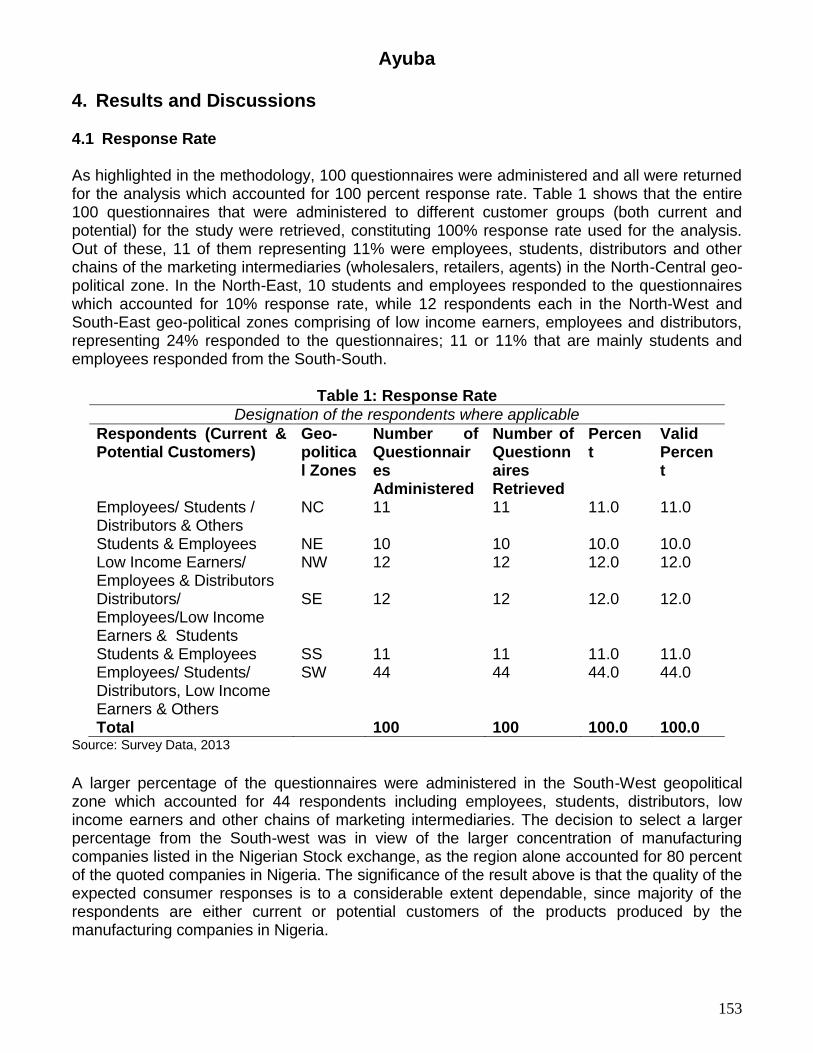
4. Results and Discussions 4.1 Response Rate As highlighted in the methodology, 100 questionnaires were administered and all were returned for the analysis which accounted for 100 percent response rate. Table 1 shows that the entire 100 questionnaires that were administered to different customer groups (both current and potential) for the study were retrieved, constituting 100% response rate used for the analysis. Out of these, 11 of them representing 11% were employees, students, distributors and other chains of the marketing intermediaries (wholesalers, retailers, agents) in the North-Central geo-political zone. In the North-East, 10 students and employees responded to the questionnaires which accounted for 10% response rate, while 12 respondents each in the North-West and South-East geo-political zones comprising of low income earners, employees and distributors, representing 24% responded to the questionnaires; 11 or 11% that are mainly students and employees responded from the South-South.
Table 1: Response Rate
Designation of the respondents where applicable
Respondents (Current & Potential Customers)
Geo-political Zones
Number of Questionnaires Administered
Number of Questionnaires Retrieved
Percent
Valid Percent
Employees/ Students / Distributors & Others
NC 11 11 11.0 11.0
Students & Employees NE 10 10 10.0 10.0 Low Income Earners/ Employees & Distributors
NW 12 12 12.0 12.0
Distributors/ Employees/Low Income Earners & Students
SE 12 12 12.0 12.0
Students & Employees SS 11 11 11.0 11.0 Employees/ Students/ Distributors, Low Income Earners & Others
SW
44 44 44.0 44.0
Total 100 100 100.0 100.0 Source: Survey Data, 2013
A larger percentage of the questionnaires were administered in the South-West geopolitical zone which accounted for 44 respondents including employees, students, distributors, low income earners and other chains of marketing intermediaries. The decision to select a larger percentage from the South-west was in view of the larger concentration of manufacturing companies listed in the Nigerian Stock exchange, as the region alone accounted for 80 percent of the quoted companies in Nigeria. The significance of the result above is that the quality of the expected consumer responses is to a considerable extent dependable, since majority of the respondents are either current or potential customers of the products produced by the manufacturing companies in Nigeria.
Ayuba
154
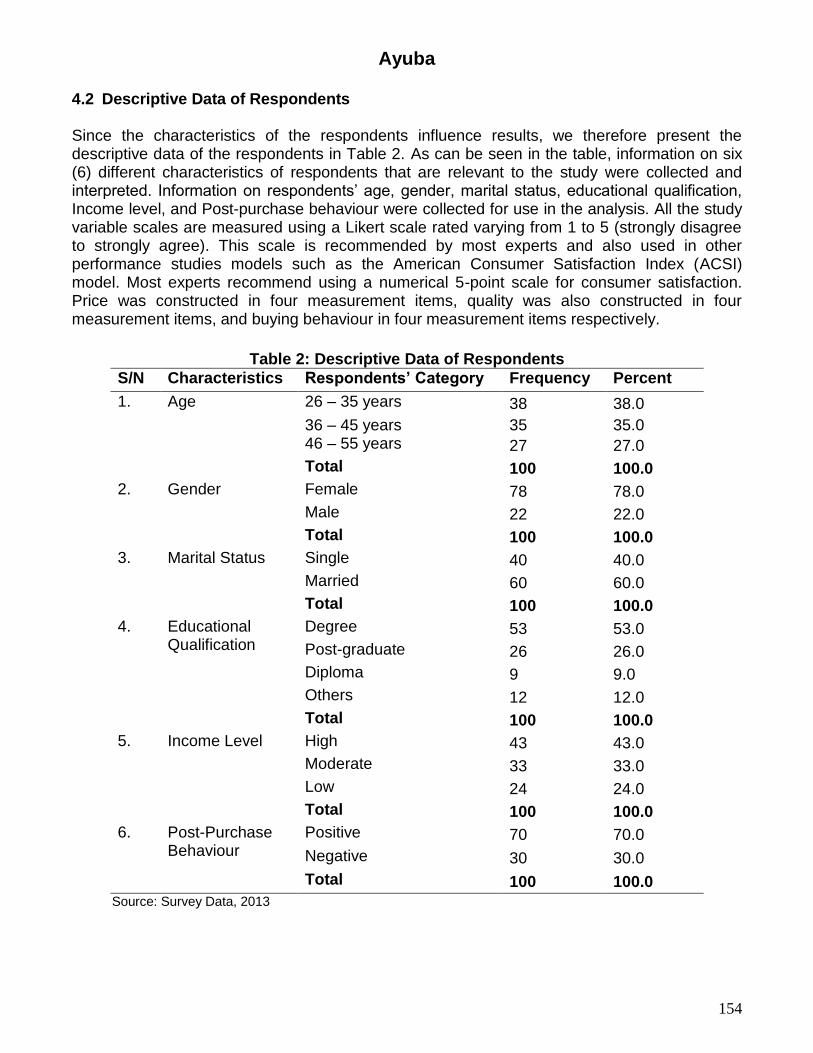
4.2 Descriptive Data of Respondents Since the characteristics of the respondents influence results, we therefore present the descriptive data of the respondents in Table 2. As can be seen in the table, information on six (6) different characteristics of respondents that are relevant to the study were collected and interpreted. Information on respondents‟ age, gender, marital status, educational qualification, Income level, and Post-purchase behaviour were collected for use in the analysis. All the study variable scales are measured using a Likert scale rated varying from 1 to 5 (strongly disagree to strongly agree). This scale is recommended by most experts and also used in other performance studies models such as the American Consumer Satisfaction Index (ACSI) model. Most experts recommend using a numerical 5-point scale for consumer satisfaction. Price was constructed in four measurement items, quality was also constructed in four measurement items, and buying behaviour in four measurement items respectively.
Table 2: Descriptive Data of Respondents
S/N Characteristics Respondents’ Category Frequency Percent
1. Age
26 – 35 years 38 38.0
36 – 45 years 35 35.0 46 – 55 years 27 27.0
Total 100 100.0
2. Gender
Female 78 78.0
Male 22 22.0
Total 100 100.0
3. Marital Status Single 40 40.0
Married 60 60.0
Total 100 100.0
4. Educational Qualification
Degree 53 53.0
Post-graduate 26 26.0
Diploma 9 9.0
Others 12 12.0
Total 100 100.0
5. Income Level High 43 43.0
Moderate 33 33.0
Low 24 24.0
Total 100 100.0
6. Post-Purchase Behaviour
Positive 70 70.0
Negative 30 30.0
Total 100 100.0
Source: Survey Data, 2013
Ayuba
155
Table 2 shows that majority of the respondents who gave their responses fell within the economically active group between the ages of 26 and 45 constituting 38% and 35% respectively. While the remaining constitute 27% made up of respondents between 46 and 55, and above 55 years. This, no doubt, would further justify our results since most of the responses were presumed to be emanating from those with the necessary purchasing power to acquire and assess the product in terms of quality, price and portray a particular behaviour after purchase which helps in achieving the research objectives. The respondents‟ gender as displayed in Table 2 indicates that the females (78%) were more than the males (22%) which shows that females were more involved in purchases and portray more post-purchase behaviours than the males. In the same Table 2, the marital status of the respondents indicates that those who are married constitute the largest percentage of respondents (60%). This shows that married consumers are more likely to be involved in product evaluations and adoption than single consumers who constitute 40 percent. From the table, the education levels were evenly distributed. Virtually all the respondents were educated, with 53% having at least Bachelor‟s degree certificates, 26% have their Postgraduate Degrees. Diploma holders were about 9% while others with certificates other than the ones mentioned earlier (at least education up to post-secondary level and those with HND and doctoral level of education) were about 12%.These statistics further indicate that most of the respondents had higher education while a relatively small number had at least high school education necessary for the respondents to have an informed knowledge on the subject of the study. On the respondents‟ income level, the table shows that out of the 100 total respondents, 43 are mainly working class with high income level, representing 43 percent, while 33 representing 33 percent are middle income earners who are current and potential customers of some Nigerian manufacturing company‟s products. Low income earners who are mainly unemployed constituted only 24, representing 24%. This implies that the high income earners are more complex in terms of their consumption behaviours than those in the middle and lower classes. Finally, the table shows that majority of the respondents about 70 or 70% of them portray a negative behaviour on questions related to the high pricing dimension of manufacturers‟ products while 30 or 30% of the respondents portrayed positive behaviour. The implication to the study is that most consumers expressed dissatisfaction with the hike in price as majority of them are price sensitive, they always go for those products that offer the most quality performance at a reduced cost. However, a detailed statistical analysis was conducted to define factors influencing consumer satisfaction model. The main statistical analyses conducted included consistency tests on the model using Cronbach's alpha method as summarized in Table 3 and validation of the indirect measurement of expectations. This was conducted between the periods of 12th April and November 2013. The table shows the reliability assessment of our indicator variables; the Cronbach coefficients of the items in the instrument are above the rule of thumb cut-off mark of 0.70 (Hatcher, 1994) and, therefore, the items are internally related to the factors they are expected to measure. The reliability test table indicates that all the items for each dimension are high, the individual reliability of the variables measured as 0.866 for pricing dimension
Ayuba
156
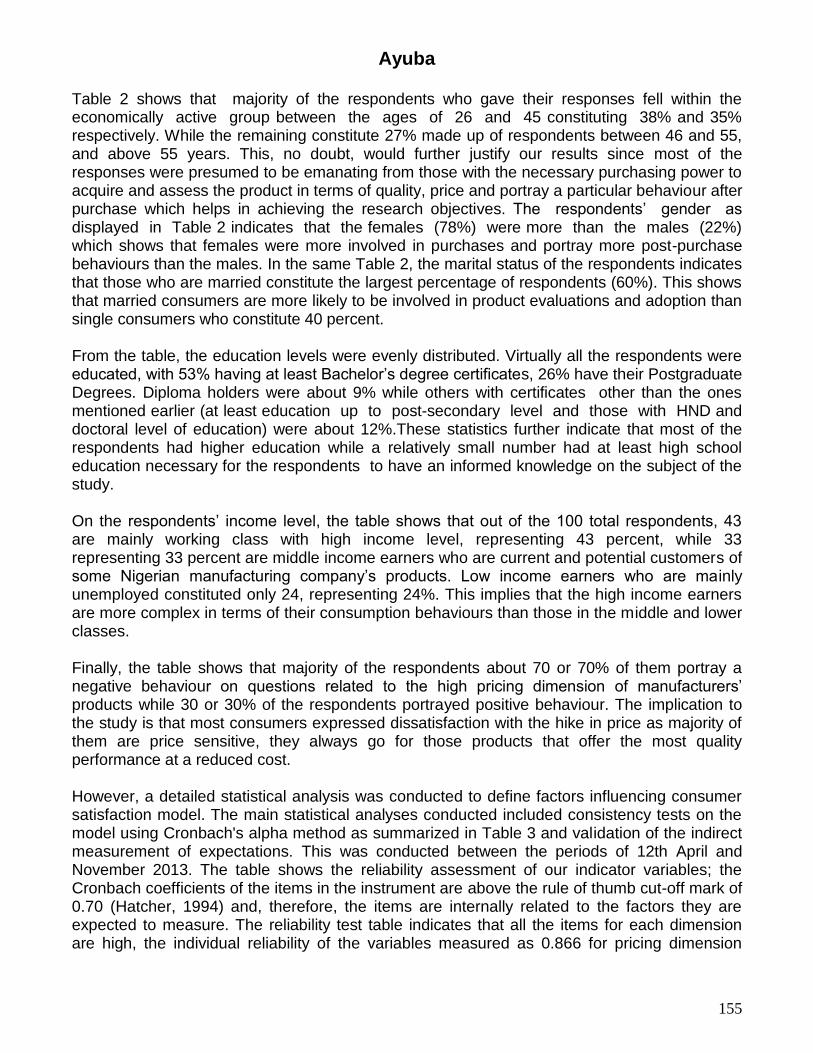
scale, product quality scale 0.826 and 0.869 for consumer buying behavior scale, were all satisfactory. 4.3 Cronbach’s Alpha Reliability Test Statistics
Table 3: Cronbach’s Alpha Reliability Statistics
Variables Cronbach’s Alpha
Pricing Dimension (PD) 0.866 Product Quality (PQ) 0.826 Consumer Buying Behaviour (CBB)
0.869
Source: Generated using SPSS output Version 20
4.4 Pearson Correlation Coefficient Analysis A correlation coefficient is a very useful way to summarize the relationship between two variables with a single number that falls between -1 and +1 (Welkowitz et al, (2006). In Morgan et al (2002) it is given thus: -1.0 (a perfect negative correlation), 0.0 (no correlation) and +1.0 (a perfect positive correlation). The Pearson correlation analysis obtained for the three-interval scaled variables is summarized in Table 4. The sample size (N) is 100 and the significant level is 5%.
Table 4: Pearson Correlation Coefficient
Variables Mean Std. Deviation PD PQ CBB
Pricing Dimension (PD)
3.4600 0.70686 1
Product Quality (PQ) 3.3750 0.67933 0.828** 1
Consumer Buying Behaviour (CBB)
3.3450 0.67306 0.823** 0.643** 1
** denote significant at 5%
Source: Generated using SPSS output Version 20
From the table, the correlation analysis indicates that there is a significant positive relationship between the pricing dimension and product quality (r = 0.828) at 5% level. A cursory look at table 4 revealed that the Pricing dimension is positively significant with the consumer buying behaviour (r = 0.823) at 5% level. Similarly, product quality had a significant moderately positive relationship with the consumer buying behaviour (r = 0.643) at 5% level.
Table 5: Model Summary
Model Beta T Sig
PD 0.923 9.031 0.000
PQ -0.120 -1.187 0.238
Ayuba
157
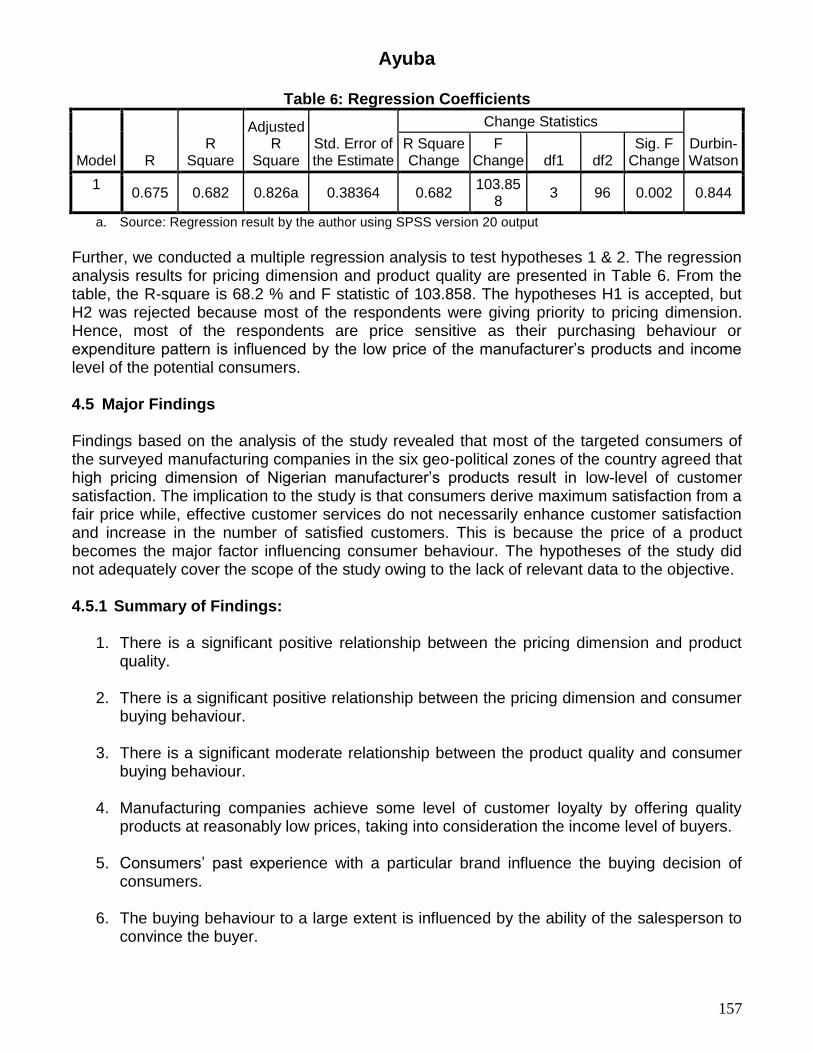
Table 6: Regression Coefficients
Model R R
Square
Adjusted R
Square Std. Error of the Estimate
Change Statistics
Durbin-Watson
R Square Change
F Change df1 df2
Sig. F Change
1 0.675 0.682 0.826a 0.38364 0.682
103.858
3 96 0.002 0.844
a. Source: Regression result by the author using SPSS version 20 output
Further, we conducted a multiple regression analysis to test hypotheses 1 & 2. The regression analysis results for pricing dimension and product quality are presented in Table 6. From the table, the R-square is 68.2 % and F statistic of 103.858. The hypotheses H1 is accepted, but H2 was rejected because most of the respondents were giving priority to pricing dimension. Hence, most of the respondents are price sensitive as their purchasing behaviour or expenditure pattern is influenced by the low price of the manufacturer‟s products and income level of the potential consumers. 4.5 Major Findings Findings based on the analysis of the study revealed that most of the targeted consumers of the surveyed manufacturing companies in the six geo-political zones of the country agreed that high pricing dimension of Nigerian manufacturer‟s products result in low-level of customer satisfaction. The implication to the study is that consumers derive maximum satisfaction from a fair price while, effective customer services do not necessarily enhance customer satisfaction and increase in the number of satisfied customers. This is because the price of a product becomes the major factor influencing consumer behaviour. The hypotheses of the study did not adequately cover the scope of the study owing to the lack of relevant data to the objective. 4.5.1 Summary of Findings:
1. There is a significant positive relationship between the pricing dimension and product quality.
2. There is a significant positive relationship between the pricing dimension and consumer buying behaviour.
3. There is a significant moderate relationship between the product quality and consumer buying behaviour.
4. Manufacturing companies achieve some level of customer loyalty by offering quality products at reasonably low prices, taking into consideration the income level of buyers.
5. Consumers‟ past experience with a particular brand influence the buying decision of consumers.
6. The buying behaviour to a large extent is influenced by the ability of the salesperson to convince the buyer.
Ayuba
158
7. Married consumers are more involved in product evaluations and adoption than those
that are single.
8. The buying behaviour of high income earners was more complex than those in the middle and lower classes.
9. Majority of the consumers are price sensitive who resist price increases and welcome price decreases.
5. Conclusion & Recommendations 5.1 Conclusion Even though there are several variables, this study identified three key variables namely; pricing dimension, product quality and consumer buying behavior as factors influencing consumer satisfaction of manufacturers‟ products in Nigeria. Based on the outcomes of all the constructs and the discussions above, the results revealed that, “most of the targeted consumers of the surveyed manufacturing companies in the six geo-political zones of the country, agreed that high pricing dimension of Nigerian manufacturers‟ products result in low-level of customer satisfaction”. This supports the research finding of Gustafsson, Johnson and Roos (2005); Ahuja, Gupta & Raman ( 2003); Ahmad, & Vays (2011) and Deng et al. (2009) who found that companies that concentrate on the improvement of product quality and charging of appropriate price would certainly satisfy their customers and would ultimately help the company retain its customers. The sample of the study is very limited to generalize the result as it focuses only on the Nigerian Manufacturing companies quoted on the Nigerian exchange as at December 2013 rather than all the marketing companies in Nigeria. Thus, the findings of the study are considered applicable to the Nigerian manufacturing sub-sector. 5.2 Recommendations As part of the above findings and conclusions, the following recommendations are made:
1. Manufacturing companies should embrace marketing concepts, by providing the much needed services and establishing good relationship with customers through effective and efficient customer services. This would result in brand loyalty and deeper market penetration that would help companies establish long term profitable relationships with their customers.
2. Manufacturers should apply an appropriate pricing strategy which will help in ensuring price fairness on the pricing dimensions of their products.
3. Aggressive promotional campaigns, particularly sales promotional activities should be conducted from time to time to keep loyal customers and attract new potential buyers.
Ayuba
159
4. For Effective satisfaction of consumers, manufacturing companies should be conducting some post-purchase activities to help handle consumer complaints or grievances quickly so as to provide the much needed satisfaction more effectively.
5. Manufacturers should guard against all forms of unethical marketing practices such as hoarding, diversion, unfair pricing, deceptive or misleading advertising, substandard products, black marketing etc.
6. Implications & Suggestions for Further Studies This research has some implications that might be of interest to manufacturers and future researchers, as it will help manufacturers in strategic marketing planning and it represents the seeds from which future researches can be developed. The findings may not automatically apply to all facets of companies, industries or sectors. Scholars are challenged to investigate other industries or sectors as a case point. In addition to the above, the following might be of interest to future researchers:
i. This same research can be carried out in other nations so that a broad comparison of the factors influencing consumer‟s satisfaction can be made.
ii. Research into other major factors affecting consumer satisfaction could be carried out to
further explain the differences in the company‟s adoption of strategic marketing activities.
iii. Finally, there have been few studies comparing similarities and differences of consumer
satisfaction among private corporations and state-owned corporations, or among local firms and multinational companies. We thus do not know which specific differences exist regarding consumer satisfaction in these various organizations. This clearly is another interesting avenue for future research.
References Ahmad, IB, Ahmad, NR & Ahmad, FM 2013, „An Empirical Study on Factors Affecting
Consumer Satisfaction‟, International Journal of Research In Commerce & Management, Vol. 4 No. 03.
Ahmad, T, & Vays, N 2011, „The Impulse Buying Behavior of Consumes For The FMCG Products In Jodhpur‟, Australian Journal of Basic and Applied Sciences, 5 (11): 1704-1710.
Ahuja, M, Gupta, B & Raman, P 2003, „An Empirical Investigation of Online Consumer Purchasing Behavior’, Communication of the ACM, 46 (12).
Akpan, B 2003, „Marketing Strategy’: The Basic Concept, Dada Press, Zaria. Anderson, EW, Fornell, C & Mazvancheryl, SK 2004, „Customer Satisfaction and Shareholder
Value‟, Journal of Marketing, Vol. 68, pg; 172–185. Anderson, Eugene, W & Vikas, Mittal 2000, „Strengthening the Satisfaction-Profit Chain,‟
Journal of Service Research, 3 (2), 107-120.
Ayuba
160
Arnold, MJ, Reynolds, KE, Ponder, N & Leung, JE 2005, „Customer delight in retail context: Investigating delightful and terrible shopping experiences‟, Journal of Business Research ,Vol.58, pp.1132-1145.
Borodo, B 2008, „Challenges of the Nigerian Manufacturers and the way forward’, Conference Paper, Manufacturers Association of Nigeria, Lagos, pp 15-19.
Bridson, K, Evan, J & Hickman, M 2008, „Assessing the relationship between loyalty program attributes, store satisfaction and store loyalty‟, Journal of retailing and consumer Service, Vol.15, pp 364-374.
Carpenter, J 2008, „Consumer shopping value, satisfaction, and loyalty in discount retailing‟, Journal of retailing and consumer services, Vol. 1, pp. 358-363.
Chauhan, V & Limbad, S 2013, „Measuring Customer Satisfaction of Mc Donald‟s Fast Food Resturant‟, International Journal of Management, IT and Engineering, Volume 3, No.8
Daily official Lists of the Nigerian Stock Exchange 2013, Live at www.nigerianstockexchange.com
Deng, Z, Lu, Y, Wei, KK & Zhang, J 2009, „Understanding customer satisfaction and loyalty: An empirical study of mobile instant messages in China‟, International Journal of Information Management, Vol. 30, pages 289–300
Dutta, A & Dutta, K 2009, „Customer expectations and perceptions across the Indian banking industry and the resultant financial implications‟. Journal of services research volume 9, number 1 (April-September 2009)
Eshghi, A, Haughton, D & Topi, H, 2007, „Determinants of customer loyalty in the wireless telecommunications industry’, Telecommunications policy, Volume 31, Issue 2, Pages 93-106.
Gustafsson, A, Johnson, MD & Roos, I 2005, „The Effects of Customer Satisfaction, Relationship Commitment Dimensions, and Triggers on Customer Retention‟, Journal of Marketing, Vol. 69, pg. 210–218.
Haque, A, Khatibi, A & Rahman, S 2009, „Factors Influencing Buying Behavior of Piracy Products and its Impact to Malaysian Market‟, International Review of Business Research Papers, 5(2), 383-401.
Hatcher, L 1994, „A Step-by-Step Approach to using the SAS System for Factor Analysis and Structural Equation Modelling’, SAS Institute Inc. Cary , NC.
Kotler, P 2000, „Marketing Management 10 (ed’), Prentice Hall, New Jersey: Kotler, P, Keller, K 2009 „Marketing Management 13th edition’, Published by Speirman
Education Inc., upper saddle River New Jersey, 07458 Meng Juan, Elliot Kevin M 2009, „Investigating Structural Relationships between Service
Quality, Switching Costs, and Customer Satisfaction‟, Journal of Applied Business and Economics, Minnesota, USA
Morgan, NA, Clark, BH & Gooner, R 2002, „Marketing productivity, marketing audits, and systems for marketing performance assessment: Integrating multiple perspectives‟. Journal of Business Research, 55(5): 363-375.
Morley, Roy 2004, „Customer based antecedents of satisfaction and dissatisfaction in business to business service‟, PHD dissertation, University of Western Ontario, Canada.
Singh, H 2006, „The Importance of Customer Satisfaction in relation to customer loyalty and retention‟, UCTI.WP-06-06, May 2006, Kuala Lumpur, Malaysia
Welkowitz, J, Cohen, BH, & Ewen, RB 2006, „Introductory Statistics for the Behavioural Sciences’. 6th ed. New Jersey: John Wiley and Sons, Inc.

Ayuba
161
Zeithaml, A 1988, „Consumer Perceptions of Price, Quality, and Value: A Means-End Model and Synthesis of Evidence‟, Journal of Marketing, 52(3), 2-22.