ASSESSMENT OF THE FACTORS INFLUENCING THE ADOPTION …
96
ASSESSMENT OF THE FACTORS INFLUENCING THE ADOPTION OF MOBILE MONEY SERVICES: A CASE OF MOROGORO REGION
Transcript of ASSESSMENT OF THE FACTORS INFLUENCING THE ADOPTION …
ASSESSMENT OF THE FACTORS INFLUENCING THE
ADOPTION OF MOBILE MONEY SERVICES:
A CASE OF MOROGORO REGION

ASSESSMENT OF THE FACTORS INFLUENCING THE
ADOPTION OF MOBILE MONEY SERVICES:
A CASE OF MOROGORO REGION
By
Magreth P Maganga
A Dissertation Submitted to the School of Business in Partial Fulfillment of the
Requirement for the Award of Master of Business Administration in Corporate
Management (MBA-CM) of Mzumbe University.
2019

i
CERTIFICATION
We, the undersigned, certify that we have read and hereby recommend for
acceptance by the Mzumbe University, a dissertation/thesis entitled Analysis of the
Factors Influencing the Adoption of Mobile Money Services: The Case of
Morogoro Region in partial/fulfillment of the requirements for award of the degree
of Master of Business Administration in Corporate Management
___________________________ ---------------------
Major Supervisor Date
___________________________ ---------------------
Internal Examiner Date
___________________________ -----------------------
External Examiner Date
Accepted for the Board of School of Business (SOB)
____________________________________________
DEAN - SCHOOL OF BUSINESS (SOB)

ii
DECLARATION
AND
COPYRIGHT
I, Magreth P Maganga, declare that this dissertation is my own original work and
that it has not been presented and will not be presented to any other University for a
similar or any other degree award.
Signature_________________________
Date_____________________________
©
This dissertation is a copyright material protected under the Berne Convention, the
copyright Act 1999 and other international and national enactments, in that behalf, on
Intellectual Property. It may not be reproduced by any means in full or in part, except
for short extract in fair dealings, for research or private study, critical scholarly review
or discourse with an acknowledgement, without the written permission of Mzumbe
University, on behalf of the author.

iii
ACKNOWLEDGEMENT
Special thanks to my Almighty God for empowering me during my study up to the
completion of this Master of Business Administration in Corporate Management
(MBA-CM).
This dissertation has been fruitful due to assistances of several people who helped me
in so many ways. I wish to direct my heartfelt indebtedness to all. I cannot mention all
by names, but I would like to express exceptional thanks to the following;
Dr. Hawa Tundui who has been my supervisor for her supervision and observation
that resulted to the accomplishment of my schoolwork as one of the requirements for
MBA. I really benefited a lot from her skilful supervision, challenges, ideas and
remarks.
However, I would like to thank Mzumbe University, particularly, the School of
Business (SOB), for accepting me to join the MBA-CM course. I wish to extend
special appreciations to my lecturers for their valuable programme materials during
course work which laid a strong base for my study.
Moreover, I thank my parents Mr & Mrs Maganga for encouraging me to join the
MBA programme at Mzumbe University. Furthermore, I thank my brothers
(Anthony& Edward) and sister (Agnes) for their support, prayers and encouragement
throughout. I also thank my friend Victoria Sangali for all her advice and all their
contribution and motivation towards completion of this dissertation. In short my many
people have been involved in one way or another to make this report complete,
however I cannot mention all of them.
Exceptional appreciations to my dearest husband Kevin Rugaimukamu for his
prayers, encouragement, moral and financial support in my studies.

iv
DEDICATION
I dedicate this work to my beloved Parents Mr & Mrs Maganga for investing much in
my education and showing me the importance of education. I also dedicate it to my
dearest husband Kevin Rugaimukamu for his spiritual, moral and financial support
throughout my studies.
v
ABBREVATIONS
MMS - Mobile Money Services
MNO - Mobile Network Operators
TAM - Technology Acceptance Model
PE - Perceived Usefulness.
PEU - Perceived Ease of Use
PC - Perceived cost
PT - Perceived Trust
PR - Perceived Risk
TPB - Theory of Planned Behavior

vi
ABSTRACT
The study investigated the factors influencing the adoption of mobile money services
in Morogoro, taking a case study of Morogoro Municipal and Morogoro district. The
study specifically assessed consumer attitudes and awareness with regards to
perceived ease of use, perceived usefulness, perceived trust, perceived cost and
perceived risk of mobile money services in the adoption of mobile money services.
Furthermore, the study examined the role of community-based factors such as
locality and social amenities and consumer specific factors such as age, gender,
occupation, education and income in the adoption of mobile money services. The
study employed a quantitative research approach whereby a questionnaire was used
for data collection. Data was collected from a sample size of 200 respondents. The
study used non probability sampling techniques, whereby purposive and convenience
sampling were used. The study employed multiple regression analysis techniques to
substantiate the factors influencing the adoption of mobile money services. The
results show that consumer attitudes with regards to perceived ease of use, perceived
usefulness and perceived trust had significant effect on the adoption of mobile
money services while perceived cost and perceived risk had no significant effect on
the adoption of mobile money services. Nevertheless, locality was the only
community-based factor that had a significant effect on the adoption of mobile
money services. The presence of social amenities had no significant effect on the
adoption of mobile money services. Furthermore, none of the consumer specific
factors had a significant effect on the adoption of mobile money services. The
research therefore proposes that the suppliers of mobile money services target
specific vicinities and improve the ease of use and trust in relation to their services,
also the service providers like Tigo, Vodacom, Airtel and Halotel should make sure
there is good allocation of agents in all places and put more emphasize on promotion
campaigns so as to make people aware about their services. The telecommunication
companies should put more emphasize on the usage of mobile money services
particularly in buying goods or services in remote areas and thus the service
providers should come up with special offers. Lastly the government should make
sure that the transactions charges are well managed by the responsible authorities.

vii
TABLE OF CONTENTS
CERTIFICATION ...................................................................................................... i
DECLARATION ........................................................................................................ ii
COPYRIGHT ............................................................................................................. ii
ACKNOWLEDGEMENT ........................................................................................ iii
DEDICATION ........................................................................................................... iv
ABBREVATIONS ...................................................................................................... v
ABSTRACT ............................................................................................................... vi
LIST OF TABLES .................................................................................................... xi
LIST OF FIGURES ................................................................................................. xii
CHAPTER ONE ......................................................................................................... 1
BACKGROUND OF THE STUDY .......................................................................... 1
1.0 Introduction ............................................................................................................ 1
1.1Background to the Study ......................................................................................... 1
1.2 Statement of the Problem ....................................................................................... 3
1.3 Objective of the study ............................................................................................ 4
1.3.1General Objective ................................................................................................. 4
1.3.2 Specific Objectives .............................................................................................. 4
1.4 Research Questions ................................................................................................ 4
1.5 Limitation of the Research ..................................................................................... 4
1.6 Scope of the study .................................................................................................. 5
1.7 Significance of the study ........................................................................................ 6
1.8 Organization of the research .................................................................................. 7
CHAPTER TWO ....................................................................................................... 9
LITERATURE REVIEW .......................................................................................... 9
2.0 Introduction ............................................................................................................ 9
2.1 Theoretical literature review .................................................................................. 9
2.1.1 The Concept of Mobile Money ........................................................................... 9
2.1.1.1 Tanzania mobile money providers. ................................................................ 10
2.1.1.2 Mobile money Interoperability ...................................................................... 10
viii
2.1.1.3 Tanzania mobile money perspective .............................................................. 11
2.1.1.4 Mobile financial services penetration in Tanzania ......................................... 11
2.1.1.5 Mobile financial service regulation in Tanzania ............................................ 12
2.1.1.6 Mobile Money Services Merits ...................................................................... 13
2.1.1.7 Factors influencing the adoption of mobile money services Reliability ........ 15
2.1.1.8 Barriers on the adoption of mobile money services ....................................... 18
2.1.2 Theories of mobile money adoption ................................................................. 20
2.1.2.1 Technology acceptance model ....................................................................... 21
2.1.2.2 Motivational Model ........................................................................................ 21
2.1.2.3 Theory of Planned Behavior .......................................................................... 22
2.1.2.4 Innovation Diffusion Theory .......................................................................... 22
2.1.2.5 Bandura’s Cognitive Theory .......................................................................... 23
2.2 Empirical literature review ................................................................................... 23
2.2.1 Early Studies on Mobile Money Service Adoption .......................................... 23
2.3 Research Gap ....................................................................................................... 26
2.4 Conceptual framework ......................................................................................... 26
CHAPTER THREE ................................................................................................. 30
RESEARCH METHODOLOGY ........................................................................... 30
3.1 Introduction .......................................................................................................... 30
3.2 Research design .................................................................................................... 30
3.3 Study Area ............................................................................................................ 30
3.4 Population of the study ......................................................................................... 31
3.5 Unit of analysis .................................................................................................... 32
3.6 Sample size and sampling Procedures ................................................................. 32
3.6.1 Sample size ........................................................................................................ 32
3.6.2 Sampling Techniques ........................................................................................ 32
3.7 Data collection ..................................................................................................... 33
3.7.1 Types of data ..................................................................................................... 33
3.7.2 Data collection methods .................................................................................... 33
3.8 Reliability and validity of the measurement instruments ..................................... 34
3.8.1 Reliability of the study ...................................................................................... 34
ix
3.8.2 Validity of the study .......................................................................................... 34
3.9 Data analysis methods .......................................................................................... 35
3.9.1 Ethical consideration. ........................................................................................ 37
CHAPTER FOUR .................................................................................................... 39
PRESENTATION OF RESULTS AND DISCUSSION OF FINDINGS ............ 39
4.0 Introduction .......................................................................................................... 39
4.1 Demographic data of the respondents. ................................................................. 39
4.1.1 Age of the respondent ....................................................................................... 39
4.1.2 Gender of respondent ........................................................................................ 40
4.1.3 Work of respondent. .......................................................................................... 41
4.1.4 Education level of respondent ........................................................................... 41
4.1.5 Tap water use of respondent ............................................................................. 42
4.1.6 Residential area of respondent. ......................................................................... 42
4.1.7 Income of the respondent. ................................................................................. 43
4.2 Adoption of mobile money by respondents. ........................................................ 43
4.3 Regression analysis .............................................................................................. 44
4.3.1Normality test ..................................................................................................... 45
4.3.2 Multicollinearity test result ............................................................................... 45
4.3.3 The Model fit ..................................................................................................... 46
4.4 Regression results ................................................................................................. 47
4.4.1 The effect of customers perceived usefulness on the adoption of mobile money
services. .......................................................................................................... 47
4.4.2 The effect of consumer’s perceived ease of use on the adoption of mobile
money services. .............................................................................................. 48
4.4.3 The effect of consumer’s perceived trust on the adoption of mobile money
services. .......................................................................................................... 49
4.4.4 The effect of consumer’s perceived cost on the adoption of mobile money
services. .......................................................................................................... 49
4.4.5 The effect of consumer’s perceived risk on the adoption of mobile money
services. .......................................................................................................... 50
x
4.4.6 The effect of consumer and community specific factors on the adoption of
mobile money services. .................................................................................. 50
4.5 Summary and conclusion of the chapter .............................................................. 52
CHAPTER FIVE ...................................................................................................... 53
SUMMARY, CONCLUSION AND POLICY IMPLICATIONS OF
THESTUDY .................................................................................................. 53
5.1 Introduction .......................................................................................................... 53
5.2 Summary .............................................................................................................. 53
5.2.1 Findings and Conclusion ................................................................................... 54
5.3 Policy/practical implications. ............................................................................... 54
5.5 Recommendations ................................................................................................ 55
5.6 Limitations of the study and Areas for further research. ..................................... 57
REFERENCES ......................................................................................................... 60
APPENDICES .......................................................................................................... 68

xi
LIST OF TABLES
Table 4.1: Age of Respondent .................................................................................... 40
Table 4.2: Gender of the Respondent ......................................................................... 40
Table 4.3: Work of respondent ................................................................................... 41
Table 4.4: Education level of respondent ................................................................... 42
Table 4.5: Tap water users ......................................................................................... 42
Table 4.6: Residential area of Respondent ................................................................. 43
Table 4.7: Income level of respondent ....................................................................... 43
Table 4.8: Adoption of mobile money services. ........................................................ 44
Table 4.9: Shapiro-Wilk W test for normal data ........................................................ 45
Table 4.10: Tolerance and Variance Inflation Factor (VIF) ...................................... 46
Table 4.11: The model summary ............................................................................... 47
Table 4.12: multiple regression results ...................................................................... 48

xii
LIST OF FIGURES
Figure 2.1 Conceptual Framework ............................................................................. 29
Figure 3.1. Morogoro Region map ............................................................................. 31

1
CHAPTER ONE
BACKGROUND OF THE STUDY
1.0 Introduction
The section introduces problem background, the statement of the problem, the
objectives of the research which are categorized into general objective and specific
objectives as well as research questions.
1.1Background to the Study
The result of emerging of a new technology, innovation and increased demand from
the customer, lead to the change in a business sector. The emergence of mobile
money services had led to new challenges and opportunities for the businesses and
individuals. Riquelme and Rios (2010) argued that as advancement of technology
goes up both financial institutions and consumers are taking advantages of
efficiencies it conveys along. For a business to remain competitive the innovation is
necessary, therefore among of the areas that have taken this advantage is mobile
money technology.
Mobile Money Services (MMS) can be described as a service that uses the mobile
phone to access financial services, according to Baptista &Hetmann (2010). Mobile
money is also a form of payment and banking services operated under financial
regulation and carried out via a mobile phone (Ho-Young, 2012). According to a
World Bank (2012) study defined mobile money services as mobile payment, mobile
money transfers or mobile wallet, frequently referred to as a joint banking and
telecommunications services operated and executed from mobile devices such as
mobile phones, credit cards or debit cards.
Mobile money services in Tanzania started in 2008 with the launch of Vodafone M-
Pesamarket drive that beset the rich, the unfortunate and the unbanked (Lema, 2014).
Zantel Tanzania launched Z-Pesa in the same year and upgraded its EzyPesa service
version in 2012.

2
Tigo, Airtel and then Halotel Tanzania followed. Currently, there are several mobile
money services available from telecommunications businesses that are Vodacom M-
Pesa, TigoPesa, Airtel cash, EzyPesa and Halopesa. This has made Tanzania's mobile
money services very competitively unique by having more than one service for
mobile money provider compared to other nations However, adoption of mobile
money services varies based on the level of technology they have from nation to
nation. Countries such as Kenya have had quicker implementation of mobile
financial services than other nations such as Tanzania (Keeler, 2012; Horne and
Nickerson, 2013). Despite attempts such as promotion campaigns and services
provided by service suppliers, mobile money has been adopted in a very low level.
(Castri and Gidvan, 2014). Several studies were conducted to demonstrate the
variables influencing mobile money services adoption. In Tanzania, Lema (2014)
performed a survey on the variables affecting adoption of mobile financial services.
The study hypothesized the following factors to affect mobile financial service
acceptance; perceived utility (PU), perceived user-friendliness (PEU), perceived ease
of use (PEU), Perceived cost (PC), Perceived trust (PT), Perceived risk (PR) and
Social influence. However, the thesis revealed that it initiated perceived usefulness,
perceived price, and Social influence to have a major effect on the implementation of
mobile financial services. Perceived user-friendliness, perceived cost, and perceived
confidence have been initiated to bring an unimportant impact towards
implementation of mobile financial services in unbanked regions.
On the other hand, other studies which have been done by different scholars have
shown that, apart from mobile money services, consumer-specific characteristics like
age, occupation, gender and education sometimes contribute largely in implementing
several service innovations which available on a particular country. For instance,
Gideon's (2015) research in Kenya.
Thesis was ready to identify the correlation between customer-related variables and
electronic banking selection in Kenya, a Kericho branch case of Standard Chartered
Bank. The research found that variables such as client information about the presence
3
of electronic banking affect the electronic banking, demographic factors, education
level, level of income; occupation and customer settlement have also a great
influence on the choice of electronic banking whereby people have different options
on choosing or adopting banking systems.
1.2 Statement of the Problem
The increase of mobile money services is noted for simple access of financial
services by the exercise of mobile phone technology. Many individuals choose
mobile money services as a way to make their day-to-day transactions easier,
Mbamba (2017). While the implementation of a mobile money payment system has
been slower for developed countries, the amount of implementation. The study on
variables affecting the use of new mobile technologies in low-income households in
Kenya, Nyambura et al. (2013) stated that population variables (gender, age, level of
schooling and marital status) have a greater impact on the implementation of new
technologies. However, Chemingui and Ben lallouna (2013) noted that many clients
are encouraged to use the facilities that match their requirements well. With the
virtual advantages given, the intention to use the service will also improve. Wessels
and Drennan (2010) discussed, however, that perceived usefulness, perceived danger,
price and compatibility influence the adoption of mobile money by consumers.
Although several studies have shown the factors influencing the implementation of
mobile money services, there are still considerations such as absence of knowledge
and bad technology that hold back mobile banking clients from accepting them,
Nyambura et al. (2013). One of the factors that holds back mobile money service
adoption is the absence of understanding of what these services can be used for, this
is according Pamela &Eliamani, (2015). Despite several research in Tanzania such as
Chale and Mbamba (2015) and Ally and Mbamba (2009), no current studies have
been conducted to identify or specifically examine customer-specific variables,
community-based variables and consumer attitudes and awareness variables that
affect mobile cash services adoption in Tanzania. This has developed a research gap
that this study aims to fill this gap by exploring attitudes and awareness variables that
4
affect the implementation of mobile money services in Tanzania linked to client,
community-based and consumer.
1.3 Objective of the study
1.3.1General Objective
The main objective of this study was to analyze the factors influencing the adoption
of mobile money services in Tanzania
1.3.2 Specific Objectives
i. Assess consumer attitudes on the adoption of mobile money services
ii. To examine the role of community based factors in the adoption of mobile
money services in Tanzania
iii. To analyze the role of customer specific factors in the adoption of mobile
money services
1.4 Research Questions
The study was carried out with a quest to achieving the set objectives by seeking
answers to the following questions;
i. Do consumer attitudes about mobile money services influence the adoption of
mobile money services in Tanzania?
ii. Do community based factors influence the adoption of mobile money
services in Tanzania?
iii. Do customer specific factors influence the adoption of mobile money services
in Tanzania?
1.5 Limitation of the Research
i. Delay from respondents. This is one of the challenges that have been faced
during data collection because the study used questionnaire whereby
respondents were provided with questionnaires to fill and thus most of them
5
kept them until when they were reminded for several times through text
messages and calls. Therefore, it was very difficult for a researcher as it
consumed a lot efforts and money.
ii. Fear from respondents. Some of the respondents especially from rural places
were not ready to provide information as they fear may be they accounts will
be hacked or something will happen to them after they have provide some
information and thus resulted to some of them to resist to fill the
questionnaires even after showing them letter of introduction from the
university and from the local government. Therefore, it makes some
difficulties as the researcher had to walk extra miles and to use a lot of
convincing power to change their perception.
1.6 Scope of the study
Geographically, the research work was done in the Morogoro region particularly on
urban whereby Morogoro Municipal was used, peri urban whereby Mlimani Ward
was used and rural places which involved Morogoro district particularly Kisaki and
Dutumi. Mobile network operators (MNO) collected plenty of information from
mobile money services clients. In context, a study focused specifically on three
objectives, such as evaluating client attitudes (perceived easy use, usefulness, cost
and trust concerning mobile money services, also examining the role of community-
based factors like locality and social amenities in mobile money services execution.
Tanzania’s mobile money services and the role of customer-specific variables such
as gender, age, education, occupation and income in mobile money services
implementation. The research was guided theoretically by five theories: Technology
acceptance model, Planned Behavior Theory, Social Cognitive Theory, Motivational
Model, and Innovation Diffusion. All these theories have been explained in literature
review.

6
1.7 Significance of the study
The section explains about fundamental contribution of using mobile money services
and they are categorized into four groups, whereby the first group is for theoretical
knowledge, the second group is for service providers or suppliers, the third group is
for policy makers and the last group is for academicians who can either be students
or instructors.
i. The research offers good knowledge of the motives and variables which
effect the adoption and implementation of mobile money services in
Tanzania as to which variables influences people to adopt or to use
mobile money services in their day to day transactions.
ii. The research is essential for suppliers of mobile money services which are
like Tigo, Vodacom, Airtel as well as Halotel as it has demonstrated the
rank on the usage of mobile money services developed up to now
(importance, difficulties and way forward). Therefore, through this study
it will help these supplies to come up with new ideas and campaigns.
iii. Policymakers will use the research to make decisions about mobile
money services. The research will be very helpful to police developers
like government institutions on the analysis of the trend of mobile and
come up with new decisions on how service providers of mobile money
should conduct their business according to Tanzanians laws and
regulations.
iv. Finally, this research is very essential for academics to undergo further
research on mobile money services so as to help people who don’t
understand about the usage, importance, risk and challenges of using
mobile money services because most of the Tanzanians are using mobile
money transactions without understanding their strengths and
weaknesses.
.

7
1.8 Organization of the research
The whole work contains the five chapters, where by every chapter is having some
subheadings which is very essential in completing this research work.
The first chapter is comprised with nine sub headings which are; introduction of the
chapter which explains what is explained in the whole chapter, then problem
background which elucidates the topic background from different perspectives,
thereafter statement of the problem which explains on the problem from the ideal
situation to the current situations, followed by the objectives of the study which
consist of general objective and specific objectives, then research questions which
were generated from the research objectives, then scope of the study which shows
the coverage of the study, then limitation of the study which explains the challenges
which have been faced by the researcher during the work and how it was handled,
significance of the study which explains the importance to the government agencies,
academicians, service providers and other people at large, also it contains the
delimitation of the research
The second chapter is Literature review which consist of several subsections which
include introduction part of the chapter which explains in brief what is contained in
the chapter, then theoretical review which consist of the concept of mobile money,
definition of mobile money which gives a good framework of the work and good
understanding of the whole topic, theories of mobile money which explains different
theories according to different scholars, empirical review literature review which
review related studies which have been done by other researchers, conceptual frame
work which explains the connection among variables on which they effect to one
another and last subsection is research gap which differentiate the this work from the
previous works.
Third chapter is Research methodology which explains about the methods used by
the study. It consists of introduction of the chapter which explains the chapter in
brief, followed by research design, population of the study, unit of analysis, sample

8
size and sampling procedure, data collection, reliability and validity and the last sub
part is data analysis method which explains about the method used by the study to
come up with the conclusion.
The forth chapter is Presentation of the results and discussion of the findings. The
chapter is divided into seven sections, where by section 4.1 presents the demographic
information of the respondents such as age, gender, occupation and education,
section 4.2 presents normality statistics analysis, section 4.3 presents
multicollinearity test results, section 4.4 presents multiple linear regression results of
factors influencing the adoption of the mobile money services and finally the
summary and conclusion of the chapter is presented in section 4.6.
The last chapter is summary, conclusion and policy implication of the study. This
chapter consists of the introduction of the chapter which explains what is contained
in the whole chapter, followed by summary, finding and conclusion, policy, practical
implications, recommendations and area for further studies.

9
CHAPTER TWO
LITERATURE REVIEW
2.0 Introduction
The section grants the review of literature on the adoption of mobile money services
in different contexts. It is subdivided in three categories, the first part presents the
definitions and a review of theories pertaining to adoption of new services, the
following fragment presents empirical literature review while the last part portrays
conceptual framework adopted for the study.
2.1 Theoretical literature review
2.1.1 The Concept of Mobile Money
Mobile money services (MMS) is a well-articulated concept in literature, it entails lot
of activities together with but not restricted tolong-distance transfers, micro-
payments and other casual air-time trading systems that use mobile technology to
unbanked economic services. Furthermore, Jenkins (2008) explains mobile money
services just as money which can be accessed and being used through a mobile
phone. On the other hand, Tiwari &Buse (2007), with the assistance of mobile
telecommunication systems, described mobile cash as the provision and accessibility
of banking and economic services. Tanzania is one of the world leaders in mobile
money transfer compared to other countries with 44% of adults having access to the
service and it has 16 million subscribers who use mobile money in their day to day
activities. Most of the adults are using mobile money for bills payment, making
transfer to friends, family or relatives and to conduct business transactions as we can
see in most places now there is policy of “lipakwa m pesa or tigopesa”.

10
2.1.1.1 Tanzania mobile money providers.
OnMarch 2018 Tanzania had six mobile money providers. These providers were
Vodacom with M-pesa which had 43 percent on market share, Tigo with Tigopesa
which had 36 percent on the market share, Airtel with Airtel money which had 17
percent market share, Halotel with Halopesa which had 3 percent on market share,
followed by Zantel with Ezypesa which owned 1 percent market share andlastly
TTCL which had 0.04 percent on market share.
Halotel became Tanzania's fifth mobile money supplier with Halopesa in 2016.
Mobile operators in Tanzania give additional mobile financial services and mobile
insurance in relation to mobile money.
Tigo introduced the first mobile insurance service in Tanzania, TigoBima, in 2012,
providing cover for life and hospitalization. Tigo clients were also the first to use a
global mobile money transfer service with immediate present conversion, both in
Tanzania and Rwanda.
2.1.1.2 Mobile money Interoperability
In September 2014, mobile money suppliers in Tanzania started interconnecting their
services with a bilateral agreement between Tigo and Airtel, formally introduced in
February 2015. Then Vodacom announced its link with Airtel and Tigo after joining
Zantel in December 2014 and February 2016. Tanzania was considered the first
country in the world to achieve full interoperability in 2016, which is the ability of
customers of different mobile services to cope directly with one another.
Through the collaboration of mobile money transfer services such as MoneyGram
and Western Union, international interoperability is also a reality in Tanzania.
B-Pesa was launched in Tanzania in 2013. B-Pesa is the first prepaid Tanzanian card
that allows clients to transact to any B-Pesa member bank or merchant B-PESA. B-
11
Pesa gives the client the flexibility to transfer cards and cards, dispense cases, deposit
money and pay bills.
BitPesa, converting electronic currency like Bitcoin is an internet platform in local
African currencies, which was extended to Tanzania in November 2015. Since that
moment, BitPesa has offered instant payments to and from seven separate mobile
money networks and over 60 banks in Nigeria, Kenya, Uganda and Tanzania.
2.1.1.3 Tanzania mobile money perspective
The GSMA demonstrates that mobile money providers will continue to improve
customer experience and improve network agent efficiency, attracting more
customers and encouraging greater use of mobile money services. Moreover, the
graduation from mobile money services to national interoperability that accelerates
transaction development in emerging markets, including Tanzania.
One of the primary problems to mobile cash development in Tanzania, however, is
taxation. A mobile money tax was first implemented in Tanzania in 2013 when a
0.15 percent excise duty on transfers exceeding TZS 30,000 was imposed. The tax
was substituted by the present m-money fee excise in 2014, which represents a
bigger share of the price of Smaller transfers. This tax is therefore regressive and
imposes a greater strain on poorer customers which, according to GSMA 2018, could
possibly reverse the profits produced in Tanzania from financial inclusion.
2.1.1.4 Mobile financial services penetration in Tanzania
Mobile financial service penetration in Tanzania has been supported by the high use
of mobile phone which has been an important feature in most of the developing
world. The authorized business models for mobile financial service provision in
Tanzania are the bank led model and the non-bankled model (Komba, 2013). Mobile
financial service market currently has four products which are offered by mobile
network operators (Non-Bank led model) which are Vodacom M-PESA, TigoPesa,
12
Airtel Money and Easy Pesa (Intermedia, 2013). The banking sector also has mobile
payment systems, such as NMB Bank PesaFasta, CRDB Bank PLC SIM Banking
Services, Akiba commercial bank, National bank of commerce, Tanzania postal
bank, Standard Chartered Bank and DCB bank. Other banks with mobile money
products include Exim bank, First National Bank, Eco Bank, Amana Bank and
Barclays Bank. According to Intermedia (2013) Financial Inclusion Tracker Survey
(FITS) conducted in Tanzania which involved 2980 household 63% of
householdpossess or have right to use to a mobile phone and 56 percent of household
have at least one active SIM card. The study also revealed that even in the
underprivileged household rural, unbanked and poor (living on less than $2 a day)
one half of them has handset and owns a SIM card. Agent network penetration has
reached134158 and they serve 40% of the population, mobile money subscribers or
accountsare 30.3 million, active users of mobile money are 9.9 million which percent
of the adults in Tanzania as at 13th September (Komba, 2013). This penetration
exceeds the financial institution access points and branches which serve only 12
percent of the population.
They provide a range of services from domestic and international cash transfers,
mobile payments (airtime ups, merchant payments, utility bill payments and salary
transfers), mobile banking (balance inquiry, withdrawals, deposit and loan services)
and limited saving facilities (Intermedia, 2013).
2.1.1.5 Mobile financial service regulation in Tanzania
Mobile financial services in Tanzania are regulated jointly by the Bank of Tanzania
and the Tanzania Communication Regulatory Authority (TCRA). The bank of
Tanzania is mandated to approve business model, and to ensure compliance with E
money issuance, protection of customer funds, Agent management, Audit and
licensing of mobile financial service providers (Komba, 2013). TCRA is responsible
for the regulation and oversight of the Mobile network operators (MNO) which fall
within its jurisdiction under its traditional role.

13
To safeguard customer money MNO are required to use a trust account at a bank and
abide by the BoT account TZS Billion Transaction volume management standards.
The partner bank uses house the trust account through which the MNO could issue
the electronic value and safely deposit the equivalence of the float (Castri and
Gidvan, 2014). The value must be backed by 100 percent liquidity to safeguard the
users’ money.
2.1.1.6 Mobile Money Services Merits
Mobile money services have the ability to extend services beyond the official
economic sector's reach. Mobile money can enhance the national payment system by
offering creative methods to satisfy the transaction requirements of ordinary people,
in addition to helping to organize domestic money transfers. This success calls for a
better comprehension of the requirements of people, present mobile money adoption
and use patterns along with associated motivations and perceptions (Drake, John,
Doreen &Muyingi, 2008, p. 9).
Williams and Torma (2007) provide further theoretical and anecdotal proof of mobile
financial services ' effect. They claim that banking access affects low-income
households in two ways. First, access to finance advantages are solely enhancing the
quality of people's life, such as saving time, decreasing the risk of crime, and
facilitating transactions. The second merit presents extra advantages resulting from
the records of economic tracking.
Financial records decrease information asymmetries, enabling for useful financial
instruments including debt funding (like mortgages) and long-term savings goods
(like pensions). Although the connection between mobile money and more advanced
economic products has yet to be systematically documented by scientists, anecdotally
there is an improvement in the quality of life resulting from the use of mobile money
services.
14
Heyer and Mas (2009) give a case of South African ranch specialists who recently
needed to go for quite a long time, spending impressive entireties, to buy broadcast
appointment, however would now be able to do as such "for short of what one rand
and kill all the movement time (p. 4)”. Versatile cash is valuable as a retail
installment stage since it has broad venture into enormous portions of the populace.
The portable cash operational outline keeps up that versatile cash has made business
open doors for enterprising clients to determine a beneficial wellspring of salary
(Jenkins, 2008).
Kleine (2010) recognizes client control as a key component of intelligent advances
(p. 8). It is likewise every now and again referenced as an advantage of versatile
exchange administrations (Aderonke and Ayo, 2009, p. 20). Client control is
characterized as the degree to which shoppers can decide the planning, substance,
and arrangement of an exchange. Pickens, Mark, David and Sarah (2009) feature that
individuals' view of authority over circumstances improve the probability of their
positive sentiments toward the experience (p. 12).
Moreover, client control persuades they can impact their objective fulfillment
procedure and along these lines increment their certainty about the result (Kleijen et
al., 2004, p. 15). Cash versatile administrations, by giving buyers constant, on-
request access to administrations, give benefits that will upgrade their apparent
worth.
One of the reasons mobile money has attracted significant attention is the expectation
that earlier excluded communities will be able to provide accessible financial
services. Financial inclusion literature highlights that "banking the unbanked" can
lead to better decision-making, more efficient markets, and other development goals
(Lyman, Pickens & Pretorius, 2008). Mobile phones have appeared throughout the
developing world as one of the most widespread techniques to replace traditional
brick-and-mortar infrastructure, such as bank branches.
15
Ivatury and Mas (2008) give extra proof about the early employments of cell phones
as monetary administration stages. Cost decrease, which can be passed on to the
client, is a noteworthy advantage. In the Philippines, a regular exchange through a
bank office costs the bank US$2.50; this would cost just US$0.50 on the off chance
that it was computerized by utilizing a cell phone. In Pakistan, Tameer Bank
evaluated that opening a bank office in a Karachi ghetto would cost multiple times
what a retail specialist would cost, and month to month working expenses would be
US$28,000, contrasted and US$300 for an operator.
Mobile banking has the ability to provide these services of greater quality. Mobile
networks are usually prevalent in developing nations, as opposed to traditional
branch banks, enabling low-income and rural population sections to access the
service and decrease transaction costs. Electronic transactions of informal financial
services are carried out in real time, are monitored and hence reliable.
2.1.1.7 Factors influencing the adoption of mobile money services Reliability
The e-payments must be accessible online 24 hours per day. That is the task
arrangement of e-installment ought not present disappointments whenever (Neuman
and Medvinsky, 1995). Unwavering quality alludes to the consistency of a measure.
A test is viewed as solid in the event that we get a similar outcome over and over.
For instance, on the off chance that a test is intended to quantify characteristic, (for
example, introspection), at that point each time the test is regulated to a subject, the
outcomes ought to be roughly the equivalent. Lamentably, it is difficult to ascertain
unwavering quality precisely, however it tends to be assessed in various ways
(Cherry, 2011). Therefore, if the mobile money system is reliable it influences people
to adopt mobile money services as people will be sure to get service throughout
unlike if the system is not reliable people will not adopt the system since they fear
not to get services every time they want the it as the system won’t be there due to
several reasons such as network problem. Also, if an error occur it fears them not to
get compensated on time
16
Latency (Clearing Time and Frequency)
Payments should be transferred at a constant rate even during peak load periods.
Customers and merchants should be ready to use e-payment procedures without
significant delays in approval and clearing (Schmidt & Muller 1997). In a network,
latency, which is synonymous with delay, is an expression of how long it takes to get
a data packet from one point to another. In some uses, latency is measured by
sending back a packet to the sender and latency is considered to be the round-trip
time (Rouse, 2006). The latency hypothesis seems to be that information should be
transferred immediately (without any delay) between one stage and another.
Costs
The adoption of e-payment schemes involves two types of expenses: fixed and
transaction costs. Installation of payment facilities such as card readers and payment
software refer to fixed costs. These transaction costs are incurred by merchants and
clients each time a company exchange takes place. Because many online transactions
require micropayment, low fixed and transaction costs are critical to e-payment
systems ' popularity (Chou, 2002). Thus, the low transaction cost results in the
impact of mobile money services as opposed to elevated transaction costs reduce the
impact on mobile money services adoption.
Trust
The perceived trust towards mobile money services can influence the adoption either
positively or negatively. If people trust the service provider, it is very easy for them
to adopt it and influence other people to adopt it but if there is no trust it is very
difficult for the people to adopt it and hence, they will discourage others not to adopt
the service.
Risk
The higher the risk the lower the adoption of mobile money services and the lower
the risk the higher the adoption of mobile services. That is if risk is perceived to be

17
low by the people it influences them to adopt the service since most people fear to
lose money unlike when the risk is perceived to be high it discourages other people
to adopt the service
Awareness
If people are familiar with the service on the usage and its advantage the adoption
will be very high unlike when people are not aware about the service, it becomes
very hard for the them since they don’t know the calculated risk and how it is
advantageous to them in the performance of their day-to-day operations or
transactions.
Locality.
This factor can influence the adoption of mobile money services where by it depends
on how individual resides, people from urban areas are more likely to adopt the
service since in urban there are a lot of promotions and also agents are everywhere
on streets for cash in and cash out unlike when people reside in rural area where they
don’t get enough promotions and exposure concerning the service it is hard for those
people to adopt it, also few agents and inadequate float in rural areas discourage
people to join the services.
Social amenities.
These includes social services such as access to tap water and electricity. The
presence of these services influence people to adopt mobile money services since it
makes easier for them to pay for their bills and the absence of these social services
does not influence people to adopt mobile money services since they don’t need to
make essential transactions like water bill payment or electricity payment.
18
2.1.1.8 Barriers on the adoption of mobile money services
Despite several efforts which have been done by the government in hand with service
providers on emphasizing people to adopt mobile money services there are still
factors hindering the adoption of mobile money services.
Insufficient understanding of the services
Most registered m-money consumers regard m-money mainly as a service to send or
receive money, regardless of the supplier. Registered consumers kept this perception
irrespective of whether they were from rural, urban or urban regions. Fifty-five
percent of non-users also believe that the service is only intended to send or receive
cash. One in five thinks m-money can be used in various respects, for example, to
save money or pay non-remittance bills.
Problems with mobile money agent
In the previous 12 months, 72% of all registered m-money customers have
encountered agent-related issues. All suppliers had the same top three issues: the
officer was absent, had no / did not have enough e-float, and had no / did not have
sufficient money.
Eighty-eight percent of users of Airtel Money, 84 percent of users of Vodacom M-
Pesa and 77 percent of users of TigoPesa had issues with agents. A formal complaint
was lodged by very few registered consumers, making it hard for suppliers to
monitor and resolve the issues.
Nine out of ten rural registered users reported problems related to agents. The
proportion of complaining urban consumers was also high: Vodacom M-Pesa 80%,
Airtel Money 81%, and TigoPesa 79%.
Technical issues
Most registered customers said it's simple to register and use m-money services.
However, one-quarter of all individual registered customers said they needed

19
assistance from other individuals when carrying out transactions with m-money.
Registered consumers use m-money officers most frequently to assist them with
transactions. Nine out of ten registered customers of Vodacom M-Pesa, Airtel Money
and TigoPesa said that signing up for and using m-money facilities was somewhat or
very simple.
Twenty-three percent of registered customers of Vodacom M-Pesa, fifteen percent of
registered users of Airtel Money, and 18 percent of registered users of TigoPesa said
they could not withdraw cash on at least one occasion. Regardless of the provider,
for the majority of users, the problem was solved within half a day; few had to wait
longer than a day.
Among the top purposes behind not having the option to pull back cash, three were
because of issues with operators which are related with specialist's framework down
whereby more often than not clients of portable cash experience this issue for quite a
while which dishearten them a great deal as you may find that they truly need to
trade out or to money out, inaccessibility of operators and insufficient buoy whereby
the majority of the specialists need more money for clients particularly when they
need clients need to trade out or out a ton of cash.
Lack of national ID
This is one of the factors that hinder the adoption of mobile services since the
simcard registration process requires a national identity card on the registration
process where most people do not have identity cards, so this also affects the
adoption process as people cannot be registered unless they have an ID card.
Language barrier
This is one of the challenges that people fail to communicate clearly, particularly in
rural areas where most people don't talk Swahili instead of speaking their vernaculars
and therefore acceptance becomes very small.

20
Cost
The transactions cost is very high, and hence it discourages people to adopt mobile
money services since people are very sensitive to cost. Therefore, any changes in the
transactions process discourage other people on the adoption of mobile money
services.
Lack of information
This is a very problem in the adoption of mobile services since information
concerning the services like new offers and transactions charges are not well
communicated to the customers and agents and hence it leads to wrong transactions
which results to discourage other people to adopt mobile money services. Also
sometimes when wrong transaction is done the responsible department does not
provide feedback to the concerned people.
Inadequate of agents especially in remote places
In rural areas there are very few agents with limited amount float and hence it
discourages much people in rural areas to adopt mobile money services since the
service is not convenience and reliable to them.
Lack of trust or Insecurity
This is another challenge which hinder the adoption of mobile money services where
by now days there is a lot bad conduct of these transactions where people are stilling
money from mobile money service subscribers by sending them wrong text messages
and give them wrong information in order to still from them. Therefore, this make
other people fear to join with these mobile money services from service providers.
2.1.2 Theories of mobile money adoption
Different theories were used in the earlier reading to observe the variables that
determine in various situations the implementation of mobile money services. The
research detects e-payment-related primary theoretical viewpoints. Acceptance of
21
technology model planned behavior theory, social cognitive theory, motivational
model, and innovation diffusion theory. Although most studies have looked into the
acceptance of mobile money services in accordance with the technology acceptance
model (Lema, 2014; Isaga, 2015), this study discusses this model along with other
models that have been used prominently in the study of technology adoption and thus
deduce detailed and comprehensive issues that define the acceptance of mobile
money services.
2.1.2.1 Technology acceptance model
An acceptance of new service or technology by TAM customers is determined by the
intention of the user to use the system, which is in turn determined by the system
views of the user (Davis, 1989). TAM further indicates that two convictions
perceived user-friendliness and perceived usefulness are crucial in explaining user-
intention variances. Where usefulness is considered the degree to which an
individual think that using a specific service will make his work easier and the
perceived ease of use is described as the degree to which an individual think that
using a specific scheme would be effortless (Davis, 1989). These two convictions of
conduct, perceived usefulness and perceived ease of use, then led to the intention of
individual conduct and real behavior. This model has been extended to include other
variable customer behavior affecting to be applicable in other areas concerning
technology application and the use of new services.
This model has been extended to include other variable which influences customer
behavior in order to be applicable in other field which involves technological
adoption and the use of new services.
2.1.2.2 Motivational Model
Motivation is a behavior which deals with the setting, according to Deci (1975), and
tends to motivate the need of a person to feel skilled. This intrinsic drive will
diminish if the individual does not enjoy the activities. Extrinsic motivation actions,
22
however, related extrinsic rewards, which subsequently correlated with the
fulfillment of the archiving objective set main drives. Likewise, when mobile money
services are adopted, induced motivation by promoting accessible mobile money
services can be useful in affecting mobile money services.
2.1.2.3 Theory of Planned Behavior
Planned behavior theory indicates that perceived behavioral control should become a
critical element of m-payment acceptance as subscribers do not have complete
control over their internet payment transactions. There are two elements of perceived
behavioral control, namely as "self-efficacy" and "facilitating circumstances"
(Mathison, 1991; Taylor & Todd, 1995).
Self-efficacy can be defined as self-confidence of an individual in his or her
behavioral capacity (Bandura, 1982); while facilitating circumstances that represent
the resources required to participate in conduct (Triandis, 1971). Planned behavior
theory captures the inner psychological factors through which countless external
factors studied in studies on Information Systems (IS) attain their impact on
customer acceptance and can provide a common frame of reference within which to
incorporate different lines of investigation (Jhao-Yin Li, 2008).
2.1.2.4 Innovation Diffusion Theory
Rogers (2003) says that it is possible to classify adopters of any fresh development or
concept into one of five classifications: innovators, early adopters, early majority,
late majority, and laggards. After evaluating a range of prior research on innovation
diffusion (Rogers, 1983, 2003) highlighting the primary factors affecting innovation
acceptance, five innovation characteristics are identified: Compatibility, Relative
advantage Observability, Complexity, and Trialability (see Rogers, 2003). The main
problem of diffusion research on innovation is how innovations are being adopted
and why innovations are being adopted at separate prices. "(Rogers, 1995) goes on to
23
state that innovation, time, communication and the social system are four main
elements of diffusion.
2.1.2.5 Bandura’s Cognitive Theory
Cognitive theory (1986) defines the connection between the behaviors of a person,
personal factors like cognitive abilities or attitudes, and the environment. Everyone
can be affected and influence each other. The theory of social cognition is a self-
confident perspective that allows individuals to exercise control over their ideas,
emotions and behavior, "What individuals think, believe, and feel affects their
conduct" (Bandura, 1986). As human life is not lived in isolation, in his perspective
of human behavior, "No man is an island," individuals are working together on
mutual convictions about their skills and common ambitions to enhance their lives.
Therefore, environment and social systems have a huge effect on human behavior.
2.2 Empirical literature review
The chapter assess previous research works on factors influencing mobile money
services execution in different circumstances. According to Zikmund et al (2010),
empirical literature review is a direct search for published work involving books and
newspapers. It is a complete survey of previous research-related investigations.
2.2.1 Early Studies on Mobile Money Service Adoption
Lema (2014) investigated factors affecting the execution of mobile financial services
for the unbanked population in Tanzania. The researcher used the model of
technology adoption as the basis for his research model Using a sample size of 206
participants and using regression analysis methods, the research discovered that
perceived usefulness, perceived price, and social influence had a major impact on the
implementation of mobile financial services. Nevertheless, the study found
insignificant difference in the adoption of mobile financial services between males
and females among the unbanked.
24
Isaga (2015) observed the determinants of mobile money services adoption in
revenue collection in Tanzania, specifically looking Confidence and safety, social
factors and financial factors affect technological factor. The research used 180
Temeke tax region participants and used a predictive step-by-step assessment. The
findings proposed that the application of mobile payment schemes is influenced by
non-repudiation, latency, price and safety declaration. In addition, hypotheses based
on reliability, customer base, ability to transform money, anonymity, privacy, and
transaction processes were negligibly dismissed the results specified that the study
supported the technological acceptance model
Mbamba (2017) evaluated the acceptance of mobile financial services in the light
technology acceptance model by clients in Tanzania. The research randomly chosen
two hundred participants from the Kinondoni district in Dar-es-salaam, made up of
both mobile money services customers and non-users, and employed regression
analysis methods. The study shown the adoption of mobile financial services is
positively linked to employee consciousness, perceived usefulness and perceived
profit, but is detrimental to cost impacts. Nevertheless, the research showed that
respondents ' population features (gender, age, and revenue level) were among the
variables that moderated mobile financial services acceptance.
Maitai and Omwenga (2016) investigated the factors affecting the mobile money
transfer strategy in Kenya's telecommunications industry. The study specifically
looked into the role of consumer behavior, resource availability, technology and user
attitudes in the Adoption of the telecommunications mobile money transfer policy in
Kenya. The study used a sample of 156 respondents randomly selected from the
target population. Using regression analysis methods, the research disclosed that
consumer behavior, availability of resources, and customer attitudes were important
considerations in Kenya's implementation of the mobile money transfer policy for
telecommunications.
25
Pako (2015) investigated the factors influencing mobile cash services in Botswana's
banking and financial sectors. This study examined factors affecting the execution of
mobile money services in the banking and financial industries of Botswana in the
light of the Technology Acceptance Model (TAM) and demographic variables
(individual age, income, level of education, bank account) from the literature on
mobile money service execution. The research used a closed-ended Likert-like
questionnaire that was administered from a targeted sample of 200 mobile banking
clients and non-users from four Gaborone-Botswana regions to a total of 190
respondents. In terms of population characteristics, stratified random sampling was
conducted to ensure diversity. Results assessment indicated that gross revenue and
ownership of bank accounts seemed irrelevant in determining the use of mobile
money services in Botswana. However, the age of individuals appeared significant in
determining whether or not an individual was using mobile money services, with
more young people preferring to use mobile money services than older people.
Aboelmaged and Gebba (2013) observed at the implementation of mobile financial
services, integrating TAM and the Planned Behavior Theory (TPB) variables in
Dubai. The research used a survey layout and was used to obtain information with a
sample size of 119 participants. The research used the model of regression as an
analytical unit. Planned behavior theory presumed that people were reasonable
decision-makers (Li, 2010). Three perceived constructs regulate the behavior,
perceived subjective norms, and attitude affect their decisions (Azjen 1991 in Li,
2010). Their mixed model has five constructs perceived to be user-friendly,
perceived usefulness, perceived control of conduct, perceived subjective standards,
and attitude. Aboelmaged and Gebba (2013) discovered that attitude; subjective
norm and perceived usefulness had a major effect on the implementation of mobile
banking while perceived user-friendliness and cognitive control had no important
effect on adoption.

26
The study conducted by Hamza and Shah (2014) implemented perceived
compatibility and social norms in Nigeria and discovered that social norms are
important in anticipating the implementation of mobile financial services along with
utility and user-friendliness. In anticipating the implementation of mobile payment,
perceived compatibility discovered not important.
Tobbin and Kuwornu (2011) looked at the adoption of mobile financial services in
Ghana. Their model investigated the effect of comparative advantage, ease of use,
usefulness, trialability, risk and confidence. Risk was the only non-significant factor,
but other variables influenced mobile financial services adoption.
2.3 Research Gap
Few studies concerning mobile money services being adopted in Tanzania (Lema,
2014; Isaga, 2015). Moreover, most studies that have been done by many scholars in
different contexts and regions in Tanzania, have only emphasized on the factors
deduced from the technological acceptance model alone and ignored other factors
which also have much influence on the adoption of mobile money services. The
study wants to follow Pako (2015) and extend its analysis beyond the technology
acceptance model and incorporate community-based factors such as locality and
social amenities like access to tap water and electricity and customer specific factor
such as social demographics characteristics (age, gender, occupation, income level
and education level. Furthermore, the study goes beyond the descriptive analysis and
establishes the relationship between variables using multiple regression analysis
techniques to analyze on how these factors influences the adoption of mobile money
services.
2.4 Conceptual framework
From the literature assessment and for the purpose of this research, the research
structure comprises of variables affecting the acceptance as autonomous variable of
mobile money services that are consumer attitude and consciousness, community-
27
based variables and customer-specific variables (age, gender, occupation, income
and education) and the implementation as dependent variable of mobile money
service.
In this study the independent variables involve consumer attitude and awareness
(risk, ease of use, trust, cost &usefulness), community-based factors (locality
whether a person resides in urban or rural and social amenities such as access of tap
water and electricity) and customer specific factors (gender, age, education,
occupation, and income). On the other hand, the dependent variable is adoption of
mobile money services. Therefore, changes made in independent variable resulted to
either positive or negative effect to the dependent variable.
The independent variables in the conceptual framework are divided into three
groups, the first is consumer attitude variables. In this study we check the influence
of consumer’s attitudes with regards to risk, ease of use, trust, cost and usefulness of
mobile money services. That is perceived risk, perceived ease of use, perceived trust,
perceived cost and perceived usefulness of mobile money services by the consumers.
Perceived risk is uncertainty about the outcome of using technology (Chitungo and
Munongo, 2013). Lee, (2009) describes perceived hazard as a potential loss resulting
from fraud or a hacker that threatens the safety of an online bank user. Fraud and
hacker intrusion can result in economic loss to clients and infringe consumer privacy
(Lee, 2009).Lee (2009) identified five perceived facets of risk that include financial
risk, risk of security or privacy, social risk, risk of time and risk of performance.
Cost is described as to what extent individual thinks it would cost cash to use mobile
banking (Munongo and Chitungo, 2013). Transactional costs may include service
charges, mobile network transmission fees (including SMS or data) and expenses for
mobile devices (Chitungo and Munongo 2013). According to Lule (2008), the cost
benefit pattern is crucial for both perceived utility and user-friendliness. Masinge,
(2010) presents low-income individuals with low buying power and sensitivity to
cost.

28
In addition, Micheni, Lule, and Muke (2013) claim that if clients perceive mobile
cash's acceptable cost, they will take it easier and then use it. To assess this building,
a five-point Likert scale that uses discrepancy, powerful disagreement, either
disagreement or disagreement, was used to examine the extent to which participants
agree or disagree with the implementation of mobile cash services.
Perceived utility is connected with technology-based efficiency (Aminet al 2007).
According to Davis (1989), perceived utility is the degree to which a person thinks it
would enhance the effectiveness of his or her job by using a particular system.
Several studies discovered that perceived usefulness had a major impact on the
adoption of mobile financial services (Aboelmaged and Gebba 2013; Chitungo and
Munongo, 2013; Davis, 1989; Li, 2010; Sayid, Echchabi, and Aziz, 2012). A five-
point Likert scale will be used to measure this construct. Dass and Pal, (2011) have
described confidence as a psychological expectation that a trusted portion will not act
opportunistically. Therefore, higher levels of confidence in a service provider will
result in a user's greater intention to participate in mobile cash transactions (Masinge,
2010). Therefore, the higher the perceived utility the higher the adoption of mobile
money services and the lower the perceived utility of the service leads to decrease in
the adoption of mobile money services.
Davis (1989) defined ease of use as the degree to which an individual believes that
using a particular system would be effortless. The impact of perceived ease of use on
a user's intention to adopt an innovation through perceived utility, either directly or
indirectly through perceived utility. Thus, the higher the perceived ease of use
influences the adoption of mobile money services which the lower the perceived ease
use of a certain innovation leads to decrease in the adoption on that new technology.
The second group of determinants are a community-based variable that is
Availability of social amenities like electricity and water supply and locality. The
implementation of mobile money services may have a beneficial effect as it
facilitates payment for such services as it need payment to be done through mobile
29
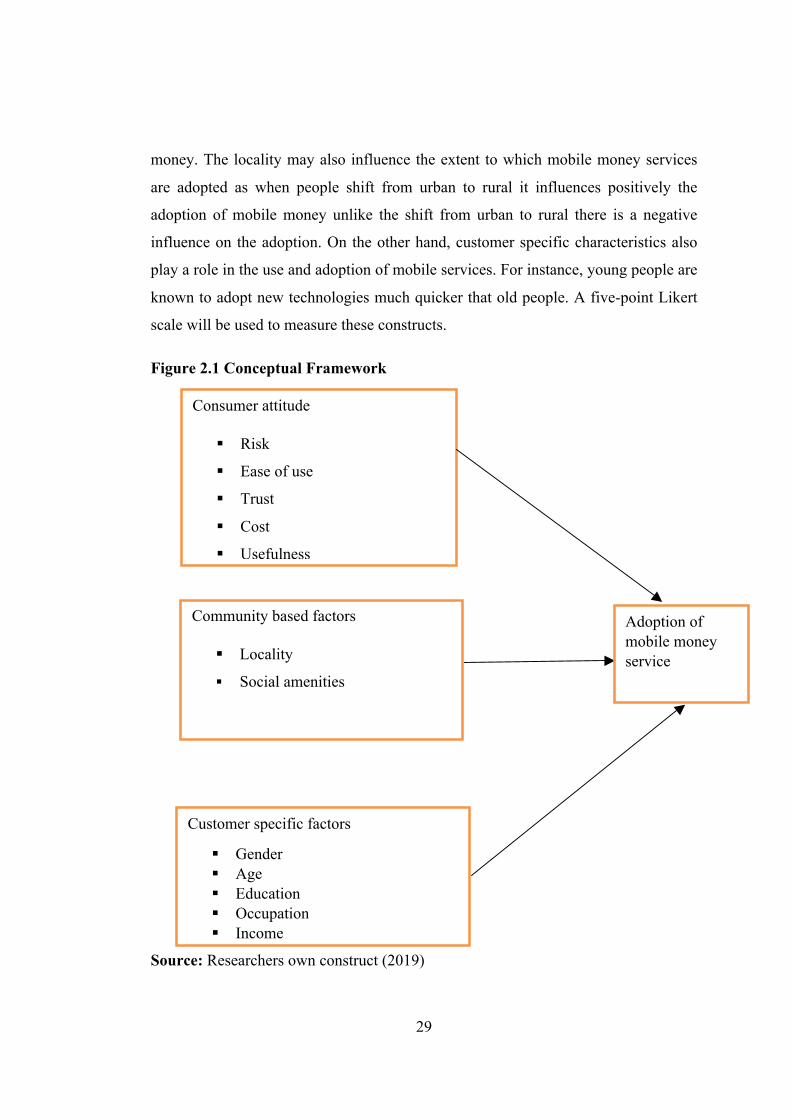
money. The locality may also influence the extent to which mobile money services
are adopted as when people shift from urban to rural it influences positively the
adoption of mobile money unlike the shift from urban to rural there is a negative
influence on the adoption. On the other hand, customer specific characteristics also
play a role in the use and adoption of mobile services. For instance, young people are
known to adopt new technologies much quicker that old people. A five-point Likert
scale will be used to measure these constructs.
Figure 2.1 Conceptual Framework
Source: Researchers own construct (2019)
Community based factors
§ Locality
§ Social amenities
Consumer attitude
§ Risk
§ Ease of use
§ Trust
§ Cost
§ Usefulness
Adoption of mobile money service
Customer specific factors
§ Gender § Age § Education § Occupation § Income
30
CHAPTER THREE
RESEARCH METHODOLOGY
3.1 Introduction
This chapter's primary aim is to demonstrate the research methods and approaches
used to response the study's research questions. The section introduces the techniques
of research design, region of study, population of study, sampling, unit of evaluation,
sample size and sampling processes for information collection, reliability and
validity tools, and processes for data analysis.
3.2 Research design
A research design constitutes the logical link between the data collected and the
research questions of the study; moreover, it defines the structure of the inquiry so as
to minimize the possibility of drawing incorrect inferences from the data. It portrays
in a clear and logical manner the tasks entailed in collecting the data needed and how
it has been used to test the key theories of the study (Dawson, 2007; Creswell, 2009;
Vaus, 2001). This study employed a quantitative research design that provides the
means for testing objectives through examining the relationship among variables.
The study used the afore mentioned design to obtain numerical measurements to
analyze the determinants of mobile money adoption in Tanzania.
3.3 Study Area
This study was carried in Morogoro Region particularly in Morogoro Municipal and
Morogoro district. The area was chosen because it has a well constituted sample that
fits well our research design and enables us to response our research questions
promptly. Also the area was chosen because Morogoro is having all the service
providers which include Vodacom, Tigo, Airtel, Zantel, Halotel and TTCL
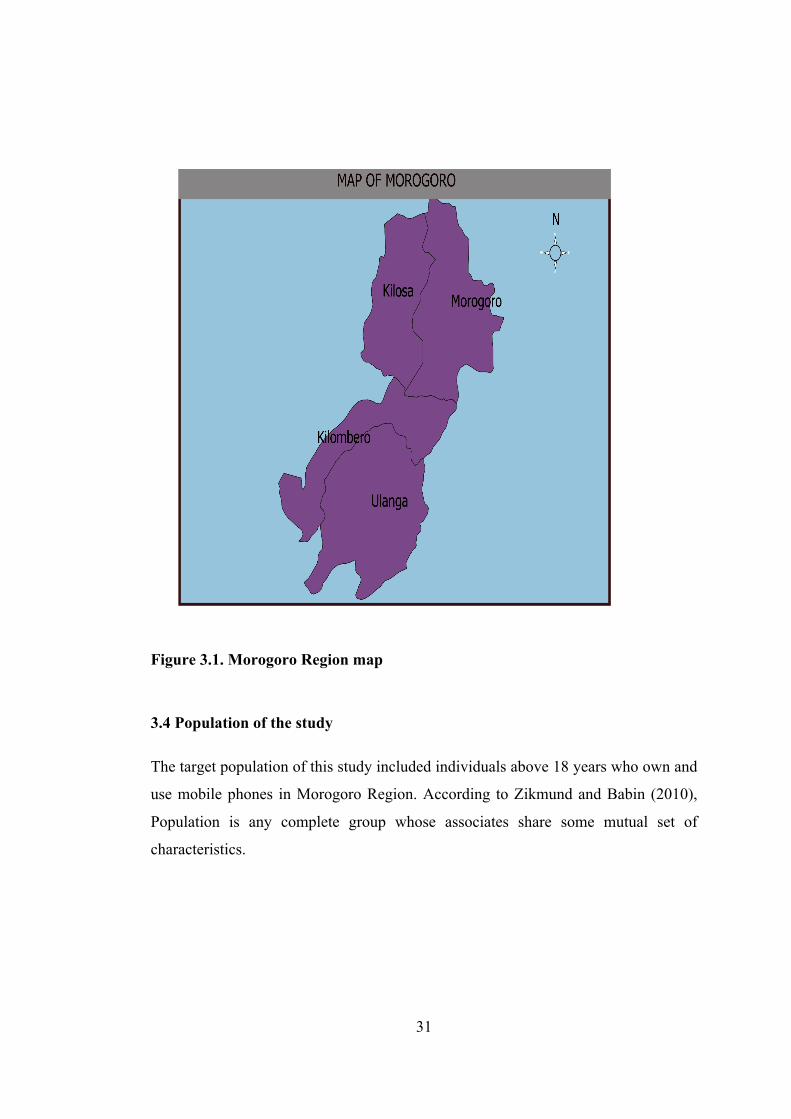
31
Figure 3.1. Morogoro Region map
3.4 Population of the study
The target population of this study included individuals above 18 years who own and
use mobile phones in Morogoro Region. According to Zikmund and Babin (2010),
Population is any complete group whose associates share some mutual set of
characteristics.
32
3.5 Unit of analysis
The unit of analysis for this research was users of mobile financial services. It
included users of mobile money services of all the telecommunication companies
providing mobile money services which include Vodacom Tanzania (M-PESA),
Tigo (Tigo-Pesa), Airtel Tanzania (Airtel Money), Zantel (Ezy-Pesa and Halotel
(Halopesa). The unit of analysis is the thing or a person about which we collect
information and from which we draw conclusion (Vaus, 2001).
3.6 Sample size and sampling Procedures
3.6.1 Sample size
The study used a sample of 200 respondents from Morogoro region. This sample size
was chosen due to financial constraints and time limitations of the study. Moreover,
as the study employed non-probability sampling techniques the sample size was thus
decided upon based on sample sizes used in other studies, resources, level of desired
precision, and time in cohesion to what was recommended by Zikmund and Babin
(2007). The study thus also follows the rule of thumb provided by Zikmund and
Babin (2007), for at least each sub sample to have a minimum of 100 respondents.
3.6.2 Sampling Techniques
In this study non-probability sampling technique was used to select respondents from
the population. According to Zikmund et al, (2010) using a non-probability
sampling, the sample is selected basing on the personal judgement or convenience
and the probability of any individual member of the population being selected is
indefinite.
Convenience and purposive or judgemental sampling was used to have respondents
who use mobile financial services. In convenience refers to the sampling procedure
of obtaining respondents or units that are most conveniently available (Bernard,
2006).
33
It was the appropriate method to obtain large number of completed questionnaire
quickly and economically. In purposive sampling, you choose the reason you want
informants (or communities) to serve, and you go out to find some (Bernard, 2006).
For both techniques, I used Halotel shop, Vodashop and Tigoshop as a meeting point
so as to get desired sample with the desired information.
3.7 Data collection
3.7.1 Types of data
The study only used primary data which was collected from the field. Primary data
are those collected fresh from the field (Lewin, 2005). According to Kothari, (2004)
primary data are those which are collected afresh and for the first time and they are
original in character.
3.7.2 Data collection methods
The research used questionnaires to gather surveys that were distributed in the
Morogoro Region to participants. Survey Questionnaire technique offers a
quantifiable or numerical description of a population's trends, attitudes, or thoughts
by examining a population sample (Creswell, 2009) According to Winter and
Dodou(2010), the study technique is commonly used by the Likert scale
questionnaire. The investigator used questionnaires face-to-face and self-
administered to collect information from the field. Respondents were provided with
self-administered questionnaires and they took the obligation of reading and
responding to the questions (Zikmund et al 2008).
In this research, self-administered paper questionnaires were distributed by the
investigator to Morogoro Region participants and subsequently gathered after filling.
Individuals who wanted more explanation and more data on some of the items in the
questionnaires were given face to face with respondents were given some
questionnaires. Bernard (2006) argues that a conversation style can generate valid,
34
coherent and accurate information when participants need to clarify uncertain and
hard ideas.
3.8 Reliability and validity of the measurement instruments
3.8.1 Reliability of the study
Joppe (2000) describes reliability as the degree to which findings are consistent over
time and the accuracy of the total population being studied. If, under the same
methodology, the results of a study can be repeated, the research instrument is
considered consistent. Reliability was assured in this research in an interview guide
with clear issues, direct and precise.
Reliable data was pre-required to answer study questions in order to guarantee
accuracy in trustworthiness study examination. Data collection methods have
enhanced the study's accuracy and determined whether information sets have been
gathered at separate moments (Patton, 2002).
3.8.2 Validity of the study
Validity determines whether the study measures what it was suggested to evaluate
correctly or how directly the findings of the study are. The research used
triangulation technique, which is the use of various data information sources, to
guarantee validity. Guion (2002) claims "Qualitative research validity informs you
whether your study results are true or certain." True "reflects the actual scenario
properly in the context of your results." Certain "in the sense that proof supports your
research, “Certain” means there are no good grounds for doubting the results.
Triangulation has been used to check and determine the validity of this study.
Content and face validity are based on instrument construction in quantitative
studies, while qualitative study depends on fluid flow and structure (Patton, 2002).

35
3.9 Data analysis methods
Multiple regression analysis methods were used in the research to support the
determinants of implementation of mobile money services in Tanzania. The research
sought to study and assess the following econometric model in consistency with the
theoretical models presented and extensions to such models;
Whereby,
Y= is the dependent variable of an individual’s adoption of mobile money services
measured by a five Likert scale which are disagree, strongly disagree, neither agree
nor disagree, agree and strongly agree to determine on much people agree or disagree
on the factors which influence the adoption of mobile money services.
X= is a vector of independent variables, constituted of Consumer attitudes and
awareness, Community based factors and customer specific factors. The variables
that were used in the three categories of independent variables are explained below;
Consumer attitude variable;
Risk perceived; perceived risk is the result of uncertainty in the use of technology
(Chitungo and Munongo, 2013). Lee, (2009) describes perceived hazard as a
potential loss resulting from fraud or a hacker that threatens the safety of an online
bank user. A 5-point Likert scale has been used to assess this building.
The research will adopt a sequence of Likert type products as adopted by Masinge
(2010) and Lee 2009 in order to assess the perceived danger structure.
Perceived usefulness; according to Davis (1989), perceived usefulness is to what
extent a individual thinks that using a specific scheme would enhance his or her job
performance to evaluate this construction, a five-point Likert scale will be used. The
research will adopt a sequence of Likert-type products as introduced by Masinge
(2010) and Jayasingh and Eze (2009) to assess the perceived utility structure.

36
Cost perceived; cost is defined as the extent to which a person believes that using
mobile money services would expense money (Chitungo and Munongo, 2013). The
fee may include transactional expenses in the form of service charges, charges for
mobile network transmission (including SMS or data) and expenses for mobile
devices (Chitungo and Munongo 2013).
A five-point Likert scale was used to assess this building. The study launched a
series of likert-type products to assess the perceived price structure as introduced by
Masinge (2010).
Perceived trust; Dass and Pal, (2011) described confidence as a psychological
expectation not to act opportunistically by a trusted portion. To evaluate this
construction, a five-point Likert scale was used. The research introduced a sequence
of Likert type items which are disagree, strongly disagree, neither agree nor disagree,
agree and strongly agree as adopted by Masinge (2010) to evaluate the perceived
confidence building. Perceived user-friendliness: Davis (1989) identified user-
friendliness as the degree to which an individual think effortlessly using a specific
scheme. To evaluate this construction, a five-point Likert scale was used. The
research introduced a sequence of Likert type products as introduced by Masinge
(2010) and Venkatesh and Davis (2000) to evaluate the perceived user-friendliness
construction.
Community based variables
Locality. It is a categorical variable whereby it explains a situation of if a person
lives in an urban, peri urban or rural area. This helped us to know if locality of
individuals determines the adoption of mobile money services, that is to say a person
in rural or urban can be influenced negatively or positively on the adoption of mobile
money services.
Social amenities; these are the presence of social services such as access to electricity
and water social services that can use mobile money facilities for billing.

37
Customer specific variables
Age; this variable is continuous, the respondent's age in years. So, in this variable the
age of respondents has been looked in terms of years. A question like “what is your
age”? Was asked in this variable so as to get or to know the exact age of respondents.
This variable is very important as it determines to what extent the age of respondents
can influence the adoption that is to say by how much percent youth or elders are
influenced to adopt mobile money services.
Gender; This is a categorical variable / dummy variable, which takes the value of 1 if
a person is female and 0 if a person is male. So, this variable helped to know number
of male and female in the whole population.
Income: This is a continuous variable, self-reported monthly income in Tanzanian
Shillings. This helped much to determine on how much each individual earn per
month and thus it becomes very easy to know if the higher income earners are
influenced to adopt mobile money services and on how low-income earners can be
influenced to adopt mobile money services
Education; This is a continuous variable, education level was determined in years
and grades; thus, respondents were hence education of respondents was known
according to the grades they have like primary, secondary and degree. This variable
is very important as it helps a researcher to know by how much level of education
influences the adoption of mobile services.
Occupation; life work of an individual is a nominal variable. It was determined by
looking on what respondents do to earn their living. Thus, it was looking on if a
person is student, employed, self-employed and if a person is retired.
3.9.1 Ethical consideration.
In conducting research there must be some ethical issues to be considered in
especially when people are involved in that research study. These comprise of
gaining the institutional authorization and obtaining guidance from different skilled
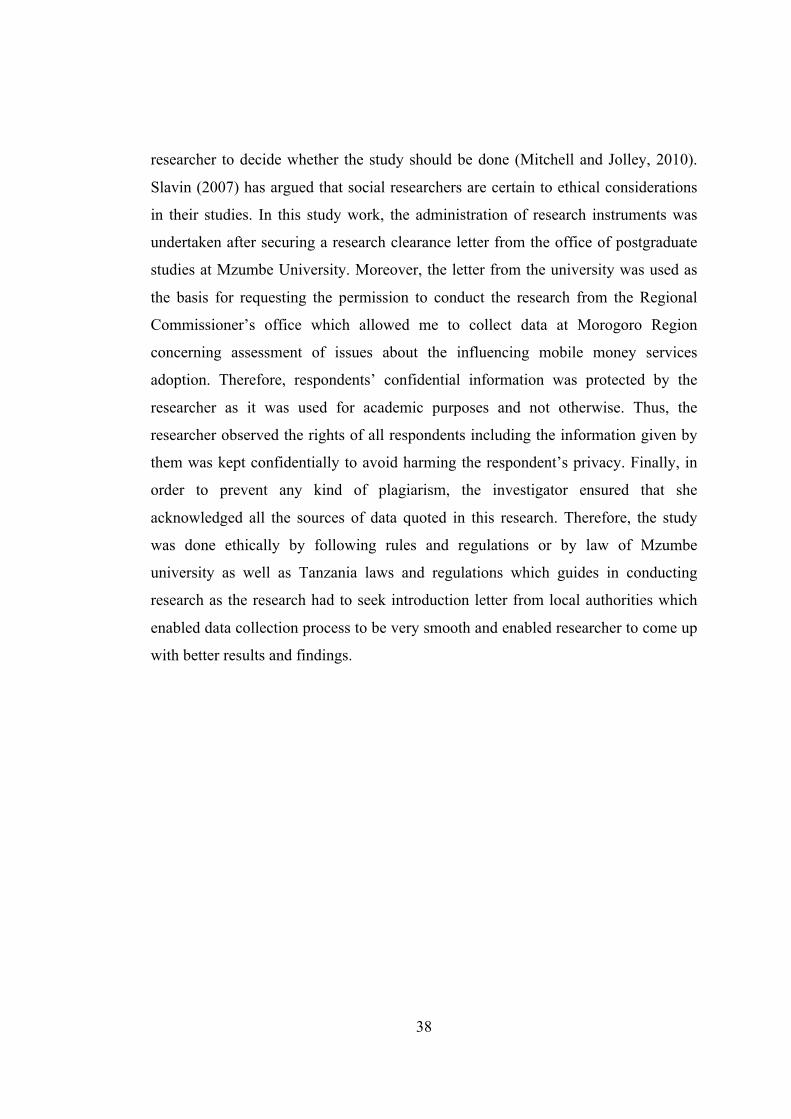
38
researcher to decide whether the study should be done (Mitchell and Jolley, 2010).
Slavin (2007) has argued that social researchers are certain to ethical considerations
in their studies. In this study work, the administration of research instruments was
undertaken after securing a research clearance letter from the office of postgraduate
studies at Mzumbe University. Moreover, the letter from the university was used as
the basis for requesting the permission to conduct the research from the Regional
Commissioner’s office which allowed me to collect data at Morogoro Region
concerning assessment of issues about the influencing mobile money services
adoption. Therefore, respondents’ confidential information was protected by the
researcher as it was used for academic purposes and not otherwise. Thus, the
researcher observed the rights of all respondents including the information given by
them was kept confidentially to avoid harming the respondent’s privacy. Finally, in
order to prevent any kind of plagiarism, the investigator ensured that she
acknowledged all the sources of data quoted in this research. Therefore, the study
was done ethically by following rules and regulations or by law of Mzumbe
university as well as Tanzania laws and regulations which guides in conducting
research as the research had to seek introduction letter from local authorities which
enabled data collection process to be very smooth and enabled researcher to come up
with better results and findings.

39
CHAPTER FOUR
PRESENTATION OF RESULTS AND DISCUSSION OF FINDINGS
4.0 Introduction
This chapter presents and discusses the empirical results of the study on the factors
influencing the adoption of the mobile money services. The chapter is divided into
five sections. Whereby, section 4.1 presents the descriptive statistics of selected
demographic and non-demographic variables, including age, gender, occupation,
income and education level and section 4.2 presents the descriptive statistics on the
adoption of mobile money services. Analogously, section 4.3 presents the pre-model
test results to assess the normality and co linearity assumptions and post model test
results to assess the model fit. Section 4.4 presents and discusses the results on the
factors influencing the adoption of the mobile money services and finally the
summary and conclusion of the chapter is presented in section 4.5.
4.1 Demographic data of the respondents.
This section presents the descriptive statistics of the demographic and non-
demographic characteristics of the respondents in terms of frequencies and
percentages. The section gives a picture of the distribution and categorization of the
respondents within the sample which may act as a guideline to policy
recommendation (Gujarati, 2004). The following subsections analogously present the
descriptive statistics of the selected characteristics of the respondents, which were
used as independent variables in our regression model presented in the sections
ahead.
4.1.1 Age of the respondent
This section presents the description of the age of the respondents used in our study.
Most of the respondents were aged between 21 and 30 years old, whereby this group
constituted of 40.5 percent of respondents as shown in table 4.1. On the other hand,
40
only 2.5 percent of the respondents were aged above 60 years. The study obtained
information over a whole a range of age groups, which enabled the researcher to
provide a snap shot of factors for adoption of mobile money services within a whole
range of age groups that is from the youth to the elderly. Moreover, as our sampling
was purposive, the fact that the largest chunk of our respondents were within the
economically active population ages, that is 21 to 50, gives a spectrum of age groups
that use mobile money services in the study area.
Table 4.1: Age of Respondent Age Of Respondent (Years) Frequency Percent 10-20 17 8.5 21-30 81 40.5 31-40 59 29.5 41-50 23 11.5 51-60 15 7.5 60+ 5 2.5 Total 200 100 Source: Field data (2019)
4.1.2 Gender of respondent
This section presents the description of the gender of the respondents that have been
used in our study. As shown in table 4.2, 52.5 percent of the sample, which
constituted of 105respondents, was male while 47.5 percent of the sample which
constituted of 95 respondents was female. Although the male respondents seem to be
a slight majority within the sample, the sample is more or less balanced in terms of
gender which indicates that there are no significant differences in the adoption of
mobile money services between the two genders.
Table 4.2: Gender of the Respondent Gender Frequency Percent Male 105 52.5 Female 95 47.5 Total 200 100 Source: Field data (2019)

41
4.1.3 Work of respondent.
This section presents the description of the type of work of respondents. Most of the
respondents in our sample were either employed or students. Whereby 47 and 30
percent of the respondents as shown in table 4.3 were employed and students
respectively. The retirees were least constituted in our sample, as only 3.5 percent of
the respondents were retired. The spread of the sample among the different work
categories indicates the adoption of mobile money services on non-occupational
basis but rather necessity. Whereas the employed and self-employed represent the
bread earners of most households, the students and retirees represent a section of
dependents within a typical Tanzanian household.
Table 4.3: Work of respondent Work of the Respondent Frequency Percent Student 60 30 Employed 94 47 Self-employed 39 19.5 Retired 7 3.5 Total 200 100 Source: Field data (2019)
4.1.4 Education level of respondent
This section presents the description of education levels of the respondents. As
shown in table 4.4, 95 respondents, that is 47.5 percent of the respondents had
achieved a University education while only 9 respondents, that is 4.5 percent of the
respondents had education levels other than primary, secondary or university
education. Although the data shows that the larger portion of the respondents had
advanced education levels in terms of secondary and university level education, the
fact that fifteen percent of the respondents that had adopted mobile money services
had primary level of education, none or any other level, could be an indication of the
ease of use of mobile money services by all consumers regardless of their education
levels.
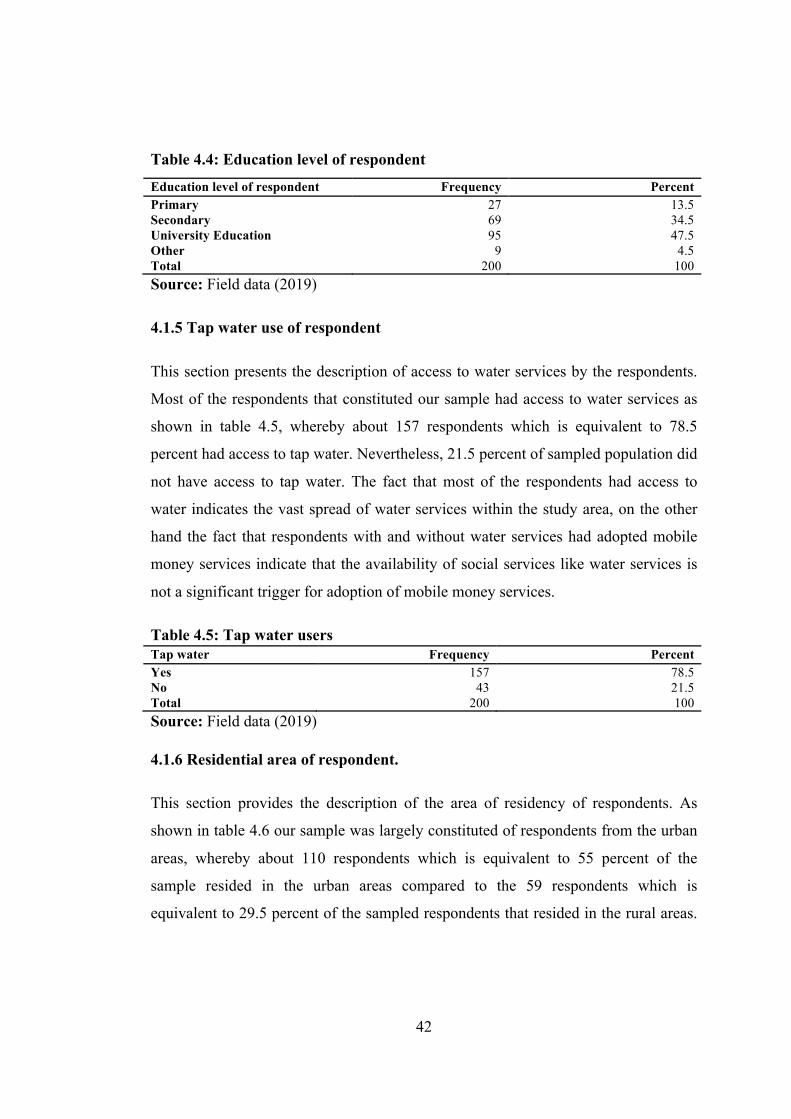
42
Table 4.4: Education level of respondent
Education level of respondent Frequency Percent Primary 27 13.5 Secondary 69 34.5 University Education 95 47.5 Other 9 4.5 Total 200 100 Source: Field data (2019)
4.1.5 Tap water use of respondent
This section presents the description of access to water services by the respondents.
Most of the respondents that constituted our sample had access to water services as
shown in table 4.5, whereby about 157 respondents which is equivalent to 78.5
percent had access to tap water. Nevertheless, 21.5 percent of sampled population did
not have access to tap water. The fact that most of the respondents had access to
water indicates the vast spread of water services within the study area, on the other
hand the fact that respondents with and without water services had adopted mobile
money services indicate that the availability of social services like water services is
not a significant trigger for adoption of mobile money services.
Table 4.5: Tap water users Tap water Frequency Percent Yes 157 78.5 No 43 21.5 Total 200 100 Source: Field data (2019)
4.1.6 Residential area of respondent.
This section provides the description of the area of residency of respondents. As
shown in table 4.6 our sample was largely constituted of respondents from the urban
areas, whereby about 110 respondents which is equivalent to 55 percent of the
sample resided in the urban areas compared to the 59 respondents which is
equivalent to 29.5 percent of the sampled respondents that resided in the rural areas.

43
This implies that most of users of mobile money services are found in the urban areas
as compared to rural areas.
Table 4.6: Residential area of Respondent Residential Area of Respondent Frequency Percent Rural 59 29.5 Peri-urban 31 15.5 Urban 110 55 Total 200 100 Source: Field data (2019)
4.1.7 Income of the respondent.
This section presents the description of the respondent’s income. The results in table
4.7 show that the majority of respondent had an income of less than 500, 000Tsh per
month, whereby about 164 out of the 200 sampled respondents equivalent to 82
percent of the sample had income of less than 500000 Tshs. On the other hand, only
3 percent of the sampled respondents had an income above 1000000 Tshs. This gives
a rough picture of the income of consumers that use mobile money services, the
results indicate that mobile money services are mostly used by consumers in the
lower and middle tier of monthly incomes.
Table 4.7: Income level of respondent
Income level of respondent (Tsh) Frequency Percent Less 500,000 164 82 500,001-1,000,000 30 15 More 1,000,000 6 3 Total 200 100 Source: Field data (2019)
4.2 Adoption of mobile money by respondents.
The adoption of mobile money service in our study are captured by five variables
which are paying bills through mobile money services, sending and receiving money
through mobile money services, saving money using mobile money services, buying
goods and services using mobile money services and buying air time through mobile
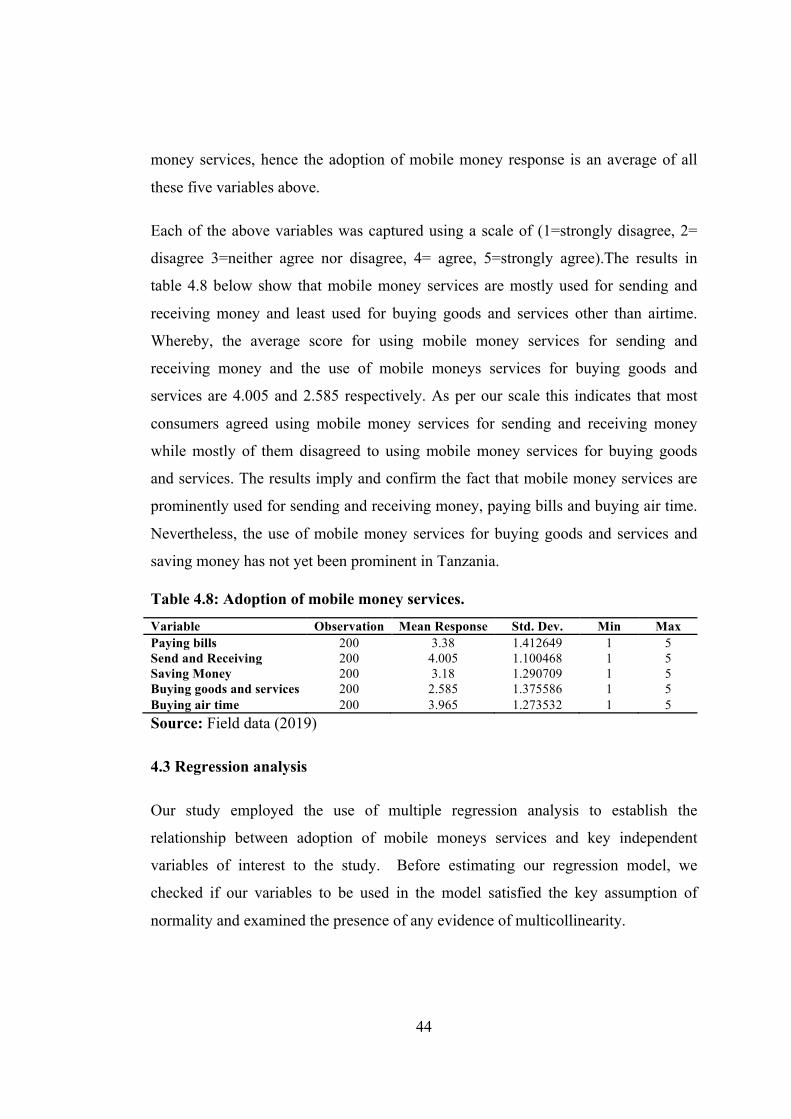
44
money services, hence the adoption of mobile money response is an average of all
these five variables above.
Each of the above variables was captured using a scale of (1=strongly disagree, 2=
disagree 3=neither agree nor disagree, 4= agree, 5=strongly agree).The results in
table 4.8 below show that mobile money services are mostly used for sending and
receiving money and least used for buying goods and services other than airtime.
Whereby, the average score for using mobile money services for sending and
receiving money and the use of mobile moneys services for buying goods and
services are 4.005 and 2.585 respectively. As per our scale this indicates that most
consumers agreed using mobile money services for sending and receiving money
while mostly of them disagreed to using mobile money services for buying goods
and services. The results imply and confirm the fact that mobile money services are
prominently used for sending and receiving money, paying bills and buying air time.
Nevertheless, the use of mobile money services for buying goods and services and
saving money has not yet been prominent in Tanzania.
Table 4.8: Adoption of mobile money services.
Variable Observation Mean Response Std. Dev. Min Max Paying bills 200 3.38 1.412649 1 5 Send and Receiving 200 4.005 1.100468 1 5 Saving Money 200 3.18 1.290709 1 5 Buying goods and services 200 2.585 1.375586 1 5 Buying air time 200 3.965 1.273532 1 5 Source: Field data (2019)
4.3 Regression analysis
Our study employed the use of multiple regression analysis to establish the
relationship between adoption of mobile moneys services and key independent
variables of interest to the study. Before estimating our regression model, we
checked if our variables to be used in the model satisfied the key assumption of
normality and examined the presence of any evidence of multicollinearity.
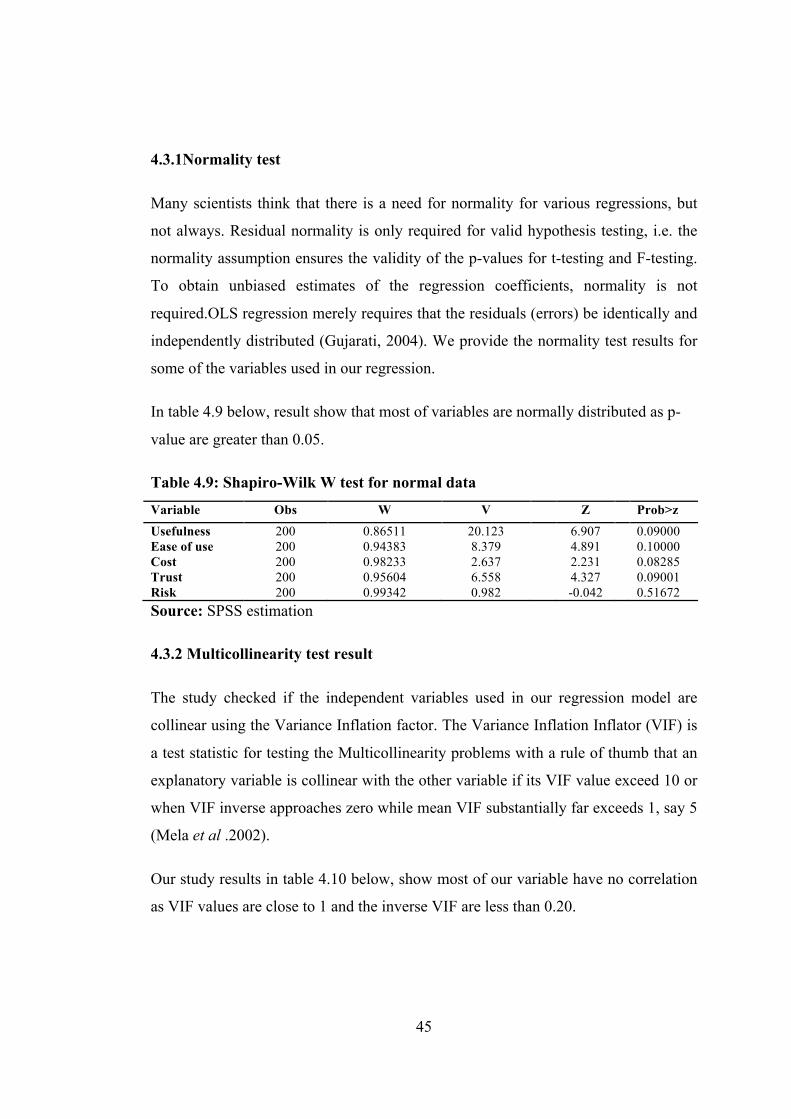
45
4.3.1Normality test
Many scientists think that there is a need for normality for various regressions, but
not always. Residual normality is only required for valid hypothesis testing, i.e. the
normality assumption ensures the validity of the p-values for t-testing and F-testing.
To obtain unbiased estimates of the regression coefficients, normality is not
required.OLS regression merely requires that the residuals (errors) be identically and
independently distributed (Gujarati, 2004). We provide the normality test results for
some of the variables used in our regression.
In table 4.9 below, result show that most of variables are normally distributed as p-
value are greater than 0.05.
Table 4.9: Shapiro-Wilk W test for normal data
Variable Obs W V Z Prob>z Usefulness 200 0.86511 20.123 6.907 0.09000 Ease of use 200 0.94383 8.379 4.891 0.10000 Cost 200 0.98233 2.637 2.231 0.08285 Trust 200 0.95604 6.558 4.327 0.09001 Risk 200 0.99342 0.982 -0.042 0.51672 Source: SPSS estimation
4.3.2 Multicollinearity test result
The study checked if the independent variables used in our regression model are
collinear using the Variance Inflation factor. The Variance Inflation Inflator (VIF) is
a test statistic for testing the Multicollinearity problems with a rule of thumb that an
explanatory variable is collinear with the other variable if its VIF value exceed 10 or
when VIF inverse approaches zero while mean VIF substantially far exceeds 1, say 5
(Mela et al .2002).
Our study results in table 4.10 below, show most of our variable have no correlation
as VIF values are close to 1 and the inverse VIF are less than 0.20.
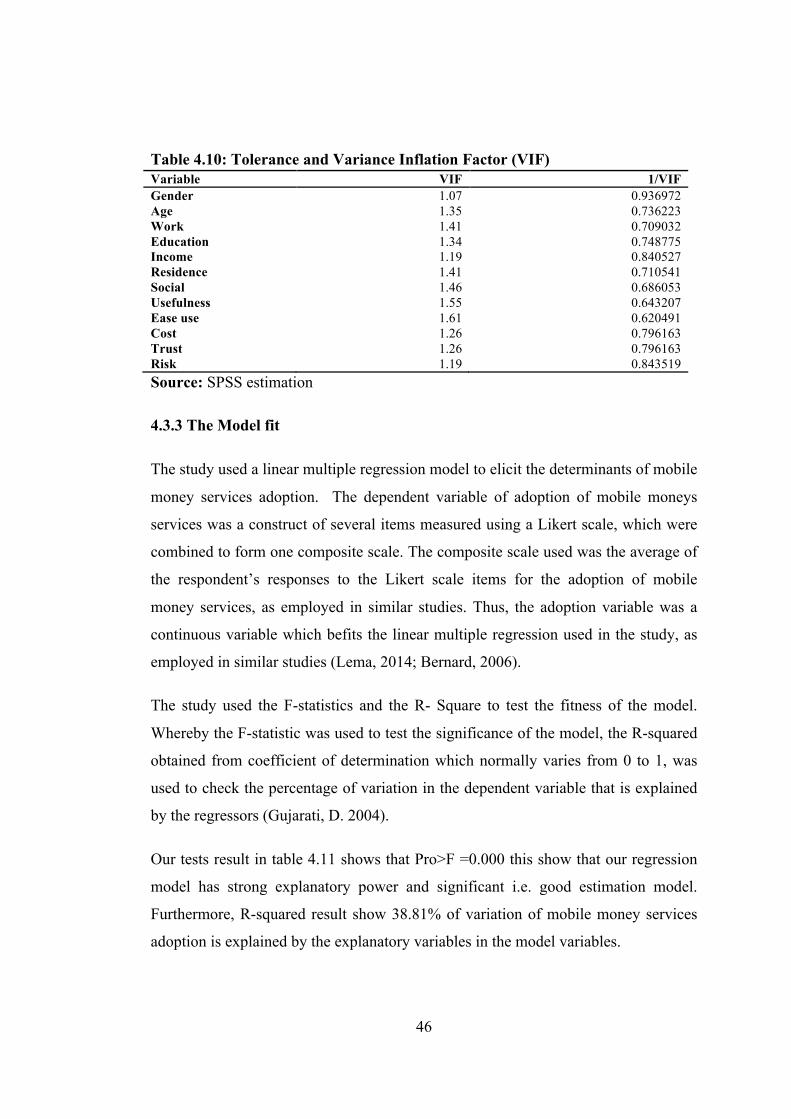
46
Table 4.10: Tolerance and Variance Inflation Factor (VIF) Variable VIF 1/VIF Gender 1.07 0.936972 Age 1.35 0.736223 Work 1.41 0.709032 Education 1.34 0.748775 Income 1.19 0.840527 Residence 1.41 0.710541 Social 1.46 0.686053 Usefulness 1.55 0.643207 Ease use 1.61 0.620491 Cost 1.26 0.796163 Trust 1.26 0.796163 Risk 1.19 0.843519 Source: SPSS estimation
4.3.3 The Model fit
The study used a linear multiple regression model to elicit the determinants of mobile
money services adoption. The dependent variable of adoption of mobile moneys
services was a construct of several items measured using a Likert scale, which were
combined to form one composite scale. The composite scale used was the average of
the respondent’s responses to the Likert scale items for the adoption of mobile
money services, as employed in similar studies. Thus, the adoption variable was a
continuous variable which befits the linear multiple regression used in the study, as
employed in similar studies (Lema, 2014; Bernard, 2006).
The study used the F-statistics and the R- Square to test the fitness of the model.
Whereby the F-statistic was used to test the significance of the model, the R-squared
obtained from coefficient of determination which normally varies from 0 to 1, was
used to check the percentage of variation in the dependent variable that is explained
by the regressors (Gujarati, D. 2004).
Our tests result in table 4.11 shows that Pro>F =0.000 this show that our regression
model has strong explanatory power and significant i.e. good estimation model.
Furthermore, R-squared result show 38.81% of variation of mobile money services
adoption is explained by the explanatory variables in the model variables.

47
This value is less than 50% normal but, according Heribert R, (1997) if the R-
squared value is low but you have statistically significant predictors, you can still
draw important conclusions about how changes in the predictor values are associated
with changes in the response value. Regardless of the R-squared, the significant
coefficients still represent the mean change in the response for one unit of change in
the predictor while holding other predictors in the model constant.
Table 4.11: The model summary
Furthermore, similar studies such as Lema (2017) in the area of mobile money
services adoption in the unbanked population, also obtained small R- square values,
where by only 42.18 percent of the variation in their dependent variable was
explained by the regressors, but their model were significant and had significant
determinant factors as our model.
4.4 Regression results
Table 12 presents the multiple regression results of model on determinants of mobile
money services adoption in Morogoro region. The results are interpreted in
subsections to show how individual consumer characteristics and their perceptions
about mobile money services influence the adoption of mobile money services
4.4.1 The effect of customers perceived usefulness on the adoption of mobile
money services.
The results in table 4.12 above show that p-value for usefulness of mobile money
service is 0.000 which is less than 0.05(5%significant level). The perceived
usefulness of mobile money services by consumers increases the consumer’s
likeliness to adopt mobile money services by 42 percent. This was substantiated by
Hamza and Shah (2014) in Nigeria, who also found similar results with regards to the
Number of Obs 200 F (12,185) 20.19 Prob > F 0.000 Adj R-squared 0.3839
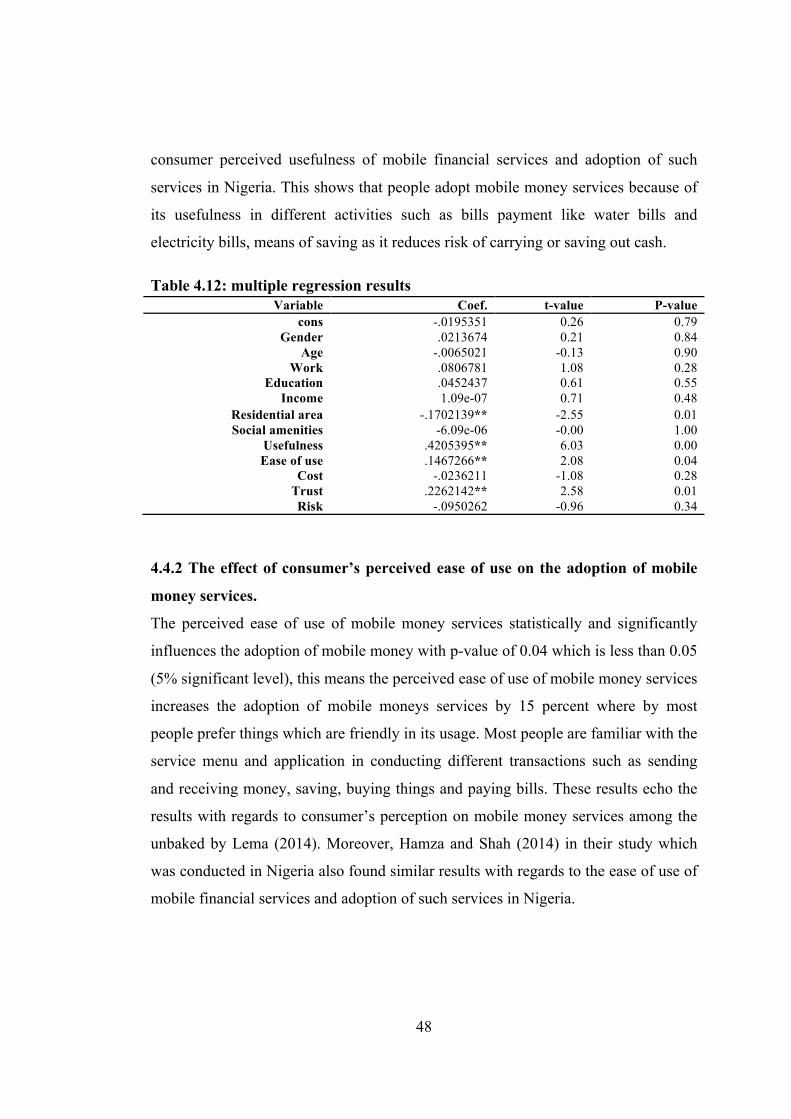
48
consumer perceived usefulness of mobile financial services and adoption of such
services in Nigeria. This shows that people adopt mobile money services because of
its usefulness in different activities such as bills payment like water bills and
electricity bills, means of saving as it reduces risk of carrying or saving out cash.
Table 4.12: multiple regression results Variable Coef. t-value P-value
cons -.0195351 0.26 0.79 Gender .0213674 0.21 0.84
Age -.0065021 -0.13 0.90 Work .0806781 1.08 0.28
Education .0452437 0.61 0.55 Income 1.09e-07 0.71 0.48
Residential area -.1702139** -2.55 0.01 Social amenities -6.09e-06 -0.00 1.00
Usefulness .4205395** 6.03 0.00 Ease of use .1467266** 2.08 0.04
Cost -.0236211 -1.08 0.28 Trust .2262142** 2.58 0.01 Risk -.0950262 -0.96 0.34
4.4.2 The effect of consumer’s perceived ease of use on the adoption of mobile
money services.
The perceived ease of use of mobile money services statistically and significantly
influences the adoption of mobile money with p-value of 0.04 which is less than 0.05
(5% significant level), this means the perceived ease of use of mobile money services
increases the adoption of mobile moneys services by 15 percent where by most
people prefer things which are friendly in its usage. Most people are familiar with the
service menu and application in conducting different transactions such as sending
and receiving money, saving, buying things and paying bills. These results echo the
results with regards to consumer’s perception on mobile money services among the
unbaked by Lema (2014). Moreover, Hamza and Shah (2014) in their study which
was conducted in Nigeria also found similar results with regards to the ease of use of
mobile financial services and adoption of such services in Nigeria.

49
4.4.3 The effect of consumer’s perceived trust on the adoption of mobile money
services.
Furthermore, the analysis show that consumer’s perceived trust also statistically
significantly influences the adoption of mobile money with p-value of 0.00 which is
less than 0.05 (5% significant level), this means the consumer’s perceived trust of
mobile money services increases their adoption of such services by 23 percent. These
results are similar to what Lema (2014) found in his study that looked at
determinants of adoption of mobile money services among the unbanked population.
Moreover, this was also substantiated further by Hamza and shah (2014) in their
study on adoption of mobile financial services in Nigeria. Therefore, this means that
the higher the perceived trust the higher the adoption of mobile money services
where by people tend to adopt things if at all its technology or conduct can be
trusted.
4.4.4 The effect of consumer’s perceived cost on the adoption of mobile money
services.
Nevertheless, the analysis show that consumer’s perceived cost was not statistically
significant, and thus had no significant influence on the adoption of mobile money
services with p-value of 0.28which is greater than 0.05 and 0.1. Nevertheless, it had
the expected sign as per theory, that is consumers perceived high cost of mobile
money services has a negative effect on the adoption of mobile moneys services in
Tanzania. Our results are similar to a few studies that did not find a significant effect
of consumer’s perceived costs on the adoption of mobile money services in Kenya
and some parts of Asia (Micheni et al, 2013; Jeong and Yoon, 2013). These results
are contrary to what Lema (2014) found in his study that looked at determinants of
adoption of mobile money services among the unbanked population. Whereby
consumer’s perceived costs were stipulated as a burden with regards to adoption of
mobile money services (Luarn and Lin, 2005; Galego and Laukannen, 2010). The
use of more controls in our regression model could be the reason that we don’t get a
50
significant effect of consumer’s perceived costs on the adoption of mobile money
services.
4.4.5 The effect of consumer’s perceived risk on the adoption of mobile money
services.
Similarly, the analysis show that consumer’s perceived risk was not statistically
significant, and thus had no significant influence on the adoption of mobile money
services with p-value of 0.35which is greater than the critical value of 0.05.
Nevertheless, it had the expected sign as per theory, that is consumers perceived high
risk of mobile money services has a negative effect on the adoption of mobile
moneys services in Tanzania. These results are supported by what Lema (2014)
found in his study that looked at determinants of adoption of mobile money services
among the unbanked population. Moreover, they are consistent with results obtained
in Ghana by Tobbin and Kowornu (2011) but contrary to what Marubwa and
Mutsikwa (2013) got in their study. The main difference in the model used in our
study and the other studies that obtained significant effect of perceived risk is the
number of controls used in the model, whereby, our model included controls for
consumer specific factors and community specific factors which could have led to
the difference in the outcomes in terms of significance.
4.4.6 The effect of consumer and community specific factors on the adoption of
mobile money services.
Our study also looked at the effect of consumer specific factors (age, income,
education, work and gender) and community specific factors (Presence of Social
amenities and Residential area) on the adoption of mobile money services beyond the
consumer’s perceptions about mobile money services.
The residential area was the only variable among the consumer and community
specific factors that had a statistically significant effect on the consumer’s adoption
of mobile money services. The residential area significantly influences the adoption
51
of mobile money with p-value of 0.01 which is less than 0.05 (5% significant level),
meaning respondents residing in rural areas were 17.02 percent less likely to adopt
mobile money service. This was the only community-based factor in the study that
significantly influences the adoption of mobile moneys services in Tanzania.
Therefore, the shift from rural to urban area influences the adoption of mobile money
services as urban areas give lee way to access of mobile moneys services from
different service providers. Moreover, people’s awareness about mobile money
services in urban areas is much higher due to targeted promotional campaigns done
by the service providers, presences of numerous agents with enough cash capital to
handle small to mega transactions. On the other hand, the situation is different in the
rural areas, with low presence of mobile money services agents, low cash flow and
low awareness of the importance and ease of use of mobile money services.
The other consumer specific variables (gender, age, work education and income) and
the community factor of presence of social amenities were found to have no
significant effect on the adoption of mobile money services by consumers. Therefore,
consumer specific factors like age or gender do not have significant influence on the
adoption of mobile money services any person can adopt depending on their needs.
Our results mirror some of the result in Lema (2014), thus pointing to the fact that
consumer’s specific factors do not significantly influence the adoption of mobile
money services. Males, however, tend to be more positive in evaluating mobile trade
than females (Yang, 2005:8). Some surveys show a masculine predominance among
mobile banking consumers (Flinders, 2008; Laforet and Xiaoyan, 2005; Laukkanen
and Pasanen, 2008). It’s possible that although these variables do not have a
significant effect as individual controls, they could have significant effects on the
adoption of mobile money services effects imbedded in sub samples according to the
different categories in the individual variables like age groups, the gender type and
income categories as was it was done in Abdinoor and Mbamba (2017).

52
4.5 Summary and conclusion of the chapter
This section provided the study's results and discussion. As we have seen most of the
outcomes of the study are in accordance to the theory. The regression results show
that variable such as usefulness, ease of use, and confidence have a beneficial impact
on adoption, while variable such as price and risk appear to be irrelevant when
mobile money services are adopted. There is also no impact on the adoption of
mobile money services by customer-specific variables such as age, gender,
occupation, education level and earnings.
53
CHAPTER FIVE
SUMMARY, CONCLUSION AND POLICY IMPLICATIONS OF
THESTUDY
5.1 Introduction
This chapter consists of four sections whereby section 5.2 provides the summary of
the study, section 5.3 findings and conclusion, section 5.4 policy implication and
recommendations and section 5.5 limitations of the study and endorsement for more
studies.
5.2 Summary
The main objective of this research was to assess factors influencing the adoption of
mobile money services in Morogoro. As substantiated in literature, the development
of the financial services plays a major role in economic development of any country.
The study used primary data collected in Morogoro region, 200 respondents were
interviewed, and the study used multiple regression model to estimate the results.
Although some studies observed that adoption of mobile moneys services is cost
sensitive (cost is statistically significant influencing the adoption of mobile money)
and affected by demographic characteristic, our study’s findings were contrary to
those findings as we did not find any statistically significant effect of costs and other
demographic variables used in our study on the adoption of mobile money services.
Nevertheless, our descriptive statistics revealed a gender difference in what the
mobile money services were used for, whereby on average male respondents used
mobile moneys services for buying goods and services; paying bill; sending and
receiving money; saving money and buying air time. Furthermore, urban resident
respondents, university level of education respondents, middle age respondents,
employed respondents and lower- and middle-income respondents were found to
have higher mobile money services adoption than others respectively.
54
5.2.1 Findings and Conclusion
The results showed that consumer attitudes (Usefulness, Ease of use and Trust) have
significant influence on the adoption of mobile money services while Cost and Risk
were insignificant. With a coefficient of about 0.419337 in absolute value, it
meant41. 9337% of adoption of mobile money services accounts from a 100%
change in usefulness. This is followed by Ease of use with about 14.7104% from
0.147104 coefficient value and Trust with about 22.5583% from 0.225583
coefficient value. Also, assessment of the priori signs shows that both variable i.e.
usefulness, Ease money and Trust have expected signs. So that any increase in value
of any independent significant variable favors the mobile money services adoption.
The significant variables had the expected signs as per the theory i.e. usefulness,
Ease money and Trust have expected signs. So that any increase in value of any
independent significant variable favors the mobile money services adoption.
The only community-based factor that had a significant influence on the adoption of
mobile money services was the residential area. With a coefficient of about -0.1702
value, it means unit change from urban to rural lead to 17.02% decrease in adoption
of mobile money services and vice versa. While factors like social amenities (tap
water and electricity) were statistically insignificant. Moreover, customer specific
factors like age, gender, work, education and income had a statistically insignificant
influence on the adoption of mobile money services.
5.3 Policy/practical implications.
Cellular phone ownership has increased across much of the developing world in
recent years, reaching over 75% of the population in sub-Saharan Africa and South
Asia (WDI). A report from Tanzania Communications Regulatory Authority (TCRA)
shows that users of mobile money in Tanzania exceed 41 million in June 2018. This
raises the potential for mobile money to be a key tool to broaden and deepen
financial access.
55
However, as from our results variables like trust were found to have significant effect
on the adoption of mobile money service due to several challenges facing the sector,
like security distress over the use of money through mobile to mobile, transactions.
This is because the platform is relatively new and there was no pre-existing security
policy, security models and security framework. This may allow the cypher
criminals, fraudsters and attackers who have fresh eyes on this new platform to
invade and disrupt the smoothness flow of the mobile money transactions.
Despite these difficulties, and contrary to the dreary results seen under previous
micro-financing programs, mobile money is unquestionably having positive impacts
on economic outcomes, particularly for women. The study findings on the economic
impacts of mobile money reveals it as a route out of poverty for women whereby
almost 49 women agreed on the usage of mobile money services for saving
compared with male whereby about 47 generally agree (appendix 3 table 11).
5.5 Recommendations
The following are policy recommendations for mobile money services. Firstly, for
tap water user, from the results it shows that most of respondent with tap water
general agree to pay water bills through mobile money services (appendix 3, table
26), hence the government should make sure transaction charges are controlled by
responsible authority to make transaction sustainable. Also, the government should
put much efforts on the supply of tap water especially in rural areas so as to increase
usage and to influence people to adopt mobile money services
Secondly in rural area, as the results shows that most people generally disagree on
use of mobile money on paying goods and services (Appendix 3, table27). Hence the
study recommends Telecommunication Company to establish price discrimination
policy in mobile money services charges between rural and urban to favor rural area
to increase the use of mobile money in rural areas.

56
Also, the service providers should reallocate more agents and put more emphasis on
promotion campaigns so as to make people aware about the services. Furthermore,
Telecommunication companies should invite business partners in which they will
prefer online payments which in turn will facilitate the adoption of mobile money
services.
Thirdly, for households who are well connected with national electricity grid, the
results show that majority of respondents agree to pay bills through mobile money
service (appendix 3, table 28) but the same population generally disagree on the use
mobile money in buying goods and services. Hence Telecommunication Companies
should establish market policy strategies to make sure that those who pay electrical
bills should also use mobile money services to buying goods and services. This can
be done through different marketing strategies like product differentiation and much
emphasis on promotion campaigns so as to make subscribers aware on the
importance of using mobile money services in both buying goods and services and in
paying electricity bills.
Fourthly, the study recommends that the telecommunication firms should emphasize
and enhance that the Mobile Money transfer is managed well. They should also
ensure that they engage the consumer’s views whenever making changes in the
systems so that there will be smooth operations of the activities.
Fifthly, the study recommends that a more scientific way of measuring, describing
and evaluating the level of their customer perception and satisfaction for the services
they deliver should be developed. Customer attitude are considering as important as
one may switch other competitor’s networks.
Also, customers should also be supplied with procedural training to allow them to
carry out transactions without the need for help. As well as providing user assistance
through online customer service centers as well as customer service points in a
provider's physical office, user support is very essential.
57
Most clients of mobile money providers complained that there was no customer
assistance to make some of them change to other service providers.
Lastly, the results show that most of the high-income earners general strongly agree
to use mobile money services, while low income earner general disagree on the use
mobile money services in buying goods and services (appendix 3, table 29). Hence
there should be more emphasize on use of mobile money services to buy goods and
services to low income earner so as to balance the adoption between the high-income
earners and low income earners. This can also be done through different promotions
to the areas with low adoption of mobile money in buying goods and services by
putting special offer to those who will use mobile money for the purpose of buying
goods and services by either giving them either bundle or vouchers as offers.
5.6 Limitations of the study and Areas for further research.
This study has attempted to analyze factors influencing adoption of mobile money
services at Morogoro region with the specific objectives which were; Assess
consumer attitudes in the adoption of mobile money services, to examine the role of
community based factors in the adoption of mobile money services in Tanzania and
to analyze the role of customer specific factors in the adoption of mobile money
services. To accomplish the goal primary data and multiple regression model was
used. This study conducted only in Morogoro particularly in Morogoro Municipal
and Morogoro district and ignores other regions across the country. Therefore, the
study recommends that in the future a similar study should be conducted across all
regions of Tanzania main land and Zanzibar in order to come up with the new
insights and to generalize the findings of the study.
Secondly area of research interest would be to substantiate social factors that impact
on mobile money services. Such researches have been done in different areas of
Africa but not Tanzania. Thus, more studies concerning mobile money services
should be done to different parts of Tanzania.
58
The third area would be to establish the relationship between mobile money services
and monetary policy. This would help to know how monetary policy would have
impact on mobile money services. Monetary policy is like discount rate, reserve
requirements, open market operations, and interest on reserves and thus it will
facilitate the transactions easily.
Telecommunications businesses have developed the mobile cash product as they see
it as one of their customers ' primary services. The challenge facing clients is who the
best service provider is. The research demonstrates several variables in choosing the
best mobile money service provider that clients consider. The most prevalent factor
used in the choice of service providers by most clients is the availability of agents
followed by ease of use along with accessibility of networks.
This research proposes that these institutions should adopt mobile money transfer
technologies as they are going to be quicker, easier and more convenient. The
research also recommends that strategic organizational choices concentrate on
critical areas of customer service activities and provide a reasonable basis, valid and
deliverable customer value that are aimed at achieving customer satisfaction and
loyalty, building long term mutually beneficial relationship with profitable
customers.
Future research may focus on defining more variables that predict, moderate, and
mediate. In addition, questionnaires should be organized to avoid participants from
being biased by attempting to conjecture the intentions of the scientists. The words
on the Likert scale in each structure must be distinct in order to prevent confusion.
Future studies can generate samples from different areas of Tanzania, especially rural
areas, as well as users from different social classes on this study. In this study, this
will further validate the customized and used measurement scales and may also
improve the suggested model.

59
Once all these variables are held in place, the use of mobile cash goods will be
simple for clients. All suppliers of mobile money services should ensure that they are
aware of their products by investing much on promotion activities concerning the
services they offer especially in rural areas, make sure that their products create
value in the sense people should perceive it as of important and essential in their day
to day activities and have usability features.
Finally, the research also proposes that further research on the adequacy of portable
cash benefits as a substitution for installment between governments elements ought
to be completed later on. This will be important in judging whether public
institutions can adopt this mode of payment for goods and services since it is
appropriate and quicker for them to carry out different transactions like payment of
different bills like water bills, electricity bills and other bills like those of TRA which
can be done through Tigopesa, Halopesa, Airtel money and M Pesa.
60
REFERENCES
Andjelkovic, M. (2010). The future is mobile. SAIS Review, 30(2), 121– 133.
Aboelmaged, M. G., &Gebba, T. R. (2013). Mobile Banking Adoption: An
Examination of Technology Acceptance Model and Theory of Planned
Behavior. International Journal of Business Research and Development,
3550.
Acharya, S. &Kshetri, N., (2012). Mobile Payments in Emerging Markets. IT Pro,
(July/August 2012), pp.9–13
Ajzen, I. (1991). The theory of planned behavior. Organizational Behavior and
Human Decision Processes, 50(2), 179-211.
doi:10.1016/07495978(91)90020-T
Akinci, S., Aksoy, S and Atilgan, E. (2004). Adoption of Internet banking
Ally, N. S., &Mbamba, U. O. L. (2009). The effect of ICT on service quality
perception and customer satisfaction: The case of ICT-enabled services in
selected banks. The African Journal of Finance and Management,28(2), 78–
92.
AL-Majali, M, & Mat, N. K. (2011). Modeling the antecedents of internet banking
service adoption (IBSA) in Jordan: A Structural Equation Modeling (SEM)
approach. Journal of Internet Banking and Commerce, 1-16.
Andjelkovic, M. (2010). The future is mobile. SAIS Review, 30(2), 121– 133
Ardic, P.O., Heimann, M. &Mylenko, N. 2011. Access to financial services and the
financial inclusion around the world: A cross-country analysis with a new
data set. World bank.
Au, Y.A. & Kauffman, R. 2008. The economics of mobile payments: Understanding
issues for an emerging financial technology application, electronic commerce
research and applications, (7)141-164.
61
Baumgartner, T. A., Strong, C. H., & Hensley, L. D. (2006). Conducting and reading
research in health and human performance. New York: McGraw-Hill.
Bångens, D. L., & Söderberg, B. (2008). Mobile Baking- Financial Service for the
Unbanked. Stockholm: The Swedish Program for ICT in Developing
Regions, SPIDER
Bhatti, T. (2007). Exploring Factors Influencing the Adoption of Mobile Commerce.
Journal of Internet Banking and Commerce, 113
Chale, P., &Mbamba, U. O. L. (2015). The role of mobile money services on growth
of small and medium enterprises in Tanzania: Evidence from Kinondoni
District in Dar es Salaam Region. Business Management Review,17(1), 81–
96.
Chemingui, H., & Ben lallouna, H. (2013). Resistance, motivations, trust and
intention to use mobile financial services. International Journal of Bank
Marketing,31(7), 574–592.
Chitungo, S. K., &Munongo, S. (2013). Extending the Technology Acceptance
Model to Mobile Banking Adoption in Rural Zimbabwe. Journal of Business
Administration and Education, 3 (1), 51-79
Cooper, DR. & Schindler, P.S. 2011. Business research methods. I ed. New York:
McGraw-Hill.
Carlson, C. (2001). Mobile commerce: core issues, products and services. Panel at
the Bled Electronic Commerce Conference, Bled, Slovenia.
Chou, Y, Lee, C., & Chung, J. (2004). Understanding M-commerce payment systems
through the analytic hierarchy process. Journal of Business Research, 57,
2004, 1423–1430.
62
Clemons, E. K. &Croson, D. C. (1997). “Reengineering money: The Mondex stored
value card and beyond.” International Journal of Electronic Commerce1 (2):
5-31.
Dass, R., & Pal, S. (2011). Exploring The Factors Affecting the Adoption of Mobile
Financial Services Among the Rural Under-Banked. Ahmedabad: Indian
Institute of Management Ahmedabad.
Donner, J. 2007a, May 23. M-Banking and m-payments services in the developing
world: complements or substitutes for trust and social capital? Paper
presented at the preconference on mobile communication at the 57th annual
conference of the international communication association in San Francisco,
USA. Retrieved August 24, 2012, from http://www. jonathandonner .com/
donner _mbanking_soccap. pdf
Davis, F. D. (1989). Perceived Usefulness, Perceived Ease of Use, and User
Acceptance of Information Technology. Management Information Systems
Research Center, 13 (3), 319-340.
Davis, F.D. & Venkatesh, V. 1996. A critical assessment of potential measurement
biases in the technology acceptance model: Three experiments. International
journal of human computer studies, 45:19-45.
Davidson, N. & Leishman, P. 2009. Building, incentivizing and managing a network
of mobile money agents: a handbook for network operators. Mobile money
for the unbanked. GSMA. Retrieved 17 July 2013 from
http//:www.gsma.com/mobilefordevelopment/wpcontentuploads/20 11/02/
Agent-networks-full. pd
Dayandandan, R. (2009). Fundamentals of Marketing Research. Mekelle: J.V.
Publishing House
63
Donner, J. & Tellez, C.A., (2008). Mobile banking and economic development:
linking adoption, impact, and use. Asian Journal of Communication, 18(4),
pp.318–332.
Drake P.M., John, K., Doreen, T. &Muyingi H.N. 2008. A model for electronic
money transfer for low reserved environment. Retrieved July, 2011 from
http://www.ieeexplore.ieee.org/ xpl/freeabs_all.jsp? arnumber=4696138
Duncombe, R. & Boateng, R., (2009). Mobile Phones and Financial Services in
Developing Countries: a review of concepts, methods, issues, evidence and
future research directions. Third World Quarterly, 30(7), pp. 1237– 1258.
F. D. Davis, (1989). Perceived usefulness and perceived ease of use and user
acceptance of information technology, MIS Quarterly, pp319-340.
Jenkins, B. 2008, 15 May. Developing mobile money ecosystems. Paper presented in
the first mobile money summit in Cairo, Egypt. Retrieved 20 May, 2008,
fromhttp://www.hks.harvard.edu/mrcbg/CSRI/publications/report_30_MOBI
LEMONEY.pdf
Fishbein, M., and Ajzen, I. (1975). Belief, Attitude, Intention and Behavior: An
introduction of Theory and Research. Reading, MA, USA: Addison-Wesley.
Hamza, A., & Shah, A. (2014). Gender and Mobile Payment System Adoption
among Students of Tertiary Institutions in Nigeria. International Journal of
Computer and Information Technology, Volume 03 (Issue 01), 13-20.
Intermedia. (2013). Mobile money: A path to financial inclusion. Dar es Salaam:
Internedia, Author.
Ivatry, G. 2006. Mobile phone banking and low-income customers: evidence from
South Africa. 9:35.
Jenkins, B. “Developing Mobile Money Ecosystems.” Washington, DC: IFC and the
Harvard Kennedy School. 2008.

64
Keeler, R. (2012, October). Financial Deepening and M4P: Lessons from Kenya and
Rwanda. Development in Practice: Impact Paper 9. (J. Garrido-Mirapeix,
&A. Kanene, Eds.) Nairobi, Kenya: KPMG and International Development
Assistance Services (IDAS).
Kim, K. & Prabhakar, B. 2000. Initial Trust, Perceived Risk, and the adoption
oflnternet banking. Brisbane: Proceedings of the twenty first International
Conference on Information Systems.
Kim, C., Mirsobit, M. & Lee, I. 2010. An empirical examination of factors
influencing the intension to use mobile payment. Computers in human
behaviour, 26:310-322.
Kothari, C. R. (2004). Research Methodology: Methods and Techniques.New Delh:
New Age International (P) Limited, Publishers.
Lapan, S. D., &deMarrais, K. (Eds.). (2004). Foundations for Research; Methods of
Inquiry in Education and the Social Sciences. Mahwah, NJ 07430: Lawrence
Erlbaum Associates.
Laukkanen, T., &Pasanen, M. (2007). Mobile banking innovators and early adopters:
How they differ from other online users? Journal of Financial Services
Marketing, “Do electronic marketplaces lower the price of goods?”
Communications of the ACM, 41(1):73-80. R. C.,
Lee, M.-C. (2009). Factors influencing the adoption of internet banking: An
integration of TAM and TPB with perceived risk and perceived benefit.
Electronic Commerce Research and Applications, Volume 8 (Issue 3), 130–
141.
Lema, A. (2014). Factors Influencing the Adoption of Mobile Financial Services in
The Unbanked Population.
Lewin, B. S. (2005). Research Methods in the Social Sciences. London: SAGE
Publications.
65
Mallat, N. (2007). “Exploring Consumer adoption of Mobile Payments- A
Qualitative Study”. The Journal of Strategic Information Systems
Masinge, K. (2010, November 10). Factors influencing the adoption of mobile
banking services at the Bottom of the Pyramid in South Africa. Research
Report. Pretoria, South Africa: Gordon Institute of Business Science (GIBS),
University of Pretoria.
Micheni, E. M., Lule, I., &Muke, G. M. (2013). Transaction Costs and Facilitating
Conditions as Indicators of the Adoption of Mobile Money Services in
Kenya. International Journal of Advanced Trends in Computer Science and
Engineering (IJATCSE), 9-15.
Mohammadi, H. (2015). A study of mobile banking usage in Iran. International
Journal of Bank Marketing,33(6), 733
National Council for Financial Inclusion. (2014). National financial Inclusion
Framework. Dar es Salaam: Bank of Tanzania
Nyambura, M., &Waema, T. M. (2013). Development outcomes of internet and
mobile phones use in Kenya: The households’ perspectives. Info, 13(3), 110–
124. Prentice Hall.
Opie, C. (Ed.). (2007). Doing Educational Research. London: Sage Publications
Padachi, K., Rojid, S. &Seetanah, B. 2007. Analyzing the factors that influence the
adoption of internet banking in Mauritius. Paper presented at the proceedings
of the 2007 computer science and IT Education Conference
Penicaud, C. 2012. State of the Industry: Results from the 2012 Global Mobile
Money
Pousttchi, K. & Schurig, M. 2004. Assessments of today’s mobile banking
applications from the view of customer requirements. Proceedings of the
Hawaii International Conference on System Sciences, January 5-8.

66
Adoption Survey. GSMA.Mobile Money for the Unbanked. Pickens, M., Porteous,
D. &
Rotman, S. 2009. Scenarios for branchless banking 2020. Washington, D.C. CGAP:
Focus Note 57
Riquelme, H., & Rios, R. (2010). The moderating effect of gender in the adoption of
mobile banking. International Journal of Bank Marketing,28(5), 328–341
Rogers, E.M, Diffusions of Innovations, New York: Free Press, 1983
Rwegoshora, H. M. M. (2006). A Guide to Social Science Research. MkukiNaNyota.
Publishers, Dar es Salaam.
Saunders, M., Philip, L., &Andrian, T. (2009). Research methods for business
students (5th ed.). Upper Saddle River, NJ:
Slavin, R.E. (2007). Cooperative learning: Theory, research, and practice (2nd Ed.).
Scott, N., Batchelor S, Ridley, J. & Jorgensen, B. (2004). The impact of mobiles in.
Africa, background paper prepared for the Commission for Africa,
London.Seville, Electronic Payment Systems Observatory (ePSO),
http://epso.jrc.es: 29.
Shapiro, C. & Varian, H. (1999). Information Rules. Boston, Massachusetts, Harvard
Business School Press.Singh, S. (1999). Electronic money: understanding its
use to increase the effectiveness of policy. Telecommunication Policy
Stalder, F. (2002). Failures and successes: notes on the development of electronic
cash. The Information Society.
Tobbin, P., &Kuwornu, J. K. (2011). Adoption of Mobile Money Transfer
Technology: Structural Equation Modeling Approach. European Journal of
Business and Management, III (7), 59-78.
67
Vaus, D. d. (2001). Research Design in Social Research. London: SAGE Publication
Ltd.
Venkatesh, v., & Davis, F. D. (2000). A Theoretical Extension of the Technology
Acceptance Model: Four Longitudinal Field Studies. Management
Science/Vol. 46, No. 2, February 2000, 46 (2), 186-204
World Bank (WB). (2012). Financial Inclusion Strategies Reference Framework.
World Bank (2006). Information and Communication for Development: Global
Trends and Policies; The World Bank, Washington, DC
Yang, K. 2005. Explaining factors affecting the adoption of mobile commerce in
Singapore. Telematics and informatics. 22(3):257-277.
Zhang, J.J., & Yuan, Y. 2002. M-commerce versus internet-based E-commerce: The
key differences. Texas: Americas Conference on information Systems.
Zikmund, W. G., &Babin, B. J. (2010). Essentials of Marketing Research (4th
Edition ed.). Natorp Boulevard, United states of America (USA):
SouthWestern CENGAGE Learning
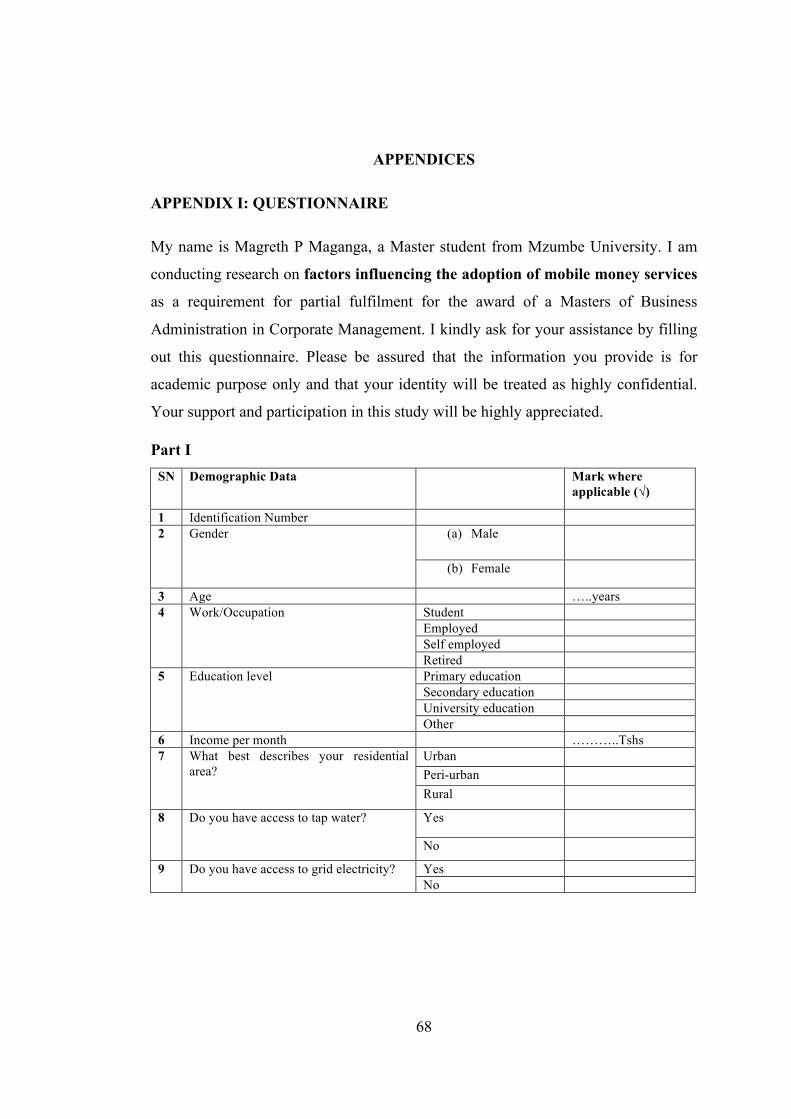
68
APPENDICES
APPENDIX I: QUESTIONNAIRE
My name is Magreth P Maganga, a Master student from Mzumbe University. I am
conducting research on factors influencing the adoption of mobile money services
as a requirement for partial fulfilment for the award of a Masters of Business
Administration in Corporate Management. I kindly ask for your assistance by filling
out this questionnaire. Please be assured that the information you provide is for
academic purpose only and that your identity will be treated as highly confidential.
Your support and participation in this study will be highly appreciated.
Part I SN Demographic Data Mark where
applicable (√)
1 Identification Number 2 Gender (a) Male
(b) Female
3 Age …..years 4 Work/Occupation Student
Employed Self employed Retired
5 Education level Primary education Secondary education University education Other
6 Income per month ………..Tshs 7 What best describes your residential
area? Urban Peri-urban Rural
8 Do you have access to tap water? Yes
No
9 Do you have access to grid electricity? Yes No
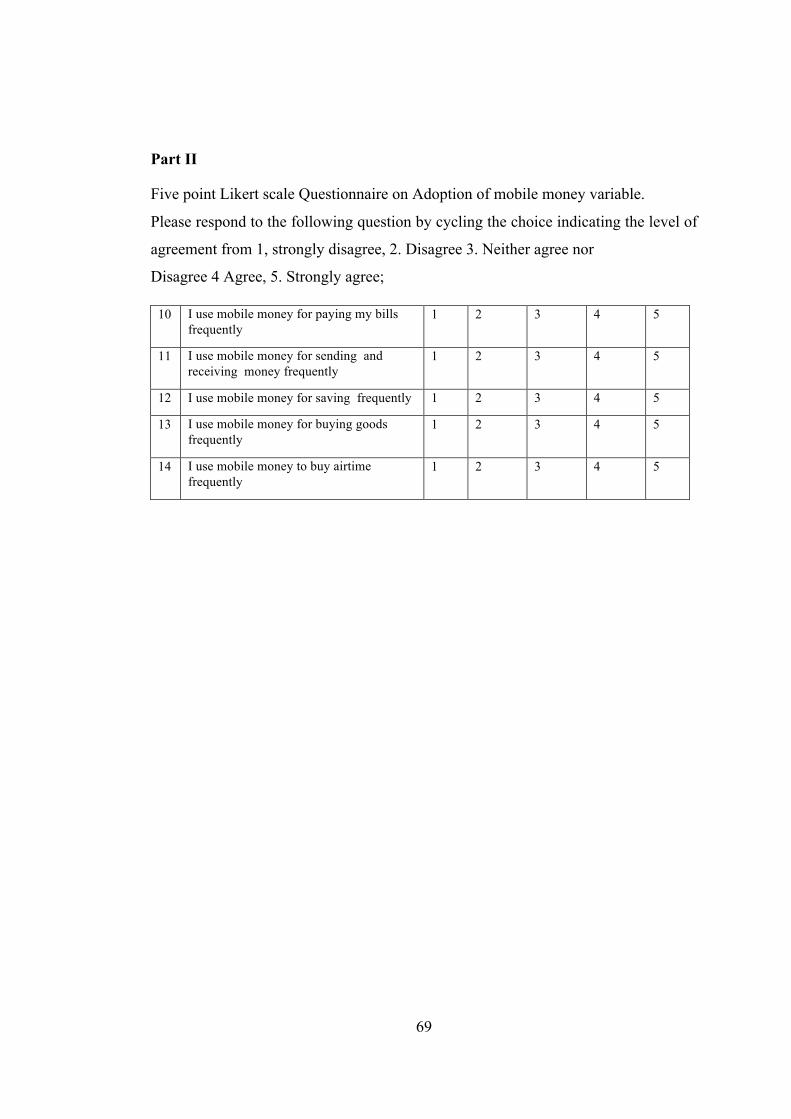
69
Part II
Five point Likert scale Questionnaire on Adoption of mobile money variable.
Please respond to the following question by cycling the choice indicating the level of
agreement from 1, strongly disagree, 2. Disagree 3. Neither agree nor
Disagree 4 Agree, 5. Strongly agree;
10 I use mobile money for paying my bills frequently
1 2 3 4 5
11 I use mobile money for sending and receiving money frequently
1 2 3 4 5
12 I use mobile money for saving frequently 1 2 3 4 5
13 I use mobile money for buying goods frequently
1 2 3 4 5
14 I use mobile money to buy airtime frequently
1 2 3 4 5

70
PART III
Five point Likert scale Questionnaire
Please respond to the following question by cycling the choice indicating thelevel of
agreement from 1, strongly disagree, 2. Disagree 3. Neither agree nor
Disagree 4 Agree, 5. Strongly agree; 15PU I think that using mobile money services
would enable me to accomplish my tasks more quickly.
1 2 3 4 5
16 I think that using mobile money services would make it easier for me to carry out my tasks.
1 2 3 4 5
17 I think that mobile money services are useful
1 2 3 4 5
18 Overall, I think that using mobile money services is advantageous
1 2 3 4 5
19PEU I think that learning to use mobile money services would be easy
1 2 3 4 5
20 I think that interaction with mobile money services does not require a lot of mental effort.
1 2 3 4 5
21 I think that it is easy to mobile money services to accomplish my banking tasks
1 2 3 4 5
22PC I think the equipment cost is expensive to use. E.g. mobile phone.
1 2 3 4 5
23 I think it is expensive to access and use mobile money.
1 2 3 4 5
24 I think the transaction fee is expensive to use.
1 2 3 4 5
25PT Mobile money services service providers have the skills and expertise to perform transactions in an expected manner
1 2 3 4 5
26 Mobile money services providers are fair in their conduct of customer transactions.
1 2 3 4 5
27 Mobile money services providers are open and receptive to customer needs.
1 2 3 4 5
28 Mobile money services service providers make good-faith efforts to
1 2 3 4 5
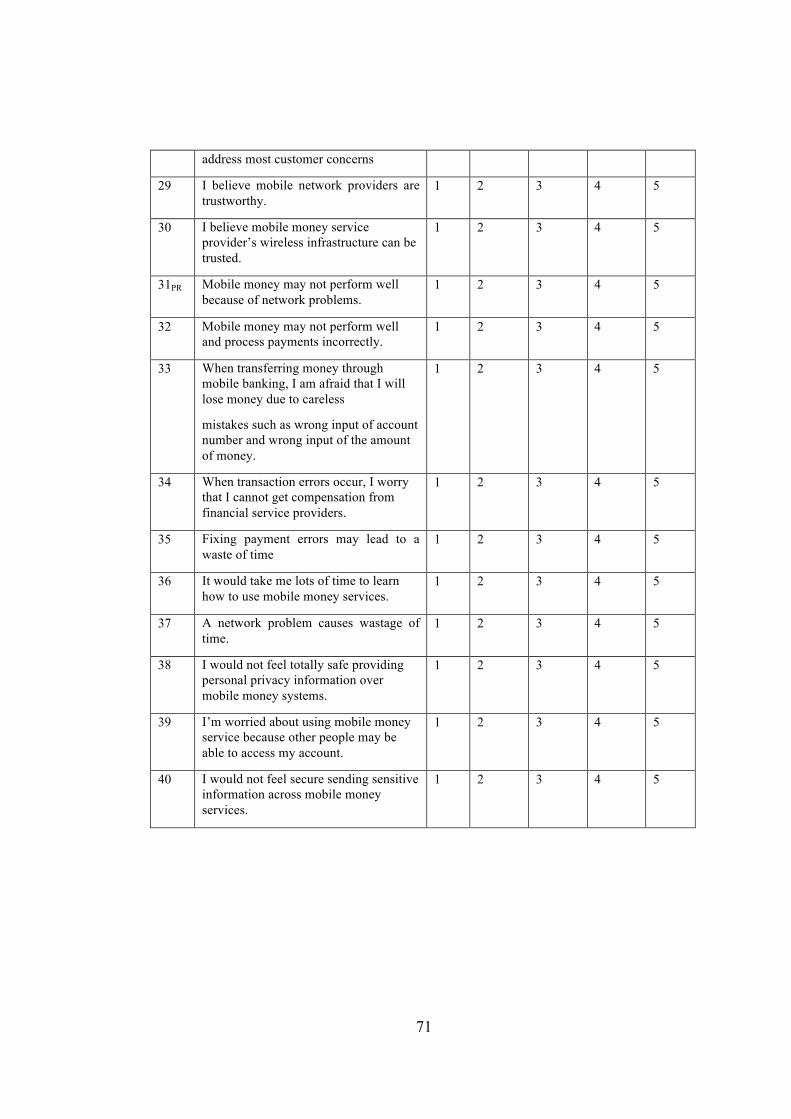
71
address most customer concerns
29 I believe mobile network providers are trustworthy.
1 2 3 4 5
30 I believe mobile money service provider’s wireless infrastructure can be trusted.
1 2 3 4 5
31PR Mobile money may not perform well because of network problems.
1 2 3 4 5
32 Mobile money may not perform well and process payments incorrectly.
1 2 3 4 5
33 When transferring money through mobile banking, I am afraid that I will lose money due to careless
mistakes such as wrong input of account number and wrong input of the amount of money.
1 2 3 4 5
34 When transaction errors occur, I worry that I cannot get compensation from financial service providers.
1 2 3 4 5
35 Fixing payment errors may lead to a waste of time
1 2 3 4 5
36 It would take me lots of time to learn how to use mobile money services.
1 2 3 4 5
37 A network problem causes wastage of time.
1 2 3 4 5
38 I would not feel totally safe providing personal privacy information over mobile money systems.
1 2 3 4 5
39 I’m worried about using mobile money service because other people may be able to access my account.
1 2 3 4 5
40 I would not feel secure sending sensitive information across mobile money services.
1 2 3 4 5
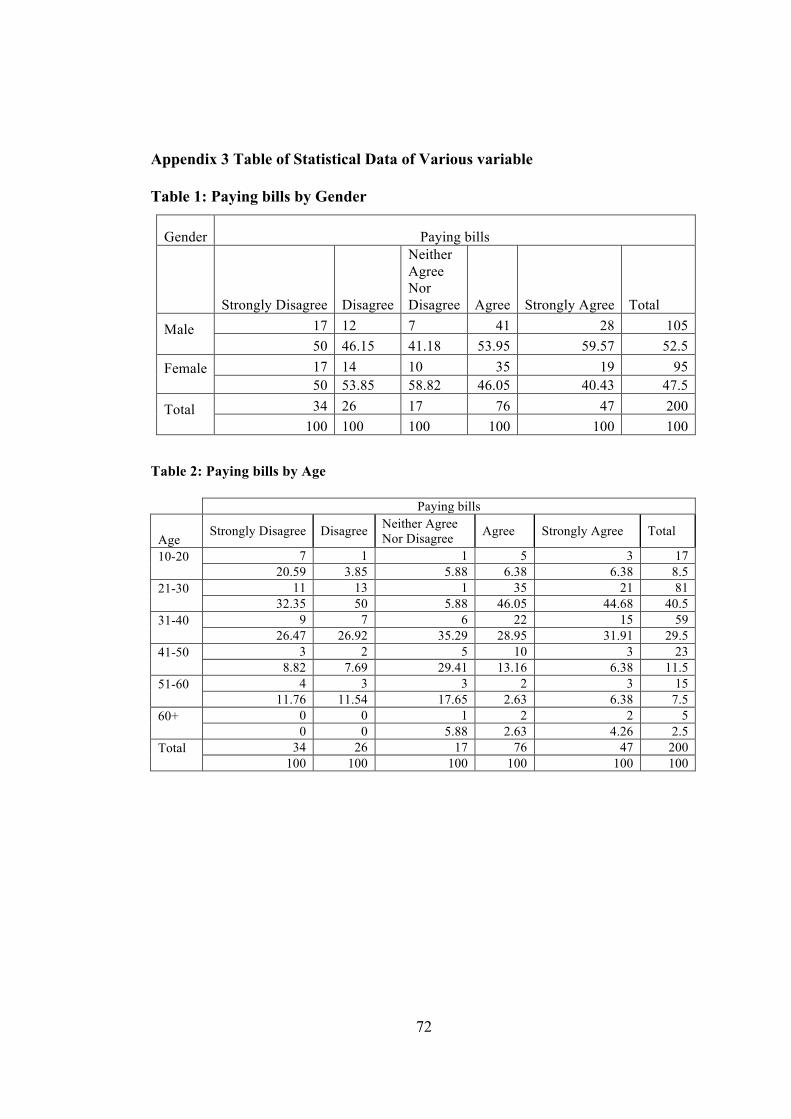
72
Appendix 3 Table of Statistical Data of Various variable
Table 1: Paying bills by Gender
Gender Paying bills
Strongly Disagree Disagree
Neither Agree Nor Disagree Agree Strongly Agree Total
Male
17 12 7 41 28 105 50 46.15 41.18 53.95 59.57 52.5
Female
17 14 10 35 19 95 50 53.85 58.82 46.05 40.43 47.5
Total
34 26 17 76 47 200 100 100 100 100 100 100
Table 2: Paying bills by Age
Paying bills
Age Strongly Disagree Disagree Neither Agree
Nor Disagree Agree Strongly Agree Total
10-20
7 1 1 5 3 17 20.59 3.85 5.88 6.38 6.38 8.5
21-30
11 13 1 35 21 81 32.35 50 5.88 46.05 44.68 40.5
31-40
9 7 6 22 15 59 26.47 26.92 35.29 28.95 31.91 29.5
41-50
3 2 5 10 3 23 8.82 7.69 29.41 13.16 6.38 11.5
51-60
4 3 3 2 3 15 11.76 11.54 17.65 2.63 6.38 7.5
60+
0 0 1 2 2 5 0 0 5.88 2.63 4.26 2.5
Total
34 26 17 76 47 200 100 100 100 100 100 100
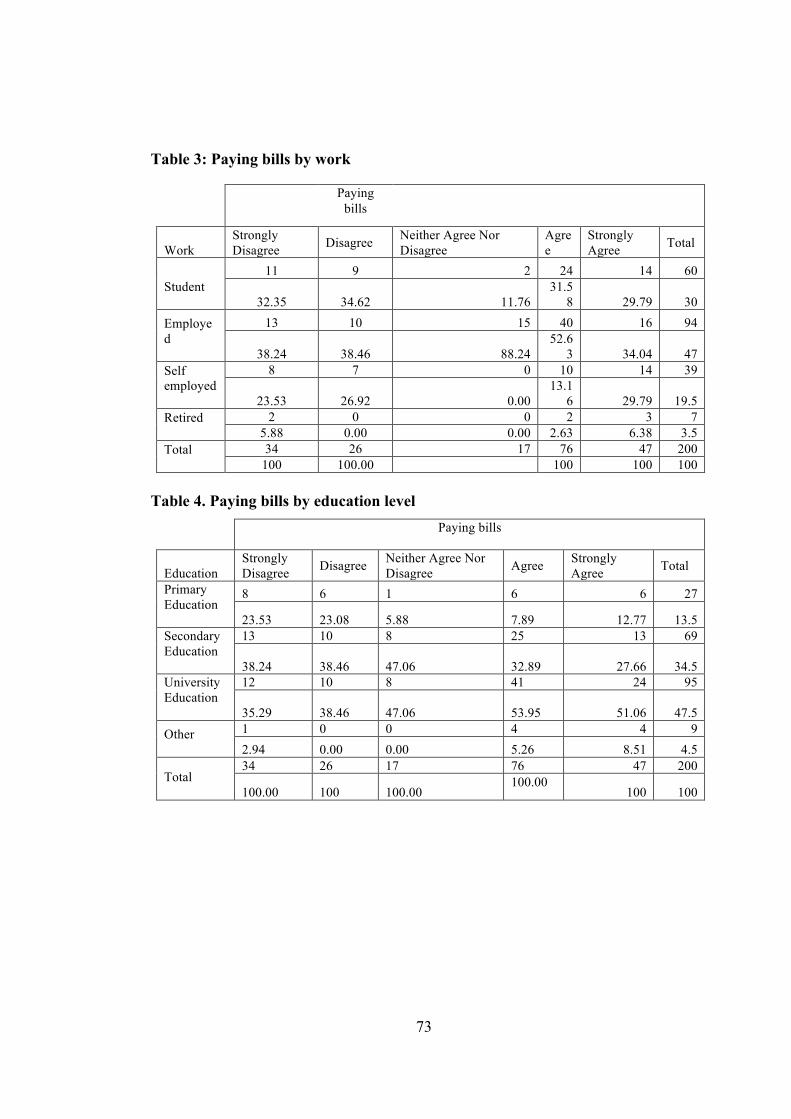
73
Table 3: Paying bills by work
Paying bills
Work
Strongly Disagree Disagree Neither Agree Nor
Disagree Agree
Strongly Agree Total
Student
11 9 2 24 14 60
32.35 34.62 11.76 31.5
8 29.79 30 Employed
13 10 15 40 16 94
38.24 38.46 88.24 52.6
3 34.04 47 Self employed
8 7 0 10 14 39
23.53 26.92 0.00 13.1
6 29.79 19.5 Retired
2 0 0 2 3 7 5.88 0.00 0.00 2.63 6.38 3.5
Total
34 26 17 76 47 200 100 100.00
100 100 100
Table 4. Paying bills by education level Paying bills
Education Strongly Disagree Disagree Neither Agree Nor
Disagree Agree Strongly Agree Total
Primary Education
8 6 1 6 6 27
23.53 23.08 5.88 7.89 12.77 13.5 Secondary Education
13 10 8 25 13 69
38.24 38.46 47.06 32.89 27.66 34.5 University Education
12 10 8 41 24 95
35.29 38.46 47.06 53.95 51.06 47.5 Other
1 0 0 4 4 9 2.94 0.00 0.00 5.26 8.51 4.5
Total
34 26 17 76 47 200
100.00 100 100.00 100.00
100 100

74
Table 5: Paying bills by income level of respondent Paying bills
Income Strongly Disagree Disagree Neither Agree Nor
Disagree Agree Strongly Agree Total
Less 500,000
30 23 14 57 40 164 88.24 88.46 82.35 75.00 85.11 82
500,001-1000000
13 10 8 25 13 69
11.76 11.54 11.76 21.05 10.64 15 More than 1000000
0 0 1 3 2 95
0.00 0.00 5.88 3.95 4.26 47.5
Total
34 26 17 76 47 200
100.00 100 100.00 100.00
100 100
Table 6: Sending and receiving money by age
Send & Receive
Age Strongly Disagree
Disagree
Neither Agree Nor Disagree Agree Strongly
Agree Total
10-20
4 1 1 5 6 17
50 5.56 5.56 6.49 7.59 8.5 21-30
1 5 4 33 38 81
12.5 27.78 22.22 42.86 48.1 40.5 31-40
3 6 6 25 19 59
37.5 33.33 33.33 32.47 24.05 29.5 41-50
0 2 3 10 8 23
0 11.11 16.67 12.99 10.13 11.5 51-60
0 4 4 3 4 15
0 22.22 22.22 3.9 5.06 7.5 60+
0 0 0 1 4 5 0 0 0 1.3 5.06 2.5
Total
8 18 18 77 79 200 100 100 100 100 100 100
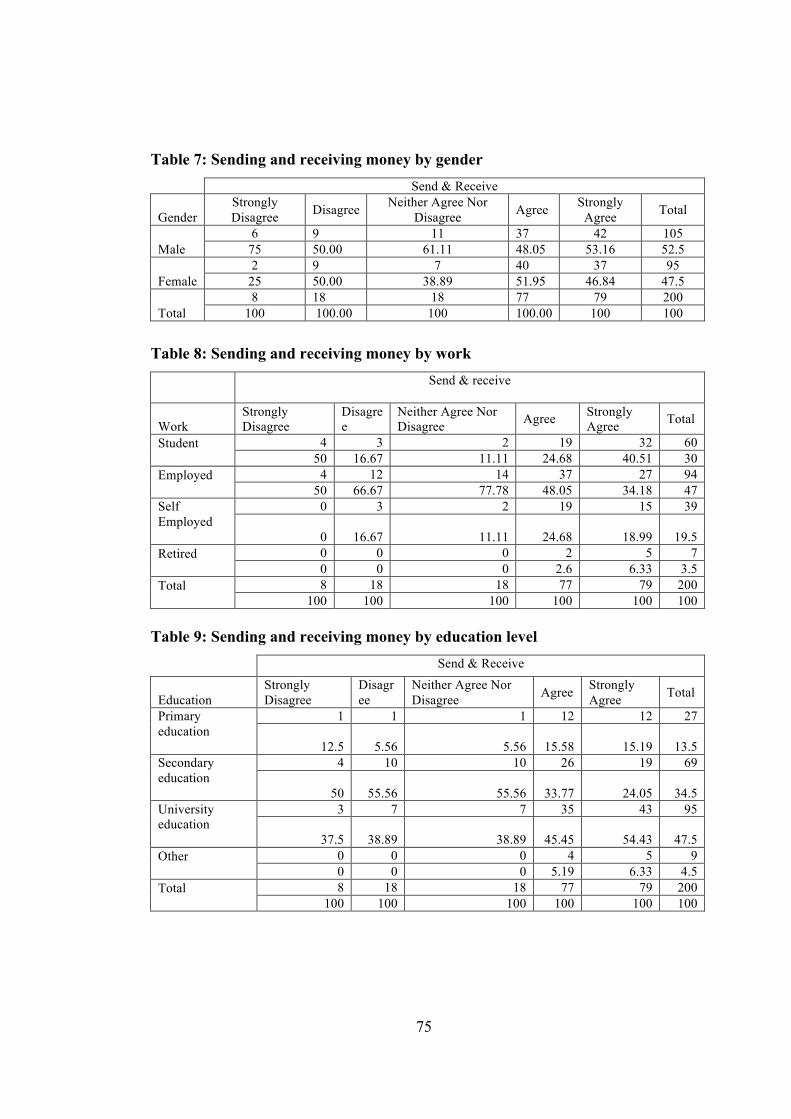
75
Table 7: Sending and receiving money by gender Send & Receive
Gender Strongly Disagree Disagree Neither Agree Nor
Disagree Agree Strongly Agree Total
Male 6 9 11 37 42 105
75 50.00 61.11 48.05 53.16 52.5
Female 2 9 7 40 37 95
25 50.00 38.89 51.95 46.84 47.5
Total 8 18 18 77 79 200
100 100.00 100 100.00 100 100
Table 8: Sending and receiving money by work
Send & receive
Work Strongly Disagree
Disagree
Neither Agree Nor Disagree Agree Strongly
Agree Total
Student
4 3 2 19 32 60 50 16.67 11.11 24.68 40.51 30
Employed
4 12 14 37 27 94 50 66.67 77.78 48.05 34.18 47
Self Employed
0 3 2 19 15 39
0 16.67 11.11 24.68 18.99 19.5 Retired
0 0 0 2 5 7 0 0 0 2.6 6.33 3.5
Total
8 18 18 77 79 200 100 100 100 100 100 100
Table 9: Sending and receiving money by education level Send & Receive
Education Strongly Disagree
Disagree
Neither Agree Nor Disagree Agree Strongly
Agree Total
Primary education
1 1 1 12 12 27
12.5 5.56 5.56 15.58 15.19 13.5 Secondary education
4 10 10 26 19 69
50 55.56 55.56 33.77 24.05 34.5 University education
3 7 7 35 43 95
37.5 38.89 38.89 45.45 54.43 47.5 Other
0 0 0 4 5 9 0 0 0 5.19 6.33 4.5
Total
8 18 18 77 79 200 100 100 100 100 100 100

76
Table 10:Sending and receiving money by income level
Send & Receive
Income Strongly Disagree Disagree Neither Agree
Nor Disagree Agree Strongly Agree Total
Less 500,000
7 17 13 63 64 164
87.5 94.44 72.22 81.82 81.01 82
500,001-1000000
1 1 4 12 12 30
12.5 5.56 22.22 15.58 15.19 15
More than 1000000
0 0 1 2 3 6
0 0 5.56 2.6 3.8 3
Total
8 18 18 77 79 200
100 100 100 100 100 100
Table 11:Saving money by gender
Saving
Gender Strongly Disagree Disagree Neither Agree Nor
Disagree Agree Strongly Agree Total
Male
13 25 21 34 12 105 54.17 55.56 58.33 55.74 35.29 52.5
Female
11 20 15 27 22 95 45.83 44.44 41.67 44.26 64.71 47.5
Total
24 45 36 61 34 200 100 100.00 100 100 100 100
Table 12:Saving money by age Saving
Age Strongly Disagree Neither Agree Nor Disagree Agree Strongly Total 10-20
5 1 2 3 6 17 20.83 2.22 5.56 4.92 17.65 8.5
21-30
7 22 14 28 10 81 29.17 48.89 38.89 45.9 29.41 40.5
31-40
6 8 12 19 14 59 25 17.78 33.33 31.15 41.18 29.5
41-50
3 7 6 4 3 23 12.5 15.56 16.67 6.56 8.82 11.5
51-60
3 3 2 7 0 15 12.5 6.67 5.56 11.48 0 7.5
60+
0 4 0 0 1 5 0 8.89 0 0 2.94 2.5
Total
24 45 36 61 34 200 100 100 100 100 100 100
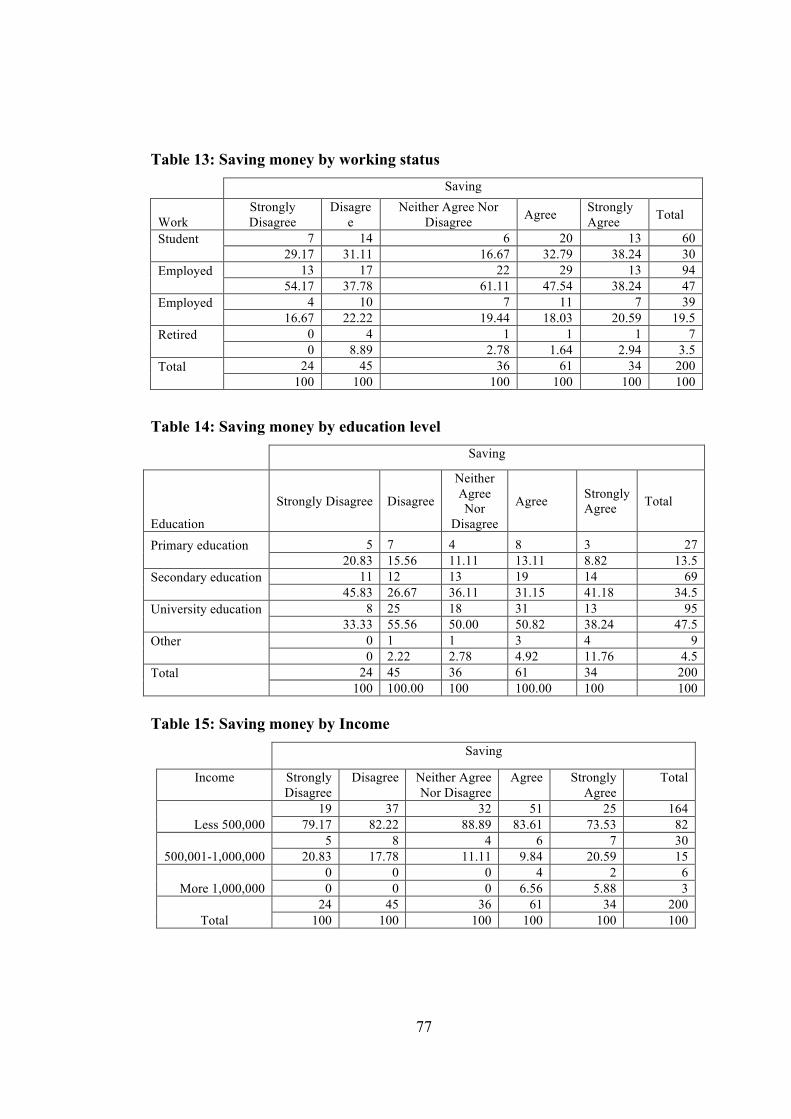
77
Table 13: Saving money by working status
Table 14: Saving money by education level Saving
Education
Strongly Disagree Disagree
Neither Agree Nor
Disagree
Agree Strongly Agree Total
Primary education
5 7 4 8 3 27 20.83 15.56 11.11 13.11 8.82 13.5
Secondary education
11 12 13 19 14 69 45.83 26.67 36.11 31.15 41.18 34.5
University education
8 25 18 31 13 95 33.33 55.56 50.00 50.82 38.24 47.5
Other
0 1 1 3 4 9 0 2.22 2.78 4.92 11.76 4.5
Total
24 45 36 61 34 200 100 100.00 100 100.00 100 100
Table 15: Saving money by Income Saving
Income Strongly Disagree
Disagree Neither Agree Nor Disagree
Agree Strongly Agree
Total
Less 500,000 19 37 32 51 25 164
79.17 82.22 88.89 83.61 73.53 82
500,001-1,000,000 5 8 4 6 7 30
20.83 17.78 11.11 9.84 20.59 15
More 1,000,000 0 0 0 4 2 6 0 0 0 6.56 5.88 3
Total 24 45 36 61 34 200
100 100 100 100 100 100
Saving
Work Strongly Disagree
Disagree
Neither Agree Nor Disagree Agree Strongly
Agree Total
Student
7 14 6 20 13 60 29.17 31.11 16.67 32.79 38.24 30
Employed
13 17 22 29 13 94 54.17 37.78 61.11 47.54 38.24 47
Employed
4 10 7 11 7 39 16.67 22.22 19.44 18.03 20.59 19.5
Retired
0 4 1 1 1 7 0 8.89 2.78 1.64 2.94 3.5
Total
24 45 36 61 34 200 100 100 100 100 100 100
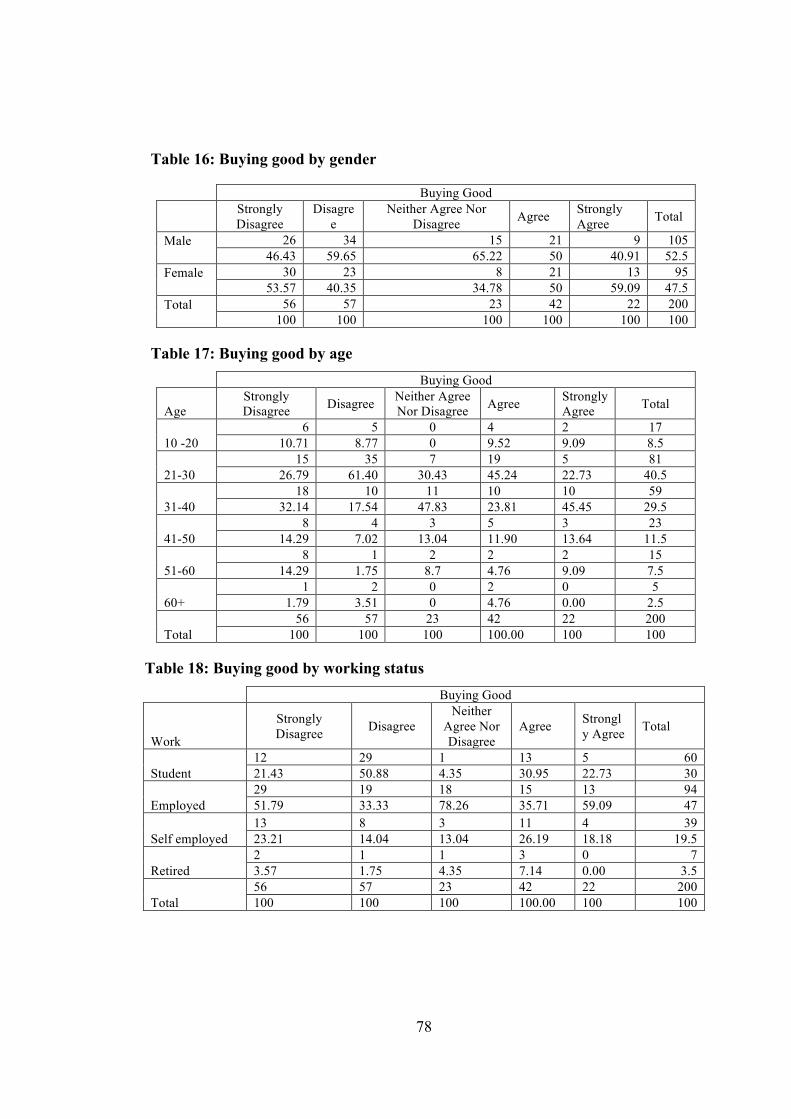
78
Table 16: Buying good by gender
Buying Good
Strongly Disagree
Disagree
Neither Agree Nor Disagree Agree Strongly
Agree Total
Male
26 34 15 21 9 105 46.43 59.65 65.22 50 40.91 52.5
Female
30 23 8 21 13 95 53.57 40.35 34.78 50 59.09 47.5
Total
56 57 23 42 22 200 100 100 100 100 100 100
Table 17: Buying good by age Buying Good
Age Strongly Disagree Disagree Neither Agree
Nor Disagree Agree Strongly Agree Total
10 -20 6 5 0 4 2 17
10.71 8.77 0 9.52 9.09 8.5
21-30 15 35 7 19 5 81
26.79 61.40 30.43 45.24 22.73 40.5
31-40 18 10 11 10 10 59
32.14 17.54 47.83 23.81 45.45 29.5
41-50 8 4 3 5 3 23
14.29 7.02 13.04 11.90 13.64 11.5
51-60 8 1 2 2 2 15
14.29 1.75 8.7 4.76 9.09 7.5
60+ 1 2 0 2 0 5
1.79 3.51 0 4.76 0.00 2.5
Total 56 57 23 42 22 200
100 100 100 100.00 100 100
Table 18: Buying good by working status Buying Good
Work
Strongly Disagree Disagree
Neither Agree Nor Disagree
Agree Strongly Agree Total
Student 12 29 1 13 5 60 21.43 50.88 4.35 30.95 22.73 30
Employed 29 19 18 15 13 94 51.79 33.33 78.26 35.71 59.09 47
Self employed 13 8 3 11 4 39 23.21 14.04 13.04 26.19 18.18 19.5
Retired 2 1 1 3 0 7 3.57 1.75 4.35 7.14 0.00 3.5
Total 56 57 23 42 22 200 100 100 100 100.00 100 100

79
Table 19: Buying good by education level
Buying Good
Education Strongly Disagree Disagree Neither Agree
Nor Disagree Agree Strongly Agree Total
Primary education 9 5 2 7 4 27 16.07 8.77 8.7 16.67 18.18 13.5
Secondary education 23 15 10 13 8 69 41.07 26.32 43.48 30.95 36.36 34.5
University education 24 36 10 16 9 95 42.86 63.16 43.48 38.1 40.91 47.5
Other 0 1 1 6 1 9 0 1.75 4.35 14.29 4.55 4.5
Total 56 57 23 42 22 200 100 100 100 100 100 100
Table 20: Buying good by income level Buying Good
Income Strongly Disagree
Disagree Neither Agree Nor Disagree
Agree Strongly Agree
Total
Less 500,000 46 48 19 34 17 164
82.14 84.21 82.61 80.95 77.27 82
500,001-1,000,000 8 8 3 6 5 30
14.29 14.04 13.04 14.29 22.73 15
More 1,000,000 2 1 1 2 0 6
3.57 1.75 4.35 4.76 0 3
Total 56 57 23 42 22 200
100 100 100 100 100 100
Table 21: Buying air time by Gender Buying air time
Gender Strongly Disagree Disagree Neither Agree Nor Disagree Agree Strongly Agree Total
Male
8 8 8 34 47 105 42.11 61.54 66.67 50 53.41 52.5
Female
11 5 4 34 41 95 57.89 38.46 33.33 50 46.59 47.5
Total
19 13 12 68 88 200 100 100.00 100 100 100 100
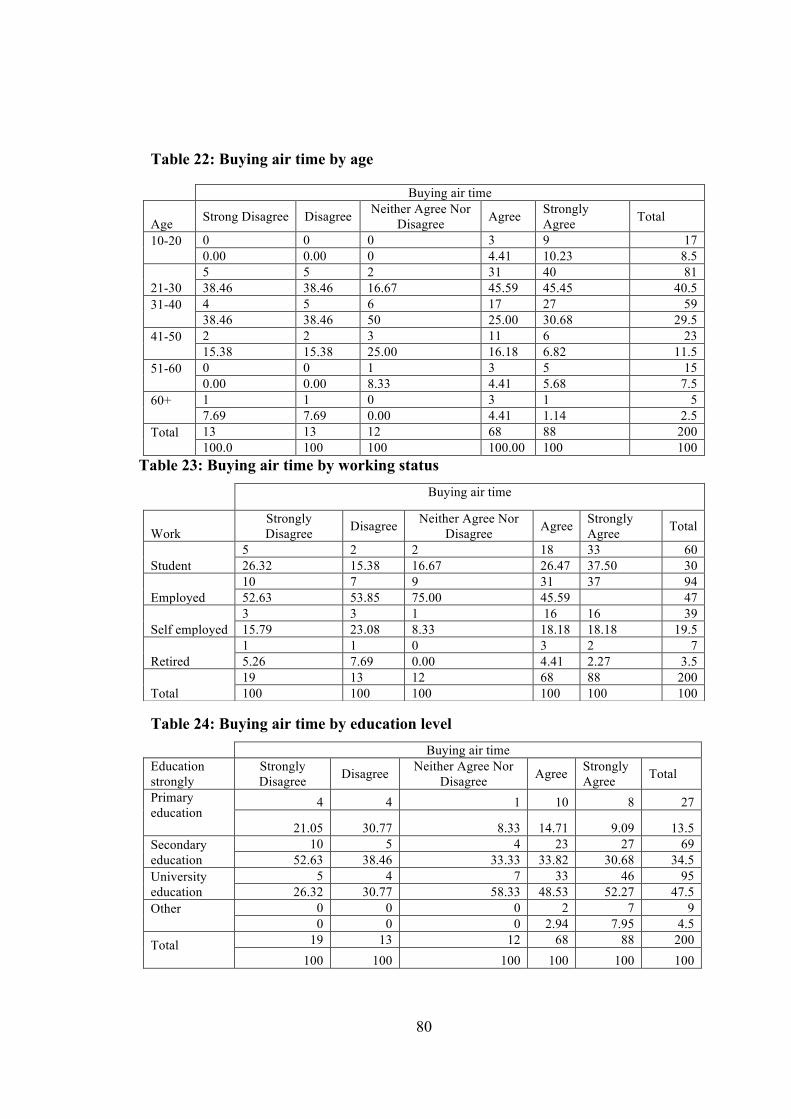
80
Table 22: Buying air time by age
Buying air time
Age Strong Disagree Disagree Neither Agree Nor Disagree Agree Strongly
Agree Total
10-20
0 0 0 3 9 17 0.00 0.00 0 4.41 10.23 8.5
21-30 5 5 2 31 40 81 38.46 38.46 16.67 45.59 45.45 40.5
31-40
4 5 6 17 27 59 38.46 38.46 50 25.00 30.68 29.5
41-50
2 2 3 11 6 23 15.38 15.38 25.00 16.18 6.82 11.5
51-60
0 0 1 3 5 15 0.00 0.00 8.33 4.41 5.68 7.5
60+
1 1 0 3 1 5 7.69 7.69 0.00 4.41 1.14 2.5
Total
13 13 12 68 88 200 100.0 100 100 100.00 100 100
Table 23: Buying air time by working status
Table 24: Buying air time by education level Buying air time
Education strongly
Strongly Disagree Disagree Neither Agree Nor
Disagree Agree Strongly Agree Total
Primary education
4 4 1 10 8 27
21.05 30.77 8.33 14.71 9.09 13.5 Secondary education
10 5 4 23 27 69 52.63 38.46 33.33 33.82 30.68 34.5
University education
5 4 7 33 46 95 26.32 30.77 58.33 48.53 52.27 47.5
Other
0 0 0 2 7 9 0 0 0 2.94 7.95 4.5
Total
19 13 12 68 88 200 100 100 100 100 100 100
Buying air time
Work Strongly Disagree Disagree Neither Agree Nor
Disagree Agree Strongly Agree Total
Student 5 2 2 18 33 60 26.32 15.38 16.67 26.47 37.50 30
Employed 10 7 9 31 37 94 52.63 53.85 75.00 45.59 47
Self employed 3 3 1 16 16 39 15.79 23.08 8.33 18.18 18.18 19.5
Retired 1 1 0 3 2 7 5.26 7.69 0.00 4.41 2.27 3.5
Total 19 13 12 68 88 200 100 100 100 100 100 100

81
Table 25: Buying air time by income level Buying air time
Income Strongly Disagree
Disagree Neither Agree Nor Disagree
Agree Strongly Agree
Total
Less 500,000 17 12 9 58 68 164
89.47 92.31 75 85.29 77.27 82
500,001-1,000,000 2 1 3 9 15 30
10.53 7.69 25 13.24 17.05 15
More 1,000,000 0 0 0 1 5 6 0 0 0 1.47 5.68 3
Total 19 13 12 68 88 200
100 100 100 100 100 100
Table 26: Adoption of mobile money by Tap water Tap water
Paying bills
Send and receiving Saving
Buying Goods and services
Buying air time
Yes 3.573248 4.019108 3.26114
6 2.675159 3.993631
No 2.674419 3.953488 2.88372
1 2.255814 3.860465 Total 3.38 4.005 3.18 2.585 3.965
Table 27: Adoption of mobile money by residential Residential Area
Paying bills
Send and receiving Saving
Buying Good and services
Buying air time
Urban 3.709091 4.072727 3.42727
3 2.854545 4.136364
Peri-urban 2.774194 3.967742 2.70967
7 2.322581 3.548387
Rural 3.068966 3.87931 2.98275
9 2.189655 3.844828 Total 3.38 4.005 3.18 2.585 3.965
Table 28: Adoption of mobile money by electrical grid user Electrical grid user
Paying bills
Send and receiving Saving
Buying Goods and services
Buying air time
Yes 3.564417 4.03681 3.18404
9 2.668712 4.03681
No 2.567568 3.864865 3.16216
2 2.216216 3.648649 Total 3.38 4.005 3.18 2.585 3.965
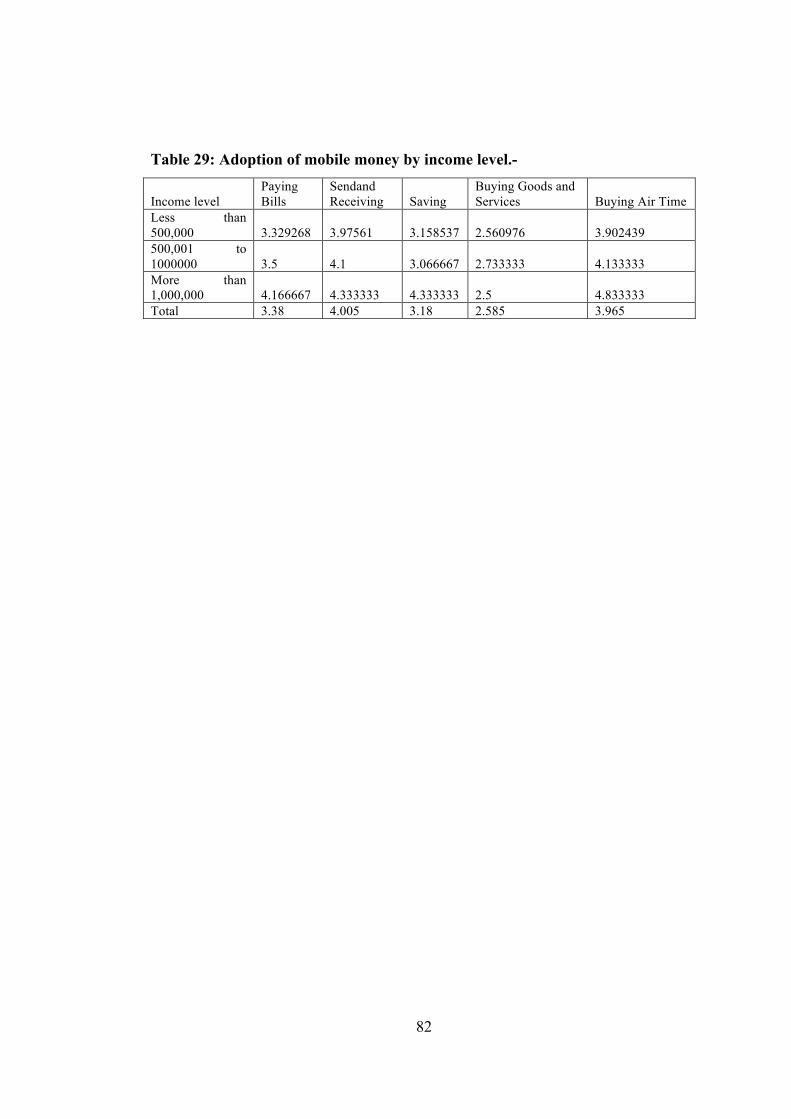
82
Table 29: Adoption of mobile money by income level.-
Income level Paying Bills
Sendand Receiving Saving
Buying Goods and Services Buying Air Time
Less than 500,000 3.329268 3.97561 3.158537 2.560976 3.902439 500,001 to 1000000 3.5 4.1 3.066667 2.733333 4.133333 More than 1,000,000 4.166667 4.333333 4.333333 2.5 4.833333 Total 3.38 4.005 3.18 2.585 3.965