An Assessment Of Factors Influencing Student Enrollment ...
120
Wayne State University DigitalCommons@WayneState Wayne State University Dissertations 1-1-2010 An Assessment Of Factors Influencing Student Enrollment Within e Southern Union Conference Of Seventh-Day Adventist Secondary Schools Olivia Dianne Beverly Wayne State University Follow this and additional works at: hp://digitalcommons.wayne.edu/oa_dissertations is Open Access Dissertation is brought to you for free and open access by DigitalCommons@WayneState. It has been accepted for inclusion in Wayne State University Dissertations by an authorized administrator of DigitalCommons@WayneState. Recommended Citation Beverly, Olivia Dianne, "An Assessment Of Factors Influencing Student Enrollment Within e Southern Union Conference Of Seventh-Day Adventist Secondary Schools" (2010). Wayne State University Dissertations. Paper 137.
Transcript of An Assessment Of Factors Influencing Student Enrollment ...
Wayne State UniversityDigitalCommons@WayneState
Wayne State University Dissertations
1-1-2010
An Assessment Of Factors Influencing StudentEnrollment Within The Southern UnionConference Of Seventh-Day Adventist SecondarySchoolsOlivia Dianne BeverlyWayne State University
Follow this and additional works at: http://digitalcommons.wayne.edu/oa_dissertations
This Open Access Dissertation is brought to you for free and open access by DigitalCommons@WayneState. It has been accepted for inclusion inWayne State University Dissertations by an authorized administrator of DigitalCommons@WayneState.
Recommended CitationBeverly, Olivia Dianne, "An Assessment Of Factors Influencing Student Enrollment Within The Southern Union Conference OfSeventh-Day Adventist Secondary Schools" (2010). Wayne State University Dissertations. Paper 137.

AN ASSESSMENT OF FACTORS INFLUENCING STUDENT ENROLLMENT
WITHIN THE SOUTHERN UNION CONFERENCE OF SEVENTH-DAY ADVENTIST
SECONDARY SCHOOLS
by
OLIVIA D. BEVERLY
DISSERTATION
Submitted to the Graduate School
of Wayne State University,
Detroit, Michigan
in partial fulfillment of the requirements
for the degree of
DOCTOR OF PHILOSOPHY
2010
MAJOR: CURRICULUM AND INSTRUCTION
Approved by:
________________________________________
Advisor Date
________________________________________
________________________________________
________________________________________

©COPYRIGHT BY
OLIVIA D. BEVERLY
2010
All Rights Reserved

ii
DEDICATION
This dissertation is dedicated to the following individuals:
My husband, Dr. Creigs Beverly, who has been my anchor, the wind beneath my
wings and the proud supporter of my life and work.
My parents, Edward and Gladys Gilbert, who sacrificed endlessly for my nine
brothers and sisters and me, and instilled in us the inspiration to set high goals and the
confidence to achieve them.

iii
ACKNOWLEDGEMENTS
I would like to thank my dissertation committee for their patience, persistence, and
support in the process of seeing this dissertation through to its completion. I thank each member
for their individual contributions and guidance. I especially thank Dr. Sharon Elliott, my advisor,
for her guidance and endless support as we traveled this journey together. I would also like to
thank Dr. Janice Greene for her words of encouragement and support and for believing that I
could complete the goal started.
This research would not have been possible without the cooperation and time my work
colleagues in the Southern Union Conference provided to assist in my data collection. Thank you
for providing the respondents, particularly the students, who participated in this research.
Additionally, I would like to thank South Central Conference for allowing me to take a leave of
absence to write this dissertation.
I would like to thank my family for their untiring patience and support over the years of
completing my graduate, then post graduate studies. I am extremely grateful to my parents,
brothers and sisters who have always had the faith in my ability and have been a source of
encouragement. I especially thank my brother Jonathon for his continued assistance in making
the dissertation journey so much easier to travel.
Most importantly, I want to thank my loving, patient husband who always believed I
could accomplish anything I wanted to. Without his encouragement and emotional support, this
journey would have been difficult, perhaps even impossible, to travel.

iv
TABLE OF CONTENTS
Dedication ....................................................................................................................................... ii
Acknowledgements ....................................................................................................................... iii
List of Tables ............................................................................................................................... vii
CHAPTER 1 – INTRODUCTION ...............................................................................................1
Background ..........................................................................................................................1
Catholic Education ...............................................................................................................4
Lutheran Education ..............................................................................................................5
Conservative Protestant Christian Education.......................................................................6
Southern Union Conference ...............................................................................................13
Research Focus ..................................................................................................................18
Research Question .............................................................................................................18
Research Design.................................................................................................................19
CHAPTER 2 – LITERATURE REVIEW .................................................................................21
Introduction ........................................................................................................................21
Charter Schools ..................................................................................................................26
Private Education ...............................................................................................................30
Adventist Specific Literature Review ................................................................................33
Literature Synthesis ...........................................................................................................41
CHAPTER 3 – METHODOLOGY ............................................................................................43
Participants .........................................................................................................................43
Materials ............................................................................................................................45
Literature Review...................................................................................................45
Research Questionnaire #1 ....................................................................................46

v
Research Questionnaire #2 ....................................................................................46
Focus Group Questionnaire ......................................................................................47
Procedures ..........................................................................................................................47
CHAPTER 4 – METHODOLOGY ............................................................................................49
Introduction ........................................................................................................................49
Survey One Results ............................................................................................................57
Survey Two Results ...........................................................................................................62
Focus Group Results ..........................................................................................................65
Quality of Education ..............................................................................................65
Cost of Education ...................................................................................................66
Christian Experiences at other schools ..................................................................67
Personal contacts with potential parents and students ...........................................67
Commitment of teachers and support staff ............................................................68
CHAPTER 5 – DISCUSSION.....................................................................................................69
Recommendations ..............................................................................................................70
Study Implications .............................................................................................................72
Study Limitations ...............................................................................................................74
Implications for Future Research .......................................................................................75
APPENDIX A – INTRODUCTORY LETTER FOR ADULT PARTICIPANTS IN THE
RESEARCH STUDY ........................................................................................76
APPENDIX B – ADULT RESPONDENT CONSENT FORM ....................................................77
APPENDIX C – PARENTS RESEARCH INFORMATION SHEET ..........................................80
APPENDIX D – INTRODUCTORY LETTER FOR STUDENT PARTICIPANTS IN THE
RESEARCH STUDY ........................................................................................83

vi
APPENDIX E – BEHAVIORAL DOCUMENTATION OF ADOLESCENT ASSENT FORM 84
APPENDIX F – QUESTIONNAIRE #1 .......................................................................................87
APPENDIX G – INTRODUCTORY LETTER FOR QUESTIONNAIRE #2 .............................90
APPENDIX H – QUESTIONNAIRE #2 .......................................................................................91
APPENDIX I – INTRODUCTORY LETTER FOR ADULT PARTICIPANTS IN THE
RESEARCH STUDY FOCUS GROUP ............................................................92
APPENDIX J – BEHAVIORAL RESEARCH INFORMED CONSENT ...................................93
APPENDIX K – FOCUS GROUP QUESTIONNAIRE ...............................................................95
APPENDIX L – HIC- NOTICE OF EXPEDITED APPROVAL .................................................96
APPENDIX M –HIC- NOTICE OF EXPEDITED AMENDMENT APPROVAL ......................97
APPENDIX N – NUMERICAL REVERSAL OF THE INPUTTED DATA FACTORS ............98
APPENDIX O – ABBREVIATION LEDGER FOR THE DAY AND BOARDING
SCHOOLS IN THE SOUTHERN UNION CONFERENCE ..........................100
REFERENCES ............................................................................................................................101
ABSTRACT .................................................................................................................................109
AUTOBIOGRAPHICAL STATEMENT ....................................................................................111

vii
LIST OF TABLES
Table 1: Cumulative Change in Numbers of Faith-based Urban Schools and Their
Students, by Religion: 2000-06..........................................................................8
Table 2: Where Do Private School Students Go To School? .........................................10
Table 3: K-12 Enrollment Over Time in California .......................................................12
Table 4: Day and Boarding Schools Enrollment for Southern Union Conference ........14
Table 5: Enrollment in Elementary and Secondary Schools, by Level and Control of
Institution: Selected Years, Fall 1970 through Fall 2017 ................................24
Table 6: Academy Enrollment in the Southern Union Conference ...............................34
Table 7: Membership Growth and SDA School Enrollment .........................................35
Table 8: Academy Enrollment in NAD (North American Division) .............................35
Table 9: Average Academy Enrollment in the North American Division .....................36
Table 10: Average Enrollment for Day and Boarding Schools Within the Southern
Union Conference ............................................................................................36
Table 11: Tuition Costs for Secondary Schools in the Southern Union Conference .......39
Table 12: Do you feel that you are adequately able to keep up to date with new
developments in your field? .............................................................................40
Table 13: Study Sample Participants for Questionnaires #1 and #2 ................................45
Table 14: Number of Respondents in the Research Study from Boarding Schools in
the Southern Union Conference .......................................................................51
Table 15: Number of Respondents in the Research Study from Day Schools in the
Southern Union Conference .............................................................................52
Table 16: Regional Superintendent Responses in the Southern Union Conference ........52
Table 17: Combined Responses Returned From Day and Boarding Schools and
Regional Superintendents in the Southern Union Conference ........................53
Table 18: Frequency of the research Variables by Factor Category for
Questionnaire #1 Administration .....................................................................53
Table 19: Frequency of the Research Variables by Factor Category for

viii
Questionnaire #1 Parents’ Perceptions ............................................................54
Table 20: Frequency of the Research Variables by Factor Category for
Questionnaire #1 External Factors ...................................................................54
Table 21: Frequency of the Research Variables by Factor Category for
Questionnaire #1 Promotional Factors .............................................................54
Table 22: Frequency of the Research Variables by Factor Category for
Questionnaire #1 Church Leadership ...............................................................55
Table 23: Statistical Ranking of All of the Research Variables for Questionnaire #1
In Descending Order ........................................................................................56
Table 24: Top Significant Research Factors Identified from Respondents from
Questionnaire #1 ..............................................................................................57
Table 25: Most Significant Factors Influencing Enrollment by Boarding School
Respondents .....................................................................................................58
Table 26: Most Significant Factors Influencing Enrollment by Day School
Respondents .....................................................................................................59
Table 27: Most Significant Factors Influencing by Superintendents as Respondents .....59
Table 28: Top Two Most Significant Responses by Category of Respondents ...............60
Table 29: Ranking of Questionnaire #2 Factors by Order of Significance ......................64
Table 30: Combined Responses Returned from Day, Boarding Schools and Regional
Superintendents in the Southern Union Conference for Questionnaire #2 ......65

1
CHAPTER 1
INTRODUCTION
Background
Within the United States public educational institutions and private religious educational
institutions have co-existed for many years. This co-existence, this existential interface within
American society is rooted in the First Amendment to the United States Constitution.
Specifically, Congress shall make no law respecting an establishment of religion, or prohibiting
the free exercise thereof, or abridging the freedom of speech, or the press, or the right of the
people peaceably to assemble, and to petition the government, for a redress of grievances (U.S.
National Archives and Records Administration, n.d.).
At the core of the concept of separation of church and state is the belief that no publicly
funded educational institution should promote any particular religious orientation or theological
worldview (i.e., no state sanctioned religion). Further, that in a multicultural, multiethnic,
multilingual and multi-religious nation, no one religious orientation should take precedent or
have hegemony over any other belief system or orientation.
In recent years, even the pledge of allegiance has become controversial as a ritual in
public school systems. Proponents of the separation of church and state concept argue that the
portion of the pledge which states, “…one nation under God…” constitutes an imposition or
represents an intrusion by the state of a particular religious point of view into the domain of
public education, thus, a violation of the separation of church and state clause.
Given this precedent set forth in the First Amendment to the U.S. Constitution, what
happens when the deeply held convictions and beliefs of parents become inconsistent or are felt
to be incompatible with the very concept of public education? To state this differently, what

2
happens when the common good, the very foundation upon which public education is based, is
deemed contrary to the personal good (wishes) of parents who seek reinforcement and
reaffirmation of their personal beliefs within public educational settings?
When faced with the inability to find a goodness of fit between their personal religious
orientation and permissible practices within public educational institutions, parents consciously
seek out compatible educational alternatives (institutions) for their children. These parental
searches for compatible educational alternatives have most often resulted in parents sending their
children to religious educational institutions which reinforce their religious belief system(s) or
home-schooling their children.
Most cultural anthropologists and sociologists agree that institutions are designed to meet
the needs of its members. Even the most casual observer is able to recognize at a minimum five
institutional forms woven together for societal sustainability. Gerth and Mills (1964) identify
these institutions as political, economic, military, kinship and religious. Though the Gerth and
Mills taxonomy does not include education, every society has some means of teaching its youth.
Neil Kagan‟s (2006) work, entitled Concise History of the World provides an evolutionary
perspective on societal institutional development over time (Kagan, 2006).
Lincoln (1971), a professor of sociology and religion stated that:
The true objective of an institution should be to strengthen the fabric of society, to
enhance the quality of life-experience of the individual, and to project the values
of the culture out of which it arises. Now the function of culture is to make
possible an ordered social life in which individuals may more nearly realize their
fullest potentials as persons. The function of an institution is to relate discrete
social experiences in such a way as to infuse life with a quality of meaning which
accentuates its social value. Hence, an institution is a social instrument directed
toward the enhancement of the individual human experience to the ultimate
benefit of the whole society. It is created as a response to a need that is felt to be
fundamental, and its singularity is that it transcends time and circumstance,
addressing itself to successive generations of men and women. (p. 606)

3
The operative phrase from Lincoln which had particular relevance for this discussion is,
“The function of an institution is to relate discrete social experiences in such a way as to infuse
life with a quality of meaning which accentuates its social value” (Lincoln, 1971, p. 606) For
some parents this outcome is achievable within public educational settings. For others it is
achievable only through the matriculation of their children in religious educational settings. At
the core of this search for educational compatibility is the concept of parental choice.
An elaboration on the concept of parental choice in the selection of educational settings
for their children is covered in some detail in the review of literature chapter. Suffice it to say
here that many factors go into decisions by parents as to the best educational setting for their
children. Beyond religious preferences, Molnar (1996) stated that considerations such as
proximity to the school, work schedules, availability of after school care, and extracurricular
activities get thrown into the mix. Also, the ability of parents to choose the best school for their
children requires more than the freedom to walk away from schools they don‟t like: they also
must be able to get their children into schools they like better.
The development of religious based educational institutions over time historically has
served two primary purposes. First, such institutions provide a means to sustain the particular
worldview of the sponsoring denomination. This is done through an immersion of its members in
the particular teachings, doctrines and ideology of the sponsoring denomination. Second, such
institutions provide parents with an alternative to public educational systems which do not permit
immersion into a particular religious orientation or doctrine.
An examination of the historical backgrounds of three religious educational institutions
will help to place the above discussion in context beginning with Catholic education, which
represents the largest faith-based school system in American society.

4
Catholic Education
According to the National Catholic Educational Association (NCEA, 2009), Catholic
education goes back deep into U.S. history- to at least 1606. In 1606, expressing their desire “to
teach children Christian doctrine, reading and writing” (p. 1, para. 2) the Franciscans opened a
school in what‟s now St. Augustine, Fla. Further north and a bit later, Jesuits instructed such
dedicated Native American students as Kateri Tekakwitha (1656-1680), who became a Catholic
in New York and taught Indian children in a Christian settlement near Montreal (NCEA, 2009).
By the latter 1600s English colonists had set up their own, publicly supported
schools. But since all the colonies were overwhelmingly Protestant, the
rudimentary education often had a heavily fundamentalist Protestant (if not
blatantly anti-Catholic) cast. Even in Catholic- founded Maryland, Catholics were
a minority, although with a bit more freedom, and in 1677, in Newtown, the
Jesuits established a preparatory school, mostly to instruct boys considered
candidates for later seminary study in Europe. The Newtown school eventually
closed, but the Jesuits opened another in the 1740‟s at Bohemia Manor, Md. Well
into the 18th
Century, however, more affluent parents often chose overseas
schools for their children, including girls dispatched to European convent schools.
Meanwhile the Catholic population continued to expand, reaching approximately
25,000 in Maryland, Pennsylvania, and New York State alone by about 1776. (p.
1, para. 3).
Through many more years (over 400 since the inception) of development and struggle,
Catholic education has grown to represent a formidable choice for many parents. Today, the
8,000 Catholic schools across the United States are regarded as a gift to the church and a gift to
the nation. Groom, professor of theology and religious education, wrote in the 1995
HarperCollins Encyclopedia of Catholicism, “Throughout history, there is no more compelling
instance of Catholic commitment to education than the school system created by the U.S.
Catholic community” (NCEA, 2009, p. 2, para. 5).
Moreover, Catholic education has long been characterized by a commitment to high and
appropriate standards in all aspects of the educational mission. The history of Catholic schooling

5
embodies a constant effort to promote academic excellence for a diverse group of students in an
environment permeated by religious values and beliefs. However, the mission and purpose of
Catholic schools is larger than attainment of academic competency. Commitment to the full
development of the spiritual as well as the academic potential of the student cannot be
compromised in a standards driven movement toward academic assessment (NCEA, 2009).
Lutheran Education
The impressive number and quality of schools that are supported by ELCA
(Evangelical Lutheran Church in America) congregations are testimony to the
many different strands and priorities of predecessor church bodies and the faithful
dedication of many individuals who very often work for substandard pay.
Lutheran schools have always had a prominent role in the Lutheran church.
(Kieschnick, 2006, p. 1, para. 1).
When Lutherans came to this country they often brought with them a
determination to educate the young using a curriculum that included religious
instruction. Henry Melchior Muhlenberg arrived in America in 1742 to assist the
scattered Lutheran churches and their schools, especially in Pennsylvania. In
addition to assisting with parish schools, Muhlenberg conducted one of the first
“charity schools” in Pennsylvania. St. Matthew Lutheran School (LCMS) was
established in New York City in 1752 (Kieschnick, 2006, p.1, para. 2).
The emphasis on parish schools was even greater among the Saxon Lutherans
who immigrated to the Midwest. Their goal was that every parish support a
school. So important were parochial schools to them that, when they organized
what is now The Lutheran Church-Missouri Synod (LCMS), “the establishment
and support of congregation parochial schools” was listed as one of the primary
purposes for the establishment of that Synod. (Kieschnick, 2006, p. 1, para. 3)
Though much smaller in number, Lutheran schools, similar to Catholic schools, have
continued to evolve over time. Kieschnick (2006) stated that today, congregation sponsored
schools are a massive, if often unnoticed, ministry in the ELCA. There are some 1,600 early-
childhood centers ministering to more then 100,000 children and their families and 275
elementary schools ministering to some 50,000 students.
Lutheran schools at all levels are probably the most ethnically inclusive agencies
in the ELCA. The percentage of non-Anglos goes up at each age level. Thus, the

6
non-Anglos in preschools total 13 percent, in elementary schools 24 percent, and
in high schools 33 percent. (Kieschnick, 2006, p. 3, para. 7)
Conservative Protestant Christian Education
Most schools falling in the conservative, Protestant Christian category of parochial
schools were founded between the mid-1960s and the early 1980s by evangelical and
fundamentalist Christians. (Private Schooling, 2009) Some scholars have argued that the
emergence of many of these schools coincided with the desegregation movement in the South
and evolved as an attempt to maintain a segregation status quo. The civil rights movement was at
its height in the 1960s and 1970s. Many parents for various reasons who did not want their
children to attend desegregated school systems opted out of public schools and selected schools
founded by evangelical, Christian fundamentalists.
The number of these private school institutions has been estimated as between 4,000 and
18,000, with an enrollment range from 250,000 to more than 1.5 million students. The best
estimates seem to be between 9,000 and 11,000 schools with a student population of
approximately 1 million (Private Schooling, 2009).
Many of the other faith-based schools not covered in this brief summary have similar
historical developments. Each faith-based/ religious based school system was created to promote,
transmit, and thereby preserve particular worldviews and theological perspectives. Paraphrasing
Lincoln (1971), each was created as a response to a need that was felt to be fundamental, and its
singularity is that it transcends time and circumstance, addressing itself to successive generations
of men and women.
In summary as expressed in the document, “Preserving a Critical National Asset” (2008-
09):

7
The United States has a long, proud tradition of faith-based K-12 education. Long
before the Declaration of Independence proclaimed America‟s emergence and the
Constitution guaranteed all citizens religious freedom, faith-based schools were
proliferating on these shores. To this day, faith-based schools remain an important
part of the American K-12 education landscape. According to the National Center
for Education Statistics, in the 2005-06 school year, there were more than 22,000
faith-based schools in operation- more than three times the number of non-
religious private schools. In fact, more than one of every six K-12 schools in the
United States is faith-based. As of the 2005-06 school year, these schools were
educating more than 4.1 million students, comparable to the entire population of
the state of Kentucky. (p. 2, para. 1 and 3)
Several integrative threads run through the historical backgrounds of private religious
educational institutions, the most prominent of which is the promotion of a particular theological
worldview. Another is the infusion of religious education into the curricula of private educational
institutions. A third is the perceived benefits of parents choosing a school consistent with and
supportive of their religious orientation.
The value of these various institutions over time within American culture has been
documented. However, in recent years another integrative thread or trend has begun to emerge.
This new development portends serious problems for religious schools. This new development is
a significant decline in overall enrollment patterns within faith-based schools. In affirmation of
this trend toward significant enrollment declines, particularly in urban faith-based schools, a
report entitled “Preserving a Critical National Asset” (2008-09) previously referred to the
following.
In total, since the 1999-2000 school year, the faith-based urban schools sector has
suffered a net loss of 1,162 schools and 424,976 students (Table 1). To put these
figures into perspective, closing every single public school in the Los Angeles
Unified School District (the second largest public school district in the Nation)
would be roughly equivalent to the net loss of faith-based urban schools during
this six year period. And the recent net loss of students suffered by faith-based
urban schools is greater than the entire enrollment of Chicago Public Schools, the
Nation‟s third largest public school district. (US Department of Education, 2008-
09, p. 8, para. 2)

8
Table 1
Cumulative Change in Numbers of Faith-based Urban Schools
and Their Students, by Religion: 2000-06
Religion Schools Students
Assembly of God -65 -13,435
Baptist -185 -44,927
Catholic -564 -257,756
Christian (no specific denomination) -69 -35,751
Episcopal -60 -25,461
Islamic 7 2,885
Jewish 50 6,566
Lutheran -41 -9,821
Pentecostal -71 -7,596
Seventh-day Adventist -71 -3,898
All other religions -93 -35,782
Total -1,162 -424,976
National Center for Education Statistics, Private School Universe Survey 1999-2000
And National Center for Education Statistics, Private School Universe Survey 2005-06.
The report goes on to state,
While sadly, this sector‟s deterioration has been going on for years, the sizable
losses suffered recently are particularly disturbing. A 2006 study noted the
quickening pace of closures between 2000 and 2005, arguing that a critical
“tipping point” has been reached. “The demographic changes that had been taking
place for more than five decades caught up with the most vulnerable of
campuses.” In fact, the number of schools lost during this six-year period was
approximately four times greater than the number lost during the previous decade.
Indeed, in a recent survey of diocesan superintendents, 97 percent said that it is
more challenging to finance schools than it was five years ago. It appears that the
accelerated rate of closures of recent years is far from an aberration; in fact, it
may foreshadow even more troubling times (US Department of Education, 2008-
09, p. 8, para. 3).
As seen in Table 1, among the many faith-based schools experiencing enrollment losses,
Seventh-day Adventist schools have had their share. It is within, or more appropriately, out of

9
this crucible of enrollment dilemmas facing Adventist schools that the focus of this research is
born.
This research was an attempt to ascertain the most significant factors contributing to
enrollment fluctuations, instability and enrollment declines in secondary educational institutions
operating within the Southern Union Conference of Seventh-day Adventist schools. Students are
the life blood of any educational system. Without them the reason or purpose for the existence of
such institutions becomes not only highly questionable, but in some situations may in fact spell
their demise.
If factors contributing to enrollment fluctuations, instability and particularly declines can
be clearly identified and prioritized, it then becomes possible to fashion intervention strategies
and corrective measures. These intervention strategies and corrective measures are designed not
only to stop the declines, but also stabilize and ultimately increase enrollment over time.
Cooper (2009) found that in 1950, for every 100 members, there were 26 students in
Seventh-day Adventist schools. By 2000, although the total number of students in Adventist
schools had surpassed the million mark, the ratio had declined to less than 10 students for every
100 members. Cooper states that though one must be cautious about expecting a direct
correlation between church membership and Seventh-day Adventist school enrollment, it is
nevertheless important to acknowledge.
Gregorutti (2008) reinforced Cooper‟s conclusions when he states that, while Adventist
church membership has grown in North America, enrollment in Adventist K-12 schools,
particularly by church members‟ children, has consistently declined since the 1980‟s.
An examination of enrollment data compiled by the Council for American Private
Education (Cape, 2009) is highly instructive. As can be seen in Table 2 below, the percent of

10
Seventh-Day Adventist children attending private schools was 1.6% during the 1989-1990
period. However that percentage dropped to 1.1% during the period of 2007-2008. Other
declines are seen among Catholic, Baptist, Lutheran, and Calvinist students.
Table 2
Where Do Private School Students Go To School?
1989-1990 2007-2008
Catholic 54.5% 42.5%
Nonsectarian 13.2% 19.4%
Conservative Christian 10.9 % 15.2%
Baptist 5.8% 5.5%
Lutheran 4.4% 3.7%
Jewish 3.2% 4.7%
Episcopal 1.7% 2.1%
Seventh-day Adventist 1.6% 1.1%
Calvinist 0.9% 0.6%
Friends 0.3% 0.4%
Source: National Center for Education Statistics (PSS Survey)
Anderson (2009) summarized the enrollment dilemma best in schools within the North
American Division (NAD) when he posited that:
In light of such statistics, the resulting stories coming from our schools are
predictably grim. Each successive school year brings word of yet another of our
approximately 1,000 NAD school campuses either struggling mightily to survive
or closing its doors altogether. Local school boards across the land meet late into
the night, trying to figure out how to deal with still further declines in enrollment.
Conference executive committees stare in despair as still another request for
hundreds of thousands of dollars in “special subsidy” comes rolling in from their
conference academy. And even some of our colleges, comparative giants though
they may be, are having their share of severe financial and enrollment crises. (In
fact, as I write this, one more of our longtime colleges is gearing up for a pivotal
meeting that will seriously consider the destiny of the school- as in whether or not
it will remain open). (p. 13)

11
Within the educational matrix of educational institutions K-12 parochial schools have
been hit especially hard by the recession. A classic case example is provided by what is
happening to parochial schools in the Silver Springs, Maryland area. Moore (2009) indicated that
“with more families holding tighter to their dollars in this economy, several county parochial
schools within the Silver Springs area are struggling, as parents pull their children out of tuition
based institutions and enroll them in public schools” (p. 1, para. 1). Moore further stated that
public school enrollments are going up and parochial school enrollments are going down. Annual
tuition in many of these parochial schools ranges between $4000.00 and $6710.00 per child with
a slight reduction if two or more children attend.
Still another example is what has happened in California. A report by Ed Source (2009)
indicated that:
For many years, about 10% of California‟s K-12 students enrolled in private
schools. However, private school enrollment began to decline in 2001-02 after the
economy experienced a downturn due to the dot-com crash. Although the
economy recovered before the latest recession, private school enrollment was
closer to 8% in 2007-08” (p. 1, para. 1).
In the meantime, students and their parents looking for alternatives to traditional public
schools have been increasingly choosing charter schools. Table 3 below shows K-12 enrollment
over time in California. As can be seen on Table 3, between the school years 1989-99 to 2007-08
enrollment in charter schools rose from 67,924 to 248,639.

12
Table 3
K-12 Enrollment over Time in California
Private Charter
Public
(noncharter) Total
1989-99 628,746 67,924 5,776,187 6,472.857
1999-00 640,802 99,048 5,852,564 6,592,414
2000-01 648,564 115,390 5,935,505 6,699,459
2001-02 635,719 132,909 6,014,466 6,783,094
2002-03 609,483 156,696 6,087,707 6,853,886
2003-04 599,605 164,808 6,133,961 6,898,374
2004-05 591,056 179,810 6,142,357 6,913,223
2005-06 594,597 199,916 6,112,187 6,906,700
2006-07 584,983 222,942 6,064,001 6,871,926
2007-08 564,734 248,639 6,026,830 6,840,203
Data: California Department of Education (CDE)
EdSource 6/09
Interestingly Milwaukee, Wisconsin has been recognized as one of the few places in the
country where the educational playing field has been at least partially leveled by a variety of
choice programs: a thriving charter school program: the parental choice program: and open
enrollment, a statewide program that allows students to transfer to other public schools within
the city (Covino, 2003).
One element of the Milwaukee Parental Choice Program, for example, is the largest
school voucher program in the United States, serving low-income families in religious and
nonreligious private schools. The program grew from 341 students in seven private schools in
1990-91 to 10,882 students in the 106 private schools in 2001-02. To be eligible for the
vouchers, families must be at or below 175% of the federal poverty level ($30,913 for a family
of four in 2001-02) and reside in the city of Milwaukee. Private schools that participate in the

13
program must agree to accept eligible students and use a random selection process when
applications exceed available space. (Caire, 2002)
The experience in Milwaukee was not unlike that of other school districts around the
country trying to implement schools of choice. Most opposition groups preferred to strengthen
existing public educational institutions rather than create alternatives. Fusarelli (2002) stated that
despite the appearance of widespread bipartisan support, increasing opposition to charter schools
is surfacing. Local teacher unions, public school administrators, and school districts in many
areas are openly hostile toward charter schools, erecting multiple obstacles to block efforts at
expanding and strengthening charter school laws.
Southern Union Conference
As stated previously, this research centers on an assessment of factors influencing student
enrollment within the Southern Union Conference of Seventh-day Adventist secondary schools.
The Southern Union Conference is one of nine unions (including Canada) which
comprise the North American Division of the World Church of Seventh-day Adventists. Housed
in the eight southern states that comprise the Southern Union, are more than 244,000 church
members and a wide multi-disciplinary organization of ministries and institutions. The eight
states which comprise the Southern Union are: North Carolina, South Carolina, Florida, Georgia,
Tennessee, Mississippi, Kentucky, and Alabama. (Southern Union Conference, May 2009)
Consistent with other parochial schools, secondary schools operating within the Southern
Union Conference of Seventh-day Adventist have not been immuned to fluctuations in student
enrollments. Secondary enrollment data compiled by the Southern Union Conference of Seventh-
day Adventist (2009) schools for the years 2004 to 2008 provide a mixed enrollment picture.
Some schools within the conference show marginal increases in enrollment, while other schools

14
show a steady decline in enrollment. In some instances schools show an increase in enrollment in
one year and a decrease the following year. Still other schools reflect very minor enrollment
variations and may be classified as steady state schools.
Ironically, at the secondary level, between the years 2004 to 2008, there was an increase
from 2,335 to 2,593 students enrolled in day and boarding schools combined. However, the
enrollment increases realized within secondary schools were not equally distributed among all
schools. In effect, increases in some schools offset decreases in other schools, thereby skewing
the true enrollment picture.
Table 4 represents the enrollment for secondary day and boarding academies within the
Southern Union Conference.
Table 4
Day and Boarding Schools Enrollment for Southern Union Conference
Day Academy Enrollment
SCHOOL YEAR AAA CA GAAA GMA MA MUA
2004-05 79 348 120 162 99 99
2005-06 72 374 137 160 100 90
2006-07 86 415 162 148 116 95
2007-08 122 406 177 158 120 85
Boarding Academy Enrollment
School
Year BA FA FLA GCA HHA HrA HA LA MPA
2004-05 122 82 612 240 25 36 121 40 150
2005-06 126 112 605 248 25 39 122 45 176
2006-07 103 152 654 251 20 32 122 44 146
2007-08 119 154 630 258 16 43 115 43 147

15
Specifically, of the six day academies (commuter campuses) that are part of this research,
four showed enrollment increases between the academic years 2004 to 2008. These four were
Atlanta Adventist Academy, Collegedale Academy, Greater Atlanta Adventist Academy, and
Madison Academy. Only two of the six day academies, Greater Atlanta Adventist Academy and
Madison Academy had a steady increase in student enrollment from 2004 to 2008. The
remaining four day academies fluctuated in enrollment over the time period, down in some years,
up in others.
Of the nine schools within the boarding academy category, five showed enrollment
increases between the academic years 2004 to 2008. These schools were Fletcher Academy,
Forest Lake Academy, Georgia Cumberland Academy, Heritage Academy, and Laurelbrook
Academy. Of these five schools which showed enrollment increases over the period of time, only
two had steady enrollment increases from 2004 to 2008. All other schools experienced
fluctuations in enrollment from year to year, sometimes up, sometimes down.
As stated, these data provide a mixed enrollment profile of the secondary schools within
the Southern Union Conference of Seventh-day Adventists. What is clear, however, is that the
only consistency in enrollment patterns among the secondary schools is their enrollment
inconsistency. These enrollment fluctuation patterns present a planning nightmare for both local
and regional school administrators.
In response to enrollment fluctuations within the Southern Union Conference, conference
administrators developed an initiative entitled the Adventist EDGE program. This was an
educational program designed for the comprehensive improvement of Adventist education Pre
K-12. One of the program initiatives was to achieve a 30% increase in enrollment by the year
2010, along the continuum of Pre K-12. This research focused only on secondary schools within

16
the Southern Union Conference. Within the secondary schools, between 2004-2008, enrollment
increased by only 258 students, as compared to an increase of 700 students which would have
met the 30% target goal.
Three educational strategies constitute the Adventist EDGE initiative.
1, Redesigning education in the Southern Union by changing the focus of classroom
teaching from a teacher/ textbook centered method to a student centered approach,
taking into account the various learning styles of every student;
2. Redouble efforts by conference leaders, members and pastors to touch every person
in the Southern Union with the good news of the saving power of Jesus and his
second coming; and
3. Promote the union‟s lay evangelism goals of spiritual growth, community
involvement, personal witness, city outreach, church planting, evangelistic
programming and media ministry.
Within the above three articulated strategies both for increasing enrollment in Southern
Union schools, and stabilizing enrollment, the implied reasons for enrollment fluctuations, and in
some cases declines, can be accounted for and addressed if these strategies are successfully
implemented. This deduction assumes that other possible causative factors such as personal
relationships and finances, (Araya, 1991), issues of safety and caring teachers, (Hunt, 1996), and
lack of commitment and distance to schools, (Fink, 1989) among others, have no relevance.
To this point Baldwin (2001) asserted that recruitment concerns Adventist education
from the elementary to higher education levels. Enrollment numbers are the lifeblood of an
institution‟s growth, a necessity for continual development of staff, technology, and facilities. In
many cases, the school‟s budget is held hostage to the dictates of a particular year‟s enrollment.

17
Reinforcing Baldwin‟s assertion is the insight provided by Bartlett (1982). Bartlett states that
among the cacophony of voices heard by the academy principal is that of the board of directors
emphasizing the importance of enrollment. Unless the principal is personally attuned to the need,
it is easy to allow this voice to be drowned out by other needs and responsibilities such as
curriculum planning, academic leadership, discipline, finance, plant construction, maintenance,
personnel, and student labor. Bartlett (1982) continues by stating that it is easy to rationalize that
if these are done well, enrollment will take care of itself or that enrollment is a responsibility of
the conference director of education, the conference youth leader, or the church pastors.
Since student enrollment drives everything in the system, if enrollment instability isn‟t
interrupted, fluctuations stabilized and enrollments ultimately consistently grown, the efficacy of
maintaining a secondary educational program within the region, and in some schools in
particular, would appear to be in jeopardy.
In summary, it is essential for relevant stakeholders and critical decision makers to get a
handle on factors influencing enrollment in Seventh-day Adventist schools. But how is the real
question. The how must be rooted in the why. To the extent that this study can shed some light
on the “why” it may provide a sound basis for mounting a campaign to address an increasingly
serious problem.
Metaphorically, students are to schools as engines are to cars. They are the driving force
for why schools exist. A steady increase in student enrollment, even marginally, is a good
indicator of sustainability. The converse is equally true, enrollment declines, if not interrupted
will eventually spell doom for both day schools (commuter campuses) and boarding schools so
affected.

18
Research Focus
This research focused on 15 day and boarding schools operating in the Southern Union
Conference of Seventh-day Adventist. The Southern Union Conference was chosen because the
researcher served as Principal in one of the secondary schools within the Southern Union
Conference. However, in order to minimize bias, the particular academy for which the researcher
was Principal was excluded from this study. For purposes of definition and distinction day
schools are essentially non-residential commuter institutions and boarding schools are
residential-live in institutions.
Research Question
The guiding question for this research was what are the most salient factors leading to
enrollment instability and fluctuations and in particular declines in secondary schools within the
Southern Union Conference of Seventh-day Adventists? Based upon these findings an
intervention strategy was developed in order to address the problem and presented to relevant
stakeholders for appropriate decision making.
Survey data for this research were obtained from stakeholders within the secondary
educational systems of the Southern Union Conference of Seventh-day Adventists. Survey
stakeholders were defined as those people whose actions and decisions have a direct bearing on
secondary school enrollment. These stakeholders were: students, pastors, parents (Adventist
parents with children attending Adventist schools, and Adventist parents with children not
attending Adventist schools), teachers, school board members, conference administrators, and
school administrators.

19
Research Design
Considerable research has been conducted on factors which contribute to enrollment
trends across educational institutional types. Although this study was specifically focused on
secondary enrollment instability and fluctuations and had a particular emphasis on enrollment
declines within the Southern Union Conference of Seventh-day Adventist schools, it was useful
to examine enrollment factors across institutional lines as these provided some insights into
Adventist enrollment patterns. As such the literature review chapter covers not only Adventist
specific enrollment findings, but also charter, public and private schools.
Drawing on the results of previous research (literature review) and allowing for a write in
section, factors identified for declining enrollment within the Southern Union Conference of
Seventh-day Adventist, as well as cross institutional patterns, were extrapolated. These factors
were compiled without regard for rank order, so as not to pre-influence how stakeholders chose
to rank order the factors.
Once the extrapolation process was completed, a questionnaire was developed listing all
of the identified factors and sent out to secondary representatives of each stakeholder group
within the eight state Southern Conference region. In the first iteration of the questionnaire,
secondary stakeholders were asked to rank the pre-identified factors in order of most significant
or influential to least significant or influential using a numerical value system.
The results of the first questionnaire iteration were analyzed using a percentage clustering
format and the top factors were deduced from the analysis. Once this process was completed, a
second iteration of the questionnaire was sent back to the initial respondents with a request to
rank order the highest percentage causative factors. The results were then analyzed and a final
rank-order deduced. When this phase was completed, the results were analyzed and intervention

20
strategies developed which were shared with administrative representatives from the Southern
Union Conference.

21
CHAPTER 2
LITERATURE REVIEW
Introduction
For purposes of historical perspective, the introductory chapter of this research included
select histories covering the origins of some faith-based K-12 institutions. In addition, attention
was given to dilemmas facing faith-based schools currently with particular emphasis both on
institutional losses across denominational lines as well as substantial losses in student
enrollments. (See Table 1) The point being made is that though this research is primarily
concerned with enrollment losses within secondary schools operating within the Southern Union
Conference, institutional and corresponding enrollment losses across faith-based institutional
lines portend significant, if not grave concerns.
This conclusion is especially important given the historical and current role faith-based
institutions play in the education of America‟s youth. The researcher is reminded here that only a
few years ago, many argued that there was no longer a need for historically Black colleges and
universities (HBCUs). The rationale was that desegregation had opened up higher educational
opportunities for all youth, independent of race, and therefore support to HBCUs was no longer
required (Lincoln, 1971). The counter argument was that HBCU‟s served a special and unique
role in American higher education and should not only be preserved, but also enhanced.
Similar affirmative arguments can be made for and about faith-based K-12 institutions.
Without question enrollment trends and patterns within and between faith-based K-12
institutions are key ingredients for not only survival, but also sustainable quality over time.
Keeping in mind that the focus of this research is specific to enrollment declines and
fluctuations within secondary schools operating in the Southern Union Conference of Seventh-

22
day Adventist, a portion of this literature review will focus on public schools, charter schools and
private/parochial schools other than Seventh-day Adventist institutions. This is necessary and
important because Adventist schools do not operate in a vacuum. They are part of a much larger
national educational consortium of schools and as such both influence and are influenced by
events, challenges and opportunities thereto appertaining. This interconnectedness is expressed
quite succinctly by Hargreaves and Fink (2006) who cited Powell, Edwards, Whitty, and
Wigfall, 2003 and Wells, 2002, stating that:
The fates of schools are increasingly intertwined. What leaders do in one school
necessarily affects the fortunes of students and teachers in other schools around
them; their actions reverberate throughout the system like ripples in a pond. As
exemplary or high-profile institutions draw the most outstanding teachers and
leaders, they drain them away from the rest. For every magnet or lighthouse
school that attracts most of the local resources and attention, dozens of
surrounding schools may operate like outhouses-low-status places in which
districts dump their difficult students and weaker staffs. The more schools
systems run on the market principles of competition and choice, the tighter these
interconnections become. (p. 1, para. 1)
Additionally, a considerable portion of enrollment literature focuses on K-12 enrollment
trends and patterns as a continuum. In effect K-8 enrollment patterns are viewed as a precursor to
high school enrollment patterns. Thus impact deductions can be made from reviewing the K-12
continuum.
As can be seen, major attention is given to research specific to Seventh-day Adventist
enrollment trends and patterns. The extrapolations from these research studies combined with
those associated with other educational institutions provide the basis for identifying the initial list
of factors to be used in construction of the first research questionnaire for respondents.
A starting point for this review of literature chapter is a National Center for Educational
Statistics (NCES; 2009) report put out in answer to the question, what are the enrollment trends
in public and private elementary and secondary schools? As can be seen in Table 5 below, except

23
for minor aberrations between the years 2003-2008, elementary schools have shown steady
increases in enrollment and are expected to continue these increases through 2017. Similarly,
public school enrollment in the upper grades rose from 11.3 million in 1990 to 15.1 million in
2006. NCES projects that public secondary enrollment will show a decrease of 3% between the
years 2006-2011 and then increase again through 2017.
In contrast the percentage of students in private elementary and secondary schools
declined from 11.7% in 1995 to 11.0% in 2005. In 2008, a projected 6.1 million students were
enrolled in private schools at the elementary and secondary levels. Between 2008 and a NCES
projection to 2017, the number of students in grades 9 through 12 is expected to decrease from
1,372,000 to 1,290,000. This expected decrease in ninth through twelfth grade enrollment
portends a substantial enrollment impact for private secondary institutions including, at least
potentially, Seventh-day Adventist day and boarding schools.

24
Table 5
Enrollment in Elementary and Secondary Schools, by Level and Control of Institution: Selected
Years, Fall 1970 through Fall 2017 [In thousands]
Public Private1
Year Total Total
Grades
Pre K-8
Grades
9-12 Total
Grades
Pre K-8
Grades
9-12
1970 51,257 45,894 32,558 13,336 5,3632 4,052
2 1,311
1980 46,208 40,877 27,647 13,231 5,3312 3,992
2 1,339
1985 44,979 39,422 27,034 12,388 5,5572 4,195
2 1,362
1990 46,864 41,217 29,878 11,338 5,6482 4,514
2 1,134
2
1995 50,759 44,840 32,341 12,500 5,9182 4,756
2 1,163
2
2000 53,373 47,204 33,688 13,515 6,1692 4,906
2 1,264
2
2001 53,992 47,672 33,938 13,734 6,3202 5,023
2 1,296
2
2002 54,403 48,183 34,116 14,067 6,2202 4,915
2 1,306
2
2003 54,639 48,540 34,202 14,338 6,0992 4,788
2 1,311
2
2004 54,882 48,795 34,179 14,617 6,0872 4,756
2 1,331
2
2005 55,187 49,113 34,205 14,908 6,0732 4,723
2 1,350
2
2006 55,394 49,299 34,221 15,078 6,0953 4,711
3 1,384
3
20073 55,710 49,644 34,589 15,055 6,066
2 4,681
2 1,385
2
20083 55,879 49,825 34,903 14,922 6,054
2 4,681
2 1,372
2
20093 56,116 50,067 35,240 14,826 6,049
2 4,695
2 1,355
2
20153 59,127 52,910 37,711 15,199 6,217
2 4,976
2 1,241
2
20163 59,786 65,503 38,052 15,451 6,283
2 5,021
2 1,262
2
20173 60,443 54087 38,399 15,689 6,356
2 5,066
2 1,290
2
Source: U.S. Department of Education, National Center for Education Statistics (2009). Digest of Education
Statistics, 2008 (NCES 2009-020), Chapter 1.
1Beginning in fall 1980, data include estimates for an expanded universe of private schools. Therefore direct
comparisons with earlier years should be avoided. 2 Estimated.
3 Projected.
Much of the aforementioned enrollment data can be accounted for in part by major
demographic changes in society. These demographic changes reflect not only the impact of the

25
baby-boom generation, but also multiethnic, multicultural and multilingual changes. Sack-Min
(2008) affirmed this conclusion when she stated that “More students will attend U.S. public
schools than ever before, with record setting enrollments being driven by immigration and the
nation‟s growing diversity” (p.1, para.1).
Portman (2009) stated that
Currently, U.S. public schools are filled with student populations that are
“multiethnic, multicultural, and multilingual” (Holcomb-McCoy & Chen-Hayes,
2007, p.75). According to the U.S. Census Bureau (2000) reports, in the 1990s,
racial and ethnic minorities made up 80% of the nation‟s population growth. In
the 2000s, there were roughly 87 million people of minority backgrounds living in
the country, corresponding to a 43% increase from the 1990 population data
(Roseberry-McKibbin, Brice, & O‟Hanlon, 2005). An examination of the U.S.
Census Bureau reports during the past 20 years indicates that the White, non-
Hispanic population grew by 7.6 % because the population of individuals from
racial minority backgrounds grew by more than 90%. (p. 1, para. 3)
Singh (2009) placed the aforementioned demographic data into its impact on Adventist
specific education.
Were the English language learners (ELLs) population homogeneous, the
challenge to meet their learning needs would be big enough; however, given their
great diversity, the challenge is enormous. ELLs in American schools come in
almost endless variety, with shades of differences within primary categories-age,
primary language, culture, years in the country, socio-economic status, parental
support, and level of English proficiency-plus a small percentage who have
identified learning disabilities. To find ways to meet ELLs‟ learning needs, to
create ELL-friendly classrooms, and to successfully incorporate ELLs into
mainstream classrooms are the ever-present challenges to teachers and school
administrators. Since the trend points toward increasingly multicultural
classrooms, it is imperative that educators find effective strategies to teach these
students. (p. 4)
Additional efforts by the Adventist educational system to successfully incorporate
students from multiethnic, multicultural and multilingual backgrounds can be found in the
writings of Campbell et al., 2009; Carrigan, 2009; Gilkeson, 2009; Greig & Bryson, 2009; Kim,
2009; Lambert, 2009; Salazar, 2009; Wahlen, 2009.

26
What is emerging is that enrollment patterns whether public or private are influenced by
multiple factors. These multiple factors are inclusive of, but not limited to, the impact of the
baby-boomer generation, immigration, as well as parental perceptions of quality of education and
costs among others.
Charter Schools
Another national trend affecting enrollment patterns in American K-12 education is the
growth of charter schools. Robelen (1998) pointed out that the dramatic growth of the charter
school movement in the United States has quickly placed this new brand of school reform
prominently on the public education map.
Fusarelli (2002) defined a charter school as an autonomous publicly funded entity that
operates on the basis of a contract between the group that organizes the school and a sponsor,
usually the local school district or state education agency. Fusarelli further explained that the
charter specifies how the school is to be operated and the educational outcomes by which it is to
be judged.
What exactly is the appeal of charter schools? First, public schools throughout the United
States have been consistently looking for ways to improve the educational achievement of their
students and maintain a competitive advantage over other educational options. Whitte, Schlomer,
and Shober (2007) posited that charter schools, first created in Minnesota in 1991, became an
option for public school districts in Wisconsin in 1993. Charter schools can potentially free their
administrators from many of the state regulated mandates on schools that charter proponents
argue drag down the overall level of instruction that can be offered in traditional educational
settings. (Whitte, Schlomer, & Shober, 2007)
Second, according to Fife (2008):

27
The charter school movement is part of a national trend that emphasized more
choice elements in public education in the 1990s that still continues in the first
decade of the twenty-first century (Spring 2005). By way of illustration, charter
school legislation was initially created in Minnesota in 1991. Since then, all
states, including the District of Columbia, have done the same with the exception
of Alabama, Kentucky, Maine, Montana, Nebraska, North Dakota, South Dakota,
Vermont, Washington, and West Virginia. (p. 1, para. 2)
Third, Kennedy (2002) indicated that charter schools can be created in different ways,
overseen by a variety of organizations, have various philosophies and academic focuses, and can
be found in all types of facilities. Kennedy concludes by outlining the characteristics of
successful charters as identified by Patsy O‟Neill, executive director of the Charter School
Resource Center of Texas. These specific characteristics are: strong governance structure,
rigorous curriculum, stable faculty and staff, extended-day schedule or after-school programs,
high parental involvement, and financial and academic accountability. These same characteristics
can be translated into why parents may choose charter schools over traditional K-12 schools.
These factors not withstanding choice appears to be a major cause in parents opting for charter
schools over traditional K-12 public schools.
Molnar, (1996) in an article entitled, “Charter Schools: The Smiling Face of
Disinvestment” offered three particularly instructive insights. “First, everyone, it seems, loved
charter schools” (p. 1, para. 1). Time magazine has called them the “New Hope for Public
Schools” (Wallis 1994). The New Democrat, the Democratic Leadership Council‟s journal, says
charter school advocates are “Rebels with a Cause” (Mirga 1994). And The New York Times (in
an unusual note of irony) calls them the “Latest „Best Hope‟ in U.S. Education” (Applebome, as
cited in Molnar, 1996)
American Federation of Teachers President Albert Shanker launched the movement
when, in a 1988 National Press Club speech, he called for empowering teachers by creating

28
charter schools that focused on professional development and had a clear commitment to
improving student achievement (Sautter, 1993). Since then, the rise of charter schools to the top
of the educational reform agenda has been spectacular (Molnar, 1996).
To many educators, parents, and politicians, the charter school idea represented a public
education alternative to private school voucher proposals. It was an idea they could embrace
enthusiastically because it seemed to protect public education as an institution and at the same
time provide for fundamental reform and systemic restructuring (Molnar, 1996).
Buckley and Schneider (2006) stated that existing research, without exception, has found
that parents are more satisfied with schools they have chosen. Perhaps the strongest explanation
for this finding is allocative efficiency (i.e., education is a complex, multifaceted good) and
choice allows parents to select schools that emphasize the kind of education they want for their
children (Schneider, Teske, & Marschall, 2000).
An expansion on the aforementioned concepts of charter schools is provided by Nathan
(1998). Nathan stated that the charter idea, as it has evolved, has a number of defining
characteristics. These are as follows:
Allows the creation of new public schools or the conversion of existing ones;
Stipulates that the schools be nonsectarian and prohibits admissions tests;
Requires that these schools be responsible for improved student achievement over a
period of three to five years or be closed;
Waives most state rules and regulations, along with local contract provisions, in
exchange for explicit responsibility for results;
Permits several public bodies- such as state and local school boards, universities, and
city governments- to authorize creation of charter schools;
Permits educators and families to select these schools, rather than being assigned to
them; and

29
Requires that average per-pupil funding follow students to the schools, along with
other appropriate funds such as Title I and special and compensatory education funds.
The charter school movement is less than 20 years old and considerable controversy
continues to exist. This controversy surrounds their usefulness and effectiveness. Approximately
one million students attend charter schools nationally which represents about 1% of all students
attending K-12 institutions.
Issues surrounding charter schools range from conclusions that for-profit educational
management organizations (EMOs) running charter schools can have both positive and negative
effects on low-income and minority enrollment depending on EMO type and urban location
(Lacireno-Paquet, 2006), to the value of state university roles in the charter school movement
(Metcalf, Theobald, & Gonzalez, 2003), to the infusion of choice and vouchers (Caire, 2002), in
the public education domain.
No effort is made here to draw any final conclusions on the merits of charter schools,
however, like any other new paradigm; they must successfully challenge the prevailing paradigm
of traditional K-12 education.
As noted by Condeluci (1995):
In understanding paradigms, it is important to note that prevailing paradigms are
not threatened until new approaches are found to be successful. Kuhn called these
new approaches anomalies. These are actions with roots outside the existing
paradigm that are found to work. Most often, these anomalies are approaches
developed by entrepreneurs and targeted to the most difficult of paradigm
challenges. As these anomalies are found to be successful, they begin to threaten
the existing paradigm. (p. 43)
What can be said is that each new K-12 paradigm added to the national consortium of K-
12 institutions, based on the theory of interconnectedness, (also known as Systems Theory) will
in some measure affect and be affected by what currently exists in private/parochial and public
K-12 educational institutions. When one million plus students are removed from existing

30
institutions, there is no question of enrollment impacts throughout all systems (Buckley &
Schneider, 2006; Grimes, 1994; Howell, 2006; Nathan, 1998; Zimmer & Buddin, 2007).
Private Education
It would appear fitting that any discourse on private education would be introduced by
quoting the rationale for its existence as articulated by the Council for American Private
Education (CAPE 1990 modified 1997). Specifically,
Private schools, by definition, help fulfill the ideal of pluralism in American
education. America‟s first schools were private schools established in the early
17th
century. Today, one in four of the nation‟s elementary and secondary schools
is a private school; eleven percent of all K-12 students attend them. These schools
are continuing to flourish and are identified by strong statements of mission and
purpose. They are religious and secular, large and small, urban and rural. They
serve diverse populations, and are multi-ethnic and multi-cultural. Almost all vest
the school‟s principal with the authority and the ability to implement change.
Faculty, parents, and when appropriate, students, are actively engaged in the
decision-making process. A sense of common community and common goals and
an emphasis on values pervade these schools. The goals of private schools include
academic excellence, meeting the needs of individual students and families, and a
concern about the social, moral, spiritual, emotional, physical and intellectual
development of each child. (p. 1, para. 1)
It is stipulated in this research that the classification, private school, encompasses
religiously-affiliated schools. The Council for American Private Education (CAPE) (2009) using
data compiled by the National Center for Education Statistics (NCES) has summarized key facts
about private K-12 schools.
Among these key facts are the following:
Pre K-12 enrollment in 2009 was 6,049,000 or 11% of all U.S. students.
During the year 2007-2008 there were 33,740 private schools or 25% of all U.S.
schools.
Most private school students (81%) attend religiously affiliated schools.

31
Most private schools are small (e.g., 86% have fewer than 300 students; See Table 1
in Chapter 1).
Additionally, CAPE (2009) reported that students attending private schools (grades 4 &
8) on average consistently scored better on national achievement tests in math and reading. In
one survey, parents, when asked the question, “In your local area, is it the public schools or the
private schools that generally provide a better education?” 52% indicated private schools and
19% indicated public schools. In answer to the question, “Which type of institution did a better
job teaching academic skills?” parents indicated that private schools did a better job 53% to 20%.
In answer to the question, “Which type of institution did a better job maintaining discipline and
order?” the response was 74% to 9% in favor of private schools. Only on the question, “Which
type of institution did a better job teaching students to get along with people from different
backgrounds?” parent responses were evenly distributed (38% to 38%).
The belief that both public and private schools were felt to do equally well in teaching
students to get along with people from different backgrounds is perhaps not so surprising in light
of the fact that public schools are increasingly experiencing the influx of student populations that
are multiethnic, multicultural and multilingual. It is essential to find effective ways and means to
integrate these students not only into the system, but also equip them with respectful
interpersonal relationship skills. Most private schools are small with an average of 300 students,
and though many have students of diverse multiethnic, multicultural and multigenerational
backgrounds, on proportionality alone, the challenge is unequal.
Under the heading “Efficiency of Public and Private Schools,” Goldhaber (2002) after
reviewing numerous studies, concluded that private school students in general, out perform their
public school counterparts on standardized tests, and they are more likely to graduate from high

32
school and attend college. Goldhaber stipulates, however, that positive private school effects
have tended to be found predominately for minority students in urban settings. There is,
however, mixed evidence about whether this is an effect of the schools they attend or a result of
student factors, such as family background.
Grimes (1994) reported that the success of private education has been based on a wide
variety of factors. He stated that the most important of these factors include the demand for
religious education and training, the perceived social status and externalities associated with
private educational institutions, and the popular perception that private schools provide a higher
quality service than public schools.
At this point, the question becomes, what differences or deductions can be drawn from
the literature to ferret out factors influencing enrollment trends and patterns across institutional
lines? In no order of priority or importance, the following factors have emerged:
Public school enrollment is going up as fewer parents are able to afford the cost of
private schools. According to the United States Department of Labor Statistics, the
unemployment rate in the United States in August of 2010 was 9.6%. Among this
number, some people have been out of work for over 14 months. People falling in this
category are known as “99ers”. As a consequence, families have had to make tough
economic choices. One choice has been to remove their children from private schools
and enroll them in public schools which are essentially free or at least substantially
less costly than private, tuition based schools.
The introduction of more educational options, i.e. magnet schools and charter
schools, as alternatives to traditional public K-12 schools, have impacted private
school enrollment;

33
Demographic trends, particularly immigration, have created an influx of multiethnic,
multilingual, and multigenerational students into K-12 systems, thereby elevating the
issue of diversity and its impact;
Parental perceptions of the quality of education received by their children is a critical
determinate in choice of school;
Size of schools, thus size of classes may bear heavily on the amount of individualized
attention students receive. The average enrollment in private schools is 300 as
compared to public schools which are often in the thousands;
Many parents are looking to religious education and training as part of the K-12
experience.
These factors will now be integrated with Seventh-day Adventist K-12 enrollment trends and
patterns as requisite to identifying the range of variables specifically impacting secondary
enrollment declines within the Southern Union Conference.
Adventist Specific Literature Review
This section is introduced by returning to the insights or perhaps more appropriately, the
laments of Anderson (2009) in his treatise, “How to Kill Adventist Education.” In response to
declining student enrollments among the 1,000 North American Division school campuses of
Seventh-day Adventist, he wrote:
In the face of such problems, many of our school boards and staff members have
taken heroic measures to right their respective ships. But honesty demands a
painful admission: More often than not, in spite of our best efforts, the decline has
continued. And the lack of progress has led many of us to give up, plop down in
one of the deck chairs on our educational Titanic, and speak wistfully of the good
old days when our schools (and perhaps even our coffers) were full. Too often we
are a people both tired and grieved, waiting for the inevitable vortex of death to
suck us down. (p. 13)

34
The concerns expressed herein by Anderson are reverberating throughout the Seventh-
day Adventist community nationally and specifically within the Southern Union Conference. As
previously stated, so concerned are administrators and church leaders about enrollment
fluctuations and declines in K-12 institutions in the Southern Union, that an aggressive
recruitment strategy has been devised. This strategy is referred to as The Adventist EDGE and is
designed to increase enrollment by 30% by the year 2010.
The justification for the concerns within the Southern Union Conference of Seventh-day
Adventist educational institutions are borne out in substantial measure in Table 6 below. Table 6,
entitled, Academy Enrollment in the Southern Union shows that in the year 2000, 2,438 students
were enrolled in schools across the Southern Union. By the year 2004, the number of students
enrolled decreased to 2,373.
Table 6
Academy Enrollment in the Southern Union Conference
Year Student Enrollment
2000 2,438
2003 2,380
2004 2,373
It could be asked, why is such a small decrease between the years 2000 and 2004 cause
for alarm? For one, decrease in enrollment is not a good indicator of either viability or
sustainability. But more importantly, one would assume that as membership in Seventh-day
Adventist church communities increase, there would be a corresponding proportionate increase

35
in student enrollment within Seventh-day Adventist schools. The converse is the case. (See Table
7.)
Table 7
Membership Growth and SDA School Enrollment
Year Membership Growth SDA School Enrollment
1950 756,812 148,144
2000 11,687,229 1,056,090
Table 8 entitled, Academy Enrollment in NAD (North American Division), illustrates
that between the years 1979 and 2003, the number of secondary schools increased from 97 to
110. At the same time, enrollment declined from 18,563 in 1979 to 15,334 by 2003.
Table 8
Academy Enrollment in NAD (North American Division)
Year Student Enrollment Number of Secondary Schools
1979 18,563 97
2003 15,334 110
Though these data cover all of the North American Division of Seventh-day Adventists,
there is a direct impact on the Southern Union Conference. Table 9 shows a significant decrease
in the average number of academy students enrolled. In 1979 there were 197 students enrolled.
By the year 2003 the average number of students enrolled decreased to 139.

36
Table 9
Average Academy Enrollment in the North American Division
Year Student Enrollment
1979 197
2003 139
Within the Southern Union Conference, the average student enrollment in both day and
boarding schools fell below the national enrollment average of 139 students. Two schools within
the Southern Union Conference, Collegedale Academy and Forest Lake Academy did not
comport with the national trend. These two schools have been excluded from Table 10 below.
Table 10
Average Enrollment for Day and Boarding Schools
Within the Southern Union Conference
School Year
Average Day
School Enrollment
Average Boarding
School Enrollment
2004-2005 112 123
2005-2006 112 112
2006-2007 121 108
2007-2008 132 112
Source: Analysis of the Day and Boarding Schools Enrollment for Southern Union Conference taken from Table 4.
Factors influencing enrollment fluctuations and particularly enrollment declines in
Seventh-day Adventist schools are multifaceted in nature. Adventist literature is replete on the
subject giving added credence not only to the significance and import of the subject matter, but
also and perhaps most importantly, added credence to the need to find successful solutions to the
problem.

37
Gregorutti (2008) reviewed over 19 studies, both nationally and internationally relative to
factors influencing Adventist enrollment. As a result Gregorutti inferred that Adventist
enrollment is affected by the following set of beliefs, perceptions, and factors:
1. Parents’ perceptions. Several studies have pointed out that limited
curriculum, staff, and amount of available involvement were among the
reasons for withdrawal; however, at the same time, parents seemed to agree
that Adventist education is very good. Perceptions about teachers‟ and
administrators‟ training and qualifications are mixed and in some cases might
negatively affect enrollment. Perceptions of spiritual environment, such as
teachers and school climate, were considered important factors in the decision
to enroll children at Adventist K-12 schools.
2. Identification with Adventist education. Parents exposed to Adventist
education tended to send their children to an Adventist K-12 school. Also,
having both parents Adventist increased the probability of a child being
enrolled at an Adventist school. A paradoxical situation was observed that
effected enrollment. Namely, parents had a tendency to agree that Christian
education is good as a conviction rather than a preference, since many of them
did not enroll their children at Adventist schools.
3. External factors. Whether in international or national settings, distance and
cost of tuition were the most cited and influential factors affecting enrollment.
For most K-12 students, distance is a very difficult obstacle to overcome, as
was analyzed and demonstrated in the majority of the studies. Beyond a
certain distance, parents tended to hesitate to enroll their children in or tended
to withdraw their children from Adventist schools.
4. Promotional factors. Greater availability of information through pastors,
teachers, and church leaders, especially to newly converted parents, would
improve enrollment rates.
5. Church leadership. Pastors and church leaders perceived themselves as
cooperative and supportive of Christian education; however, some parents saw
these leaders as less supportive, which negatively impacted enrollment. (p. 7)
Though Christian education for parents is an important consideration for enrolling their
children in Adventist schools, Christian education in and of itself is insufficient to make the final
enrollment decision. More is needed. Baldwin (2001) stated that
One way to increase the number of students attending your school is through the
effective use of extracurricular activities. Putting it simply: Students recruit

38
students. But what is the most effective approach? Although academics, caring
staff, location, campus amenities, and spiritual tone all play important roles, one
of the best enticements for prospective students is extracurricular activities.
Whether or not prospective students are actively involved in the specific activity,
they will see the best a school has to offer. There are many options: sports, drama,
music, ministry teams, etc. (p. 32)
In 1982, Bartlett (1982) stated that school enrollment will rise and fall in direct
proportion to the amount of personal contact with parents and students. The clear inference here
is that the less personal contact had with parents and prospective students, the more likely that
schools other than Seventh-day Adventist will be chosen.
Brown (2001) reinforced the importance of personal contacts, especially when trying to
recruit for boarding academies. He stated that research and experience have shown that the more
personal the strategy, the more effective the persuasion.
Rasi (2000) inferred that enrollment declines in many instances can be traced directly to
the degree to which Adventist schools have a clear statement of mission; the level of
commitment of administrators, teachers and support staff; projection of a positive image; and the
level of supportive alliance with the local church families and leaders.
Stevenson (2001) suggested that the lack of an effective recruitment strategy operating
within K-12 Adventist schools is at the heart of enrollment struggles. He concludes with the
notion that with a concerted effort, most schools can increase their enrollment, but it takes
organization and a systematic approach.
On the international scene Lekic (2005) investigated perceptions and attitudes toward
Adventist schools in Canada. He found that for Adventist parents, the top three reasons for
sending children to church schools were spiritual focus a safe and caring environment, and
dedicated school personnel. For non-Adventist parents, the three main reasons were a safe and
caring environment, high-quality academics, and spiritual focus. Adventist parents who did not

39
send their children to church schools gave the following reasons; distance from home, high cost
of tuition, and lack of high-quality academics.
In the area of tuition costs, it is instructive to examine the costs associated with the fifteen
day and boarding schools comprising this study. These data are provided in Table 11. As can be
seen, the cost to attend day schools ranges $591 to $866 per month. In the case of boarding
schools, the range is $925 to $1815 per month. In a time of severe economic uncertainty and job
instability, these costs may indeed be a contributing factor both in terms of not enrolling youth in
Adventist schools or pulling them out in favor of less costly alternatives.
Table 11
Tuition Costs for Secondary Schools in the Southern Union Conference
Day Schools Tuition Cost Per Month (Approximate)
Atlanta Adventist Academy $866
Collegedale Academy $638
Greater Atlanta Adventist Academy $475
Greater Miami Academy $670
Madison Academy $750
Miami Union Academy $591
Boarding Schools Tuition (Approximate) Room & Board (Approximate)
Bass Academy $740 $550
Fletcher Academy $722 $500
Forest Lake Academy $1,815
Georgia Cumberland Academy $911 $698
Harbert Hills Academy $1,200 (books, tuition, room & board)
Heritage Academy $925
Highland Academy $1,557
Laurelbrook Academy $1,190
Mt. Pisgah Academy $810 $620
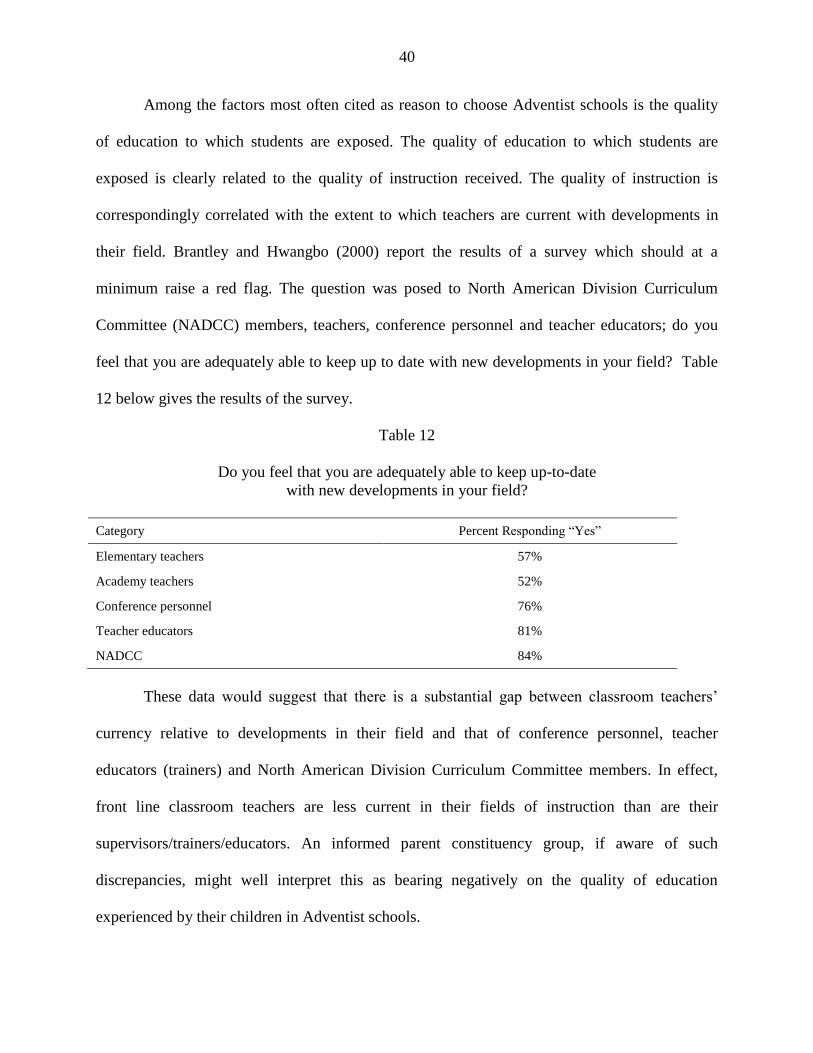
40
Among the factors most often cited as reason to choose Adventist schools is the quality
of education to which students are exposed. The quality of education to which students are
exposed is clearly related to the quality of instruction received. The quality of instruction is
correspondingly correlated with the extent to which teachers are current with developments in
their field. Brantley and Hwangbo (2000) report the results of a survey which should at a
minimum raise a red flag. The question was posed to North American Division Curriculum
Committee (NADCC) members, teachers, conference personnel and teacher educators; do you
feel that you are adequately able to keep up to date with new developments in your field? Table
12 below gives the results of the survey.
Table 12
Do you feel that you are adequately able to keep up-to-date
with new developments in your field?
Category Percent Responding “Yes”
Elementary teachers 57%
Academy teachers 52%
Conference personnel 76%
Teacher educators 81%
NADCC 84%
These data would suggest that there is a substantial gap between classroom teachers‟
currency relative to developments in their field and that of conference personnel, teacher
educators (trainers) and North American Division Curriculum Committee members. In effect,
front line classroom teachers are less current in their fields of instruction than are their
supervisors/trainers/educators. An informed parent constituency group, if aware of such
discrepancies, might well interpret this as bearing negatively on the quality of education
experienced by their children in Adventist schools.

41
Literature Synthesis
It is probably safe to say that no educational administrator, whether the institution is
public, quasi-public as in a charter school or private/parochial is indifferent to enrollment trends
and patterns as these affect their particular educational setting. As previously indicated, student
enrollment is to a school system as an engine is to a car. Without students the purpose for
schools ceases. Equally, a car without an engine will not run.
What the review of literature has revealed is that enrollment patterns and trends are
multifaceted in nature. As such, no single factor affecting enrollment is sufficient to account for
the many variations thereto appertaining.
Second, among the consortium of K-12 schools in American society, there is a systemic
interconnectedness between and among them. What happens in one type of educational setting
creates ripple effects in other settings. To restate Hargreaves and Fink (2006), the fate of schools
are increasingly intertwined. What leaders do in one school necessarily affects the fortunes of
students and teachers in other schools….
Third, because of the interinstitutional connectedness, factors influencing enrollment
trends and patterns have applicability across institutional lines. Thus, when attempting to
extrapolate factors influencing enrollment declines specific to secondary schools within the
Southern Union Conference of Seventh-day Adventist, enrollment indices across institutional
lines is appropriate.
It should also be noted that the list of factors deduced from the literature may not be
exhaustive. As a result, in the questionnaire construction phase, provision was made for write in
responses. The identified factors were as follows.
1. Recruitment strategies on the part of school officials
2. School Mission Statement

42
3. Personal contacts with potential parents and students
4. The commitment of administrators
5. The commitment of teachers and support staff
6. Training/preparedness of administrators
7. Training/preparedness of teachers
8. Quality of education received in school
9. Needs of multiethnic and multilingual students (diversity)
10. Support systems for special needs children
11. Local governance structures
12. Enrollment in K-8 schools
13. Extra-curricular activities
14. Christian educational experiences at other schools
15. The cost of education
16. The availability of quality choices within public schools, i.e. magnet schools and
charter schools
17. The distance between the location of school and where families live is too great
18. Infrastructure and facilities- i.e. gymnasium, classrooms, state of the art technology,
etc.
19. Projection of a positive school image
20. Constituent pastors‟ support
21. Support alliance necessary between schools and local church families and leaders

43
CHAPTER 3
METHODOLOGY
Participants
The original intent of this research was to survey 15 secondary schools operating within
the Southern Union Conference of Seventh-day Adventist schools. At the outset of the study, 16
secondary schools were identified as affiliated with the Southern Union Conference of Seventh-
day Adventist schools. The principal investigator served as the administrator of one of the
schools and this institution was omitted from the sample to avoid a conflict of interest.
As the research unfolded, it was discovered that two of the remaining 15 schools had
become established as independent schools and were therefore no longer under the Office of
Education for the Southern Union Conference of Seventh-day Adventist schools. The elimination
of these two secondary schools reduced the number of participating institutions to 13. Of the
remaining 13 schools, 4 chose not to participate in the study. As a result, 9 schools made up the
institutional respondent pool. This reduced the population sample from 370 to 226 possible
participants.
Nine constituent groups were identified as major stakeholders within each institutional
setting. Members of each stakeholder group were included in the sample. The institutional
stakeholders were identified as follows: teachers, parents, students, school board members,
pastors/ church leaders, principals, area and regional administrators and parents of non-enrolled
students.
Since this study was localized to the Southern Union Conference and narrowed to include
only secondary institutions, in some instances 100% of particular stakeholders of participating
institutions were surveyed. The stakeholders falling in this category included:

44
Each of the secondary school principals (9)
All area and regional administrators for Southern Union Conference (10)
Each school board chairperson (9)
One at-large parent, per school, selected by the parent council (9)
Six additional parents, per school, of students not attending an SDA academy (54)
The pastor/ church leader who represents the primary clerical liaison person to each
institution (9)
The president of each parent council or home and school organization (9)
The lead teacher representative from each institution (9)
Students in grades 9-12 (108)
The student respondents for the study were drawn from grades nine to twelve in each
institution. Not less than three members of each class who volunteered to participate were
included. At a minimum, 108 total student respondents were sought from this group.
Table 13 below is a graphic representation of the study sample for questionnaires #1 and
#2.

45
Table 13
Study Sample Participants for Questionnaires #1 and #2
Category Number Percentage
1. Institutional Principal 9 100
2. School Board President/Chairperson 9 100
3. President of Parent Council 9 100
4. Lead Pastor/ Church leader1 9 100
5. Area Regional Administrator2 10 100
6. Lead Institutional Teacher3 9 100
7. Parent At-large4 9 unknown
8. Students- 12-Per School5 108 unknown
9. Parents of non-enrolled students-6 per school area 54 unknown
Total Sample 226 1
Each institution has a key or major church sponsor. This was the pastor/church leader used in the study. 2
There were 7 regional conferences utilized in this study, with 1 Education Superintendent representing each
region. In addition, there were 3 Southern Union Conference office administrators who participated in the study,
making a total of 10 area regional administrators. 3
Each school usually has a lead teacher or some other related title for a person who is in charge of the school in
the absence of the principal. 4
The parent at-large was selected by the parent council association
5 Three students per grade, grades 9 to 12, were requested for the student respondents
The final participants in the research study consisted of a focus group. The focus group
makeup consisted of an associate director for education for the Southern Union Conference, a
teacher within the Southern Union Conference, a principal within the Southern Union
Conference and a current board member within the Southern Union Conference who had
previously occupied roles as a teacher, principal and regional superintendent.
Materials
Literature review.
A review of literature on factors influencing student enrollment trends and patterns across
educational institutional lines yielded 21 variables that affect student enrollment trends and
patterns. No attempt was made in the review of literature process to categorize these variables

46
relative to their weighted significance in influencing enrollment trends and patterns. This list of
variables provided the data necessary to construct the first of three research questionnaires.
Research questionnaire #1
The research process called for the construction of a survey questionnaire which
consisted of the 21 variables influencing student enrollment trends and patterns as identified in
the review of literature. It is important to note here that the factors perceived to be contributing to
enrollment declines are stated in neutral terms so as not to sway respondent responses positively
or negatively. These 21 variables were sub-divided into five categories to facilitate participant
responses. These five sub-divided categories were: administration, parent‟s perceptions, external
factors, promotional factors and church leadership. See Appendix F for the breakdown of factors
under each category for Questionnaire #1.
Research questionnaire #2.
A second questionnaire was constructed based on the data analysis from the
administration of Questionnaire #1. The purpose for Questionnaire #2 was to further prioritize
those variables deemed to be the most significant in influencing enrollment trends and patterns.
Questionnaire #2 consisted only of those variables which were rated by research respondents to
be in the top 50% of influencing factors. See Questionnaire #2 in Appendix H for the factors
which constituted Questionnaire #2.
47
Focus group questionnaire.
The final phase of the research was in the form of a questionnaire based on data analysis
from Questionnaire #2 which was used by the researcher to conduct a focus group. The focus
group consisted of key educational Adventist K-12 stakeholders in the Southern Union
Conference.
Procedures
Questionnaire #1 was pre-tested within the Huntsville, Alabama Adventist community to
discover and correct any glitches which could have hampered data collection processes. The
questionnaire was then sent out to key stakeholders with directions to rank order the pre-
identified factors from most important to least important as reasons for enrollment declines using
a numerical weighting system. In the event research participants felt that none of the pre-
identified factors accounted for enrollment declines, an opportunity to write in such factors was
provided on the questionnaire.
After respondents had ranked the pre-identified factors from most important to least
important and returned them, the results were analyzed. The top factors deemed to be the most
important in explaining enrollment declines were returned to study respondents who were then
asked to re-rank them from most important to least important.
The final stage of data collection was in the form of a focus group. The primary intent of
the focus group was not so much a third level validation of key enrollment factors found in data
collection phases one and two, but rather as a process to fashion recruitment and enrollment
strategies resulting from findings in phases one and two.
Focus groups typically use a questioning route, similar to an interview guide that should
grow directly from the research questions (Stewart & Shamdasani, 1990), (Goltzman, Kollar &

48
Trinkle, 2010). Given this directive, focus group questions were formulated consistent with the
findings and rankings obtained from questionnaire #2. A convenience sampling plan was used to
select focus group participants. As a result members of the focus group were not representative
of all categorical respondents by states, rather by their proximity to and ease of access to the
Southern Union Conference office in Atlanta, Georgia.
Four previously identified focus group participants met with the researcher in Atlanta,
Georgia on June 30, 2010. A fifth member who was unable to attend the Atlanta session availed
herself to the researcher in a subsequent interview.
The principal investigator opened the focus group with a general introduction of why the
focus group was formed and a description of the purpose and findings of the research. This was
followed by a brief orientation to the expectations and outcomes sought. Specific attention was
given to crafting strategies to address the factors found to be the most influential in determining
enrollment patterns within secondary Seventh-day Adventist schools operating within the
Southern Union Conference. A questionnaire was provided to each focus group member to
facilitate the discussion and for ease of recording specific strategic initiatives. See Appendix K.
Study data were analyzed utilizing the statistical program for the social sciences SPSS.
Specifically, the latest version, PASW 18, was used in the research study.

49
CHAPTER 4
RESULTS
Introduction
The purpose of this study was to identify from among key stakeholders affiliated with
secondary schools in the Southern Union Conference, their perceptions of factors which most
significantly influenced enrollment patterns among and within these schools. A thorough review
of research literature on factors influencing student enrollment across institutional lines yielded
21 such factors. These data provided the basis for constructing the questionnaire for phase one of
the data collection process.
The 21 pre-identified factors were sub-divided into five categories to facilitate ease of
response. These categories were administration, parent‟s perceptions, external factors,
promotional factors, and church leadership. Respondents were asked to rank each factor from the
most significant to the least significant with 1 being the most significant, to 2 for the next most
significant and so on until all factors had a numerical value. Data were analyzed using the latest
version of PASW.
To make maximum efficient use of PASW as a tool to analyze data for this research, it
was necessary to numerically reverse the order of responses within each subcategory during the
data input process. Under the category administration, for example, seven factors were ranked by
respondents. In inputting the data into SPSS, a respondent ranking of 1 for the most significant
factor was inputted as 7, 2 was inputted as 6; 3 was inputted as 5, 4 was inputted as 4; 5 was
inputted as 3, 6 was inputted as 2 and 7 was inputted as 1.
The second subcategory, Parents‟ Perceptions, also contained seven factors that were
ranked by the respondents. The same reversal of data input was applicable for this subcategory as

50
in the category Administration. The third subcategory, External Factors, had only 3 factors; thus,
the numerical weighting reversal occurred accordingly, i.e. 1 was inputted as 3; 2 was inputted as
2; and 3 was inputted as 1. The fourth subcategory, Promotional Factors, contained only 2
factors; as a result 1 was inputted as 2 and 2 was inputted as 1. The final subcategory, Church
Leadership, also contained only 2 factors, and subsequently followed the same weighting as
Promotional factors. This reversal in numerical significance in weighting the responses of
respondents in no way altered or biased the outcomes of the study.
As a result of this change, the higher the cumulative responses were to each research
variable (factor), the greater the perceived significance of the variable to stakeholders as an
influence on enrollment patterns. The converse was equally true, specifically, the lower the
cumulative responses, the less the perceived significance to stakeholders. See Appendix L for
illustrations of the numerical reversal of the inputted factors for all five subcategories as they
appeared on Questionnaire #1.
Table 14 below provides the categorical breakdown for boarding schools represented in
the study, the number of possible respondents per category, the number of responses returned
and the percentage of responses returned for each category.

51
Table 14
Number of Respondents in the Research Study from
Boarding Schools in the Southern Union Conference
Category
Number of
Research
Respondents
Number of Responses
Returned for
Questionnaire #1
Percent
Principals 5 4 80.0
School Board Presidents 5 3 60.0
Parent Council Presidents 5 2 40.0
Lead Pastors 5 1 20.0
Lead Teachers 5 2 40.0
Parents-At-Large 5 1 20.0
Students 60 18 30.0
Parents of Students Not Attending SDA
Schools
0 0 0.0
Total Boarding School Responses 90 31 34.0
Note: Boarding schools are residential institutions
Tables 15 and 16 below provide the categorical breakdown of day schools and regional
superintendents represented in the study, the number of possible respondents per category, the
number of responses returned and the percentage of responses for each category.

52
Table 15
Number of Respondents in the Research Study From
Day Schools in the Southern Union Conference
Category
Number of
Research
Respondents
Number of Responses
Returned for
Questionnaire #1
Percent
Principals 4 3 75.0
School Board Presidents 4 0 0.0
Parent Council Presidents 4 1 25.0
Lead Pastors 4 1 25.0
Lead Teachers 4 2 50.0
Parents-At-Large 4 3 75.0
Students 48 5 10.0
Parents of Students Not Attending SDA
Schools
0 0 0.0
Total Day School Responses 72 15 21.0
Note: Day schools are commuter institutions.
Table 16
Regional Superintendent Responses in the Southern Union Conference
Category
Number of Research
Respondents
Number of Responses
Returned for
Questionnaire #1
Percent
Regional Superintendents 10 6 60.0
Table 17 below provides the combined responses from both day and boarding schools,
and regional superintendents, including the number of potential respondents, the number of
questionnaires returned and the percentage of all responses.

53
Table 17
Combined Responses Returned From Day and Boarding Schools and
Regional Superintendents in the Southern Union Conference
Category
Number of Research
Respondents
Number of Responses
Returned for
Questionnaire #1
Percent
Boarding Schools 90 31 34.0
Day Schools 72 15 21.0
Regional Superintendents 10 6 60.0
Total Responses 172 52 30.0
Tables 18 to 22 below provide the frequency scores, by subcategory, for the twenty-one
research factors from questionnaire #1. The percent response category in each table represents
the cumulative sum of significant values of 5, 6 and 7 from all of the respondents for each
specified research variable.
Table 18
Frequency of the Research Variables by Factor Category
for Questionnaire #1
Administration
Research Variable Percent
Recruitment strategies on the part of school officials 46.2
School Mission Statement 32.6
Personal contacts with potential parents and students 63.5
The commitment of administrators 61.5
The commitment of teachers and support staff 61.5
Training/preparedness of administrators 11.5
Training/preparedness of teachers 26.9
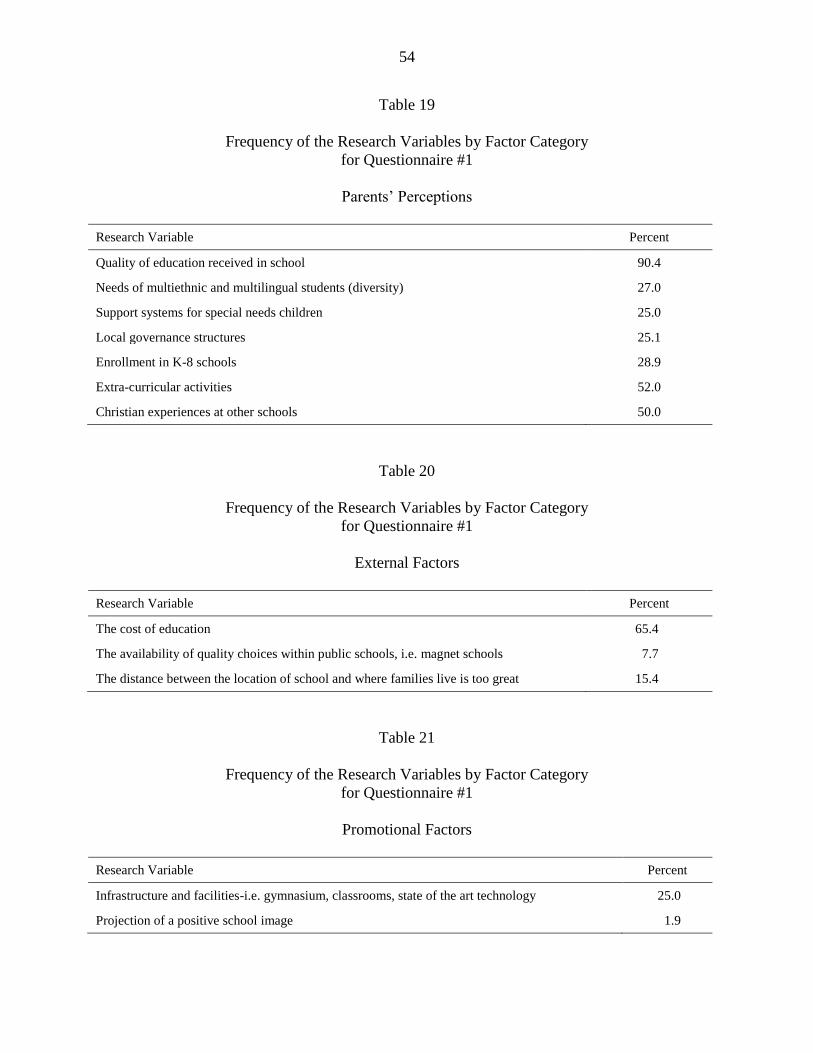
54
Table 19
Frequency of the Research Variables by Factor Category
for Questionnaire #1
Parents‟ Perceptions
Research Variable Percent
Quality of education received in school 90.4
Needs of multiethnic and multilingual students (diversity) 27.0
Support systems for special needs children 25.0
Local governance structures 25.1
Enrollment in K-8 schools 28.9
Extra-curricular activities 52.0
Christian experiences at other schools 50.0
Table 20
Frequency of the Research Variables by Factor Category
for Questionnaire #1
External Factors
Research Variable Percent
The cost of education 65.4
The availability of quality choices within public schools, i.e. magnet schools 7.7
The distance between the location of school and where families live is too great 15.4
Table 21
Frequency of the Research Variables by Factor Category
for Questionnaire #1
Promotional Factors
Research Variable Percent
Infrastructure and facilities-i.e. gymnasium, classrooms, state of the art technology 25.0
Projection of a positive school image 1.9

55
Table 22
Frequency of the Research Variables by Factor Category
for Questionnaire #1
Church Leadership
Research Variable Percent
Constituent pastors‟ support 1.9
Support alliance necessary between schools and local church families and leaders 44.2
Table 23 below provides the combined frequency of the research factors identified as
significant by the respondents in the research study in descending order, from most significant to
least significant.
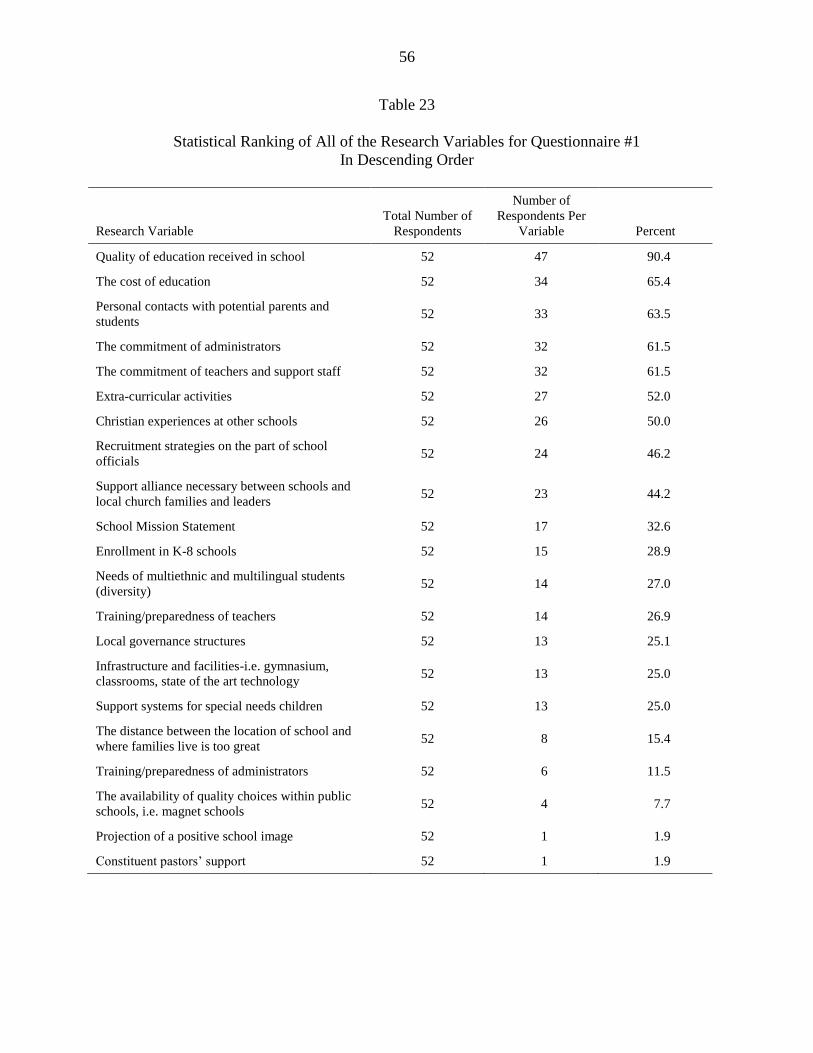
56
Table 23
Statistical Ranking of All of the Research Variables for Questionnaire #1
In Descending Order
Research Variable
Total Number of
Respondents
Number of
Respondents Per
Variable Percent
Quality of education received in school 52 47 90.4
The cost of education 52 34 65.4
Personal contacts with potential parents and
students 52 33 63.5
The commitment of administrators 52 32 61.5
The commitment of teachers and support staff 52 32 61.5
Extra-curricular activities 52 27 52.0
Christian experiences at other schools 52 26 50.0
Recruitment strategies on the part of school
officials 52 24 46.2
Support alliance necessary between schools and
local church families and leaders 52 23 44.2
School Mission Statement 52 17 32.6
Enrollment in K-8 schools 52 15 28.9
Needs of multiethnic and multilingual students
(diversity) 52 14 27.0
Training/preparedness of teachers 52 14 26.9
Local governance structures 52 13 25.1
Infrastructure and facilities-i.e. gymnasium,
classrooms, state of the art technology 52 13 25.0
Support systems for special needs children 52 13 25.0
The distance between the location of school and
where families live is too great 52 8 15.4
Training/preparedness of administrators 52 6 11.5
The availability of quality choices within public
schools, i.e. magnet schools 52 4 7.7
Projection of a positive school image 52 1 1.9
Constituent pastors‟ support 52 1 1.9

57
Survey One Results
Using the technique of percentage clustering, the significant factors influencing student
enrollment were determined based on all variables with a percent response of 50% or greater.
The inherent assumption in this reductionist approach was that if the most significant factors
affecting enrollment patterns could be identified and subsequently addressed in an effective
recruitment and retention strategic plan, then those factors deemed less significant would be
minimized, if not neutralized.
After analyzing the data from Questionnaire #1, seven factors received the highest
cumulative scores and were deemed to be perceived as the most significant factors by study
respondents. These seven factors were quality of education received in school, the cost of
education, personal contacts with potential parents and students, the commitment of
administrators, the commitment of teachers and support staff, extracurricular activities and
Christian experiences at other schools. Table 24 below provides the factors identified from
questionnaire #1 which received a percentage response of 50% or greater.
Table 24
Top Significant Research Factors Identified From Respondents
From Questionnaire # 1
Research Variable Percent
Quality of education received in school 90.4
The cost of education 65.4
Personal contacts with potential parents and students 63.5
The commitment of administrators 61.5
The commitment of teachers and support staff 61.5
Extra-curricular activities 52.0
Christian experiences at other schools 50.0

58
Additionally, it was deemed insightful to assess which category of respondents ranked
which influencing factors as the most significant. Most significant is defined as ranking the
research variable with a numerical value of 1 with SPSS inputting in the reverse as presented in
Appendix N. The subcategories Administration and Parents‟ Perceptions each contained seven
research variables. The most significant factor was therefore inputted into PASW as a numerical
value of 7. The subcategory External Factors contained only three research variables; therefore
the most significant value was inputted into SPSS with a value of 3. The subcategories
Promotional Factors and Church Leadership had only two research variables each, therefore the
most significant value was inputted into SPSS with a value of 1. This was important because the
possibility of enrollment strategies may have to factor in different institutional settings. Table 25
below provides data in answer to this question from boarding school respondents.
Table 25
Most Significant Factors Influencing Enrollment
By Boarding School Respondents
Research Variable
Total Number of
Respondents
Number of Respondents
Per Variable
Percent
Quality of education received 31 19 61.29
The cost of education 31 20 64.52
Personal contacts with potential parents and students 31 6 19.36
The commitment of administrators 31 6 19.36
The commitment of teachers and support staff 31 3 9.68
Extracurricular activities 31 3 9.68
Christian experiences at other schools 31 6 19.36
Table 26 below provides data on the most significant enrollment factors as perceived by
day school respondents.

59
Table 26
Most Significant Factors Influencing Enrollment
By Day School Respondents
Research Variable
Total Number of
Respondents
Number of
Respondents Per
Variable
Percent
Quality of education received 15 12 80.0
The cost of education 15 9 60.0
Personal contacts with potential parents and students 15 4 26.7
The commitment of administrators 15 3 20.0
The commitment of teachers and support staff 15 3 20.0
Extracurricular activities 15 1 6.7
Christian experiences at other schools 15 0 0.0
Table 27 provides data on the most significant enrollment factors as perceived by
superintendents as respondents.
Table 27
Most Significant Factors Influencing Enrollment
By Superintendents as Respondents
Research Variable
Total Number of
Respondents
Number of
Respondents Per
Variable Percent
Quality of education received 6 1 16.7
The cost of education 6 4 66.7
Personal contacts with potential parents and students 6 2 33.3
The commitment of administrators 6 1 16.7
The commitment of teachers and support staff 6 0 0.0
Extracurricular activities 6 0 0.0
Christian experiences at other schools 6 0 0.0

60
When the responses of boarding schools, day schools and superintendents are aligned, the
quality of education received, the cost of education and personal contacts with potential parents
and students closely approximate a one to one correspondence. In effect, there is near unanimity
between the three respondent categories on the causes of enrollment fluctuations and declines in
secondary schools operating in the Southern Union Conference of Seventh-day Adventist. This
conclusion should be useful in fashioning the focus group discussion in phase three of the data
collection process.
Further reinforcement of the top seven most significant factors, by respondent categories,
can be seen in Table 28 below which illustrates the top two most significant responses, by
category, from the research respondents.
Table 28
Top Two Most Significant Responses by Category of Respondents
Respondent
Category Research Variable
Number of
Respondents
in the Study
Frequency of
Respondents
per Variable
Category
Ranking
Score** Percent
Principals
1. Quality of education 7 6 7 85.7
2. Cost of education 7 5 3 71.4
2. Projection of positive school image 7 5 2 71.4
School Board President
1. Projection of positive school image 3 3 2 100.0
2. Quality of education 3 2 7 66.7
2. Commitment of administrators 3 2 7 66.7
Parent Council President
1. Quality of education 3 3 7 100.0
2. Cost of education 3 2 3 66.7
2. Infrastructure and facilities 3 2 2 66.7

61
Respondent
Category Research Variable
Number of
Respondents
in the Study
Frequency of
Respondents
per Variable
Category
Ranking
Score** Percent
2. Support alliance between school and
church families and leaders
3 2 2 66.7
*Pastors
1. Quality of education 2 2 7 100.0
1. Cost of education 2 2 3 100.0
1. Pastors‟ support 2 2 2 100.0
Teachers
1. Projection of positive school image 4 4 2 100.0
1. Pastors‟ support 4 4 2 100.0
2. Quality of education 4 3 7 75.0
2. Cost of education 4 3 3 75.0
Parents
1. Cost of education 4 3 3 75.0
1. Projection of positive school image 4 3 2 75.0
1. Pastors‟ support 4 3 2 75.0
2. Quality of education 4 2 7 50.0
2. Available quality choices within
public schools
4 2 2 50.0
Students
1. Projection of a positive school image 23 15 2 65.2
2.Cost of education 23 14 3 60.9
2. Support alliance between school and
church families and leaders
23 14 2 60.9
Superintendents
1. Cost of education 6 4 3 66.7
1. Projection of a positive school image 6 4 2 66.7
1. Pastors‟ support 6 4 2 66.7
2. Support alliance between school and
church families and leaders
6 3 2 50.0
*There were only two Pastors as respondents. All remaining research variables received a frequency of responses
per variable of 50% for the second most significant factor(s).
**For purposes of clarification, column 5 above, Category Ranking Scores, was discussed in the introduction to the
data analysis, and illustrated in tables 15- 19.

62
As can be seen in Table 28, with minor variations, quality of education and cost of
education received near unanimous support as the most significant factors influencing student
enrollment. Projection of a positive school image also received a high ranking, particularly
among principals, school board presidents, teachers, and students. One could reasonably argue,
among other possibilities, that board presidents, principals, and teachers, in particular view
projection of a positive school image as a direct reflection on them and therefore perceived as a
critically significant factor influencing student enrollment. It could also be argued that if an
institution is perceived as having an excellent quality of education rating, then the image of the
institution would already have been branded as having a positive school image. Further
refinement of these results will be discussed in phase two of the data collection and analysis
process.
Survey Two Results
Phase two of the data collection process was designed to resubmit the top perceived
significant factors identified to be the most important in influencing student enrollment as
identified by study respondents. Seven factors were then resubmitted to study respondents in the
form of a second questionnaire. (See Appendix H) The same instructions applicable in
responding to Questionnaire #1 were applicable to Questionnaire #2. Specifically, study
respondents were asked to rank the top significant factors identified in Questionnaire #1, from
the most significant to least significant using a numerical value system of one to seven with one
being the most significant to two as the second most significant up to seven being the least
significant.
The same numerical weighting for questionnaire #2 was used so as to minimize
respondent confusion. Data from questionnaire #2 were also analyzed utilizing the SPSS

63
statistical computer program. As was the case with questionnaire #1 data input was reversed for
questionnaire #2. In effect, 7 became 1, 6 became 2, 5 became 3, 4 remained 4, 3 became 5, 2
became 6 and 1 became 7. The second questionnaire was mailed out to study respondents with a
two week window for return responses.
The number of questionnaires sent out for phase two of the study corresponded with the
number of categorical responses received from study institutions and individuals in phase one.
The one exception occurred with students in questionnaire #2. Since there was no way due to
confidentiality, to know which students, by school, responded to questionnaire #1, the number of
students receiving questionnaire #2 varied by participating institutions. In other words, student
questionnaires were sent only to those schools from which students responded to the first
questionnaire. If a school received questionnaire #2 for students, all of the students identified by
the school received questionnaire #2. Thus, the total number of questionnaires mailed for phase
two of the study, including students, was 89. Of this number 42 study respondents returned
questionnaires for a rate of return of 47.19%.
Table 29 below shows the rank ordering of factors by phase two respondents from most
important to least important as factors influencing enrollment. Consistent with the rank order of
factors found in phase one data analysis, quality of education and cost of education accounted for
the most important factors influencing enrollment.

64
Table 29
Ranking of Questionnaire #2 Factors by Order of Significance
Research Factor Percent
Quality of education 35.7
Cost of education 26.2
Christian experiences at other schools 19.0
Commitment of teachers/ support staff 9.5
Personal contacts with potential parents and students 7.1
Commitment of administrators 4.8
Extracurricular activities 2.4
Personal contacts were ranked third in importance from questionnaire #1, but fell
significantly in questionnaire #2. Christian experiences in other schools ranked third in
questionnaire #2. The spread of the remaining factors was insignificant and in their composite
were deemed approximately equal in value.
These data analysis results sharpened greatly the parameters of the research focus group
which represented the final data collection phase, stage three. Five factors formed the core of the
focus group discussion, specifically, quality of education, cost of education, Christian
experiences at other schools, personal contacts with potential parents and students and
commitment of teachers and support staff. A word of caution is apropos here concerning the
factor, “Christian experiences at other schools”. It is unclear whether respondents were
suggesting that Christian experiences in schools other than Seventh-day Adventist institutions
were acceptable options to Seventh-day Adventist schools or whether they interpreted the quality
of Christian experiences in Seventh-day Adventist schools as a key factor in their choice of a
Seventh-day Adventist school.
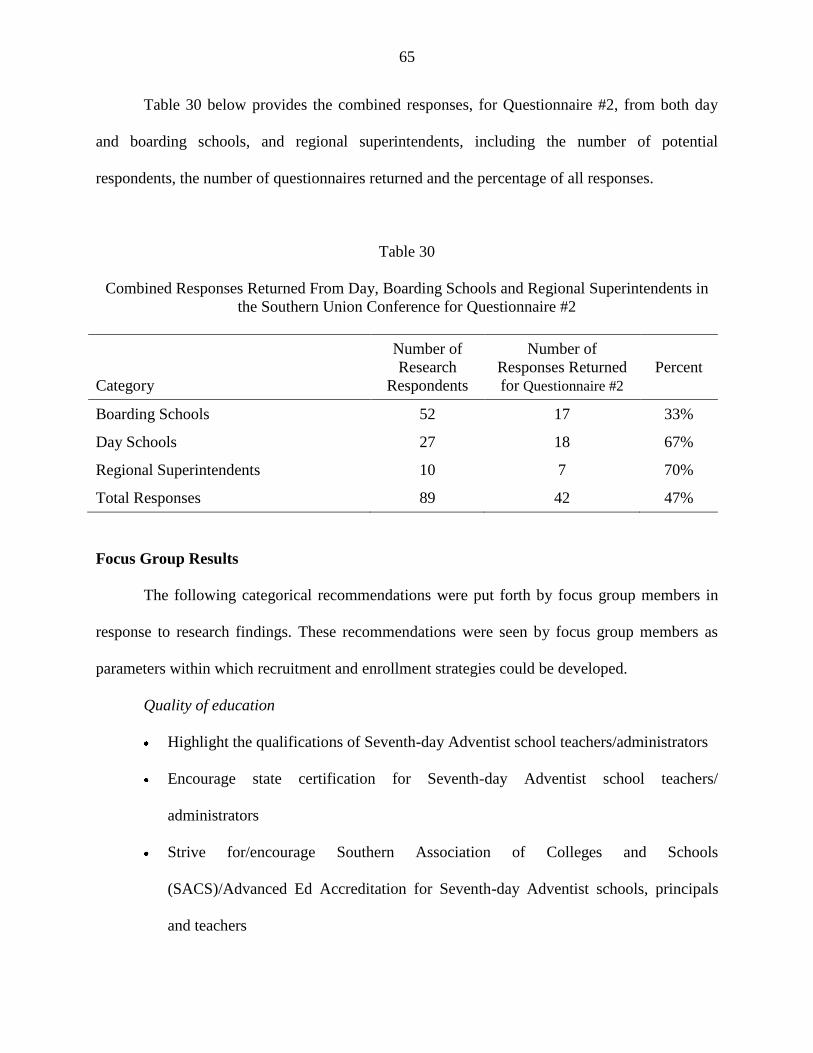
65
Table 30 below provides the combined responses, for Questionnaire #2, from both day
and boarding schools, and regional superintendents, including the number of potential
respondents, the number of questionnaires returned and the percentage of all responses.
Table 30
Combined Responses Returned From Day, Boarding Schools and Regional Superintendents in
the Southern Union Conference for Questionnaire #2
Category
Number of
Research
Respondents
Number of
Responses Returned
for Questionnaire #2
Percent
Boarding Schools 52 17 33%
Day Schools 27 18 67%
Regional Superintendents 10 7 70%
Total Responses 89 42 47%
Focus Group Results
The following categorical recommendations were put forth by focus group members in
response to research findings. These recommendations were seen by focus group members as
parameters within which recruitment and enrollment strategies could be developed.
Quality of education
Highlight the qualifications of Seventh-day Adventist school teachers/administrators
Encourage state certification for Seventh-day Adventist school teachers/
administrators
Strive for/encourage Southern Association of Colleges and Schools
(SACS)/Advanced Ed Accreditation for Seventh-day Adventist schools, principals
and teachers

66
Offer more advanced placement courses
Market each school to emphasize its uniqueness; have a great public relations plan
Update school facilities and equipment, such as the science labs, media
centers/libraries
Move from teacher driven instruction to student centered learning through teacher
accountability, classroom observations, professional development,
teacher/administrative mentoring programs
Emphasize student test scores on both the ACT and SAT when compared to national
averages, as well as other standardized tests taken during the school year
Emphasize schools graduates are accepted to and scholarships awarded
Consider special summer enrichment programs in language arts, science and
mathematics. The idea here is to give each student a competitive edge.
Cost of education
Establish endowment funds at each school
Support and modeling from leadership to invest financially in Christian education
Assist the church in recognizing that Christian education is a form of evangelism that
should be supported financially by diverting/allocating funding targeted for
evangelism
One church conference diverted a portion of evangelism funds to provide
scholarships and funding for students throughout the area
Identify support from industries to support Christian education
Identify student work opportunities in the community
Encourage training in work opportunities

67
Canvassing/literature evangelism (a work program within the Seventh-day Adventist
church that provides work opportunities for students to sell literature and materials
published by the Seventh-day Adventist church.)
Conduct parent asset surveys to determine areas of expertise which can be used in the
educational enterprise in exchange for either lowering or offsetting tuition costs (e.g.,
an engineer could possibly teach a mathematics course or run a special seminar for
students in science, etc.)
Explore the range of educational scholarship options available to Seventh-day
Adventist students including public sector opportunities, e.g. the state of Georgia
offers a tax scholarship program
Christian experiences at other schools
Promote what is right not wrong, positive not negative in SDA schools
Provide an exit questionnaire for parents to identify reasons for withdrawing students
from an SDA school
Market SDA schools positively (revisit the value of branding)
Many non-SDAs view SDA schools as private schools; some SDA members tend to
view SDA schools as the only choice for their children, though this view has begun to
erode.
Personal contacts with potential parents and students
Establish recruitment teams with trained individuals
Create opportunities for personal contacts
Create multimedia such as DVDs to positively promote each school
Provide extensive customer training and implementation to all school personnel

68
Establish strong alumni associations at each school
Ensure that lead Pastors and churches fully support their affiliated school
Commitment of teachers and support staff
Strengthen communication within the school and the school community
Require consistent follow up by school teachers to parents
Provide teacher support for needed resources and materials
Include teacher input in school decision making
Ensure that all school personnel have access to world class educational staff
development opportunities in a variety of venues.
Encourage and provide support for teachers and administrators to continuously update
and modernize their educational portfolios.
Examine the use of teacher portfolios as an evaluation measure (tool)

69
CHAPTER FIVE
DISCUSSION
This study was designed to ascertain those factors felt to be the most influential in
determining enrollment trends and patterns within secondary schools operating under the aegis of
the Southern Union Conference of Seventh - day Adventist. Officials within the Seventh-day
Adventist educational establishment had expressed deep concerns over the inconsistent and
unpredictable enrollment numbers in secondary schools within the conference and had embarked
upon some strategies to combat these anomalies known as the Adventist EDGE program.
Though this study was targeted to secondary schools within the Southern Union
Conference, enrollment fluctuations and declines have been felt and discussed throughout the
entire North American Division of Seventh-day Adventist. As expressed by Baldwin (2001),
recruitment concerns Adventist educators from the elementary to higher education levels.
Enrollment numbers are the lifeblood of an institution‟s growth, a necessity for continual
development of staff, technology, and facilities. In response to an Inter-American Division of
Seventh-day Adventist study which noted a marked imbalance between the growth in
membership and the enrollment of Adventist children and youth in its schools and universities
Simmons (2010) stated, “if we improve the quality of our schools and their campus facilities, and
provide the necessary tools for our teachers to better their education,… churches will support our
schools more and send their children to them” (p. 38). Brown (2001) stated that:
Today, especially in North America, many Adventist church schools, academies,
and colleges and universities are asking themselves, “Where have all the students
gone?” . . . Despite enrollment declines, the prospects can be better than they
imagined. With hard work and focus, most schools can grow their enrollments. (p.
4)

70
In 1982, Bartlett (1982) stated, “Among the cacophony of voices heard by the academy principal
is that of the board of directors emphasizing the importance of enrollment” (p. 8)
It should be noted that enrollment concerns are not limited to Seventh-day Adventist
institutions and schools as these concerns can be found throughout the country in both private
and public school settings. (See the review in Chapter 2 for a more detailed discussion).
Of the five top influencing factors, quality of education and cost of education were
deemed to be the most critical. One could surmise that if quality of education and cost of
education could be effectively addressed, other influencing factors could, if not eliminated, be at
least minimized.
Various studies on enrollment trends and patterns within Adventist educational
institutions vary in their conclusions, however, parental perceptions of the quality of education
received and cost of education are nearly universal. Concurrent with quality of education and
cost of education, the spiritual aspects of an Adventist education are viewed as extremely
important (Gregorutti, 2008). The above conclusions would clearly suggest that any effective
strategy designed to stabilize student enrollment trends and patterns within Seventh-day
Adventist secondary schools, must not only incorporate these findings as the foundation upon
which student enrollment is based, but must also deeply appreciate the significance of their
influence.
Recommendations
Generally speaking, administrators and leaders within Seventh-day Adventist educational
establishments must fully recognize and deeply appreciate the fact that Seventh-day Adventist
schools don‟t exist in a vacuum. To this point, educators and leaders in the Adventist educational
world would do well to read Thomas Friedman‟s book, The World is Flat (Friedman,

71
2006).Though such leaders rely heavily on the faith of Seventh-day Adventist parents to send
their children to Seventh-day Adventist schools, this is no longer a guaranteed certainty. Such
educators and leaders would also do well to revisit the wisdom of Lincoln (1971) who stated,
Every human experience rests upon some previous experience, and every
possibility for tomorrow is contingent to some other possibility which was
realized yesterday. Human possibility is created at the intersection of time, place,
and circumstance. Manipulate any one of these variables and the life chances of
any given individual will be changed….The great benefactors of society are so
often the visionaries who have the peculiar perceptivity to see beyond the
exigencies of the present that is here, and to address the future that is to be.
Human society is dynamic; it is never a static accomplishment capable of
complete realization in a lifetime or a generation. Rather it is always in process-
always becoming what it is, always different from what it was; yet never what it
will be. (p. 605)
The continued viability of Seventh-day Adventist educational institutions is deeply
dependent on the extent to which these institutions adjust and effectively respond to the ever
changing environments in which they operate. As previously stated, parents of Seventh-day
Adventist students don‟t automatically send their children to Seventh-day Adventist schools
simply because they are themselves Seventh-day Adventist. Seventh-day Adventist schools must
compete with an ever widening range of options open to parents for educating their children,
inclusive of, but not limited to charter schools, magnet schools, other private denominational
institutions, public schools with excellent reputations for educational excellence and even home
schooling. (Anderson, 2009)
Another factor worthy of consideration in the context of devising effective recruitment
and enrollment strategies is that though Seventh-day Adventist secondary schools operating in
the Southern Union Conference are interconnected, they are simultaneously unique institutions.
Thus, recruitment and enrollment strategies must not only address regional issues and concerns,
but each must also address its own particular and unique needs. In effect, while some recruitment

72
and enrollment strategies have universal application, some may need to be tailored to the specific
institution developing them.
A third consideration is the need to develop institutional interfaces and programs outside
of the Seventh-day Adventist world. An example of this would be to enter into agreements with
schools offering advanced placement courses to allow Seventh-day Adventist students, if such
courses aren‟t available in their own schools, to participate in them. Many states have distance
learning programs that can be utilized by schools throughout the state. Such partnerships can
only enhance the quality of education students receive. Anecdotically, the researcher is aware of
efforts to limit education to systems and organizations found only within the Seventh-day
Adventist church structure. This would seem to suggest that networking outside of the confines
of the Seventh-day Adventist church organization is not largely encouraged.
Study Implications
This study has attempted to identify those factors which most significantly account for
enrollment fluctuations and in some institutional cases declines in Seventh-day Adventist
secondary schools operating in the Southern Union Conference. A list of 21 factors was
originally developed from a literature review covering a broad range of educational institutional
types on factors which impact enrollment. The research process undertaken narrowed this list to
five factors deemed to be the most significant in determining secondary school enrollment
among schools operating within the Southern Union Conference.
These five factors were quality of education, cost of education, Christian experiences at
other schools, personal contacts with potential parents and students and commitment of teachers
and support staff. It is critically important to note that the five factors deemed to most influential
in determining enrollment trends and patterns in secondary schools are consistent for both
73
boarding and day schools. One could speculate that enrollment issues impacting day schools
would be different from those impacting boarding schools. Clearly venue does not matter.
Quality of education and cost of education transcend venue.
Ultimately, each school will need to revisit on a case by case basis the components of a
marketing strategy of need analysis, such as outlined by McKillip. (McKillip, 1987) Specifically:
(a) selection of the target population, those actually or potentially eligible for the service and able
to make the necessary exchanges; (b) choice of competitive position, distinguishing the agency‟s
services from those offered by other agencies and providers; and (c) development of an effective
marketing mix, selection of a range and quality of services that will maximize utilization by the
target population.
In politics the first rule applicable in election processes is to “secure your base”. Using
the data provided from this study, overlaid with particularization based on local circumstances,
secondary schools need to “secure their student enrollment base” in the Southern Union
Conference. Once the base is secured, continuing to expand the enrollment base beyond the
Seventh-day Adventist community might not be such a bad idea.
It is noted that though the numbers of non-Adventist students are increasing in Adventist
schools, this trend is not always seen as a positive. Dulan, World Director of Education in the
most recent issue of the Journal of Adventist Education (Summer, 2010) stated, “In addition, the
increasing non-Adventist enrollment in church-operated schools, while providing an opportunity
for missions, increases the burdens of the first two challenges, and to that extent can diminish the
„Adventist-ness‟ of the education offered to church members‟ children” (p. 4)
In the same issue of the journal, Rasi (2010) stated,
While we rejoice in this trend, we need to critically evaluate whether we are
diluting our identity and evangelistic mission in order to accommodate the large

74
influx of students of other faiths. We also need to find out why many church
members are not enrolling their children and youth in our schools. Statistics
reveal a steady decline in the percentage of Adventist students at all levels of
education. (p. 8)
Study Limitations
Several limitations of this study are necessary for discussion. The first limitation was the
inability of the researcher in cooperation with respondent alliance partners to get Seventh-day
Adventist parents of secondary school age children, not enrolled in a Seventh-day Adventist
school, to participate in the study. The researcher relied heavily on the Pastors of churches
affiliated with the various schools to identify this population and seek their participation. This
particular population cohort would have been a valuable source of information on the topic under
review.
As principal of one of the Seventh-day Adventist schools operating in the Southern
Union Conference the researcher has had the opportunity to speak directly with parents falling in
the above category. It should be kept in mind that the particular school in which the researcher
held the position of principal was omitted from the study institutions so as to avoid/ minimize a
conflict of interest. Nevertheless, a few anecdotes are instructive. A few Seventh-day parents
falling in the category of having secondary children not enrolled in a Seventh-day Adventist
institution have given the researcher the following reasons: not enough individualized attention
to children with special needs; non-rigorous curriculum; some inept/incompetent teachers;
insufficient mechanisms for parental input, and just too expensive for the family.
A second limitation of the study was the reduction of a potential institutional respondent
pool from 16 institutions to 9. This reduction resulted from one school being eliminated due to
the researcher‟s former role as principal, two schools were determined to be independent schools
and were therefore not under the Southern Union Conference guidelines, and four schools chose

75
not to participate in the study. Had all fifteen schools participated the results of the study may
have been significantly different. Equally, institutional participation of these schools could have
given increased credibility to the study results. There is no way to tell.
Finally, eight focus group members had agreed to meet with the researcher in Atlanta,
Georgia on June 30, 2010. However, three for various reasons had to cancel their participation. A
fifth participant made herself available post June 30, 2010 for an individual interview. The
recruitment and enrollment strategies which evolved from the focus group process may have
been substantially enriched had all members participated.
Implications for Future Research
The results of this study point to the need for additional studies on recruitment and
enrollment trends and patterns within Seventh-day Adventist educational institutions.
(1) An in depth study on Seventh-day Adventist parents with school age children not
enrolled in Seventh-day Adventist schools: causes and explanations.
(2) An in depth case study of a Seventh-day Adventist K-12 institution not experiencing
enrollment fluctuations/declines: specifically the culture, operations and behaviors of
such an institution.
(3) An in depth study, where applicable, on the divide between some Seventh-day
Adventist schools and the churches which represent their major constituent cohort.
(4) Finally, with Seventh-day Adventist church membership going up and student
enrollment going down, what is the future of Seventh-day Adventist educational
institutions in an ever changing world.
76
APPENDIX A
INTRODUCTORY LETTER FOR ADULT PARTICIPANTS
IN THE RESEARCH STUDY
Dear Respondent,
You are being asked to participate in a research study to assist in determining those factors which
most significantly affect student enrollment patterns within secondary schools operating in the
Southern Union Conference of Seventh-day Adventists. This study is being conducted in 15 day
and boarding secondary schools operating in the 8 state Southern Union Conference. The results
of the study may be instrumental in uncovering key factors influencing enrollment within the
Southern Union Conference of Seventh-day Adventists.
The school Principal will assist in distribution of the research questionnaire for this study. A
package of questionnaires has/will be sent to each Principal with materials for each of the
participants. The research participants for each school include: teachers, principals, school board
chairs, parent council presidents, students, lead teachers/ vice principals, parents and church
pastors.
You will be asked to complete the questionnaire twice, in two different settings. The first
questionnaire is designed to determine respondent perceptions to categorical lists of 21 factors
extracted from research literature which are deemed to influence student enrollment.
You are asked to rank these factors under each categorical heading from most significant to least
significant. The number one (1) should be used for the most significant. The number two (2)
should be used for the second most significant and so on until all factors have a numerical value.
In the event you feel that none of the pre-identified factors, in a particular category, account for
enrollment declines, write in your response on the line item labeled “other” and give it a
numerical value.
You will be provided with an envelope for the respondent category within which you fall. Once
you complete the questionnaire, please put it in the self-addressed, stamped envelope provided
and return it to the principal investigator. Please DO NOT sign your name to either the
questionnaire or the envelope. This is to ensure your privacy and confidentiality.
Thank you for participating in this research study.
Sincerely,
Olivia Beverly
Doctoral Student
Wayne State University

77
APPENDIX B
AN ASSESSMENT OF FACTORS INFLUENCING STUDENT ENROLLMENT
WITHIN THE SOUTHERN UNION CONFERENCE OF
SEVENTH-DAY ADVENTIST SECONDARY SCHOOLS
Behavioral Research Informed Consent
Adult Respondent Consent Form
Principal Investigator (PI): Olivia Beverly
(256) 852-5109
Purpose
As an adult stakeholder in the Southern Union Conference, you are being asked to participate in
a research study. This research study is an attempt to identify those factors which most
significantly affect student enrollment patterns within secondary schools operating in the
Southern Union Conference of Seventh-day Adventists. This study is being conducted in 15 day
and boarding secondary schools operating in the 8 state Southern Union Conference. The
estimated number of study participants, including students, is about 370.
A review of the literature has identified factors which contribute to enrollment trends across
various educational institutions (public, private and charter). Consistent with other parochial
schools, the Southern Union Conference of Seventh-day Adventist has not been immuned to the
national trend of declining student enrollments. While church membership has grown, K-12
enrollment in Seventh-day Adventists schools has undergone fluctuations. This study is
specifically focused on secondary enrollment within the Southern Union Conference of Seventh-
day Adventist schools.
Please read this form and ask any questions you may have before agreeing to be in the
study.
Study Procedures
If you agree to take part in this research study, you will be asked to:
1. Complete two questionnaires, in two different sessions. The first questionnaire
includes five categories found in research literature which influence student enrollment. The five
categories are: administration, parents‟ perceptions, external factors, promotional factors and
church leadership. Under each category is a list of sub-factors which you are asked to rank in
order of importance/significance beginning with (1) one as most significant and continuing with
2, 3, 4, etc. until all factors have been ranked under each category. In the event you feel that none
of the pre-identified factors, in a particular category, account for enrollment declines, write in
your response on the line item labeled “other” and give it a numerical value.
Once the results from the first questionnaire have been tabulated, a second questionnaire
will be developed. You will be asked to make a final ranking of the key factors having the

78
highest level of significance identified from the results of the first questionnaire. For example the
top 8 to 10 factors deduced from the first questionnaire will be ranked in order of
significance from 1-10 with 1 again being the most significant etc.
2. It should take no more than 20-30 minutes to complete each questionnaire, perhaps
less. This will be a paper and pencil exercise. Both questionnaires should be completed over a 4-
6 week period of time.
3. If for some reason you choose not to answer a question, this will not prevent you from
remaining in the study, though it is hoped that you will answer all questions
4. The questionnaires will be filled out by participant categories i.e. students, parents,
teachers, pastors, etc. You will be provided with a self-addressed, stamped envelope for the
respondent category within which you fall. Once you complete the questionnaire, please place it
in the self-addressed, stamped envelope provided, seal it and return it by postal mail to the
principal investigator indicated on the return envelope. Please DO NOT sign your name to either
the questionnaire or the envelope. This is to ensure your privacy and confidentiality.
Benefits
As a participant in this research study, there will be no direct benefit for you; however,
information from this study may assist the Southern Union Conference in long-term planning
and development strategies to sustain Adventist education.
Risks
There are no known risks at this time to participation in this study.
Study Costs
Participation in this study will be of no cost to you.
Compensation
You will not be paid for taking part in this study.
Confidentiality
There will be no personal information about you collected. The responses you provide on the
research questionnaire will be identified by category of respondent. All respondents in a
particular category will be grouped for data analysis. For example, in the category of students,
there will be no way to match a student questionnaire to a particular student. The same is true for
all other categories. No individual names will appear anywhere in the research to ensure
confidentiality.
Voluntary Participation/Withdrawal

79
Taking part in this study is voluntary. You have the right to choose not to take part in this study.
Questions
If you have any questions about this study now or in the future, you may contact the school
Principal at the school, or the principal investigator, Olivia Beverly at (256) 852-5109. If you
have questions or concerns about your rights as a research participant, the Chair of the Human
Investigation Committee can be contacted at (313) 577-1628. If you are unable to contact the
research staff, or if you want to talk to someone other than the research staff, you may also call
(313) 577-1628 to ask questions or voice concerns or complaints.
Participation
By completing the questionnaire, you are agreeing to participate in this study.

80
APPENDIX C
AN ASSESSMENT OF FACTORS INFLUENCING STUDENT ENROLLMENT WITHIN
THE SOUTHERN UNION CONFERENCE OF
SEVENTH-DAY ADVENTIST SECONDARY SCHOOLS
Parents Research Information Sheet
Principal Investigator (PI): Olivia Beverly, Doctoral Student-Wayne State University, Detroit,
Michigan
(256) 852-5109
Purpose
Because you are the parent of a student attending one of the secondary schools in the Southern
Union Conference, you are being asked to give permission for your child to participate in a
research study to determine those factors which most significantly affect student enrollment
patterns within secondary schools operating in the Southern Union Conference of Seventh-day
Adventists. This study is being conducted in 15 secondary schools in the Southern Union
Conference.
Study Procedures
Your child will be asked to:
1. Complete two questionnaires, in two different sessions. The first questionnaire includes five
categories found in research literature which influence student enrollment. The five categories
are: administration, parents‟ perceptions, external factors, promotional factors and church
leadership. Under each category is a list of sub-factors which your child will be asked to rank in
order of importance/significance beginning with (1) one as most significant and continuing with
2, 3, 4, etc. until all factors have been ranked under each category. In the event your child feels
that none of the pre-identified factors, in a particular category, accounts for enrollment declines,
he/she can write in their response on the line item labeled “other” and give it a numerical
value.Once the results from the first questionnaire have been tabulated, a second questionnaire
will be developed. Your child will be asked to make a final ranking of the key factors having the
highest level of significance identified from the results of the first questionnaire. For example the
top 8 to 10 factors deduced from the first questionnaire will be ranked in order of
significance from 1-10 with 1 again being the most significant etc.
2. It should take no more than 20-30 minutes to complete each questionnaire, perhaps less. This
will be a paper and pencil exercise. Both questionnaires should be completed over a 4-6 week
period of time.

81
3. If for some reason your child chooses not to answer a question, this will not prevent him/her
from remaining in the study, though it is hoped that your child will answer all questions. 4. Your child will be provided with a self-addressed, stamped envelope for the respondent
category within which he/she falls. Once your child completes the questionnaire he/she will
place it in the envelope provided, seal it and return it to the principal investigator indicated on the
return envelope. Your child will not sign his/her name to either the questionnaire or the
envelope. This is to ensure their privacy and confidentiality.
Benefits
As a participant in this research study, there will be no direct benefit for your child; however,
information from this study may benefit other people now or in the future.
Risks
There are no known risks at this time to participation in this study.
Costs
There will be no costs to your child for participation in this research study.
Compensation
Your child will not be paid for taking part in this study.
Confidentiality
All information collected about your child during the course of this study will be kept without
any identifiers.
Voluntary Participation /Withdrawal
Taking part in this study is voluntary. Your child is free to not answer any questions or to
withdraw at any time.
Questions
If you have any questions about this study now or in the future, you may contact the principal at
the school or the principal investigator at (256) 852-5109. If you have questions or concerns
about your child‟s rights as a research participant, the Chair of the Human Investigation
Committee can be contacted at (313) 577-1628. If you are unable to contact the research staff, or
if you want to talk to someone other than the research staff, you may also call (313) 577-1628 to
ask questions or voice concerns or complaints.

82
Participation
If you do not contact the principal investigator (PI) within a 2-week period, to state that you do
not give permission for your child to be enrolled in the research trial, your child will be enrolled
into the research. You may contact the PI by telephone to (256) 852-5109, email address:
[email protected] or you may use the optional tear off sheet below and return it to the
principal investigator.
Optional Tear Off
If you do not wish to have your child participant in the study, you may fill out the form below
and return it to the principal investigator at:
Olivia Beverly
380 Dan Crutcher Road
Toney, Alabama 35773
I do not allow my child _______________________________to participate in this research
study. Name
_______________________________________ Printed Name of Parent
_______________________________________ _____________ Signature of Parent Date

83
APPENDIX D
INTRODUCTORY LETTER FOR STUDENT PARTICIPANTS
IN THE RESEARCH STUDY
Dear Respondent,
You are invited to participate in a research study to help us understand some factors that
influence student enrollment in grades 9 through 12 within the Southern Union Conference of
Seventh-day Adventists. This study will include students in 15 day and boarding schools in the
Southern Union Conference. Since you are a student attending one of these schools, you are
eligible to participate in this study. The results of this study may be instrumental in identifying
key factors influencing enrollment within the Southern Union Conference.
If you decide to participate in the study, you will complete two questionnaire surveys, during two
different sessions. Each survey should take approximately 20-30 minutes to complete.
The first survey will ask you to rank a list of 21 factors in order from most significant to least
significant. These factors have been organized under five different headings. The five headings
are administration, parents‟ perceptions, external factors, promotional factors, and church
leadership. Under each heading place the number one to the left of the factor you feel is most
important, followed by the number two and so forth until all factors have a number value. In the
event you feel that none of the pre-identified factors, in a particular category, account for the
enrollment declines, write in your response on the line item labeled “other” and give it a
numerical value. The results from the first questionnaire will be analyzed.
A second survey will be developed from the most significant factors identified from the first
survey. In the second questionnaire, you will be asked to repeat the ranking process; however,
the number of factors will be smaller. You will use the same numbering system to rank the
factors in the second questionnaire.
Once you complete the questionnaire, place it in the self-addressed, stamped envelope provided,
seal it and return it to the principal investigator. Please DO NOT sign your name to either the
questionnaire or the envelope. This is to ensure your privacy and confidentiality.
Thank you for participating in this research study.
Sincerely,
Olivia Beverly
Doctoral Student, Wayne State University

84
APPENDIX E
AN ASSESSMENT OF FACTORS INFLUENCING STUDENT ENROLLMENT WITHIN
THE SOUTHERN UNION CONFERENCE OF
SEVENTH-DAY ADVENTIST SECONDARY SCHOOLS
Behavioral Documentation of Adolescent Assent Form
Assent Information Sheet
Study Investigator: Olivia Beverly
Why am I here?
This is a research study. Only people who choose to take part are included in research studies.
You are being asked to take part in this study because you are a 9th
to 12th
grade student
attending a secondary school in the Southern Union Conference of Seventh-day Adventist.
Please take time to make your decision. Talk to your family about it and be sure to ask questions
about anything you don‟t understand.
Why are you doing this study?
This study is being done to assist in identifying factors which most significantly affect student
enrollment patterns within secondary schools in the Southern Union Conference.
What will happen to me?
You will be asked to:
1. Complete two questionnaires, in two different sessions, on what you believe influences
student enrollment at your school. The first questionnaire includes five categories found in
research literature which influence student enrollment. The five categories are: administration,
parents‟ perceptions, external factors, promotional factors and church leadership.
Under each category is a list of sub-factors which you are asked to rank in order of significance
beginning with (1) one as most significant and continuing with 2, 3, 4, etc. until all factors have
been ranked under each category.
In the event you feel that none of the pre-identified factors, in a particular category, account for
enrollment declines, write in your response on the line item labeled “other” and give it a
numerical value.
Once the results from the first questionnaire have been tabulated, a second questionnaire will be
developed. You will be asked to make a final ranking of the key factors having the highest level
of significance identified from the results of the first questionnaire. For example the top 8 to 10

85
factors identified from the first questionnaire will be ranked in order of significance from 1 to 10
with 1 again being the most significant etc.
2. It should take no more than 20-30 minutes to complete each questionnaire, perhaps less. This
will be a paper and pencil exercise. Both questionnaires should be completed over a 4-6 week
period of time.
3. If for some reason you choose not to answer a question, this will not prevent you from
remaining in the study, though it is hoped that you will answer all questions
4. You will be provided with an envelope for the respondent category within which you fall.
Once you complete the questionnaire, please place it in the self-address, stamped envelope
provided, seal it and return it by postal mail to the principal investigator identified on the return
envelope. Please DO NOT sign your name to either the questionnaire or the envelope. This is to
ensure your privacy and confidentiality.
How long will I be in the study?
You will be in the study for approximately 20-30 minutes for two different sessions.
Will the study help me?
You may not benefit from being in this study; however information from this study may help
the Southern Union Conference in long-term planning and development strategies to sustain
Adventist education.
Will anything bad happen to me?
There are no risks to you for participation in this study.
Do my parents or guardians know about this?
Information explaining this study has been given to your parents/guardian to allow you to
participate in this research study. You can talk this over with them before you decide.
What about confidentiality?
Do not write or sign your name on the questionnaire or the envelope when you complete the
questionnaire. There will be no personal data collected on you in this study and there will be no
way to link you with your responses.

86
What if I have any questions?
If you have any questions about the study, discuss it with your school principal. You may also
call the principal investigator, Olivia Beverly at (256) 852-5109. If you have questions or
concerns about your rights as a research participant, the Chair of the Human Investigation
Committee can be contacted at (313) 577-1628.
Do I have to be in the study?
You don‟t have to be in this study if you don‟t want to or you can stop being in the study at any
time. Please discuss your decision with your parents and the Principal of your school. No one
will be angry if you decide to stop being in the study.
Voluntary Participation /Withdrawal
Your participation in this study is voluntary. You are free to withdraw from the study at any
time.

87
APPENDIX F
QUESTIONNAIRE #1
Below is a list of factors broken into five categories found in existing research literature which
may account for stagnant or decreasing secondary school enrollments in the Southern Union
Conference. Please rank these factors, in each category, from most important to least important
with one (1) being the most significant, to two (2) for the next most significant etc. until all
factors are ranked. For example, in the category Administration, if you think that the School
Mission Statement is the most significant factor influencing enrollment, then you would rank
School Mission Statement as #1 in the space provided for that choice. If in your opinion none of
the pre-identified factors account for the declines, please write in your thoughts in the space
indicated as Other and provide a numerical rank.
Administration
______Recruitment strategies on the part of school officials
______School Mission Statement
______Personal contacts with potential parents and students
______The commitment of administrators
______The commitment of teachers and support staff
______Training/preparedness of administrators
______Training/preparedness of teachers
______Other__________________________________
_______________________________________
_______________________________________
Parents’ Perceptions
_____ Quality of education received in school
______Needs of multiethnic and multilingual students (diversity)
______Support systems for special needs children
______Local governance structures
______Enrollment in K-8 schools

88
______Extra-curricular activities
______Christian educational experiences at other schools
______Other___________________________________
_______________________________________
_______________________________________
External Factors
______The cost of education
______The availability of quality choices within public schools, i.e. magnet schools and
charter schools
_____The distance between the location of school and where families live is too great
_____Other____________________________________
_______________________________________
_______________________________________
Promotional Factors
______Infrastructure and facilities- e.g. gymnasium, classrooms, state of the art technology
______Projection of a positive school image
______Other__________________________________
_______________________________________
_______________________________________
Church Leadership
______Constituent pastors‟ support
______Support alliance necessary between schools and local church families and leaders
______Other__________________________________
______________________________________
Please place the completed Questionnaire (only) in the self-addressed, stamped envelope
provided. Do not write your name on the Questionnaire or the envelope. Seal the envelope
and return it to the principal investigator within one week. For convenience, you may leave

89
your sealed envelope at the school front office for mailing. Thank you for your input in
completing this Questionnaire.
Olivia Beverly, Principal Investigator/ Doctoral Student
Wayne State University

90
APPENDIX G
AN ASSESSMENT OF FACTORS INFLUENCING STUDENT ENROLLMENT WITHIN
THE SOUTHERN UNION CONFERENCE OF
SEVENTH-DAY ADVENTIST SECONDARY SCHOOLS
Introductory Letter for Questionnaire #2
Dear Respondents,
Thank you for your assistance with ranking the 21 factors identified in Questionnaire #1
as factors influencing student enrollment in the secondary schools within the Southern Union
Conference. Enclosed please find Questionnaire #2 created from the results of Questionnaire #1.
Your assistance is asked to rank the six factors on Questionnaire # 2 in order of
importance from most to least important. Please use 1 for the most important, followed by 2 for
the next most important, then 3, 4, 5, 6 and 7 as the least important factor.
I would deeply appreciate, if at all possible, to have this questionnaire returned within
one week. I recognize that the school year is drawing quickly to a close.
Your input in this research study has been tremendously valuable. Thank you again for
participating in this study.
Sincerely,
Olivia Beverly
Principal Investigator/ Doctoral Student

91
APPENDIX H
AN ASSESSMENT OF FACTORS INFLUENCING STUDENT ENROLLMENT WITHIN
THE SOUTHERN UNION CONFERENCE OF
SEVENTH-DAY ADVENTIST SECONDARY SCHOOLS
Questionnaire #2
Please rank the following factors from most important to least important with one (1) the most
significant, (2) for the next most significant, followed by 3, 4, 5, 6 and 7 (7 represents the
least significant) until all factors are ranked.
______ Extracurricular activities
______Christian experiences at other schools
______ Quality of education received in school
______The commitment of administrators
______Personal contacts with potential parents and students
______ The cost of education
______The commitment of teachers and support staff
Please place the completed Questionnaire in the self-addressed, stamped envelope provided. Do
not write your name on the Questionnaire or the envelope. Return the questionnaire to the
principal investigator within one week, if at all possible, as the school year is drawing to a
close. Thank you for your input in completing this second Questionnaire.
Olivia Beverly, Principal Investigator/ Doctoral Student
Wayne State University

92
APPENDIX I
AN ASSESSMENT OF FACTORS INFLUENCING STUDENT ENROLLMENT WITHIN
THE SOUTHERN UNION CONFERENCE OF
SEVENTH-DAY ADVENTIST SECONDARY SCHOOLS
Introductory Letter for Adult Participants
In the Research Study Focus Group
Dear Focus Group Participant,
You are being asked to participate in a research study focus group to review the findings of a
questionnaire administered to determine those factors which most significantly affect student
enrollment patterns within secondary schools operating in the Southern Union Conference of
Seventh-day Adventists. This study was conducted in 15 day and boarding secondary schools
operating in the 8 state Southern Union Conference.
The research participants for each school included: teachers, principals, school board chairs,
parent council presidents, students, lead teachers/ vice principals, parents and church pastors.
Participants completed two sets of questionnaires which consisted of factors extrapolated from
the review of literature which most significantly affected student enrollment patterns within
schools. The results of the second questionnaire have identified and ranked the significant factors
identified by respondents within the Southern Union Conference.
Thank you for participating in this research study.
Sincerely,
Olivia Beverly
Doctoral Student
Wayne State University

93
APPENDIX J
AN ASSESSMENT OF FACTORS INFLUENCING STUDENT ENROLLMENT WITHIN
THE SOUTHERN UNION CONFERENCE OF
SEVENTH-DAY ADVENTIST SECONDARY SCHOOLS
Behavioral Research Informed Consent
Adult Respondent Consent Form
Principal Investigator (PI): Olivia Beverly
(256) 852-5109
Purpose
As an adult stakeholder in the Southern Union Conference, you are being asked to participate in
a research study. This research study is an attempt to identify those factors which most
significantly affect student enrollment patterns within secondary schools operating in the
Southern Union Conference of Seventh-day Adventists. This study is being conducted in 15 day
and boarding secondary schools operating in the 8 state Southern Union Conference.
A review of the literature has identified factors which contribute to enrollment trends across
various educational institutions (public, private and charter). Consistent with other parochial
schools, the Southern Union Conference of Seventh-day Adventist has not been immuned to the
national trend of declining student enrollments. While church membership has grown, K-12
enrollment in Seventh-day Adventists schools has undergone fluctuations. This study is
specifically focused on secondary enrollment within the Southern Union Conference of Seventh-
day Adventist schools.
Please read this form and ask any questions you may have before agreeing to be in the
study.
Study Procedures
If you agree to take part in this research study, you will be asked to:
Participate in a focus group discussion regarding the results of a second questionnaire
administered to stakeholders in the Southern Union Conference.
Benefits
As a participant in this research study, there will be no direct benefit for you; however,
information from this study may assist the Southern Union Conference in long-term planning
and development strategies to sustain Adventist education.
Risks

94
There are no known risks at this time to participation in this study.
Study Costs
Participation in this study will be of no cost to you.
Compensation
You will not be paid for taking part in this study.
Confidentiality
The responses you provide in the focus group will not be recorded by person, only by the
questionnaire factor to which the responses are applicable. In effect, there will be no way in the
final research results to identify who said what in the focus group.
Voluntary Participation/Withdrawal
Taking part in this study is voluntary. You have the right to choose not to take part in this study.
Questions
If you have any questions about this study now or in the future, you may contact the principal
investigator, Olivia Beverly at (256) 852-5109. If you have questions or concerns about your
rights as a research participant, the Chair of the Human Investigation Committee can be
contacted at (313) 577-1628. If you are unable to contact the research staff, or if you want to talk
to someone other than the research staff, you may also call (313) 577-1628 to ask questions or
voice concerns or complaints.
Participation
By participating in the focus group you have simultaneously agreed to participate in this study.

95
APPENDIX K
AN ASSESSMENT OF FACTORS INFLUENCING STUDENT ENROLLMENT WITHIN
THE SOUTHERN UNION CONFERENCE OF
SEVENTH-DAY ADVENTIST SECONDARY SCHOOLS
Focus Group Questionnaire
Based upon the findings of this research, five factors have been deemed to be the most influential
in determining whether parents choose to enroll their children in SDA secondary schools
operating in the Southern Union Conference or not. From your perspective how can secondary
schools most effectively address each of these factors for long term recruitment strategic
planning?
Quality of education
Cost of education
Christian experiences at other schools
Personal contacts with potential parents and students
Commitment of teachers and support staff

96
APPENDIX L
NOTICE OF EXPEDITED APPROVAL

97
APPENDIX M
NOTICE OF EXPEDITED AMENDMENT APPROVAL

98
APPENDIX N
NUMERICAL REVERSAL OF THE INPUTTED DATA FACTORS
Administration
Respondent Ranking Reversal Ranking
1 7
2 6
3 5
4 4
5 3
6 2
7 1
Numerical Reversal of the Inputted Data Factors
Parents’ Perceptions
Respondent Ranking Reversal Ranking
1 7
2 6
3 5
4 4
5 3
6 2
7 1

99
Numerical Reversal of the Inputted Data Factors
External Factors
Respondent Ranking Reversal Ranking
1 3
2 2
3 1
Numerical Reversal of the Inputted Data Factors
Promotional Factors
Respondent Ranking Reversal Ranking
1 2
2 1
Numerical Reversal of the Inputted Data Factors
Church Leadership
Respondent Ranking Reversal Ranking
1 2
2 1

100
APPENDIX O
ABBREVIATION LEDGER FOR DAY AND BOARDING SCHOOLS IN THE
SOUTHERN UNION CONFERENCE
Abbreviation Ledger
Day Schools
AAA CA GAAA GMA MA MUA
Atlanta
Adventist
Academy
Collegedale
Academy
Greater
Atlanta
Adventist
Academy
Greater
Miami
Academy
Madison
Academy
Miami
Union
Academy
Boarding Schools
BA FA FLA GCA HHA HrA
Bass
Academy
Fletcher
Academy
Forest
Lake
Academy
Georgia
Cumberland
Academy
Harbert
Hills
Academy
Heritage
Academy
HA LA MPA
Highland
academy
Laurelbrook
Academy
Mt. Pisgah
Academy
101
REFERENCES
Adventist Edge. (2009). Office of Education, Southern Union Conference. Decatur, GA.
Anderson, S. (2009). How to Kill Adventist Education. Maryland: Review and Herald Publishing
Association.
Araya, G. W. (1991). Factors Influencing Support for Seventh-day Adventist Education as
Expressed by Church Pastors. Unpublished doctoral dissertation, LaSierra University,
Riverside, California.
Baldwin, B. (2001). Using extracurricular activities to boost your school‟s enrollment. The
Journal of Adventist Education, 64(1), 32-35.
Bartlett, V. (1982). Boarding academy enrollment-a challenge. The Journal of Adventist
Education, 44(3), 8-9, 46-47.
Brantley, P. & Hwangbo, Y. (2000). Curriculum and instruction in North American schools.
Results from the profile ‟99 survey of Adventist Educators. The Journal of Adventist
Education, 63(1), 4-9.
Brown, V. (2001). Recruiting students at every level. The Journal of Adventist Education,
64(1),4-8.
Bryson, J. (2006). Factors influencing enrollment trends in Seventh-day Adventist boarding
schools in North America. Unpublished doctoral dissertation. Andrews University,
Berrien Springs, Michigan.
Buckley, J., & Schneider, M. (2006 1). Are Charter School Parents More Satisfied with
Schools?: Evidence from Washington, DC. Peabody Journal of Education, 81(1), 57-78.
Caire, K. (2002). The truth about vouchers. Educational Leadership, 59(7), 38-43.

102
California Department of Education. (2009). Private, Public Charter, and Other Public School
Enrollment Over Time. Retrieved from EdSource. Private, public charter, and other
public school enrollment over time. http://www.edsource.org/2234.html
Campbell, C., Hong, L., Otis, M., & Valencia, P. (2009). Student missionaries and English
language learners. The Journal of Adventist Education, 71(5), 35-39.
Carrigan, R. (2009). Implementing language acquisition classrooms. The Journal of Adventist
Education, 71(5), 26-29.
Cooper, Harris. (1984). The Integrative Research Review. Beverly Hills, CA: Sage Publications.
Cooper, Lowell C. (2009). Profile of a Changing Church. Retrieved June 7, 2009, from
http://dialogue.adventist.org./ articles/15-1-cooper.
Condeluci, A. (1995). Interdependence: The Route to Community. Winter Park, Florida: GR
Press, Inc.
Council for American Private Education. (2009). Where do private school students go to school?
Retrieved July 6, 2009, from http://www.capenet.org/facts.html
Council for American Private Education, (1990, October, Modified 1997, March). Rationale.
Germantown, Maryland
Covino, Jennifer K. (2003). Choice is good. District Administration, 38(11), 39-41.
Dulan, C.G. (2010). The uniqueness of Adventist education. The Journal of Adventist Education,
72(5), 4-5.
Fife, B. (2008) The Anatomy and Ideology of a Charter. Indiana University-Purdue University
Fort Wayne. Online Submission: http://www.eric.ed.gov/ERICWebPortal/ custom/
portlets/recordDetails/detailmini.jsp?_nfpb=true&_&ERICExtSearch_SearchValue_0=E
D501289&ERICExtSearch_SearchType_0=no&accno=ED501289

103
Fink, Jerrell Newton (1989). Perceptions of Seventh-day Adventists Church Ministers Toward
Seventh-day Adventist Schools. Unpublished doctoral dissertation, Virginia Polytechnic
Institute and State University. Blacksburg, Virginia.
Friedman, T. (2006). The World is Flat. New York: Farrar, Straus and Giroux.
Fusarelli, L. (2002). Charter Schools: Implications for Teachers and Administrators. Clearing
House, 76(1), 20-24. (ERIC Document Reproduction Service No. EJ658904) Retrieved
August 6, 2009, from ERIC database.
Gerth, H. & Mills, C. (1964). Character and Social Structure. New York, Chicago, Burlingame:
Harcourt, Brace & World, Inc.
Gilkeson, E. (2009). Creating successful strategies for ESL instruction. The Journal of Adventist
Education, 71(5), 19-25.
Goldhaber, D. (2002) School choice as education reform: what do we know? Eric Digest.
Retrieved from: www.ericdigests.org/2002-1/choice.html
Goltzman, J., Kollar, S., Trinkle, J. (2010). Listening to the voices of children in foster care:
youths speak out about child welfare, workforce, turnover and selection. Social Work.
55(1), 47-53.
Gregorutti, G. (2008). Factors Influencing Enrollment in Adventist K-12 Schools: A Review of
the Literature. The Journal of Adventist Education, 70(2), 10-17.
Greig, S. & Bryson, J. (2009). Teaching adult learners of ESL. The Journal of Adventist
Education, 71(5), 8-13.
Grimes, P. (1994). Public versus Private Secondary Schools and the Production of Economic
Education. Journal of Economic Education, 25(1), 17-30.
Hargreaves, A., & Fink, D. (2006). The ripple effect. Educational Leadership. 63(8), 16-21.

104
Howell, W. (2006) Switching schools? A closer look at parents‟ initial interest in and knowledge
about the choice provisions of no child left behind. Peabody Journal of Education, 81(1),
140-179.
Hunt, Dean (1996). The Factors That Impact Marketing and Enrollment in Seventh-day
Adventist Schools. Unpublished doctoral dissertation, University of Virginia,
Charlottesville, VA.
Kagan, N. (2006). Concise History of the World. Washington, DC: National Geographic Society.
Kennedy, M. (2002, December 1). Charter Schools: Threat or Boon to Public Schools?.
American School & University, 75(4), 18-26.
Kieschnick, M.M. (2006). A brief history of Lutheran schools. Lutheran Partners, 22(2), 1-5.
Retrieved September 24, 2009 from http://www.2.elca.org/lutheranpartners/r5s/
060304_06.html.
Kim, E. (2009) Do non-native speakers make good ESL teachers? The Journal of Adventist
Education, 71(5), 40-42.
Kotler, P. (1982). Marketing for nonprofit organizations (2nd
ed.). Englewood Cliffs, NJ:
Prentice-Hall.
Lacireno-Pacquet, N. (2006). Charter school enrollments in context: an exploration of
organization and policy influences. Peabody Journal of Education, 81(1), 79-102.
Lambert, C. (2009). An action plan for teaching young English language learners. The Journal of
Adventist Education, 71(5), 14-18.
Lekic, M. (2005). Perceptions and Attitude of Selected Adventist and Non-Adventist Parents of
School-Age Children Toward Adventist Schools in Canada Unpublished doctoral
dissertation, Andrews University, Berrien Springs, MI.

105
Lincoln, C. E. (1971). The Negro colleges and cultural change. Daedalus Journal of the
American Academy of Arts and Sciences, 100(3), 603-629.
McKillip, Jack. (1987). Need Analysis Tools for the Human Services and Education. Beverly
Hills CA: Sage Publications.
Metcalf, K., Theobald, N., & Gonzalez, G. (2003). State University Roles in the Charter School
Movement. Phi Delta Kappan, 84(7), 542-45.
Mirga, T. (1994). “Rebels with a cause.” The New Democrat, 6(2):17-22.
Molnar, A. (1996). Charter schools: the smiling face of disinvestments. Educational Leadership,
54(2), 9-15.
Moore, M. (2009). Recession hits parochial school enrollment, Retrieved June 7, 2009 from
http://www.gazette.net/stories/03112009/montnew181605
Nathan, J. (1996). Possibilities, Problems, and progress: early lessons from the charter
movement. Phi Delta Kappan, 78(1), 18-23.
Nathan, J. (1998). Heat and light in the charter school movement. Phi Delta Kappan, 79(7), 499-
505.
National Catholic Education Association (NCEA). (2009). A Brief Overview of Catholic Schools
in America. Retrieved September 22, 2009 from http://www.ncea.org/about/
HistoricalOverviewofCatholicSchoolsInAmerica.asp
Portman, T. (2009). Faces of the Future: School Counselors as Cultural Mediators. Journal of
Counseling & Development, 87(1), 21-27.
Powell, S., Edwards, T., Whitty, G., & Wigfall, V. (2003). Education and the middle class.
London: Open University Press.
106
Private Schooling-What is a Private School?, History of Private Schools in the United States. In
Education Encyclopedia. Retrieved September 22, 2009, from
http://education.stateuniversity.com/pages/2334/Private-Schooling.html
Rasi, H. (2000). The task ahead. The Journal of Adventist Education, 63(1), 3, 47.
Rasi, H. (2010). Adventist education in the 21st century: eight significant trends. The Journal of
Adventist Education, 72(5), 6-9.
Robelen, E.W. (1998). A viable path for school reform? Educational Leadership 55(12), 1-7,
Retrieved August 4, 2009 from http://www.ascd.org/publications/newsletters/
infobrief/jan98/num12/tocaspx
Sack-Min, J. (2008) Enrollment surge brings more challenges. American School Board Journal,
195(8), 6-7.
Salazar, P. (2009). Cultural and linguistic impact on ESL assessment. The Journal of Adventist
Education, 71(5), 30-34.
Sautter, R.C. (1993). Charter Schools: A New Breed of Public Schools. Policy Briefs, Report 2.
Oak Brook, Ill.: North Central Regional Educational Laboratory.
Schneider, M., Teske, P., & Marschall, M. (2000). Choosing schools: consumer choice and the
quality of American schools. Princeton, NJ: Princeton University Press.
Simmons, E. S. (2010). Getting down to business, thinking strategically about Adventist
Education. Adventist World, 6(6), 36-37.
Singh, J. (2009) English learners in the classroom. The Journal of Adventist Education, 71(5), 4-
7.
Southern Union Conference Seventh-Day Adventists. (2009). Secondary Education.
Retrieved June 7, 2009, from http://www.southernunion.com/article.php?id=81

107
Stevenson, R. (2001, October/November). Effective recruiting. The Journal of Adventist
Education, 36-40.
Stewart, D.W., & Shamdasani, P.N. (1990). Focus groups: theory and practice. London: Sage
Publications.
U.S. Department of Education, National Center for Education Statistics (2009). Digest of
Education Statistics, 2008 (NCES 2009-020), Chapter 1.
US Department of Education. (2008-09). Preserving a Critical National Asset: Disadvantages
Students and the Crisis in Faith-Based Urban Schools. Washington, DC.
U.S. Department of Labor, Bureau of Labor Statistics. (2010). The employment situation-August
2010. Retrieved from http://stats.bls.gov/news.release/archives/empsit_09032010.pdf
U.S. National Archives and Records Administration. (n.d.). The Bill of Rights: A Transcription
Retrieved from http://archives.gov/exhibits/charters/bill_of_rights.html
Wahlen, P. (2009). Scripture and language learning. The Journal of Adventist Education, 71(5),
43-47.
Wallis, C. (1994, October 31). A Class of Their Own. Time 53-61.
Wells, A.S. (2002). Where charter school policy fails. New York: Teachers College Press.
Witte, J., Schlomer, P., & Shober, A. (2007). Going Charter? A Study of School District
Competition in Wisconsin. Peabody Journal of Education, 82, 410-439.
Zimmer, R., & Buddin, R. (2007). Getting Inside the Black Box: Examining How the Operation
of Charter Schools Affects Performance. Peabody Journal of Education, 82, 231-273.
(ERIC Document Reproduction Service No. EJ772347) Retrieved August 6, 2009, from
ERIC database.

108
ABSTRACT
AN ASSESSMENT OF FACTORS INFLUENCING STUDENT ENROLLMENT
WITHIN THE SOUTHERN UNION CONFERENCE OF SEVENTH-DAY ADVENTIST
SECONDARY SCHOOLS
by
OLIVIA D. BEVERLY
December, 2010
Advisor: Dr. Sharon Elliott
Major: Curriculum and Instruction
Degree: Doctor of Philosophy
Secondary schools operating within the Southern Union Conference of Seventh-day
Adventist are experiencing severe enrollment fluctuations and some instances declines. These
trends and patterns have set off alarms within the Southern Union Adventist educational
establishment and in some quarters have even raised the specter of whether some schools have
long-term sustainability or survivability.
As a consequence of this enrollment dilemma, this research was designed to examine
those factors perceived by educational stakeholders within the Southern Union Conference of
Seventh-day Adventist deemed to be the most significant in influencing student enrollment
trends and patterns.
The methodology for this research consisted of a thorough review of educational K-12
enrollment literature across institutional lines which identified factors influencing student
enrollment. This process yielded 21 factors, which were sub-divided into five categories to
facilitate ease of respondent responses. The five sub-divided categories were: administration,
parents‟ perceptions, external factors, promotional factors and church leadership. These factors

109
were formulated into a questionnaire to key stakeholders for ranking from most important to
least important using a numerical weighting system.
Once the results from the first questionnaire were analyzed using PASW, the number of
factors was reduced from 21 to the 7 that received most significant rankings. These seven factors
were: extracurricular activities, Christian experiences at other schools, quality of education
received in school, the commitment of administrators, personal contacts with potential parents
and students, the cost of education, and the commitment of teachers and support staff. A second
questionnaire was developed from these results and sent to key stakeholders to rank the top
seven factors. An analysis of these results found two factors deemed to be the most significant
among the seven in influencing enrollment patterns within secondary schools. These two factors
were quality of education and cost.
A focus group of key Southern Union stakeholders was convened to develop recruitment
strategies consistent with the research findings. The essential conclusion was that each school
needed to tailor its enrollment and recruitment strategies within the context of its particular
circumstances, and draw from focus group recommendations those deemed to be a goodness of
fit for each school.

110
Autobiographical Statement
Olivia D. Beverly
Education: 2010 PhD Wayne State University, Curriculum & Instruction
1997 Ed.S. Wayne State University, Administration
1993 M.A.T.Wayne State University, Secondary Science & Social Science
1975 B.A. Oakwood College Biology and Chemistry
Professional I have worked in the field of education for over 20 years in various
Experience: roles and capacities. My experiences have included teaching science and
mathematics at middle and secondary levels, Science Department Chair at the
secondary level, and as Principal of a K-12 institution. In addition, I have taught
in Adult Education and other college level bridge programs.
Additional Professional Experiences:
Served as a charter board member for over five years for the Michigan Partnership for New
Education. This became the Office for Charter Schools for the state of Michigan.
Served on district professional development teams, curriculum writing teams, school
improvement teams, and with various mentoring programs.
Conducted in- service training in multiple venues with a primary focus on curriculum and
instruction.
Conducted research at both the undergraduate level and throughout my professional career in
areas of overall educational reform and teacher education.
Extensive work with “high risk” urban and rural youth in dropout prevention programs.
Significant post graduate training and internships at:
Rensselaer Polytechnic Institute in Troy, New York, and the
United States Air Force Academy in Colorado Springs, Colorado
Selected Publications:
Beverly, O. (2008). Continuing the vision. Southern Tidings. 102(5), 28.
Detroit Area Pre-College Engineering Program, High School Curriculum Guide, 1999
UJIMA Academy- MEAP High School Science Manual, 1998, 1999
Beverly, C., Patrick, B., Burns, R. & Beverly, O. (1999). The Congress of National Black
Churches, Inc. Church rebuilding & arson prevention program: overview, insights and
lessons learned.