Assessment of Climate Change Impact on Agriculture Giacomo Trombi, Roberto Ferrise, Marco Moriondo &...
42
Assessment of Climate Change Impact on Agriculture Giacomo Trombi, Roberto Ferrise, Marco Moriondo & Marco Bindi DiSAT – University of Florence Rome – IFAD – July, 24 th 2008 Case studies
-
Upload
arthur-byrd -
Category
Documents
-
view
216 -
download
2
Transcript of Assessment of Climate Change Impact on Agriculture Giacomo Trombi, Roberto Ferrise, Marco Moriondo &...
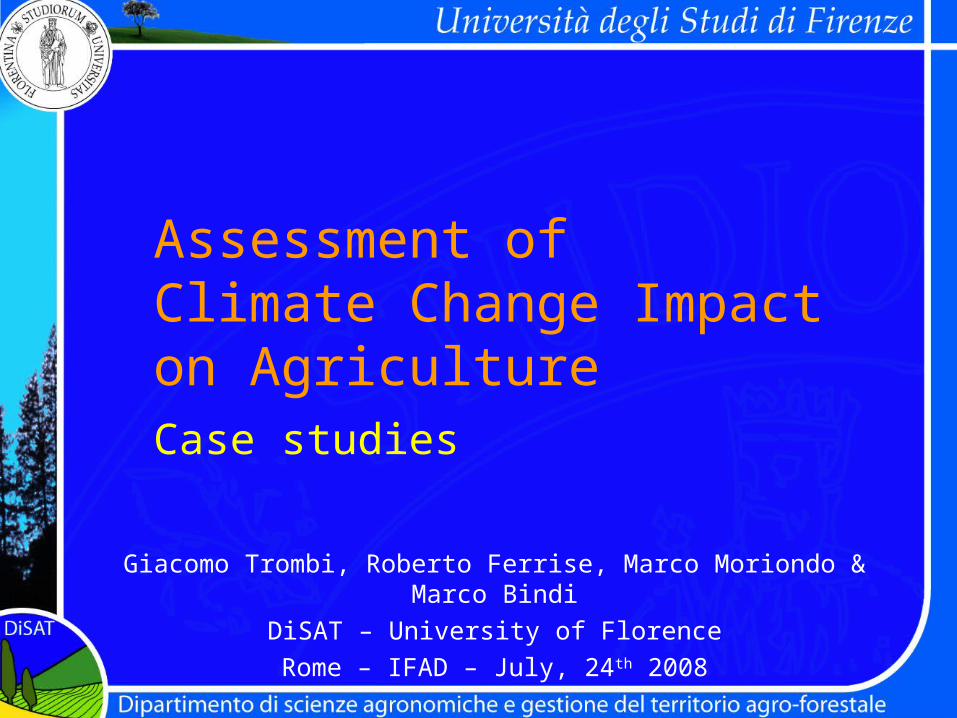
Assessment of Climate Change Impact on Agriculture
Giacomo Trombi, Roberto Ferrise, Marco Moriondo & Marco Bindi
DiSAT – University of Florence
Rome – IFAD – July, 24th 2008
Case studies

Assess the impacts of present and future climate
change on agriculture
ObjectivesObjectives
SummarySummary
DatabaseDatabase
Simulation ModelsSimulation Models
Impact AssessmentImpact Assessment
A/M StrategiesA/M Strategies
ObjectivesObjectives
SummarySummary
DatabaseDatabase
Simulation ModelsSimulation Models
Impact AssessmentImpact Assessment
A/M StrategiesA/M Strategies
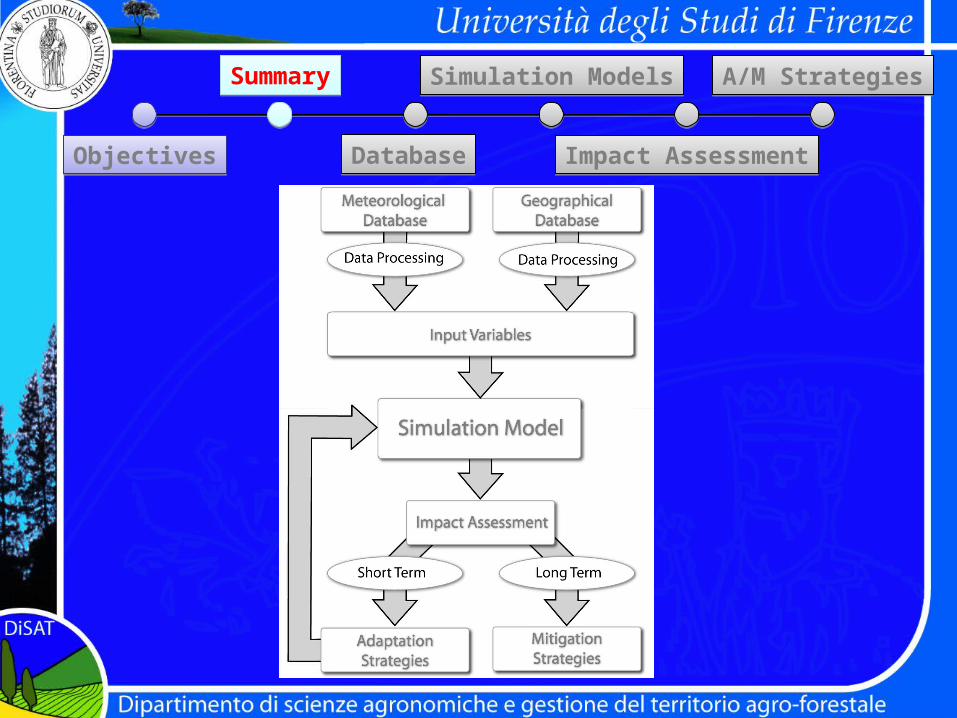
Workflow:
1. Database structuring (meteorological & geographical)– Data retrieving & processing inputs for simulation model
2. Simulation Models– Model choice– Model calibration & validation– Model run (input data from MDB & GDB)
3. Impact assessment (model output)
4. Adaptation/Mitigation strategies
5. Simulation of A/M strategies (steps 2.,3.,4.)
Objectives
Summary
Database
Simulation Models
Impact Assessment
A/M Strategies
Assessments done
• Land Use – Potato Cultivation in S.A.
• Crop – Crops in N.E. Argentina
• Pest & Disease - World
• Erosion – Soil erosion in north Argentina
• Hydrology – Itaipu Hydropower Basin
Impacts of climate change on potato cultivation in South
America
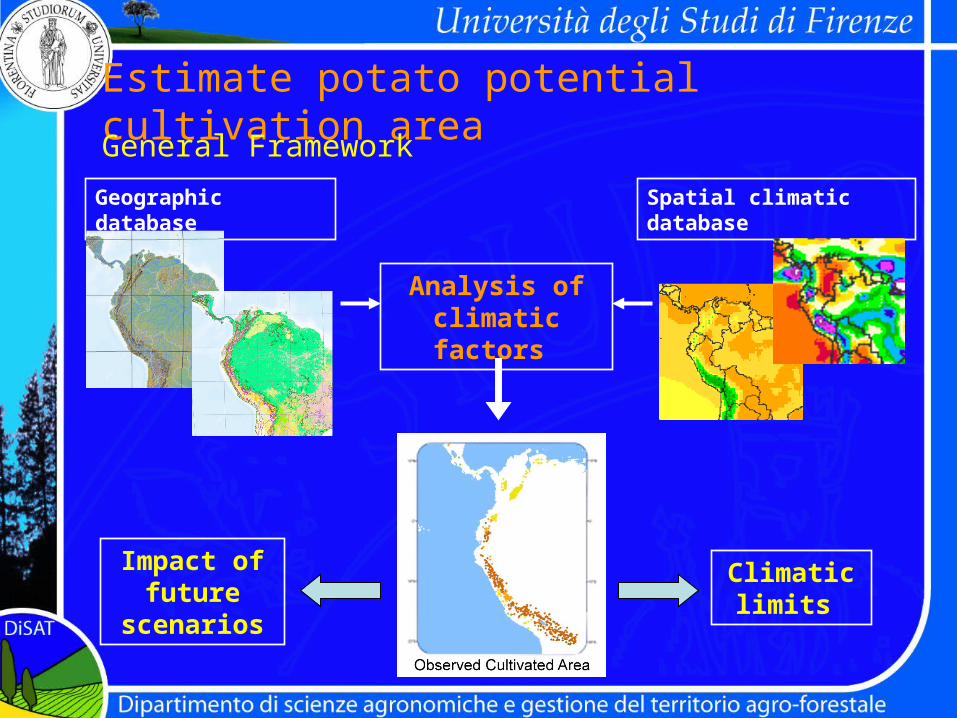
Geographic database Spatial climatic database
Climatic limits
Impact of future
scenarios
Analysis of climatic factors
Estimate potato potential cultivation areaGeneral Framework
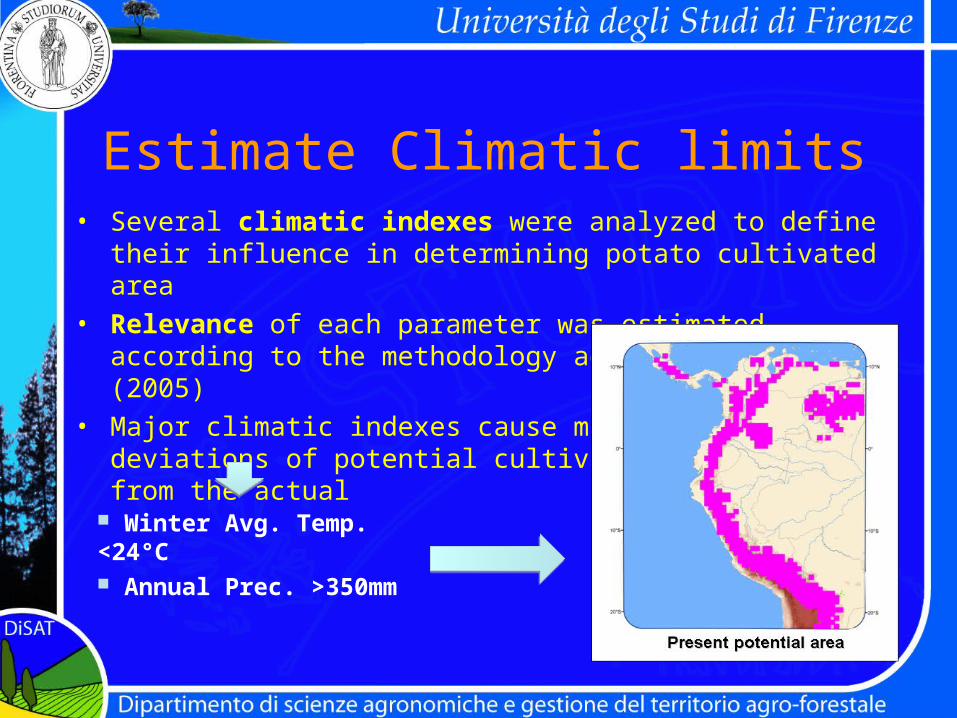
Estimate Climatic limits• Several climatic indexes were analyzed to define their influence
in determining potato cultivated area• Relevance of each parameter was estimated according to the
methodology adopted by Arundel (2005)• Major climatic indexes cause major
deviations of potential cultivation area from the actual
Winter Avg. Temp. <24°C
Annual Prec. >350mm
2070 suitable area2070 suitable area
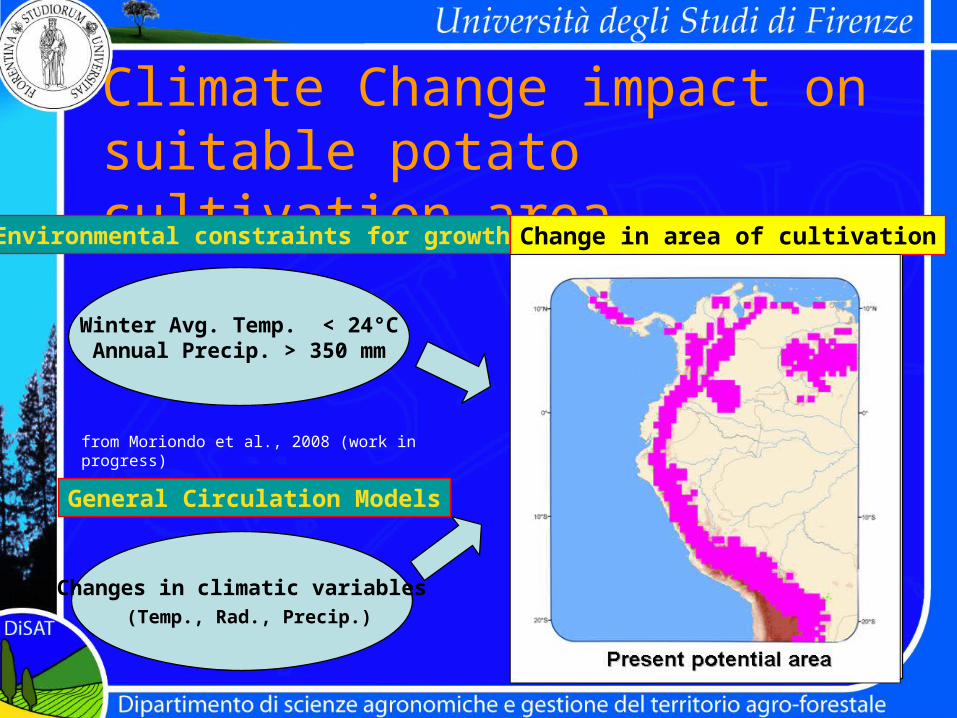
Climate Change impact on suitable potato cultivation area
Winter Avg. Temp. < 24°CAnnual Precip. > 350 mm
Changes in climatic variables (Temp., Rad., Precip.)
General Circulation Models
Environmental constraints for growth Change in area of cultivation
from Moriondo et al., 2008 (work in progress)

Adaptation strategies:heat stress tolerant cv. vs suitable area
Adaptations (hybrids that Adaptations (hybrids that perform better in warmer perform better in warmer environment, e.g. with environment, e.g. with spp. Phureja in their spp. Phureja in their pedigree) may allow:pedigree) may allow:
• to have lower to have lower reduction of reduction of suitable cultivation suitable cultivation areasareas
• to maintain good to maintain good yieldsyields
from Moriondo et al., 2008
(work in progress)
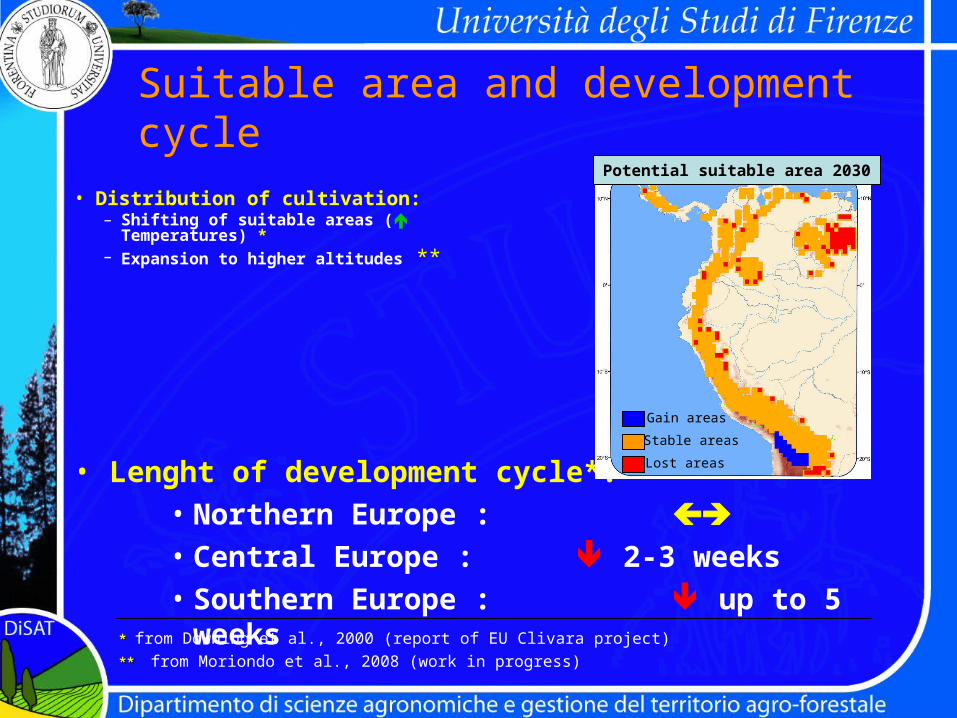
Suitable area and development cycle
• Distribution of cultivation:– Shifting of suitable areas ( Temperatures) *– Expansion to higher altitudes **
* * from Downing et al., 2000 (report of EU Clivara project)
** ** from Moriondo et al., 2008 (work in progress)
• Lenght of development cycle*:
• Northern Europe :
• Central Europe : 2-3 weeks
• Southern Europe : up to 5 weeks
Potential suitable area 2030
Lost areas
Stable areas
Gain areas

Climate change impact assessment in N-E Argentina

Simulating the possible impact of climate change on yield of
•Soybean
•Wheat
Scope of the work
Climate change impact assessment in N-E
Argentina

Observed data (Tmin, Tmax, rainfall and solar radiation) from a net of stations for period 1960-2006
Meteorological available data
Climate change impact assessment in N-E
Argentina
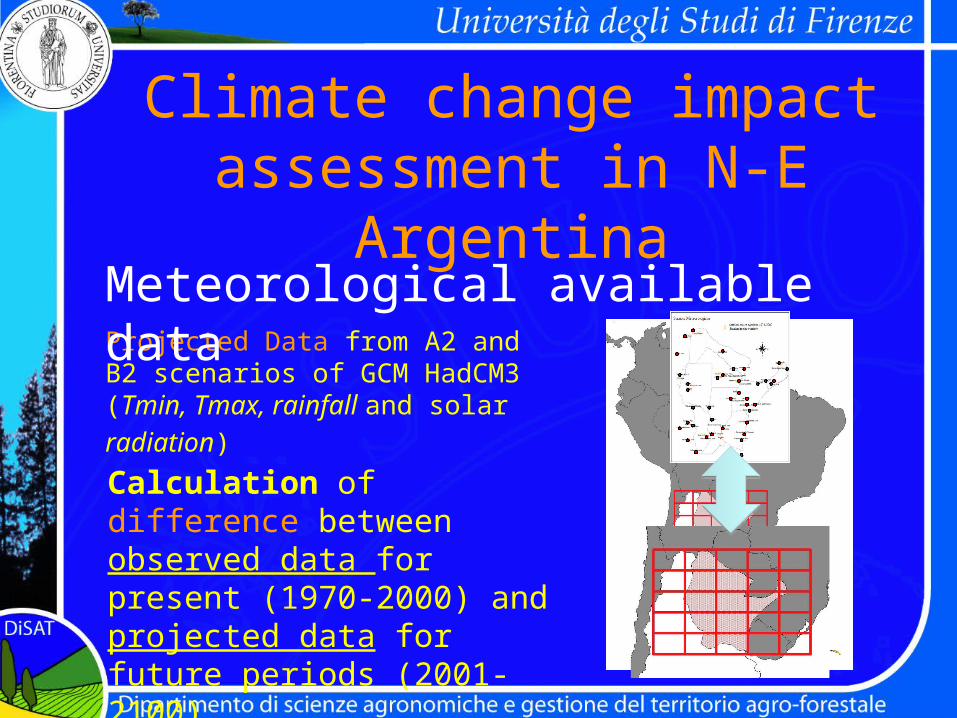
Projected Data from A2 and B2 scenarios of GCM HadCM3 (Tmin,
Tmax, rainfall and solar radiation)
Meteorological available data
Climate change impact assessment in N-E
Argentina
Calculation of difference between observed data for present (1970-2000) and projected data for future periods (2001-2100).
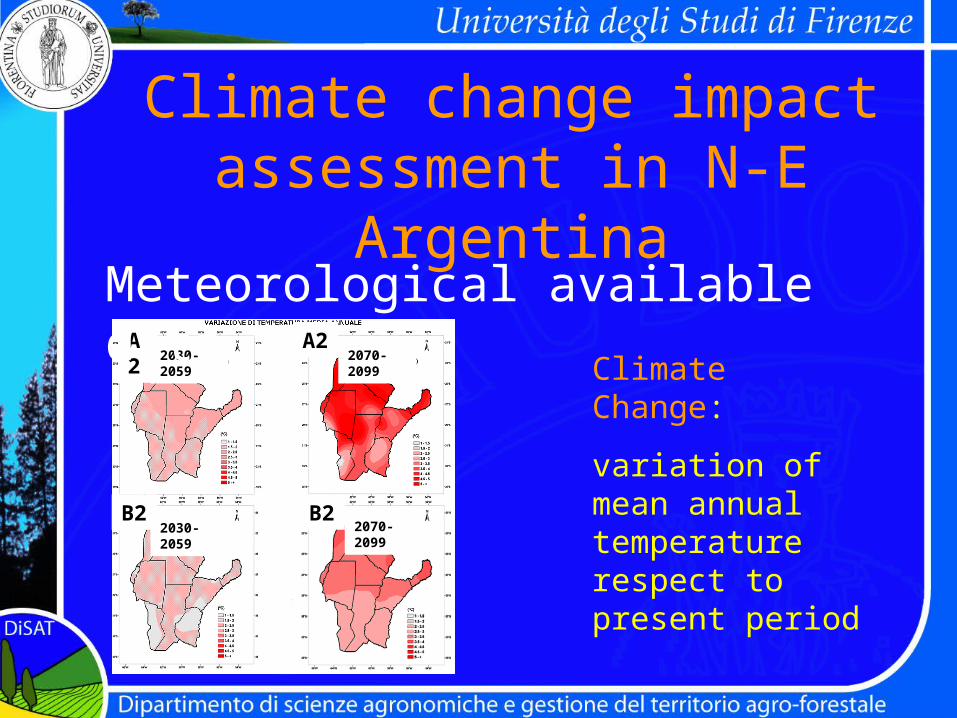
Climate Change:
variation of mean annual temperature respect to present period
A2
B2
B2
A2
2070-2099
2070-2099
2030-2059
2030-2059
Climate change impact assessment in N-E
ArgentinaMeteorological available data

Soil type
(soil depth and granulometry)
Geographical available dataGeographical available data
Climate change impact assessment in N-E
Argentina
Land use
(crop distribution)
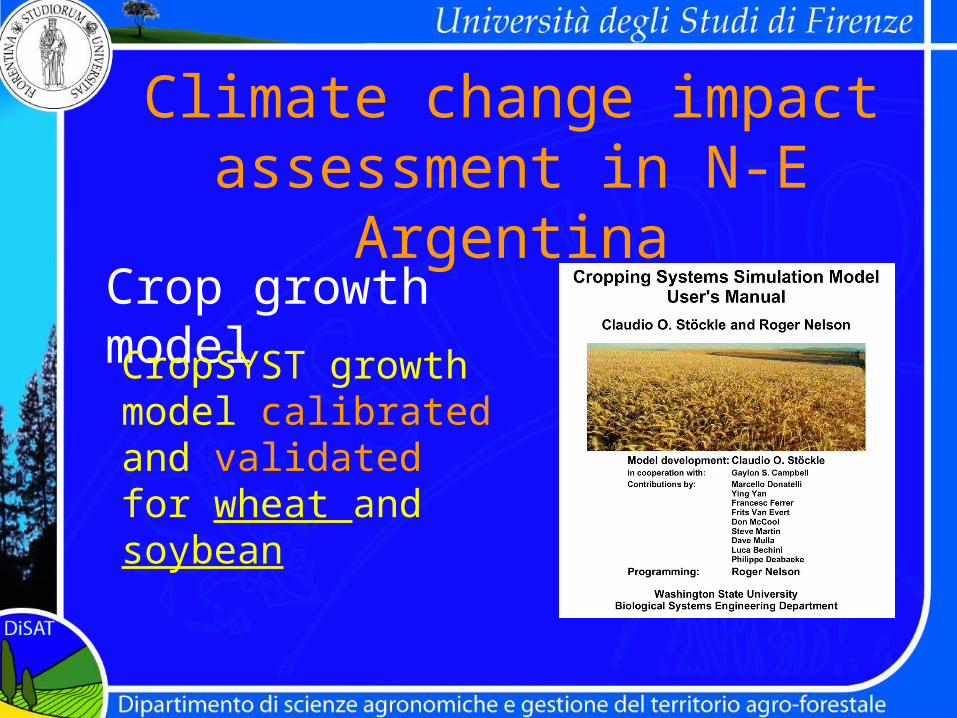
Crop growth model
CropSYST growth model calibrated and validated for wheat and soybean
Climate change impact assessment in N-E
Argentina

Climate change impact assessment in N-E
ArgentinaWheatYieldAssessment
General decrease of wheat yield over the region
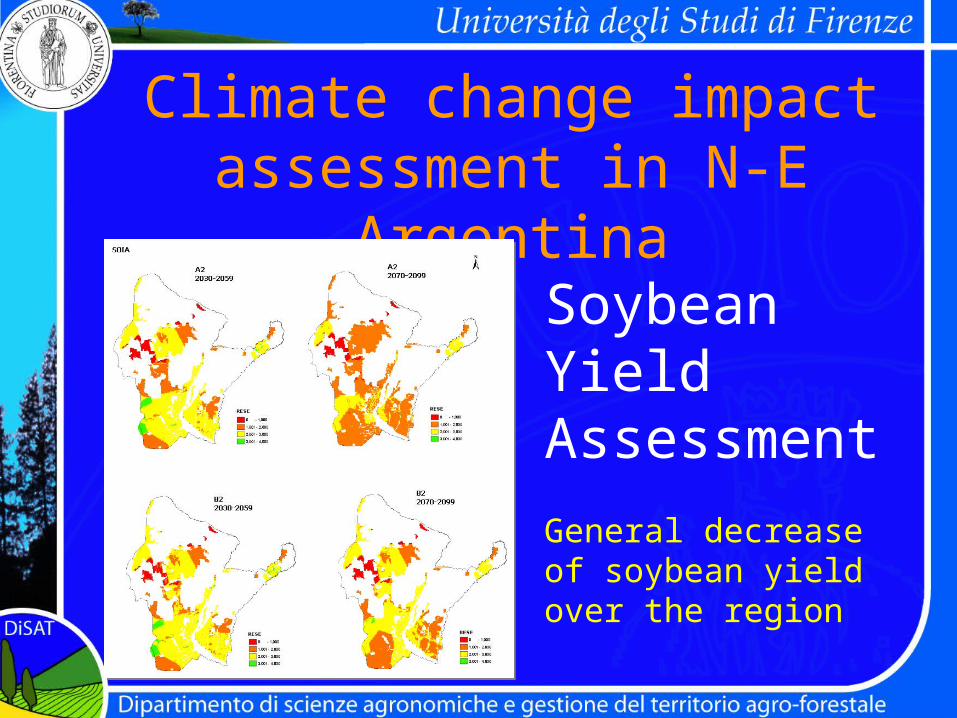
Climate change impact assessment in N-E
ArgentinaSoybeanYieldAssessment
General decrease of soybean yield over the region

Pest and diseases
Impacts on potato Late Blight
Quiroz et al., 2004

• Current meteorological data (1961-1990) were used to estimate the number of pesticide sprays needed to protect potatoes from LB across the world
• Potential potato cultivation area was assessed by using only climatic variables
Impacts on potato Late Blight
• Climate was assumed to change with an average increase of temperature of +2°C over the whole planet
• A forecast model (Simcast) was then run to assess the impact of such a change on LB
Impacts on potato Late Blight
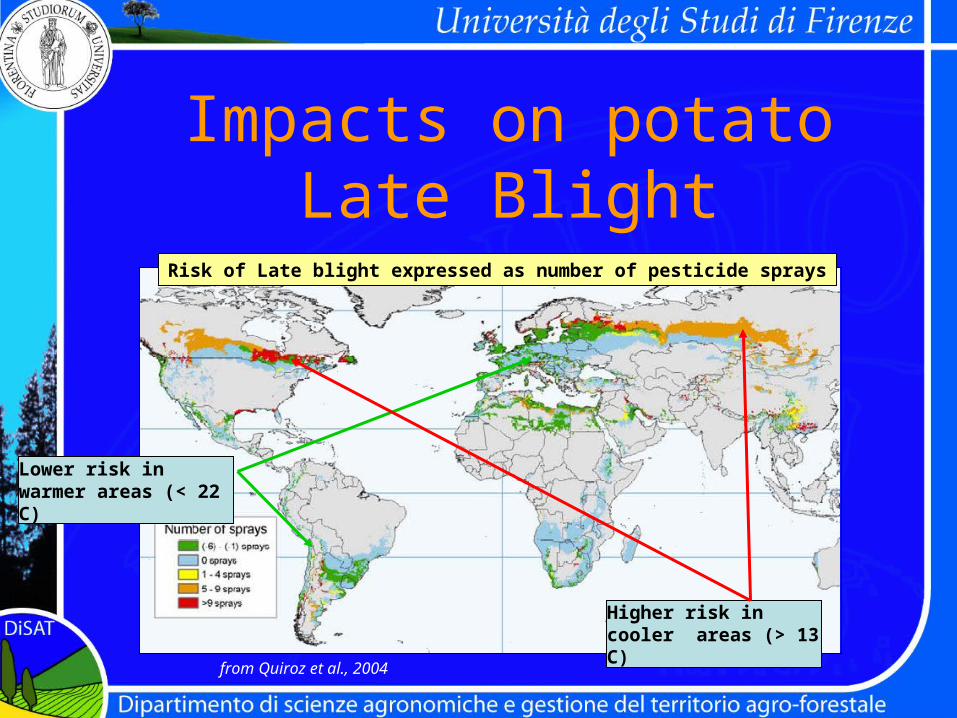
Risk of Late blight expressed as number of pesticide sprays
Lower risk in warmer areas (< 22 C)
Higher risk in cooler areas (> 13 C)
from Quiroz et al., 2004
Impacts on potato Late Blight

A result
• Climate warming up may cause a reduction in the risk of infection in a significant part of the potential area of cultivation
Impacts on potato Late Blight
Impact of climate change on soil erosion in North
Argentina
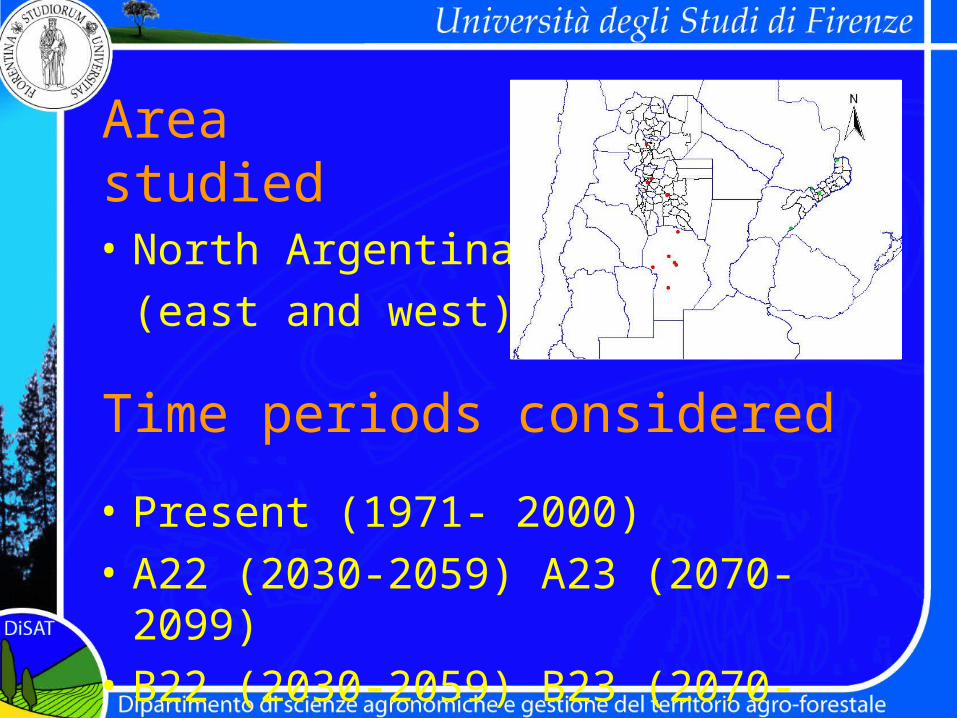
Area studied
• North Argentina
(east and west)
Time periods considered
• Present (1971- 2000)
• A22 (2030-2059) A23 (2070-2099)
• B22 (2030-2059) B23 (2070-2099)

Parameters (I)
• Factor R (Erosion Index) interpolation of data from meteorological stations
• Factor K (Soil Erodibility) from CIOMTA soil map
• Factor L (lot length) Giordani & Zanchi, 1995
• Factor S (slope) Giordani & Zanchi, 1995 on data from DEM

Parameters (II)
• Factor C– Effect of vegetation on soil erosion– Vegetation cover type– Crop rotations– Cultivation techniques– Residue management– Data from CIOMTA soil map reclassified as
in Giordani & Zanchi, 1995.

Results (I)
• Annual Erosion (average) for department (present period)
• Mean variation of annual erosion (%) of future periods in comparison to present (both w/ and w/o applying different land use hypothesis)
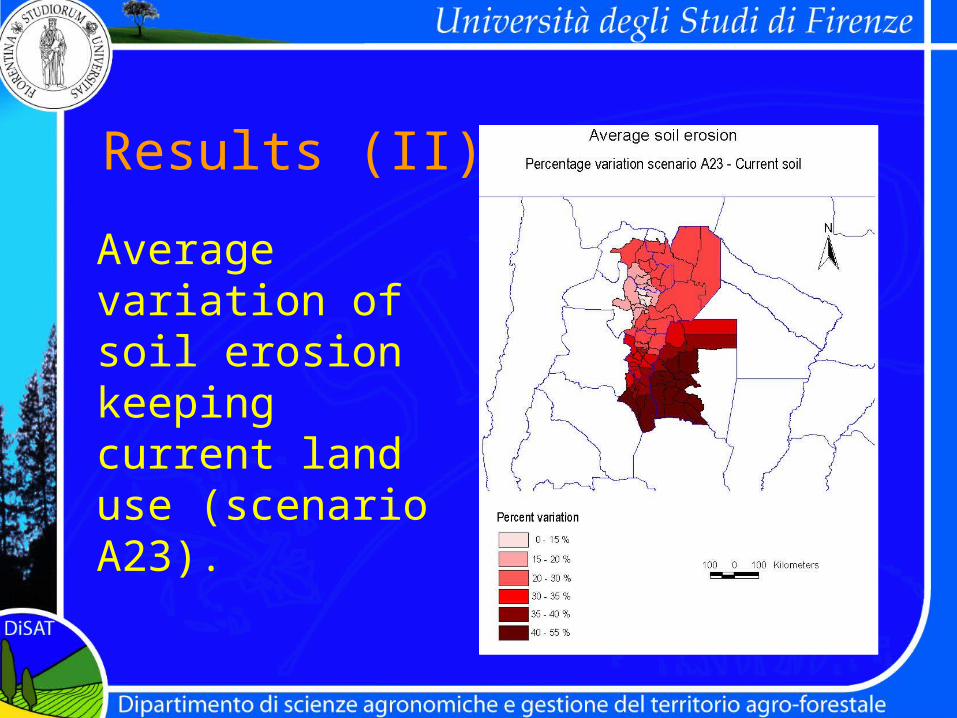
Results (II)
Average variation of soil erosion keeping current land use (scenario A23).
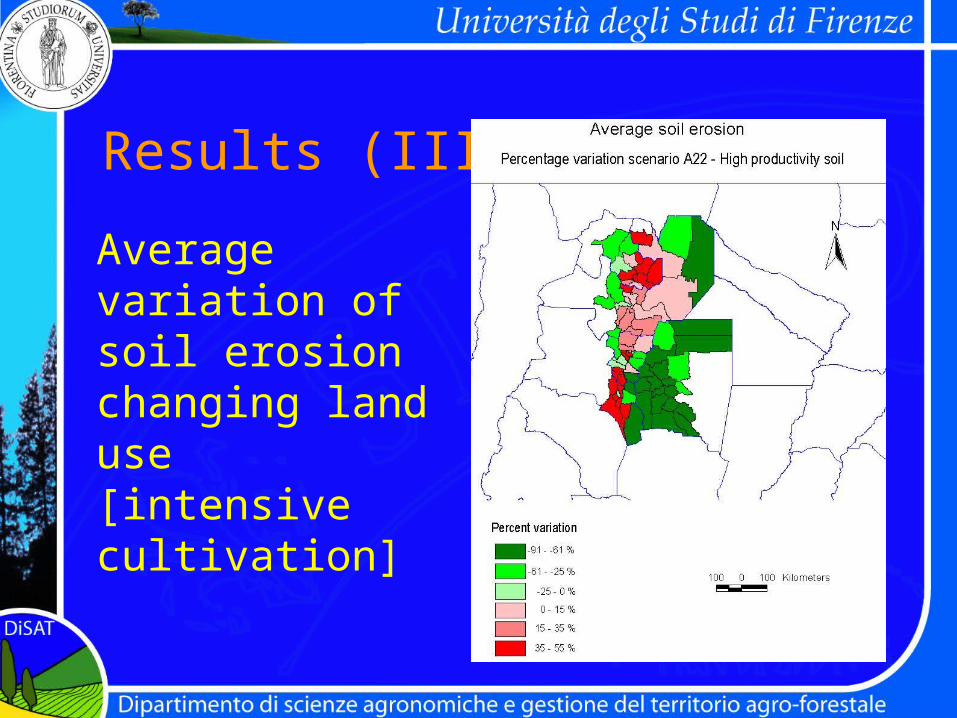
Results (III)
Average variation of soil erosion changing land use [intensive cultivation]
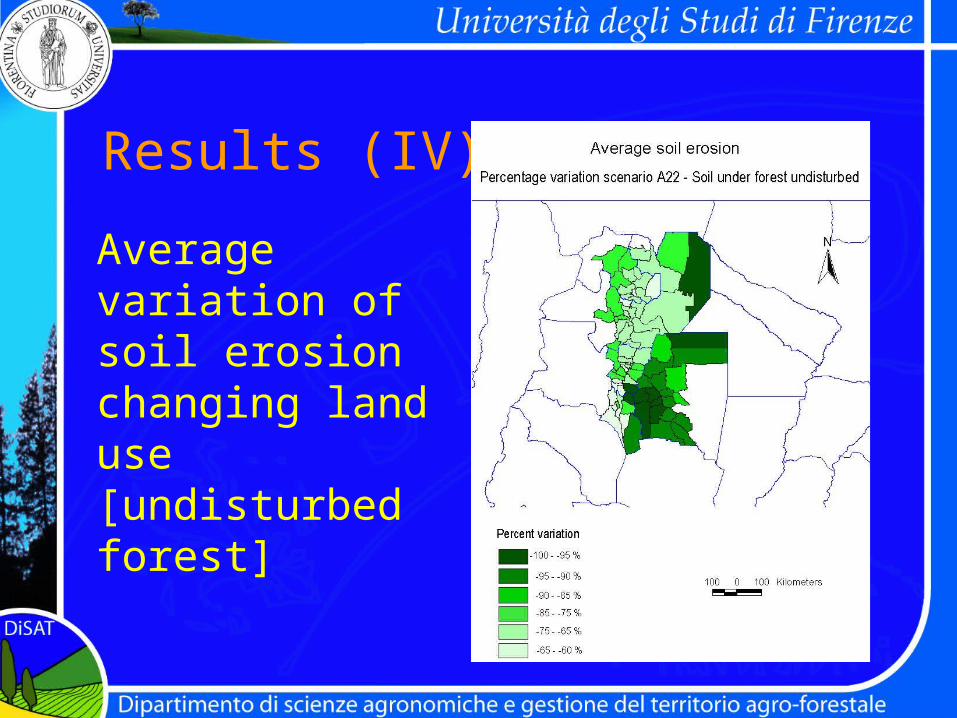
Results (IV)
Average variation of soil erosion changing land use [undisturbed forest]

Conclusions
Land Use changes
Current land use increased erosion
Soil cultivated with graminae and legumes (high production)
less erosion
Soil cultivated with graminae and legumes (moderate production)
increased erosion
Pastures increased erosion
Natural forests less erosion
Altitude and slope cause West zone to have higher erosion values
Impact of climate change on the hydrology of the Itaipu
hydropower basin
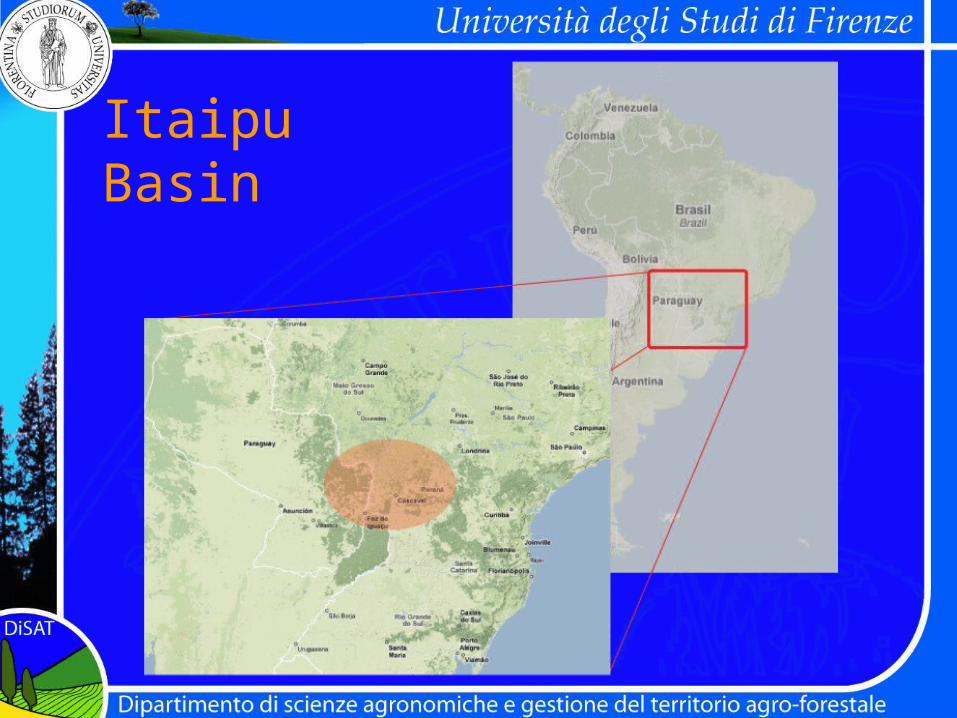
Itaipu Basin

MethodologyCO2-Emission scenariosGeneral Circulation Models(GCMs)
Downscaling (Statistical)Stochastic Weather Generator
Local observed climate(Temp, Precip, flow river)
Stochastic Scenarios – Base/Climate change Scenarios (Temp, Precip, Evap)
Hydrologic model(Precipitation/runoff)
Changes in runoffHydrologic model perfomace
Changes in Temp, Precip, EvapClimate local characteristics
Methodological schematic
Observed records
Simulatedriver flow
Precipitation / Evaporation
runoff
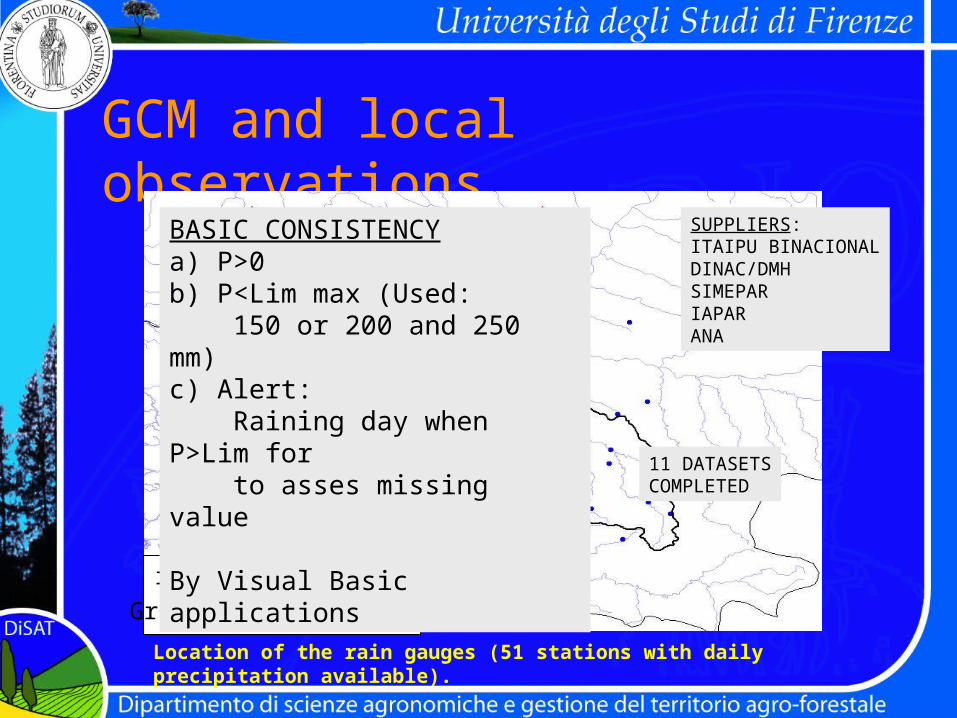
GCM and local observations
Location of the rain gauges (51 stations with daily precipitation available).
rain gauge
Grid point of CGCM2
SUPPLIERS:ITAIPU BINACIONALDINAC/DMHSIMEPARIAPARANA
11 DATASETSCOMPLETED
BASIC CONSISTENCYa) P>0b) P<Lim max (Used: 150 or 200 and 250 mm)c) Alert: Raining day when P>Lim for to asses missing value
By Visual Basic applications
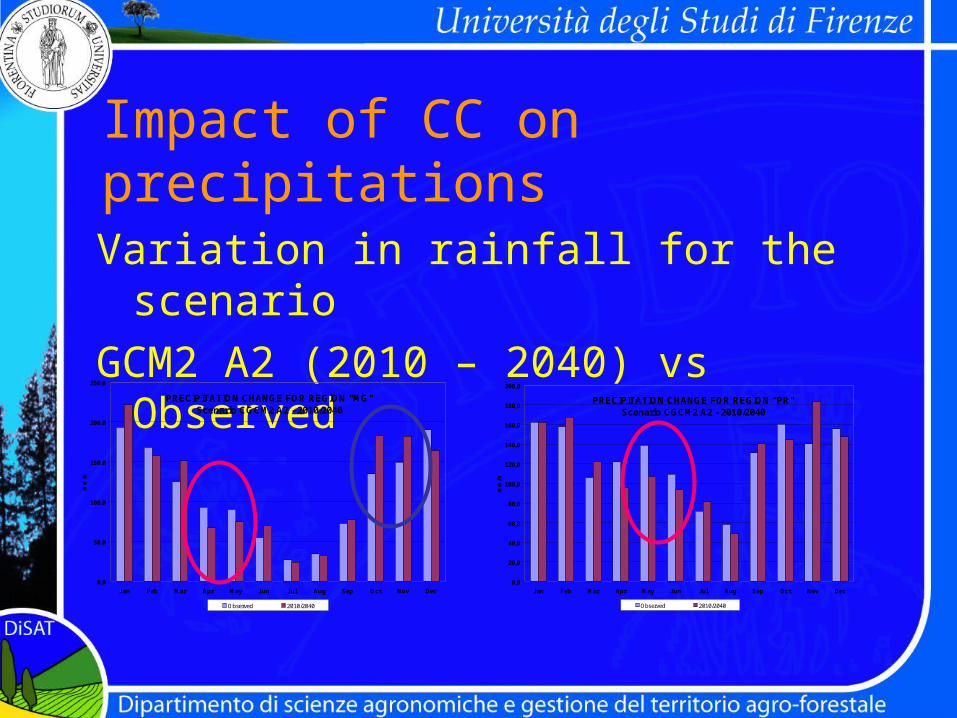
Impact of CC on precipitations
Variation in rainfall for the scenario
GCM2 A2 (2010 – 2040) vs Observed
PRECIPITATION CHANGE FOR REGION "PR"Scenario CGCM2 A2 - 2010/2040
0,0
20,0
40,0
60,0
80,0
100,0
120,0
140,0
160,0
180,0
200,0
Jan Feb Mar Apr May Jun Jul Aug Sep Oct Nov Dec
mm
/m
Observed 2010/2040
PRECIPITATION CHANGE FOR REGION "MG"Scenario CGCM2 A2 - 2010/2040
0,0
50,0
100,0
150,0
200,0
250,0
Jan Feb Mar Apr May Jun Jul Aug Sep Oct Nov Dec
mm
/m
Observed 2010/2040

Changes in runoff• Runoff is expected to increase over west side of the
basin, while decreasing on the opposite side
Changes in mean annual runoff in scenario CGCM2-A2 2010/2040 by sub-basin.
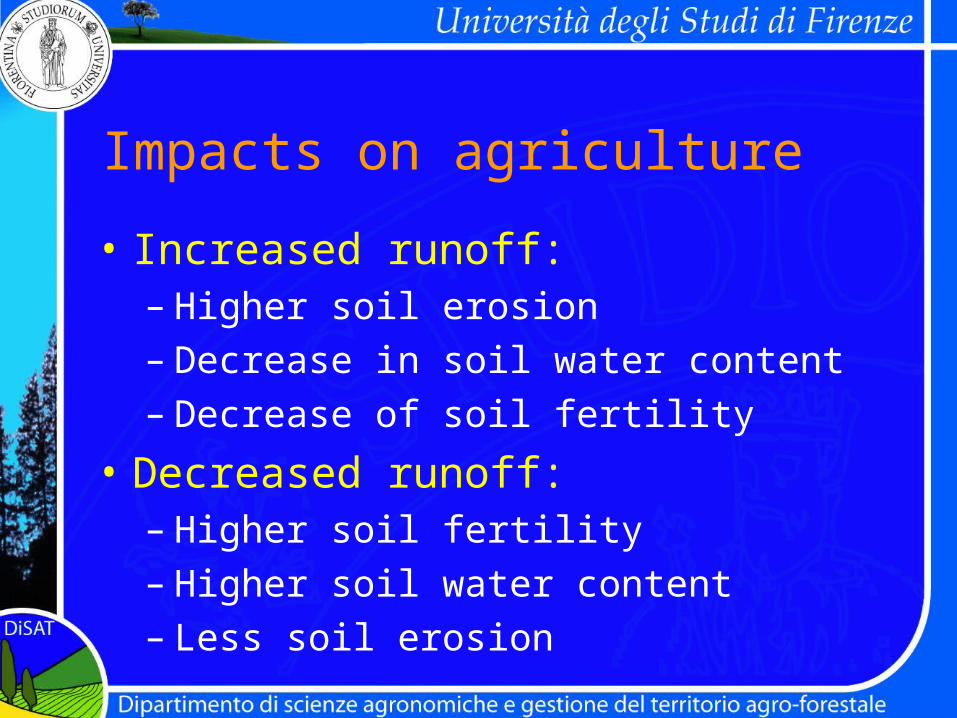
Impacts on agriculture
• Increased runoff:– Higher soil erosion– Decrease in soil water content– Decrease of soil fertility
• Decreased runoff:– Higher soil fertility– Higher soil water content– Less soil erosion
Thank you for your attention