
Assessment of Baffin Bay Serpulid Reef Communities as ...
27
Assessment of Baffin Bay Serpulid Reef Communities as Critical Habitat for Black Drum Prey Resources Publication CBBEP – 135 Project Number – 1922 August 2019 Prepared by: Jennifer Pollack, Ph.D., Principal Investigator Terry Palmer, M.S. Natasha Breaux, M.S. Texas A&M University-Corpus Christi Harte Research Institute for Gulf of Mexico Studies 6300 Ocean Drive, Unit 5869 Corpus Christi, TX 78412 Submitted to: Coastal Bend Bays & Estuaries Program 615 N. Upper Broadway, Suite 1200 Corpus Christi, TX 78401 The views expressed herein are those of the authors and do not necessarily reflect the views of CBBEP or other organizations that may have provided funding for this project.
Transcript of Assessment of Baffin Bay Serpulid Reef Communities as ...

Assessment of Baffin Bay Serpulid Reef Communities as Critical Habitat for Black Drum Prey Resources
Publication CBBEP – 135 Project Number – 1922
August 2019
Prepared by:
Jennifer Pollack, Ph.D., Principal Investigator
Terry Palmer, M.S. Natasha Breaux, M.S.
Texas A&M University-Corpus Christi Harte Research Institute for Gulf of Mexico Studies
6300 Ocean Drive, Unit 5869 Corpus Christi, TX 78412
Submitted to: Coastal Bend Bays & Estuaries Program
615 N. Upper Broadway, Suite 1200 Corpus Christi, TX 78401
The views expressed herein are those of the authors and do not necessarily reflect the views of CBBEP or other organizations that may have provided funding for this project.
Assessment of Baffin Bay Serpulid Reef Communities as Critical Habitat for Black Drum Prey Resources
Final Technical Report
by: Jennifer Pollack, Ph.D., Principal Investigator
Terry Palmer, M.S. Natasha Breaux, M.S.
Texas A&M University-Corpus Christi
Harte Research Institute for Gulf of Mexico Studies 6300 Ocean Drive, Unit 5869
Corpus Christi, TX 78412
Final Report to:
Coastal Bend Bays & Estuaries Program
August 30, 2019

Table of Contents
Introduction ..................................................................................................................................... 1
Methods........................................................................................................................................... 2
History of Study Area ................................................................................................................. 2
Present-Day Study Area .............................................................................................................. 3
Study Design ............................................................................................................................... 3
Water Quality .............................................................................................................................. 4
Quantitative Fauna Analyses ...................................................................................................... 4
Sampling ................................................................................................................................. 4
Laboratory analysis ................................................................................................................. 4
Statistical Analysis .................................................................................................................. 5
Stable Isotope Analyses .............................................................................................................. 5
Sampling ................................................................................................................................. 5
Laboratory Sample Preparation .............................................................................................. 6
Stable Isotope Statistical Analyses ......................................................................................... 7
Results ............................................................................................................................................. 7
Water Quality .............................................................................................................................. 7
Quantitative Fauna Analyses ...................................................................................................... 9
Stable Isotope Analyses ............................................................................................................ 15
Discussion ..................................................................................................................................... 20
The Importance of Serpulid Reefs in Baffin Bay ..................................................................... 20
The Importance of Serpulid Reefs in the Baffin Bay Food Web .............................................. 21
The Future of Baffin Bay’s Serpulid Reefs .............................................................................. 21
References ..................................................................................................................................... 22

1
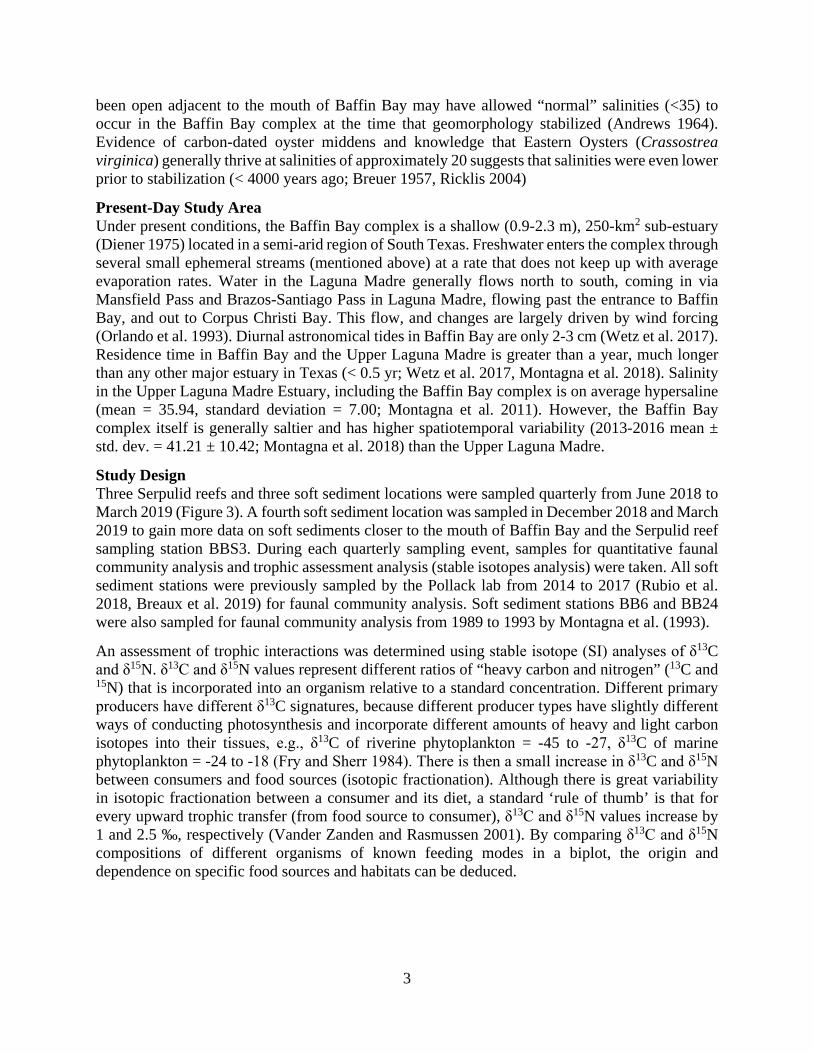
Introduction Despite the hydrological variability in the eight major Texas estuaries (Sabine-Neches, Trinity-San Jacinto, Lavaca—Colorado, Guadalupe, Mission-Aransas, Nueces, Upper and Lower Laguna Madre), the sea floor of each is dominated by soft sediments. However, natural hard structure in the form of calcareous reefs exist to various extents within each major estuary. These reefs directly and indirectly enhance ecosystem production and provide valuable ecosystems services, such as erosion control, water filtration, and food provision. One estuary, the Upper Laguna Madre Estuary, is different to all other major Texas estuaries in that its reefs are not created by the commercially important Eastern Oyster, Crassostrea virginica. The Upper Laguna Madre Estuary, specifically in its secondary bay, Baffin Bay, is famous for its extensive Serpulid reefs, built not by oysters, but millions of tiny (<2 cm) Serpulid worms (polychaeta; Figure 1).
Serpulids, like oysters, are sessile suspension feeders. Serpulids occur in a wide range of aquatic habitats, from freshwater to salinities of up to 55, but most taxa are primarily marine (ten Hove and van den Hurk 1993). In contrast, the Eastern Oyster is much more common in salinities <25. Serpulids use a feathered radiole (Figure 2) to collect suspended particles from the water column and respire (ten Hove and van den Hurk 1993). Filter feeding by Serpulids has been demonstrated to “reduce water turbidity, enhance nutrient recycling, and regulate abundances of phytoplankton” (Leung and Chueng 2017 and references therein). Serpulid worms settle on natural and man-made hard substrates and, except for one Sabellid genus, are the only polychaete family to secrete a calcareous tube (usually calcite and/or aragonite) around themselves as they grow (Bastida-Zavala 2017).
The origin of Serpulid reefs of Baffin Bay is uncertain. The most commonly accepted age of the reefs is based on
radiocarbon dating and is estimated to be 3000 years old (Valastro et al. 1972). Hedgpeth (1953) cited notes by W. Armstrong Price (1950) that claimed that there were active Serpulid reefs between 1875 and 1910. However, no living Serpulids were found after this until the early 1970s (Breuer 1957, Brown et al. 1977). It is estimated that the original Serpulid reefs in Baffin Bay were formed, and maximum reef growth occurred, under polyhaline (salinity 18-30) conditions (Andrews 1964), although other evidence shows that conditions could just as likely have been euhaline (salinity 30 to 40; ten Hove and van den Hurk 1993). The species that constructed the reefs is unknown because Serpulid worm taxonomy is largely based on characteristics of the animal itself, rather than of the tube (ten Hove and van den Hurk 1993). There is only one Serpulid
Figure 1. Piece of Serpulid Reef
Figure 2. Serpulid worm Hydroides dianthus from Baffin Bay (excluding calcareous tube)
2
species that inhabits the present-day Baffin Bay Serpulid reefs, despite others being present in the neighboring Nueces and Mission-Aransas Estuaries. It is possible that this current species, Hydroides dianthus, could have formed the reefs that currently exist in Baffin Bay, however it could also be a number of similar species, such as Hydroides elegans, Ficopomatus enigmaticus, or a species that has since become extinct (ten Hove and van der Hurk 1993).
Hydroides dianthus is a common Serpulid (Bastida-Zavala et al. 2017) with a wide recorded tolerance of salinities (1-51.7) and temperatures (3-30 °C), enabling it to successfully invade waters of the world including those in China (salinity 33, Dong et al. 2018), Italy (salinity 13-48, Bianchi and Morri 2001), and Delaware Bay, USA (salinity 23-28, Maurer et al. 1979, Haines and Maurer 1980). The relatively high salinities of Baffin Bay may suit H. dianthus, although there is some evidence that biological interactions of macroalgae and mussels at salinities above 30 limit the distribution of the Serpulid (Otani and Yamanashi 2010). The Serpulid reefs of Baffin Bay are often covered by filamentous algae, barnacles, mussels, and bryozoans, which undoubtably are affected by changes in water quality, including salinity, and likely influence the growth and recruitment of H. dianthus.
The diverse fauna and flora that occur on Baffin Bay’s serpulid reefs form a unique ecosystem that has been favored fishing grounds amongst local fishermen. Despite their popularity for fishing, their ecological role is not well understood. Past studies have shown the importance of Serpulid reefs as habitat for fish and invertebrate species and that the reefs are degrading in size and distribution compared to historic levels (Hardegree 1997; Tunnell et al. 2001). Therefore, it is critical to enhance our understanding of their ecological role to support conservation efforts. This study aimed to assess the importance of Serpulid reef as habitat for invertebrate species and investigate the role of these reef-resident species as prey items for commercially and recreationally important fish species, particularly Black Drum. There are three objectives addressed in this study:
1) Determine differences between faunal composition of the reef and soft sediment to determine the level of enhancement that the reefs provide,
2) Determine changes in reef community composition over time to determine the influence of varying hydrological conditions on faunal composition,
3) Determine the role of the reefs in the food web, particularly with respect to the diet of recreationally important fish species.
Methods History of Study Area The Baffin Bay complex forms the upstream-most part of the Upper Laguna Madre Estuary, South Texas. The Baffin Bay complex is a drowned river valley sub-estuary that began forming approximately 20,000 years ago as the Los Olmos, San Fernando and Petronila Creeks cut deep valleys into the currently submerged land to what is now Laguna Salada, Cayo del Grullo, and Alazan Bays (Brown et al. 1977). Sea level rose during the mid-Holocene warm period (5000-7000 years ago) and the geomorphology stabilized to its current position at around 3000 years ago (Dial and Black 2019). In its current position, Laguna Salada, Cayo del Grullo, and Alazan Bays flow into Baffin Bay, the largest and deepest of the bays that make up the Baffin Bay complex. The Baffin Bay complex flows into the Upper Laguna Madre, a hypersaline lagoon that is connected to the Gulf of Mexico via Corpus Christi Bay to the north and the lower Laguna Madre to the south. Direct exchange between Baffin Bay, the Laguna Madre, and the Gulf of Mexico is blocked by Padre Island. It is thought that greater freshwater inflows and a tidal pass that may have
3
been open adjacent to the mouth of Baffin Bay may have allowed “normal” salinities (<35) to occur in the Baffin Bay complex at the time that geomorphology stabilized (Andrews 1964). Evidence of carbon-dated oyster middens and knowledge that Eastern Oysters (Crassostrea virginica) generally thrive at salinities of approximately 20 suggests that salinities were even lower prior to stabilization (< 4000 years ago; Breuer 1957, Ricklis 2004)
Present-Day Study Area Under present conditions, the Baffin Bay complex is a shallow (0.9-2.3 m), 250-km2 sub-estuary (Diener 1975) located in a semi-arid region of South Texas. Freshwater enters the complex through several small ephemeral streams (mentioned above) at a rate that does not keep up with average evaporation rates. Water in the Laguna Madre generally flows north to south, coming in via Mansfield Pass and Brazos-Santiago Pass in Laguna Madre, flowing past the entrance to Baffin Bay, and out to Corpus Christi Bay. This flow, and changes are largely driven by wind forcing (Orlando et al. 1993). Diurnal astronomical tides in Baffin Bay are only 2-3 cm (Wetz et al. 2017). Residence time in Baffin Bay and the Upper Laguna Madre is greater than a year, much longer than any other major estuary in Texas (< 0.5 yr; Wetz et al. 2017, Montagna et al. 2018). Salinity in the Upper Laguna Madre Estuary, including the Baffin Bay complex is on average hypersaline (mean = 35.94, standard deviation = 7.00; Montagna et al. 2011). However, the Baffin Bay complex itself is generally saltier and has higher spatiotemporal variability (2013-2016 mean ± std. dev. = 41.21 ± 10.42; Montagna et al. 2018) than the Upper Laguna Madre.
Study Design Three Serpulid reefs and three soft sediment locations were sampled quarterly from June 2018 to March 2019 (Figure 3). A fourth soft sediment location was sampled in December 2018 and March 2019 to gain more data on soft sediments closer to the mouth of Baffin Bay and the Serpulid reef sampling station BBS3. During each quarterly sampling event, samples for quantitative faunal community analysis and trophic assessment analysis (stable isotopes analysis) were taken. All soft sediment stations were previously sampled by the Pollack lab from 2014 to 2017 (Rubio et al. 2018, Breaux et al. 2019) for faunal community analysis. Soft sediment stations BB6 and BB24 were also sampled for faunal community analysis from 1989 to 1993 by Montagna et al. (1993).
An assessment of trophic interactions was determined using stable isotope (SI) analyses of δ13C and δ15N. δ13C and δ15N values represent different ratios of “heavy carbon and nitrogen” (13C and 15N) that is incorporated into an organism relative to a standard concentration. Different primary producers have different δ13C signatures, because different producer types have slightly different ways of conducting photosynthesis and incorporate different amounts of heavy and light carbon isotopes into their tissues, e.g., δ13C of riverine phytoplankton = -45 to -27, δ13C of marine phytoplankton = -24 to -18 (Fry and Sherr 1984). There is then a small increase in δ13C and δ15N between consumers and food sources (isotopic fractionation). Although there is great variability in isotopic fractionation between a consumer and its diet, a standard ‘rule of thumb’ is that for every upward trophic transfer (from food source to consumer), δ13C and δ15N values increase by 1 and 2.5 ‰, respectively (Vander Zanden and Rasmussen 2001). By comparing δ13C and δ15N compositions of different organisms of known feeding modes in a biplot, the origin and dependence on specific food sources and habitats can be deduced.

4
Figure 3. Map of the Baffin Bay complex showing reef and soft sediment sampling locations, and estimated rock reef presence (NOAA 2018).
Water Quality Water quality (including water temperature, salinity, dissolved oxygen (DO), and pH) was measured using a YSI Pro DSS. Measurements were taken approximately 10 cm below the water surface and 20 cm above the sediment bottom.
Quantitative Fauna Analyses Sampling Small pieces of Serpulid reef were collected by hand in the field at each of the three Serpulid reef stations to extract benthic invertebrates for abundance and biomass determinations. Reef pieces were immediately transferred to a 500 µm mesh ‘bio-bag’ to prevent loss of invertebrates in the water column. Three replicate chunks were collected at each reef station and sampling date and preserved in 5 % buffered formalin.
At soft sediment stations, a 6.7-cm diameter core tube (35.4 cm2 area) was used to sample to a depth of 10 cm (following Street et al. 1997) to extract benthic infaunal invertebrates. Three replicate cores were collected from each station on each sampling date. Cores were split into 0-3 cm and 3-10 cm sections and preserved in 5 % buffered formalin.
Laboratory analysis In the laboratory, volume (mL of water displaced) measurements for reef samples were obtained, then molluscs and other hard-shelled organisms were counted and identified. Pieces of reef were placed in 12 N HCL for 24 hours to dissolve reef substrate. Remaining organisms were rinsed onto a 500 µm sieve and identified under a dissecting microscope to the lowest possible taxon (usually
5
species). A Folsom plankton splitter was used to obtain a subsample for processing when organisms in reef samples were too abundant to be counted.
Organisms from soft-sediment core samples were extracted on a 500 µm sieve, sorted using a stereo microscope, identified to the lowest practical identifiable level (usually species), and enumerated.
Dry-weight biomass measurements for both reef and soft-sediment matrices were obtained after combining individual macrofauna into species or family groups and drying at 55 °C for 24 h. Mollusc shells were removed with 1 N HCl prior to drying and weighing.
Statistical Analysis Spearman rank correlations were fit for macrofaunal abundance and biomass to evaluate the effects of salinity change and other water quality variables on both reef and sediment fauna. Community composition of faunal communities were analyzed using multivariate statistical methods. Non-metric multi-dimensional scaling (nMDS; Clarke 1993) was used to compare numbers of individuals of each species for each sample (station-date-replicate combination). The distance between station - date combinations in a nMDS plot can be related to community similarities or differences between different stations. Differences and similarities among communities were highlighted using cluster analysis using the group average method. Multivariate analyses were performed on a Bray–Curtis similarity matrix on loge(x+1) transformed data using Primer 7 software (Clarke and Gorley 2015).
Trophic Function Analyses Sampling Sediment organic matter (SOM) and suspended particulate organic matter (SPOM) were collected via benthic coring and water collection, respectively, during benthic sampling events. Collections for stable isotope analyses of macrofauna were made with additionally collected reef pieces and sediment cores. Three additional cores were sieved in a biobag in the field, with retained items and whole reef pieces stored in containers filled with local water inside a cooler until the end of the field day, when they were transported to the laboratory.
Fish were collected in two ways: Reef-dwelling fish (Pinfish [Lagodon rhomboides] and Sheepshead [Archosargus probatocephalus]) were collected from reef stations using hook and line or a speargun. Sport fish (Black Drum [Pogonias cromis], Red Drum [Sciaenops ocellatus], and Spotted Seatrout [Cynoscion nebulosus]) were collected opportunistically through partnerships with commercial and recreational fishermen. Up to 15 sport fish (including at least 5 Black Drum) were collected from Baffin Bay 6-8 weeks after each benthic sampling event. Black Drum were purchased from local trotline fishermen, while tissue samples from other species (particularly non-commercial species i.e. Red Drum, Spotted Seatrout) were collected from anglers at Kaufer-Hubert boat launch in Riviera Beach, Texas. These fish were caught in the Baffin Bay complex, but not necessarily around Serpulid reefs. Length and other standard measurements of all fish were taken. Tissues were extracted upon receipt of samples. All food web tissue and organic matter samples were stored on ice until returning to the laboratory to be stored at -20 °C.
6
Laboratory Sample Preparation Suspended particulate organic matter (SPOM) water samples were filtered through pre-combusted glass fiber filters upon returning to the laboratory. The resulting filters were then dried in a vacuum freeze-drier. Samples to be analyzed for Carbon were decarbonated to remove excess organic carbon by HCL fuming in a vacuum-enclosed system.
Sediment organic matter (SOM) samples were sieved over a 500 µm mesh to remove large pieces of shell hash, then dried in a vacuum freeze-drier. Samples to be analyzed for Carbon were decarbonated by adding 1 N HCL until cessation of bubbling. SOM samples were then dried in a dry-block heater, rinsed with deionized water, and freeze-dried again.
Macrofauna collected for stable isotope analyses were sieved live on a 500 µm mesh within 24 hr of sample collection, separated by taxa, and placed in aquaria to allow gut evacuation. For each species identified, 3 individuals of differing size classes were reserved when possible and stored at -20°C in a freezer. Organisms were later vacuum freeze-dried.
Specific instructions for preparing different taxa types for stable isotope analyses are listed below.
• Crabs: For large crabs the claw meat was removed only. For small crabs, the entire body was used.
• Bivalves: Only the soft parts of organisms were used after manually removing all shell. • Barnacles: Only the soft parts of organisms were used after manually removing all shell. • Gastropods: The entire animal was used after manually removing the shell and operculum. • Isopods/worms/amphipods: The entire organisms were used. Epaxial fish muscle tissue samples for stable isotope analysis were removed from the anterior portion of the fillet using a clean stainless-steel scalpel rinsed with deionized water between each sample. Any adhering flesh/scales were removed from the tissue samples. Clean tissues were placed in individual microtubules and stored at -20 °C until further analysis.
All dried samples were ground (using mortar and pestle or ball mill) to a homogenous fine powder and stored in clean plastic microtubules. Appropriate amounts of each sample type were encapsulated in tin (Nitrogen analyses) or silver (decarbonated samples for Carbon analyses) capsules for further analyses.
Samples were prepared in TAMU-CC laboratories for stable isotope analysis before sending off to be analyzed with an Isotope-Ratio Mass Spectrometer (IRMS) at the University of La Rochelle, France. At the University of La Rochelle, approximately 5 mg of dry ground tissue samples were placed in a tin boat with 10 mg of precombusted Vanadium pentoxide (V2O5). The isotopic composition of δ15N and δ13C were analyzed with a continuous-flow stable isotope mass spectrometer attached to a Carlo Erba elemental analyzer following the batch analysis methods and standards used by Fry (2007). Replicate isotope analyses of N and C were performed to validate machine readings. Isotopic ratios were reported relative to the standards: atmospheric N2 for δ15N and Vienna PeeDee belemnite for δ13C using the formula:
δsample(‰) = (Rsample/Rstandard – 1)/1000
where R represents the isotopic ratio.

7
Stable Isotope Statistical Analyses Kruskal-Wallis rank sum tests were used to investigate seasonal or salinity-related
fluctuations in isotope compositions of sediment, macrofauna, and muscle tissue (Peterson 1999, Fry 2002, Lorrain et al. 2002); Wilcoxon signed rank tests were used to compare SOM and macrofauna across habitat types (reef vs. soft sediment). Values from stable isotope analyses were put into a stable isotope biplot to assess dietary similarities and trophic trends.
Results Water Quality Water Quality was similar at the Serpulid reef and infauna stations (Figure 4 and Figure 5). Salinity decreased from 46 to 29 in the four-month study period. This decrease was the second-fastest decrease, and covered most of the range of salinities that the stations experienced, since sampling by the Pollack Lab began in March 2014 (Figure 4). Temperature followed a typical seasonal pattern, experiencing a high in June 2018 of 29 °C and a low in December of 14 °C (Figure 5 ). Dissolved oxygen was inversely related to temperature. pH peaked in September 2018 but decreased in December 2018 and March 2019.
Figure 4. Salinity sampled at the current soft sediment (blue) and reef (red) study stations. The shaded regions represent minimum and maximum salinities in each sampling period. Values before 2018 are plotted for reference only.

8
Figure 5. Temperature, pH and dissolved oxygen at the Baffin Bay soft sediment (blue) and reef (red) stations sampled in this study. The shaded regions represent minimum and maximum values in each sampling period. Values before 2018 are plotted for reference only.

9
Quantitative Fauna Analyses Mean abundance and biomass of fauna were 706 times greater and 289 times greater per volume of reef than the same volume calculated from the top 10 cm of soft sediment (Figure 6 and Figure 7). Twenty-two taxa occurred in soft sediment stations (Table 1), as opposed to forty-three species in reef substrate stations (Table 2). Faunal abundance increased downstream toward the mouth of Baffin Bay from BBS1 to BBS3 (Figure 8). Crustaceans increased in abundance, while polychaetes and bivalves decreased in abundance, at reef stations moving toward the mouth of Baffin Bay. There was no consistent spatial trend in faunal biomass among reef locations. Community composition of Serpulid reef sites was numerically dominated by crustaceans, namely the amphipod Corophium louisianum. Soft sediment fauna was dominated in abundance and biomass by bivalves and polychaetes, with the highest abundance of crustaceans at site BB6, located closest to Serpulid reef and the mouth of Baffin Bay near the Laguna Madre (Figure 9).
Figure 6. Abundance of fauna in the top 10 cm of sediment (blue) and chunks of reef (red) in June 2018- March 2019.
Figure 7. Biomass of fauna in the top 10 cm of sediment (blue) and chunks of reef (red) in June 2018- March 2019.

10
Table 1. List of macrofaunal species abundance at soft sediment stations June 2018- March 2019.
Species/Taxa BB6 BB24 BB40 AL1 Sediment
n L-1 % n L-1 % n L-1 % n L-1 % n L-1 % Cum. %
Mediomastus ambiseta 22.2 20.2 5.7 44.4 16.5 52.2 25.5 51.4 17.5 42.1 42.1 Mulinia lateralis 38.3 34.8 5.4 42.6 5.9 18.7 15.8 31.9 16.4 32.0 74.1 Ampeliscidae 34.0 30.9 0 0 0 0 0 0 8.5 7.7 81.8 Streblospio benedicti 0 0 1.2 9.3 6.1 19.4 1.2 2.4 2.1 7.8 89.5 Pectinaria gouldii 1.9 1.7 0.2 1.9 0.7 2.2 3.8 7.6 1.7 3.4 92.9 Armandia agilis 4.3 3.9 0 0 0.5 1.5 0 0 1.2 1.3 94.2 Glycinde sp. 1.4 1.3 0.2 1.9 1.4 4.5 0.5 1.0 0.9 2.1 96.4 Caprellidae 2.8 2.6 0 0 0 0 0 0 0.7 0.6 97.0 Aoridae 2.4 2.1 0 0 0 0 0 0 0.6 0.5 97.6 Melitidae 0.5 0.4 0 0 0 0 0.5 1.0 0.2 0.3 97.9 Gastropoda 0.5 0.4 0 0 0.2 0.7 0.2 0.5 0.2 0.4 98.3 Corophium louisianum 0.5 0.4 0 0 0 0 0 0 0.1 0.1 98.4 Cnidaria 0.5 0.4 0 0 0 0 0 0 0.1 0.1 98.5 Acteocina canaliculata 0.5 0.4 0 0 0 0 0 0 0.1 0.1 98.6 Anomalocardia auberiana 0 0 0 0 0 0 0.5 1.0 0.1 0.2 98.9 Cumacea 0.5 0.4 0 0 0 0 0 0 0.1 0.1 99.0 Diopatra cuprea 0 0 0 0 0 0 0.5 1.0 0.1 0.2 99.2 Lyonsia hyalina 0 0 0 0 0 0 0.5 1.0 0.1 0.2 99.5 Nemertea 0 0 0 0 0 0 0.2 0.5 0.1 0.1 99.6 Turbellaria 0 0 0 0 0.2 0.7 0.0 0.0 0.1 0.2 99.8 Fargoa gibbosa 0 0 0 0 0 0 0.2 0.5 0.1 0.1 99.9 Nereiphylla fragilis 0 0 0 0 0 0 0.2 0.5 0.1 0.1 100

11
Table 2. List of macrofaunal species abundance at Baffin Bay reef stations June 2018- March 2019.
Species/Taxa BBS1 BBS2 BBS3 Reef
n L-1 % n L-1 % n L-1 % n L-1 % Cum. %
Corophium louisianum 9578.5 50.5 17281.6 60.1 29650.5 70.4 18836.9 60.3 60.3 Polydora ligni 2646.8 13.9 1020.7 3.6 1136.1 2.7 1601.2 6.7 67.1 Syllis cornuta 1225.5 6.5 2281.0 7.9 1189.3 2.8 1565.3 5.7 72.8 Hargeria rapax 0 0 2069.5 7.2 1611.7 3.8 1227.1 3.7 76.5 Balanus eburneus 1300.5 6.9 1614.0 5.6 740.3 1.8 1218.3 4.7 81.2 Naineris laevigata 71.4 0.4 916.6 3.2 2620.9 6.2 1203.0 3.3 84.5 Brania clavata 108.9 0.6 1371.8 4.8 1482.1 3.5 987.6 3.0 87.4 Cnidaria 773.6 4.1 627.4 2.2 1214.1 2.9 871.7 3.0 90.5 Hydroides dianthus 966.3 5.1 206.6 0.7 445.3 1.1 539.4 2.3 92.8 Nereis riisei 1050.1 5.5 320.7 1.1 221.1 0.5 530.6 2.4 95.2 Brachidontes exustus 735.8 3.9 390.5 1.4 169.9 0.4 432.0 1.9 97.0 Caprellidae 0 0 311.1 1.1 285.3 0.7 198.8 0.6 97.6 Terebella rubra 0 0 23.2 0.1 564.7 1.3 196.0 0.5 98.1 Eumida sanguinea 221.2 1.2 33.2 0.1 252.3 0.6 168.9 0.6 98.7 Mediomastus californiensis 61.7 0.3 83.2 0.3 125.6 0.3 90.2 0.3 99.0 Elasmopus levis 96.0 0.5 0 0 95.8 0.2 63.9 0.2 99.3 Melitidae 0.0 0 25.1 0.1 113.4 0.3 46.2 0.1 99.4 Schistomeringos rudolphi 50.0 0.3 13.0 0 5.0 0 22.7 0.1 99.5 Nemertea 35.9 0.2 4.6 0 16.8 0 19.1 0.1 99.6 Obelia bidentata 0 0 2.7 0 51.9 0.1 18.2 0.0 99.6 Pycnogonida 4.0 0 29.3 0.1 16.8 0 16.7 0.1 99.7 Xanthidae 14.1 0.1 3.2 0 30.2 0.1 15.8 0.1 99.7 Autolytus sp. 3.9 0 19.1 0.1 14.2 0 12.4 0 99.8 Phyllodocidae 8.3 0 3.2 0 14.5 0 8.6 0 99.8 Isopoda 0 0 5.3 0 17.6 0 7.6 0 99.8 Cerapus tubularis 0 0 11.6 0 10.7 0 7.4 0 99.8 Aoridae 0 0 11.1 0 7.7 0 6.3 0 99.9 Syllis sp. 9.0 0 9.5 0 0.0 0 6.2 0 99.9 Ampithoidae 0.0 0 4.0 0 13.1 0 5.7 0 99.9 Prionospio sp. 0.0 0 14.7 0.1 0 0 4.9 0 99.9 Oligochaeta 13.6 0.1 0 0 0 0 4.5 0 99.9 Brachyura 0 0 6.9 0 0 0 2.3 0 99.9 Terebellidae 0 0 6.9 0 0 0 2.3 0 100.0 Granidierella bonneroides 0 0 6.4 0 0 0 2.1 0 100.0 Syllidae 5.2 0 0 0 0 0 1.7 0 100.0 Dyspanopeus texanus 0 0 0 0 5.0 0 1.7 0 100.0 Porifera 0 0 0 0 4.6 0 1.5 0 100.0

12
Spionidae 3.8 0 0 0 0 0 1.3 0 100.0 Amphipoda 0 0 3.2 0 0 0 1.1 0 100.0 Holothuroidea 0 0 3.2 0 0 0 1.1 0 100.0 Mediomastus sp. 0 0 3.2 0 0 0 1.1 0 100.0 Cerithium lutosum 0 0 0 0 3.2 0 1.1 0 100.0 Turbellaria 0 0 0 0 2.3 0 0.8 0 100.0
Figure 8. Mean densities of major taxa types occurring in soft sediment and Serpulid reef stations in June 2018- March 2019. Pie graph size is indicative of relative abundance (top) and biomass (bottom).
13
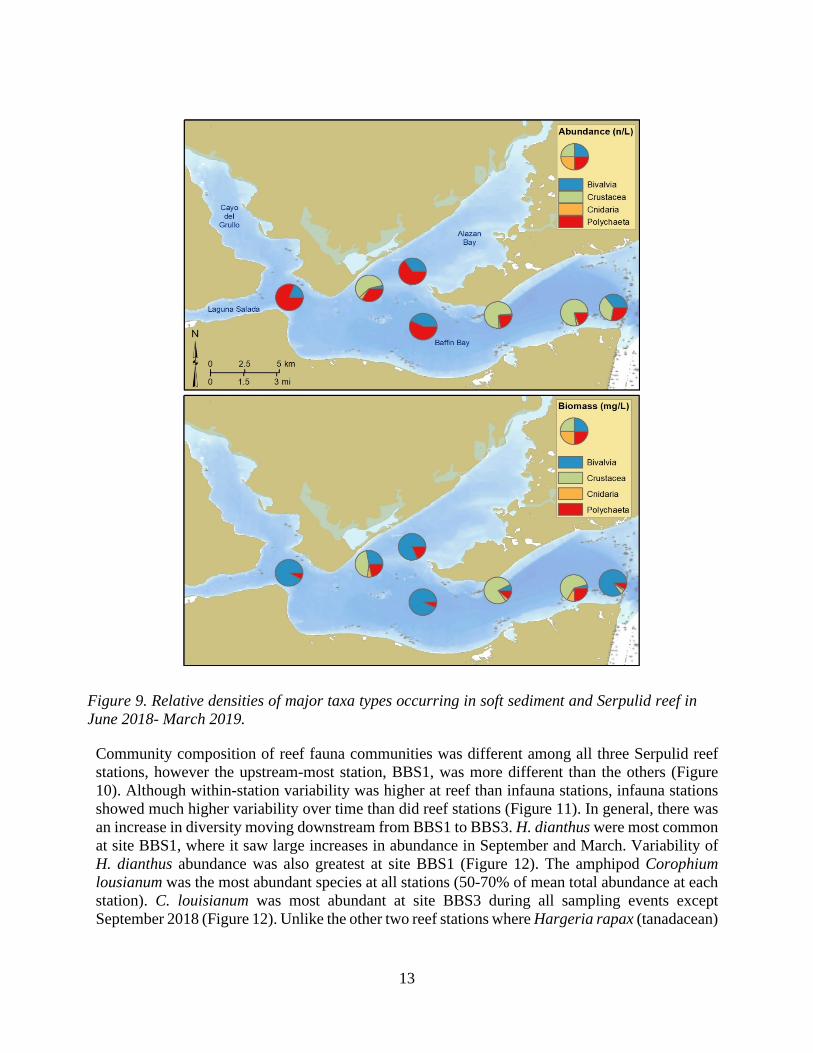
Community composition of reef fauna communities was different among all three Serpulid reef stations, however the upstream-most station, BBS1, was more different than the others (Figure 10). Although within-station variability was higher at reef than infauna stations, infauna stations showed much higher variability over time than did reef stations (Figure 11). In general, there was an increase in diversity moving downstream from BBS1 to BBS3. H. dianthus were most common at site BBS1, where it saw large increases in abundance in September and March. Variability of H. dianthus abundance was also greatest at site BBS1 (Figure 12). The amphipod Corophium lousianum was the most abundant species at all stations (50-70% of mean total abundance at each station). C. louisianum was most abundant at site BBS3 during all sampling events except September 2018 (Figure 12). Unlike the other two reef stations where Hargeria rapax (tanadacean)
Figure 9. Relative densities of major taxa types occurring in soft sediment and Serpulid reef in June 2018- March 2019.
14
and Naineris laevigata (Orbiniid polychaete) made up a large proportion of total abundance, these species were rare (N. laevigata) or absent (H. rapax) at site BBS1 (Table 1).
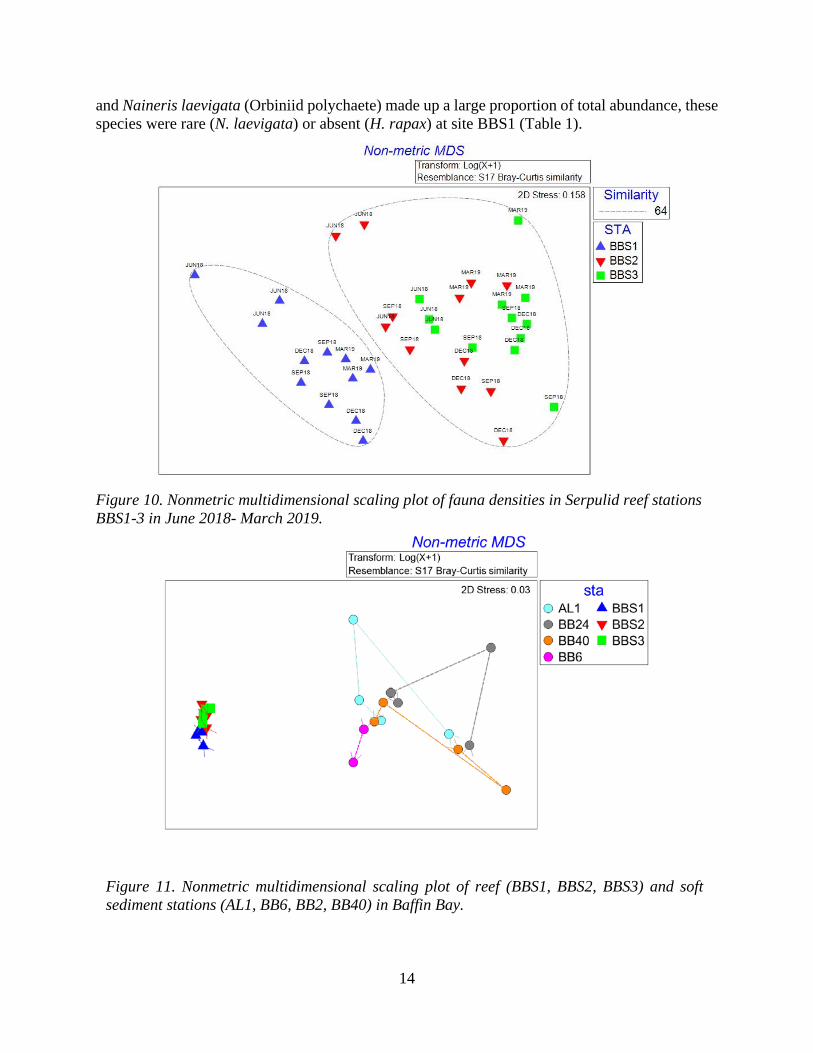
Figure 10. Nonmetric multidimensional scaling plot of fauna densities in Serpulid reef stations BBS1-3 in June 2018- March 2019.
Figure 11. Nonmetric multidimensional scaling plot of reef (BBS1, BBS2, BBS3) and soft sediment stations (AL1, BB6, BB2, BB40) in Baffin Bay.

15
For all sediment sites and reef sites except BBS2, there was a decrease in macrofaunal abundance and biomass in September of 2018 (Figure 13). Abundance and biomass of reef fauna were not correlated with any measured water quality variables. However, abundance of macrofauna in soft sediments stations was negatively correlated with pH (p = 0.02, rho = -0.58). There was also a relationship between soft sediment infaunal abundance and salinity, though it was not significant at the p = 0.05 level (p 0.05, rho = -0.524).
Trophic Function Analyses Invertebrates obtained from reef samples included Balanus eburneus (barnacle), Brachidontes exustus (scorched mussel), Corophium louisianum (amphipod crustacean), H. dianthus (serpulid polychaete), four algae types, Cnidarians, Xanthidae crabs, and representatives from two other polychaete families. Soft sediment fauna included primarily Mulinia lateralis (Dwarf Surfclam), as well as Goniadidae and Pectinariidae polychaetes, Nemertean and Turbellarian worms, and Gastropods (Table 3). No distinction could be made between δ13C ratios of groups of macrofauna (suspension and deposit feeders) collected at reef and soft sediment sites. SOM and SPOM δ13C ratios at reef and infauna sites were also indistinguishable and showed no significant trends over time (Figure 14, Figure 15).
Muscle tissue samples from 51 fish including 23 Black Drum, 13 Spotted Sea Trout, 4 Red Drum, 2 Sheepshead Minnows, 8 Pinfish, and 1 Sheepshead were collected from commercial and recreational anglers and via fisheries-independent sampling for stable isotope analyses (Table 3, Figure 15). Black Drum collected by commercial fishermen in unspecified locations within Baffin Bay had similar isotope compositions to Pinfish and Sheepshead collected at reef sampling stations. Both appeared to utilize a wide variety of Baffin Bay prey resources. Spotted Seatrout
Figure 12. Change in abundance of the Serpulid Hydroides dianthus (Left) and crustacean Corophium louisianum at reef stations. Shaded bands represent the maximum and minimum range at each station during each sampling date.

16
and Red Drum had similar δ13C but higher δ15N values than other fish, indicating that they were feeding from the same sources but at a higher trophic level.
Table 3. Stable isotope compositions of taxa and samples collected in Baffin Bay via commercial and recreational anglers, and benthic sampling on June 2018- March 2019
Location Collected Sample Type Species name n
δ13C δ15N
Mean Std. Dev. Mean Std.
Dev.
Baffin Bay Fish
Sheepshead (Archosargus probatocephalus) 1 -18.90 10.95 Spotted Seatrout (Cynoscion nebulosus) 13 -17.04 1.52 13.53 0.74 Sheepshead Minnow (Cyprinodon variegatus) 2 -14.32 0.46 8.63 0.29 Pinfish (Lagodon rhomboides) 8 -16.40 2.49 9.90 1.14 Black Drum (Pogonias cromis) 23 -16.82 2.79 10.20 1.70 Red Drum (Sciaenops ocellatus) 4 -15.68 2.76 12.21 0.61
Infauna
Carnivore Acteocina canaliculata 2 -19.74 1.03 7.61 2.21 Nemertea 1 -21.81 10.12 Turbellaria 2 -20.92 0.40 7.50 0.04
Deposit
Armandia agilis 1 -21.55 7.94 Ampeliscidae 2 -19.55 1.04 5.58 0.49 Ampharetidae 3 -22.07 2.22 7.74 0.27 Amphipoda 1 -20.77 7.30 Goniadidae 4 -20.93 1.13 9.68 1.12 Nassarius vibex 1 -14.97 6.09
Suspension Mulinia lateralis 19 -20.48 0.84 5.79 1.04 Pectinariidae 10 -21.07 0.54 7.06 1.22
Organic Matter
SOM 14 -20.95 0.67 4.60 0.34 SPOM 25 -24.72 1.55 3.49 2.35
Reef
Carnivore Nereididae 29 -19.65 1.20 8.41 0.96 Xanthidae 4 -17.86 0.80 8.53 0.70
Deposit
Corophium louisianum 33 -20.36 1.17 6.47 0.65 Cerapus tubularis 2 -18.67 1.53 7.18 1.55 Leptochelia rapax 1 -19.79 6.44 Orbiniidae 4 -20.30 0.48 6.98 0.30 Terebellidae 3 -20.40 0.23 7.57 0.08
Suspension
Balanus eburneus 36 -19.25 1.09 7.94 0.93 Brachidontes exustus 29 -21.61 0.60 5.30 0.58 Cnidaria 6 -20.79 0.28 10.02 0.87 Hydroides dianthus 29 -21.13 0.88 6.96 0.90
Algae
Brown Algae 3 -14.21 8.37 5.51 0.83 Filamentous Algae 1 -19.65 4.38 Gracilaria sp. 2 -20.16 5.35 8.56 0.24 Green Algae 7 -19.74 2.28 3.89 0.74 Red Algae 4 -18.88 1.42 5.16 1.84 Turf Algae 3 -17.27 3.18 4.89 0.85
Organic Matter
SOM 12 -21.37 2.77 4.22 0.65 SPOM 20 -24.40 1.62 3.35 1.66

17
Figure 13. Abundance (left) and biomass (right) of reef (top) and sediment (bottom) fauna. Note different scales on axes.

18
Figure 14. δ13C values for organic matter in Baffin Bay soft sediment (AL1, BB24, BB40, BB6; depicted with solid lines and hollow markers) and Serpulid reef stations (BBS1, BBS2, BBS3; depicted with dashed lines and solid markers).

19
Figure 15. Stable isotope biplot of fish muscle tissue (triangles, with species denoted by color), and potential food sources (with samples collected on reef samples represented by solid circles and those from soft sediment stations by hollow circles, and trophic group/ sample type represented by color). SOM = Sediment organic matter and SPOM = suspended particulate organic matter.
20
Discussion Importance of Serpulid Reefs in Baffin Bay From this study, we have demonstrated that the fauna inhabiting Serpulid reefs are far more productive than those occurring in soft sediments of Baffin Bay, outside the influence of the reefs: This is shown by the over 700 times greater abundance, nearly 300 times greater biomass, and twice the number of macrofauna species on the reef than off of it.
In addition to the increased productivity in reef samples, the marked difference in reef response to water quality changes indicates that these habitats are more resilient to disturbance than soft sediment communities. Baffin Bay displays large and frequent fluctuations in water quality variables including salinity, pH, and frequent algal blooms, and the effects of these are reflected in the soft sediment communities (Montagna et al. 1993, Montagna and Kalke 1995, Rubio et al. 2018, Breaux et al. 2019). While soft sediment infauna can be nearly absent under stressful environmental conditions and fluctuate greatly with freshwater inflow events, it appears that reef populations are more stable over time. pH in particular appears to play a large role in structuring soft sediment macrofaunal communities in Baffin Bay (Breaux et al. 2019), but this effect was not seen in reef communities. More research is warranted to understand the role of Serpulid reefs in buffering against fluctuations in pH.
The species found in the current study are similar to those found in the most recent and probably most comprehensive study of Serpulid reefs in Baffin Bay (Hardegree 1997). This study took place over a similar salinity range as experienced in the current study, though a higher number of species were identified (43 in this study and 29 in Hardegree 1997). The number of taxa in this study is similar to those found by Cole (1981; 38). The amphipod C. louisianum was the most abundant organism in the Hardegree study (71%), which is similar to quantities occurring in the current study (60% overall, 70% at site BBS3). Hardegree noted that C. louisianum abundances followed a seasonal cycle, though this was difficult to identify in this study because of large differences in reef sites.
Hardegree sampled four reefs, of which, only one is in a similar location to one in the current study (BBS2, East Kleberg Point). In his study, the Serpulid H. dianthus only occurred at the eastern end of Baffin Bay, but primarily closer to the mouth. In June 2018 in this study, there was a similar increase in Serpulid abundances towards the mouth of Baffin Bay, but in September, two reef replicate samples at the upstream-most station (BBS1) had 1900-4700 n L-1, much more than any other sample (0-550 n L-1).Though the reef at site BBS1 was smaller and more degraded than the other reef sites, it had more areas bare of macroflora and fouling organisms, perhaps providing crucial space for serpulid recruitment. Multiple sharp increases in abundance of small H. dianthus occurred at this site, but there were no lasting increases in their populations and these reef-building polychaetes were generally sparse in samples. Although these populations appeared not to increase over time, this understanding of settlement patterns will help determine ideal timing and placement of restoration efforts in the future. The community composition of reef fauna changes along the longitudinal axis of Baffin Bay, which may indicate a change in reef importance, stability, health, and thus potential for restoration.
21
Role of Serpulid Reefs in the Baffin Bay Food Web Baffin Bay supports a uniquely large Black Drum population (Olsen 2014), and fauna supported by Serpulid reefs is likely a critical contributor to their success in this often-hostile system. Isotope analyses indicate that Black Drum and other sport fish likely rely (both directly as in Black Drum, Sheepshead and Pinfish, and indirectly in the case of higher-trophic level consumers like Red Drum and Spotted Seatrout) on food items from a combination of reef and soft sediment habitat types. Though it is not possible to distinguish reef and soft sediment organic matter and fauna isotopically, quantitative analyses from this and other studies show that possible food sources are far more prevalent and stable at reef locations than in soft sediments (Montagna et al. 1993, Montagna and Kalke 1995, Hardegree 1997, Rubio et al. 2018, Breaux et al. 2019).
Breaux et al. (2019) found that Baffin Bay Black Drum diets consist primarily of deposit-feeding macrofauna, yet these were rare or absent under high salinity conditions in soft sediment samples. Further, Ajemian et al. (2018), Rubio et al. (2018), and Breaux et al. (2019) concluded that under these hypersaline conditions common to Baffin Bay, Black Drum move less and forage within the bay, rather than leaving to forage in other bay systems. The high energetic cost of osmotic regulation under hypersaline conditions may make travelling outside of the bay difficult for Black Drum—Baffin Bay’s unique and productive Serpulid reefs likely provide a refuge for these fish when other food items become scarce and/or inaccessible. A further comparison of Black Drum population size via TPWD catch rate data and carrying capacity estimates as determined by quantitative faunal analyses could further elucidate the importance of reef fauna to fish populations in Baffin Bay.
The Future of Baffin Bay’s Serpulid Reefs Brown et al. (1977) estimated that there was 16 km2 of Serpulid reef present in Baffin Bay in the 1970s. However, Hardegree (1997) documented that the sizes and abundances of reefs have been declining substantially since then, and that some of the causes of these declines have been human-induced. The direct causes of reef erosion were hypothesized to be from natural wave action, boat traffic (directly damaging the reefs by hitting them) and trampling by fishermen. Other purely speculative mechanisms of erosion could be dissolution from changes in pH, and bioerosion. By monitoring these reefs over time, as in this study, the abundance of reef-forming Serpulids can be quantified under a variety of water quality conditions to determine if it is possible that the reefs have the potential to accrete again. The rate and timing of colonization of Serpulids to a reef may best be determined using a combination of the H. dianthus population information gathered in these quantitative faunal analyses and placement of settlement plates.
In addition to determining colonization rates, effective management of the reefs will be more effective if the number and size of the reefs in Baffin Bay are quantified repetitively over time to determine the rate that the reefs are changing size. The extent of reef presence could be determined using mobile LiDAR (Light Detection and Ranging) remote sensing and/or side-scan sonar surveys. If there is indeed a rapid net loss of Serpulid reef, it may be deemed important to create artificial reefs, so that the habitat and productivity provided by natural reefs in Baffin Bay is not lost.

22
References Ajemian, M. J., Mendenhall, K. S., Pollack, J. B., Wetz, M. S., and G. W. Stunz. 2018. Moving
forward in a reverse estuary: Habitat use and movement patterns of black drum (Pogonias cromis) under distinct hydrological regimes. Estuaries and coasts, 41(5), 1410-1421.
Andrews, P.B. 1964. Serpulid reefs, Baffin Bay, southeast Texas. In A.J. Scott, ed., Depositional environments south-central Texas coast. Gulf Coast Assoc. Geol. Soc. Field Trip Guidebook, p. 101-120.
Bastida-Zavala J.R., McCann L.D., Keppel E., and G.M. Ruiz. 2017. The fouling Serpulids (Polychaeta: Serpulidae) from United States coastal waters: an overview. European Journal of Taxonomy 344: 1–76, https://doi.org/10.5852/ejt.2017.344
Bianchi, C. N.; Morri, C. 2001. The battle is not to the strong: Serpulid reefs in the lagoon of Orbetello (Tuscany: Italy)., Estuarine, Coastal and Shelf Science 53: 215:220
Breaux, N., Lebreton, B., Palmer, T. A., Guillou, G., and J.B. Pollack. 2019. Ecosystem resilience following salinity change in a hypersaline estuary. Estuarine, Coastal and Shelf Science, 106258.
Breuer, J.P. 1957. An ecological survey of Baffin and Alazan Bays, Texas. Publ. Univ. Tex. Inst. Mar. Sci. 4(2):134-155.
Brown L.F. Jr., J.H. McGowen, T.J. Evans, C.G. Groat, and W.L. Fisher. 1977. Environmental geologic atlas of the Texas coastal zone - Kingsville area. Bureau of Economic Geology, University of Texas at Austin. 123 pp.
Clarke KR. 1993. Non-parametric multivariate analyses of changes in community structure. Australian Journal of Ecology 18:117–143.
Clarke, K.R. and R.N. Gorley. 2015 PRIMER v7: User Manual/Tutorial. PRIMER-E: Plymouth, UK.
Cole, M.C. 1981. The serpulid reefs of Baffin Bay, Texas in Modem depositional environments of sands in south Texas; 1981 Convention Field Trip, Gulf Coast Assoc. Geol. Socs. p. 55-73.
Dial S. and S. Black. 2009. Prehistoric Peoples of the Coastal Prairies and Marshlands (Baffin Bay) In: Texas Beyond History. https://texasbeyondhistory.net/coast/images/ap6.html. Visited 27 April 2019.
Diener, R.A. 1975. Cooperative Gulf of Mexico estuarine inventory and study‐ Texas area description, p. 129. U.S. Department of Commerce, NOAA technical report, National Marine Fisheries Service Circular 393; [accessed 2018 June 13]. Available from http://spo.nmfs.noaa.gov/Circulars/CIRC393.pdf
Dong, Z., Sun, T., and L. Wang. 2018. The biogenic reefs formed by the alien polychaete Hydroides dianthus (Serpulidae, Annelida) favor the polyp stage of Aurelia coerulea (Cnidaria, Scyphozoa) in a coastal artificial lake. Marine Pollution Bulletin 129: 86-91

23
Fry, B. 2002. Conservative mixing of stable isotopes across estuarine salinity gradients: A conceptual framework for monitoring watershed influences on downstream fisheries production. Estuaries 25: 264–271.
Fry, B. 2007. Stable Isotope Ecology. Springer Verlag, New York. 308 pp.
Fry B. and E.B. Sherr. 1984. δ13C measurements as indicators of carbon flow in marine and fresh-water ecosystems. Contributions in Marine Science 27: 13–47.
Haines J.L. and Maurer D. 1980. Benthic invertebrates associated with a Serpulid polychaete assemblage in a temperate estuary. Internationale Revue der Gesamten Hydrobiologie 65 (5): 643–656. https://doi.org/10.1002/iroh.19800650504
Hardegree, B. 1997. Biological productivity associated with the Serpulid reefs of Baffin Bay, Texas. M.S. Thesis, Texas A&M University-Corpus Christi.
Hedgpeth, J.W. 1953. An introduction to the zoogeography of the Northwestern Gulf of Mexico with reference to the invertebrate fauna. Publ. Inst. Mar. Sci., Univ. Texas, 3: 109-224.
Leung, J.Y.S. and N.K.M..Cheung. 2017. Feeding behaviour of a Serpulid polychaete: Turning a nuisance species into a natural resource to counter algal blooms? Marine Pollution Bulletin 115(1–2): 376-382.
Lorrain, A., Y. M. Paulet, L. Chauvaud, N. Savoye, A. Donval, and C. Saout. 2002. Differential δ 13 C and δ 15 N signatures among scallop tissues: implications for ecology and physiology. Journal of Experimental Marine Biology and Ecology 275: 47–61.
Maurer, D., L. Watling, W. Leatham and P. Kinner. 1979. Seasonal changes in feeding types of estuarine benthic invertebrates from Delaware Bay. Journal of Experimental Marine Biology and Ecology 36: 125-155.
Montagna, P. A., and R. D. Kalke. 1995. Ecology of infaunal Mollusca in south Texas estuaries. American Malacological Bulletin 15: 307–326.
Montagna, P. A., J. Brenner, J. Gibeaut, and S. Morehead. 2011. Coastal impacts, p. 96–123. In J. Schmandt, G. R. North, and J. Clarkson [eds.], The impact of global warming on Texas, 2nd ed. Univ. of Texas Press.
Montagna, P.A., X. Hu, T.A. Palmer and M. Wetz. 2018. Effect of hydrological variability on the biogeochemistry of estuaries across a regional climatic gradient. Limnology and Oceanography 63(6): 2465-2478.
Montagna, P.A., D.A. Stockwell and R.D. Kalke. 1993. Dwarf surfclam Mulinia lateralis (Say, 1822) populations and feeding during the Texas brown tide event. Journal of Shellfish Research 12: 433-442.
National Oceanographic and Atmospheric Administration. 2018. Electronic Navigational Charts: US5TX24M. Edition 18. Updated 19 Apr 2018. https://www.charts.noaa.gov/ENCs/ENCsIndvDateSort.shtml

24
Olsen, Z. T. 2014. Potential impacts of extreme salinity and surface temperature events on population dynamics of black drum, Pogonias cromis, in the upper Laguna Madre, Texas. Gulf of Mexico Science 32.1: 6.
Orlando, S.P., Rozas, L.P., Ward, G.H., and C.J. Klein. 1993. Salinity characteristics of Gulf of Mexico estuaries. Silver Spring, MD: National Oceanic and Atmospheric Administration, Office of Ocean Resources Conservation and Assessment.
Otani M. and R. Yamanishi. 2010. Distribution of the alien species Hydroides dianthus (Verrill, 1873) (Polychaeta: Serpulidae) in Osaka Bay, Japan, with comments on the factors limiting its invasion. Plankton and Benthos Research 5: 62–68. https://doi.org/10.3800/pbr.5.62
Peterson, B. J. 1999. Stable isotopes as tracers of organic matter input and transfer in benthic food webs: A review. Acta Oecologica 20: 479–487.
Ricklis, R.A 2004. Prehistoric Occupation of the Central and Lower Texas Coast. In “The Prehistory of Texas”, edited by Timothy Perttula, p155-180. Texas A & M University Press, College Station.
Robertson, J.D. and C.F.A. Pantin. 1938. Tube formation in Pomatoceras triqueter. Nature, Lond., vol. 141, pp. 648-649.
Rubio, K.S., Ajemian, M.J., Stunz, G.S., Palmer, T.A., Lebreton, B. and J.B. Pollack. 2018. Dietary composition of black drum Pogonias cromis in a hypersaline estuary reflects water quality and prey availability. Journal of Fish Biology 93: 250-262.
Street, G. T., P. A. Montagna, and P. L. Parker. 1997. Incorporation of brown tide into an estuarine food web. Marine Ecology Progress Series 152: 67–78.
ten Hove, H.A. and P. van den Hurk. 1993. A review of recent and fossil Serpulid ‘reefs’; actuopalaeontology and the ‘Upper malm’ Serpulid limestones in NW Germany. Geologie en Mijnbouw 72: 23-67.
Tunnell, J.W. Jr., Judd, F.W. and R.C. Bartlett. 2001. The Laguna Madre of Texas and Tamaulipas. Texas A&M University Press. 372 pp.
Valastro, S. Jr., E.M. Davis, and A.G. Varela. 1972. University of Texas Radiocarbon Dates IX. Radiocarbon 14: 461-485.
Vander Zanden, M.J. and J.B. Rasmussen. 2001. Variation in δ15N and δ13C trophic fractionation: Implications for aquatic food web studies. Limnology and Oceanography 16: 2061-2066.
Wetz, M.S., E.K. Cira, B. Sterba‐Boatwright, P.A. Montagna, T.A. Palmer, and K.C. Hayes. 2017. Exceptionally high organic nitrogen concentrations in a semi‐arid South Texas estuary susceptible to brown tide blooms. Estuarine Coastal and Shelf Science 188: 27–37. doi:10.1016/j.ecss.2017.02.001


![Narwhals document continued warming of southern Baffin Bay · Münchow [2006] used historical and essentially only sum-mertime data to examine evidence of warming in Baffin Bay and](https://static.fdocuments.in/doc/165x107/5d27622a88c993b7508c4f16/narwhals-document-continued-warming-of-southern-baffin-bay-muenchow-2006-used.jpg)