SHELL GREENLAND A/S 2013 SITE SURVEY IN BAFFIN BAY BLOCKS...
124
February, 2013 SHELL GREENLAND A/S 2013 SITE SURVEY IN BAFFIN BAY BLOCKS 5 (ANU) AND 8 (NAPU) PRELIMINARY ENVIRONMENTAL IMPACT ASSESSMENT
-
Upload
phungkhanh -
Category
Documents
-
view
215 -
download
2
Transcript of SHELL GREENLAND A/S 2013 SITE SURVEY IN BAFFIN BAY BLOCKS...

February, 2013
SHELL GREENLAND A/S
2013 SITE SURVEY IN BAFFIN BAY
BLOCKS 5 (ANU) AND 8 (NAPU)
PRELIMINARY ENVIRONMENTAL IMPACT ASSESSMENT

2013 SITE SURVEY IN BAFFIN BAY BLOCKS 5 (ANU) AND 8 (NAPU) PRELIMINARY ENVIRONMENTAL IMPACT ASSESSMENT
Ramboll Hannemanns Allé 53 DK-2300 Copenhagen S Denmark T +45 5161 1000 F +45 5161 1001 www.ramboll.com
Date 01/03/2013

PRELIMINARY ENVIRONMENTAL IMPACT ASSESSMENT
CONTENTS
1. Introduction 1 1.1 Exploration activities 1 1.2 Environmental impact assessment 2 2. Regulatory framework 3 2.1 Greenlandic legislation and guidelines 3 2.2 International treaties, conventions and best practice 3 2.3 Shell standards 3 3. Project description 4 3.1 Project overview 4 3.2 Survey schedule and programme 6 3.3 Type and intensity of activities 7 3.4 Logistics 13 3.5 Waste, emissions and discharges 14 3.6 Demobilisation 15 4. Considered alternatives 16 5. Impact assessment (planned events) 17 5.1 Method for impact assessment 17 5.2 Summary of potential project impacts 21 5.3 Climate and ice conditions 24 5.4 Oceanography 25 5.5 Bathymetry 26 5.6 Water and sediment quality 27 5.7 Plankton 28 5.8 Benthic flora and fauna 28 5.9 Fish and shellfish 31 5.10 Marine mammals 35 5.11 Protected areas 52 5.12 Seabirds 54 5.13 Commercial and recreational fishery 56 5.14 Maritime traffic 60 5.15 Tourism 61 5.16 Cumulative impacts 61 5.17 Transboundary impacts 61 5.18 Summary of impacts 61 6. Impact assessment (unplanned events) 65 6.1 Spill scenarios 65 6.2 Impacts to the marine environment 65 7. Environmental management plan 67 7.1 Management structure 67 7.2 Planning phase 67 7.3 Survey phase 67 7.4 Communications 71 7.5 Unplanned Events 72 8. References 73
Appendix 1: Introduction to Sound
Appendix 2: Acoustic Modelling
Appendix 3: Summary of calculations for estimates of percentage of populations and numbers of individuals exposed to seismic noise

PRELIMINARY ENVIRONMENTAL IMPACT ASSESSMENT
LIST OF ABBREVIATIONS
µPa Micropascal 2D HR seismic Two-dimensional high-resolution seismic BAT Best Available Technology BEP Best Environmental Practice BMP Bureau of Minerals and Petroleum dB Decibel DCE Danish Centre for Environment and Energy (previously DMU/NERI,
National Environmental Research Institute) EBS Environmental Baseline Survey EIA Environmental Impact Assessment FLO Fisheries Liaison Officer HFO HSSE & SP
Heavy fuel oil Health, security, safety, environment and social performance.
IAGC International Association of Geophysical Contractors IUCN International Union for the Conservation of Nature kHz Kilohertz Km Kilometer m Meter MARPOL Convention for the Prevention of Pollution from Ships MBES Multi Beam Echosounding MMPP Marine Mammal Protection Plan MMSO Marine Mammal and Seabird Observer ms Millisecond NORSOK NORSOK standards developed by the Norwegian petroleum industry OGP Oil & Gas Producers OSPAR Convention for the Protection of the Marine Environment of the
North East Atlantic Pa Pascal PAH Polycyclic Aromatic Hydrocarbons PAM Passive acoustic monitoring RMS Root Mean Square s Second SAR Search And Rescue SEIA Strategic Environmental Impact Assessment SEL Sound exposure level SPL Sound pressure level SSS Side Scan Sonar TAC Total Allowable Catch

PRELIMINARY ENVIRONMENTAL IMPACT ASSESSMENT
1
1. INTRODUCTION
Shell Greenland A/S (hereafter Shell) is the operator of the license blocks 5 (Anu) and 8 (Napu) in Baffin Bay, Greenland (Figure 1-1).
Figure 1-1 Location of the license blocks Anu (Block 5) and Napu (Block 8) in Baffin Bay, Greenland.
The two license blocks each cover an area of approximately 10,000 km2. The licensees are the same for the two license blocks. In addition to Shell (the operator), the licensees are GDF SUEZ E&P Greenland AS, Statoil Greenland A/S and NUNAOIL A/S. License numbers for the two blocks are No. 2011/12 and No. 2011/14.
1.1 Exploration activities To date, Shell has been the operator for a Site Hazards Survey (2011), a Shallow Coring Project (2012) and a 3D Seismic Survey (2012). Based on these, potential sites for exploratory drilling have been identified. In 2013, Shell is planning to conduct a site survey of the potential drilling sites. The proposed 2013 activities are described in section 3.

PRELIMINARY ENVIRONMENTAL IMPACT ASSESSMENT
2
1.2 Environmental impact assessment Under the Greenlandic Mineral Resources Act, part 15, exploration-related activities require the submission of an Environmental Impact Assessment (EIA) or, if the activities are not expected of having adverse effect, an Environmental Mitigation Assessment /1/. Preparation of an Environmental Impact Assessment (EIA) is a systematic process to identify, predict, evaluate and mitigate the environmental impacts of a proposed project, ensuring informed decision-making by the company and the authorities, in this case, the Bureau of Minerals and Petroleum (BMP). This environmental impact assessment (EIA) for the 2013 site survey in Baffin Bay, has been prepared in accordance with a number of environmental acts, guidelines and manuals /1//2//3//4/. The EIA presents the technical project, stating how the site survey will be conducted, in accordance with Best Available Technique (BAT) and Best Environmental Practice (BEP). The impact assessment addresses a number of physical, chemical, biological and socioeconomic parameters. For each parameter, a description of existing conditions and an impact assessment is presented. For any expected, adverse impacts, mitigating measures will be evaluated and any residual impact will be further assessed. The findings of the EIA provide the basis for an Environmental Management Plan for the survey. The preliminary EIA will be published by the BMP for public consultation. Answers to submissions will be coordinated by the BMP and published with the final EIA report. The process of the EIA and public consultation is summarised in Table 1-1.
Table 1-1 Time table for the EIA process
Activity Expected timing Preliminary EIA submitted to BMP March 1st 2013 Public consultation March 1st – April 26th 2013 Response to public and regulatory comments Expected May 2013 Final EIA submitted Expected June 2013

PRELIMINARY ENVIRONMENTAL IMPACT ASSESSMENT
3
2. REGULATORY FRAMEWORK
2.1 Greenlandic legislation and guidelines The 2013 site survey in Baffin Bay is an activity under the Greenland Parliament Act no. 7, 2009 on mineral resources and mineral resources activities (The Mineral Resources Act) /1/. An amendment to the Mineral Resources Act was adopted by Parliament and in effect by 1 January 2013. The EIA has been prepared in accordance with Guidelines to environmental impact assessment of seismic activities in Greenland waters, December 2011 /3/ and Manual for seabird and marine mammal survey on seismic vessels in Greenland, May 2012 /4/.
2.2 International treaties, conventions and best practice Greenland is a self-governing province of Denmark with extensive autonomy on matters of environment and biodiversity. Since the establishment of the home rule in 1979, Greenland has signed a number of international agreements and has undertaken obligations under several international conventions concerning the use, administration and protection of the environment. As required by the BMP guidelines, offshore exploration activities are planned and executed in a way so that environmental risks are identified, assessed and reduced as much as reasonable practical. Best Available Technique (BAT) and Best Environmental Practice (BEP) shall be applied and used in order to minimise environmental impacts of the site survey. BAT and BEP guidelines (e.g. NORSOK and OGP standards), international conventions (e.g. OSPAR and MARPOL) have been observed in the preparation of the EIA and EMP.
2.3 Shell standards Shell requires that EIAs are prepared in line with internationally recognised standards. International Finance Corporation Performance Standard 1 is used as a reference document, with Greenlandic requirements and guidelines taking priority. The site survey will be conducted within the framework of Shell’s internal standards and business principles, as well as the environmental, health, and safety policies and procedures of engaged contractors. Environmental, Health and Safety management of the site survey will follow the procedures and requirements as described in Shell’s HSSE & SP Control Framework and Corporate Standards (Table 2-1).
Table 2-1 Shell commitment and policy on health, security, safety, environment and social performance.
Commitment Policy Shell is committed to:
• Pursue the goal of no harm to people • Protect the environment • Use material and energy efficiently to
provide our products and services • Respect our neighbours and contribute to the
societies in which we operate • Develop energy resources, products and
services consistent with these aims • Publicly report on our performance • Play a leading role in promoting best practice
in our industries • Manage HSSE & SP matters as any other
critical business activity • Promote a culture in which all Shell
employees share this commitment
Every Shell Company:
• Has a systematic approach to HSSE & SP management designed to ensure compliance with the law and to achieve continuous performance improvement
• Sets targets for improvement and measures, appraises and reports performance
• Requires contractors to manage HSSE & SP in line with this policy
• Requires joint ventures under its operational control to apply this policy, and uses its influence to promote it in its other ventures
• Engages effectively with neighbours and impacted communities
• Includes HSSE & SP performance in the appraisal of staff and rewards accordingly.

PRELIMINARY ENVIRONMENTAL IMPACT ASSESSMENT
4
3. PROJECT DESCRIPTION
3.1 Project overview Shell, as operator, is planning to undertake a site survey during the summer season of 2013 as preparation for future exploration of the license blocks 5 and 8 in Baffin Bay. The 2013 site survey is expected to be carried out by one or two vessels and includes:
• A two-dimensional high resolution (2D HR) seismic survey in multiple survey sites (of app. 3 x 3 km)
• An Environmental Baseline Survey (EBS) in multiple survey sites (of app. 3 x 3 km) • Service of metocean buoys deployed during the 2011 survey and serviced in 2012 • Deployment and recovery of Passive Acoustic Monitoring (PAM) buoys
The general objective of the site survey is to evaluate the presence of subsurface hazards, such as shallow gas pockets, and to obtain physical, chemical and biological characterisation of the immediate area around the potential drilling sites. The metocean monitoring activities are performed to gain a better understanding of the site-specific meteorological, oceanographic and ice conditions. Key figures concerning the proposed 2013 survey especially in relation to the seismic activities are presented in Table 3-1 and compared to the 2012 survey in the same area.
Table 3-1 Key figures concerning the 2012 and 2013 surveys
2012 survey Proposed 2013 survey Seismic survey area ~ 8,500 km2 ~ 90 km2 Duration of seismic activities ~ 2.5 months ~ 10 days Number of vessels 2 seismic (+ 5 support vessels) 1 seismic (+ possibly 1 EBS) Size of air gun array 2 x 3,480 in3 1 x 160 in3 The following sections provide, in accordance with BMP’s EIA Guidelines /3/, a description of the proposed type of work, area, schedule, equipment and materials for the planned 2013 site survey. Table 3-2, Table 3-4, Table 3-3 and Table 3-5 presents survey details in the format required by the BMP EIA Guidelines. The locations and actual number of survey sites (possibly up to 10 survey sites) are not fixed at this stage. However, the survey sites will be within the three survey areas illustrated in Figure 3-1. The figure also illustrates locations of proposed metocean and PAM buoys. Actual number and exact location of survey sites and metocean and PAM buoys will be determined and communicated to BMP. It is expected that location of survey sites will be situated in the survey areas within the two license blocks. The surveys will be restricted to up to ten survey sites (each 3x3 km) and will occur at depths of 500 – 800 m.

PRELIMINARY ENVIRONMENTAL IMPACT ASSESSMENT
5
Figure 3-1 Proposed survey areas, locations of metocean buoys and PAM equipment
As illustrated in Figure 3-1 the 2D HR seismic survey is proposed within selected parts of the area covered by the 3D seismic survey conducted in 2012. The area to be covered by 2D HR seismic activities in the proposed 2013 survey is up to 90 km2. As a reference it can be informed that the 3D seismic survey in 2012 covered approximately 8,500 km2. The planned site survey has been announced for tender as of December 19th 2012 and the proposals by potential contractors are requested on February 8th 2013. Award is expected mid-March. Therefore, specific details concerning e.g. vessels (expected up to two), equipment, logistic details etc. cannot be provided in this EIA. As basis for the assessments in this EIA (see section 5), this section will build on relevant requirements specified to potential providers of this service. Furthermore, descriptions of typical and/or expected equipment for these types of surveys will be described based on experiences from surveys performed under the same licenses in 2011 and 2012 /5//6/.

PRELIMINARY ENVIRONMENTAL IMPACT ASSESSMENT
6
3.2 Survey schedule and programme 3.2.1 General details
The timing of the site survey is highly dependent on ice conditions. The site survey is proposed to be undertaken in the period between July 15th and October 15th 2013 or as long as prevailing weather/ ice conditions allows. No 2D HR seismic shots will however be performed before August 1st 2013. Survey operations can normally continue 24 hours a day, seven days a week. See also section 3.3.3 and Appendix 2 concerning acoustic monitoring. The speed and progress of the site survey is likely to be influenced by the weather and the presence of ice in the survey areas. The order of surveyed sites will for the same reason depend on weather and ice conditions and operational requirements.
3.2.2 2D High resolution seismic survey The site survey includes a 2D HR seismic survey in up to ten 3 x 3 km survey sites within the survey areas in the two license blocks. The line spacing within the 3 x 3 km sites will be 100 m in main line direction with cross lines every 250 m adding up to approximately 135 km survey lines in total for each survey site. The target depth for the survey is maximum 1000 m below seabed. With an assumed vessel speed of 4 knots the 2D HR seismic surveying is expected to be completed within approximately 24 hours at each survey site. In addition, tie lines to adjacent locations may be required. The specific line orientation within the survey sites will be specified at a later stage of the planning and is not considered of importance to this EIA. The expected duration of the 2D HR seismic survey will involve the following operations and estimated time requirements within the time window for the planned site survey (August 1st to October 15th 2013):
• Mobilisation and transit to survey area – 7 days • Survey operation, including transit between sites – 22 days • Standby (weather downtime) – 4 days • Demobilisation and transit - 4 days
Table 3-2 provides the survey data requested in the BMP EIA Guidelines for seismic activities in Greenland waters /3/.
Table 3-2 Survey data table
Specify
Description Provided
Type of survey 2D HR seismic survey and EBS Shell Map of the area with all transect lines shown
See Figure 3-1 for survey areas. Specific survey sites (up to 10) are not yet defined Individual survey site sizes are 3 km x 3 km Line density 100 m / 250 m Transect lines not available yet
Shell
Start and end dates for the survey
Earliest start (mobilisation etc.): 15/07/2013 No 2D HR seismic shot before: 01/08/2013
Shell
Expected duration See section 3.2.2 Shell Duty cycle of operation (in hours / 24 hours). Number of hours in the dark per 24 hours
24 Hours, see section 3.3.3 concerning use of PAM / Hours of darkness in August: 0 h; September: 8 h; 1-15 October: 12 h
Shell
Number and types of accompanying vessels
No accompanying vessels are expected Shell
Intended use of icebreakers Will survey be carried out in ice?
Icebreaker assistance is not expected, see section 3.4.
Shell

PRELIMINARY ENVIRONMENTAL IMPACT ASSESSMENT
7
3.2.3 Environmental baseline survey Environmental baseline survey (EBS) is proposed at the same sites as the 2D HR seismic surveys (see Figure 3-1) to obtain a physical, chemical and biological characterization of the sites. The EBS work consists of:
• An integrated bathymetry survey by Multibeam Echo Sounder (MBES) and Side Scan Sonar (SSS)
• Visual seabed inspections by Remotely Operated Vehicle (ROV) • Benthic and sediment sampling by ROV or box corer and/or grab sampler
The expected duration of EBS will involve the following operations and estimated time requirements within the time window for the planned site survey (July 15th to October 15th 2013):
• Mobilisation and transit to survey area – 6 days • Survey operations, including transit between sites – 51 days • Standby (weather downtime) – 6 days • Maintenance – 4 days • Demobilisation and transit - 4 days
3.2.4 Metocean buoys maintenance
Metocean buoys were deployed in 2011. The buoys were serviced during the 2012 surveys and needs servicing again in 2013. These buoys will be retrieved, serviced and returned to the water. This activity will be carried out as part of the 2D HR seismic survey or the EBS within the time frames for the vessel conducting these services (see section 3.2.2 and 3.2.3).
3.2.5 Passive acoustic monitoring buoys Deployment and recovery of Passive Acoustic Monitoring (PAM) buoys for recording acoustic output from seismic programme and recording marine mammal vocalizations. These activities will be conducted as part of the 2D HR seismic survey or the EBS within the time frames for the vessel conducting these services (see section 3.2.2 and 3.2.3).
3.3 Type and intensity of activities 3.3.1 BAT and BEP implementation
The survey vessels and equipment for the survey will be selected based on operational requirements and the environment in which the survey is being carried out, e.g. ice class of vessels and minimum size of airgun array used. The vessels and equipment used for the survey will comply with industry Best Available Techniques (BAT) and Best Environmental Practice (BEP). BAT and BEP will be applied and used during the survey in order to minimise environmental impacts. Mitigation measures required to reduce the level of potential impacts in accordance with BAT and BEP are described in the specific impact sections.
3.3.2 Survey vessels It is not known at the moment if the 2D HR seismic survey and the EBS will be performed from one or two vessels. Vessels will comply with conventions, laws, regulations and legal requirements that apply to the specific activities in this area. Marine Mammal and Seabird Observers (MMSOs) will be on the vessel during the site survey, addressing mitigation of potential disturbance to marine mammals. The MMSOs will be tasked with implementing monitoring and mitigation measures as detailed in guidelines to environmental impact assessment of seismic activities in Greenland waters /3/ and in accordance with the DCE Manual for seabird and marine mammal survey on seismic vessels in Greenland, May 2012 /4/. The monitoring may be initiated outside Greenland waters, during vessel transit.

PRELIMINARY ENVIRONMENTAL IMPACT ASSESSMENT
8
The MMSOs have two tasks. • To watch systematically for marine mammals before start-up and during seismic survey in
order to mitigate and observe safety distances to whales and seals. • To collect data on abundance and distribution of seabirds and marine mammals through
systematic surveys. This task shall be carried out both during times when seismic survey is conducted, and when sailing in transit.
During survey activities in conditions with poor visibility a Passive Acoustic Monitoring (PAM) system will be used on board the vessel. The system is expected to be running during the entire survey to continuously monitor the environment. The PAM system will be operated on board the survey vessel. Detected sounds are processed using specialized software. The MMSOs will be competent in operating the PAM system and interpret the detected sounds. Details of the PAM system in Table 3-3 are requested in the EIA guidelines. These details will be available at contract award.
Table 3-3 Specifications of PAM system, will be available at contract award
Specify
Description Provided
Number of hydrophones Threshold of the recording system
Sample rate of the recording system
Where will hydrophones be placed?
Will there be duty cycling of recordings? In that case when will the PAM system be used?
Name of software Species covered Estimated range accuracy, m. Furthermore, a Fisheries Liaison Officer (FLO) will be used if required by BMP to communicate and advise in matters related to the fishery. Refer to section 5.13 concerning fishery.
3.3.3 2D HR seismic survey equipment The survey vessel for the 2D HR seismic survey will be capable of undertaking the following survey operations in water depths of up to 1,000 meters:
• Shallow seismic geohazard surveys • Bathymetry surveys (single beam echo sounder)
The survey vessel will deploy the following equipment:
• Single Beam Echo Sounder • Seismic source for geohazard surveys • Streamer (solid or gel filled)
In addition to BMP requirements, all survey operations will as a minimum comply with the 2011 OGP Guidelines for the conduct of offshore drilling hazard site surveys /7/. Specifically regarding the offshore seismic survey, the contractor will meet “IAGC Environmental Guidelines for World-wide Geophysical Operations (2001)” and “IAGC Recommended Mitigation Measures for Cetaceans during Geophysical Operations (2009)”.

PRELIMINARY ENVIRONMENTAL IMPACT ASSESSMENT
9
The contractor for the site survey has not been selected and no specific details on e.g. vessels can currently be provided. Figure 3-2 illustrates a typical 2D HR Seismic site survey. A small air gun (standard source configuration and volumes are expected for this survey) will provide the seismic source, with a 600 m solid or gel filled hydrophone streamer to record the seismic reflection towed behind the survey vessel.
Figure 3-2 Schematic illustration of a typical 2D HR seismic survey setup.
Air guns produce, specifically sound at low frequencies (50-250 Hz) by venting high-pressure air into the water. This produces an air-filled cavity that expands rapidly, then contracts and re-expands to generate the pulsed signal which penetrates the subsurface and is reflected back to the streamers. A single beam echo sounder (SBES) will also be used during the 2D HR seismic survey to obtain knowledge of the seabed. A frequency of 210 kHz is expected for the SBES. Table 3-4 and Table 3-5 provide the array specifications and acoustic properties of the airgun array requested in the EIA Guidelines for seismic activities in Greenland waters /3/. The presented data pertains to the acoustic modelling performed for this survey, Appendix 2. For reference it can be informed that the 3D seismic survey conducted in 2012 in the same area was performed using 2 vessels each with an air gun array size of 3,480 in3 and 6 streamers of 7 km each and supported by 4 chase vessels and 1 support vessel (this 2013 survey assumes an air gun array of 160 in3, see Table 3-4).

PRELIMINARY ENVIRONMENTAL IMPACT ASSESSMENT
10
Table 3-4 Array specifications
Specify
Description Provided
Number and names of vessels towing airgun arrays
One or two vessel will be used for 2D HR seismic survey and EBS. No contracted operator yet.
Shell
For each vessel provide geometric layout of complete airgun array with individual volume specified (in PSI per airgun and in3 per airgun)
Not available yet. Source configuration and volumes however expected to be standard for 2D HR: 4 x 40 in3 sleeve gun array.
Shell
Size of total array (In3 and PSI for the entire array)
160 in3 is expected Shell
Firing rate in shots/sec Will sub arrays fire simultaneously or alternate?
Shot point interval 6.25 m at 4 knots. Shell
Operation speed of the vessel in km/hours or knots.
4 knots Shell
Table 3-5 Acoustic properties of the airgun array
Specify Description Provided Far field pressure signature (provide figure) Frequency spectrum of the far field signature (broadband) (provide figure)
See acoustic modelling report (Appendix 2)
DHI
Source level (source factor) of airgun array on acoustic axis below array, given in all of the following units:
• dB re 1 µPa zero- peak (broadband)
230 dB re µPa DHI
• dB re 1 µPa peak- peak (broadband)
236 dB re 1µPa DHI
• dB re 1 µPa rms (Over 90%* pulse dura-tion) (provide duration for rms calculation)
50 ms pulse duration; 227 dB re 1 µPa
DHI
• dB re: 1 µPa2s. per pulse
214 dB re 1 µPa2·s DHI
• Energy, joule/m2 per airgun pulse
Will be available following contract award
Signal duration. (Define how it is measured)
50 ms; taken from literature DHI
Map showing modelled sound pressure levels (rms*), peak-peak and sound exposure level (µPa2s) for the survey area and surroundings (to levels likely to affect marine mammals or nearest land)
See noise maps in acoustic modelling report (Appendix 2)
DHI
Provide description of the noise propagation model, including assumptions of sound speed profiles.
Parabolic Equation RAMgeo code, Sound Speed Profile taken from measurements done in 2012 (details; see acoustic modelling report; Appendix 2)
DHI

PRELIMINARY ENVIRONMENTAL IMPACT ASSESSMENT
11
3.3.4 Environmental baseline survey equipment Seabed morphology, seabed bathymetry and presence of biota on the seabed are determined by acoustic means through high resolution Side Scan Sonar (min 500 kHz, SSS) and Multi Beam Echosounding (200 or 400 kHz, MBES). The SSS and MBES will be Remote Operated Vehicle (ROV) or Autonomous Underwater Vehicle (AUV) mounted. Figure 3-3 illustrates a typical vessel for EBS.
Figure 3-3 Schematic illustration of a typical environmental baseline survey.
Visual inspection will be carried out by means of an HD camera mounted on a ROV. Visual inspection and analysis is required for geophysical and biological seabed features. The visual surveys are executed cautiously to ensure that it does not cause damage to biota, especially if the target includes corals and/or sponges. Visual inspections will be carried out on seabed features with areas >25 m2. A maximum of 3 inspections per survey site is expected.. Benthic and sediment sampling is proposed in eight stations for each of the survey sites to enable characterisation of benthic invertebrate assemblages and physical/chemical characterization as per OSPAR guidelines. Additional characterisation of epifauna will also be achieved through sampling at the seabed. Numbers of samples and sampling strata associated with the physical and chemical analysis sediment samples will vary by parameter. The planned methods of collecting sediment samples as well as number of samples and sample specifications are indicated in Table 3-6 for each survey site. The physical footprint will depend on the actual sampling device and the number of samples. Assuming an impact area of 0.1 to 0.25 m2 per sample and a number of rejected samples, a total area of 70 m2 per survey site is roughly estimated.

PRELIMINARY ENVIRONMENTAL IMPACT ASSESSMENT
12
Table 3-6 Planned EBS sampling and methods for each of the three survey sites
Sampling
Method Station Samples Specifications
Seabed bathymetry
Side scan sonar and multi beam echosounder
Minimum area of 3 km x 3 km per survey site
- -
Seabed features
Remotely operated vehicle w/ HD camera
Dependent on acoustic survey
- -
Surficial sediment (Benthic invertebrate)
Box corer and/or grab sampler
Minimum of 8 stations per survey site
Minimum of 70 per survey site
Volume of each sample is 0.02 m3 (0.32x0.32x0.2 m3)
Surficial sediment (Chemistry)
Box corer and/or grab sampler
Minimum of 8 stations per survey site
Minimum of 116 per survey site
Weight of samples is between 50 and 300 g per sample Maximum depth of sampling is 6 cm
Epifauna
Small bottom trawl or dredge
Dependant on acoustic and ROV survey
One tow per sampling station
Contents of trawl or dredge
3.3.5 Metocean and PAM buoys The monitoring equipment for the metocean and PAM buoys requires a means of securing them to the seabed. For ease of handling and deployment, steel weights are used as ballast. This is a relatively common method of securing such moorings and provides the necessary ballast which is easy to deploy and has a small seabed footprint. During deployment of the buoys it is possible that the steel weight will settle into the seabed. The planned method for recovery is to leave the steel weights on the seabed following recovery of the equipment. This will leave a physical footprint of less than 1 m2 per buoy and the weights would degrade slowly over time. An example of an metocean buoy setup is illustrated in Figure 3-4.

PRELIMINARY ENVIRONMENTAL IMPACT ASSESSMENT
13
Figure 3-4 Principle of oceanographic mooring setup
3.4 Logistics
Upernavik is the proposed primary port for medical emergency response, with Aasiaat proposed as an alternative base. Crew changes as needed are planned executed through the nearest suitable port or by crewboat from Upernavik. Bunkering and resupply will only take place in accordance with the Manual of Permitted Operations (MOPO) developed specifically for this operation once the contractor has been selected. Approximately 35 and 50 personal are expected to be stationed onboard the survey vessels for the 2D HR seismic survey and the EBS respectively, assuming two vessels. A comprehensive ice management plan will be developed as part of the project preparations. The plan will outline how icebergs and growlers will be dealt with to ensure a safe operation of the vessel during operations and transit. This will include systems for iceberg/growler detection, tracking and avoidance procedures. Icebreaker assistance is not expected, as the survey will only take place during conditions without first year ice.

PRELIMINARY ENVIRONMENTAL IMPACT ASSESSMENT
14
3.5 Waste, emissions and discharges 3.5.1 Emissions to air
The main source of emissions to the atmosphere will be from the vessel’s engines. The vessels will use marine gasoil with sulphur content less than 1.5 % (weight). It is roughly estimated that the total fuel consumption from both the seismic vessel and the EBS vessel is expected to be approximately 2,500 tonnes in total for both surveys (EBS and seismic). Standard industry emission factors /8/ are used to estimate emissions to air based on the fuel usage of 2,500 tonnes. The total emissions are presented in Table 3-7.
Table 3-7 Estimated emissions to air from vessels during 2013 survey
Component Estimated total emissions (tonnes)
CO2 7925 NOX 175 Nm VOC 13 SOX 7 N2O 1 CO 18
3.5.2 Vessel liquid discharges The main liquid effluents generated by the survey vessels will comprise:
• Greywater (water from culinary activities, shower and laundry facilities, deck drains and other non-oily waste water drains (excluding sewage))
• Treated blackwater (sewage) • Drainage water • Service water / vessel engine cooling water.
All discharges will comply with requirements set out in the International Convention for the Prevention of Pollution from Ships, 1973, as modified by the Protocol of 1978 (MARPOL 73/78) and its annexes. The total volumes of planned discharges (from both EBS and seismic survey, assuming to vessels) are estimated at 4,500 litres of treated blackwater and 13,000 litres greywater. These estimates assume that black water and grey water are produced at a rate of up to 50 litres and 150 litres per person per day respectively /5/, for the expected number of persons on board i.e. 35 persons (EBS) and 50 persons (seismic survey). The total volume of discharged service water is expected to be small and spread over a large offshore area.
3.5.3 Vessel solid wastes All solid wastes will be sorted by type, compacted where practicable and stored on board before disposal to an appropriate certified onshore reception facility. It is proposed that the survey vessels will bag solid waste materials and store them on board for disposal on return to the vessel’s home ports. Should waste disposal be required in Greenland, an appropriate port will be used to provide waste handling / disposal facilities. Food waste will be macerated and disposed at sea. All wastes during the survey will be managed in accordance with MARPOL requirements, relevant national legislation and best practice principles.
3.5.4 Lights During the open water season there is constant light in the Baffin Bay area until dark nights start in early September. At 74˚N, the midnight sun period, with the sun continuously above the horizon lasts from April to August. Up to the 12 h day/12 h night at autumn equinox (21st September) the number of daylight hours decrease gradually. By the end of the survey window (October), the day-length will have decreased to approx. 4 hours in the survey area, and by November 7, the polar night engulfs the survey area. The need for on-deck illumination thus increases during the survey.

PRELIMINARY ENVIRONMENTAL IMPACT ASSESSMENT
15
All survey vessels will carry appropriate navigation lights for periods of poor visibility and night-time, including ice searchlights.
3.5.5 Noise The vessels and the 2D HR seismic survey and other geophysical equipment generate underwater noise. The largest sound pressure level will be generated by the survey airgun and the frequency content of the emitted pulse will be a function of the total airgun volume (see section 5.2.1). The signal is focused in a downward direction to limit spreading of sound. High resolution seismic site survey uses a much smaller airgun than other seismic surveys, which typically use airgun arrays with a capacity far greater than 1,000 in3. The airgun size expected for this survey is 160 in3. Typical noise levels produced are presented in section 5.2.1.
3.6 Demobilisation Demobilisation is pending further planning when contractor is selected. The vessels may demobilise in Greenland from the survey areas on completion of the site survey.

PRELIMINARY ENVIRONMENTAL IMPACT ASSESSMENT
16
4. CONSIDERED ALTERNATIVES
4.1.1 Timing The survey schedule is predominantly determined by ice conditions in the area, as well as availability of a suitable vessel tailored to operating in these conditions. Ice cover for much of the year prevents vessel movements in the area over large periods of time. The survey period between July 15th and October 15th 2013 has been identified as the open water season when the site survey can be carried out. No other alternatives could be considered.
4.1.2 Survey equipment The proposed survey equipment uses sound of different frequencies and amplitudes to map the seabed and shallow sediments. The range of equipment provides varying degrees of coverage, detail and penetration into the seabed. The equipment has been selected to provide the coverage and detail required to address any potential seabed or shallow hazards. The high resolution seismic spread will use an airgun to generate the seismic signal. Alternative sound sources include explosives and water guns, however, the air gun is preferred as it is the safest, most reliable and provides a consistent signal required for acquiring data. The airgun source proposed for this site survey is far smaller than the airgun source used for typical seismic surveys, which will often be in the order of twenty times larger. The smallest size of airgun will be used which is capable of delivering the signal strength required to map the sub-surface and identify potential hazards as per the survey scope of work. The survey will utilise a towed streamer to record the returning sound signal generated by the airgun or airguns. An alternative to the use of a towed streamer is the use of Ocean Bottom Sensors. With this technique, cables are placed on the seabed with hydrophones and geophones to detect the reflected waves from the sound source. This technique is not suitable for use during a high resolution site survey which is of short duration. Instead, Ocean Bottom Sensors are primarily used for longer term projects where the sensors can remain in place over long periods. A towed streamer is therefore considered to be a relatively simple and safe method of seismic acquisition.

PRELIMINARY ENVIRONMENTAL IMPACT ASSESSMENT
17
5. IMPACT ASSESSMENT (PLANNED EVENTS)
The environmental impact assessment (EIA) addresses a number of physical, chemical, biological and some socioeconomic parameters. For each parameter, a description of existing conditions is presented. The existing conditions are presented with reference to the recent strategic environmental impact assessment (SEIA) of Baffin Bay /9/ where appropriate. Since the license blocks are located more than 85 km from the coast, coastal resources and topics have largely been considered outside the area of influence for the site survey. As recommended in the seismic EIA guidelines /3/, focus is on the biological components of the environment that are most likely to be influenced by the site survey. Based on the description of the existing conditions, an assessment of environmental impacts is performed. A set of impact factors related to the survey are identified, and potential impacts are assessed along the classical assessment lines: time, space and magnitude, in accordance with the methodology presented in section 5.1.
5.1 Method for impact assessment The impact assessment is based on the survey plans as they appeared by late January 2013, and the description of the existing environment. Both planned and unplanned (accidental) impacts (resulting from planned and unplanned events, respectively) are assessed. This section describes the methodology used to assess the environmental impacts associated with the 2013 site survey. Environmental impacts include both direct and any indirect, secondary, short-, medium- and long-term, permanent and temporary, positive and negative impacts caused by the project. The methodology used for assessment of impacts includes criteria for categorizing environmental impacts. The impact assessment includes:
• Identification of potential project impacts • Nature, type and reversibility of impact • Intensity, scale and duration of impacts • Sensitivity of resource/receptor • Overall severity of impacts
The impact assessment methodology serves to provide means of characterising identified impacts and their overall severity. Following the assessment of overall severity, a further assessment of residual impacts are performed. Residual impact assessesthe impact upon the receiving environment after implementation of mitigation measures.
5.1.1 Identification of potential project impacts The first step of identifying potential impacts consists of an identification of which sources or activities in the project may result in potential impacts and which receptors may be affected. Typical impacts are associated with:
• Noise • Physical disturbance • Waste • Discharges to sea • Emissions to air • Light • Unplanned events (assessed in section 6)
5.1.2 Nature, type and reversibility of impact
Impacts are initially described and classified according to their nature (either negative or positive), their type and their degree of reversibility. Type refers to whether an impact is direct, indirect, secondary or cumulative. The degree of reversibility refers to the capacity of the impacted environmental component/resource to return to its pre-impact state.
Nature, type and reversibility are elaborated upon in Table 5-1.

PRELIMINARY ENVIRONMENTAL IMPACT ASSESSMENT
18
Table 5-1 Classification of impacts: Nature, type and reversibility of impacts
Nature of impact
Negative An impact that is considered to represent an adverse change from the baseline (current condition) or to introduce a new, undesirable factor.
Positive An impact that is considered to represent an improvement to the baseline or to introduce a new, desirable factor.
Type of impact
Direct Impacts that result from a direct interaction between a planned project activity and the receiving environment.
Indirect Impacts that result from other activities that are assessed to happen as a consequence of the project.
Secondary Impacts that arise following direct or indirect impacts as a result of subsequent interactions within the environment.
Cumulative Combined impacts of other survey activities and other human activities in the area (e.g. fishery)
Transboundary Impacts across borders, i.e. impacts to the Canadian part of Baffin Bay.
Degree of reversibility
Reversible Impacts on resources / receptors that cease to be evident, either immediately or following an acceptable period of time, after termination of a project activity.
Irreversible Impacts on resources / receptors that are evident following termination of a project activity and that remain for an extended period of time. Impacts that cannot be reversed by implementation of mitigation measures.
5.1.3 Intensity, scale and duration of impacts.
Predicted impacts are defined and assessed in terms of a number of variables, primarily intensity, scale and duration of an impact. Ascribing values to the variables are, for the most part, objective. However, awarding a value to certain variables may be subjective in that the extent, and even direction, of change often is difficult to define.
An explanation of the classifications and values applied in the EIA is presented in Table 5-2.
Table 5-2 Classification of impacts in terms of Intensity, scale and duration. Intensity of impacts
No impact: No impacts on structure or function of the resource/receptor within the affected area.
Minor impact: Minor impacts on structure or function of the resource/receptor within the affected area, but basic structure and /function remain unaffected.
Medium impact: There will be partial impacts on structure or function inside the affected area. Structure/function of the resource/receptor will be partially lost.
Large impact: The structures and functions of the resource/receptor are altered completely. Structure/function loss is apparent inside the affected area.
Geographical extent of impacts
Local impacts: There will be changes in the immediate vicinity of the survey area. Impacts are restricted to the survey sites (3x3 km).
Regional impacts: There will be impacts outside the immediate vicinity of the survey sites (local impacts), and up to around 10 km outside the survey sites.
National impacts: Impacts will be restricted to Greenland.
Transboundary impacts:
Impacts will be experienced outside of Greenland.

PRELIMINARY ENVIRONMENTAL IMPACT ASSESSMENT
19
Duration of impacts
Immediate: Impacts during and immediately after the construction; however the impacts stop immediately when the activity is stopped.
Short-term: Impacts throughout the period of site survey and up to one year after.
Medium-term: Impacts that continue over an extended period, between one and ten years after the site survey.
Long-term: Impacts that continue over an extended period, more than ten years after the site survey.
5.1.4 Sensitivity of resource/receptor
The overall significance of the impacts is evaluated on basis of the evaluation of the single impact variables, as described above, and on the sensitivity of the resource/receptors affected. It is imperative to place some form of value (low, medium and high) on a resource/receptor that could potentially be affected by project activities. Such a value may be regarded as subjective to some extent. However, expert judgement and stakeholder consultation ensure a reasonable degree of consensus on the intrinsic value of a resource/receptor. The allocation of a value to a resource/receptor allows for the assessment of a resource’s/receptor’s sensitivity to change (impact). Various criteria are used to determine value/sensitivity, including, amongst others, resistance to change, adaptability, rarity, diversity, value to other resources/receptors, naturalness, fragility and whether a resource/receptor is actually present during a project activity. These determining criteria are elaborated upon in Table 5-3.
Table 5-3 Criteria used to evaluate sensitivity of resource/receptor.
Sensitivity
Low: A resource / receptor that is not important to the functions/services of the wider ecosystem or that is important but resistant to change (in the context of project activities) and will naturally and rapidly revert to pre-impact status once activities cease.
Medium: A resource / receptor that is important to the functions/services of the wider ecosystem. It may not be resistant to change, but it can be actively restored to pre-impact status or will revert naturally over time.
High: A resource / receptor that is critical to ecosystem functions/services, not resistant to change and cannot be restored to pre-impact status.
5.1.5 Overall severity of impacts
The severity of the impact is then defined by comparing the intensity of the impact of the project and the sensitivity of the environmental receptors. It is qualified according to a scale which ranges from "none" to "significant", defined as presented in Table 5-4.
Table 5-4 Criteria for evaluation of the severity of impacts
Severity of impacts
No impact: There will be no impact on the environment.
Minor impact: Minor adverse changes that might be noticeable, but fall within the range of normal variation. Impacts are short-term and natural recovery takes place in the short term.
Moderate impact: Moderate adverse changes in an ecosystem. Changes may exceed the range of natural variation. Potential for natural recovery in the medium-term is good. However, it is recognised that a low level of impact may remain.
Significant impact: The structure or function in the area will be changed, and the impact will also have impact outside the license blocks.
In the environmental impact assessment, every resource/receptor assessed will be accompanied by a table summarizing the assessment of the different variables of intensity, scale and duration,
PRELIMINARY ENVIRONMENTAL IMPACT ASSESSMENT
20
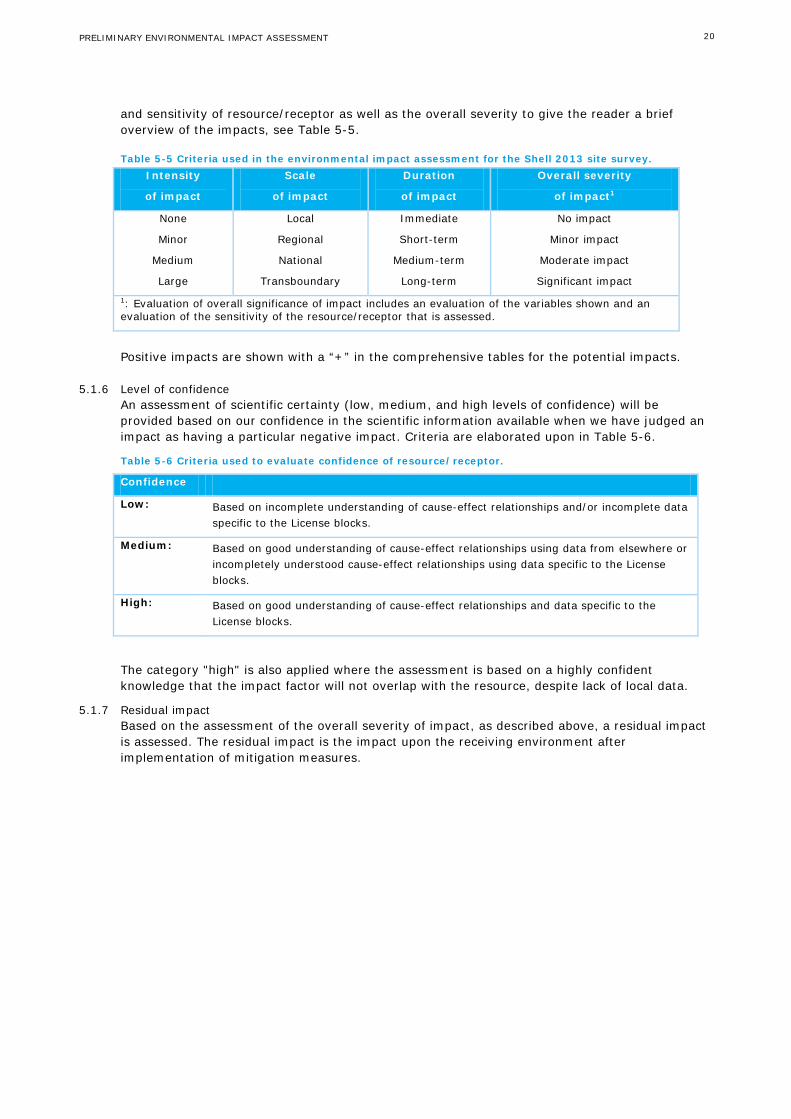
and sensitivity of resource/receptor as well as the overall severity to give the reader a brief overview of the impacts, see Table 5-5.
Table 5-5 Criteria used in the environmental impact assessment for the Shell 2013 site survey. Intensity
of impact
Scale
of impact
Duration
of impact
Overall severity
of impact1
None
Minor
Medium
Large
Local
Regional
National
Transboundary
Immediate
Short-term
Medium-term
Long-term
No impact
Minor impact
Moderate impact
Significant impact 1: Evaluation of overall significance of impact includes an evaluation of the variables shown and an evaluation of the sensitivity of the resource/receptor that is assessed.
Positive impacts are shown with a “+” in the comprehensive tables for the potential impacts.
5.1.6 Level of confidence An assessment of scientific certainty (low, medium, and high levels of confidence) will be provided based on our confidence in the scientific information available when we have judged an impact as having a particular negative impact. Criteria are elaborated upon in Table 5-6.
Table 5-6 Criteria used to evaluate confidence of resource/receptor.
Confidence
Low: Based on incomplete understanding of cause-effect relationships and/or incomplete data specific to the License blocks.
Medium: Based on good understanding of cause-effect relationships using data from elsewhere or incompletely understood cause-effect relationships using data specific to the License blocks.
High: Based on good understanding of cause-effect relationships and data specific to the License blocks.
The category "high" is also applied where the assessment is based on a highly confident knowledge that the impact factor will not overlap with the resource, despite lack of local data.
5.1.7 Residual impact Based on the assessment of the overall severity of impact, as described above, a residual impact is assessed. The residual impact is the impact upon the receiving environment after implementation of mitigation measures.

PRELIMINARY ENVIRONMENTAL IMPACT ASSESSMENT
21
5.2 Summary of potential project impacts The potential project impacts resulting from the planned 2013 site survey are summarized in Table 5-7, based on the project description (see section 3).
Table 5-7 Summary of potential project impacts. For details, please refer to section 3.
Potential project impact
Summary based on section 3
Physical disturbance from vessels and equipment
During the site survey up to two vessels are expected in the area (EBS and seismic vessel). The site survey is planned to be undertaken in the period between the 15th July and 15th October 2013. No 2D HR seismic shots will be fired before 1st of August 2013.
Noise The 2D HR seismic survey equipment and the vessel propeller systems generate an amount of underwater noise. The largest sound pressure level will be generated by the survey airgun. As underwater noise is considered a primary impact, special focus will be given to this. Acoustic modelling is presented below.
Waste All solid wastes will be sorted by type, compacted where practicable and stored on board before disposal to an appropriate certified reception facility. No waste will be abandoned offshore.
Planned discharges All discharges will comply with requirements set out in MARPOL. The total volume of discharges (both EBS and seismic survey) is estimated at 4,500 l blackwater and 13,000 l greywater. The volume is discharged throughout the survey period, over a large offshore area.
Emissions Emissions have been estimated based on fuel consumption in relation to the 2013 site survey. Total emissions (both EBS and seismic survey) are estimated at 7,925 ton CO2, 175 ton NOx, 13 ton nmVOC, 7 ton SOx, 1 ton N2O and 18 ton CO2.
Light All survey vessels will carry appropriate navigation lights for night-time and periods of poor visibility, including ice searchlights.
Unplanned events Unplanned events are addressed in section 6.
5.2.1 Acoustic noise modelling The 2D HR seismic surveys introduce sound pressure levels that have the potential to impact marine life (marine mammals and fish) at the sites and in adjacent areas. Acoustic modelling has been performed for the site survey, in accordance with the BMP guidelines and the model includes an estimate of the noise levels included in the model and the numerical modelling of the propagation loss from source out to a distance where impacts are not considered biologically important for the receivers.
An introduction to sound is presented in Appendix 1, presenting sound terminology. The acoustic modelling is included in Appendix 2.
An overview of the areas that will be explored using 2D seismic survey, as well as the Environmental Baseline Survey (multi-beam echosounder and side-scan sonar) is shown in Figure 5-1. The site survey will take place at up to ten locations within the proposed survey area. The noise modelling of the 2D seismic surveys is based on modelling at three sites (3x3 km) around proposed sites occurring at depths of 500 – 800 m. Noise generated by the additional survey methods (multibeam echosounder, side scan sonar) is also assessed. The modelling is presented in Appendix 2, and the results are summarised in this section.
Multi-beam echosounders are used to provide a detailed estimate of water depth. The equipment model Kongsberg EM 1002 multibeam echosounder produces pulsed signals with a duration of either 0.2, 0.7 or 2 msec. The main energy is centred around 95 kHz, and source sound pressure levels are reported to be 225 dB re 1µPa /14/.The beam pattern is broad in the plane defining the width of the echosounder’s transducer and narrow in the plane defining its height.

PRELIMINARY ENVIRONMENTAL IMPACT ASSESSMENT
22
Side-scan sonars use extremely high-frequency (100-500 kHz) pulses to map the upper layers of the seabed. The pulses are of very short duration (300-600 µsec), and source sound pressure levels are between 220-226 dB re 1µPa /14/.
2D High resolution seismic survey to investigate the proposed locations for drilling. The surveys are similar to conventional 2D seismic surveys, except that the source used is comprised of a smaller volume of compressed air such as in this case with the overall 160 cubic inches involving only four airguns. Looking at the source strength, Genesis /14/ and Wyatt /16/ provide a comprehensive review of a variety of airguns and airgun arrays. According to their analysis, the emitted sound field is a function mainly of the size and the number of airguns and the overall emitted psi values.
Figure 5-1 Overview of the survey areas and the three locations for which the modelling of the 2D seismic surveys was undertaken.
Based on information from the literature (for example /14/) we derived a zero-to-peak value of 230 dB re 1 µPa for the type of airgun array assessed to be used in the site survey. The difference between the zero-to-peak values and the peak values was set at 6 dB resulting in a peak-to-peak source sound pressure level of 236 dB re 1 µPa for the array /14/.
For the frequency spectrum we used a modelled far-field signature and the corresponding frequency spectrum for frequencies up to 1 kHz of a representative array (see /65/) and scaled it to meet the source strength identified for this study. We decided to include frequencies of up to 4 kHz (see Madsen /15/). For frequencies above 1 kHz, the source spectrum was extrapolated assuming an 18 dB / octave slope (see, for example Wyatt /16/). The resulting spectrum is shown in Figure 5-2.

PRELIMINARY ENVIRONMENTAL IMPACT ASSESSMENT
23
Figure 5-2 Frequency spectrum of seismic survey array far field signature.
Based on the derived spectrum, the resulting broadband SEL level was 214 dB re µPa2·s. Genesis /14/ lists zero-to-peak and SEL values for a variety of airguns and airgun arrays, and based on their review it can be seen that on average the SEL values are about 20 dB below the zero-to-peak values. RMS values can then be derived from SEL values (see review by OSPAR /17/).RMS values could be derived by adding 13 dB to the corresponding SEL values.
5.2.2 Modelling results – summary of Appendix 2 2D seismic surveys are to take place at up to ten locations in Baffin Bay. The surveys will be restricted to areas (3x3 km) around proposed drilling sites and will occur at depths of 500 – 800 m. We present the results of an acoustic propagation modelling study of the expected noise exposure from the planned 2D seismic surveys to be included in the supplied EIA. The model is based on actual bathymetry information covering the entire area and basic knowledge of sediment properties. We also used detailed data on the vertical sound speed profiles during the time of the proposed survey (July – October). Horizontally, our model intends to cover all areas exposed to levels likely to affect marine mammals. Different from previous investigations, we also include frequencies above 2 kHz in the modelling to better match the acoustic sensitivity of some of the marine life in the area.
Based on information about the airgun array that will be used and literature data the acoustic modelling used a zero to peak source sound pressure level of 230 dB re 1 µPa as the input variable in this study. The resulting peak to peak source sound pressure level was defined as 236 dB re 1 µPa. For the frequency spectrum we used a modelled far-field signature and the corresponding frequency spectrum of a representative array and scaled it to meet the source strength identified for this study. Based on the derived spectrum, the resulting broadband SEL level was 214 dB re µPa2·s. RMS values were directly derived from SEL values and resulted in a source sound pressure level of 227 dB re 1 µPa. The calculation of the sound levels at different distances from the sources was undertaken for frequencies up to 4 kHz using a 2D numerical model of the underwater acoustic propagation. The well-established AcTUP package was used, applying the RAMGEO code which is a full Parabolic Equation model.
An example of the noise propagation maps produced in the acoustic modelling is shown in Figure 5-3.

PRELIMINARY ENVIRONMENTAL IMPACT ASSESSMENT
24
Figure 5-3 Example of noise propagation map at one of three sites where acoustic modelling has been undertaken [units are in dB re 1 µPa2·s].
The results of the modelling show a sharp decrease of sound levels in the first km from the source and a smoother decline in sound pressure levels at a longer range. Higher frequencies than 1 kHz where attenuated more rapidly than those below 1 kHz although not as drastically as expected. Furthermore, the difference in propagation loss across sites was very small indicating that results obtained here can be transferred somewhat to other sites if the development is relocated.
Looking at the cumulative sound fields (sound over a 24 h period including the survey), it is clear that impact ranges can be larger than for single shots. Yet, the assumption that the acoustic energy just sums up at the receiver in the way suggested by the calculations, neglects that hearing might recover between pulses. Thus, the overall impact from the survey over the course of a one-day cycle might be smaller than indicated in the cumulative maps.
The survey area will comprise 3 x 3 km with transects at each 100 m. It will take app 12 h to travel this distance with the assumed survey speed of 4 kn. The total survey area will be this 90 km2.
5.3 Climate and ice conditions 5.3.1 Existing conditions
As described in the SEIA /9/, the weather conditions in the Baffin Bay area are influenced by the North American continent and the North Atlantic Ocean, but also the Greenland Inland Ice and

PRELIMINARY ENVIRONMENTAL IMPACT ASSESSMENT
25
the steep coasts of Greenland have a significant impact on the local weather. Atlantic depressions frequently cause strong winds off West Greenland. Also more local phenomena such as fog are common features near the shore. Midnight sun, when the sun is continuously above the horizon, lasts from the 30th of April to the 12th of August at 74 ˚N. Up to the 12 h day/12 h night at autumn equinox (21st September) the number of daylight hours decrease gradually. By the end of the survey (mid October), the day-length will have decreased to approx. 4 hours in the survey area, and by November 7, the polar night engulfs the survey area. The license blocks are situated within the Arctic climate zone, with average air temperature below 10° C year round. Summer temperatures over the ocean are usually close to surface water temperatures, which typically range from -1.8 to 5 ˚C. In winter the waters of Baffin Bay are normally covered with sea ice from December to June. Two types of sea ice occur: fast ice, which is stable and anchored to the coast, and drift ice, which is very dynamic and consists of floes of varying size and density. The drift ice is often referred to as ‘The West Ice’ because it is formed to the west of Greenland /9/. The maximum extend of the west ice is usually seen in late March. In addition to sea ice, icebergs originating from calving glaciers occur in the entire region, and may be encountered during the site survey /10/.
5.3.2 Impact assessment The emissions associated with the site survey (from up to two vessels) have been assessed in section 3.5. The estimated emissions from the site survey are considered comparable to those from other vessels in the area. It is assessed that no measurable impacts on climate and ice conditions will occur.
Table 5-8 Environmental impacts to climate and ice conditions in connection with the 2013 site survey.
Potential project impact
Intensity
of impact
Scale
of impact
Duration
of impact
Overall severity
of impact
Level of confidence
Emission of greenhouse
gasses
Minor Local Long-term No impact High
5.4 Oceanography 5.4.1 Existing conditions
The oceanography in the license blocks and in Baffin Bay was reviewed in detail in an EIA from 2012 /6/, and is briefly summarized in the following. The currents in Baffin Bay are dominated by a strong southward flow of cold water and ice from the Arctic Ocean. The relatively warm West Greenland Current crosses Baffin Bay from east to west. Because of the moderate wind conditions in Baffin Bay, wave heights are characteristically small, usually below 1.7 m for the four-month period August–November, 1985–1996 /19/. Larger waves can occur, but these are usually of short duration. Waves have minimum levels in the early summer months when considerable amounts of sea ice are present as well as the lower summer winds, whereas larger waves occur in the fall with more open water and higher winds. The water temperature at the surface is below −1 °C in winter. In summer, the surface temperature varies from 4–5 °C to 0 °C. At deeper waters, the temperature is low throughout the year. The salinity exceeds 34 ‰ in winter, partly due to sea ice formation, while summer salinity is typically 30-32 ‰.
5.4.2 Impact Assessment In general, the oceanography in Baffin Bay is a product of large-scale and global processes. Presence of vessels performing seismic and environmental surveys within a period of a few months will not impact the oceanography.

PRELIMINARY ENVIRONMENTAL IMPACT ASSESSMENT
26
Table 5-9 Environmental impacts to oceanography in connection with the 2013 site survey.
Potential project impact
Intensity
of impact
Scale
of impact
Duration
of impact
Overall severity
of impact
Level of confidence
- No impact High
5.5 Bathymetry 5.5.1 Existing Conditions
The coastal zone of the region is dominated by rocky shorelines with many archipelagos. Small bays with sand or gravel are found in sheltered areas. The Northern part (from Kullorsuaq and to Savissivik in the North) the coastal line is dominated by glaciers with Nunataks /10/. The bathymetry of Baffin Bay with shallow sills both to the north and south creates a relatively isolated body of cold, deep, polar water. The shelf in eastern Baffin Bay is shallow (less than 200 m) and is generally a narrow strip (usually less than 80 km wide) along the coast and some banks. Outside the shelf depths reach more than 2,000 m in central parts of the bay /10/. In the two license blocks, the depths vary from c. 150 m in the northwestern area and 2000 m in the southwest corner of the license blocks. The main part of the license blocks are at depths of 400-800 metres.
Figure 5-4 Bathymetry in Baffin Bay and the license blocks

PRELIMINARY ENVIRONMENTAL IMPACT ASSESSMENT
27
5.5.2 Impact Assessment As part of site survey, there will be some removal and relocation of seabed material in connection with grab/boxcorer sampling, trawl, ROV usage and deployment of moorings for oceanographic measuring equipment. This disturbance will be in the surficial sediment layers, and sampling will leave a shallow depression in the seabed. In areas of accumulation, sediments from neighbouring areas and fall-out from the water column will gradually re-fill such sampling marks, though this may take some time. The actual time will depend of the depths of the depressions and is assessed to be medium-term (1-10 years). Based on the very local disturbance, and the medium-term duration, the disturbance is assessed to have no impact on the bathymetry of the area.
Table 5-10 Environmental impacts to bathymetry in connection with the 2013 site survey
Potential project impact
Intensity
of impact
Scale
of impact
Duration
of impact
Overall severity
of impact
Level of confidence
Seabed disturbance
None Local Medium-term No impact High
5.6 Water and sediment quality 5.6.1 Existing conditions
A benthic survey /6/ was done with a drop camera along 11 transects in the northern license block, and further north at depths of 600-750 m. These are the same depths as the planned 2013 site survey. Sediments consisted mainly of fine sand, and a few spread locations of gravel or gravel/sand mixture. Cobble, rubble, boulders, and shells accounted for minor proportions of the observed substrate at most survey sites. In general, information on contaminants in water and marine sediments are only available near local discharge point, e.g. cities, settlements, former mine sites and Thule Airbase. Thus, no local sediment data from the survey sites exist, but in 2008, polycyclic aromatic hydrocarbons (PAH) were analysed in the surface sediment layer (0-1 cm depth) of Baffin Bay /20/. PAH levels were generally low and could be regarded as background levels. The occurrence of contaminants in the marine environment and their potential impacts on biota has been studied in Greenland. Based on studies of contaminants in organisms, as summarized in the SEIA /9/, the overall conclusion was that lead levels in marine organisms from Greenland were low, whereas cadmium, mercury and selenium levels were high. No clear conclusions could be drawn in relation to geographical differences.
5.6.2 Impact assessment Disturbance of seabed in relation to site survey sampling, ROV usage and deployment buoy anchors is expected to cause suspension of fine grained sediments, which subsequently resettle on the seabed. Such short-term, local disturbance is assessed to be of no impact to water and sediment quality. Discharges of grey water and treated black water can lead to increased organic load of the sediments. This can in extreme cases stimulate growth in and changes of benthic faunal assemblages. . However, the release of fine particular material in a stream of freshwater will sink very slowly towards the seabed, and at 600 – 700 m depth, it will be spread over a large area and is not expected to cause any measurable impact on water or sediment.
Table 5-11 Environmental impacts to water and sediment quality in connection with the 2013 site survey
Potential project impact
Intensity
of impact
Scale
of impact
Duration
of impact
Overall severity
of impact
Level of confidence
Suspended sediments
Minor Local Short-term No impact High
Discharges Minor Local Short-term No impact High

PRELIMINARY ENVIRONMENTAL IMPACT ASSESSMENT
28
5.7 Plankton 5.7.1 Existing conditions
As described in the SEIA /9/, total primary production in the arctic is from three sources: phytoplankton, ice algae on the underside of fast or drift ice, and benthic algae. In most of Baffin Bay, there is a brief and intense phytoplankton bloom immediately after ice break-up in spring, with high transient phytoplankton biomass and relatively low total primary production integrated over depth and season. Exceptions are polynyas (which is not previously registered in the license blocks), areas of open water surrounded by ice, some of which are recurring and remaining open throughout the winter. Zooplankton provides the main pathway to transfer energy from phytoplankton to consumers at higher trophic levels, e.g., fish, and thus has a critical role in marine food webs. High latitude zooplankton production follows the extremely strong seasonal pulse of phytoplankton. Numerous taxa are included, but copepods, particularly calanoid copepods, are dominant. Studies carried out near Melville Bay showed that the most dominant copepod species are Calanus hyperboreus, C. glacialis, and C. finmarchicus. Their vertical distribution was linked to food availability, salinity, and temperature. The genus Calanus was most abundant in water with temperatures below <0 °C, whereas other species were most abundant at temperatures >0 °C /9/. Although copepods are typically predominant in Arctic marine systems, there is a broad assemblage of other planktonic groups and their role has yet not fully been understood /9/. The knowledge on plankton is not yet sufficient to designate any important or critical areas within Baffin Bay, except for the north water polynya which is situated in northern Baffin Bay /9/.
5.7.2 Impact assessment Mortality of plankton has been observed at close range (within 5 m) of the source of the seismic shot /9//26/. The impacts of seismic noise are assessed to have no impact given the size of planktonic populations and their high natural mortality rate. Discharges may influence planktonic organisms. The discharges associated with the site survey are minor and assessed to be of no measurable impact to water and sediment quality. It is assessed that there will be no impact to plankton.
Table 5-12 Environmental impacts to plankton in connection with the 2013 site survey
Potential project impact
Intensity
of impact
Scale
of impact
Duration
of impact
Overall severity
of impact
Level of confidence
Seismic noise Minor Local Short-term No impact High
Discharges Minor Local Short-term No impact High
5.8 Benthic flora and fauna 5.8.1 Existing conditions
The knowledge of benthos in Baffin Bay is sparse. Northern Baffin Bay (71-78 °N) was sampled with benthic grab and photography in 2008 /21/. Sampling depths ranged from 0-200 m. In their deepest depth range 150-200 m an average biomass of 175 g wet weight/m2, and a dominance of polychaetes was recorded.

PRELIMINARY ENVIRONMENTAL IMPACT ASSESSMENT
29
Figure 5-5 Typical substrate observed during the Baffin Bay drop camera-mediated borehole benthic habitat survey, September 2011 /6/.
In the license blocks, one benthic survey /6/ was done with a drop camera along 11 transects in the northern part of license block Anu, and further north outside the license blocks at depths of 600-750 m. These are the same depths as the planned 2013 site survey. The benthic fauna found by viewing video from 11 transects, consisted of shrimp (most common), brittle stars, sea stars, sea anemones, sponges and soft corals, and some other animal groups. The poor resolution of the pictures made it difficult to discover traces of infauna on the sediment surface, but it is very likely that burrowing polychaetes, molluscs and echinoderms will dominate the infaunal assemblages. The survey also reported strong bottom currents, which makes it likely that the dominant benthos will be filter feeders. The seemingly self-contradictionary combination of strong currents and soft sediment has previously been reported from locations in the Barents Sea /22/. Single colonies of sponges were discovered in 6 transects in the 2011 survey and no sponge bed aggregations were reported. As observed by Christiansen /25/, sponge beds are present north of Svalbard (78 °N). In case of occurrence of dense sponge beds in the license blocks, further surveying and potential drilling operations should be planned accordingly. Out of 24 different benthic fauna assemblages defined by Thomson /23/ on the Canadian side of Baffin Bay, nine occurred in Central (72 °N, 70 °E) and Northern (75 °N, 78 °E) Baffin Bay at depths of 500 - 1,088 m and on sand and silt substrates or both. A possibility of finding certain species within each assemblage was calculated, and is presented in Table 5-13. It is considered likely that the same species will occur at the same depths and sediment conditions as the license blocks.

PRELIMINARY ENVIRONMENTAL IMPACT ASSESSMENT
30
Table 5-13 Short description of some of assemblages of benthic animals found in Central and Northern Baffin Bay /23/. The name gives an indication of the most common species in the particular assemblage.
Assemblage Sediment Central/Northern Baffin Bay
Abundance Northern/Central Baffin
Bay Anonyx pacificus Amphipod Silt Northern/Central Rare
Ophiura sarsi Brittle star Sand Northern/Central Common
Ctenodiscus Sea star Sand/Silt Northern/Central Common
Praxillura-Golfingia Polychaete -
Sipunculid
Sand/Silt Northern/Central Abundant
Lumbrineris - Acsidia Polychaete - Sea squirt
Sand Northern/Central Rare
Nereis zonata Polychaete Silt Northern/Central Common/Abundant
Aglaophamus - Asychis
Polychaetes Sand/Silt Northern/Central Abundant/Abundant
Samythella Polychaete Sand Northern/Central Abundant
Polyphysia crossa Polychaete Silt Central Abundant
Cold water coral (Lophelia sp.) reefs have been discovered in the Davis Strait south of Baffin Bay. It is considered unlikely that reefs will be found in the license blocks as the water temperatures here (1° C) are below the typical temperature range for cold waters corals (4-12° C) /24/.
5.8.2 Impact assessment This impact assessment is based on the assumption that currents and sediment composition at the survey sites are similar to that found in the 20112 survey /6/. Impacts are summarized in table 6-13. Grab- and boxcorer sampling, ROV usage and deployment of anchors will disturb the seabed by upwhirling. Upwhirled sediments might be carried downstream and fall down on the sea bed elsewhere, where they might resettle and cover epi- and infaunal organisms. Unless the ROV is settled on the seabed and is propelled forward, the amounts of upwhirled sediments will be local and short-term. The impact of resedimentation on benthic fauna is assessed to be negligible. Removal of soft sediments by grab- or box corer sampler will leave a shallow depression in the sea bed. It may take several years before such depressions are refilled by natural sedimentation, but they will fairly quickly be recolonized. Thus impacts on faunal composition and abundance are negligible. The deployment of steel weights as mooring for buoys will crush benthic animals directly hit. Some soft bottom benthos can regenerate body parts, but species that have hard calcareous skeletons, like clams or corals, are sensitive to crushing. The area of impact is quite small (1 m2 per weight) and so the overall impacts of crushing will expectedly be negligible. It is planned to leave the steel weights at the seabed when the buoys are removed. The steel weights represent a permanent hard substrate in what is expected to be a soft bottom benthic community. This will give hard bottom benthos the opportunity to colonize the new substrate, and thus alter the local faunal composition on the spot. Fish, crustaceans and other animals often are attracted to such hard bottom structures in a monotonous soft sediment seabed landscape, where they may find both food and shelter. However, the overall assessment is that leaving the steel weights will have a negligible impact on the seabed fauna. Recolonization of benthic habitats depend on the type of habitat, the growth rate of the fauna, the geographic extent of the impacted area and the presence of a pool of sexually mature individuals to recruit from. In cold waters fauna normally grow very slow and recolonization back to original species/size composition generally takes longer than further south.

PRELIMINARY ENVIRONMENTAL IMPACT ASSESSMENT
31
Discharges of grey water and treated black water can lead to increased organic sedimentation. This can lead to changes of species composition and growth in the benthic fauna as a result of increased food availability. However, the release of fine particular material in a stream of freshwater will sink very slowly towards the seabed, and at 600 – 700 m depth, it will be spread over a large area and is not expected to cause any measurable impact on benthos. Very few studies have been done to determine the impacts of seismic and sonar on sessile an in-faunal benthos. Christian et al. /26/ reported that close range seismic sound emission (2 m range) on snow crab eggs had impacts on larval development and settlement. But as the seismic survey and sonar is performed more than 600 m away from the sea bed, it is assessed that there will be no impact to benthic fauna.
Table 5-14 Environmental impacts to benthic fauna in connection with the 2013 site survey
Potential project impact
Intensity of impact
Scale of impact
Duration of impact
Overall severity
of impact
Level of confidence
Seabed disturbance (upwhirling
/resedimentation)
Minor Local Short-term
Negligible High
Anchoring Minor Local Permanent Negligible High
Discharges -> Increased organic
downfall
Minor Local Short-term
No impact High
Seismic noise - - - No impact High
5.8.3 Mitigating measures Deployment of anchors for buoys at the same place as grab samples/box corer has been taken, ensures a minimum of disturbed area on the seabed. A careful and slow approach of equipment to the seabed also minimizes the amount of sediments being temporarily suspended within the water column.
5.8.4 Residual impacts As the mitigating measures are limited, the residual impacts of the survey activity to benthos are considered the same as the impacts expected before considering any mitigating measures.
5.9 Fish and shellfish 5.9.1 Existing conditions
The fish fauna of Baffin Bay is not well known, and limited specific knowledge from the actual survey area is available. The fish and shellfish fauna of Baffin Bay include populations of several species. According to Jørgensen /27/, at depths below app. 500 m, the Greenland halibut is the dominant species, while species like lumpfish, spotted wolffish, polar cod, capelin, greenland cod, atlantic cod, northern shrimp, snow crab and several species of sculpins, skates and rays also occur in the area. The key species are described below based on the SEIA /9/, the 2012 EIA /6/, and references therein. The Greenland halibut (Reinhardtius hippoglossoides) is a circumpolar deep-water, semi-pelagic flatfish that inhabits depths of ~400–2,000 m. It spends most of its life on the bottom, but moves into the water column to feed. Off west Greenland, the Greenland halibut spawn at depths >1,000 m south of 67 °N. The eggs and larvae drift northward and the larvae subsequently settle in the shallower waters of the banks. In the Northwest Atlantic, the lumpfish (Cyclopterus lumpus) is distributed from Greenland south to Chesapeake Bay. Lumpfish spend most of the year in deep, offshore waters, but in spring and early summer, typically May–June, they seek shallow coastal waters to spawn. The eggs are attached to the substrate at shallow waters, and the female migrate back to deeper

PRELIMINARY ENVIRONMENTAL IMPACT ASSESSMENT
32
water immediately after spawning, leaving the male to guard the clumps of eggs for 6 – 8 weeks. The northern distribution limit of lumpfish in Baffin Bay is at 72–75°N. The spotted wolffish (Anarhichas minor) occurs in the Arctic Ocean and on both sides of the North Atlantic from Labrador to the Barents Sea. Off West Greenland, it is found as far north as Upernavik and sporadically to Thule. It is found offshore in cold, deep water, usually <5°C at 50–800 m depths. Wolffish prefer coarse sand and sand/shell bottom with rocky areas nearby for shelter and spawning. The species does not form large schools and migrations are local and limited. The polar cod (Boreogadus saida), known elsewhere as arctic cod, is a pelagic or semi-pelagic species with a circumpolar arctic distribution. It can form large aggregations, often deep in the water column or near the bottom on the shelf. It also occurs in coastal waters and is often associated with sea ice, in crevices and holes in the ice. Polar cod spawn large buoyant eggs in ice-covered waters in November–February, and the eggs incubate under the ice until larvae hatch in late spring when the ice starts to melt. The polar cod is an important forage species in the arctic marine food web as a key prey for many marine mammals and seabird species. The capelin (Mallotus villosus) is a small, pelagic, schooling fish. It is a cold-water species that occurs widely in the northern Hemisphere. In the Disko Bay area, capelins spawn in huge numbers in spring in the subtidal zone along beaches and low rocky coasts. Capelin occur only in the southernmost part of the Baffin Bay, with an approximate northern distribution limit at 72–75°N. Greenland cod (uvak, Gadus ogac) and Atlantic cod (Gadus morhua) are both found in coastal and open waters of Baffin Bay. The Greenland cod is a coastal/shallow water stationary species of limited commercial value, while the Atlantic cod historically has been an important fishery resource to Greenland. After two decades of virtual absence from west Greenland waters, the Atlantic cod stock during the latest years has reappeared in both coastal and offshore waters off west Greenland. However, the species hardly ranges as far north as the survey area. The northern shrimp (Pandalus borealis) occurs all along the on the West Greenland continental shelf from Cape Farewell to ~74°N. It typically occurs in waters 100–600 m deep, mainly on the outer slopes and banks. Although northern shrimp are considered bottom dwellers, they migrate vertically at night and sometimes during the day to feed on the small planktonic organisms in the upper water column. The shrimp larvae are planktonic for 3–4 months, drifting passively with the currents. Shrimp larvae are generally more abundant in waters <200 m deep. Important areas for shrimp larval development are the slopes of the banks, on the banks, and the shelf break. By the end of their first year, most northern shrimp have settled to the seafloor as juveniles. The snow crab (Chionoecetes opilio) occurs over a broad depth range in the northwest Atlantic from Greenland south to the Gulf of Maine. Snow crabs are patchily distributed along the west coast of Greenland in coastal areas and fjords, typically at 180–400 m depths /10/. Large males are most common on mud or mud/sand, whereas smaller crabs are common on harder substrates. The snow crab life cycle include larval hatching in the spring, followed by a 12–15 week planktonic period during which the larvae develop through various stages before settling to the sea bottom. Benthic juveniles of both sexes moult frequently. At ~4 years of age, they become sexually mature. Iceland scallops (Chlamys islandica) are generally found inshore and on banks at 20–60 m depths where current velocity is relatively high /10/. The West Greenland populations are generally found in coastal areas. The Iceland scallop lives on the surface of hard substrates, rarely on soft, muddy bottoms. In West Greenland, the largest aggregations are found in the Nuuk area, where most of the direct fishery has taken place. In offshore areas there are only low concentrations of generally small scallops and large quantities of empty scallop shells, suggesting that offshore populations were once more abundant than they are currently.

PRELIMINARY ENVIRONMENTAL IMPACT ASSESSMENT
33
5.9.2 Impact assessment Potential impacts to fish are assessed in this section, based on the potential project impacts summarized in section 5.2. Please note that potential impacts to fisheries are assessed in section 5.13. Noise from site survey has been assessed based on the modelled sound levels and criteria for behavioural and physiological response to underwater noise. There is little information available on the hearing abilities of species of particular relevance for the license blocks; Atlantic cod and Atlantic herring therefore serve as models for other fish species. The upper cut-off frequency of hearing in herring is expected to be the maximum upper cut-off frequency for all fish in the area. Impacts to fish pertain to physical damage and behavioural changes. Fish behaviour in response to noise is not well understood. Sound pressure levels that may deter some species, may attract others. Physical damages to the hearing apparatus lead to permanent changes in the detection threshold (permanent threshold shift, PTS). This can be caused by the destruction of sensory cells in the inner ear, or by metabolic exhaustion of sensory cells, support cells or even auditory nerve cells. Hearing loss is usually only temporary (temporary threshold shift, TTS) and the fish will regain its original detection abilities after a recovery period. For PTS and TTS the sound intensity is an important factor for the degree of hearing loss, as is the frequency, the exposure duration, and the length of the recovery time. Fish are highly sensitive to the particle motion of the sound field, and species with no airfilled cavities, such as a swim bladder, cannot detect pressure /28/. Regardless of the presence of air-filled structures, the adequate stimulus for the fish auditory system at frequencies below 100 Hz is particle motion /28/. At higher frequencies the sound pressure impinging on a swim bladder causes it to vibrate, thereby supplying an increase in particle motion stimulating the inner ear. For fish with swim bladder the sound pressure therefore becomes the dominant stimulus. Fish with swim bladders therefore have increased hearing sensitivity at higher frequencies /29/. The Atlantic cod possesses a swim-bladder but has no special coupling between the swim-bladder and the inner ear. In the Atlantic herring the swim-bladder extends to the inner ear, where it is directly connected /30/. Particle motion measurements of noise sources are rarely made and have not been available for this report. Pressure measurements are therefore used when discussing the impact on fish. The hearing of Atlantic herring has been investigated by Enger /31/, and the hearing of Atlantic cod by several authors /32//33/. The audiograms of these species are shown in Figure 5-6. The thresholds of the audiograms are given in units of sound pressure. Cod can hear up to about 400 Hz, whereas herring can hear up to a few kHz.
Figure 5-6 Audiogram of Atlantic cod (Gadus morhus) and Atlantic herring (Clupea harengus) modified from /30//31//32//33/.
101 102 103 10460
70
80
90
100
110
120
130
140
Frequency (Hz)
dB re
1 µ
Pa
Gadus morhua 1Gadus morhua 2Gadus morhua 3Clupea harengus
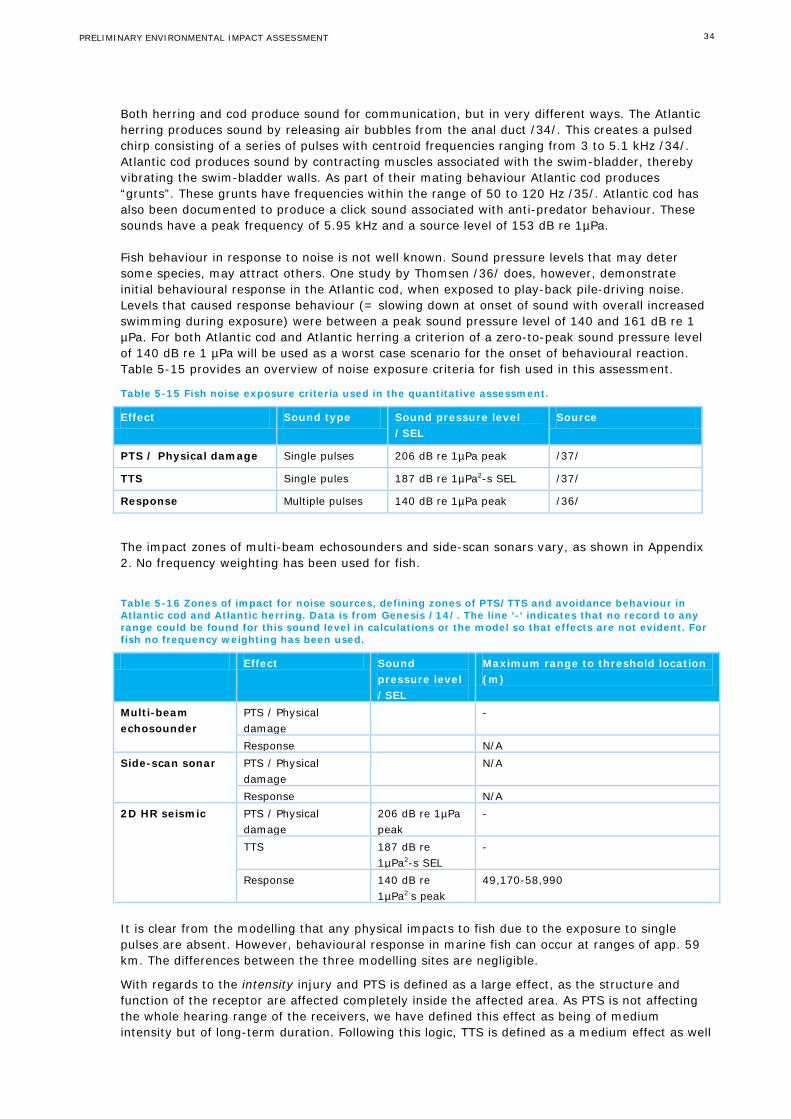
PRELIMINARY ENVIRONMENTAL IMPACT ASSESSMENT
34
Both herring and cod produce sound for communication, but in very different ways. The Atlantic herring produces sound by releasing air bubbles from the anal duct /34/. This creates a pulsed chirp consisting of a series of pulses with centroid frequencies ranging from 3 to 5.1 kHz /34/. Atlantic cod produces sound by contracting muscles associated with the swim-bladder, thereby vibrating the swim-bladder walls. As part of their mating behaviour Atlantic cod produces “grunts”. These grunts have frequencies within the range of 50 to 120 Hz /35/. Atlantic cod has also been documented to produce a click sound associated with anti-predator behaviour. These sounds have a peak frequency of 5.95 kHz and a source level of 153 dB re 1µPa. Fish behaviour in response to noise is not well known. Sound pressure levels that may deter some species, may attract others. One study by Thomsen /36/ does, however, demonstrate initial behavioural response in the Atlantic cod, when exposed to play-back pile-driving noise. Levels that caused response behaviour (= slowing down at onset of sound with overall increased swimming during exposure) were between a peak sound pressure level of 140 and 161 dB re 1 µPa. For both Atlantic cod and Atlantic herring a criterion of a zero-to-peak sound pressure level of 140 dB re 1 µPa will be used as a worst case scenario for the onset of behavioural reaction. Table 5-15 provides an overview of noise exposure criteria for fish used in this assessment.
Table 5-15 Fish noise exposure criteria used in the quantitative assessment.
Effect Sound type Sound pressure level /SEL
Source
PTS / Physical damage Single pulses 206 dB re 1µPa peak /37/
TTS Single pules 187 dB re 1µPa2-s SEL /37/
Response Multiple pulses 140 dB re 1µPa peak /36/
The impact zones of multi-beam echosounders and side-scan sonars vary, as shown in Appendix 2. No frequency weighting has been used for fish.
Table 5-16 Zones of impact for noise sources, defining zones of PTS/TTS and avoidance behaviour in Atlantic cod and Atlantic herring. Data is from Genesis /14/. The line ‘-‘ indicates that no record to any range could be found for this sound level in calculations or the model so that effects are not evident. For fish no frequency weighting has been used.
Effect Sound pressure level /SEL
Maximum range to threshold location (m)
Multi-beam echosounder
PTS / Physical damage
-
Response N/A Side-scan sonar PTS / Physical
damage N/A
Response N/A 2D HR seismic PTS / Physical
damage 206 dB re 1µPa peak
-
TTS 187 dB re 1µPa2-s SEL
-
Response 140 dB re 1µPa2·s peak
49,170-58,990
It is clear from the modelling that any physical impacts to fish due to the exposure to single pulses are absent. However, behavioural response in marine fish can occur at ranges of app. 59 km. The differences between the three modelling sites are negligible.
With regards to the intensity injury and PTS is defined as a large effect, as the structure and function of the receptor are affected completely inside the affected area. As PTS is not affecting the whole hearing range of the receivers, we have defined this effect as being of medium intensity but of long-term duration. Following this logic, TTS is defined as a medium effect as well

PRELIMINARY ENVIRONMENTAL IMPACT ASSESSMENT
35
but as it is reversible, it is one of short term duration. Behavioural responses can range from medium to minor, depending on the number of species affected. The assessment of the different sound levels from all activities on fish species clearly indicates that echosounders and side scan sonar will only lead to minor or moderate impacts. For the 2D seismic surveys TTS can only occur very close to the source (<10 metres). The 2D seismic survey could also lead to avoidance, with behavioural impacts on fish assessed to potentially occur at a distance of 59 km from the source.In any case, the survey will be of only comparably short duration so that effects will be immediate and not of any longer duration. Overall, it can be concluded that the site survey planned for the summer of 2013 will have only moderate noise impacts on the biological environment in Baffin Bay. Presence of the vessels may pose a potential impact, as noise from vessel engine and propellers may disturb fish. Also the passage of ships through ice infested waters may cause impacts to fish. The overturning of ice-floes has been seen to expose polar cod, living in crevices and hollows in the ice, for predation by gulls and other seabirds following the vessel. The extent of this type of impact is however expected to be negligible, as the survey will take place during the expectedly ice-free period. Physical disturbance of seabed is assessed to have no impact on water and sediment quality. Except from the potential retrieval of individual specimens as part of the samples collected by the box-corer, no impacts to fish assemblages is foreseen. Discharges of organic waste may potentially attract scavenging fish, but no measurable fish aggregations are expected in the license blocks. Temperature increase due to release of wastewater has limited extent and duration and will not cause any influence on marine fish.
Table 5-17 Environmental impacts to fish in connection with the 2013 site survey
Potential project impact Intensity
of impact
Scale
of impact
Duration
of impact
Overall severity
of impact
Level of confidence
Noise (seismic) TTS
Medium Local Short term Minor Medium
Noise (seismic) Response
Minor Regional Immediate Moderate High
Presence of vessels High Local Short-term
Minor Medium
Disturbance of the seabed
Low Local Short-term
No impact High
Planned discharges Low
Local Short-term
No impact High
5.9.3 Mitigating measures
The proposed site survey in Baffin Bay is constrained to the open-water season. Choosing any other time of the year for doing the survey than the time window planned is not an option. Mitigating measures are related to number of fixed stations deployed, location and general duration of investigations.
5.9.4 Residual impacts As the need for and the possibilities to enforce mitigating measures are limited, the residual impacts of the survey activity to fish is considered the same as the impacts expected before considering any mitigating measures.
5.10 Marine mammals 5.10.1 Existing conditions
Marine mammals represent key species in the ecosystem of Baffin Bay in Western Greenland. No resident populations are present in the license areas, which are used by migrating species of marine mammals. Six key species of marine mammals are assessed to potentially occur in the

PRELIMINARY ENVIRONMENTAL IMPACT ASSESSMENT
36
license blocks; Bowhead whale, Beluga whale, Narwhal, Harbour seal, Ringed seal and Walrus. Pilot whale, hooded seal, sperm whale and minke whale may also be present. These are detailed below, along with the polar bear, with reference to the SEIA for further information /9/. Other occurring species are mentioned briefly and summarized in table 1. Since most species are migratory and have a wide range of distribution, detailed information on presence/absence and seasonality are provided based on the best available information. During survey activities undertaken in 2011 /75/, marine mammal sightings were recorded for a survey in a larger study area comprising the two license blocks. The results of the survey are presented in Figure 5-7. During the survey, MMSO’s observed one unidentified baleen whale, which was observed in the southern license block. In the study area, 16 harp seal sightings (19 individuals), seven ringed seal sightings (9 individuals), and 15 unidentified seal sightings (20 individuals) were observed throughout the study area. Outside the study area, during transit to and from the study area and Nuuk, four minke whales and 78 seals were observed. No other marine mammals (incl. polar bears) were observed at any time during the survey.
Figure 5-7 Distribution of marine mammal sightings in and around a study area during the August–September 2011. Figure derived from /75/. The license blocks relevant to this EIA are highlighted in green.

PRELIMINARY ENVIRONMENTAL IMPACT ASSESSMENT
37
During survey activities in 2012, marine mammal sightings were undertaken for a survey in Baffin Bay (including the two license blocks). The survey included seven vessels, and preliminary results include both Baffin Bay as well as transit from Newfoundland, Nuuk and Upernavik. Preliminary results (unpublished, results provided by Shell) of the 2012 MMSO activities in Baffin Bay show that the sightings included numerous seals, primarily harp, ringed and hooded seals, but also bearded and harbour seals. Most whales were observed during transit to and from the survey area, with sightings of sperm whale, minke whale and sei whale within the license blocks. In addition, a single polar bear was spotted within the two license blocks.
Table 5-18 Preliminary results of the MMSO activities during 2012 survey
Species All observations In license blocks
No. of animals
No. of observations
No. of animals
No. of observations
Harp Seal 1404 556 907 451
Unidentified seal 230 205 191 170
Long-finned pilot whale
167 14 56 3
Ringed seal 119 117 109 107
Hooded Seal 89 86 78 77
White-beaked dolphin 26 7 4 1
Sperm whale 20 15 16 13
Humpback whale 18 4
Fin whale 17 14 3 2
Minke whale 15 12 3 3
Bearded seal 14 13 13 12
Sei Whale 14 5
Large whale 12 12 3 3
Harbour porpoise 9 4
Unidentified whale 8 5
Fin/Sei whale 5 2
Bottlenose Whale 4 2 1 1
Harbour seal 2 1 2 1
Hooded/bearded seal 1 1 1 1
Polar bear 1 1 1 1
Grand Total 2175 1076 1388 846
5.10.1.1 Whales In the license blocks, the sea ice cover throughout the spring months represents a constraint to the presence of these animals, which will only reach such locations once the ice retreats /9/. The narwhal and beluga whale are specialised inhabitants of the Arctic and can be found in Baffin Bay year round /9/. Other species are generally only present in the area during ice-free periods of the summer. The narwhal (Monodon monoceros) has very specific habitat requirements, ranging between 70 oN and 80 oN throughout Arctic and North Atlantic waters. Populations from Canada and West Greenland have high site fidelity to the winter pack ice of Davis Strait and Baffin Bay in regions along the continental slope.

PRELIMINARY ENVIRONMENTAL IMPACT ASSESSMENT
38
Two narwhal populations are found near the license blocks during summer, one in Melville Bay and another in Inglefield Bredning further north. However, only the Melville Bay population is found in the license blocks, and they are found in the northeast corner of the area during summer. Migration through the license blocks appears to follow the 1,000-m contour southward. Narwhals from the Canadian High Arctic can migrate through the License blocks as early as late September–early October, and narwhals from Melville Bay migrate south from mid-October to mid-December, depending on the year /6/. Narwhal feed primarily on Greenland halibut, together with other fish, squid and shrimp - mainly in the winter at deep water and possibly at or near the bottom /40/. Narwhals breed only once every 3 years between March and May with calves being born during the following summer. Protection zones for narwhal are described in section 5.11. The beluga whale (Delphinapterus leucas) is distributed throughout arctic and sub-arctic waters /41/. During the winter months, belugas congregate around areas of loose ice, feeding from the polynyas. They inhabit coastal waters, estuaries, shelf breaks, and deep basins during the summer months. In 2006 the abundance of belugas in West Greenland was estimated to 10,595 individuals, and concentrations of whales were mostly located in Disko Bay on the northern shore of Store Hellefisk Bank as well as along the eastern edge of the pack ice covering Baffin Bay and Davis Strait /6/. Approximately 30% of the Eastern Canadian high Arctic/Baffin Bay Beluga stock migrates to West Greenland for overwintering /39/. Belugas that occur in and near the license blocks during part of the year are found in Lancaster Sound, Barrow Strait, Peel Sound, and Baffin Bay during the ice-free period /9/. Migration routes are primarily along the coast and through near shore waters, so few whales are expected in the license blocks at any time of year except perhaps in April–June, during the spring migration, when some animals travel through loose pack ice in offshore areas /6/. Belugas acquire most of their annual food during the winter, which makes them particularly sensitive during this time of the year. They feed on polar cod and other fish but also squid and shrimps. Mating season is mainly between late February to early April, with calves being born between May and July in latitudes after a gestation period of over a year /9/. During the winter bowhead whales (Balaena mysticetus) are observed in areas near the ice edge and in areas of unconsolidated pack ice. In the Baffin Bay-Davis Strait, bowhead whales move out of the summering areas as the ice forms during autumn towards the open water near the ice edge off West Greenland and eastern Baffin Island /42/. Bowhead whales seasonally use the eastern parts of Baffin Bay for feeding and undertake migrations /9/. Although this species feeds mostly during the winter months at particular feeding grounds, it may also feed opportunistically during the spring migration. Their diet is based on crustacean zooplankton (copepods), epibenthic organisms, and some benthic organisms. Mating usually occurs during late winter and early spring. Soon after the calves are born (between April and June, but mostly in May), spring migration takes place.

PRELIMINARY ENVIRONMENTAL IMPACT ASSESSMENT
39
Figure 5-8 Seasonal home range distributions of bowhead whales in 2009. Adapted from 2012 EIA /6/.
Other whales may also be encountered in Baffin Bay. Minke whales (Balaenoptera acutorostrata) are common within Baffin Bay, but there is no knowledge on specific, important areas for this species within West Greenland. Sei whales (Balaenoptera borealis), fin whales (Balaenoptera physalus), humpback whales (Megaptera novaegliae) and blue whales (Balaenoptera musculus) can also occur in the south of Baffin Bay from June to November. Pilot whale (Globicephala melas), white-beaked dolphin (Lagenorhynchus albirostris) and bottlenose whale (Hyperodon ampullatus) may also occur /9/. Killer whales (Orcinus orca) could be encountered occasionally in the license blocks, mainly during the summer /6/.
5.10.1.2 Walrus and seals The walrus and several species of seals occur in the Baffin Bay. Ringed seals and bearded seals are residents and more or less dependent on the sea ice , while harp seals and hooded seals are migrants and are present only when there is open water /9/. Walruses (Odobenus rosmarus) breed in the Arctic pack ice during winter. Often walruses haul out on land or ice floes in groups of up to several thousand individuals. Five of the presumed eight sub-populations of Atlantic walrus are in Western and three are in Eastern Greenland. Walrus generally have an affinity for shallow water areas where they feed on a variety of benthic invertebrates, although they occasionally make dives to maximum 200–250 m depth, which makes most of the license blocks too deep for this species. However, a limited number of walruses spend the winter in leads and cracks between the land-fast ice and the moving pack ice in the license blocks. Moreover, there seems to be an unknown number of walruses that use this location as a migration corridor during spring and perhaps also autumn /9/. A protection zone for walrus is are found north of the license blocks, see section 5.11. Protection period in the walrus protection zone is from 1 Oct. to 31 May. The ringed seal (Pusa hispida) is the most common seal in the Arctic and is abundant in Baffin Bay. The ringed seal use sea ice exclusively as their breeding, moulting and resting habitat, rarely, if ever, coming onto land. Average densities of ringed seals on fast ice as well as on consolidated pack ice in the Baffin Bay area vary between 1.3–2 seals/km2 in June. This density range can probably be applied to a large part of Baffin Bay /9/.

PRELIMINARY ENVIRONMENTAL IMPACT ASSESSMENT
40
Females give birth in the spring (March to May). Moulting occurs from mid-May to mid-July. Then, the animals spend a considerable amount of time hauled out on ice at the edge of the permanent pack ice, or on remnant land-fast ice along coastlines. During this period, feeding activity is at its minimum. Outside the breeding and moulting seasons, this species is distributed in waters of nearly any depth. Ringed seals prey on small animals, and preferred prey tends to be schooling fish species, mainly polar cod. The bearded seal (Erignathus barbatus) is a large seal, usually associated with the sea ice and is considered resident in Baffin Bay. They feed on fish and benthic invertebrates found in waters down to 100 m depth. Bearded seals make breathing holes where the ice stays relatively thin and they either winter in reoccurring leads and polynyas or they follow the pulse of the expanding and shrinking sea ice. Birth takes place in April–May on drifting ice or near ice edges with access to open water. Bearded seals are present throughout the Baffin where suitable habitats are available, and no particular important areas for the species are known /9/. The harp seal (Pagophylus groenlandicus) is present in the license blocks from late-June to November. Harp seals are caught in large numbers in the coastal area near the license blocks, particularly in the late summer and autumn months. Their offshore prey is unknown, but amphipods are likely to be important. Around 10 % of the population of the seals from the West Atlantic population (estimated at about 6 million individuals) spend the summer and autumn foraging in Davis Strait and Baffin Bay /9/. Hooded seal (Cystophora cristata) is a large migratory seal that does not breed in East Baffin Bay. It occurs late in the open-water season (July to October) and usually in offshore waters. It is a deep diver, feeding regularly below 500 m. The adult seals migrate to Davis Strait and Baffin Bay during the end of July /9/.
5.10.1.3 Polar bear The polar bear (Ursus maritimus) relies almost entirely on the marine sea ice environment throughout their life cycle, and are known to travel great distances through the Arctic region generally on drifting oceanic ice floes, in search of food. Polar bears spend over 50 % of their time hunting for food, and their diet mainly consists of ringed and bearded seals /40/. Breeding occurs in March to May, and birth is generally thought to occur from late November to mid-January /38/. Baffin Bay is an important polar bear habitat during autumn, winter and spring. When the central Baffin Bay field of consolidated pack ice disappears during spring and summer the polar bears either use eastern Baffin Island or the Melville Bay area as a summer retreat /9/.

PRELIMINARY ENVIRONMENTAL IMPACT ASSESSMENT
41
Figure 5-9 Polar bear Kernel home range (July to September). Adapted from Perry et al. (2011)
5.10.1.4 Overview of marine mammals
Table 5-19 provides an overview of marine mammals occurring in Baffin Bay, their main habitat and their red list status.
Table 5-19 Overview of marine mammals occurring in the strategic assessment area, their conservation status and hunting status (adapted from /9/).*LC=Least concern, DD=data deficiency, NT=not threatened, VU=vulnerable, ENCR=critically endangeres.
Period of occurrence
in Baffin Bay
Main Habitat Biological activity
Greenland Red List status*
Distribution in the Baffin Bay SEIA
area
Baleen Whales
Minke Whale (Balaenoptera acutorostrata)
April-November
Coastal waters and banks
Feeding only. Winter
breeding grounds are
unknown
LC Common in south
Fin Whale (Balaenopetara physalus)
June-October
Edge of banks and coastal waters
Feeding only LC Occasionally in south
Blue Whale (Balaenoptera musculus)
July-October
Edge of banks Feeding only DD Occasionally in south

PRELIMINARY ENVIRONMENTAL IMPACT ASSESSMENT
42
Humpback Whale (Megaptera novaeangliae)
June-November
Edge of banks and coastal waters
Feeding only LC
Abundant in south
Sei Whale (Balaenoptera borealis)
June-October
Offshore Uncertain DD Occasionally in south
Bowhead whale (Balaena mysticetus)
February-June
Pack ice and marginal ice zone
Feeding NT Locally abundant migrant and winter
visitor Toothed whales
Narwhal (Monodon monoceros)
Whole year (mostly in summer and mid-seasons)
Winter: Edge of banks, deep water. Summer: Fjords, coastal waters.
Migrants along 1000 m contour
Feeding November-
March. Breeding
March-May. Calfs are born in Summer/Fall
CR
Abundant summer and winter as a
migrant
Beluga whale (Delphinapterus leucas)
October-November, April-June
Banks Feeding November-
March. Breeding
February-late April. Calfs are born May-July
CR
Abundant migrant
Killer whale (Orcinus orca)
June-August
Ubiquitous Feeding. Breeding in Summer.
NA Occasional
Long-finned pilot whale (Globicephala melas)
June-August
Deep waters Feeding. Breeding in Summer.
LC
Occasional in south
White-beaked dolphin (Lagenorhynchus albirostris)
Summer Shelf waters Feeding. Lack of breeding
data
NA
Occasional in south
Sperm Whale (Physeter macrocephalus)
May-November
Deep waters Feeding only NA Unknown
Harbour porpoise (Phocoena phocoena)
April-November
Coastal waters Feeding only DD
Only in south
Northern bottelnose whale (Hyperodon ampullatus)
Summer Deep waters Feeding only NA/DD
Unknown
Walrus and seals
Walrus (Odobenus rosmarus)
Whole year Polynyas, mariginal ice zone, shallow
water
Feeding. Breeding in winter. Pups
are born mid-April to mid-
June
ENCR
Migrants from adjacent areas
Ringed Seal (Pusa hispida)
Whole year Waters with ice Feeding. Breeding in
late April-early May. Pups are born March-
May
LC
Common and widespread

PRELIMINARY ENVIRONMENTAL IMPACT ASSESSMENT
43
Hooded Seal (Cystophora cristata)
June-October
Mainly deep waters Feeding only LC Common and widespread
Bearded Seal (Erignathus barbatus)
Whole year Waters with ice Feeding. Pups are born mid-March to mid-
April
DD
Numerous
Harp Seal (Pagophilus groenlandicus)
June-October
Whole area Feeding only LC Widespread and abundant
Carnivores
Polar Bear (Ursus maritimus)
Whole year Drift ice and ice edges Breeding in March-May. Birth in late November - mid January
VU Common, mainly with ice
5.10.2 Impact assessment
Potential project impacts are detailed in section 5.2. Of relevance to marine mammals are the potential project impacts noise, light and physical disturbance. Each potential project impact is assessed in relation to marine mammals, with focus on focal species of mammals in the area; bowhead whale, beluga whale, narwhal, harbour seal, ringed seal, walrus and polar bear. Similar impacts are expected for other marine mammal species. Noise from seismic activities is considered the main potential impact to marine mammals. Marine mammals are sensitive to the pressure component of a sound field. Species-specific information on sensitivity is presented below, followed by an impact assessment. Generally, the effect of noise on marine mammals can be divided into four broad categories that largely depend on the individual’s proximity to the sound source:
• Detection • Masking • Behavioural changes • Physical damages
It is important to note that the limits of each zone of impact are not sharp, and that there is a large overlap between the different zones. Behavioural changes, masking and detection also critically depend on the background noise level and all impacts depend on the age, sex and general physiological and behavioural states of the animals /60/. Detection ranges depend on background noise levels which are unknown in this case. They are of great importance when discussing masking effects, but masking is not a directly relevant issue for pulsed sounds such as those used in the site survey /15/. This impact assessment is therefore restricted to physical damages and behavioural changes.
Physical damages to the hearing apparatus lead to permanent changes in the animals’ detection threshold (permanent threshold shift, PTS). This can be caused by the destruction of sensory cells in the inner ear, or by metabolic exhaustion of sensory cells, support cells or even auditory nerve cells. Hearing loss is usually only temporary (temporary threshold shift, TTS) and the animal will regain its original detection abilities after a recovery period, but in prolonged exposures, where the ear is exposed to TTS inducing sound pressure levels before it has had time to recover, TTS may build, and a TTS of 50 dB or more will often result in permanent damage /62/. For PTS and TTS the sound intensity is an important factor for the degree of hearing loss, as is the frequency, the exposure duration, and the length of the recovery time. Changes in behaviour are inherently difficult to evaluate. They range from very strong reactions, such as panic or flight, to more moderate reactions where the animal may orient itself towards the sound or move slowly away. However, the animals’ reaction may vary greatly depending on season, behavioural state, age, sex, as well as the intensity, frequency and time structure of the

PRELIMINARY ENVIRONMENTAL IMPACT ASSESSMENT
44
sound causing behavioural changes. According to Miller et al. /92/ (also see Southall /60/) exposures to sound pressure levels between 130 dB re 1 µPa and 150 dB re 1µPa from airgun array pulses induced behavioural reactions in wild beluga whales. Yet, not all individuals showed a reaction with no apparent changes in behaviour at received levels of well above 150 dB re 1µPa (see Miller et al. /92/). The EIA for the 2012 3D seismic survey /6/) used an exposure criterion of a sound pressure level of 150 dB re 1 µPa for behavioural impacts. Recent research on impulsive pile driving sounds /90//91/ and airgun pulses /89/ indicates that the harbour porpoise - a species particularly sensitive to acoustic disturbance – exhibit avoidance behaviour at received sound exposure levels of around 140 dB re 1 µPa2·s. This criterion will be used for all three species of cetacean for the 2D seismic surveys. Since for the echosunders and sidescan sonars, only sound pressure levels were available, we used a received sound d pressure level of 140 dB re 1 µPa as the criteria for behavioural reaction for these sources following a precautionary approach. Avoidance behaviour in ringed seals and bearded seals is induced at exposure levels exceeding sound pressure levels of 190 dB re 1µPa /60/. This criterion is also assumed for walruses. Beluga whales and narwhals both use echolocation to navigate and forage. They emit broadband echo-location clicks of very short duration /46/. Beluga whale clicks are centred around 100-115 kHz and have peak-to-peak source levels up to 225 dB re 1µPa /46/. Narwhal clicks have peak frequency at 20 and 40 kHz, and the maximal peak-to-peak source level measured is 218 dB re 1µPa /47/. The hearing sensitivity has been investigated in the beluga whale both behaviourally and using ABR (latest by Finneran et al /48/) and the audiogram is presented in Figure 5-10. An audiogram shows the hearing sensitivity with frequency on the x-axis and sound level on the y-axis. In general, audiograms have a U – shape with the areas of best sensitivity at the lowest values. Hearing in the narwhal has not yet been investigated, but in the following it is assumed to be comparable to that of a beluga whale. Beluga whale hearing becomes increasingly directional with higher frequencies. This increase in hearing directionality at the frequencies relevant for echo-location improves their echo-location capabilities by making them less susceptible to background noise and clutter echoes (i.e. returning echoes from other objects than the intended target) /49/. Directional hearing at higher frequencies is also expected for narwhals, as it has been demonstrated in other echo-location toothed whales as well /50/. Beluga whales and narwhals both use a variety of different sounds for communication. They use clicks, but also sound with significantly lower frequencies known as whistles and pulsed calls. Beluga whale communication sounds range from 260 Hz to 20 kHz, but with dominant frequencies from 1 to 8.3 kHz /11//51/. Narwhal communication sounds are lower in frequency ranging from 400 Hz to 14.5 kHz /52/. Lowering the frequency content causes the sound to be emitted more omnidirectionally which could be advantageous when communicating in a group.

PRELIMINARY ENVIRONMENTAL IMPACT ASSESSMENT
45
Figure 5-10 Audiogram of four beluga whales. Beethoven and Turner are modified from Ridgway et al. 2001. MUK and NOK are modified from /48/.
The hearing in baleen whales requires further investigation. However, anatomical studies of the inner ear in the northern right whale (Eubalaena glacialis), a close relative of the bowhead whale, suggest that this species has a hearing range from 10 Hz to 22 kHz /53/. This study is the only study to directly infer the complete hearing range of any baleen whale. Baleen whales are known to produce low frequency, high intensity calls for communication. Bowhead whales produce songs as well as calls, with a total frequency range for both types of sound being between 25 Hz and 2.6 kHz /54/.
Pinnipeds, such as walruses, bearded seals and ringed seals, are amphibious animals, and their hearing has evolved to function in both air and water, two acoustically very different media. The underwater hearing sensitivity of a male walrus can be seen in Figure 5-11. The hearing sensitivity has only been studied in a few species of pinnipeds. Studies of hearing thresholds for ringed seals and bearded seals are currently underway. However, the underwater hearing sensitivity of the harbour seal has been studied extensively (Figure 5-11) /56//57//58/ and will serve as a model for the underwater hearing sensitivity of ringed and bearded seals. The hearing thresholds of harbour seals are generally recommended to be used as a conservative estimate of the hearing thresholds for species where the hearing has not been investigated /60/. Pinnipeds produce a wide range of communication calls both over and underwater. Underwater calls are mainly associated with courtship behaviour and territoriality and are often produced by males /59/. Walruses produce underwater sounds with frequencies mainly below 1-2 kHz and may contain significant energy even at 10 Hz /11/. Bearded seals produce a variety of mating sounds with frequencies ranging from 200 Hz to 22 kHz /59/, and ringed seals produce sounds with frequency contents between 400 Hz and 16 kHz /11/.
102 103 104 105 10640
60
80
100
120
140
160
180
Frequency (Hz)
dB re
1µP
a
MUKNOKTurnerBeethoven

PRELIMINARY ENVIRONMENTAL IMPACT ASSESSMENT
46
Figure 5-11 Audiogram of harbour seal and walrus. Harbour seal (Phoca vitulina 1-3) are modified from /56//57//58/. Walrus (Odobenus rosamrus is modified from Kastelein /55/.
For the quantitative assessment of impact ranges for behaviour and injury, criteria for marine mammals have been derived from a variety of sources (see /61//60/). The NMFS criteria /61/ are part of the US regulation (except, to our knowledge, the behaviour criteria). The NMFS criteria are based on the assumption that received levels that are lower than these criteria will not injure animals or impair their hearing abilities but higher received levels may have some effects. We have interpreted these criteria as the onset of TTS also noting the relatively low thresholds. Applicable are also the initial scientific recommendations on marine mammal noise exposure criteria as developed by a group of US experts /60/.
PTS has not been measured in any cetaceans, but Southall /60/ proposes peak sound pressure levels of 230 dB re 1µPa and SEL levels of 198 dB re: 1 μPa2-s (Mlf) as criteria both for single and multiple pulses. A study by Finneran /63/ measured TTS in a beluga whale when exposed to a single sound pulse from a seismic watergun. The TTS limit was at a peak-to-peak sound pressure level of 226 dB re 1 µPa (recovery to within 2 dB of the original hearing sensitivity after 4 min). A similar criterion for PTS and TTS will be assumed for narwhals and bowhead whales. Table 5-20 provides an overview of noise exposure criteria for marine mammals used in this assessment. Studies of hearing thresholds for ringed seals and bearded seals are currently underway. However, the underwater hearing sensitivity of the harbour seal has been studied extensively and served as a model for the underwater hearing sensitivity of ringed and bearded seals.
101 102 103 104 105 10650
60
70
80
90
100
110
120
130
Frequency (Hz)
dB re
1 µ
Pa
Phoca vitulina 1 Phoca vitulina 2 Phoca vitulina 3Odobenus rosmarus

PRELIMINARY ENVIRONMENTAL IMPACT ASSESSMENT
47
Table 5-20 Marine mammal noise exposure criteria used in the quantitative assessment.
Effect Taxa Sound type Sound pressure level /SEL
Source
Start of hearing effects - TTS
Cetaceans Airgun pulses 180 dB re 1µPa /61/
Start of hearing effects - TTS
Pinnipeds Airgun pulses 190 dB re 1µPa /61/
PTS Cetaceans (Beluga, narwhal, bowhead whale)
Single - multiple pulse 230 dB re 1µPa peak
/60/
PTS Cetaceans (Beluga, narwhal, bowhead whale)
Single - multiple pulse SEL 198 dB re 1µPa2-s (Mlf, Mmf, Mhf)
/60/
PTS Pinnipeds (in water) Single pulse - multiple pulse 218 dB re 1µPa peak
/60/
PTS Pinnipeds (in water) Single pulse - multiple pulse SEL 186 dB re 1µPa2-s (Mlf, Mmf, Mhf)
/60/
TTS Cetaceans (Beluga, narwhal, bowhead whale)
Single pulses 224 dB re 1µPa peak
/60/
TTS Cetaceans (Beluga, narwhal, bowhead whale)
Single pulses 183 dB re 1µPa2-s SEL (Mlf, Mmf, Mhf)
/60/
TTS Pinnipeds (in water) Single pulses 212 dB re 1µPa peak
/60/
TTS Pinnipeds (in water) Single pulses 171 dB re 1µPa2-s SEL (Mpw)
/60/
TTS Pinnipeds in water Single pulses 226 dB re 1µPa peak to peak
/63/
Onset of response
Cetaceans (Beluga, narwhal, bowhead whale)
Multiple pulses 2 D seismic / echosounder / side scan sonar
140 dB re 1µPa2·s / 140 dB re 1µPa
/60//89/
Response Seals Multiple pulses 190 dB re 1µPa /60/
Using the criteria for injury and avoidance behaviour described above, zones of impact for the different sound sources are calculated from the M-weighted sound pressure source levels. Mammals generally do not hear equally well over their entire range of hearing. Towards the lower and upper cut-off frequencies the perceived loudness becomes less than what is predicted from the audiogram /64/. This discrepancy in perceived loudness can be compensated by applying an equal-loudness filter. Southall /60/ developed equal-loudness filters for the different marine mammal groups, and in the following this M-weighting will be applied for the evaluation of noise impact where possible. More details about M-weighting are given in the acoustic modelling report.

PRELIMINARY ENVIRONMENTAL IMPACT ASSESSMENT
48
Little information is available regarding the power spectra of the sound sources investigated here. In the following it is assumed that the main sound energy is centred at 95 kHz for the multi-beam echosounder and 100-110 kHz for the side-scan sonar. This gives a conservative estimate of zones of impact. These frequency ranges, and M-weighted source levels, are used to calculate the distance between the source and the injury and behavioural response threshold locations /60/.
• The assumed M-weighted sound pressure levels (SPLM) for a multi-beam echosounder are 221 dB re 1 µPa for mid-frequency cetaceans and 215 dB re 1 µPa for pinnipeds, the frequency range of the echosounder is outside the hearing range of low-frequency cetaceans.
• The SPLM for the side-scan sonar is very similar to the multi-beam echo-sounders with 222 dB re 1 µPa for mid-frequency cetaceans and 217 dB re 1 µPa for pinnipeds.
The zones of impact for the equipment associated with multi-beam echosounder and side scan sonar are collected in Table 5-21.
Table 5-21 Zones of impact for a multi-beam echosounder and side scan sonar, defining zones of PTS/TTS and avoidance behaviour in the beluga whale, narwhal, bowhead whale, walrus, bearded seal, ringed seal, Atlantic cod and Atlantic herring. Data on multi-beam echosounder noise is from Genesis /14/. (a criteria from the National Marine Fisheries Service). The line ‘-‘ indicates that no record to any range could be found for this sound level in calculations or the model so that effects are not evident.
Effect Sound pressure level /SEL Maximum range to threshold location (m)
Multi-beam echosounder
PTS Cetaceans (narwhal and beluga) - PTS Pinnipeds (in water) - TTS Cetaceans (narwhal and beluga)a 85 TTS Pinnipeds (in water)a 20 Response Cetaceans (Beluga, narwhal) 350 - 800 Response Seals (bearded and ringed seal) 20 – 250
Side-scan sonar PTS Cetaceans (narwhal, beluga and bowhead whale)
-
PTS Pinnipeds (in water) - TTS Cetaceans (narwhal and beluga)a 90 TTS Pinnipeds (bearded and ringed
seal)a 35
Response Cetaceans (Beluga, narwhal) 350 - 800 Response Seals (bearded and ringed seal) 35 – 350
For the assessment of the impact zones from the 2D high resolution survey, numerical modelling of underwater noise was applied, as detailed in Appendix 2.
The results of the modelling for the seismic survey are shown in Table 5-22. The spatial dimension of the underwater noise field is assessed for single shots and a survey undertaken over 24 h, see Appendix 2. It is very clear from the assessment that any physical impacts due to the exposure to single pulses are restricted to very close ranges from the source. Behavioural response in cetaceans is assessed to occur at distances of up to 6 km from the source. The differences between the sites are negligible.

PRELIMINARY ENVIRONMENTAL IMPACT ASSESSMENT
49
Table 5-22 Zones of impact for the 2D high resolution seismic survey (see detailed results in the acoustic modelling report, Appendix 2)
Effect Taxa Sound pressure level /SEL
Maximum range to threshold location 1,2 and 3 (m)
Start of hearing effects - TTS
Cetaceans 180 dB re 1µPa 70-80
Start of hearing effects - TTS
Pinnipeds 190 dB re 1µPa -40
PTS Cetaceans (Beluga, narwhal, bowhead whale)
230 dB re 1µPa peak -
PTS Cetaceans (Beluga, narwhal, bowhead whale)
SEL 198 dB re 1µPa2-s (Mlf, Mmf, Mhf)
-
PTS Pinnipeds (in water) 218 dB re 1µPa peak - PTS Pinnipeds (in water) SEL 186 dB re 1µPa2-
s (Mlf, Mmf, Mhf) -
TTS Cetaceans (Beluga, narwhal, bowhead whale)
224 dB re 1µPa peak -
TTS Cetaceans (Beluga, narwhal, bowhead whale)
183 dB re 1µPa2-s SEL (Mlf, Mmf, Mhf)
30 Mlf
TTS Pinnipeds (in water) 212 dB re 1µPa peak - TTS Pinnipeds (in water) 171 dB re 1µPa2-s
SEL (Mpw) 50-
TTS Pinnipeds in water 226 dB re 1µPa peak to peak
-
Response Cetaceans (Beluga, narwhal, bowhead whale)
160 dB re 1µPa 230-250
Response Cetaceans (beluga, narwhal, bowhead whale
140 dB re 1µPa 5,800 – 6,090
Response Seals 190 dB re 1µPa 40-
With regards to the intensity we define injury and PTS as being a large effect, as the structure and function of the receptor are affected completely, and structure and function are lost completely inside the affected area. As PTS is not affecting the whole hearing range of the receivers, we have defined this effect as being of medium intensity but of long-term duration. Following this logic, TTS is defined as a medium effect as well but as it is reversible, it is one of short term duration. Behavioural responses can range from medium to minor, depending on the number of species affected.
Applying the NMFS criteria, echosounders are predicted to lead to TTS in narwhal and beluga at 85 m from the source and in pinnipeds at distances of 10 m from the source. Behavioural effects are expected from 20 m (seals) to 800 m (narwhal and beluga). The impact ranges for the side scan sonar are TTS at 90 m in belugas and narwhals and at 35 m in pinnipeds. Behavioural responses are expected at a maximum range of 800 m (narwhal). Seals are much less affected with behaviour to be expected up to 320 m from the source.
For the 2D high resolution surveys TTS will be limited to areas close to the source (80 m in cetaceans and 40 m for pinnipeds). The onset of behavioural response can be expected in all three cetacean species at distances of up to 6 km from the source with little difference between the sites. For seals, behavioural responses are only expected at close ranges (40 m).
The results of the impact assessment are summarized in Table 5-24. As can be seen, the effects of noise on marine organisms are directly coupled to the activities. With the exception of the bowhead whale, TTS may be induced at relatively short distances. If noise inter-pulse intervals are shorter than the TTS recovery periods, TTS may accumulate and could potentially result in PTS (see also assessment of cumulative SEL levels for the 2D seismic survey). However, for the received levels, duty cycles and exposure times of interest here, the possibility of PTS to occur based on multiple exposures is very low. Once survey activities subside, physical effects should disappear within a few days. Behavioural effects could result in animals leaving the area for longer periods, but should return to normal within a few months at most.

PRELIMINARY ENVIRONMENTAL IMPACT ASSESSMENT
50
Estimates of number of individuals and percentage of population assessed to be physiologically or behaviourally impacted from single airgun pulses have been assessed. The assessment has been made based on the population and density estimates performed for the 2012 EIA for seismic activities in the two license blocks /6/ and the zones of impact assessed in the acoustic modelling. A summary of the calculations is presented in Appendix 3. As presented in Table 5-23, the numbers of affected individuals are very low, with less than 1 individual potentially impacted for all species.
Table 5-23 Estimates of number of individuals assessed to be physiologically or behaviourally impacted impacted from single airgun pulses. A summary of the calculations are presented in Appendix 3.
Animals assessed to be physiologically impacted (TTS)
Animals assessed to be behaviourally impacted
Individuals1 Percentage of population2
Individuals1 Percentage of population2
Ringed seal 7.0 * 10-3 3.1 * 10-6 7.0 * 10-3 3.1 * 10-6
Narwhale (offshore)
5.2 * 10-5 3.5 * 10-7 0.29 2.0 * 10-3
Beluga whale (summer)
1.2 * 10-7 6.9 * 10-4
Beluga whale (fall)
1,2 * 10-6 6,9 * 10-3
Bowhead whale 1,2 * 10-5 6,9 * 10-2
Walrus 3,1 * 10-6 3,1 * 10-6
Presence of vessels may contribute to the animals' habituation to human activities. However, limited interaction between the site survey and marine mammals in the area is expected. Marine mammal responses to vessels often include changes in general activity (e.g., from resting or feeding, to active avoidance), changes in surfacing-respiration-dive cycles, and changes in speed and direction of movement. Behavioural reactions tend to be reduced when animals are actively involved in a specific activity such as feeding or socializing, as reviewed by Richardson /43/. Whales react most noticeably to erratically moving vessels with varying engine speeds and gear changes, and to vessels in active pursuit. In general, large baleen whales are more susceptible to strikes than smaller toothed whales. A description of the response of the six focal species is presented in the following. Belugas and Narwhals' response to vessels during ice-free seasons are variable, ranging from tolerance to avoidance. The response of belugas and narwhals appears to be dependent on the type of vessel, its speed and course, the whales' activity, and their previous exposure to industrial activity. According to Finley /44/narwhal and belugas' sensitivity to vessel presence in Lancaster Sound declined after repeated exposures. Narwhals revealed more subtle reactions to oncoming vessels than belugas, generally by slowing-down their movements or remaining motionless near the ice edge, as reviewed in /6/. In Baffin Bay few belugas are expected to occur, and narwhals from Melville Bay are not expected to be present in the license blocks. Thus, it is not expected that belugas and narwhals will be majorly exposed to vessels to cause disturbance or mortality. Marine mammal observers will also be onboard, mitigating this impact. Given the planned mitigation measures, it is assessed that the impacts will be negligible. Bowhead whales seem to show avoidance reactions to approaching vessels at distances of 4 km or greater /43/. When vessels travel slowly, bowhead whales are often more tolerant, showing little or no reaction. Furthermore, bowhead whales engaged in social interactions or mating may be less responsive than other bowhead whales /6/. Bowhead whales may be encountered in the license blocks during the site survey period. However, the planned timeline for this project does

PRELIMINARY ENVIRONMENTAL IMPACT ASSESSMENT
51
not overlap with major feeding or breeding periods/areas of the whales. Thus, it is believed that if encountered, a bowhead whale would be able to avoid the vessels and prevent ship strikes. Marine mammal observers will also be onboard, mitigating this impact. For this site survey it is thus assessed that the operations involved may not impact bowhead whales. A study on walrus /45/ showed that when hauled-out on ice, the behavioural reaction of walruses depends mainly on vessel distance and speed. In addition, walrus respond at greater distances when a vessel approached from downwind as compared with upwind, and that this species shows less reaction in water than on ice. Thus, collisions between vessels and walrus do not seem to be of concern. However, walrus are not expected to be present in the license blocks, which is too deep for them to feed >200m. For this current study, walrus vessel avoidance reactions in water are expected to be localized and short-term. There are few studies on pinnipeds' behavioural reaction to vessels. Hauled-out ringed seals often show short-term escape reactions to approaching ships within 250–500 m /38/. It seems that when in water seals are less responsive to approaching vessels than when on ice, and may even lead to curious behaviour /6/. Polar bears have no natural predators and, given their position at the top of the food web, it is very sensitive to changes in the arctic marine ecosystem. According to Fay et al. (1984), most polar bears seem to be little affected by vessel presence, although different behavioural reactions have been documented. Generally, the responses tend to be short-term and usually described as avoidance by walking, running, or swimming away. However, other bears may not show any reactions at all /6/). Mothers with cubs are expected to be more protective and cautious, especially when more than one cub is present. Encounters between vessels and swimming polar bears are very unlikely, as few polar bears sightings are expected during the proposed period of the site survey. Seabed disturbance and changes in food availability are assessed in previous sections. Certain marine mammals that may occur in the license blocks are known to feed on benthic animals, particularly the narwhal, beluga, bearded seal and walrus. However, belugas and narwhals acquire most of their dietary requirements during the winter, feeding very little, if at all, during the summer. Being located offshore at water depths of 400 – 800 meters, survey sites are at depths deeper than the feeding range for walrus, which is able to dive no deeper than c. 200 meters. Any seabed disturbances related to the site survey are considered to be of no influence to marine mammals. The previous sections have assessed the impacts of the survey activities to fish and lover trophic ecosystem levels. No or minor impacts to neither pelagic crustaceans nor pelagic fish are expected. Based on this, it is assessed that there will be no impacts to whale or seal feeding in the license blocks, caused by alterations of the distributions of prey items. The presence of moored hydrographic stations has some probability of causing entanglement of mammals. This may prove fatal to an individual becoming entangled. The moored equipment of the survey are expected to consist of ropes/wires being stretched between anchor, measuring instruments and flotation buoys all the time the equipment is deployed. Avoiding slack and loose piles of floating rope will reduces the risk of accidental entanglement of whales or seals. There is a low risk of entanglement and ship collision to individuals, and the overall impact is assessed to be none. Navigational and deck- working lights used to illuminate working areas, are sources of artificial light being spread into the environment. Light may attract plankton and fish, serving as prey for marine mammals. However, planned activities are scheduled to take place within a time window from July to October, during which daylight dwindles, and illumination gradually becomes needed. It is assessed that light from the site survey on marine mammals will have no measurable impact.

PRELIMINARY ENVIRONMENTAL IMPACT ASSESSMENT
52
Table 5-24 Environmental impacts to marine mammals in connection with the 2013 site survey
Potential project impact
Intensity of impact
Scale of impact
Duration of impact
Overall severity of impact
Level of confidence
Noise (MBES) TTS Medium Local Short-term Moderate
Medium
Noise (MBES) Response Medium Local Short-term Minor
Medium
Noise (SSS) TTS Medium Local Short-term Moderate
Medium
Noise (SSS) Response Medium Local Short-term Minor
Medium
Noise (seismic) TTS Medium Local Short term Minor
Medium
Noise (seismic) Response Medium Regional Immediate Moderate
Medium
Presence of vessels Medium Local Short-term Minor Low
Seabed disturbance and changed food availability
- - - No impact High
Entanglement in mooring
Low Local
Short
No impact High
Light Low Local Short No impact High
5.10.3 Mitigating measures
The mitigation measures applied are:
• Marine mammal observers, ensuring that the survey is delayed if animals are observed • Soft start procedure gradually increasing the sound energy to provide time for mammals
to leave the area • Observations of a safety zone (500 m) where the survey is stopped if animals are
observed • Passive acoustic monitoring system, enabling registration of marine mammals under
adverse weather conditions. The site survey is undertaken applying the mitigating measures outlined above and no further mitigating measures are expected.
5.10.4 Residual impact The planned mitigating measures would effectively alleviate the risk of temporary threshold shift. However, the measures would not be mitigating to behavioural impacts as ranges are larger and animals cannot be visually observed at these distances. The residual impact to marine mammals is thus assessed to be minor.
5.11 Protected areas 5.11.1 Existing conditions
Figure 5-12 show protected areas in or near the license blocks. There are no Ramsar-areas, important bird areas (IBA) or areas protected according to the Greenland Nature Protection Law (Melville Bay reserve and Bird Protection areas) within the license blocks.

PRELIMINARY ENVIRONMENTAL IMPACT ASSESSMENT
53
The license blocks are situated in a seismic protection zone for narwhal, appointed as a migration corridor (narwhal zone II). The protection zone is the fall migration habitat where the narwhals (and beluga whales) are present from 15 October at least until 1 Dec. Seismic activities in narwhal zone II shall be confined to a minimum in the protection period. Narwhal zone I is the summer habitat, where narwhals are present when the sea ice melts in summer until fall migration (1 June to 15 Oct). Beluga whales also occur in this area from 1 October. The shortest distance from survey areas to the seismic protection zone for narwhal summer habitat is approximately 40 km.
Figure 5-12 Protected and important areas in and near the license blocks.
5.11.2 Impact assessment
The license blocks only overlap with one type of protection zone: seismic protection zone for narwhal. The protection zone is the fall migration habitat where the narwhals (and beluga whales) are present from 15 October at least until 1 Dec. As there is no overlap between the site survey and the protection period, it is assessed that there will be no impacts to protected areas.

PRELIMINARY ENVIRONMENTAL IMPACT ASSESSMENT
54
Table 5-25 Environmental impacts to protected areas in connection with the 2013 site survey
Potential project impact
Intensity of impact
Scale of
impact
Duration of impact
Overall severity
of impact
Level of confidence
None No High
5.12 Seabirds 5.12.1 Existing conditions
The highly productive waters off Northwest Greenland combined with suitable breeding habitats along the shores attract millions of seabirds during the open water season (May – September). Most of the seabirds found in the region are migratory and only visit the area during the breeding period. The birds arrive from early May from the eastern Canadian Arctic, eastern Canada, northeaster United States, Western Europe, and the south Atlantic, and many species aggregate in large breeding colonies containing several million pairs /9/. Besides being an important breeding area, the Baffin Bay area supports large numbers of migrating birds traveling through the area to and from breeding sites in the northern parts of Canada and Greenland /9/. The seabirds play an important role in the High Arctic ecosystem. Because they breed on land and forage at sea, they transport nutrients across the biogeographic boundary between the highly productive sea and the relatively low productive terrestrial ecosystem. Thus, colonial seabirds play a key role in fertilizing and sustaining the terrestrial ecosystem /66//67/. Many seabird species in the Baffin Bay area are fish consumers and prey on species such as capelin, sand eel and polar cod. Other species live on benthic invertebrates or support the fish diet with large zooplankton species (copepods, amphipods and krill) /9/. Little auks are specialized on a planktivorous diet and prey entirely on zooplankton throughout the breeding period /69/. The different diet preferences are reflected in the foraging behaviour (foraging range, diving depth, timing etc.). Some species (such as guillemots) show diving depths of more than 100 meters while other species (such as little auks) mainly feed in the surface waters (10-50 meters) /70//9/. Some species are forced on long distance foraging trips due to unsustainable local foraging options and may travel more than 100 kilometres to locate suitable prey /9/. The most numerous seabird species in High Arctic is the little auk (Alle alle) /84/. Estimated 80 % of the total world population (corresponding to 33 million birds) breeds in the Avanersuaq (Thule) district of Northwest Greenland /71/. In addition, the majority of the Greenland breeding population of Brünnich's Guillemots (Uria lomvia) breed in the area /9/. Also, northern fulmar (Fulmarus glacialis) and Black-legged kittiwake (Rissa triactyla) are common in Baffin Bay /9/. A list of important species for the area is presented in Table 5-26. Among the species found in the Baffin Bay area, several are of conservational concern and included on the Greenland Red List and/or are of national or international importance. The conservational status for selected species is presented in Table 5-26.

PRELIMINARY ENVIRONMENTAL IMPACT ASSESSMENT
55
Table 5-26 Overview of selected seabird species found offshore in the Baffin Bay area. List modified from /9/.
Species Greenland
Red List status
National
responsibility
species*
Importance of
Baffin Bay
area**
Fulmar (Fulmarus glacialis) Least Concern High
Red-necked phalarope (Phalaropus lobatus) Least Concern Low
Red phalarope (Phalaropus fulicarius) Least Concern Low
Black-legged kittiwake (Rissa tridactyla) Vulnerable High
Glaucous gull (Larus hyperboreus) Least Concern Medium
Icelandic gull (Larus glaucoides) Least Concern Yes Low
Sabines Gull (Xema sabini) Near Threatened Low
Ivory gull (Pagophila eburnean) Vulnerable Medium
Arctic tern (Sterna paradisaea) Near Threatened High
Atlantic puffin (Fratercula arctica) Near Threatened High
Brünnich's Guillemot (Uria lomvia) Vulnerable High
Black guillemot (Cepphus grylle) Least Concern Yes High
Razorbill (Alca torda) Least Concern High
Little auk (Alle alle) Least Concern Yes High
*National responsibility species (defined as more than 20 % of the global population in Greenland), species with isolated population in Greenland and species listed as ‘Data Deficient’ (DD) occurring in the assessment area. Only species which may occur in marine habitats are included. **Importance of Baffin Bay SEIA area to population (conservation value) indicates the significance of the population occurring within the Baffin Bay assessment area in a national and international context. On a large scale the general knowledge of seabirds in the area is well known whereas, detailed information of offshore distribution and area utilization is very sparse. Presumably the most important offshore areas include waters with early ice break-up and areas where upwelling events are recurrent /9/. However, a report on marine mammal and seabird surveys conducted during a seismic site survey in 2011 include seabird observation from 65-76º N between August and September /75/. The density of birds ranged from 0.83 birds/km2 (August, 68–70 °N) to 9.11 birds/km2 (September, 74–76 °N). The highest densities were observed in the most southerly (65–68 °N) and most northerly (74–76 °N) latitudes of the survey area. A list of species observed from those surveys is presented in Table 5-27.
Table 5-27 Summary of selected bird observations during a seismic site survey off northwest Greenland between 11 August and 18 September 2011, modified from /75/.
Species Total number (individuals)
Fulmar (Fulmarus glacialis) 398 Red-necked phalarope (Phalaropus lobatus) 14 Red phalarope (Phalaropus fulicarius) 45 Arctic skua (Stercorarius parasiticus) 8 Black-legged kittiwake (Rissa tridactyla) 398 Glaucous gull (Larus hyperboreus) 122 Icelandic gull (Larus glaucoides) 1 Sabines Gull (Xema sabini) 1 Ivory gull (Pagophila eburnean) 2 Arctic tern (Sterna paradisaea) 4 Atlantic puffin (Fratercula arctica) 1 Brünnich's Guillemot (Uria lomvia) 118 Black guillemot (Cepphus grylle) 36 Little auk (Alle alle) 1,925 Eiders (Somateria spp.) 92
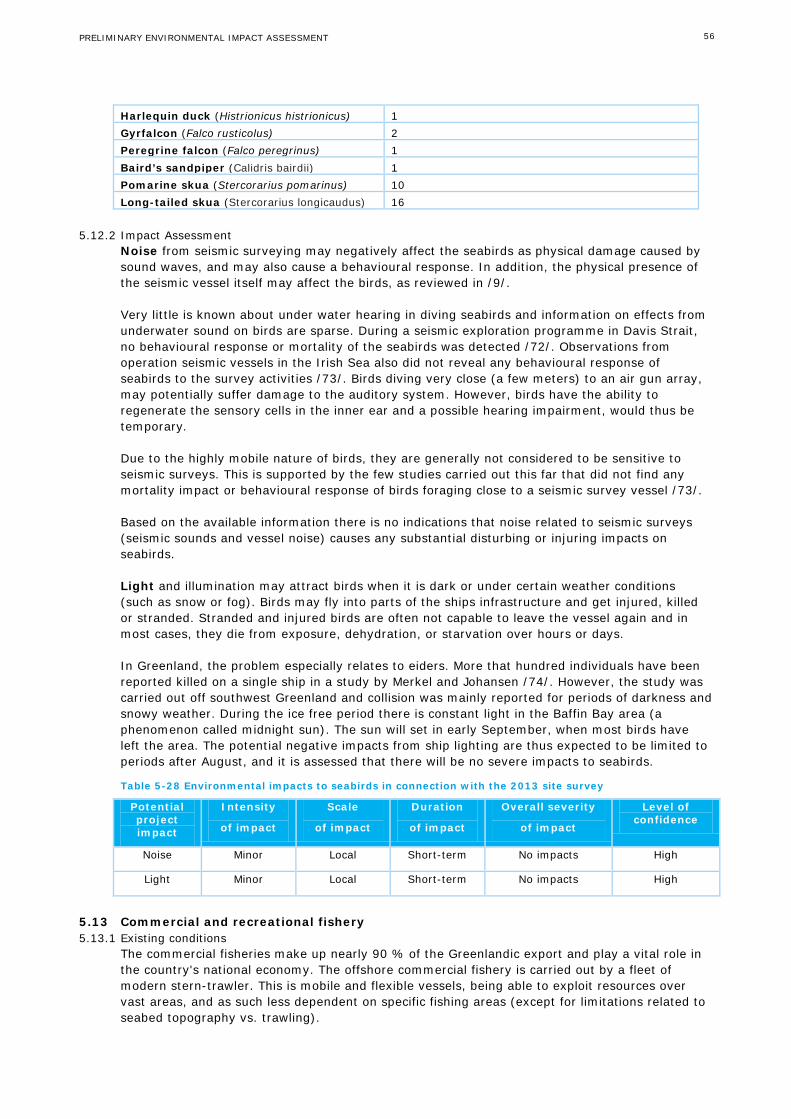
PRELIMINARY ENVIRONMENTAL IMPACT ASSESSMENT
56
Harlequin duck (Histrionicus histrionicus) 1 Gyrfalcon (Falco rusticolus) 2 Peregrine falcon (Falco peregrinus) 1 Baird’s sandpiper (Calidris bairdii) 1 Pomarine skua (Stercorarius pomarinus) 10 Long-tailed skua (Stercorarius longicaudus) 16
5.12.2 Impact Assessment Noise from seismic surveying may negatively affect the seabirds as physical damage caused by sound waves, and may also cause a behavioural response. In addition, the physical presence of the seismic vessel itself may affect the birds, as reviewed in /9/. Very little is known about under water hearing in diving seabirds and information on effects from underwater sound on birds are sparse. During a seismic exploration programme in Davis Strait, no behavioural response or mortality of the seabirds was detected /72/. Observations from operation seismic vessels in the Irish Sea also did not reveal any behavioural response of seabirds to the survey activities /73/. Birds diving very close (a few meters) to an air gun array, may potentially suffer damage to the auditory system. However, birds have the ability to regenerate the sensory cells in the inner ear and a possible hearing impairment, would thus be temporary. Due to the highly mobile nature of birds, they are generally not considered to be sensitive to seismic surveys. This is supported by the few studies carried out this far that did not find any mortality impact or behavioural response of birds foraging close to a seismic survey vessel /73/. Based on the available information there is no indications that noise related to seismic surveys (seismic sounds and vessel noise) causes any substantial disturbing or injuring impacts on seabirds. Light and illumination may attract birds when it is dark or under certain weather conditions (such as snow or fog). Birds may fly into parts of the ships infrastructure and get injured, killed or stranded. Stranded and injured birds are often not capable to leave the vessel again and in most cases, they die from exposure, dehydration, or starvation over hours or days. In Greenland, the problem especially relates to eiders. More that hundred individuals have been reported killed on a single ship in a study by Merkel and Johansen /74/. However, the study was carried out off southwest Greenland and collision was mainly reported for periods of darkness and snowy weather. During the ice free period there is constant light in the Baffin Bay area (a phenomenon called midnight sun). The sun will set in early September, when most birds have left the area. The potential negative impacts from ship lighting are thus expected to be limited to periods after August, and it is assessed that there will be no severe impacts to seabirds.
Table 5-28 Environmental impacts to seabirds in connection with the 2013 site survey
Potential project impact
Intensity
of impact
Scale
of impact
Duration
of impact
Overall severity
of impact
Level of confidence
Noise Minor Local Short-term No impacts High
Light Minor Local Short-term No impacts High
5.13 Commercial and recreational fishery 5.13.1 Existing conditions
The commercial fisheries make up nearly 90 % of the Greenlandic export and play a vital role in the country's national economy. The offshore commercial fishery is carried out by a fleet of modern stern-trawler. This is mobile and flexible vessels, being able to exploit resources over vast areas, and as such less dependent on specific fishing areas (except for limitations related to seabed topography vs. trawling).
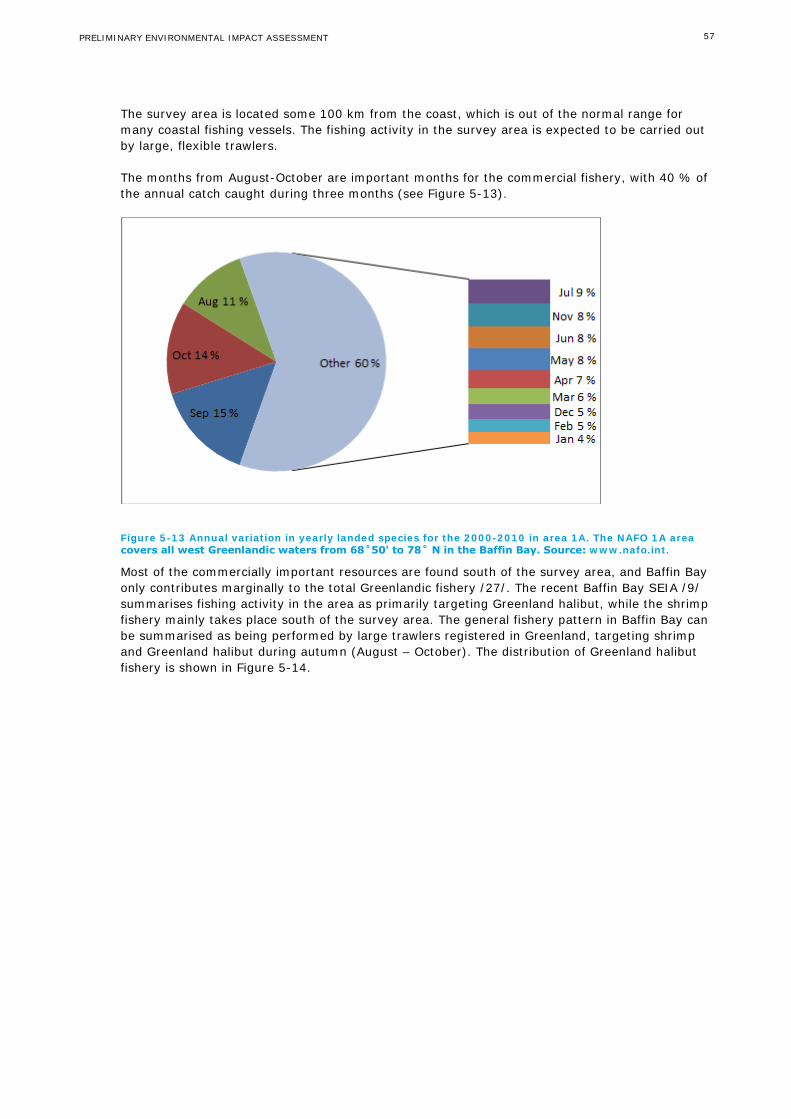
PRELIMINARY ENVIRONMENTAL IMPACT ASSESSMENT
57
The survey area is located some 100 km from the coast, which is out of the normal range for many coastal fishing vessels. The fishing activity in the survey area is expected to be carried out by large, flexible trawlers. The months from August-October are important months for the commercial fishery, with 40 % of the annual catch caught during three months (see Figure 5-13).
Figure 5-13 Annual variation in yearly landed species for the 2000-2010 in area 1A. The NAFO 1A area covers all west Greenlandic waters from 68˚50' to 78˚ N in the Baffin Bay. Source: www.nafo.int.
Most of the commercially important resources are found south of the survey area, and Baffin Bay only contributes marginally to the total Greenlandic fishery /27/. The recent Baffin Bay SEIA /9/ summarises fishing activity in the area as primarily targeting Greenland halibut, while the shrimp fishery mainly takes place south of the survey area. The general fishery pattern in Baffin Bay can be summarised as being performed by large trawlers registered in Greenland, targeting shrimp and Greenland halibut during autumn (August – October). The distribution of Greenland halibut fishery is shown in Figure 5-14.

PRELIMINARY ENVIRONMENTAL IMPACT ASSESSMENT
58
Figure 5-14 Distribution of Greenland offshore halibut fishery and size of landings from the assessment area. Redrawn from /9/
The shrimp population in West Greenland waters is decreasing due to poor recruitment. The catch quotas are decreasing accordingly (from an estimated catch in 2012 of 110 000 tons to a quota recommendation given by Pinngortitalerifiik (Greenland Institute of Natural resources) of 80,000 tonnes in 2013 /76/. This is likely to lead to reduced effort, and less important areas will tend to become even less interesting to the trawling fleet. Historically, the shrimp fishery has taken place south of the survey area, but the shrimp trawlers are flexible and independent of harbour/support facilities, and if ice conditions and catch rates are favourable in the survey area, the trawlers might be fishing in this region. Greenland halibut is the second important commercial fish resource being harvested in the survey area. This stock seems to be stable, and a total allowable catch (TAC) of approx. 13 000 tons (the same as 2007 - 2012) is expected for 2013 /77/. Reduced availability of shrimp may encourage increased effort in the trawling for Greenland halibut, but it is considered unlikely that the survey area during 2013 will be of particular significance to Greenland halibut fishery. Despite a predicted increase in the population of Atlantic cod off west Greenland, this species has not (yet) increased in numbers sufficient to compensate for dwindling shrimp quotas. The license blocks are located some 100 km from the coast and far from the major settlements and villages in west Greenland. The area thus is of limited or no interest to the smallest fishing and recreational vessels.
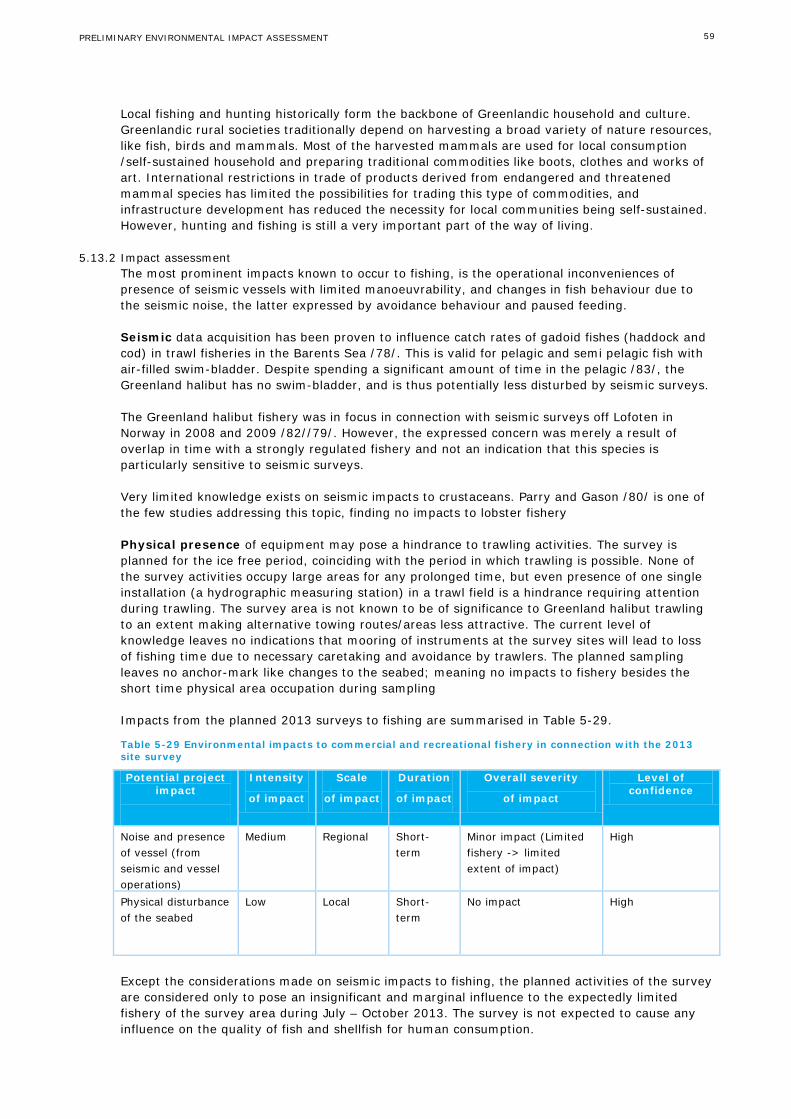
PRELIMINARY ENVIRONMENTAL IMPACT ASSESSMENT
59
Local fishing and hunting historically form the backbone of Greenlandic household and culture. Greenlandic rural societies traditionally depend on harvesting a broad variety of nature resources, like fish, birds and mammals. Most of the harvested mammals are used for local consumption /self-sustained household and preparing traditional commodities like boots, clothes and works of art. International restrictions in trade of products derived from endangered and threatened mammal species has limited the possibilities for trading this type of commodities, and infrastructure development has reduced the necessity for local communities being self-sustained. However, hunting and fishing is still a very important part of the way of living.
5.13.2 Impact assessment The most prominent impacts known to occur to fishing, is the operational inconveniences of presence of seismic vessels with limited manoeuvrability, and changes in fish behaviour due to the seismic noise, the latter expressed by avoidance behaviour and paused feeding. Seismic data acquisition has been proven to influence catch rates of gadoid fishes (haddock and cod) in trawl fisheries in the Barents Sea /78/. This is valid for pelagic and semi pelagic fish with air-filled swim-bladder. Despite spending a significant amount of time in the pelagic /83/, the Greenland halibut has no swim-bladder, and is thus potentially less disturbed by seismic surveys. The Greenland halibut fishery was in focus in connection with seismic surveys off Lofoten in Norway in 2008 and 2009 /82//79/. However, the expressed concern was merely a result of overlap in time with a strongly regulated fishery and not an indication that this species is particularly sensitive to seismic surveys. Very limited knowledge exists on seismic impacts to crustaceans. Parry and Gason /80/ is one of the few studies addressing this topic, finding no impacts to lobster fishery Physical presence of equipment may pose a hindrance to trawling activities. The survey is planned for the ice free period, coinciding with the period in which trawling is possible. None of the survey activities occupy large areas for any prolonged time, but even presence of one single installation (a hydrographic measuring station) in a trawl field is a hindrance requiring attention during trawling. The survey area is not known to be of significance to Greenland halibut trawling to an extent making alternative towing routes/areas less attractive. The current level of knowledge leaves no indications that mooring of instruments at the survey sites will lead to loss of fishing time due to necessary caretaking and avoidance by trawlers. The planned sampling leaves no anchor-mark like changes to the seabed; meaning no impacts to fishery besides the short time physical area occupation during sampling Impacts from the planned 2013 surveys to fishing are summarised in Table 5-29.
Table 5-29 Environmental impacts to commercial and recreational fishery in connection with the 2013 site survey
Potential project impact
Intensity
of impact
Scale
of impact
Duration
of impact
Overall severity
of impact
Level of confidence
Noise and presence of vessel (from seismic and vessel operations)
Medium Regional Short-term
Minor impact (Limited fishery -> limited extent of impact)
High
Physical disturbance of the seabed
Low Local Short-term
No impact High
Except the considerations made on seismic impacts to fishing, the planned activities of the survey are considered only to pose an insignificant and marginal influence to the expectedly limited fishery of the survey area during July – October 2013. The survey is not expected to cause any influence on the quality of fish and shellfish for human consumption.

PRELIMINARY ENVIRONMENTAL IMPACT ASSESSMENT
60
5.13.3 Mitigating measures A site survey of a specific location has limited, if any, possibilities to move the activity to other locations. Spatial mitigating measures to reduce influence on fisheries are thus limited to changes of the order in which the survey locations are visited. This should be considered in dialogue with any fishing vessels operating in the area during the survey. The planned site survey in Baffin Bay is restricted in time by the heavy ice conditions most of the year. The ice-free time window sets limitations on timing of the survey, as well as trawling, thus overlap with any trawling activity in the area seems likely, given that fishing takes place. Choosing any other time of the year for doing the survey than the time window planned is not an option. Mitigating measures in terms of order of magnitude of impact is related to number of fixed stations deployed, location and general duration of investigations.
5.13.4 Residual impacts As the need for and the possibilities to enforce mitigating measures are limited, the residual impacts of the survey activity to fisheries is considered the same as the impacts expected before considering any mitigating measures.
5.14 Maritime traffic 5.14.1 Existing conditions
Maritime traffic in Baffin Bay is primarily fisheries, cargo and cruise ships, the number of which has been increasing in recent years /85/. According to Joint Arctic Command in Nuuk the marine traffic in the area is limited and primarily consists of:
• Cargo ships. The settlements in the Upernavik district received supplies by cargo ships. The cargo ships normally sail along the coast and are not expected in or near the license blocks. Only a very limited number of cargo ships are using the north-west passage.
• Cruise ships. Cruise ships are concentrated in the area near Ilulissant and do normally not sail offshore.
• Fishing vessels. As described in section 5.13, minor halibut fishing is taking place in the southern part of the license blocks and no shrimp fishing is conducted in the license blocks.
The Northwest Passage is the name given to a set of marine routes between the Atlantic and Pacific Ocean, spanning the straits and sounds of the Canadian Archipelago. The passage is a transportation corridor through one massive archipelago until it reaches open, but ice-infested waters in the Baffin Bay (east) and Beaufort Sea (west). Current shipping demand in the Northwest Passage involves up to 22 seasonal trips and occurs during the 100 day navigation season that span from mid-July to the end of October /85/.
5.14.2 Impact assessment The amount of marine traffic in the license blocks is very limited in the license blocks as the majority of the maritime traffic is nearshore. On this background, it is assessed that the site survey will have no impact on maritime traffic.
Table 5-30 Environmental impacts to maritime traffic in connection with the 2013 site survey
Potential project impact
Intensity
of impact
Scale
of impact
Duration
of impact
Overall severity
of impact
Level of confidence
- - - - No impact High

PRELIMINARY ENVIRONMENTAL IMPACT ASSESSMENT
61
5.15 Tourism 5.15.1 Existing conditions
The most important asset for the tourist industry is the unspoiled, authentic and pristine nature. Besides tourists staying in hotels and other accommodation on shore, cruise ships bring an increasing number of tourists to Greenland, with 23,500 visitors in 2011 /85/. The cruise ships focus on the coastal zone and they often visit very remote areas that are otherwise almost inaccessible and sightings of seabirds and marine mammals are among the highlights on these trips. Tourism is increasing in importance in the Baffin Bay area and is one of the major sectors in the Greenland economy. Nature-based tourism in coastal regions is the primary component of this industry primary to the south of the license blocks. Cruise ships travel along the coast primarily in August and September.
5.15.2 Impact assessment Tourism is primarily related to the coastal areas. As the license blocks are some 100 km from the shore, it is assessed that there will be no direct impact on tourism.
Table 5-31 Environmental impacts to tourism in connection with the 2013 site survey
Potential project impact
Intensity
of impact
Scale
of impact
Duration
of impact
Overall severity
of impact
Level of confidence
- - - - No impact High
5.16 Cumulative impacts
Different impacts may together result in a different impact than each one would separately, as certain impacts can reinforce or counteract other impacts. As per January 2013, no other seismic surveys are announced in Baffin Bay, and no other surveys are announced in the license blocks. As such, no cumulative impacts are expected in relation to survey activities.
5.17 Transboundary impacts Transboundary impacts relate to impact across borders, i.e. impacts to the Canadian part of Baffin Bay, and could be associated with maritime traffic or propagation of underwater sound. No transboundary impacts have been identified as part of the environmental impact assessment.
5.18 Summary of impacts The results of the impact assessment are presented in Table 5-32, along with level of confidence. As is evident from the table, some impacts associated with the 2013 survey are moderate. Applying the identified mitigating measures, the residual impact is reduced to minor. The main activity of concern is the underwater noise emitted by the seismic activities and this is summarized below. Routine activities associated with the site survey, e.g. discharges of grey water (showers, wash water) and black water (treated sewage) as well as the physical presence of vessels were assessed, as were the impacts of the benthic sampling planned for the environmental baseline survey (EBS). Impacts of routine activities and benthic sampling are not detailed in this summary because impacts were assessed to be minor.
PRELIMINARY ENVIRONMENTAL IMPACT ASSESSMENT
62
5.18.1 Fish At depths below app. 500 m, the Greenland halibut is the dominant species, while species like lumpfish, spotted wolffish, polar cod, capelin, greenland cod, atlantic cod, northern shrimp, snow crab and several species of sculpins, skates and rays also occur. Noise from site survey has been assessed based on the modelled sound levels and criteria for behavioural and physiological response to underwater noise. Any physical impacts due to the exposure to single pulses are restricted to very close ranges from the source. Behavioural response in marine fish can occur at ranges just below 60 km. Impacts to fish associated with the seismic survey are assessed to be moderate.
5.18.2 Marine mammals No resident populations are known to occur in the license blocks. Based on dedicated aerial surveys, the SEIA and MMSO data several species of marine mammals have been identified in this area. Key species of marine mammals assessed to potentially occur in the license blocks are bowhead whale, beluga whale, narwhal, bearded seal, ringed seal, walrus and polar bear. Noise from site survey has been assessed based on the modelled sound levels and criteria for behavioural and physiological response to underwater noise. Overall, the only physiological effects that can occur with this type of sound source under the modelled propagation scenario are temporary threshold shift in bowhead whales close to the source. Behavioural response is expected in cetaceans (narwhals, beluga whales and bowhead whales) at ranges up to 6 km from the source, while seals are much less affected with behaviour potentially affected within 40 from the source.
The mitigation measures applied are 1) Marine mammals observers ensuring that no marine mammals are in the area prior to seismic start-up, 2) Soft start procedure gradually increasing the sound energy to provide time for mammals to leave the area, 3) Observations of the ‘safety zone’ (500 m) where survey is delayed if animals are observed, and 4) Passive Acoustic Monitoring (on board) in low visibility conditions. All four methods would effectively alleviate the risk of temporary threshold shift, and the residual impact is thus considered minor. Yet the behavioural impacts would not be mitigated as distances are larger and animals cannot be visually observed at these distances.
5.18.3 Protected areas The license blocks are situated in a seismic protection zone for narwhal, appointed as a migration corridor (narwhal zone II). The protection zone is established to protect the fall migration habitat where the narwhals (and beluga whales) are present from 15 October at least until 1 Dec. Seismic activities in narwhal zone II shall be confined to a minimum in the protection period. As there is no overlap between the site survey and the protection period, it is assessed that there will be no impacts to protected areas.

PRELIMINARY ENVIRONMENTAL IMPACT ASSESSMENT
63
Table 5-32 Summary of the overall severity of impacts, mitigating measures and residuel impact for parameters related to the planned 2013 site survey. The level of confidence for each impact assessment is also provided.
Parameter Overall severity of impact*
Mitigating measures Residual impact
Level of confidence
Climate and ice conditions
No impact N/A No impact High
Oceanography No impact N/A No impact High
Bathymetry No impact N/A No impact High
Water and sediment quality
No impact N/A No impact High
Plankton No impact N/A No impact High
Benthic fauna Minor impact No mitigating measures applicable Minor impact
High
Fish Moderate impact
No mitigating measures applicable Moderate impact
Medium-High
Marine Mammals Moderate impact
Marine mammal observers ensuring no marine mammals in the vicinity prior to seismic start-up Soft start procedure gradually increasing the sound energy to provide time for mammals to leave the area Observations of a safety zone (500 m) where the survey is delayed if animals are observed Passive acoustic monitoring system, enabling registration of marine mammals under adverse weather conditions.
Minor impact
Low-High
Protected areas No impact N/A No impact High
Seabirds No impact N/A No impact High
Commercial and recreational fishery
Minor impact Spatial mitigating measures to reduce influence on fisheries are limited to changes of the order in which the survey locations are visited. This should be considered in dialogue with any fishing vessels operating in the area during the survey.
Minor impact
High
Maritime traffic No impact N/A No impact High
Tourism No impact N/A No impact High
Cumulative impacts
No impact N/A No impact High
Transboundary impacts
No impact N/A No impact High

PRELIMINARY ENVIRONMENTAL IMPACT ASSESSMENT
64
Table 5-33 Criteria used in the environmental impact assessment for the planned 2013 site survey. Intensity
of impact
Scale
of impact
Duration
of impact
Overall severity
of impact1
No
Minor
Medium
Large
Local
Regional
National
Transboundary
Immediate
Short-term
Medium-term
Long-term
No impact
Negligible impact
Minor impact
Moderate impact
Significant impact 1: Evaluation of overall significance of impact includes an evaluation of the variables shown and an evaluation of the sensitivity of the resource/receptor that is assessed.
The environmental impact assessment is based on the best available information at this time. The license blocks are situated in Baffin Bay, ~100 km from land, in an area with limited data coverage. The main knowledge gap thus relates to site-specific data for the environmental parameter. Some studies have been carried out, but no structured repetitive surveys have been carried out in the license blocks.

PRELIMINARY ENVIRONMENTAL IMPACT ASSESSMENT
65
6. IMPACT ASSESSMENT (UNPLANNED EVENTS)
The planned site survey consists of seismic activities and sampling. Unplanned events include and accidental spill and loss of equipment during sampling. Loss of equipment during sampling refers to e.g. loss of streamer, or loss of an anchor. As the lost equipment is expected to be comparable to the dropped steel weights in association with the moorings assessed in section 5, loss of equipment is not further addressed. Preventative measures and plans will be in place to avoid any fuel spillage or other accidental events during the site survey, as described in section 7. Plans and measures include: spill prevention plans and ship-board oil pollution prevention plans, crew training, adherence to the safety management procedures including proper bunkering procedures, and drills. An ice management plan will be implemented and minimize the likelihood of vessel collisions with icebergs. In the unlikely event of a spill, impacts will be minimized; including use of appropriate onboard spill kits.
6.1 Spill scenarios For the purpose of this EIA, two scenarios for accidental fuel spill (of marine gas oil) were assessed. The first assumes a small spill during routine bunkering of a vessel and the second assumes total fuel loss (marine gas oil) from a vessel following a vessel collision (with another vessel or an iceberg).
• Scenario 1 assumes a fuel hose rupture during bunkering from a supply vessel to the seismic vessel. Based on a fuel transfer rate of ~100 m3/h and assuming it would take one minute for ship personnel to notice the leak and stop the fuel pumps, ~1.7 m3 of fuel could be spilled overboard.
• Scenario 2 is a worst-case scenario spill considering total fuel loss of the vessel. As the vessel for the site survey has not been selected, the volume considered in relation to the 2012 survey if used, resulting in a worst case spill of 1,925 m3. Such a spill is considered to be unlikely.
Refuelling of the survey vessel may, if necessary, occur in the license blocks, some 100 km from the Greenland coast, including the coastal areas identified as sensitive to spills in the SEIA /9/and oil spill sensitivity atlas for coastal areas of northwest Greenland /10/. Based on wind and current patterns described in the existing conditions (section 5) and the 2012 EIA /6/, an offshore fuel spill within the license blocks is more likely to move away from the coast, than towards the coast /6/.
6.2 Impacts to the marine environment The recent strategic environmental impact assessment (SEIA) /9/ reviewed potential impacts of accidental oil spills (including larger scale subsurface blowouts during exploration drilling) and the following assessment refers to the SEIA for further details. Water quality, and possibly sediment quality, would be susceptible to an accidental spill. As reviewed in the 2012 EIA /6/ marine gas oil is a light oil that persists in the environment for much shorter periods than e.g. crude oil or heavy fuel oils. In cold water, only about 50% of the spilled gas oil would remain on the water surface after 12 hours, and a spill of gas oil would thus not persist for long periods on the water surface. The remaining gas oil is split, with about half dispersed in the water column and the other half lost to evaporation. Based on the worst case scenario, the amount of marine gas oil that could be lost during a vessel collision (with another vessel or an iceberg) would form a diminishing surface slick for a few days to a week /6/. The scale of a spill in a worst-case scenario is thus assessed to be regional with a short-term duration, and assessed to be minor. Plankton (incl eggs and larvae of fish and invertebrates) are sensitive to hydrocarbon exposure. The occurrence, abundance and distribution of eggs and larvae of marine fish and invertebrate in the license blocks are likely to be highly variable by season and dependent on a variety of potential for individual invertebrate eggs and larvae in the upper water column to sustain lethal

PRELIMINARY ENVIRONMENTAL IMPACT ASSESSMENT
66
and sublethal effects following contact with high concentrations of hydrocarbons. In relation to fisheries, larvae of Greenland halibut and shrimp are found in deeper waters and would be less likely to come in contact with a fuel spill at the water’s surface. In the event of an accidental spill (which will be local and short-term), it is assessed that minor impacts to plankton may occur. Under natural conditions, most juvenile and adult fish can actively avoid contaminated water /9/. Impacts to fish populations is considered minor, but with uncertainty related to lack of life cycle knowledge on most species. Due to expected low densities of marine mammals in the license blocks, and the limited amounts of light fuel onboard the survey vessels, accidental discharges of marine gas oil are not expected to cause any impacts to seals or whales. Whales and seals rely on a layer of blubber, rather than fur, for insulation (except seal pups) and are generally not sensitive to a minor spill. As noted in the SEIA, the primary species in the license blocks that would be vulnerable to exposure to marine gas oil is the polar bear, which could have reduced insulation capabilities. The primary effects of an accidental spill on fisheries relates to physical effects on target species and fouling of gear. As noted in section 5.13, little fishery is expected in the license blocks, primarily targeting Greenland halibut. Direct impacts to ongoing fishing activity will likely be aborting fishing to take part in SAR operations. As impacts on fish and marine invertebrates from a spill of marine gas oil are expected to be minor, it is assessed that impacts on fisheries will be minor. Further impacts to fisheries due to market perceptions of poor product quality (no buyers or reduced prices, etc.) are more difficult to predict, since the actual (physical) impacts of the spill might have little to do with these perceptions. Seabirds are extremely vulnerable to fuel spills in the marine environment, as reviewed in /9/. Even a small amount of fuel may destroy the insulating and water-resistant properties and affecting the buoyancy of the plumage causing the bird to die from hypothermia, starvation or drowning. In addition, birds may get intoxicated from ingestion or inhalation of fuels when they are cleaning their plumages or are feeding on contaminated food. Intoxication may cause irritation of the digestive organs, damages to liver, kidneys and salt glands and leading to anaemia. The aggregative nature of many species of seabirds in Baffin Bay (especially little auks and Brünnich's Guillemots increases the potential for larger mortalities in case of an oil spill.
Transboundary impacts relate to impact across borders, i.e. impacts to the Canadian part of Baffin Bay. With the worst-case spill assessed to be regional with a short-term duration, no significant transboundary impacts are expected to occur.

PRELIMINARY ENVIRONMENTAL IMPACT ASSESSMENT
67
7. ENVIRONMENTAL MANAGEMENT PLAN
An environmental management plan (EMP) has been prepared to address implementation and monitoring of agreed mitigating measures for the site survey. In effect, the EMP links the EIA to the execution of the site survey. The EMP includes a description of the management structure and outlines the mitigating measures agreed for the site survey.
7.1 Management structure Shell is the operator for the license blocks and is managing the site survey activities. The site surveys will be undertaken by a specialist contractor, who will be responsible for the day-to-day operation of the vessel and the site survey programme. A client representative will be stationed on board the vessel and will be responsible for ensuring compliance with contract scope and specifications, audit of data quality, monitoring implementation of project HSSE plan and monitoring project progress.
7.2 Planning phase An Environmental Impact Assessment (EIA) must be prepared, describing the environmental conditions and assessing potential impacts. As part of the EIA seasonal considerations (e.g. pupping, migration of marine mammals) are addressed. Airgun array must be chosen to use the lowest practicable power levels to achieve the geophysical objectives of the survey. The airgun array for the 2013 survey has yet to be selected, and the EIA includes acoustic modelling based on conservative assumptions. The assumptions are based on parameters from previous surveys, literature and experience. The Seismic EIA Guidelines request operators to seek methods to reduce and/or baffle unnecessary high-frequency noise and to increase the directionality of the airguns. These potential mitigation measures have been assessed in a Joint Industry Programme study /87/. It was determined that the equipment necessary to reduce and/or baffle the airguns is not yet available. Communication with the relevant stakeholders (e.g. authorities, other operators and local interest groups) will be established as a minimum according to regulatory requirements. In addition to informing about the project, such communication allows the operator to assess cumulative impacts, e.g. if seismic surveys are planned in neighbouring license blocks.
7.3 Survey phase 7.3.1 Marine mammals – seismic mitigating measures
As evidenced in this EIA, the main impact is that of airgun array noise on marine mammals. This EMP focuses on minimizing noise impacts and is based primarily on the best practice mitigation guidelines described in the BMP Guidelines /3/. Marine mammal (and seabird; see below) observations will be performed from the survey vessels allowing an unobstructed view of the waters around the vessel. Whenever possible, the MMSOs will conduct observations from an outdoor platform. During periods of poor weather (high winds, rain/snow, or extreme cold temperatures), the MMSOs will continue monitoring for marine mammals and seabirds from the bridge for safety reasons. MMSOs aboard each of the seismic vessels will monitor for the presence of marine mammals (and seabirds) during all daylight hours. At all times, MMSOs will have access to a direct communication line with the survey room and the operator of the airguns. A safety zone of 500 m from the centre of the airgun array will be implemented for marine mammals, based on international best practice. Table 7-1 summarizes the operational monitoring and mitigation measures proposed for Shell’s seismic program. Flow-charts will be developed that clearly outline the decision-making process for implementing mitigation and monitoring procedures.

PRELIMINARY ENVIRONMENTAL IMPACT ASSESSMENT
68
During periods of poor visibility (when the 500-m safety zone for marine mammals, respectively cannot be monitored because of darkness or poor sighting conditions such as fog, rain, snow, or sea states >3), PAM will be used during the pre-shooting watch period to monitor for vocalizing marine mammals within the safety zone. The safety zone monitored by the PAM system will be determined in the field to ensure it extends beyond 500 m to compensate for the system’s accuracy. If any marine mammal is visually or acoustically detected within the safety zone during the pre-shooting watch period, the ramp-up will be delayed until the animal has been observed outside of the safety zone or 20 min has passed since the animal was last detected. A pre-shooting search of 30 min (60 min in water depths of >200 m) will be conducted before the start of any airgun operations. If the airgun array is shut down while on a transect line for any reason other than a marine mammal shutdown, the airgun array can be re-initiated at full power given that the shutdown is not longer than 5 min. Otherwise, a 20-min search and full ramp-up procedure will need to be initiated. When a marine mammal is observed to be on a course that will result in its entering the safety zone, a precautionary shutdown of the airgun array will be implemented. The ramp-up or soft start procedure will occur over a minimum period of ~20 min. Ramp up will start with the smallest volume airgun and incrementally increase the number of airguns activated. The procedure will be planned such that the start of the survey line begins immediately following the ramp up (i.e., unnecessary airgun firing will be avoided). Ramp ups will not exceed 40 min in duration, and to the extent possible will be initiated during daylight hours. During periods of poor monitoring visibility (when the 500-m safety zone for marine mammals cannot be monitored because of darkness or poor sighting conditions such as fog, rain, snow, or sea states >3), PAM will be used during the ramp-up procedure to monitor vocalizing marine mammals within the safety zone. If any marine mammal is visually or acoustically detected within the safety zone during the ramp-up procedure, the airgun array will be reduced to the mitigation gun (smallest airgun in the array) and a new ramp-up procedure will be initiated once the animal has been detected outside of the safety zone or 20 min has passed since the animal was last detected. When the airgun array is shut down, either because of marine mammals within the safety zone or for other reasons, the mitigation gun will continue to be used. If a marine mammal is observed within the 500-m safety zone for marine mammals, the airgun array will be reduced to the mitigation gun until the animal has left the safety zone. When this situation occurs, the airgun array can return to shooting at full power without requiring a ramp-up procedure in cases where (i) the animal is observed to have left the safety zone and (ii) the maximum time of the silent break (period between shut down and start up) is 5 min. If this period is longer than 5 min or the animal is not observed leaving the 500-m safety zone for marine mammals, a 20-min pre-shooting search period followed by a 20-min ramp-up procedure will be used before line shooting can resume. Line Changes. The airgun array output will be shut down when the transit time to the next survey line is expected to be greater than 20 min (the amount of time it would take to conduct a full ramp-up procedure). A 30 min (60 min in water depths of >200 m) pre-shooting search and full ramp-up procedure will be initiated before the start of the next survey line. If a transit between survey lines is expected to last less than 20 min, the airgun array can remain operational during transit, but preferably at a reduced power output (mitigation gun). No ramp-up procedure will be required at the start of the next survey line. Table 7-1 outlines the measures that will be taken to avoid or mitigate environmental impacts. All crew members, including support crew, will be made aware of the standards and controls applicable to the conduct of this survey before surveying commences.

PRELIMINARY ENVIRONMENTAL IMPACT ASSESSMENT
69
Table 7-1 Summary of operational monitoring and mitigation measures for Shell’s 2013 site survey
Marine mammal and seabird observers (MMSOs)
• MMSO observations will be performed from the survey vessels on an elevated platform allowing an unobstructed view of the waters around the vessel. Whenever possible, the MMSOs will conduct observations from an outdoor platform.
• MMSOs aboard the seismic vessel will monitor for the presence of marine mammals during all daylight hours and via on board PAMs in low visibility conditions.
• MMSOs will have access to a direct communication line with the operator of the airguns.
• A safety/shut-down zone of 500 m for marine mammals will be implemented and monitored for the presence of marine mammals during all daylight hours.
Passive acoustic monitoring (PAM)
• During periods of poor visibility, the on board PAM system will be used during the pre-shooting watch period to monitor for vocalizing marine mammals within the safety zone. PAM will also be used at night and during fog.
• If any marine mammal is visually or acoustically detected within the safety zone during the pre-shooting watch period, the ramp-up will be delayed until the animal has been observed outside of the safety zone or 20 min has passed since the animal was last detected.
• PAM will also be used to shut down during acquisition.
Pre-shooting search
• A pre-shooting search of 30 min (60 min in water depths of >200 m) will be conducted before the start of any airgun operations.
Shutdown
• If any marine mammal is observed within the 500-m safety zone for cetaceans (and walruses) and other marine mammals, respectively, the airgun array will be reduced to the mitigation gun.
• A precautionary shutdown will be applied if a marine mammal is observed to be on a course that will result in its entering the shutdown zone.
Soft start
• The soft start procedure will occur over a minimum period of ~20 min. Soft start will not exceed 40 min in duration and to the extent possible will be initiated during
• daylight hours.
• The ramp-up procedure will be planned such that the start of the survey line begins immediately following the ramp-up.
• Soft starts will to the extent possible will be initiated during daylight hours.
• During periods of poor monitoring visibility, the onboard PAM system will be used during the ramp-up procedure to monitor vocalizing marine mammals within the safety zone.
• If any marine mammal is detected within the safety zone during the soft start, the airgun array will be reduced to the mitigation gun and a new ramp-up procedure will be initiated once the animal has been detected outside of the safety zone or 20 min has passed since the animal was last detected.
• If any marine mammal is detected within the safety zone while on the transect line, the airgun array will be reduced to the mitigation gun and a new ramp-up procedure will be initiated if the silent break (period between shut-down and start-up) exceeds 5 minutes or 20 min has passed since the animal was last detected. If the animal is observed outside the safety zone within 5 minutes after shut-down, the airgun array can be started at full power without ramp-up.
• If the airgun array is shut down for any reason other than marine mammals while on the transect line, the airgun array can be re-initiated at full power given that the silent break is not longer than 5 min. Otherwise, a 20-min pre-shooting search and full ramp-up procedure will need to be initiated.

PRELIMINARY ENVIRONMENTAL IMPACT ASSESSMENT
70
Line changes
• The airgun array output will be shutdown when the transit time to the next survey line is expected to be greater than 20 min.
• A 30 min (60 min in water depths of >200 m) pre-shooting search and full ramp-up procedure will be initiated prior to the start of the next survey line.
• If a transit between survey lines is expected to last less than 20 min, the airgun array can remain operational during transit, but preferably at a reduced power output (mitigation gun). No ramp-up procedure will be required at the start of the next survey line.
7.3.2 Seabirds
Systematic seabird surveys will be conducted to the maximum extent possible and by experienced seabird observers (MMSOs). Seabird observations will be undertaken using the follow the protocol outlined in the Manual for seabird and marine mammal survey on seismic vessels in Greenland on vessels that include MMSOs. Deck lighting will be minimized (especially upward and horizontal-projecting light) to the extent that it is safe and practical to reduce the likelihood of birds stranding on Project vessels. Daily searches of Project vessels will be conducted for stranded birds. Project personnel will be made aware of bird attraction to the lights on offshore structures. However, some degree of lighting is required for safe work practices, and seismic surveying is conducted around the clock. The MMSOs will conduct daily searches of the ship, and the ship’s crew will also be notified to contact the MMSOs if a bird is found.
7.3.3 Fisheries Interactions
The BMP Guidelines state that the licensee shall, upon BMP request, include one or more Fishery Liaison Officers (FLO) in the operation. If a FLO is required, a logbook of observations will be kept. It is not anticipated that a FLO will be required considering the location of the license blocks. Vessel crews will keep a log of sightings and contacts with fishing (and other) vessels. In addition, a log will be kept of any unused fishing or other equipment removed from the sea for the purpose of clearing a path for the survey vessels. The log will include location, date, type of equipment, and any identifying marks. No hunting or fishing will be permitted from Project vessels or from in-going or out-going individuals while on land during crew change operations.
7.3.4 General Ship Operations Project vessels will operate in accordance with all applicable laws, standards and conditions while in Greenland waters. The impacts of vessel traffic on marine mammals will be reduced by vessels steering a straight course and maintaining constant and moderate speed (less than 14 knots) whenever possible. Shell is committed to these mitigation measures to the extent that is possible and practical for their operations. Maintaining a constant and moderate speed will reduce changes in sound levels and frequencies of engine and propeller sounds that disturb marine animals.

PRELIMINARY ENVIRONMENTAL IMPACT ASSESSMENT
71
7.3.5 Other Environmental Conditions The BMP’s Application Guidelines /2/ also note requirements related to other environmental conditions and considerations:
• When acquiring seismic data, the operation shall be conducted in accordance with the Best Practices listed in the BMP guidelines
• All non-degradable materials and structures shall be removed upon termination of the operation, unless BMP approves otherwise.
• Discharge of wastewater and kitchen waste shall be in compliance with the provisions of Annex IV and Annex V of the MARPOL Convention.
• Hunting and fishing is not permitted in connection with exploration activities, unless specific permission is given by the Greenland Government. [Note that hunting and fishing from Project vessels will not be permitted by Shell.]
• BMP may, when approving specific exploration activities, require the licensee to perform further impact studies and/or limit the operation to certain periods or from certain areas.
• Vessels engaged and machinery used in the exploration activities shall only use marine gasoil with a sulphur content less than 1.5 % (weight). Heavy fuel oil and oil with a sulphur content >1.5 % must not be used.
Shell will comply with each of these requirements (as described above) and will brief Project personnel about these and all other environmental commitments and requirements during in-person start up meetings before survey start (expected July 2013).
7.3.6 Reporting
Marine mammal and seabird observation databases, along with a monitoring report, will be submitted to BMP and DCE within two months of completion of the seismic program. If a fisheries liaison officer is requested onboard, a logbook of observations will also be reported to BMP.
7.4 Communications Engagement with local communities will take place before, during, and after the seismic operations to ensure that community concerns are heard and acted upon wherever possible. Other aspects of Shell’s communication approach are provided below.
• Shell staff will be present in Greenland to maintain close relationships with stakeholders and to respond to potential issues.
• A grievance mechanism will be established, offering various ways (e.g., telephone, email, personal contact) to enable local stakeholders to contact Shell directly to ensure timely resolution of concerns and complaints.
• Shell will continue to communicate with other operators during the planning and operation phases to avoid interactions and minimize impacts.
• Shell will contact the DCE prior to survey start to ensure that its monitoring and mitigation plan for marine mammals and seabirds meets DCE protocols.
• Shell will be available to meet with local stakeholders after the proposed survey program to present the findings of the marine mammal and seabird monitoring program.
• To make sure that all survey personnel are aware of the environmental issues and mitigation measures that will be applied for the 2013 survey, Shell environmental and Project management personnel will hold a meeting with the survey vessel crews and managers before the start of the program to ensure full compliance.
PRELIMINARY ENVIRONMENTAL IMPACT ASSESSMENT
72
7.5 Unplanned Events As part of Shell’s application for permission, Shell will submit to BMP a description of the safety management system and bridging documents for the health, safety, security, and environmental management systems in a separate document to this EIA, no later than 40 days prior to the anticipated survey start. These documents will include roles and responsibilities of all parties in the event of an emergency or accident during the 2013 program, including an Emergency Response Plan, Spill Response Plan that will include bunkering procedures to be used, and an Ice Management Plan. The following measures will also reduce the likelihood of an unplanned event.
• Vessel contractors will be made aware of relevant national legislation and guidelines, as well as follow International Maritime Organization best practices and guidelines such as Guidelines for Ship Operating in Polar Waters.
• Drills are a regulatory requirement and are carried out at regular intervals during which the oil spill response kit is checked. These oil spill drills encompass bunkering in port and at sea and machinery leaks, and form a part of the emergency onboard drills matrix.
BMP and Shell shall be notified immediately of any significant accidental event, including loss of life, missing persons, serious injury, fire, oil spill, and any threat to the personnel or the safety of the survey vessel. Any spills or unplanned releases will also be recorded and reported to appropriate authorities.

PRELIMINARY ENVIRONMENTAL IMPACT ASSESSMENT
73
8. REFERENCES
/1/ Greenland Self-Government. 2009. Greenland Parliament Act of 7 December 2009 on mineral resources and mineral resource activities (the Mineral Resources Act).
/2/ Bureau of Minerals and Petroleum (BMP). 2011. Guidelines for Application, Execution and Reporting of Offshore Hydrocarbon Exploration Activities (Excluding Drilling) in Greenland.
/3/ Danish Centre of Environment and Energy (DCE). 2011. Guidelines to environmental impact assessment of seismic activities in Greenland waters, 3rd revised edition.
/4/ Danish Centre of Environment and Energy (DCE) and Bureau of Minerals and Petroleum (BMP). 2012. Manual for seabird and marine mammal survey on seismic vessels in Greenland.
/5/ Shell Kanumas A/S (ERM). 2011. Environmental Impact Asessement, High resolution seismic site survey 2011.
/6/ Shell Kanumas A/S (Grontmij & LGL). 2012. Environmental Impact Asessement, 2012 Anu-Napu 3-D Seismic Survey in Baffin Bay Blocks 5 and 8.
/7/ Oil and Gas Producers (OGP). 2011. Guidelines for the conduct of offshore drilling hazard site surveys, Report No. 373-18-1.
/8/ Oljeindustriens Landsforening (OLF). 2012. Veiledning til den Årlige Utslippsrapporteringen.
/9/ Boertmann, D. and Mosbech, A. (eds.) 2011. Eastern Baffin Bay - A strategic environmental impact assessment of hydrocarbon activities. Scientific Report no 9, from Danish Centre for Environment and Energy. 270 pp.
/10/ National Environmental Research Institute. 2011. Environmental oil spill sensitivity atlas for the Northern West Greenlant (72º-75º N) coastal zone. NERI Technical Report no. 828.
/11/ Richardson, W. J., Greene, C. R. Jr., Malme, C. I., and Thomson, D. H. 1995. Marine mammals and noise. Academic Press, New York.
/12/ McCauley, R.D., Fewtrell, J., Duncan, A.J., Jenner, C., Jenner, M.-N., Penrose, J.D., Prince, R.I.T., Adhitya, A., Murdoch, J. and McCabe, C. 2000. Marine Seismic Surveys: Analysis and Propagation of Air Gun Signals; and Effects of Air-Gun Exposure on Humpback Whales, Sea Turtles, Fishes and Squid. Report on research conducted for The Australian Petroleum Production and Exploration Association.
/13/ Madsen, P.T., 2005. Marine mammals and noise: problems with root mean square sound pressure levels for transients. Journal of the Acoustical Society of America 117, 3952-3957.
/14/ Genesis. 2011. Review and Assessment of Underwater Sound Produced from Oil and Gas Sound Actibities and Potential Reporting Requirements under the Marine Strategy Framework Directive. Genesis Oil and Gas Consultants report for the Department of Energy and Climate Change – J71656.
/15/ Madsen, P. T., Wahlberg, M., Tougaard, J., Lucke, K., and Tyack, P. 2006. Wind turbine underwater noise and marine mammals:implications of current knowledge and data needs. Marine Ecolology Progress Series 309: 279-295.
/16/ Wyatt, R. 2008. Joint Industry Programme on Sound and Marine Life Review of Existing Data on Underwater Sounds Produced by the Oil and Gas Industry. Seiche Measurements Limited – S186 (1).
/17/ OSPAR, 2009. Overview of the impacts of anthropogenic underwater sound in the marine environment OSPAR Convention for the Protection of the Marine Environment of the North-East Atlantic (www.ospar.org).
/18/ Grønland Statistik. 2012. Grønlands energiforbrug 2011. Energy 2012-01.
/19/ Valeur, H.V., Hansen, C., Hansen, K.Q., Rasmussen, L. and Thingvad, N. 1996. Weather, sea and ice conditions in eastern Baffin Bay, offshore Northwest Greenland. A review. DMI Technical Report No. 96–12.
/20/ Sejr, M.K., Batty, P., Josefson, A., Blicher, M.E., Hansen, J. & Rysgaard, S. 2010. Survey of macrobenthic invertebrates in the eastern Baffin Bay including estimates of biochemical activity and

PRELIMINARY ENVIRONMENTAL IMPACT ASSESSMENT
74
PAH levels in the sediment. Report from National Environmental Research Institute and Greenland Institute of Natural Resources, 28 pp.
/21/ Blicher, M., Josefson, A., Batty, P., Schiedek, D., Sejr, M.K., Hansen, J. & Rysgaard, S. 2008. Cruise report, benthic fauna in ecological key areas along the coast of Northwest Greenland. Greenland Institute of natural Resources, National Environmental Research Institute.
/22/ Mannvik, H-P., Wassbotn, I. & Cochrane, S., 2011. Miljøundersøkelse i Region IX og X Barentshavet 2010. Akvaplan-niva report no. 5000-03, 169 p + appendix.
/23/ Thomson, D. H., 1982. Marine Benthos in the Eastern Canadian High Arctic: Multivariate Analyses of Standing Crop and Community Structure. Arctic, Vol. 35, NO. 1, P. 61-74.
/24/ Neulinger, S., 2009. Cold-water reefs. Retrieved from http://www.coralscience.org/main/articles/climate-a-ecology-16/cold-water-reefs
/25/ Christiansen, S., 2010. Background Document for Deep-sea sponge aggregations. Ospar Commission Biodiversity series.
/26/ Christian, J.R., Mathieu, A., Thomson, D.H., White, D., and Buchanan, R.A., 2003. Effects of Seismic Energy on Snow Crab (Chionoecetes opilio). Report from LGL Ltd. and Oceans Ltd. for the National Energy Board, File No.: CAL-1-00364, 11 April 2003.
/27/ Jørgensen O. A., Hvingel, C. Møller, P. R. & Treble, M. 2005. Identification and mapping of bottom fish assemblages in Davis Strait and Southern Baffin Bay. – Can. J. Fish. Aquat. Sci. 62: 1833-1852.
/28/ Kalmijn, A. J. 1988. Hydodynamic and acoustic field detection, in Sensory biology of aquatic animals, edited by J. Atema, R. Fay, A. Popper, and W. Tavolga (Springer-Verlag, New York): 83-131.
/29/ Fay, R. R., and Popper, A. N. 1974. Acoustic stimulation of ear of goldfish (Carrassius auratus). Journal of Experimental Biology 61: 243-260.
/30/ Blaxter, J., Denton, E. J., Gray, J. A. B. 1981. Acousticolateralis system in clupeid fishes. In: Tavolga, WN, Ray, RR (Eds.). Hearing and sound communication in fishes. Springer-Verlag, New York, pp 39-56.
/31/ Enger, P. 1967. Hearing in herring. Comp. Biochem. Physiol., 22:527-538.
/32/ Buerkle, U. 1967. An audiogram of the Atlantic cod, Gadu morhua L. J. Fish. Res. Bd. Cananda, 24, 2309-2319
/33/ Chapman, C.J. and Hawkins, A.D. 1973. A field study of hearing in the Cod, Gadus morhua L. Journal of comparative physiology, 85: 147-167
/34/ Wahlberg, M., Westerberg, H. 2003. Sounds produced by herring (Clupea harengus) bubble release. Aquatic Living Resources. 16: 271-275.
/35/ Finstad, J. L., Nordeide, J. T. 2004. Acoustic repertoire of spawning cod, Gadus morhua. Environmental Biology of Fishes. 70: 427-433.
/36/ Thomsen, F., Mueller-Blenkle, C. Gill, A., Metcalfe, J., McGregor, P. K., Bendall, V., Andersson, M. H., Sigray, P., and Wood, D. 2012. Effects of Pile-driving on the Behavior of Cod and Sole. A.N. Popper and A. Hawkins (eds.), The Effects of Noise on Aquatic Life, Advances in Experimental Medicine and Biology 730. Springer Science+Business Media, LLC 2012.
/37/ Halvorsen, M. B. Casper, B. M., Woodley, C. M. Carlson, T. J., Popper, A. N. 2011. Predicing and mitigating hydroacoustic impacts on fish from pile installations. NCHRP Research Results Digest 363, Project 25.28, National Cooperative Highway Research Program, Transportation Research Board, National Academy of Sciences, Washington, D. C.
/38/ Encyclopedia of Earth. Eds. Cutler J. Cleveland (Washington, D.C.: Environmental Information Coalition, National Council for Science and the Environment). [First published in the Encyclopedia of Earth July 23, 2010; Last revised Date May 21, 2011; Retrieved January 11, 2013. www.eoearth.org.
/39/ Heide-Jørgensen, M.P., P. Richard, R. Dietz, K.L. Laidre, J. Orr, and H.C. Schmidt. 2003a. An estimate of the fraction of belugas (Delphinapterus leucas) in the Canadian High Arctic that winter in West Greenland. Polar Biol. 26:318–326.

PRELIMINARY ENVIRONMENTAL IMPACT ASSESSMENT
75
/40/ IUCN 2012. IUCN Red List of Threatened Species. Version 2012.2. <www.iucnredlist.org>. Downloaded on 11 January 2013.
/41/ Jefferson, T.A., M.A. Webber, and R. Pitman. 2008. Marine Mammals of the World: A Comprehensive Guide to their Identification. Academic Press, London. 573 p.
/42/ Reeves, R.R. and M.P. Heide-Jørgensen. 1996. Recent status of bowhead whales, Balaena mysticetus, in the wintering grounds off West Greenland. Polar Res. 15 (2):115–125.
/43/ Richardson, W.J., C.R. Greene Jr., C.I. Malme, and D.H. Thomson. (1995). Marine Mammals and Noise. Academic Press, San Diego. 576 p.
/44/ Finley, K.J., G.W. Miller, R.A. Davis, and C.R. Greene. (1990). Reactions of belugas, Delphinapterus leucas and narwhals Monodon monoceros, to icebreaking ships In: T.G. Smith, D.J. St. Aubin and J. Geraci (eds.), Advances in research on the Beluga whale, (Delphinapterus leucas). Can. Bull. Fish. Aquat. Sci. 224:97-117.
/45/ Fay, F.H., B.P. Kelly, P.H. Genhrich, J.L. Sease, and A.A. Hoover. (1984). Modern populations, migrations, demography, trophics, and historical status of the Pacific walrus. Outer Cont. Shelf Environ. Assess. Program, Final Rep. Principal. Invest., NOAA, Anchorage, AK 37:231–376. 693 p. OCS Study MMS 86-0021; NTIS PB87-107546. 693 p.
/46/ Au, W. W. L. 1993. The sonar of dolphins. Springer-Verlag, New York.
/47/ Møhl, B., Surlykke, A.,Miller, L.A. 1990. High intensity narwhal clicks. Sensory abilities of cetaceans. J. A. Thomas, Kastelein, R. A. New York, Plenum Press.
/48/ Finneran, J. J., Carder, D. A., Dear, R., Belting, T., McBain, J., Dalton, L., Ridgway, S. H. 2005. Pure tone audiograms and possible aminoglycoside-induced hearing loss in belugas (Delphinapterus leucas). Journal of the Acoustical Society of America 117(6): 3936-3943.
/49/ Mooney, T.A., Nachtigall, P. E., Castellote, M., Taylor, K. A., Pacini, A. F., Esteban, J-A. 2008. Hearing pathways and directional sensitivity of the beluga whale, Delphinapterus leucas. Journal of Experimental Marine Biology and Ecology. 362: 108-116.
/50/ Kastelein, R. A., Janssen, M., Verboom, W. C., Haan, D. de 2005. Receiving beam patterns in the horizontal plane of a harbour porpoise (Phocoena phocoena). Journal of the Acoustical Society of America 118(2): 1172-1179.
/51/ Sjare, B. L., Smith, T. G. 1986a. The Vocal Repertoire of White Whales, Delphinapterus-Leucas Summering in Cunningham Inlet, Northwest-Territories.Canadian Journal of Zoology-Revue Canadienne De Zoologie. 64(2): 407-415.
/52/ Marcoux, M., Auger-Méthé, M., Humphries,M. M. 2012. Variability and context specificity of narwhal (Monodon monoceros) whistles and pulsed calls. Mar. Mam. Sci. 28(4): 649-665.
/53/ Parks, S. E., Ketten, D. R., O’Malley, J. T., Arruda, J. 2007. Anatomical Predictions of Hearing in the North Atlantic Right Whale. The Anatomical Record. 290: 734-744.
/54/ Tervo, O. M., Parks, S. E., Miller, L.A. 2009. Seasonal changes in the vocal behaviour of bowhead whales (Balaena mysticetus) in Disco Bay, Western-Greenland. J. Acoust. Soc. Am. 126(3): 1570-1580.
/55/ Kastelein, R. A., Mosterd, P., van Santen, B., Hagedoorn, M., de Haan, D. 2002. Underwater audiogram of a Pacific walrus (Odobenus rosmarus divergens) measured with narrow-band frequency-modulated signals. J. Acoust. Soc. Am. 112(5): 2173-2182.
/56/ Møhl, B. 1968. Auditory sensitivity of the common seal in air and water. The Journal of Auditory Research 8: 27-38.
/57/ Kastak, D., Schusterman, R. J. 1998. Low-frequency amphibious hearing in pinnipeds: Methods, measurements, noise and ecology. Journal of the Acoustical Society of America 103(4): 2216-2228.
/58/ Terhune, J.M. 1988. Detection thresholds of a harbour seal to repeated underwater high-requency, short-duration sinusoidal pulses. Can. J. Zool., 66:1578-1582.
/59/ Van Parijs, S. M., Lydersen, C., Kovacs, K. M. 2003. Vocalizations and movements suggest alternative mating tactics in male bearded seals. Animal Behaviour 65: 273-283.

PRELIMINARY ENVIRONMENTAL IMPACT ASSESSMENT
76
/60/ Southall, B., Bowles, A. E., Ellison, W. T., Finneran, J. J., Gentry, R. L., Greene, C. R. Jr., Kastak, D., Ketten, D. R., Miller, J. H., Richardson, W. J., Thomas, J. A., Tyack, P. L. 2007. Marine mammal noise exposure criteria: initial scientific recommendations. Aquatic mammals 33(4).
/61/ NMFS. 2003. Taking marine mammals incidental to conducting oil and gas exploration activities in the Gulf of Mexico. Federal register 68, 9991-9996.
/62/ Ketten, D. R. 2012. Marine Mammal Auditory system Noise Impacts: Evidence and Incidence. A.N. Popper and A. Hawkins (eds.), The Effects of Noise on Aquatic Life, Advances in Experimental Medicine and Biology 730. Springer Science+Business Media, LLC 2012.
/63/ Finneran, J. J., Schlundt, C. E., Dear, R., Carder, D. A., Ridgway, S. H. 2002. Temporary shift in masked hearing thresholds in odontocetes after exposure to single underwater impulses from a seismic watergun. J. Acoust. Soc. Am. 111(6): 2929-2940.
/64/ Moore, B. C. J. 2012. An Introduction to the Psychology of Hearing. Sixth edition. Emerald Group Ltd.
/65/ DHI. 2011. Modelling of Underwater Noise from Seismic Survey in Aruba - Report for WorleyParsons Spain. Hørsholm DHI in cooperation with ODS.
/66/ Gabrielsen, G. W., Taylor, J. R. E., Konarzewski, M. and Mehlum, F. 1991. Field and Laboratory Metabolism and Thermoregulation in Dovekies (Alle alle). Auk 108, 71-78.
/67/ Stempniewicz, L. 2001. BWP Update. Oxford Univ. Press, Oxford. BVP Update.
/68/ Wilson, L. J., Bacon, P. J., Bull, J., Dragosits, U., Blackall, T. D., Dunn, T. E., Hamer, K. C., Sutton, M. A. and Wanless, S. 2004. Modelling the spatial distribution of ammonia emissions from seabirds in the UK. Environmental Pollution 131, 173-185
/69/ Pedersen, C. E. and Falk, K. 2001. Chick diet of dovekies Alle alle in Northwest Greenland. Polar Biology 24, 53-58.
/70/ Falk, K., Pedersen, C. E. and Kampp, K. 2000. Measurements of diving depth in Dovekies (Alle alle). Auk 117, 522-525.
/71/ Egevang, C., Boertmann, D., Mosbech, A. and Tamstorf, M. P. (2003): Estimating colony area and population size of little auks Alle alle at Northumberland Island using aerial images. Polar Biology 26, 8-13.
/72/ Stemp, R. (1985): Observations on the effects of seismic exploration on seabirds. p. 217-233 In: G.D. Greene, F.R. Engelhardt, and R.J. Peterson (eds.), Proceedings of workshop on effects of explosives use in the marine environment. Cdn. Oil and Gas Admin., Env. Prot. Branch, Tech. Rep. No. 5. Ottawa.
/73/ Evans, P.G.H., Lewis, E.J. and Fisher, P. (1993): A study of the possible effects of seismic testing upon cetaceans in the Irish Sea. Rep. by Sea Watch Foundation, Oxford, to Marathon Oil UK Ltd. Aberdeen. 35 p.
/74/ Merkel, F.R. and Johansen, K.L. (2011): Light-induced bird strikes on vessels in south west Greenland. Marine Pollution Bulletin 62:2330-2336.
/75/ Abgrall, P. and R.E. Harris. 2011. Marine mammal and seabird monitoring of Shell Kanumas A/S’s 2011 2-D seismic site survey off West Greenland. LGL Rep. TA8067. Rep. by LGL Limited, King City, ON, Canada, for Shell Kanumas A/S, Naerum, Denmark. 43 p.
/76/ Siegstad, H. 2012. Biologisk rådgivning 2013 – rejer. Biological advice on shrimp fishery 2013. Announcement no. 20.00-11/2012 from Greenland Institute of Natural resources, dated 29. October 2012.
/77/ Siegstad, H. 2012. Powerpoint presentation of fisheries advice downloaded from Greenland Institute of Natural resources web page 13.01.13.
/78/ Engås, A., Løkkeborg, S., Ona, E., Soldal, A.V. 1996. Effects of seismic shooting on local abundance and catch rates of cod (Gadus morhua) and haddock (Melanogramma aeglefinus). Can. J. Fish. Sci. 53: 2238-2249

PRELIMINARY ENVIRONMENTAL IMPACT ASSESSMENT
77
/79/ Løkkeborg, S., Ona, E., Vold, A., Pena, H., Salthaug, A., Totland, B., Øvredal, J.T., Dalen, J., Handegard, N.O. 2010. Effekter av seismiske undersøkelser på fiskefordeling og fangstrater for garn og line i Vesterålen sommeren 2009. Fisken og Havet no. 2-2010, 74 sider [In Norwegian]
/80/ Parry G.D. & A. Gason 2006. The effect of seismic surveys on catch rates of rock lobsters in western Victoria, Australia. Fish. Res. 79: 272–284
/81/ Pedersen, G., Midtgard, M.R. & V. Øiestad 2003. Alvorlige oljeutslipp – konsekvenser for fiskemarkedet. Extensive oil spills and the effects on the fish market. Akvaplan-niva rapport 2578, 68 pp. Norwegian and English version.
/82/ Vold, A., Løkkeborg, S., Tenningen, M., & J. Saltskår 2009. Analyse av innsamlede fangstdata for å studere effekter av seismiske undersøkelser på fiskeriene i Lofoten og Vesterålen sommeren 2008. Fisken og havet nr. 5 - 2009. 47 pp. [In Norwegian]
/83/ Vollen, T & O.T. Albert 2008. Pelagic behavior of adult Greenland halibut (Reinhardtius hippoglossoides). Fish. Bull. 106:457–470.
/84/ Stempniewicz, L. 2001. BWP Update. Oxford Univ. Press, Oxford. BVP Update.
/85/ Grønlands statistik. 2013. www.stat.gl (accessed 4/2/2013)
/86/ Joint Arctic Command (telephone conversation, January 17th 2013)
/87/ Spence, J., R. Fisher, M. Bahtiarian, L. Boroditsky, N. Jones, and R. Dempsey. 2007. Review of existing and future potential treatments for reducing underwater sound from oil and gas industry activities. Rep. by Noise Control Engineering Inc., for Joint Industry Programme on E&P Sound and Marine Life.
/88/ Urick, Robert J. 1983. Principles of Underwater Sound, 3rd Edition. New York. McGraw-Hill.
/89/ Lucke, K., Siebert, U., Lepper, P. A., Blanchet, M. A. 2009. Temporary shift in masked hearing thresholds in a harbor porpoise (Phocoena phocoena) after exposure to seismic airgun stimuli. Journal of the Acoustical Society of America 125(6): 4060-4070.
/90/ Tougaard, J., Kyhn, L. A., Amundin, M., Wennerberg, D., Bordin, C. 2012. Behavioural reactions of Harbour Porpoise to Pile-Driving Noise. A.N. Popper and A. Hawkins (eds.), The Effects of Noise on Aquatic Life, Advances in Experimental Medicine and Biology 730. Springer Science+Business Media, LLC 2012.
/91/ Brandt MJ, Diederichs A, Betke K, Nehls G (2011) Responses of harbour porpoises to pile driving at the Horns Rev II offshore wind farm in the Danish North Sea. Mar Ecol Prog Ser 421:205–216.
/92/ Miller, G. W., Moulton, V. D., Davis, R. A., Holst, M., Millman, P., MacGillivray, A., et al. (2005). Monitoring seismic effects on marine mammals – southeastern Beaufort Sea, 2001-2002. In S. L. Armsworthy, P. J. Cranford, & K. Lee (Eds.), Offshore oil and gas environmental effects monitoring: Approaches and technologies (pp. 511-542). Columbus, OH: Battelle Press.

PRELIMINARY ENVIRONMENTAL IMPACT ASSESSMENT
1
APPENDIX 1 INTRODUCTION TO UNDERWATER SOUND

PRELIMINARY ENVIRONMENTAL IMPACT ASSESSMENT
2
For a better understanding of the technical terms used in this report, this Appendix will provide a short introduction into underwater sound. Sound in water is a travelling wave in which particles of the medium are alternately forced together and then apart. The sound can be measured as a change in pressure within the medium, which acts in all directions, described as the sound pressure. The unit for pressure is Pascal (Newton per square metre). Each sound wave has a pressure component (in Pascals) and a particle motion component indicating the displacement (metres), the velocity (metres per second) and the acceleration (metres per second2) of the molecules in the sound wave. Depending on their receptor mechanisms, marine life is sensitive to either pressure or particle motion or both. The pressure can be measured with a pressure sensitive device such as a hydrophone (an underwater microphone). Due to the wide range of pressures and intensities and taking the hearing of marine life into account, it is customary to describe these using a logarithmic scale. The most generally used logarithmic scale for describing sound is the decibel scale (dB). The sound pressure level (SPL) of a sound is given in decibels (dB) by equation 1:
SPL (in dB) = 20 log10 (P/P0) where P is the measured pressure level and P0 is the reference pressure. The reference pressure in underwater acoustics is defined as 1 micropascal (µPa). As the dB value is given on a logarithmic scale, doubling the pressure of a sound leads to a 6 dB increase in sound pressure level. As the reference pressure for measurements in air is 20 µPa, and water and air differ acoustically, the dB levels for sound in water and in air cannot be compared directly. Most animals, including marine mammals, are sensitive to sound pressure. On the other hand fish and many invertebrates are also sensitive to the local particle motion of the sound field. Measurements of Sound A sound wave can be analysed and measured in several different ways. Figure 1 illustrates the different measurement units.
Figure A1-1 Waveform of a sine-wave with indications of the different measurement units.
0
0
Time (ms)
Pre
ssur
e (P
a)
p-p0-p
SEL
RMS

PRELIMINARY ENVIRONMENTAL IMPACT ASSESSMENT
3
The four different measurement units depicted in Figure 1 are:
• Zero-to-peak’ (peak) – dB p; the interval from zero to the maximum amplitude of the signal.
• ‘Peak-to-peak’ (peak-to peak) – dB p-p; the interval from the lowest to the highest amplitude of the signal.
• ‘Root-mean-square-pressure level (RMS) – dB rms; the square root of the average squared signal pressure divided by the duration of the signal. This term is synonymous for sound pressure level.
• ‘Sound-exposure-level (SEL) – dB AE/dB SEL; the total energy content of the signal, measured by integrating the squared signal pressures over time.
All these measures are made on the pressure waveform of the signal. The re-calculation into decibels transforms the values into relative measures of intensity or energy. For a simple sine-wave with signal duration ~ 100 ms, peak-to-peak levels will be the highest, followed by zero-to-peak, RMS, and finally SEL. However, if the duration is longer than 1 s, the SEL-level will be higher than the RMS level. Peak and peak-to-peak sound pressure values refer to the amplitude of a given sound and are therefore not dependent on the choice of time window as are the RMS and SEL measures. They are suited for the description of short impulsive sounds such as airguns. In hearing studies the stimulus is often a pure tone measured with RMS, and therefore thresholds are often given in sound pressure levels. When calculating detection distances it is therefore easiest to use the sound pressure level of the signal to compare with the audiogram. SEL-values are calculated by measuring the sound energy of a signal with reference to a 1 µPa RMS signal of duration 1 s (see above). SEL is given in the unit dB re 1 µPa2s. For transient sounds it is not sufficient to only report an RMS level, as both the peak and the RMS level is important when assessing the effects on animals. Further, the choice of time window for calculating the average is strongly affecting the resulting RMS level (Madsen 2005). Therefore, the choice of time window should always be reported. However, the RMS is often the only measurement available in many reports. In the following, the presented values are given in RMS units with unknown choice of time window.

PRELIMINARY ENVIRONMENTAL IMPACT ASSESSMENT
0
APPENDIX 2 ACOUSTIC MODELLING

PRELIMINARY ENVIRONMENTAL IMPACT ASSESSMENT
1
1. EXECUTIVE SUMMARY
2D seismic surveys are to take place at up to ten locations in Baffin Bay (West Greenland) in the summer of 2013. The surveys will be restricted to areas (3x3 km) around proposed drilling sites and will occur at depths of 500 – 800 m. 2 D seismic surveys go along with sound pressure levels that have the potential to impact marine life (marine mammals and fish) at the site and in adjacent areas. We present the results of an acoustic propagation modelling study of the expected noise exposure from the planned 2D seismic surveys to be included in the supplied EIA. The model is based on actual bathymetry information covering the entire area and basic knowledge of sediment properties. We also used detailed data on the vertical sound speed profiles during the time of the proposed survey (July – October). Horizontally, our model intends to cover all areas exposed to levels likely to affect marine mammals. Different from previous investigations, we also include frequencies above 2 kHz in the modelling to better match the acoustic sensitivity of some of the marine life in the area.
Based on information about the airgun array that will be used and literature data we used a zero to peak source sound pressure level of 230 dB re 1 µPa as the input variable in this study. The resulting peak to peak source sound pressure level was defined as 236 dB re 1 µPa. For the frequency spectrum we used a modelled far-field signature and the corresponding frequency spectrum of a representative array and scaled it to meet the source strength identified for this study. Based on the derived spectrum, the resulting broadband SEL level was 214 dB re µPa2·s. RMS values were directly derived from SEL values and resulted in a source sound pressure level of 227 dB re 1 µPa. The calculation of the sound levels at different distances from the sources was undertaken for frequencies up to 4 kHz using a 2D numerical model of the underwater acoustic propagation. For this we used the well-established AcTUP package. We applied the RAMGEO code which is a full Parabolic Equation model.
For the quantitative assessment of impact ranges, we have chosen several criteria for marine mammals and fish derived from a variety of sources. The used NMFS criteria are part of the US regulation. Applicable are also the initial scientific recommendations on marine mammal noise exposure criteria as developed by a group of US experts. Recent work on fish has resulted in evidence based criteria for this taxa that we have applied directly.
The results of the modelling show a sharp decrease of sound levels in the first km from the source and a smoother decline in sound pressure levels at a longer range. Higher frequencies than 1 kHz where attenuated more rapidly than those below 1 kHz although not as drastically as expected. Furthermore, the difference in propagation loss across sites was very small indicating that results obtained here can be transferred somewhat to other sites if the development is relocated.
For the 2D high resolution surveys TTS will be limited to areas close to the source (80 m in cetaceans and 40 m in for pinnipeds). The onset of behavioural response can be expected in all three cetacean species at distances of approx. 6 km from the source with little difference between the sites. For seals, behavioural responses are only expected at close ranges (40 m).
For fish, the onset of any behavioural reactions can take place at a maximum distance of 59 km.
Looking at the cumulative sound fields (sound over a 24 h period including the survey), it is clear that impact ranges can be larger than for single shots. Yet, the assumption that the acoustic energy just sums up at the receiver in the way suggested by the calculations, neglects that hearing might recover between pulses. Thus, the overall impact from the survey over the course of a one-day cycle might be smaller than indicated in the cumulative maps.

PRELIMINARY ENVIRONMENTAL IMPACT ASSESSMENT
2
2. INTRODUCTION
2D seismic surveys are to take place at up to ten locations in Baffin Bay (West Greenland) in the summer of 2013. The surveys will be restricted to areas (3x3 km) around proposed sites and will occur at depths of 500 – 800 m. The surveys will be restricted to areas (3x3 km) around the proposed drilling sites. 2D seismic surveys go along with sound pressure levels that have the potential to harm marine life (i.e. marine mammals and fish) at the site and in adjacent areas (for a review of seismic survey impacts refer to OSPAR, 2009). According to the BMP guidelines (see Kyhn et al., 2011), the areas where sound might impact marine life shall be modelled. This should include an estimate of the source levels included in the model and the numerical modelling of the propagation loss from source to a distance out where impacts are negligible. The modelling will make use of internationally accepted units (peak SPL, SEL etc.). The results of the modelling shall be included in the impact assessment on marine mammals and fish.
2.1 Aims Here we present a model of the expected noise exposure from 3 locations areas located in the prospect areas for drilling in Baffin Bay to be included in the supplied EIA. The model is based on actual bathymetry information covering the entire area and basic knowledge of sediment properties. We also used detailed data on the vertical sound speed profiles during the time of the proposed survey (July – October). Horizontally, our model intends to cover all areas exposed to levels likely to affect marine mammals (see noise exposure criteria in the EIA report and Southall et al. 2007).
The seismic noise propagation model will result in sound levels at different ranges and depths from the airgun array (depths relevant for the species in the area). Noise levels presented in the model are:
• zero-to-peak sound pressure levels referenced to 1 μPa (zero-peak), • Peak-to-peak sound pressure levels referenced to 1 μPa (peak-peak), • rms sound pressure levels referenced to 1 μPa (rms measured over 90% of pulse
duration, as defined by Madsen, 2005; in the following this will be referred to the sound pressure level following the terminology suggested by TNO, 2011)
• Sound exposure levels (SEL1) referenced to 1 μPa2·s per pulse.
For the assessment of cumulative effects also the cumulated sound exposure level (across all airgun pulses) per 24 hours is being presented.
Modelling will cover all biologically relevant parts of the frequency spectrum as much as these frequencies carry any substantial distance out from the source.
3. METHODS
3.1 Model areas and environmental conditions The modelling of the 2D surveys shall be performed at three locations in Baffin Bay shown in Table A2-1 and in Figure A2-1. These locations were the initially proposed survey sites but can be viewed as representative for similar conditions (nearby location and similar water depth) in the licensing blocks.
1 The sound exposure level (SEL) is often used in the assessment of noise impact on the sea environment and is a measure of the total energy of the noise normalised to 1 second.

PRELIMINARY ENVIRONMENTAL IMPACT ASSESSMENT
3
Table A2-1 Overview of the three survey locations (E = Easting; N = Northing).
Location Designation Coordinates (WGS84/UTM21N)
Location 1 E: 370700, N: 8274502
Location 2 E: 360764, N: 8248717
Location 3 E: 343898, N: 8181657
Figure A2-1 Overview of the three locations for which the modelling of the 2D seismic surveys was undertaken (green circles are chosen for better visibility only).

PRELIMINARY ENVIRONMENTAL IMPACT ASSESSMENT
4
Based on previous investigations and literature data on the assumed sound spread (see for example OSPAR, 2009), it was assumed that the modelling area should at least include areas 150 km away from the source in all directions. We thus chose 10 azimuth traces with a length of 150 km each (depending on coastal barriers). An example of the bathymetric profile around one location is shown in Figure A2-2 (see also chapter 7.1). It is clear from the plots that study area (= survey area and 150 km radius around each source) is diverse and covers marine landscapes of several hundred to app. 2,500 metres of water depths.
Figure A2-2 3-D bathymetric profile of source location 1 ( source SRTM-30 geographic grid interpolated onto a 1 km x 1 km grid in UTM-21 coordinates; note that resolution mesh in the figures does not correspond to the actual resolution, but is only shown for reference; blue line = shore line; length of each trace is 150 km )
With regards to the sound speed profile, measurements undertaken by Shell in Baffin Bay Blocks 5 – 8 clearly show a rather uniform profile during that time of the year (Figure A2-3). We therefore took the average of each measurement at defined water depth intervals to arrive at an idealized plot for the survey time. Water depth > 700 m were extrapolated from the measurements.
The lowest sound speed in the water column is observed at depth ~70 m. Since sound rays bent towards regions of lower sound speed, the minimum in the profile acts as an acoustic waveguide, known as the Deep Sound Channel, in which energy from a source near the minimum may be trapped, allowing it to propagate with little loss to very large ranges; as much as several thousand kilometres. The axis of the deep sound channel is between the deep isothermal region and the mixed layer of almost constant temperature due to wind and wave activity.

PRELIMINARY ENVIRONMENTAL IMPACT ASSESSMENT
5
Figure A2-3 Measured sound speed profiles in Baffin Bay Blocks 5 – 8 during July - October 2012
The geoacoustic data was derived from Henriksen et al., 2000 from a representative cross-section of Baffin as well as from data gathered by Codispoti et al., 1968. The layers used in the modelling and the main parameters are depicted in Table A2-2.
0
100
200
300
400
500
600
700
1430 1440 1450 1460 1470 1480W
ater
Dep
th (
m)
Speed of Sound in Water m/sec
All Profiles Overlay
VSP1_DESCENT VSP1_ASCENTVSP2_DESCENT VSP2_ASCENTVSP3_DESCENT VSP3_ASCENTVSP4_DESCENT VSP4_ASCENTVSP5_DECENT VSP5_ASCENTVSP6_DESCENT VSP7_DESCENTVSP7_ASCENT VSP8_DESCENTVSP8_ASCENT VSP9_DESCENTVSP10_DESCENT VSP11_DESCENTVSP11_ASCENT VSP12_DESCENT

PRELIMINARY ENVIRONMENTAL IMPACT ASSESSMENT
6
Table A2-2 Overview of seabed geoacoustic profile used for the modelling (Cp = compressed wave speed, α = compressional attenuation, p = density).
Seabed layer (m) Material Geoacoustic property
0 – 20 Mud and clay Cp = 1600 m/s
α = 0.2 dB/λ
Ρ = 1.80 g/cm3
20 – 160 Glacial deposits and coarse sediments
Cp = 1700 m/s
α = 1.05 dB/λ
Ρ = 1.80 g/cm3
160 Glacial deposits and coarse sediments
Cp = 2000 m/s
α = 0.85 dB/λ
Ρ = 2.05 g/cm3
3.2 Survey parameters
The proposed activities for 2013 involve 2D high resolution seismic survey. In a 2D seismic survey, the vessel follows lines or a grid where the lines are a certain distance apart. One sound source is used, which is composed of several airguns to form an air gun array, and one hydrophone cable.
Figure A2-4 Schematic diagram for a 2D seismic survey. The vessel tows a sound source and a receiver cable with hydrophones. P=pressure waves. S=shear waves. (DNV 2007)
The following more detailed information on the survey design was acquired from the client.

PRELIMINARY ENVIRONMENTAL IMPACT ASSESSMENT
7
Table A2-3 Main parameters of the 2 D survey
Survey information Parameter
Type of survey (2D etc.) 2DHR
Start and end dates of each survey Earliest start 15/7/2013; survey period is July – October 2013
Expected duration Max 4 Weeks on site
Duty cycle of operation (in hours/24 hours) 24 Hours
Survey outline Survey lines are 100 m apart (cross lines every 250 m)
Array specification 4x40” sleeve gun array
Array positioning Source Depth 2.5m; Streamer Depth 2.5m
Firing rate in shots/sec Shot point interval 6.25 m at 4 knots (1 shot per 3.125 s) 0.32 shot/sec (total ~13 h)
Operation speed of the vessel in km/hours or
knots.
4 kn
3.3 Noise modelling
Air-gun arrays are designed to produce a single downward-directed impulse that propagates through the water column and into the seabed. Unavoidably, some sound energy also radiates horizontally from the array creating a complex radiation pattern. The presence of multiple propagation paths involving surface and bottom bounces as well as the re-radiation of sound reverberating within sub bottom layers increases the complexity of the received signal and can give rise to long reverberant wave forms of several seconds at long ranges.
3.3.1 Source information The 2D survey that has to be assessed here is a site survey used to investigate the proposed locations for drilling. The surveys are similar to conventional 2D seismic surveys, except that the source used is comprised of a smaller volume of compressed air such as in this case with the overall 160 cubic inches involving only four airguns. Since the source is relatively simple, the directivity of the array was taken to be omni-directional providing the same noise radiation in all azimuth angles. This is a conservative approach as it will most likely lead to overestimation of the noise field in some cases.
Looking at the source strength, Genesis, 2011 and Wyatt, 2008, provide a comprehensive review of a variety of airguns and airgun arrays. According to their analysis, the emitted sound field is a function mainly of the size and the number of airguns and the overall emitted psi values (see Figure A2-5).

PRELIMINARY ENVIRONMENTAL IMPACT ASSESSMENT
8
Figure A2-5 Comparison of measured and calculated air gun SPL in relation to airgun volume (from Wyatt, 2008).
As can be seen in Figure A2-5, the SPL below 500 cubic inches lie somewhere between 200 and 250 dB re 1 µPa. According to Ainslie, 2010, the zero to peak dipole source level of a 0.7 L 40 in3
small gun was 224 dB re 1µPa at 1 m2. A medium gun (2.5 – 1.0 L and 150 – 250 in3 ) had a zero to peak dipole source level of 229 – 230 dB re 1 µPa. The latter represents the proposed volume for the Baffin Bay survey and as a conservative measure the higher zero to peak value of 230 dB re 1 µPa should be used in this study. The differences between the zero to peak values and the peak to peak values were set at 6 dB resulting in a peak-to-peak source sound pressure level of 236 dB re 1 µPa for the array (see Genesis, 2011).
For the frequency spectrum we used a modelled far-field signature and the corresponding frequency spectrum for frequencies up to 1 kHz of a representative array (see DHI, 2011) and scaled it to meet the source strength identified for this study. We decided to include frequencies of up to 4 kHz as it has been shown that they can, in some circumstances contribute to the noise levels and considerable distances, and also because the marine mammals subject to the assessment are sensitive in this frequency range (see Madsen et al., 2006). For frequencies above 1 kHz, the source spectrum was extrapolated assuming a 18 dB / octave slope (see, for example Wyatt, 2008). The resulting spectrum is shown in Figure A2-6.
2 The sound source level is defined as the effective level of sound at a nominal distance of 1 meter. dB re. µPa. at 1 m.

PRELIMINARY ENVIRONMENTAL IMPACT ASSESSMENT
9
Figure A2-6 1/3 Octave frequency spectrum of seismic survey array far field signature.
Based on the derived spectrum, the resulting broadband SEL level was 214 dB re µPa2·s. This corresponds well with measurements. Genesis, 2011 lists zero-to-peak and SEL values for a variety of airguns and airgun arrays, and based on their review it can be seen that on average the SEL values are about 20 dB below the zero-to-peak values. RMS values can then be derived from SEL values following
𝑆𝑃𝐿𝑟𝑚𝑠 = 𝑆𝐸𝐿 + 10 log10𝑇1𝑇2
(8.1)
where 𝑇1 = 1 s (reference duration for SEL values) and 𝑇2 = duration of the seismic pulse, in our case 50 ms (see review OSPAR, 2009).
After this formula, RMS values could be derived by adding 13 dB to the corresponding SEL values. The differences between the peak and the peak-to-peak value were set at 6 dB.
Table A2-4 Summary of source levels for the 4 x 40 in3 airgun array used in the acoustical modelling
Variable Dimension
Peak-to-Peak source sound pressure level 236 dB re 1 µPa
Zero-to-peak source sound pressure level 230 dB re 1 µPa
Source sound pressure level 227 dB re 1 µPa
Sound exposure level at 1 m 214 dB re 1 µPa2·s
For the present study, the array layout was comparably simple. We thus opted for a conservative approach with the directivity of the seismic array defined as omnidirectional, i.e. the same noise radiated in all azimuth angles.

PRELIMINARY ENVIRONMENTAL IMPACT ASSESSMENT
10
3.3.2 Sound propagation modelling The calculation of the sound levels at different distances from the sources was undertaken for frequencies up to 4 kHz using a numerical model of the underwater acoustic propagation. For this end we used the well-established AcTUP package (Duncan and Maggi, 2006). We applied the RAMGeo code which is a full Parabolic Equation model. RAMGeo is based on the RAM3 approach and was developed by Collins (1993) applying Padé series expansion. RAMGeo accounts for the change in speed of sound in the water column.
The sea surface is treated as a simple, perfectly reflecting boundary modelled as a pressure-release boundary. For a realistic treatment of seabed effect on wave propagation in the ocean, it is necessary to include absorption in the bottom material. The model includes propagation in the bottom seabed, but only handles compression waves (ocean bottom sediments modelled as fluids) not shear waves. Besides accounting for attenuation constants in the bottom layers, it is important to include density changes at the water-bottom interface as well as within the bottom itself for a realistic treatment of bottom effects on propagation. A simplified bottom description based on a number of constant-density layers was used. The lower boundary condition involves termination of the physical solution domain by an artificial absorption layer of several wavelengths thickness so as to ensure that no significant energy is reflected from the lower boundary. The absorption layer is modelled with a complex index of the refraction model.
The sound source properties of the airgun array were combined with the propagation model to calculate the sound propagation in discrete angular directions of the seismic array at 10 2D transects. We modelled specific 1/3 octave bands from 10 Hz to 4 kHz that are most relevant for the marine mammal species in the area. Based on our calculations we will provide exemplary maps of the sound pressure field as a function of distance (full maps in Appendix A). These ‘noise maps’ will be used for the impact assessment in the next step. In total, we have 3 positions of the seismic survey vessel and calculate the sound spread for each position (e.g. 3 noise events simulated times 10 acoustic propagation transects = 30 calculations).
As the three most important species in the region (walrus, beluga whale and narwhal) spend most of their time in the upper water column, the receiver depth4 was set at 20 m in the modelling of the transmission loss of the 1/3 octave frequencies.
The Range-dependent Acoustic Model simulations were carried out based on the following simplified conditions and specific assumptions:
• The sea surface is treated as a simple, horizontal perfectly reflecting boundary ignoring the sea states, where in addition to waves the upper ocean will have an infusion of air bubbles which has a significant impact on the speed of sound in the surface part of the water column. Furthermore, the ocean surface of the area of investigation is assumed to be completely free of ice including the present of a partial ice cover and ice floes.
• The code is a 2D model ignoring 3D effects due to horizontal refraction of sound rays reflected by a sloped sea bottom. E.g. when the sea floor is shoaling, as is the case for the ocean over a sloping beach and the continental slope, and around seamounts and islands, a ray travelling obliquely across the slope experiences the phenomenon of horizontal refraction.
• Effects of underwater ambient noise and masking are not addressed in the model. • Airguns arranged in arrays are tuned to focus sharply pulsed pressure downward into the
ground. Thus energy emission and propagation in the horizontal are reduced. In the present numerical model the source is modelled as a point source, which is omni-directional. At low-frequencies, below a few hundred Hz, the sound source characteristics of an airgun appear omni-directional, however, each airgun becomes more multipolar with higher frequency. The extent of the airgun array and the directionality of the sound source are ignored in the noise propagation simulations.
3 Range-dependent Acoustic Model (RAM) 4 Note the reported levels are at a constant water depth and is not the maximum value in the water column at each discrete distance from the sound source.

PRELIMINARY ENVIRONMENTAL IMPACT ASSESSMENT
11
The simplifications are expected to lead to a conservative estimate of the sound levels.
The spatial discretisation used in the finite difference model is defined in terms of the wavelength being modelled. Hence the simulations take into account sensitivity to frequency components. The radial resolution is
𝑑𝑟 = 𝛼𝜆 (8.2)
and the depth resolution is then defined as
𝑑𝑧 = 𝛽 𝑑𝑟 (8.3)
The modelling was carried out with the following discretisation for the different frequency domains.
Table A2-5 Spatial discretisation parameters for different frequency regions
Frequencies 𝛂 𝛃 Number of Padé tems
1 Hz - 50 Hz 140
2 8
51 Hz - 200 Hz 110
2 8
201 Hz - 1000 Hz 15 2 8
1001 Hz - 4000 Hz 15 2 8
In the sound propagation simulation at frequencies above 1 kHz the effect of the bathymetry surrounding the source is ignored.
3.4 Threshold values For the quantitative assessment of impact ranges, we have chosen several criteria for marine mammals and fish that have been derived from a variety of sources (see NMFS, 2003; Southall et al., 2007; Halvorsen et al., 2011). The NMFS criteria are part of the US regulation (except, to our knowledge, the behaviour criteria), although depicting pulsed sounds in rms sound pressure levels is not without its problems (see discussion by Madsen, 2005). The NMFS criteria are based on the assumption that received levels that are lower than these criteria will not injure animals or impair their hearing abilities but higher received levels may have some effects. We have interpreted these criteria as the onset of TTS also noting the relative low values. Applicable are the initial scientific recommendations on marine mammal noise exposure criteria as developed by a group of US experts (Southall et al., 2007). Recent work on fish has resulted in evidence based criteria for this taxa (Halvorsen et al., 2011).
Table A2-6 provides an overview of noise exposure criteria for marine mammals and fish that have been used in this assessment.

PRELIMINARY ENVIRONMENTAL IMPACT ASSESSMENT
12
Table A2-6 Marine mammal and fish noise exposure criteria used in the quantitative assessment (PTS = Permanent threshold shift; a permanent elevation of the hearing threshold in certain frequencies. TTS = Temporary threshold shift; a temporary elevation of the hearing threshold in certain frequencies.
Source Effect Taxa Sound type Sound pressure level /SEL
NMFS, 2003 Start of hearing effects - TTS
Cetaceans Airgun pulses 180 dB re 1µPa
Start of hearing effects - TTS
Pinnipeds Airgun pulses 190 dB re 1µPa
Southall et al., 2007
PTS Cetaceans (3hearing classes)
Single - multiple pulse
230 dB re 1µPa peak
PTS Cetaceans (3 hearing classes)
Single - multiple pulse
SEL 198 dB re 1µPa2-s (Mlf, Mmf, Mhf)
PTS Pinnipeds (in water)
Single pulse - multiple pulse
218 dB re 1µPa peak
PTS Pinnipeds (in water)
Single pulse - multiple pulse
SEL 186 dB re 1µPa2-s (Mlf, Mmf, Mhf)
TTS Cetaceans (3 hearing groups)
Single pulses 224 dB re 1µPa peak
TTS Cetaceans (3 hearing groups)
Single pulses 183 dB re 1µPa2-s SEL (Mlf, Mmf, Mhf)
TTS Pinnipeds (in water)
Single pulses 212 dB re 1µPa peak
TTS Pinnipeds (in water)
Single pulses 171 dB re 1µPa2-s SEL (Mpw)
Finneran et al. 2002
TTS Pinnipeds in water Single pulses 226 dB re 1µPa peak to peak
Halvorsen et al. 2011
PTS / Physical damage
Fish Single pulses 206 dB re 1µPa peak
Halvorsen et al. 2011
TTS Fish Single pules 187 dB re 1µPa2-s SEL
Southall et al. 2007
Response Cetaceans (Beluga, narwhal, bowhead whale)
Single pulses 160 dB re 1µPa
Southall et al. 2007
Response Cetaceans (Beluga, narwhal, bowhead whale)
Single pulses 2 D seismic surveys / echosounder sidesecan sonar
140 dB re 1µPa2·s / 140 dB re 1µPa
Thomsen et al., 2012
Response Marine fish (based on experiments on sole and cod)
Multiple pulses 140 dB re 1µPa peak
Southall et al. 2007
Response Seals Multiple pulses 190 dB re 1µPa

PRELIMINARY ENVIRONMENTAL IMPACT ASSESSMENT
13
4. RESULTS
The following section presents the results of the simulations. First we present a brief description of how the different values are determined, followed by tabulated ranges to threshold values and finally exemplary plots of the sound propagation.
The following section presents the results of the simulations. First we present a brief description of how the different values are determined, followed by tabulated ranges to threshold values and finally exemplary plots of the sound propagation.
4.1 Sound levels The output from the modelling in AcTUP is the Transmission loss (TL) 1/3 octave per frequency band
𝑇𝐿𝑓 = −20 log10𝑝𝑟𝑒𝑐𝑖𝑣𝑒𝑑𝑝𝑠𝑜𝑢𝑟𝑐𝑒
[dB] (8.4)
This transmission loss is then used to determine the received SEL (𝑆𝐸𝐿𝑅) at any distance by subtracting the TL from the source level according to (8.5).
𝑆𝐸𝐿𝑅 = 10 log10 �� 100.1 𝑆𝐸𝐿𝑓𝑆𝑅𝐶−0.1 𝑇𝐿𝑓
𝑓
� (8.5)
Where 𝑆𝐸𝐿𝑓𝑆𝑅𝐶 is the SEL for each 1/3 octave band with the centre frequency 𝑓. See source spectrum in Figure A2-6.
The M-weighted SEL is found as
𝑆𝐸𝐿 = 10 log10 �� 100.1 𝑆𝐸𝐿𝑓−0.1 𝑀(𝑓)
𝑓
� (8.6)
where the weighting factor is determined as
𝑀(𝑓) = −20 log10 �𝑓2𝑓ℎ𝑖2
(𝑓2 + 𝑓𝑙𝑜2)(𝑓2 + 𝑓ℎ𝑖2 )� (8.7)
where the cut-off frequencies are as listed in Table 3.1.
The weighting curves are plotted in Table A2-7.
Table A2-7 Functional hearing groups and associated auditory bandwidths (Southall et al. 2007)
Functional hearing group Estimated auditory bandwidth
𝒇𝒍𝒐 𝒇𝒉𝒊
Low-frequency Cetaceans (LFC) 7 Hz 22 kHz
Mid-frequency Cetaceans (MFC) 150 Hz 160 kHz
High-frequency Cetaceans (HFC) 200 Hz 180 kHz
Pinnipeds (PINN) 75 Hz 75 kHz
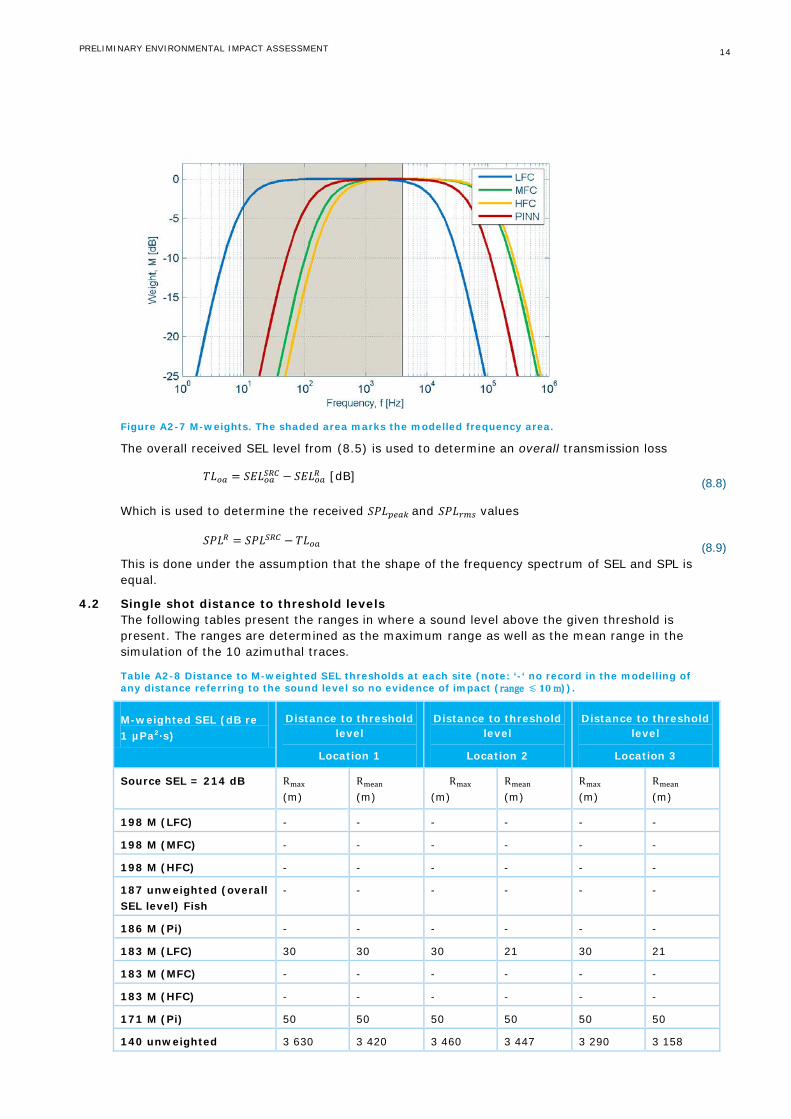
PRELIMINARY ENVIRONMENTAL IMPACT ASSESSMENT
14
Figure A2-7 M-weights. The shaded area marks the modelled frequency area.
The overall received SEL level from (8.5) is used to determine an overall transmission loss
𝑇𝐿𝑜𝑎 = 𝑆𝐸𝐿𝑜𝑎𝑆𝑅𝐶 − 𝑆𝐸𝐿𝑜𝑎𝑅 [dB] (8.8)
Which is used to determine the received 𝑆𝑃𝐿𝑝𝑒𝑎𝑘 and 𝑆𝑃𝐿𝑟𝑚𝑠 values
𝑆𝑃𝐿𝑅 = 𝑆𝑃𝐿𝑆𝑅𝐶 − 𝑇𝐿𝑜𝑎 (8.9) This is done under the assumption that the shape of the frequency spectrum of SEL and SPL is equal.
4.2 Single shot distance to threshold levels The following tables present the ranges in where a sound level above the given threshold is present. The ranges are determined as the maximum range as well as the mean range in the simulation of the 10 azimuthal traces.
Table A2-8 Distance to M-weighted SEL thresholds at each site (note: ‘-‘ no record in the modelling of any distance referring to the sound level so no evidence of impact (range ≲ 𝟏𝟎 m)).
M-weighted SEL (dB re 1 µPa2·s)
Distance to threshold level
Location 1
Distance to threshold level
Location 2
Distance to threshold level
Location 3
Source SEL = 214 dB Rmax (m)
Rmean (m)
Rmax (m)
Rmean (m)
Rmax (m)
Rmean (m)
198 M (LFC) - - - - - -
198 M (MFC) - - - - - -
198 M (HFC) - - - - - -
187 unweighted (overall SEL level) Fish
- - - - - -
186 M (Pi) - - - - - -
183 M (LFC) 30 30 30 21 30 21
183 M (MFC) - - - - - -
183 M (HFC) - - - - - -
171 M (Pi) 50 50 50 50 50 50
140 unweighted 3 630 3 420 3 460 3 447 3 290 3 158

PRELIMINARY ENVIRONMENTAL IMPACT ASSESSMENT
15
Table A2-9 Distance to SPL thresholds at each site
𝑺𝑷𝑳 (dB re 1 µPa)
Distance to threshold level
Location 1
Distance to threshold level
Location 2
Distance to threshold level
Location 3
Source 𝐒𝐏𝐋 = 𝟐𝟐𝟕 𝐝𝐁
Rmax (m)
Rmean (m)
Rmax (m)
Rmean (m)
Rmax (m)
Rmean (m)
200 - - - - - -
190 40 40 40 40 40 40
180 80 71 70 70 80 71
170 130 121 130 121 130 122
160 230 230 250 234 250 235
150 5 800 4 413 5 890 5 595 6 090 5 487
140 30 410 24 602 33 040 29 218 32 850 27 890
130 116 340 77 470 100 700 84 508 104 610 81 051
120 >150 0005 >150 000 >150 000 >150 000 >150 000 >150 000
Table A2-10 Distance to peak SPL thresholds at each site
Peak 𝑺𝑷𝑳𝟎𝑷 (dB re 1 µPa)
Distance to threshold level
Location 1
Distance to threshold level
Location 2
Distance to threshold level
Location 3
Source 𝐒𝐏𝐋𝟎𝐏 = 𝟐𝟑𝟎 𝐝𝐁 Rmax (m)
Rmean (m)
Rmax (m)
Rmean (m)
Rmax (m)
Rmean (m)
230 - - - - - -
218 - - - - - -
224 - - - - - -
212 - - - - - -
206 - - - - - -
200 - - - - - -
190 50 50 50 50 50 50
180 90 81 90 86 90 90
140 52 550 38 216 58 990 45 486 49 170 41 207
5 Modelling area extends 150 000 m. No SPL levels below 120 dB was recorded, hence the notation >150 000

PRELIMINARY ENVIRONMENTAL IMPACT ASSESSMENT
16
Table A2-11 Distance to peak SPL thresholds at each site
Peak 𝑺𝑷𝑳𝑷𝑷 (dB re 1 µPa)
Distance to threshold level
Location 1
Distance to threshold level
Location 2
Distance to threshold level
Location 3
Source 𝐒𝐏𝐋𝐏𝐏 = 𝟐𝟑𝟔 𝐝𝐁 Rmax (m)
Rmean (m)
Rmax (m)
Rmean (m)
Rmax (m)
Rmean (m)
230 - - - - - -
218 - - - - - -
224 - - - - - -
212 - - - - - -
206 - - - - - -
200 40 40 40 40 40 40
190 70 70 70 70 70 70
180 120 120 120 120 120 120
140 69 236 69 228 100 650 79 743 98 680 72 402
4.3 Singe shot frequency dependent propagation loss The subsequent section presents exemplary plots of the SEL from the simulations. In the transect contour plots the noise penetration into the seabed is not shown, although the phenomenon is included in the calculations.
The first plot presents the SEL in terms of the overall SEL as well as the four M-weighted SEL. The second figure is a zoom on the first kilometre. This reveals the very rapid attenuation of the sound levels within the first couple of hundred meters.
The third figure shows the source SEL frequency spectrum together with the received spectrum at 1 km, 5 km, 10 km, 50 km and 100 km from the source.
The fourth and final plot shows a two-dimensional transect of the SEL. The shaded area indicates the seabed.
We have chosen a single direction for each of the three locations, with different development in the bathymetry for illustration purposes.
4.3.1 Location 1: Direction 144 °N
Figure A2-8 SEL along trace

PRELIMINARY ENVIRONMENTAL IMPACT ASSESSMENT
17
Figure A2-9 SEL along the first kilometre of the trace
Figure A2-10 Source SEL frequency spectrum together with the received spectrum at 1 km, 5 km, 10 km, 50 km and 100 km from the source
Figure A2-11 Two-dimensional transect of overall SEL along trace

PRELIMINARY ENVIRONMENTAL IMPACT ASSESSMENT
18
4.3.2 Location 2: Direction 252 °N
Figure A2-12 SEL along trace
Figure A2-13 SEL along the first kilometre of the trace
Figure A2-14 Source SEL frequency spectrum together with the received spectrum at 1 km, 5 km, 10 km, 50 km and 100 km from the source

PRELIMINARY ENVIRONMENTAL IMPACT ASSESSMENT
19
Figure A2-15 Two-dimensional transect of overall SEL along trace
4.3.3 Location 3: Direction 72 °N
Figure A2-15 SEL along trace
Figure A2-16 SEL along the first kilometre of the trace

PRELIMINARY ENVIRONMENTAL IMPACT ASSESSMENT
20
Figure A2-17 Source SEL frequency spectrum together with the received spectrum at 1 km, 5 km, 10 km, 50 km and 100 km from the source
Figure A2-18 Two-dimensional transect of overall SEL along trace
4.4 Single shot noise maps
The noise maps for single shots are shown in Appendix B. It can be seen that the sound is not spreading omnidirectional due to the interactions with the bathymetry including sound absorption and propagation in the seabed. It is visible too; that the sound is degrading to relatively low levels close to receiver, although it will most likely be audible to marine life over the entire license block area with 105 dB re 1 µPa2 ·s most likely exceeding ambient noise levels in most cases. It is visible also that the horizontal sound spread differs across regions but that the overall distribution of received sound exposure levels looks very similar between the three locations.

PRELIMINARY ENVIRONMENTAL IMPACT ASSESSMENT
21
4.5 Cumulative SEL maps Cumulative SEL has been used to assess the noise exposure for marine mammals exposed to multiple pressure pulses from the airgun array, with resulting impact ranges larger than for single shot.
As there are no other surveys occurring in 2013, only the Shell survey has been used to calculate the cSEL levels.
The cumulative sound exposure is calculated as
𝑆𝐸𝑐𝑢𝑚 = 𝑆𝐸𝐿𝑠𝑖𝑛𝑔𝑙𝑒 + 10 log10 𝑛 (8.10)
where n is the number of shots fired during a period of 24 hours at a single location. n=15,000. Hence the cumulative sound exposure level is 41.7 dB higher than the single shot SEL.
The maps for the cumulative footprint of the survey are shown in Appendix C. The horizontal spread of the sound is identical to the broadband levels but the overall received levels are higher compared to the broadband levels for the single shot.
5. CONCLUSIONS
In the present study the noise propagation from a seismic survey at three locations in the Baffin Bay area using an air-gun array was modelled. Detail site-specific input data was used in the simulations. The modelling is done in frequency domain for all 1/3-octave band frequencies between 10 and 4000 Hz. All calculations are done on a deterministic basis, hence the model does not account for ocean dynamics due to surface waves, currents, fluctuations in the sound speed profile arising from small-scale turbulence, etc. The results presented are to be viewed in light of an ensemble averaged basis.
On average the simulations show that the sound propagation across the three locations are similar, leading to very similar results with regards to the range over which impacts on marine life might occur.
Most of the acoustic energy of the seismic airgun pluses is located well below 1 kHz with the higher frequencies attenuating more rapidly than the lower ones. As attenuation due to viscosity reduces with decreasing frequency, low frequency propagation in the Deep Sound Channel can extend over vast distances in the ocean.
From the numerical calculations it is also apparent that the transmission loss is very high over the first km from the source which is in principal in line with expectations (see Jensen et al., 2011), although the level of decrease over the first few hundred meters is very high. In the far field, the sound propagates with much less loss compared to the near field.
As the difference between the three sites show very little variation in sound exposure level it is expected that the results obtained here very likely can be transferred somewhat to other sites if the development is relocated.
As expected, the computations show that the cumulative sound6 results in higher impact ranges than for single shots. Yet, the assumption that the acoustic energy just sums up at the receiver in the way suggested by Southall et al., 2007, neglects that hearing might recover between pulses. Thus, the overall impact from the survey over the course of a one-day cycle might be smaller than indicated in the cumulative maps.
6 A result of the total sound energy over the whole survey period released in 1 second

PRELIMINARY ENVIRONMENTAL IMPACT ASSESSMENT
22
6. REFERENCES Ainslie, M.A., 2010. Principles of sonar performance modellingSpringer in association with Praxis Publishing Chichester, UK.
Codispoti, L.A., Kravitz, J.H., Collins, M.D., 1968. Oceanographic Cruise Summary, Baffin Bay-Davis Strait-Labrador Sea, Summer 1967. Informal rept. 3 Sep-14 Oct 1967 Naval Oceanographic Office NSTL Station, MS
Collins, M. D. 1993. A split-step Pad´e solution for the parabolic equation method. The Journal of the Acoustical Society of America, 93(4), 1736–1742.
DHI, 2011. Modelling of Underwater Noise from Seismic Survey in Aruba - Report for WorleyParsons Spain. DHI in cooperation with ODS, Hørsholm
Duncan, A.J., Maggi, A.I., 2006. A Consistent, user friendly Interface for Running a Variety of Underwater Acoustic propagation Codes. Proceedings of ACOUSTICS 2006.
Genesis, 2011. Review and Assessment of Underwater Sound Produced from Oil and Gas Sound Activities and Potential Reporting Requirements under the Marine Strategy Framework Directive Genesis Oil and Gas Consultants Report for Department of Energy and Climate Change, Aberdeen.
Halvorsen, M.B., Casper, B.M., Woodley, C.M., Carlson, T.J., Popper, A.N., 2011. Predicting and mitigating hydroacoustic impacts on fish from pile installations. NCHRP Research Results Digest 363, Project 25-28, National Cooperative Highway Research Program, Transportation Research Board (available at http://www.trb.org/Publications/Blurbs/166159.aspx). National Academy of Sciences, Washington.
Henriksen, N., Higgins, A.K., Kalsbeek, F., Christopher; T., Pulvertaft, R., 2000. Greenland from Archaean to Quaternary Descriptive text to the Geological map of Greenland, 1:2 500 000. Geology of Greenland Survey Bulletin(185), 1-93.
Jensen, F.B., Kuperman, W.A., Porter, M., B.,, Schmidt, H., 2011. Computational Ocean Acoustics, Second Edition Springer, New York, Dordrecht, Heidelberg, London.
Kyhn, L.A., Boertmann, D., Tougaard, J., Johansen, K., Mosbech, A., 2011. Guidelines to environmental impact assessment of seismic activities in Greenland waters. Danish Centre for Environment and Energy, Roskilde.
Madsen, P.T., 2005. Marine mammals and noise: problems with root mean square sound pressure levels for transients. Journal of the Acoustical Society of America 117, 3952-3957.
Madsen, P.T., Johnson, M., Miller, P.J.O., Aguilar Soto, N., Lynch, J., Tyack, P., 2006. Quantitative measures of air gun pulses recorded on sperm whales (Physeter macrocephalus) using acoustic tags during controlled exposure experiments. Journal of the Acoustical Society of America 120(4), 2366-2379.
NMFS, 2003. Taking marine mammals incidental to conducting oil and gas exploration activities in the Gulf of Mexico, Federal register 68, 9991-9996.
OSPAR, 2009. Overview of the impacts of anthropogenic underwater sound in the marine environmentOSPAR Convention for the Protection of the Marine Environment of the North-East Atlantic (www.ospar.org).
Southall, B.L., Bowles, A.E., Ellison, W.T., Finneran, J.J., Gentry, R.L., Greene, C.R.J., Kastak, D., Ketten, D.R., Miller, J.H., Nachtigall, P.E., Richardson, W.J., Thomas, J.A., Tyack, P., 2007. Marine mammal noise exposure criteria: initial scientific recommendations. Aquatic Mammals 33, 411-521.
Thomsen, F., Mueller-Blenkle, C., Gill, A., Metcalfe, J., McGregor, P., Bendall, V., Amdersson, M., Sigray, P., Wood, D., 2012. Effects of pile driving on the Behavior of Cod and Sole. In: Hawkins, A., Popper, A.N. (Eds.), Effects of Noise on Aquatic Life Springer, New York, pp. 387-389.
TNO, 2011. Standard for measurement and monitoring of underwater noise, part 1: physical quantities and their units In: Ainslie, M.A. (Ed.). TNO, Den Haag
Wyatt, R., 2008. Review of Existing Data on Underwater Sounds Produced by the Oil and Gas Industry. Joint Industry Programme on Sound and Marine Life, London.
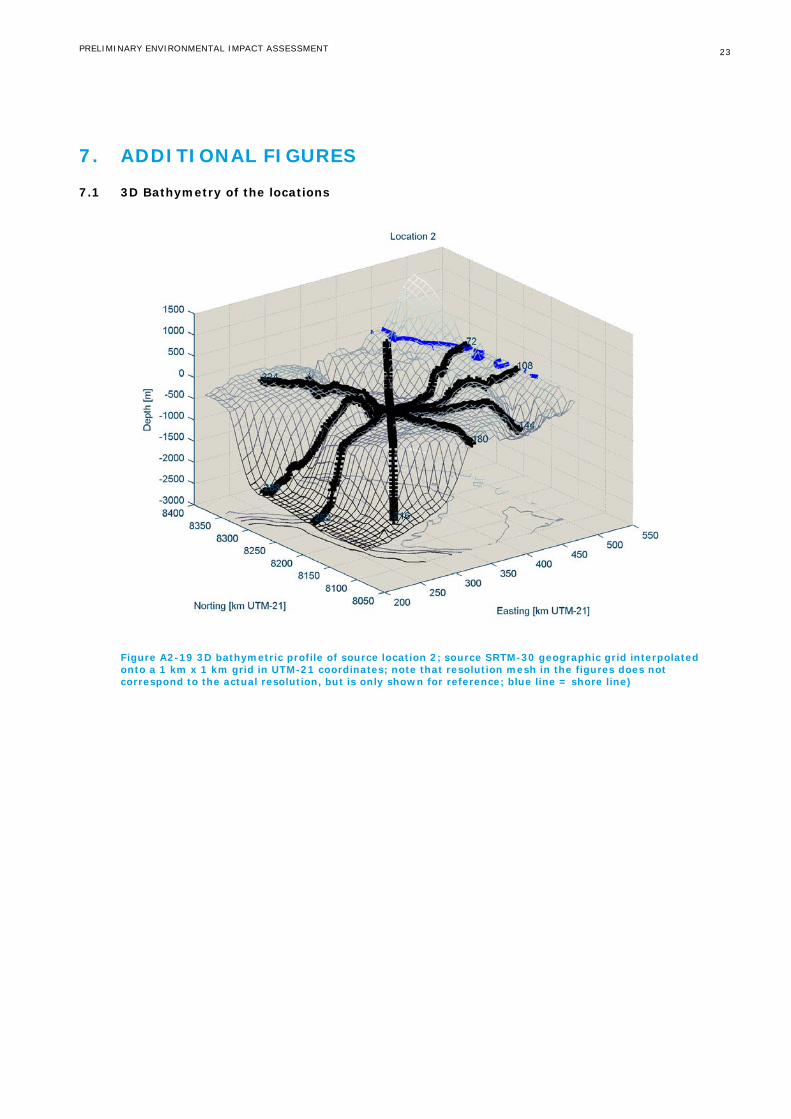
PRELIMINARY ENVIRONMENTAL IMPACT ASSESSMENT
23
7. ADDITIONAL FIGURES
7.1 3D Bathymetry of the locations
Figure A2-19 3D bathymetric profile of source location 2; source SRTM-30 geographic grid interpolated onto a 1 km x 1 km grid in UTM-21 coordinates; note that resolution mesh in the figures does not correspond to the actual resolution, but is only shown for reference; blue line = shore line)

PRELIMINARY ENVIRONMENTAL IMPACT ASSESSMENT
24
Figure A2-20 3D bathymetric profile of source location 3 source SRTM-30 geographic grid interpolated onto a 1 km x 1 km grid in UTM-21 coordinates; note that resolution mesh in the figures does not correspond to the actual resolution, but is only shown for reference; blue line = shore line)

PRELIMINARY ENVIRONMENTAL IMPACT ASSESSMENT
25
7.2 Noise maps for single shots
Figure A2-21 Broadband SEL levels at location 1 measured in dB re µPa2·s

PRELIMINARY ENVIRONMENTAL IMPACT ASSESSMENT
26
Figure A2-22 Broadband SEL levels at location 2 measured in dB re µPa2·s

PRELIMINARY ENVIRONMENTAL IMPACT ASSESSMENT
27
Figure A2-23 Broadband SEL levels at location 3 measured in dB re µPa2·s

PRELIMINARY ENVIRONMENTAL IMPACT ASSESSMENT
28
7.3 Noise maps cumulative SELs
Figure A2-24 Cumulative SEL at location 1 measured in dB re µPa2·s

PRELIMINARY ENVIRONMENTAL IMPACT ASSESSMENT
29
Figure A2-25 Cumulative SEL at location 2 measured in dB re µPa2·s

PRELIMINARY ENVIRONMENTAL IMPACT ASSESSMENT
30
Figure A2-26 Cumulative SEL at location 3 measured in dB re µPa2·s

PRELIMINARY ENVIRONMENTAL IMPACT ASSESSMENT
31
7.4 Noise maps peak-to-peak SPLs
Figure A2-27 Peak-to-peak SPL at location 1

PRELIMINARY ENVIRONMENTAL IMPACT ASSESSMENT
32
Figure A2-28 Peak-to-peak SPL at location 2

PRELIMINARY ENVIRONMENTAL IMPACT ASSESSMENT
33
Figure A2-29 Peak-to-peak SPL at location 3

PRELIMINARY ENVIRONMENTAL IMPACT ASSESSMENT
34
7.5 Noise maps rms SPLs
Figure A2-30 rms SPL at location 1

PRELIMINARY ENVIRONMENTAL IMPACT ASSESSMENT
35
Figure A2-31 rms SPL at location 2
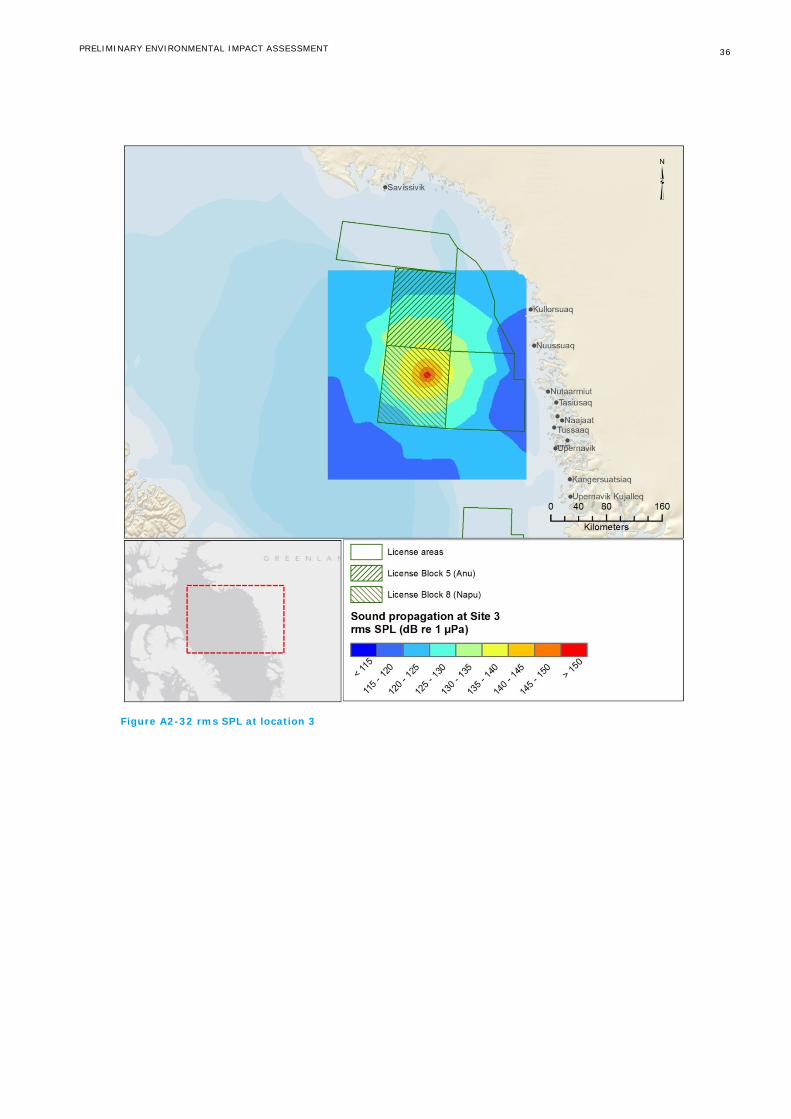
PRELIMINARY ENVIRONMENTAL IMPACT ASSESSMENT
36
Figure A2-32 rms SPL at location 3

PRELIMINARY ENVIRONMENTAL IMPACT ASSESSMENT
1
APPENDIX 3 SUMMARY OF CALCULATIONS FOR ESTIMATES OF PERCENTAGE OF POPULATIONS AND NUMBER OF INDIVIDUALS EXPOSED TO SEISMIC NOISE

PRELIMINARY ENVIRONMENTAL IMPACT ASSESSMENT
2
Estimates of animals assessed to be physiologically impacted from the seismic surveys have been assessed, providing a percentage of the population assessed to be potentially impacted. The calculation has been performed in line with the 2012 EIA, for the following species:
• Ringed seal • Narwhale (offshore) • Beluga whale • Bowhead whale • Walrus
The assessment has been made based on the population and density estimates performed for the 2012 EIA for seismic activities in the two license blocks (EIA reference /6/) and the zones of impact assessed defined in the acoustic modelling. The impact zones and subsequent estimates have been prepared without considering mitigating efforts, and therefore take a precautionary approach. As described in this EIA, for the 2D high resolution surveys TTS will be limited to areas close to the source (80 m in cetaceans and 40 m for pinnipeds). Behavioural response is expected in cetaceans (narwhals, beluga whales and bowhead whales) at ranges up to 6 km from the source, while seals are much less affected with behaviour to be expected less than 100 meters from the source. The number of ringed seal and narwhals potentially exposed to each level of seismic sounds was estimated by multiplying the impact zones by the density of animals. The estimated numbers were then divided by the population size to estimate the proportion of the population exposed.
Table A3-1 Estimates of individuals and percentage of population of ringed seal and narwhale assessed to potentially be physiologically impacted.
Density Corrected densitya
Estimated population size
Impact zone
Animals assessed to be physiologically impacted (TTS)
individuals /km2
individuals /km2
individuals km2 Individualsb Percentage of populationc
Ringed seal 1.39 228,000 0.005 7.0E-03 3.1E-06
Narwhale (offshore)
0.0026 0.0122 15,060 0.020 5.2E-05 3.5E-07
a corrected for availability bias by dividing by 0.21 (CV=0.09) b density * impact zone c impacted individuals / population * 100
Table A3-2 Estimates of individuals and percentage of population of ringed seal and narwhale assessed to potentially be behaviourally impacted.
Density Corrected density
Estimated population size
Impact zone
Animals assessed to be behaviourally impacted
individuals /km2
individuals /km2
Individuals km2 Individuals1 Percentage of population2
Ringed seal 1.39 228,000 0.005 7.0E-03 3.1E-06
Narwhale (offshore)
0.0026 0.0122 15,060 113 2.9E-01 2.0E-03
a corrected for availability bias by dividing by 0.21 (CV=0.09) b density * impact zone c impacted individuals / population * 100

PRELIMINARY ENVIRONMENTAL IMPACT ASSESSMENT
3
For the other marine mammals, only an estimate of the percentage of the population, as the distributions of these species (beluga whale, bowhead whale, walrus, and polar bear) are not expected to overlap in any substantive way with the seismic survey. The percentage was determined by dividing the impact zone by the size of the Baffin Bay Strategic Environmental Assessment Study Area. For belugas, the assessment was performed for both summer and fall. In the case of the summer beluga estimate, this number was further multiplied by 0.01 to account for the fact only 1% of the population could still occur in the Baffin Bay SEIA Study Area. When considering the fall migrating beluga estimate, this number was multiplied by 0.1 to account for the fact that only 10% of the population could still occur beyond 5 km from the coast during the migration.
Table A3-3 Estimates of percentage of population of beluga, bowhead whale and walrus assessed to potentially be behaviourally impacted.
SEIA Assessment Area
Percentage of the population available
Impact zone Animals assessed to be behaviourally impacted
km2 % km2 Percentage of populationa
Beluga whale
Summer (July–September)
163,845 1 0.020 1.2E-07
Fall (October) 163,845 10 0.020 1.2E-06 Bowhead whale 163,845 100 0.020 1.2E-05 Walrus 163,845 100 0.005 3.1E-06 a (Impact zone/Area) x percentage of the population available
Table A3-4 Estimates of percentage of population of beluga, bowhead whale and walrus assessed to potentially be behaviourally impacted.
SEIA Assessment Area
Percentage of the population available
Impact zone Animals assessed to be behaviourally impacted
km2 % km2 Percentage of populationaa
Beluga whale
Summer (July–September)
163,845 1 113 6.9E-04
Fall (October) 163,845 10 113 6.9E-03 Bowhead whale 163,845 100 113 6.9E-02 Walrus 163,845 100 0.005 3.1E-06 a (Impact zone/area) x percentage of the population available For further details regarding the calculations, please refer to the 2012 EIA for seismic activities in the two license blocks (EIA reference /6/).


![Narwhals document continued warming of southern Baffin Bay · Münchow [2006] used historical and essentially only sum-mertime data to examine evidence of warming in Baffin Bay and](https://static.fdocuments.in/doc/165x107/5d27622a88c993b7508c4f16/narwhals-document-continued-warming-of-southern-baffin-bay-muenchow-2006-used.jpg)