Baffin Bay and Kane Basin Polar Bear Subpopulations: … · Executive Summary This document serves...
23
Executive Summary This document serves as the Executive Summary for the report titled “Re-Assessment of the Baffin Bay and Kane Basin Polar Bear Subpopulations: Final Report to the Canada-Greenland Joint Commission on Polar Bear” delivered to the Canada-Greenland Joint Commission on Polar Bear on 31 July 2016. The document is hereafter referred to as “SWG 2016” (see complete citation below). The Executive Summary summarizes the content of the 14 chapters of the report, discusses key findings, and presents recommendations for future monitoring of the Baffin Bay (BB) and Kane Basin (KB) polar bear subpopulations. Report citation: SWG [Scientific Working Group to the Canada-Greenland Joint Commission on Polar Bear]. 2016. Re-Assessment of the Baffin Bay and Kane Basin Polar Bear Subpopulations: Final Report to the Canada-Greenland Joint Commission on Polar Bear. 31 July 2016: x + 636 pp. The report was prepared by S. N. Atkinson (SWG), E. W. Born (SWG), K. L. Laidre (SWG), N. J. Lunn (SWG) and Ø. Wiig (SWG) and external experts T. Arnold, M. Dyck, E. V. Regehr, H. Stern, and S. Stapleton and was edited by K. L. Laidre and N. J. Lunn. Chapter 1: Introduction The Canada-Greenland Joint Commission on Polar Bear (JC) was established with the signing of a “Memorandum of Understanding between the Government of Canada, the Government of Nunavut, and the Government of Greenland for the Conservation and Management of Polar Bear Populations” (MOU) on 30 October 2009 (Anon. 2009). Primary objectives of the MOU include to (1) manage polar bear within the Kane Basin and Baffin Bay management units in order to ensure their conservation and sustainable management into the future and (2) establish an effective system of management which will include adhering to the principles of conservation. The JC subsequently established a 5-member Scientific Working Group (SWG) to provide with scientific advice and recommendations with respect to the conservation and management of the Baffin Bay (BB) and Kane Basin (KB) polar bear subpopulations. The JC tasked the SWG with using the best available scientific information to: (1) propose Total Allowable Harvest (TAH) levels for the KB and BB subpopulations and provide the JC with a written report of its recommendations; and (2) provide science advice to the JC for monitoring the effects of habitat changes on polar bears. In May 2010 the SWG prepared a report to the JC (SWG 2010) outlining the current available information on population status. The SWG concluded that the estimates of abundance and vital rates for BB and KB were out of date. Further, population viability analysis (PVA) using these data and current harvest levels resulted in 100% of simulations projecting that both subpopulations would decline after 10 years (PBSG 2010). The SWG informed the JC that simulations are typically run no more than 10-15 years beyond the date when data were last collected, meaning the PVAs were outdated and therefore unreliable. Furthermore, the SWG
Transcript of Baffin Bay and Kane Basin Polar Bear Subpopulations: … · Executive Summary This document serves...

Executive Summary
This document serves as the Executive Summary for the report titled “Re-Assessment of the Baffin Bay and Kane Basin Polar Bear Subpopulations: Final Report to the Canada-Greenland Joint Commission on Polar Bear” delivered to the Canada-Greenland Joint Commission on Polar Bear on 31 July 2016. The document is hereafter referred to as “SWG 2016” (see complete citation below). The Executive Summary summarizes the content of the 14 chapters of the report, discusses key findings, and presents recommendations for future monitoring of the Baffin Bay (BB) and Kane Basin (KB) polar bear subpopulations.
Report citation: SWG [Scientific Working Group to the Canada-Greenland Joint Commission on Polar Bear]. 2016. Re-Assessment of the Baffin Bay and Kane Basin Polar Bear Subpopulations: Final Report to the Canada-Greenland Joint Commission on Polar Bear. 31 July 2016: x + 636 pp.
The report was prepared by S. N. Atkinson (SWG), E. W. Born (SWG), K. L. Laidre (SWG), N. J. Lunn (SWG) and Ø. Wiig (SWG) and external experts T. Arnold, M. Dyck, E. V. Regehr, H. Stern, and S. Stapleton and was edited by K. L. Laidre and N. J. Lunn.
Chapter 1: Introduction
The Canada-Greenland Joint Commission on Polar Bear (JC) was established with the signing of a “Memorandum of Understanding between the Government of Canada, the Government of Nunavut, and the Government of Greenland for the Conservation and Management of Polar Bear Populations” (MOU) on 30 October 2009 (Anon. 2009). Primary objectives of the MOU include to (1) manage polar bear within the Kane Basin and Baffin Bay management units in order to ensure their conservation and sustainable management into the future and (2) establish an effective system of management which will include adhering to the principles of conservation. The JC subsequently established a 5-member Scientific Working Group (SWG) to provide with scientific advice and recommendations with respect to the conservation and management of the Baffin Bay (BB) and Kane Basin (KB) polar bear subpopulations. The JC tasked the SWG with using the best available scientific information to: (1) propose Total Allowable Harvest (TAH) levels for the KB and BB subpopulations and provide the JC with a written report of its recommendations; and (2) provide science advice to the JC for monitoring the effects of habitat changes on polar bears.
In May 2010 the SWG prepared a report to the JC (SWG 2010) outlining the current available information on population status. The SWG concluded that the estimates of abundance and vital rates for BB and KB were out of date. Further, population viability analysis (PVA) using these data and current harvest levels resulted in 100% of simulations projecting that both subpopulations would decline after 10 years (PBSG 2010). The SWG informed the JC that simulations are typically run no more than 10-15 years beyond the date when data were last collected, meaning the PVAs were outdated and therefore unreliable. Furthermore, the SWG

2
noted potential impacts of environmental change on polar bears due to loss of sea ice, and that demographic rates could have significantly changed since the last inventories of these subpopulations in the 1990s. Given the out-of-date information on abundance and vital rates (PBSG 2010) and large-scale environmental changes observed in Baffin Bay during the last decades, the SWG recommended that new estimates of subpopulation abundance, subpopulation delineation, and vital rates be obtained for BB and KB (SWG 2010).
In preparation for initiating a full-scale subpopulation inventory of BB and KB, a pilot aerial survey was conducted over the sea ice of SE Baffin Island in spring 2010 to explore the utility of this method. From this pilot study it was concluded that aerial survey was one of several feasible options for estimating the number of polar bears in BB and KB. A report was subsequently prepared that weighed the different survey options, including recommendations on appropriate methodologies for physical mark-recapture (MR), aerial surveys, and genetic M-R (SWG 2011). The SWG concluded that physical MR was the superior approach for assessing population abundance and vital rates in BB. Aerial survey was determined to be the best approach for assessing KB. The SWG acknowledged advantages and disadvantages of both methods. Following discussion of the SWG’s report, the JC concluded that genetic MR was the preferred method for both subpopulations due to lack of endorsement by Inuit in Nunavut for the physical MR approach, and because variability in sea-ice conditions could create an unacceptable amount of risk in obtaining accurate population estimates via aerial surveys. Thereafter, the JC recommended to the signatories of the MOU that a 3-year research program for a genetic MR in BB and KB be developed.
A multi-year research program was developed by the SWG that contained three basic field components: (1) biopsy darting of polar bears to obtain genetic samples along East Baffin Island, in NW Greenland and in the Kane Basin region; (2) deployment of satellite transmitters on male and female polar bears in NW Greenland and Kane Basin; and (3) hunter collection of tissue samples from the catch of polar bears (harvest recoveries) in BB, KB and adjacent subpopulations. A 3-year study was proposed beginning in the fall of 2011 with the following objectives: 1) to estimate the abundance and sex (and approximate age) composition of polar bears in BB and KB; 2) to compare new estimates of abundance with those derived from previous studies (1991-1997), to gain insight into subpopulation trends; 3) to delineate the boundaries of the BB and KB subpopulations and reassess the validity of these areas as demographic units; 4) to estimate survival and reproductive parameters (to the extent possible) for use in population viability analyses; and 5) to evaluate polar bear distribution with respect to environmental variables, particularly ice conditions, topography and the distribution and availability of food. The current report (SWG 2016) presents the overall approach, detailed scientific methods, results and discussion of this multi-year research program.

3
Chapter 2: Population Delineation of Baffin Bay and Kane Basin
There have been no new scientific studies in BB or KB to update information on subpopulation delineation since 1997. Chapter 2 uses recent data from genetics, satellite telemetry, and the recapture or harvest of research-marked individuals in BB and KB to reassess subpopulation boundaries.
Chapter 2 first outlines an analysis to ensure comparisons between the 1990s and 2000s satellite telemetry data are valid. Polar bears were captured and collared in different areas of the BB subpopulation and in different seasons during these two periods (in the 1990s in fall on Baffin Island and spring in NW Greenland; in the 2000s in spring on the Northwest Greenland sea ice). Thus a first step was to evaluate whether bears captured in spring were using the same areas as those captured in fall. The results show that the 1990s and 2000s satellite telemetry data sets are compatible for analyses comparing population delineation across decades; approximately 92% of adult females collared in West Greenland in spring used the same areas on Baffin Island where adult females were captured and collared in fall in the 1990s.
We then conducted a suite of spatial analyses using the historical and recent satellite telemetry data to assess changes between decades in overall space use (e.g., range sizes), range overlap, shifts in median latitude of seasonal ranges over decades, and changes in emigration or immigration across subpopulation boundaries. Findings show there has been a significant reduction in the size of the 2000s BB 95% kernel range (i.e. a measure of the area used by collared bears) in all months and seasons when compared to the range in the 1990s. The most marked reduction is a 60% decline in subpopulation range size in summer. The overlap of the 1990s and 2000s BB ranges was < 50% in all months, reflecting both a contraction and shift of the BB subpopulation range in the 2000s. These shifts are related to the loss of annual sea ice and changes in breakup timing, contracting the range of the BB subpopulation and shifting the distribution of BB polar bears northward in all seasons. With respect to movements across subpopulation boundaries, BB bears in the 2000s were significantly less likely to leave BB than in the 1990s. In particular, there was a reduction in the number of collared bears moving into Davis Strait and Lancaster Sound from BB, apparently due to reduced winter sea-ice coverage. This suggests the BB subpopulation has become more discrete, with less exchange between it and other subpopulations.
In KB, the mean 95% kernel range for the subpopulation has expanded since the 1990s. The increase in range use in the 2000s occurs in all seasons, however is statistically significant only in summer (June-September), where ranges doubled between the 1990s and the 2000s. This range expansion is likely related to changes in sea ice, as KB is trending towards the characteristics of an annual ice ecoregion (like BB) where ice melts out almost completely each summer. These observed changes reflect general differences in habitat use of bears occupying the archipelago vs. seasonal ice ecoregions: bears inhabiting seasonal ice regions have larger and

4
more variable home ranges as they temporally track sea ice whereas bears in archipelago regions have smaller home ranges with less variation.
There is still considerable seasonal overlap in KB subpopulation ranges for bears in the 1990s and 2000s (50-98% overlap over decades), suggesting that bears generally continue to use the same areas of KB. There were significant northward shifts in median latitude of KB polar bear locations in the 2000s in spring and summer (smaller shifts than in BB) though the variability in the range of latitudes has increased. There has been no change during winter. These distribution patterns did not change with a sensitivity analysis in which bears captured in eastern KB were excluded from the 2000s data, to match the distribution of captures in the 1990s. This suggests that our key findings for KB were not influenced by the distribution of capture locations.
Genetic analyses were conducted using eight polymorphic microsatellites as part of the large sample of genetic data collected for MR analyses (Chapters 5 and 10). Overall, there was low genetic resolution due to the small number of microsatellites. BB and KB polar bears could not be differentiated genetically. Also in accordance with previous genetic studies, BB and KB polar bears were found to be genetically different from polar bears in Lancaster Sound and Davis Strait. Thus the results showed that the genetic basis for delineation of BB and KB remains unchanged.
Recapture and harvest recovery data examined during the 3-year genetic MR studies in BB and KB had very low levels of recapture or recovery of bears outside their subpopulation of origin. The total number of bears marked in years 1 and 2 of these studies (2011-2012 in BB and 2012-2013 in KB) was equivalent to ~34% and ~25% of the estimated population size in BB and KB, respectively. Despite this, instances of emigration were ≤ 1% of the recaptures and recoveries of marks for the BB subpopulation. Similarly for the KB subpopulation, documented cases of emigration comprised < 4% of recaptures and recoveries. This is also consistent with the movement analyses based on satellite telemetry data showing that emigration from BB has been significantly reduced since the 1990s, largely due to reduced sea-ice extent in winter and absence of sea ice in summer.
Overall, findings based on satellite telemetry, movement of marked bears, and population genetics suggest that the existing boundaries of the BB and KB subpopulations continue to be relevant for harvest management purposes and population monitoring.
Chapter 3: Reassessing the 1990s Baffin Bay Data for Bias and Compatibility with the 2010s Data
Chapter 3 evaluates sampling and biological issues, including non-random and incomplete sampling, that have the potential to introduce bias in estimates of survival and abundance derived from MR studies of the BB subpopulation.

5
The genetic MR study of BB in 2011-2013 incorporated noninvasive genetic sampling and modelled live-recapture and dead-recovery data in the same analytical framework. Both of these approaches increased sample sizes and reduced susceptibility to some types of bias. Nonetheless, major challenges to the application of MR models to the BB data were revealed during the current analysis of the combined 1993-2013 data. A comprehensive reassessment of the 1990s BB data was conducted because, compared to the 2010s data, the 1990s data had smaller sample sizes, reduced geographic coverage, and different environmental conditions, which in combination introduced uncertainties and potential limitations into analyses of the data. The results of this reassessment (Chapter 3) directly inform the ability to compare results from analyses of the 1990s and 2010s BB data and evaluate trends in polar bear survival and abundance.
The 1990s MR sample size was small (average 229 total captures per sampling year), relative to the 2010s (average 470 total biopsies per sampling year), and the number of recaptures in the 1990s was low. Live-encounter MR sampling was only conducted in some years within each decade: 1993-1996 and 1997 along the coast of Baffin Island in fall, and 2011-2013 along the coast of Baffin Island and in NW Greenland in fall, and there were few dead recoveries during the period between MR sampling studies (1998-2010), particularly in the latter years. Small sample sizes make it difficult to estimate demographic parameters and assess population trend, limiting both the strength of inference that can be drawn from the 1990s data and our ability to quantify and reduce bias in estimates of demographic parameters.
The spatial distribution of polar bear physical captures and biopsy samples for the MR studies in the 1990s and 2010s was significantly different. In the 2010s, a larger fraction of bears were sampled inland from the coastline and inside fjords along Baffin Island. This difference in distribution of captures between sampling periods was not due to changes in habitat use. Analyses of satellite telemetry data from adult females, providing an assessment of land use between decades that is independent of capture location, showed no differences in distance inland or elevation for onshore bears between the 1990s and 2010s. Thus, the differences in capture distribution were a function of different sampling effort, with less effort expended away from coastlines and inside fjords in the 1990s.
The spatially-defined sampling area in Nunavut in the 1990s was less than ½ of the sampling area in the 2010s. The 2010s sampling area encompassed most fjords along the coast and more inland habitat. To evaluate potential biases associated with the smaller sampling area of the 1990s, MR analyses and estimated parameters were compared from two datasets: (1) all 2010s MR data, and (2) a geographic subset of the 2010s MR data that was comparable to the sampling area in the 1990s (Chapter 5).
A related difference across decades was the degree of temporary emigration from the sampling area. In the 1990s there was likely high temporary emigration from the sampling area on the Baffin Island coast because bears used offshore sea ice or ice around the archipelago

6
region in summer. This was demonstrated by analyses of satellite telemetry together with daily passive microwave sea-ice data. Sea ice was considerably reduced in the 2010s, with Baffin Bay ice free by August, and temporary emigration was substantially lower. In each sampling year between 1993 and 2013, the number of independent collared adult females transmitting in the sampling area was enumerated. In the 1990s, approximately <30% of radio-collared female bears were inside the sampling area during the MR fall sampling periods. This suggests that a potentially large proportion of bears were not available for capture in some years during the 1990s. In contrast in the 2010s, between 70-80% of radio-collared adult females were in the sampling area.
Moderate levels of random temporary emigration from the sampling area should not result in biased demographic parameters. However, the degree of temporary emigration in the 1990s appeared variable and dependent on environmental conditions; and small samples sizes made it difficult to rule out significant bias. Additional sources of temporary emigration in the 1990s were non-random and linked to the reproductive cycle of females. Adult females in reproductive classes that were likely pregnant in fall moved farther inland on Baffin Island (i.e., to find suitable denning habitat), compared to non-pregnant females, which likely contributed to the under-sampling of adult females in some years in the 1990s because of the lack of inland sampling.
Consistent with the differences in sampling effort and temporary emigration between the 1990s and 2010s, there were significant differences in the composition of the MR samples (e.g., the proportion of bears within each age-sex class) between these two periods. Specifically, adult females appear under-represented in the 1990s samples.
There were also technical challenges with the 1990s MR data. Within the 1990s MR data there was uncertainty in identifying bears that were located with the aid of radio-telemetry vs. those located by standard search (i.e., random encounter) because original capture records did not make this distinction. Telemetry assisted captures were thus inferred by comparing available information to the capture history files compiled for the original 1990s BB demographic analysis of Taylor et al. (2005). This uncertainty could result in bias, because knowing which bears were located by telemetry was important in the most-supported MR models for the 1990s data.
Overall, relative to the 2010s data, the 1990s data were characterized by smaller sample sizes, incomplete geographic sampling, a likely higher degree of temporary emigration for bears that remained on sea ice during the summer, and potential non-random temporary emigration for adult females that moved farther inland to den. These issues led to an increased potential for bias in estimates of survival and abundance from the 1990s data. As a result, demographic parameters estimated from 1990s and 2010s BB data are not directly comparable, limiting the ability to evaluate population trends.

7
Chapter 4: Habitat and Habitat Use in Baffin Bay
Chapter 4 evaluates changes in BB sea-ice habitat and changes in BB polar bear habitat use between the 1990s and 2000s (2009-2015). The results of this work provide information directly requested by the JC (assessment of the impacts of changes in sea ice) as well as important context for the MR study, such as how environmental changes may explain observed results. The results provide scientific information which can be used for comparison to observations from local ecological knowledge (LEK) studies, including observations of increased densities of polar bears on land or closer to shore and communities.
Sea-ice habitat was assessed in BB starting in 1979, the beginning of the satellite record, and continuing through 2015 using passive microwave data (daily gridded information on sea ice). Sea-ice habitat in BB has significantly declined over this period, especially since the mid-1990s. The length of summer (i.e., the number of days from sea-ice retreat in spring to sea-ice advance in fall) has increased by 12 days/decade since 1979. The mean sea-ice concentration during June-October has decreased by 4% per decade. The general pattern of melt has not changed but occurs about 3-4 weeks earlier in the 2000s than in 1990s. In general BB has incurred large changes in the sea-ice regime experienced by polar bears and this has resulted in habitat loss.
As a result, multiple changes have been observed in the movements and habitat use of BB polar bears. Movement rates of adult female polar bears have significantly declined during the open water period (August-October) in the 2000s due to disappearance of offshore and archipelago summertime sea ice. Bears are significantly less likely to move from land onto sea ice in summer in the 2000s due to the near-absence of sea ice during the open-water period.
BB bears used significantly lower sea-ice concentrations in winter and spring in the 2000s than the 1990s. Bears had stronger preferences to be closer to the 300 m depth contour (on shelf waters and near land) in the 2000s. Sea-ice concentration alone did not determine preferred habitat; adult females selected for lower sea-ice concentrations if it allowed them access to continental shelf waters (<300 m). Adult female bears were significantly closer to land in all months in the 2000s except at the end of breakup (June-July), when they stayed on offshore sea ice as long as possible, likely to maximize feeding.
Potential long-distance swimming events were identified, defined as events in the summer during which bears traveled >100 km from offshore sea ice, to Baffin Island, through areas with <10% sea-ice concentration, and with a concurrent period of reduced or absent collar transmissions (i.e., because collars generally do not transmit when bears are in water). These events were observed in both decades, but the frequency increased in the 2000s, particularly in 2011.
Changes in land use on Baffin Island were observed and are a result of early sea-ice breakup and late sea-ice freeze-up. In the 2000s, bears spent significantly more time on land on

8
Baffin Island, and arrival dates on Baffin Island in summer were one month earlier in the 2000s than in the 1990s. The amount of time bears spent on land has increased by 20-30 days since the 1990s. Bears in the 2000s no longer arrive on Devon or Ellesmere Islands but only on Baffin Island (few remain in Melville Bay Greenland, where some resident bears have been observed for the first time using satellite tracking). There is a close correlation between dates of arrival on Baffin Island and the spring sea-ice break-up metric, as well as a correlation between dates of departure from Baffin Island to the sea ice and the fall sea-ice freeze-up metric.
Sixteen maternity dens were located by use of satellite telemetry between 2009 and 2015 (15 on Baffin Island and 1 in Melville Bay, NW Greenland). Changes in maternity denning in BB were observed. A maternity den was identified in Melville Bay, which was not the case during the 1990s, supporting other lines of evidence that there is greater use of Melville Bay during recent decades. Furthermore, entry dates into maternity dens were >1 month later in the 2000s. Exit dates from maternity dens did not change. Thus, there has been a significantly shorter maternity den duration in BB in the 2000s. The first date of arrival on land by pregnant females was significantly earlier in the 2000s than the 1990s thus bears spend more time on land before entering maternity dens. Maternity dens in the 2000s occurred at higher elevations and steeper slopes than maternity dens in the 1990s, likely due to reduced snow cover.
In conclusion, large scale habitat and habitat use changes in BB over the past 25 years are closely linked to the loss of sea ice.
Chapter 5: Genetic Mark-Recapture Study of Polar Bears in Baffin Bay
Chapter 5 outlines the methodologies and results of the 3-year genetic MR study conducted for the BB subpopulation during 2011-2013. Joint live-recapture and dead-recovery MR models were used to analyze data with the objective of updating estimates of survival and population size. The dataset consisted of genetic marks from 914 physical captures during 1993-1995 and 1997 and 1,410 genetic samples obtained from remote biopsy darting during 2011-2013. Harvest recoveries (n=243) from Canada and Greenland were incorporated throughout the 21-year (1993-2013) study period, but no live recapture sampling occurred during the 13-year interval from 1998 – 2010.
The mean estimate of total abundance of the BB subpopulation in 2012-2013 was 2,826 (95% CI = 2,059-3,593) polar bears. The mean estimate of total abundance 1994-1997 was 2,173 (95% CI = 1,252-3,093) bears, similar to the estimate reported by Taylor et al. (2005). Estimates of abundance for the 1990s and 2010s are not directly comparable due to changes in sampling design and environmental conditions.
The mean estimates of total (i.e., including harvest mortality) survival in 2011-2013 were 0.90 (SE = 0.05) for females age ≥ 2 years, and 0.78 (SE = 0.06) for males age 2 ≥ years. The time-constant estimate of total survival for a combined age class of cubs-of-the-year and yearlings, over the entire period 1993-2013, was 0.87 (SE = 0.06). Estimates of un-harvested

9
survival in 2011-2013 for females and males age ≥ 2 years were 0.91 (SE = 0.05) and 0.83 (SE = 0.06), respectively. Estimates of survival for both sexes may have included negative bias due to temporary emigration (see Chapter 3).
We performed a comparative assessment of sampling design and environmental conditions in the 1990s and 2010s to help interpret parameter estimates, quantify potential bias, and understand trends. An evaluation of the spatial distribution of onshore captures, together with data on habitat use from satellite telemetry, suggested that more systematic and geographically broader live-recapture sampling, including inland areas and the backs of fjords, occurred during 2011 – 2013 compared to the 1990s. Furthermore, offshore sea ice was available to polar bears during the annual sampling periods in the 1990s, but largely unavailable in the 2010s.
We created a geographic subset of the 2010s data based on the estimated sampling area from the 1990s to investigate the effects of sampling differences. Analyses suggested that geographically-restricted sampling such as occurred during the 1990s could result in approximately 10% negative bias in estimates of abundance. Furthermore, satellite telemetry data suggested that a potentially significant proportion of the BB subpopulation may have been located outside the sampling area or on the sea ice during MR sampling in the 1990s, although no sampling was conducted on the ice. This represents another potential source of negative bias in the 1990s abundance estimate although we were not able to quantify its magnitude.
Differences in sampling design and environmental conditions between the 1990s and 2010s introduced variable levels of heterogeneity into recapture probabilities. This heterogeneity was due in large part to the temporary emigration of bears from the sampling area, which was more pronounced in the 1990s (i.e., more bears were located farther inland, where there was no sampling, or on the sea ice). Although moderate levels of random temporary emigration are not problematic for MR models, high or variable levels of temporary emigration combined with short live-encounter sampling windows, or non-random temporary emigration, are well-known sources of bias. Our approach of including harvest returns in the same analytical framework as live-capture data likely mitigated bias to some extent. However, the BB data were too sparse to fit MR models that explicitly estimated temporary emigration and thus minimized its effects on parameters.
Considering statistical uncertainty in estimated parameters and evidence that the sampling design and environmental conditions likely resulted in an underestimate of abundance in the 1990s, it is not possible to conclude that the estimate of total abundance in the 2010s represents an increase in the size of the BB subpopulation. Although the 2010s abundance estimate represents the best-available information and is suitable for informing management, we cannot reliably determine the trend in subpopulation size over the 1993-2013 study period.
10
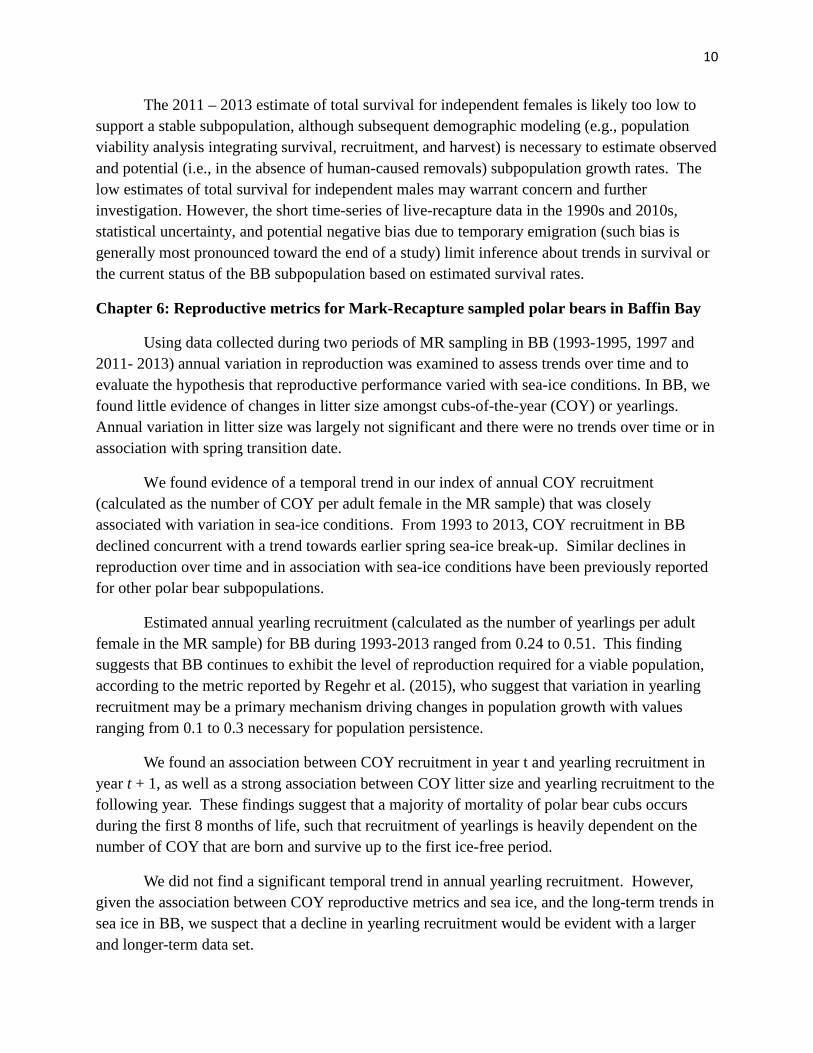
The 2011 – 2013 estimate of total survival for independent females is likely too low to support a stable subpopulation, although subsequent demographic modeling (e.g., population viability analysis integrating survival, recruitment, and harvest) is necessary to estimate observed and potential (i.e., in the absence of human-caused removals) subpopulation growth rates. The low estimates of total survival for independent males may warrant concern and further investigation. However, the short time-series of live-recapture data in the 1990s and 2010s, statistical uncertainty, and potential negative bias due to temporary emigration (such bias is generally most pronounced toward the end of a study) limit inference about trends in survival or the current status of the BB subpopulation based on estimated survival rates.
Chapter 6: Reproductive metrics for Mark-Recapture sampled polar bears in Baffin Bay
Using data collected during two periods of MR sampling in BB (1993-1995, 1997 and 2011- 2013) annual variation in reproduction was examined to assess trends over time and to evaluate the hypothesis that reproductive performance varied with sea-ice conditions. In BB, we found little evidence of changes in litter size amongst cubs-of-the-year (COY) or yearlings. Annual variation in litter size was largely not significant and there were no trends over time or in association with spring transition date.
We found evidence of a temporal trend in our index of annual COY recruitment (calculated as the number of COY per adult female in the MR sample) that was closely associated with variation in sea-ice conditions. From 1993 to 2013, COY recruitment in BB declined concurrent with a trend towards earlier spring sea-ice break-up. Similar declines in reproduction over time and in association with sea-ice conditions have been previously reported for other polar bear subpopulations.
Estimated annual yearling recruitment (calculated as the number of yearlings per adult female in the MR sample) for BB during 1993-2013 ranged from 0.24 to 0.51. This finding suggests that BB continues to exhibit the level of reproduction required for a viable population, according to the metric reported by Regehr et al. (2015), who suggest that variation in yearling recruitment may be a primary mechanism driving changes in population growth with values ranging from 0.1 to 0.3 necessary for population persistence.
We found an association between COY recruitment in year t and yearling recruitment in year t + 1, as well as a strong association between COY litter size and yearling recruitment to the following year. These findings suggest that a majority of mortality of polar bear cubs occurs during the first 8 months of life, such that recruitment of yearlings is heavily dependent on the number of COY that are born and survive up to the first ice-free period.
We did not find a significant temporal trend in annual yearling recruitment. However, given the association between COY reproductive metrics and sea ice, and the long-term trends in sea ice in BB, we suspect that a decline in yearling recruitment would be evident with a larger and longer-term data set.

11
Mean litter sizes in Baffin Bay and the proportions of COY and yearlings were similar to those observed in Foxe Basin and Southern Hudson Bay. In contrast, metrics for Baffin Bay were notably higher than those estimated for Davis Strait and Western Hudson Bay. These comparisons suggest that BB remains a relatively productive subpopulation within this ecoregion despite what appear to be recent declines in reproduction.
Chapter 7: Body Condition of Baffin Bay Polar Bears
Fatness Index (FI) scores were collected from polar bears encountered during two periods of MR sampling in BB, 1993-1995, 1997 and 2011- 2013. We examined trends in this metric of body condition across both sampling periods in relation to sea-ice conditions.
We found evidence of declines in body condition amongst bears in BB between 1993 and 2013. Body condition in BB polar bears declined in close association with the duration of the ice-free period and spring sea ice transition dates. This is consistent with the hypothesis that reduced time on the sea ice (and presumably declining access to prey during spring to early summer) is a primary mechanism driving this decline.
Our results follow with previous studies that found declining condition amongst BB bears through to 2010 using different metrics derived from physical handing of bears (Rode et al. 2012). Sampling as reported in Chapter 7 was range wide during both time periods (1993-1997 and 2011-2013) suggesting that the findings of Rode et al. (2012) were representative of BB even though they were more spatially restricted.
These findings are also consistent with available traditional knowledge suggesting that body condition of polar bears in BB was poorer in the early 2000s relative to the 1990s (Dowsley and Wenzel 2008, Born et al. 2011)
We found evidence of recent foraging in approximately 9% of the BB bears observed during the on-land period. Marine mammals, in particular seals and walrus, made up almost half of the identifiable food sources.
Chapter 8: Polar Bear Harvesting in Baffin Bay and Kane Basin: A Summary of Historical Harvest and Harvest Reporting, 1993 to 2014.
Chapter 8 provides an overview of the polar bear harvest in BB and KB. We examined the level and composition of the harvest over recent decades looking for trends over time or in relation to other factors. We also examined the harvest monitoring systems that are in place; identifying issues that may affect the accuracy of harvest monitoring and the ability of jurisdictions to effectively manage harvest. The results presented provide background information for discussion around future harvest levels and determination of population status. Recommendations on improvements to the harvest reporting and monitoring systems are provided.

12
Both Canada (Nunavut) and Greenland harvest polar bears from the BB and KB subpopulations. During 1993-2005 (i.e., before quotas were introduced in Greenland) the combined (i.e., in both countries) annual harvest averaged 165 (range: 120-268) and 12 (range: 6-26) polar bears from the BB and KB subpopulations, respectively. During 2006-2014 the combined annual harvest averaged 161 (range: 138-176) and 6 (range: 3-9) polar bears from the BB and KB subpopulations, respectively. Total harvest peaked between 2002 and 2005 coinciding with several events in harvest reporting and harvest management in both Canada and Greenland.
In BB the sex ratio of the combined harvest has remained around 2:1 (male: females) with an annual mean of 35% females amongst independent bears. In KB the sex composition of the combined harvest was 33% females overall for the period 1993-2014. The estimated composition of the KB harvest since the introduction of a quota in Greenland has been 44% female but the factual basis for estimation of the sex ratio in the KB harvest is weak.
In Greenland the vast majority of bears are harvested between January and June in BB and KB, whereas in Nunavut ca. 40% of the harvest in BB is in the summer to fall (August – November) while bears are on or near shore. In Nunavut, all harvesting of bears from KB occurred in the spring.
Sport hunting of polar bears is permitted in Canada but not Greenland. Sport hunting constituted on average 16% of the annual harvest and peaked in 2008 coincident with several management actions. Sport hunting is highly selective for older, adult males.
Defense-of-life-and-property kills (DLPs) of polar bears in BB were dominated by young (2-3 years old) individuals. We did not find evidence of a trend in the annual number of DLPs between 1993 and 2014. Most DLPs occurred during the open water period (August-November) when bears were on or near shore. The seasonal frequency of DLPs in Canada (Nunavut) declined through the summer and fall.
Genetic validation of the sex of individual bears, as reported by the hunters, showed that sex was incorrectly reported in a significant number of cases and errors were most common in Greenland. Based on genetic validation, the presence of physical marks (i.e., ear tags or tattoos) on bears was also significantly under reported in the harvest. Detection of marked bears declined with increasing age of marks suggesting that mark loss, especially the loss of ear tags, was a problem. This finding has implications for the use of harvest recoveries in MR studies.
Management and the history of management of polar bears in Canada and Greenland differs in some respects: (1) quotas were introduced in Canada in 1967 and in Greenland in 2006, (2) sport hunting is allowed in Canada but not in Greenland, (3) Canadian management is designed to achieve a target harvest sex ratio of 2:1 (males to females) whereas the harvest of independent polar bears in Greenland is non-selective, and (4) most polar bears in Greenland are taken from dog sleds whereas in Canada most are taken from snowmobiles.
13
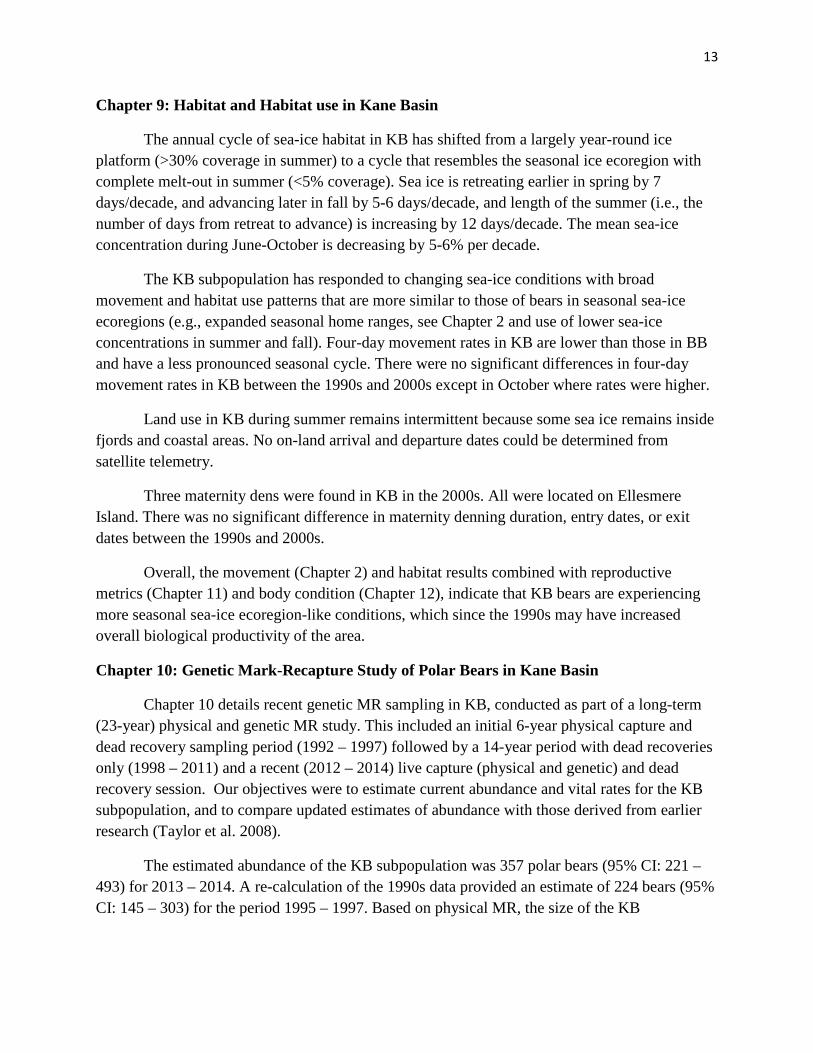
Chapter 9: Habitat and Habitat use in Kane Basin
The annual cycle of sea-ice habitat in KB has shifted from a largely year-round ice platform (>30% coverage in summer) to a cycle that resembles the seasonal ice ecoregion with complete melt-out in summer (<5% coverage). Sea ice is retreating earlier in spring by 7 days/decade, and advancing later in fall by 5-6 days/decade, and length of the summer (i.e., the number of days from retreat to advance) is increasing by 12 days/decade. The mean sea-ice concentration during June-October is decreasing by 5-6% per decade.
The KB subpopulation has responded to changing sea-ice conditions with broad movement and habitat use patterns that are more similar to those of bears in seasonal sea-ice ecoregions (e.g., expanded seasonal home ranges, see Chapter 2 and use of lower sea-ice concentrations in summer and fall). Four-day movement rates in KB are lower than those in BB and have a less pronounced seasonal cycle. There were no significant differences in four-day movement rates in KB between the 1990s and 2000s except in October where rates were higher.
Land use in KB during summer remains intermittent because some sea ice remains inside fjords and coastal areas. No on-land arrival and departure dates could be determined from satellite telemetry.
Three maternity dens were found in KB in the 2000s. All were located on Ellesmere Island. There was no significant difference in maternity denning duration, entry dates, or exit dates between the 1990s and 2000s.
Overall, the movement (Chapter 2) and habitat results combined with reproductive metrics (Chapter 11) and body condition (Chapter 12), indicate that KB bears are experiencing more seasonal sea-ice ecoregion-like conditions, which since the 1990s may have increased overall biological productivity of the area.
Chapter 10: Genetic Mark-Recapture Study of Polar Bears in Kane Basin
Chapter 10 details recent genetic MR sampling in KB, conducted as part of a long-term (23-year) physical and genetic MR study. This included an initial 6-year physical capture and dead recovery sampling period (1992 – 1997) followed by a 14-year period with dead recoveries only (1998 – 2011) and a recent (2012 – 2014) live capture (physical and genetic) and dead recovery session. Our objectives were to estimate current abundance and vital rates for the KB subpopulation, and to compare updated estimates of abundance with those derived from earlier research (Taylor et al. 2008).
The estimated abundance of the KB subpopulation was 357 polar bears (95% CI: 221 – 493) for 2013 – 2014. A re-calculation of the 1990s data provided an estimate of 224 bears (95% CI: 145 – 303) for the period 1995 – 1997. Based on physical MR, the size of the KB

14
subpopulation was previously estimated to be 164 polar bears (95% CI: 94-234) for 1994-1997 (noting that this estimate applies to different years than our re-analysis; Taylor et al. 2008).
More bears were documented in the eastern regions of the KB subpopulation area during 2012 – 2014 than during 1994-1997. Eastern Kane Basin was searched during the 1990s although with less effort than in the 2010s due to the low density of bears observed there. The presence of ringed seals in eastern Kane Basin during spring in the 1990s indicated that this area was good polar bear habitat (Taylor et al. 2001). The difference in distribution between the 1990s and 2010s may reflect differences in spatial distribution of bears, possibly influenced by reduced hunting pressure by Greenland in eastern KB and thus an increased density of bears in KB, but also some differences in sampling protocols.
The 2013 – 2014 estimate of abundance suggests 357 (221 – 493) bears currently use KB in springtime (i.e., the Kane Basin super-population; Kendall et al. 1997), and the current point estimate is higher than the historical estimate. Based on a randomization procedure that assumed normal sampling distributions for abundance estimates, the mean difference between the estimate of KB abundance for 2013-2014 and the estimate for 1995-1997 was approximately 133 bears (standard deviation of the difference ≈ 80 bears), with 95% of the sampling distribution suggesting that population change between the two time periods could have been positive. This suggests relatively strong evidence for a stable to increasing subpopulation, and is consistent with data on movements, condition and reproduction. We encourage some caution in interpretation of population growth due to potential expansion of the sampling frame and differences in sampling protocols between the 1990s versus the 2010s study periods.
Current estimates of total survival for age 3+ females (0.95; SE: 0.04) and dependent bears were consistent with previous research, but new estimates of total survival are lower for age 3+ males (0.87; SE: 0.06). Our longer-term data set, for which no capture or biopsy sampling and few recoveries occurred during 1998-2011, and several other ecological, sampling, and technical considerations may contribute to this result.
We documented a reduction in mortality associated with harvest, likely attributable to implementation of Greenland’s harvest quota in 2006. Demographic modeling suggests KB bears exhibit relatively high fidelity to the springtime study area, with <4% of marked bears permanently emigrating. This follows with the movement data presented in Chapter 2.
Chapter 11: Aerial survey of polar bears in Kane Basin
An aerial survey was conducted in KB in 2014 concurrently with the final year of sampling for the MR study (Chapter 10). The protocol ensured consistency in the sampling frames and study periods in KB and allowed us to derive independent estimates of abundance from the two techniques, enabling us to compare results, while keeping in mind that the definition of the “study population” may differ between the two methods.

15
The estimate of abundance based on the springtime 2014 aerial survey in KB was 206 bears (95% lognormal CI: 83 - 510). However, due to insufficient coverage of offshore polar bear habitat this estimate is liley negatively biased. Based on a randomization procedure that assumed normal sampling distributions for abundance estimates, the mean difference between the estimate of total abundance 2013-2014 from the MR study (357 bears, 95% CI = 221 – 493) and the aerial survey estimate was approximately 151 bears (standard deviation of the difference ≈ 127 bears), with 88% of the sampling distribution suggesting that the difference was positive (i.e., that the MR estimate was at least one bear larger than the aerial survey estimate).
Differences between MR and aerial survey point estimates in KB require caution when comparing results from different techniques conducted during springtime. Aerial surveys yield a snapshot estimate of abundance (i.e., the number of bears occupying the survey area during the study period), whereas MR generates a super-population estimate reflecting all bears with a non-zero probability of detection during the study period (including individuals that are currently outside the survey area due to temporary emigration). We suggest that the MR estimate is appropriate for use in management.
As shown also in other areas of the Arctic (e.g. the Barents Sea; Aars et al. 2009) aerial surveys provide a useful tool for inventorying subpopulations. The method has been successfully used on even larger subpopulations than KB. The springtime aerial survey in KB was successfully implemented due to the small geographic area and a period of good weather, but precision could be improved by increasing survey effort to better estimate the detection function and by ensuring that the entire range of the subpopulation is covered.
Chapter 12: Reproductive metrics for Mark-Recapture sampled polar bears in Kane Basin
Chapter 12 summarizes reproductive metrics for KB using data collected during two periods of MR sampling from 1992 to 1997 (Taylor et al. 2008) and 2012 to 2014 (Chapter 10). The results provide additional context for interpreting the results of MR analyses and assessment of the present status of the KB subpopulation.
Reproductive metrics for KB, including mean litters sizes for cubs-of-the-year (COY) and yearlings, and an index of recruitment (calculated as the number of yearlings per adult female in the MR sample), were comparable between the 1990s and 2010s sampling periods. Mean litter sizes in KB (for COY: 1.67 in the 1990s and 1.60 in the 2010s) were similar to those observed in other polar bear subpopulations in the archipelago ecoregion (range 1.65 - 1.71). Annual samples sizes were generally too small to support comparisons amongst years. However, for the years with the largest sample sizes (1995, 2013, and 2014), when the total number of bears sampled exceeded 50 individuals there was notable variation in the proportions of sampled bears that were cubs-of-the-year (range 15% - 30%) suggesting significant annual variation in cub production. In contrast, proportions of yearlings and the yearling recruitment index were relatively invariant among years
16
In summary, we found no evidence of changes in reproductive performance in KB between the 1990s and 2000s, but sparse data limited our conclusions.
Chapter 13: Observations of body condition and foraging habits of polar bears in Kane Basin during the spring
Using the Fatness Index (see also Chapter 7) we compared the body condition of polar bears in KB in the 1990s and 2010s. Body condition was better amongst KB sub-adults and adult females with yearlings during the 2010s relative to the 1990s, though sample sizes were limited. In contrast, condition amongst adult males, adult females with COYs, and lone adult females was similar between these time periods.
Apparent improvement in body condition in the 2010s may reflect natural variation or a response to long-term changes in the sea-ice regimen in KB, largely turning into a system resembling a seasonal sea-ice ecoregion. Seals and polar bears were similarly distributed in Kane Basin. Relatively high densities of both seals and bears in northeastern Kane Basin, near the Humbolt Glacier (eastern KB), indicates that this region has high productivity and is important habitat for polar bears in the subpopulation.
A high proportion of KB bears were found to have extensive hair loss and skin ulcerations on their feet. The cause of these lesions is unknown to science. Traditional knowledge suggests this phenomenon is the result of abrasive injuries sustained by walking and digging in hard, icy, coarse snow cover on the spring sea ice combined with increased rates of movement during the peak mating and feeding periods.
Chapter 14: General Discussion and Advice to the Joint Commission
Assessment of subpopulation status
The BB and KB studies represent the first times that genetic mark-recapture has been implemented at population-wide scales for estimating polar bear abundance and demographic rates. Sampling via biopsy darting was highly successful in yielding tissue samples suitable for genotyping in both Baffin Bay and Kane Basin. Biopsy darting is generally fast, efficient, and significantly less invasive than physical mark-recapture, since bears are not immobilized. These findings suggest that genetic mark-recapture can provide a useful, less invasive inventory tool.
However there were trade-offs with this method that resulted in some information not being available that would have provided more context for the assessment (tooth ages of bears allowing for more refined modeling of age classes, more detailed information on physical condition, a large suite of physical samples were not collected with biopsy darting, reduced sample sizes of collared bears for satellite telemetry studies). Furthermore, some physical capture was critical for providing key information for this assessment. The movement information gleaned from the satellite telemetry collected from bears captured in NW Greenland was used

17
during interpretation of results, both in the context of habitat change but also for informing potential sampling biases in the MR and for setting the MR results in context.
Large-scale projects like the recent BB and KB studies are expensive and logistically challenging and limit the frequency with which management jurisdictions can perform them. If repeated population and monitoring studies are envisioned every 10-15 years in BB or KB, then it is recommended to maintain and increase the number of “marks” in the population via single-year biopsy sampling at least every 5-7 years. This will ensure genetically marked bears in the population are recovered through harvest or via a new population study allowing a more robust or less-biased estimation of some vital rates.
However, it should also be noted that mark-recapture studies need at least 3 years of field sampling to derive population estimates with an acceptable degree of precision. As demonstrated in the present study post hoc genetic analyses of samples and data analyses may result in results being available ca. 5 years after initiation of a study. Furthermore, genetic mark-recapture (similar to physical mark-recapture) studies conducted in subpopulations with a huge distribution area in an annually fluctuating environment (i.e. fluctuations in sea-ice cover) like Baffin Bay may be influenced by fluctuations in ability to obtain representative sampling (e.g. temporary emigration, portions of the populations unavailable to sampling of offshore remote sea ice).
Future assessments of polar bear subpopulations with a wide range may also consider aerial surveys in combination with satellite telemetry for estimating population abundance, which have proven useful in other areas (Aars et al. 2009). If there are favorable springtime weather conditions an aerial survey may be conducted during a single season. However, in contrast to mark-recapture aerial surveys are more susceptible to poor weather conditions in a single year.
The SWG was tasked with proposing Total Allowable Harvest (TAH) levels for both the Baffin Bay and Kane Basin subpopulations but was not provided with any specific guidance on the management goals for these subpopulations by the JC, despite several requests over a period of years. The SWG requested that the JC provide:
1) A statement of management objectives for each subpopulation,
2) Information on the expected frequency and intensity of future monitoring, and
3) A statement of risk tolerance with respect to the effects of human caused removals.
As a consequence of not receiving the necessary information on which to base recommendations on TAH from the JC, the SWG is currently unable to provide these recommendations. Specific objectives for the management and conservation of BB and KB polar bears are critical as these will largely influence recommendations on TAH, which in turn will ensure that decision makers have all the necessary information available to them. Risk
18
tolerance and management objectives are not decisions to be made by scientific staff but rather by those with management authority for the resource and, ideally, are made after consideration of not only subsistence harvest but also other sources of human-caused removals (e.g., human-bear interactions) and after consultation with all stakeholders.
Once the JC provides the requested information, the SWG strongly recommends that subsequent advice on TAH be based on population simulations using models that have the ability to incorporate changing carrying capacity (e.g., due to sea-ice loss) and demographic data quality as part of the overall process to assess risk under different harvest management scenarios. The SWG recommends the use of a demographic model, such as developed by Regehr et al. (2015), which is a state-dependent management framework that links the demographic model to simulated population assessments and can be used to estimate the maximum sustainable rate of human-caused removals. It can also be used to calculate a recommended sustainable harvest rate, which Regehr et al. (2015) note is generally lower than the maximum sustainable rate because it is dependent on management objectives, the precision and frequency of population data, and risk tolerance.
Habitat changes
Both scientific studies (herein as well as earlier literature) and local knowledge (Dowsley et al. 2005, Dowsley and Wenzel 2008 and Born et al. 2011) have documented impacts of habitat change (e.g., sea-ice loss) on polar bears in BB (and likely also KB). Habitat monitoring will be critical going forward given the projections for sea ice in the Arctic. The results of the habitat assessment work conducted in Baffin Bay and Kane Basin since 2009, largely based on satellite telemetry data from collared adult female polar bears, have provided a wealth of new information on habitat and habitat change, which directly inform the status of the BB and KB subpopulations
The SWG concludes that future physical capture and satellite tagging studies in BB and KB (collaring and tracking adult female bears for periods of years) will be critical to extending the current time series and informing managers of the impacts of sea-ice habitat loss over the upcoming decades. Given the large physical changes documented in this study, and clear responses of polar bears in both areas, continuation of the time series of satellite telemetry data will improve our understanding of the impacts of future biotic and abiotic changes. The satellite telemetry studies should be conducted on intervals of 10 years or less, with samples sizes roughly equivalent to those collected in the 1991-1997 and 2009-2013 periods (approximately 40 adult females tracked over a period of several years). Lower sample sizes will make assessments more difficult due to individual variability and lack of model convergence for RSFs (as seen for KB).
Satellite telemetry data for the first time documented that 18% of the adult females collared in West Greenland remained in the nature reserve of Melville Bay for a least one

19
summer season and in a few cases over a year. This is in accordance with observations from experienced hunters in Melville Bay, who have noted increasing occurrence of polar bears in Melville Bay, as well as that documented by Taylor et al. (2005) and Born et al. (2011). An additional recommendation for future work is to investigate what fraction of the BB subpopulation uses Melville Bay year-round and to follow the development in this group of polar bears residing year-round in the Melville Bay Nature Reserve. This could make use of the existing genetic marks from this study, with the addition of one or two additional biopsy sampling seasons in Melville Bay in combination with satellite telemetry.
The SWG also recommends continued assessment of changes in habitat in BB and KB via satellite-based observation of sea ice (passive microwave data, MODIS, or Radar images, continued development of habitat models (per Durner et al. 2009, Laidre et al. 2015 and Chapters 4 and 9), continued studies linking habitat change to demography, and continued monitoring of TEK and LEK from both Canada and Greenland will provide information on how changes in sea ice are impacting the polar bear hunt (e.g., hunting practices), the overall harvest, and the condition of bears harvested.
Synthesis
In January 2010, the JC tasked the SWG with using the best available scientific information to: (1) propose Total Allowable Harvest (TAH) levels for the Kane Basin and Baffin Bay subpopulations and provide the Joint Commission with a written report of its recommendations, (2) provide science advice to the Joint Commission for monitoring the effects of habitat changes on polar bears.
After reviewing available information, the SWG concluded (SWG 2011) that previous estimates of abundance in Baffin Bay (BB) and Kane Basin (KB) and vital parameters derived from joint Canada-Greenland physical mark-recapture studies (1993-1997) in BB and KB were outdated and of uncertain value for management given the significant changes in reported harvest levels and sea-ice conditions that had occurred since these studies were completed. Additionally, information on the status of these subpopulations obtained from modeling versus traditional ecological knowledge (TEK) was seemingly contradictory. To resolve this uncertainty, the SWG initiated new research in 2011 to (1) assess numbers of polar bears in the BB and KB subpopulations, and (2) to gather data on the effects of sea-ice loss on polar bears in these regions.
Overall responses to changes in habitat
Both subpopulations have shown marked changes in general distribution in response to large-scale, long-term reductions in sea ice in the BB and KB regions during the last ca. 25 years. The BB subpopulation has contracted its range and shifted its distribution northward in all seasons when compared to the situation in the 1990s. In general this subpopulation has become more discrete, with less exchange with neighboring subpopulations (KB, Lancaster Sound and

20
Davis Strait). As a result of earlier spring break up, the more complete melting of annual ice and delayed fall freeze-up, BB polar bears are spending an increasing amount of time on land during which they have no access or reduced access to marine mammal prey.
In the 1990s, the sea-ice regimen in the KB region was characterized by consolidated pack ice of annual and multi-year mix that persisted during the summer. This provided bears in KB with a higher degree of year round access to sea-ice habitat than in more seasonal sea-ice ecoregions such as BB. Since the 1990s, however, conditions in KB have been trending towards the characteristics of the sea-ice conditions in BB where ice melts out almost completely each summer (i.e., “seasonal ice ecoregion” conditions). Results from our studies suggest the KB subpopulation has responded to this transition in sea-ice regimens by expanding its range since the 1990s especially during summer. Larger and more variable home ranges and the use of lower sea-ice concentrations in summer and fall have also been observed. These changes in distribution and movements are characteristic of polar bears inhabiting “ecoregions” with annual sea ice.
Changes in phenology and demography
In BB we have detected signs of changes in phenology and demography indicating that BB polar bears are responding in several ways to the decrease in suitable habitat between the 1990s and 2000s. This is expected to continue with continued sea ice loss.
With respect to behavior, we found that adult females are now utilizing lower sea-ice concentrations and sea-ice habitat significantly closer to land. Bears are arriving onshore on Baffin Island in the summer one month earlier and are spending significantly more time (20-30 days) on land before returning to the newly but later forming sea ice. The number of recorded long-distance swimming events of females has increased suggesting that bears are presently responding to lowered sea-ice concentrations in order to maintain fidelity to their summer range on Baffin Island. Pregnant bears are entering maternity dens more than 1 month later but date of den emergence has remained unchanged. The consequences of this shortened denning period are unknown. However, the observation that maternity dens tend to be located at higher elevations in the 2000s than in the 1990s suggests that reduced snow cover on the mountains of eastern Baffin Island may be one of the causes.
We also detected a decrease in demography and body condition of BB polar bears over time. Recruitment of cubs-of-the year has declined concurrent with a trend towards earlier spring sea-ice break-up since the 1990s. Despite our relatively limited ability to estimate survival, low survival rates amongst independent males in the 2000s compared to earlier estimates may in part reflect the impacts of changing environmental conditions. Finally, declines in body condition amongst bears in BB between 1993 and 2013 have occurred in close association with the duration of the ice-free period and spring sea-ice transition dates.

21
In contrast to BB, we found no evidence of changes in reproductive performance in KB between the 1990s and 2000s (but the sparsity of data limited our conclusions). We found signs of an apparent improvement in body condition in the 2000s which may simply reflect natural variation but could also be part of a response to long-term changes in the sea-ice regimen in Kane Basin, whereby the productivity of the marine ecosystem has increased.
Abundance
The genetic mark-recapture assessment of the BB subpopulation resulted in a mean estimate (2012-2013) of total abundance of 2,826 polar bears (95% CI = 2,059-3,593). Due to several limitations of the available data, discussed in detail in this report, the estimates of abundance for the 1990s and 2000s are not directly comparable. Therefore, it is not possible to draw firm conclusions about trends in the abundance of the BB subpopulation. Nevertheless, the study has demonstrated the presence of a subpopulation in Baffin Bay considerably larger than that inferred from previous modeling (1,546 bears cf. PBSG 2015); the results of which formed part of the basis for the PBSG’s (2015) designation of BB as a declining subpopulation. TEK information has not indicated any marked decline in the BB subpopulation (e.g. Dowsley and Taylor 2006, Born et al. 2011).
Despite uncertainty in the observed trend in BB, multiple lines of evidence relating to movements, distribution, habitat availability and use, behavior, reproductive performance, and body condition demonstrate that the BB subpopulation is undergoing significant changes in response to deteriorating habitat. If the current trends in sea ice continue it is reasonable to predict further changes in this subpopulation including, ultimately, declines in abundance and vital rates. This warrants caution in both future monitoring and management.
Using mark-recapture in KB, the new (2013-2014) estimate of abundance for this subpopulation was 357 polar bears (95% CI: 221 – 493). A re-calculation of 1990 mark-recapture data in KB resulted in an estimate of 224 bears (95% CI: 145 – 303) for the period 1995 – 1997. A comparison between these two estimates indicates the presence of a stable or increasing subpopulation, which is consistent with information on movements, body condition and reproduction and in accordance with TEK (Born et al. 2011). These changes suggest the subpopulation is currently healthy and stable. This finding is contrary to a lower estimate of abundance obtained from previous modeling (Taylor et al. 2008); the results of which formed part of the basis for the PBSG’s (2010) designation of KB as a declining subpopulation.
These changes in KB may signal a positive response to the initial impacts of climate change in the High Arctic as previously hypothesized for polar bears. However, we note that if trends in sea ice continue these positive impacts are predicted to diminish and be replaced by negative impacts. We therefore recommend on-going monitoring of sea-ice habitat and intermittent surveys to track changes in abundance in this small subpopulation.

22
Literature Cited
Aars, J., T.A. Marques, S.T. Buckland, M.Andersen, S. Belikov, A. Boltunov, and Ø. Wiig. 2009. Estimating the Barents Sea polar bear population size. Marine Mammal Science 25:35-52.
Anon. 2009. Memorandum of Understanding between the Government of Canada, the Government of Nunavut, and the Government of Greenland for the Conservation and Management of Polar Bear Populations, 9 pp.
Born, E. W., A. Heilmann, L. K. Holm, and K. L. Laidre. 2011. Polar bears in Northwest Greenland: an interview survey about the catch and the climate. Monographs on Greenland, Man and Society Volume 41. Museum Tusculanum Press, University of Copenhagen, Copenhagen, Denmark.
Dowsley, M. 2005. Inuit knowledge regarding climate change and the Baffin Bay polar bear population. Nunavut Wildlife Research Group Final Report No. 1, Government of Nunavut, 43 pp.
Dowsley, M., and G. W. Wenzel. 2008. ‘‘The time of the most polar bears’’: A co-management conflict in Nunavut. Arctic 61:177–189.
Durner, G. M., D. C. Douglas, R. M. Nielson, S. C. Amstrup, T. L. McDonald, I. Stirling, M. Mauritzen, E. W. Born, Ø. Wiig, E. DeWeaver, M. C. Serreze, S. E. Belikov, M. M. Holland, J. Maslanik, J. Aars, D. A. Bailey, and A. E. Derocher. 2009. Predicting 21st-century polar bear habitat distribution from global climate models. Ecological Monographs 79:25–58.
Laidre, K. L., E. W. Born, P. Heagerty, Ø. Wiig, H. Stern, R. Dietz, J. Aars, and M. Andersen. 2015. Shifts in female polar bear (Ursus maritimus) habitat use in East Greenland. Polar Biology 38:879–893.
Lunn, N. J., S. Servanty, E. V. Regehr, S. J. Converse, E. Richardson, and I. Stirling. 2016. Demography of an apex predator at the edge of its range – impacts of changing sea ice on polar bears in Hudson Bay. Ecological Applications 26:1302–1320
Obbard, M. E., S. Stapleton, K. R. Middell, I. Thibault, V. Brodeur, and C. Jutras. 2015. Estimating the abundance of the Southern Hudson Bay polar bear subpopulation with aerial surveys. Polar Biology 38:1713–1725.
PBSG [IUCN/SSC Polar Bear Specialist Group]. 2010. 2009 status report on the world’s polar bear subpopulations. Pages 31–80 in M. E. Obbard, G. W. Thiemann, E. Peacock, and T. D. DeBruyn, editors. Polar Bears: Proceedings of the 15th Working Meeting of the IUCN/SCC Polar Bear Specialist Group. IUCN, Gland, Switzerland and Cambridge, UK.
23
PBSG [IUCN/SSC Polar Bear Specialist Group]. 2015. Population status. Status table. http://pbsg.npolar.no/en/status/status-table.html
Regehr, E. V., R. R. Wilson, K. D. Rode, and M. C. Runge. 2015. Resilience and risk – a demographic model to inform conservation planning for polar bears. U.S. Geological Survey Open-File Report 2015-1029. U.S. Geological Survey, Reston, Virginia, USA.
Rode, K. D., E. Peacock, M. Taylor, I. Stirling, E. W. Born, K. L. Laidre and Ø Wiig. 2012. A tale of two polar bear populations: ice habitat, harvest and body condition. Population Ecology 54:3–18.
Stapleton, S., E. Peacock, and D. Garshelis. 2016. Aerial surveys suggest long-term stability in the seasonally ice-free Foxe Basin (Nunavut) polar bear population. Marine Mammal Science 32:181–201.
SWG [Scientific Working Group to the Canada-Greenland Joint Commission on Polar Bear]. 2010. Report of the Scientific Working Group to the Canada-Greenland Joint Commission on Polar Bear, 28-31 May 2010, Ilulissat, Greenland, 18 pp
SWG [Scientific Working Group to the Canada-Greenland Joint Commission on Polar Bear]. 2011. Survey options for assessment of the Baffin Bay (BB) and Kane Basin (KB) polar bear populations. Unpublished report submitted by the Scientific Working Group to the Canada-Greenland Joint Commission on Polar Bear to the Canada-Greenland Joint Commission on Polar Bear, 32 pp.
Taylor, M.K., S. Akeeagok, D. Andriashek, W. Barbour, E.W. Born, W. Calvert, D. Cluff, S. Ferguson, J. Laake, A. Rosing-Asvid, I. Stirling, F. Messier 2001. Delineation of Canadian and Greenland Polar Bear (Ursus maritimus) populations by cluster analysis of movements Canadian Journal of Zoology 79: 690-709.
Taylor, M. K., J. Laake, P. D. McLoughlin, E. W. Born, H. D. Cluff, S. H. Ferguson, A. Rosing-Asvid, R. Schweinsburg, and F. Messier. 2005. Demography and viability of a hunted population of polar bears. Arctic 58:203–214.
Taylor, M. K., J. Laake, P. D. McLoughlin, H. D. Cluff, E. W. Born, A. Rosing-Asvid, and F. Messier. 2008. Population parameters and harvest risks for polar bears (Ursus maritimus) of Kane Basin, Canada and Greenland. Polar Biology 31:491–499.