ASSAD 2017 - darta.net.audarta.net.au/wordpress-content/uploads/2019/02/ASSAD-2017.pdf · ASSAD...
92
Australian Secondary School Students’ Use of Tobacco, Alcohol, Over-the-Counter Drugs, and Illicit Substances ASSAD 2017 STATISTICS & TRENDS
Transcript of ASSAD 2017 - darta.net.audarta.net.au/wordpress-content/uploads/2019/02/ASSAD-2017.pdf · ASSAD...

Australian Secondary School Students’ Use of Tobacco, Alcohol, Over-the-Counter Drugs, and Illicit Substances
AS
SA
D 2
01
7
ST
AT
IST
ICS
& T
RE
ND
S

ii ASSAD 2017: Statistics & Trends
December 2018, Centre for Behavioural Research in Cancer, Cancer Council Victoria
Report prepared by: Nicola Guerin and Victoria White
Prepared for Drug Strategy Branch, Australian Government Department of Health
Published by Cancer Council Victoria
Suggested citation:
Guerin, N. & White, V. (2018). ASSAD 2017 Statistics & Trends: Australian Secondary Students’ Use of Tobacco, Alcohol, Over-the-counter Drugs, and Illicit Substances. Cancer Council Victoria.
615 St Kilda Road Melbourne Victoria 3004 Australia
T: +61 3 9514 6100
W: www.cancervic.org.au
For enquiries contact:
Centre for Behavioural Research in Cancer
T: +61 3 9514 6410

ASSAD 2017: Statistics & Trends iii
ASSAD 2017 STATISTICS & TRENDS
This report presents information from the Australian Secondary Students’ Alcohol and Drug Survey (ASSAD) on the use of tobacco, alcohol, over-the-counter drugs (for non-medicinal purposes), and other substances in school students aged 12 to 17 in Australia. The 2017 ASSAD survey was conducted during the academic school year of 2017. This was the twelfth survey in a series that began in 1984. The first six ASSAD surveys measured adolescents’ use of only tobacco and alcohol. Since the seventh survey, ASSAD has also included questions about the use of over-the-counter drugs (for non-medicinal purposes), and other substances.
In 2017, around 20,000 secondary students aged between 12 and 17 participated in the survey. Students answered questions about their current and lifetime use of tobacco, alcohol, analgesics, tranquilisers, and other substances, and their behaviour related to the use of these substances.
Included in the report are detailed tables on the prevalence of use of these substances by adolescents aged between 12 and 17 in Australia during 2017, and trends in their use over time since 2011. For these comparisons, we focused on estimates for three age groupings: 12 to 15; 16 to 17; and 12 to 17.
The first section of the report includes a brief overview of the survey’s history and methodology. Later sections and appendices include a selection of easily interpretable tables and figures which may be reproduced in reports and presentations.

iv ASSAD 2017: Statistics & Trends
Acknowledgements
The Centre for Behavioural Research in Cancer at Cancer Council Victoria gratefully acknowledges the cooperation and assistance of the people and organisations listed here in the running of this survey:
all students who participated in the survey
the staff of participating schools
state departments of education
state and diocese Catholic education offices
state associations of independent schools
The organisations listed below funded ASSAD 2017 data collection in states or territories:
Australian Government Department of Health
Cancer Council Victoria
Department of Health and Human Services, Victorian Government
Centre for Epidemiology and Evidence, NSW Ministry of Health
Centre for Population Health, NSW Ministry of Health
Mental Health & Drug and Alcohol Office, NSW Ministry of Health
Cancer Institute, NSW
Cancer Council South Australia
Drug and Alcohol Services South Australia, SA Health
Tobacco Control Research and Evaluation, South Australian Health and Medical Research Institute (SAHMRI)
Chronic Disease Prevention Tobacco Policy Team, Health Department of Western Australia
Performance and Programs, Mental Health Commission, Government of Western Australia
Cancer Council Queensland
Queensland Health
ACT Health, Epidemiology Section, Health Improvement Branch, Population Health Division
Cancer Council Tasmania
Communities, Sport and Recreation, Department of Premier and Cabinet, Tasmania
Department of Education, Tasmania
Public Health Services, Department of Health and Human Services, Tasmania
Alcohol & Drug Services, Tasmanian Health Service
Northern Territory Government, Department of Health, Mental Health, Alcohol, and Other Drugs Branch
The people listed below coordinated the survey and/or organised data collection in their state or territory:
Tanya Plueckhahn, Gorjana Radisic, Kate Clarke-Palmer, Greg Sharplin, and Tony Daly, Cancer Council South Australia
Frances Gibson, Ann-Maree Hughes, Hai Phung, Sommer Sherwood, Epidemiology Section, Health Improvement Branch, Population Health Division, ACT Health
Tim Harrold, Jessica Gugusheff, Heather, Baldwin, Suzanne Schindler, Health Behaviour Surveillance, Centre for Epidemiology and Evidence, NSW Ministry of Health

ASSAD 2017: Statistics & Trends v
Chris Moon, Warren Que Noy, Northern Territory Government, Department of Health, Mental Health, Alcohol, and Other Drugs Branch
Amanda Harrison, Rebecca Hood, Su-Ann Drew, Russell Bridle, Performance and Programs, Mental Health Commission, Government of Western Australia
Mandy Gardener, Natalie Klein, Abby Smith, Cancer Council Tasmania
Nicola Guerin, Tahlia Williams, Maree Scully, Felicity Houewen, Cancer Council Victoria
Rebecca Perkins, Peter Anderson, Peter Baade, Upeksha Chandrasiri, Cancer Council Queensland
Ted White, Tendai Dawkins, Community Solutions, Queensland
Saskia Kirson, Angela Brooks, McNair Ingenuity Research, NSW
Catherine Manley, Sonja Porter, Miles Morgan Australia, Western Australia
Australian Council for Educational Research advised on all aspects of sampling.
Wai Yen Loh, Larissa Popowski, Alison Hopkins of Cancer Council Victoria, undertook and managed data cleaning and coding.
We also thank the research team who administered the survey to students throughout Australia.

vi ASSAD 2017: Statistics & Trends
Table of Contents
Key Findings 1
Smoking and Secondary Students in Australia 2017 2
Alcohol and Secondary Students in Australia 2017 3
Use of Over-the-Counter Drugs and Illicit Substances by Secondary Students in Australia 2017 4
Introduction 5
Method 6
Tobacco use among Australian secondary students 14
Alcohol use among Australian secondary students 23
Use of over-the-counter drugs among Australian secondary students 28
Illicit substance use among Australian secondary students 29
Additional findings on substance use among Australian secondary students 32
Tables 34
Tobacco use among Australian secondary students 34
Alcohol use among Australian secondary students 48
Use of over-the-counter drugs among Australian secondary students 58
Illicit substance use among Australian secondary students 65
Additional findings on substance use among Australian secondary students 77
Appendix 1: National questionnaire 83
Appendix 2: ASSAD data matters 84
ASSAD 2017: Statistics & Trends 1
A
SS
AD
20
17
K
EY
FIN
DIN
GS

2 ASSAD 2017: Statistics & Trends
Smoking and Secondary Students in Australia 2017

ASSAD 2017: Statistics & Trends 3
Alcohol and Secondary Students in Australia 2017

4 ASSAD 2017: Statistics & Trends
Use of Over-the-Counter Drugs and Illicit Substances
by Secondary Students in Australia 2017

ASSAD 2017: Statistics & Trends 5
INTRODUCTION
The Australian Secondary Students’ Alcohol and Drug Survey
The Australian Secondary Students’ Alcohol and Drug Survey (ASSAD) is the largest national survey of teenage substance use in Australia. ASSAD data provides estimates of the current prevalence of tobacco use, alcohol use, and the use of other substances among school students in Australia aged 12 to 17. ASSAD reports also examine trends in the use of these substances over time.
ASSAD is conducted every three years, and ASSAD 2017 was the twelfth survey in a series conducted from 1984 by Cancer Councils nationwide in collaboration with the Western Australian Health Department. The smoking and alcohol section of the survey was first used in 1984, while the section on use of other substances has been included since 1996. Since 1996, federal, state, and territory health departments have collaborated on ASSAD. Previous ASSAD surveys were conducted (tobacco and alcohol only) in 1984, 1987, 1990, and 1993, and (including other substances) in 1996, 1999, 2002, 2005, 2008, and 2011.
We surveyed around 20,000 students for ASSAD 2017. As in previous survey years, teenagers who were not at school in 2017 were not included in the school-based sample.

6 ASSAD 2017: Statistics & Trends
METHOD
Sample selection
The Australian Centre for Education Research (ACER) drew a national school sample based on the most recent available enrolment data from 2016 (excluding schools with less than 100 student enrolments).
Sampling
We drew two school samples for each state and territory. School samples were stratified by education sector (government, Catholic, and independent) to reflect statewide distributions.
In South Australia, feeder primary schools for participating secondary schools were also sampled for Year 7 students.
Targets
Target national sample: 25,000 Survey period: 2017 academic school year Schools approached: 1756 Schools participated: 305 School response rate: 17%
Factors affecting response rate
Reasons for non-participation:
High number of research participation requests
Scheduling (e.g., curriculum pressure, exams, school events)
Staff time
Additional Sample
Schools with similar characteristics to the sampled school were recruited to replace any sampled schools that did not participate, and so maintain a representative sample.

ASSAD 2017: Statistics & Trends 7
Procedure
School approvals
For each sampled school, we requested Principal permission to conduct the survey.
If permission was not granted, we sought the participation of a school in the same geographic catchment and the same education sector.
Parental consent
State education authorities and individual schools have increasingly required active parental consent for student research participation.
When required, parents complete and submit a consent form to approve their child’s participation. Without this consent, the student does not participate. This requirement tends to reduce student participation due to lack of parent response.
Teacher liaison
Response rates are less affected by active consent requirements when teachers actively assist in reminding students and parents to complete the consent form.
Sample of students
Past experience has shown that teachers are more likely to assist with reminders when we surveyed intact classes of students, rather than randomly selected students within year levels. Therefore, when active parental consent was required we randomly selected intact classes within the surveyed year levels. We excluded classes selected by ability or performance to maintain a representative cross-section of the student population in each year level.
We also surveyed intact classes when Principals were otherwise unable to approve participation.
Administration Following the protocols established for past ASSAD surveys, members of the research team attended schools to administer the pencil-and-paper questionnaire to students on an agreed survey date.
Teacher presence
Teacher presence during survey administration was determined by state or territory education department policy, and school policy.
94% of students completed the questionnaire with a teacher present. This proportion was similar in 2011 (90%) and 2014 (88%). When present, teachers stayed at the front or back of the room and did not assist with survey administration.
Overall, students completing the survey with a teacher present did not report significantly lower tobacco use than those who completed the survey without a teacher present.
When a teacher was present, students were more likely to report lifetime tobacco use, and older students (aged 16-17) were more likely to report smoking in the past year. This had no meaningful effect on overall results. For more recent smoking (i.e., past week and past month), teacher presence had no significant effect on students’ responses.
When a teacher was present, students did not report significantly less alcohol use than students who completed the survey without a teacher present. Older students were slightly more likely to report never using alcohol when a teacher was present when they were surveyed, but this did not affect the pattern of overall results. For other substances, teacher presence did not significantly affect student responses, except for slightly higher reports of cannabis use by students with a teacher present.
Questionnaire The 15 page questionnaire was shared in all states and territories and included key questions about use of tobacco, alcohol, analgesics, tranquilisers, and other substances (see Appendix 1). Two questions about students’ mental health and use of health services were also included.
To control for order effects, we used two versions of the questionnaire. For order 1, students completed questions about alcohol use first. For order 2, students completed questions about tobacco use first. Questions about the use of other substances were completed after alcohol and tobacco use questions for both orders.

8 ASSAD 2017: Statistics & Trends
Questions about tobacco use
Past surveys
Most of the questionnaire items related to tobacco use in the core questionnaire were identical to those in previous ASSAD surveys.
Recency These questions assessed lifetime use, use in the past 12 months, use in the past four weeks, and use in each of the seven days preceding the survey.
Cigarette brands
Students who had used tobacco in the past seven days were asked to indicate the brand they smoked and the usual packet size
Source of cigarettes
Students who had used tobacco in the past seven days were asked how they got their last cigarette.
If students indicated that someone had bought their last cigarette for them, they were asked to report who this person was.
Self-perceived smoking status
Students were also asked to report whether they saw themselves as a non-smoker, ex-smoker, occasional smoker, light smoker, or very heavy smoker.
Form of tobacco use
In 2014, we included questions asking students to indicate their use of menthol hybrid or dual-flavoured cigarettes, roll-your-own tobacco, shisha (i.e., hookah or waterpipe tobacco), and cigars/cigarillos. In 2017, we expanded the range of questions asked about e-cigarettes and shisha tobacco.
E-cigarettes Students were asked to report their use of electronic cigarettes, including in the past month, where or from whom they got their last used e-cigarette, and whether they had ever smoked a conventional cigarette before using an e-cigarette.
Questions about alcohol use
Past surveys
We used similar questionnaire items about alcohol use as those included in previous ASSAD surveys.
Recency These questions also assessed ‘ever use’, use in the past 12 months, use in the past four weeks, and use in each day of the week before the survey.
Alcohol type
We asked students who had ever used alcohol to indicate the usual type of alcohol they had consumed (e.g., beer, wine, spirits, premixed).
Source of alcohol
The source of their last alcoholic drink.
Drinking location
Where they had consumed this last drink.
Self-perceived drinking status
Students also completed questions about whether they saw themselves as a non-drinker, party drinker, occasional drinker, light drinker, or heavy drinker.
Adverse outcomes
As in 2014, we asked students to indicate whether any of 20 specified outcomes or events had occurred after they had consumed alcohol in the past year. These outcomes included being sick (vomiting), arguing, being in a fight, verbally abusing someone, needing to go to the hospital, and missing school.
Binge drinking
To assess ‘binge’ drinking behaviour, students were asked about their intention to get drunk when they consumed alcohol, and how many times they had consumed five or more alcoholic drinks on any one occasion in the past two weeks, four weeks, year, and lifetime (never, 1-2 times, 3-5 times, 10-19 times, 20-29 times, 40 or more times).

ASSAD 2017: Statistics & Trends 9
Questions about use of over-the-counter drugs and other substances
Past surveys
We included questions about several categories of over-the-counter and illicit substances in the questionnaire: cannabis, analgesics, tranquilisers, inhalants, hallucinogens, amphetamines, performance- or image-enhancing drugs, ecstasy, cocaine, and opiates.
Recency For each substance, we asked students to indicate the number of times they had used or taken the substance in the past week, past four weeks, past year, and over their lifetime (seven response categories from ‘none’ to ’40 or more times’).
Non-medicinal use
For tranquilisers, steroids, amphetamines, and opiates, we asked explicitly about non-medical use.
Source & reason for use
For analgesics, we asked students to indicate their reasons for use, and how it was obtained. Students who had used tranquilisers were also asked how they were obtained.
Multiple substances
For tranquilisers, cannabis, amphetamines, hallucinogens, and ecstasy, we asked students if they had used any other substance(s) on the same occasion (including alcohol, tobacco, analgesics, tranquilisers, cannabis, amphetamines, and hallucinogens.
Alone or with others
Students who had used cannabis were also asked if they had consumed it alone, with others, or both, and how it was used.
Additional substances
Since 2014, ASSAD has also included questions about student use of ethno-botanical and synthetic substances in the past year (response: yes, no). The questionnaire listed four types of synthetic substances and students could give a free text response to indicate use of other synthetic substances. Students indicated the type of substance used or indicated that they had not used any synthetic substance.
Questions about use of health services for substance use, emotional or behavioural problems
Past surveys
As in 2014, we asked students to indicate whether they had ever been diagnosed or told by a doctor or nurse that they had a mental health condition, and whether they had seen a health professional for alcohol or drug use, or because of emotional or behavioural problems.
10 ASSAD 2017: Statistics & Trends
Substance Definitions
We report the same substance categories as used in the questionnaire, and follow the descriptions and examples provided to student participants.
Alcohol Ordinary beer, low alcohol beer, wine, wine cooler, champagne or sparkling wine, alcoholic cider, alcoholic energy drinks, premixed spirits, spirits, liqueurs, sherry or port.
Amphetamines Amphetamines or speed, uppers, goey, crystal meth, dex, dexies, dexamphetamine, ox blood, methamphetamine or ice, other than for medical reasons.
Analgesics Painkillers/analgesics such as ‘Disprin’, ‘Panadol’ or ‘Nurofen’.
Cannabis Marijuana, grass, hash, cannabis, dope, weed, mull, yardi, ganga, pot, a bong, or a joint.
Cocaine Cocaine.
Ecstasy Ecstasy or XTC, E, MDMA, eccy, X, bickies.
Electronic cigarettes Battery operated electronic cigarettes (e-cigarettes).
Ethno-botanicals Salvia, Kraton, Khat, Kava.
Hallucinogens LSD, acid, trips, magic mushrooms, datura, angel’s trumpet.
Inhalants Deliberately sniffed (inhaled) from spray cans or sniffed things like glue, paint, petrol or thinners in order to get high or for the way it makes you feel.
Opiates Heroin, smack, horse, skag, hammer, H, or other opiates (narcotics) such as methadone, morphine, oxycodone or pethidine other than for medical reasons.
Performance or image enhancing drugs
Steroids, muscle, roids or gear, without a doctor’s prescription to make you better at sport, to increase muscle size or to improve your general appearance.
Shisha tobacco Shisha tobacco or hookah or waterpipe.
Synthetic drugs Synthetic cannabis, emerging synthetic hallucinogens, MDPV, mephedrone, other synthetic substance.
Tobacco Cigarettes.
Tranquilisers Sleeping tablets, tranquillisers, sedatives or benzodiazepines, such as valium, mogadon, diazepam, temazepam (mazzies, vallies, moggies, jellies), serepax (serries) or rohypnol (rohies, barbs), for non-medical reasons.
ASSAD 2017: Statistics & Trends 11
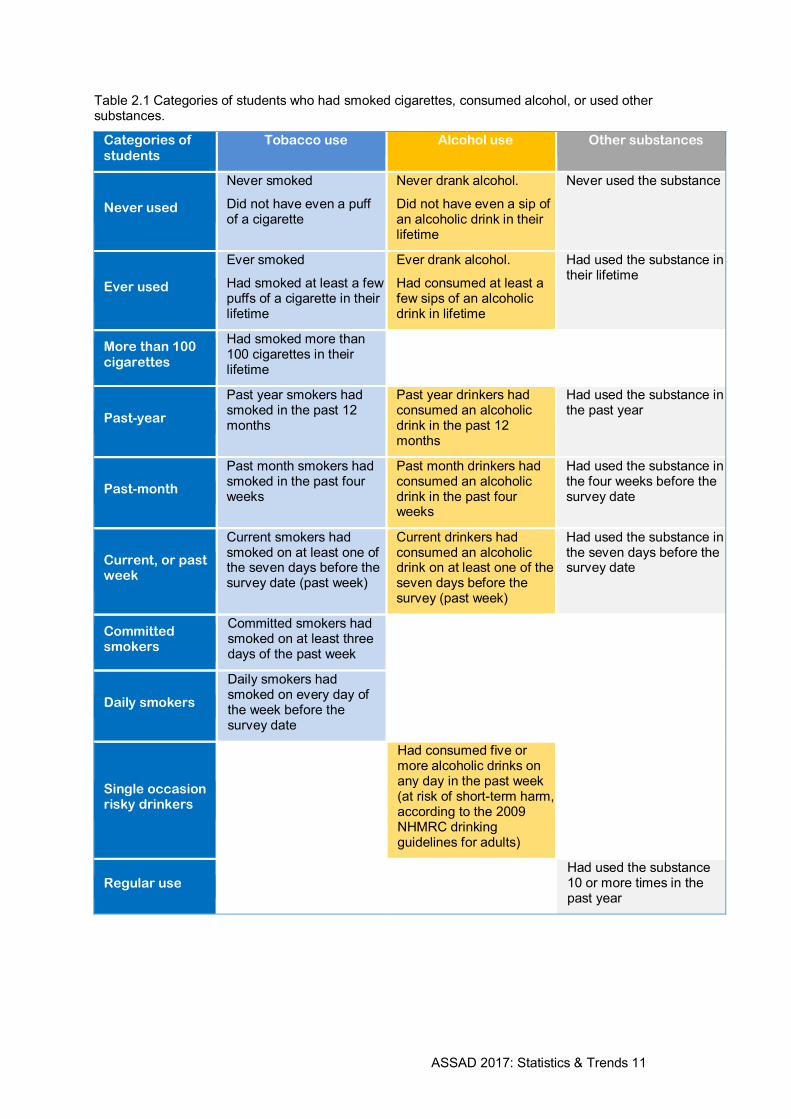
Table 2.1 Categories of students who had smoked cigarettes, consumed alcohol, or used other substances.
Categories of students
Tobacco use Alcohol use Other substances
Never used
Never smoked
Did not have even a puff of a cigarette
Never drank alcohol.
Did not have even a sip of an alcoholic drink in their lifetime
Never used the substance
Ever used
Ever smoked
Had smoked at least a few puffs of a cigarette in their lifetime
Ever drank alcohol.
Had consumed at least a few sips of an alcoholic drink in lifetime
Had used the substance in their lifetime
More than 100 cigarettes
Had smoked more than 100 cigarettes in their lifetime
Past-year
Past year smokers had smoked in the past 12 months
Past year drinkers had consumed an alcoholic drink in the past 12 months
Had used the substance in the past year
Past-month
Past month smokers had smoked in the past four weeks
Past month drinkers had consumed an alcoholic drink in the past four weeks
Had used the substance in the four weeks before the survey date
Current, or past week
Current smokers had smoked on at least one of the seven days before the survey date (past week)
Current drinkers had consumed an alcoholic drink on at least one of the seven days before the survey (past week)
Had used the substance in the seven days before the survey date
Committed smokers
Committed smokers had smoked on at least three days of the past week
Daily smokers
Daily smokers had smoked on every day of the week before the survey date
Single occasion risky drinkers
Had consumed five or more alcoholic drinks on any day in the past week (at risk of short-term harm, according to the 2009 NHMRC drinking guidelines for adults)
Regular use Had used the substance
10 or more times in the past year

ASSAD 2017: Statistics & Trends 12
Recency and frequency of use measures
Tobacco
We use the terms ‘smoker’ and ‘tobacco use’ to refer to cigarette use. We asked students if they had ever smoked in their lifetime, in the past year, and in the past four weeks (Table 2.1). Students entered the number of cigarettes they had smoked on each of the seven days before the survey date. We report the prevalence of tobacco use within these periods by sex and age group. We use several categories to describe students who have used cigarettes during each recency bracket.
Alcohol
Students were asked if they had consumed alcohol in their lifetime, in the past year, and past month (Table 2.1). They entered the number of alcoholic drinks they consumed on each of the seven days before the survey. Prevalence of use within these time periods is reported by sex and age group.
The 2009 NHMRC alcohol use guidelines advise the safest option for people under 18 to be abstinence. We took ever having had an alcoholic drink to indicate not adhering to this guideline. NHMRC guidelines also state that adults who consume five or more drinks on any day are putting themselves at risk. While this guideline is for adults, it gives an estimate of teenage alcohol consumption at risky levels. We examined the percentage of students drinking at levels that could result in short-term harm.
Other substance use
We asked students how many times they had used a particular drug within specified time periods (Table 2.1). For each substance, the prevalence of use within their lifetime, the past
year, and the past month is reported for all male and female students in each age group between 12 and 17. For more common substances (e.g., analgesics and cannabis), we also report weekly use.
For all substances, the recency of use categories overlap and are not mutually exclusive. For example, a student who reported having used a substance in the past week was also included in the estimates of use for all other time periods (i.e., past month, past year, and lifetime use).
Sample size and final data set
During the ASSAD 2017 survey period, 20,019 students from years 7 to 12 were surveyed from schools across Australia. Completed questionnaires from all states and territories were logged by the Centre for Behavioural Research in Cancer at Cancer Council Victoria, before being scanned for the production of electronic data files.
Cancer Council Victoria also cleaned the 2017 ASSAD data following procedures established in previous survey years (see Appendix 2). In the final dataset, students with a large number of missing responses, or whose responses were exaggerated or largely implausible (i.e., ‘nonsense’ responses), were removed from the dataset before analysis.
We removed 406 cases from the data set during data cleaning, due to large amounts of missing data or implausible response patterns. This left 19,613 valid cases in the final data set. Of these, 19,115 were aged between 12 and 17 and provided valid sex data (Table 2.2). We excluded data from students outside this age range and who did not indicate their sex.
Table 2.2 Number of secondary school students aged between 12 and 17 surveyed across Australia in 2017 by sex and age
Age in years
Sex 12 13 14 15 16 17 Total
Male 832 1,818 1,590 1,610 1,774 1,267 8,891
Female 1,030 1,871 1,745 1,729 2,238 1,611 10,224
Total 1,862 3,689 3,335 3,339 4,012 2,878 19,115
ASSAD 2017: Statistics & Trends 13
Data Analysis
Excluded data
We excluded missing, invalid, or multiple responses from analyses for specific questions. To minimise data loss and best represent the sampled population, we included these students’ in analysis of other questions when their responses were valid.
Population weights
We present analyses for students aged 12 to 17. We weighted the data to align the sample with population distributions of 12 to 17 year old students in secondary schools nation-wide. This addressed any possible bias in prevalence estimates as a result of disproportionate sampling of any state or territory, education sector, age, or sex. We used enrolment details collected by the Australian Bureau of Statistics (ABS) in August 2017 of students by sex, age group, and education sector, to calculate weights (Table 2.3, Appendix 2).
Alpha levels
As our sample was large, increasing the probability of type 1 error (i.e., the likelihood of finding a significant difference between groups that does not reflect a real or meaningful difference in the broad population), we interpreted and reported only associations that were statistically significant at an alpha level of .01 (p < .01, or the 99% confidence interval did not include 0) as meaningful effects.
Confidence intervals
ASSAD 2017 provides data from a sample of the total population, not census data. Therefore, we must account for sampling error. Prevalence estimates for the sample are provided for information, even when the confidence interval is wide, and we can be less confident that our results closely reflect the population. For percentages or proportions, sampling error is indicated by the 95% confidence interval calculated for the number of students in the analysed group (e.g., 17 year old females) and the percentage reported (e.g., 20%). For smaller sample sizes and when the estimate is close to 50%, the confidence interval will be large. Therefore, interpretation of these results should be more cautious than when sample size is larger and estimates more extreme. When interpreting results, please refer to the confidence intervals associated with the sample size for each age and sex group (Table 2.4, Appendix 2).
We present results for specific sub-groups (e.g., current smokers, or past-year alcohol consumers). When percentages are reported for a specific sub-group, the confidence interval is likely to be wider than for the sex and age group from which it is drawn. For example, in 2017, the number of students of a specific age (e.g., 12 or 13 year old students) who had used some substances within a time period, was small (e.g., only 16 males and 12 females aged 12 had smoked in the past four weeks). Therefore, we combined data for age-level groups (i.e., 12-15, 16-17) when reporting proportions for some specific sub-groups (e.g., current smokers).

14 ASSAD 2017: Statistics & Trends
TOBACCO USE AMONG AUSTRALIAN SECONDARY STUDENTS
How many Australian secondary school students smoked in 2017?
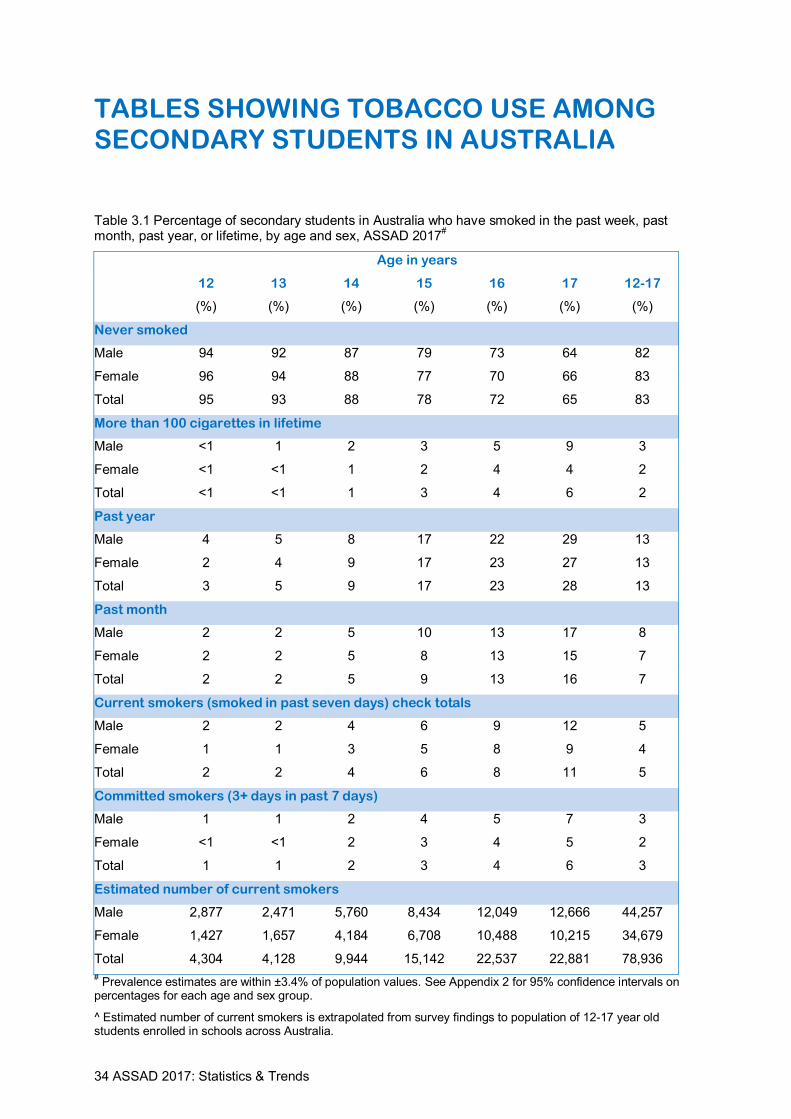
In 2017, 83% of all secondary students in Australia had never smoked (Table 3.1). Levels of experimental and regular smoking increased with age, but by age 17 most students (65%) had still never smoked.
The lowest proportion of students to have smoked in the past month was among 12 year olds (2%), and this level rose to 16% among 17 year olds. A similar pattern was evident among students who had smoked in the past week (i.e., current smokers), from 2% of 12 year olds to 11% of 17 year olds. Only around 3% of all students had smoked on three or more days during the past week (committed smokers), with this being highest among 17 year olds (6%). Committed smoking was observed similarly for both sexes.
We found only one sex difference in smoking rates within these time periods. Among 17 year olds, more male than female students had smoked 100 cigarettes in their lifetime
1. There
was no other sex difference in who had smoked in the past year, month, or week, at any age.
Overall, around 2% of all students had smoked more than 100 cigarettes in their lifetime (6% of 17 year olds).
1 p < 0.01 for all reported significant differences
Patterns in current smoking
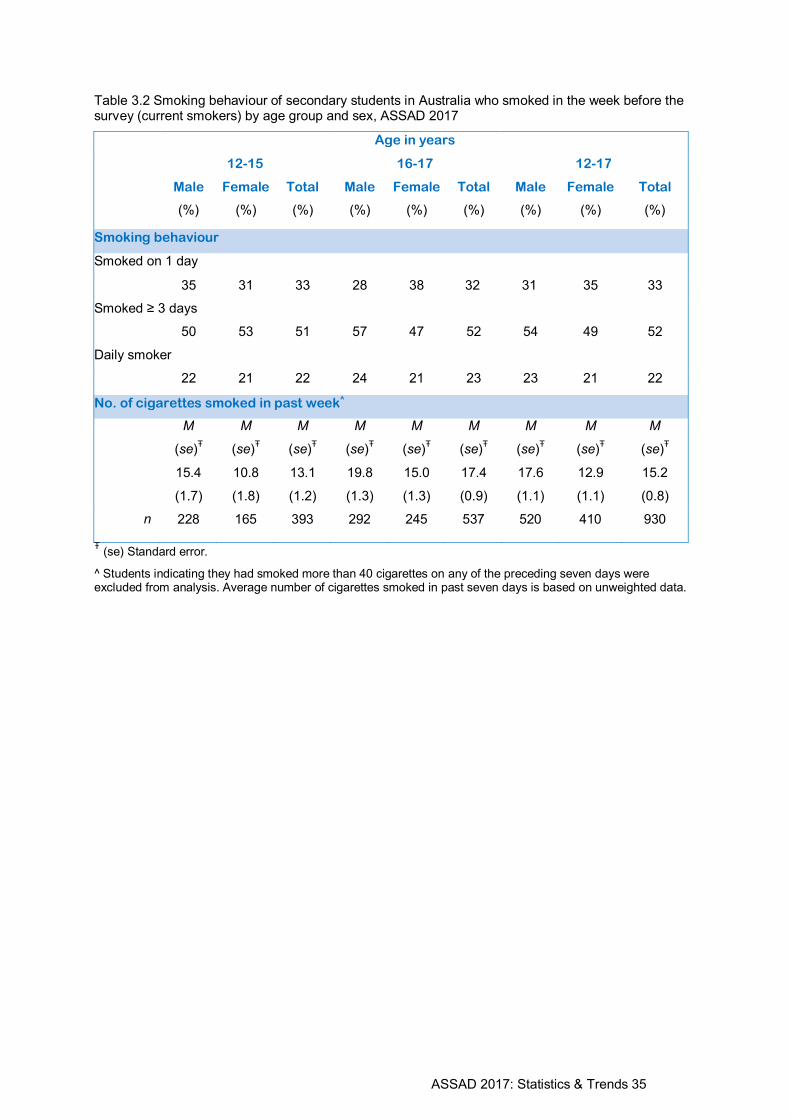
Around 33% of current smokers aged 12 to 17 had smoked on only one day of the past week (Table 3.2). Around half had smoked on three or more days of the past week, with around 22% smoking daily.
The frequency of smoking increased with age among male current smokers. More younger than older male current smokers smoked on only one day of the week (12-15: 35%; 16-17 students: 28%), while more older male current smokers (16-17: 57%; 12-15: 50%) had smoked on three or more days of the past week.
The opposite pattern was evident in female current smokers. For this group, older students were more likely than younger students to smoke on only one day of the past week (16-17: 38%; 12-15: 31%), while younger female current smokers (53%) were more likely than older (47%) to have smoked on at least three days of the past week.
Over all ages, male current smokers were likely to smoke on more days per week than female current smokers. This was mainly due to older male students smoking on more days per week.
Male smokers also used a higher number of cigarettes each week than female current smokers (Table 3.2). Students aged 16 and 17 smoked more cigarettes per week (M = 15) than those aged 12 to 15 (M = 13).
Current smokers who did not smoke every day used substantially fewer cigarettes per week (M = 8) than daily smokers (M = 42). Older daily smokers smoked more cigarettes in a week (M = 46) than younger daily smokers (M = 34). This age effect was greater for female students, as while there was no sex difference in the number of cigarettes smoked per week by older daily smokers, younger female daily smokers tended to smoke fewer cigarettes per week than younger male daily smokers.
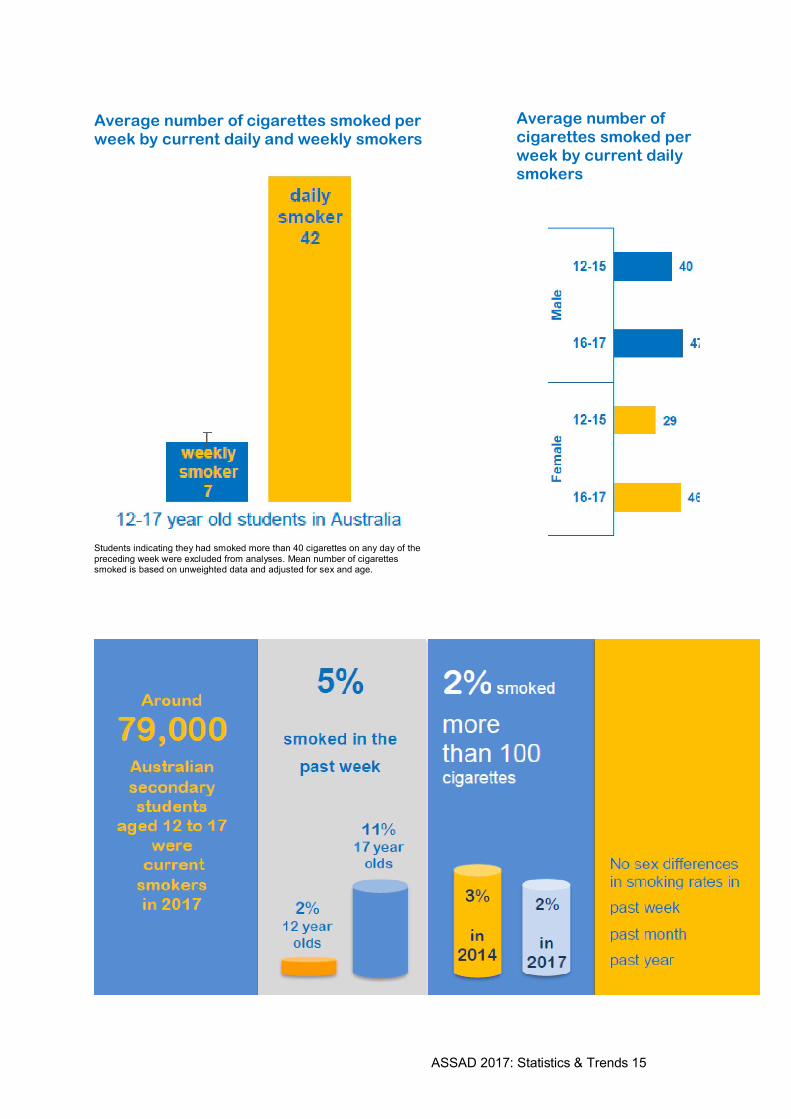
ASSAD 2017: Statistics & Trends 15
Average number of cigarettes smoked per week by current daily and weekly smokers
Students indicating they had smoked more than 40 cigarettes on any day of the preceding week were excluded from analyses. Mean number of cigarettes smoked is based on unweighted data and adjusted for sex and age.
Average number of cigarettes smoked per week by current daily smokers
16 ASSAD 2017: Statistics & Trends
Changes in smoking behaviour
Key indicators
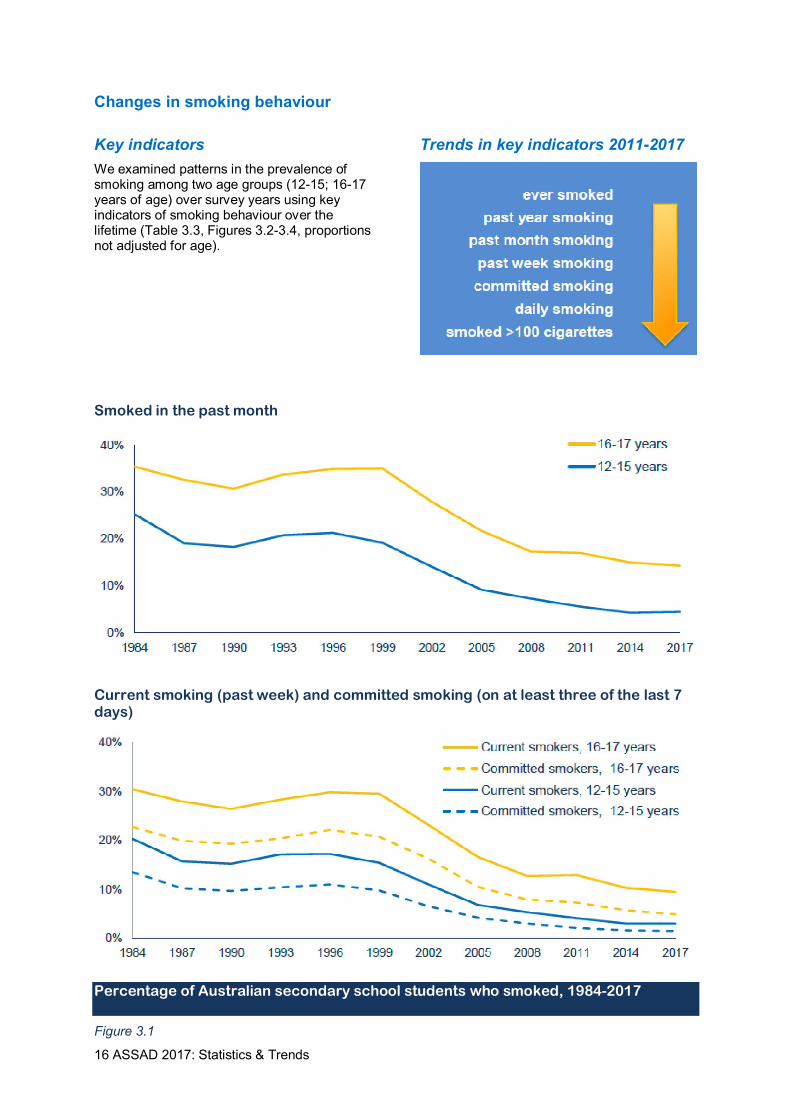
We examined patterns in the prevalence of smoking among two age groups (12-15; 16-17 years of age) over survey years using key indicators of smoking behaviour over the lifetime (Table 3.3, Figures 3.2-3.4, proportions not adjusted for age).
Trends in key indicators 2011-2017
Smoked in the past month
Current smoking (past week) and committed smoking (on at least three of the last 7 days)
Percentage of Australian secondary school students who smoked, 1984-2017
Figure 3.1

ASSAD 2017: Statistics & Trends 17
Trends in prevalence of smoking in the past month
The proportion of students aged 12 to 15 who had smoked in the past month fell from 1984 to 1990, before rising slightly through the 1990s (Figure 3.1). Between 1999 and 2014 the prevalence of past month smoking declined steadily. However, there was no further decline in this age group from 2014 to 2017.
For 16 and 17 year old students, the prevalence of past month smoking followed a similar pattern (Figure 3.1). However, the decline in past month smoking from 1999 plateaued between 2008 and 2011, before lower prevalence was again recorded in 2014 and 2017. The proportion of students in this age group who had smoked in the past month was lower in 2017 than at any other point in this survey series.
Trends in prevalence of current smoking
The prevalence of current smoking from 1984 to 2017 followed very similar patterns to those observed for past month smoking.
Current smoking declined among 12 to 15 year olds in the late 1980s, before increasing through the early 1990s (Table 3.3). After 1996, prevalence rates again declined (Figure 3.1). In 2017, rates of current smoking were the lowest ever observed. We found similar trends for committed smokers (who had smoked on at least three days in the past week) in this age group.
Among older students (aged 16 and 17), current and committed smoking rates declined from 1999 to 2017 (Figure 3.1). The decline between 2014 and 2017 was not significant.
Change in recency and regularity of smoking 2011-2017
Among younger students aged 12 to 15, smoking at some time during the lifetime, and smoking in the past week, were less common in 2017 than in 2011. This decline was also observed in the prevalence of current smoking on three or more days of the past week (committed smokers, Table 3.3). For lifetime smoking, having smoked more than 100 cigarettes in the lifetime, past month and past week smoking, and daily smoking, prevalence was lower in 2017 for all students than in 2011, and there was a trend to lower prevalence than was recorded in 2014 (Table 3.3).
The proportion of students aged 16 and 17 who had reported smoking in 2017 was also generally lower than that reported in 2011 and 2014. There was a significant decline from 2011 to 2017 in lifetime and past week smoking. The significance of change in different recency periods varied somewhat between males and females (Table 3.3).
Fewer students in 2017 reported that they had smoked more than 100 cigarettes in their lifetime than in 2014, with this being a significant decline from 2011. Daily and committed smoking also tended to decline from 2014 to 2017. The proportion of students smoking at these frequencies in 2017 was significantly lower than in 2011.

18 ASSAD 2017: Statistics & Trends
Sources and types of cigarettes smoked by secondary students
Most current smokers did not buy their last cigarette themselves (82%, Table 3.4). It was more common for older students (16-17: 24%) than younger students (12-15: 9%) to buy cigarettes. Around six per cent of current smokers bought their last cigarette from a convenience store (4%) or milk bar (2%).
Most common sources of cigarettes for current smokers aged 12-17
6% Parents
4% Siblings
7% Took from home
26% Friend under 18
22% Friend over 18
15% Someone bought it for me
18% Bought it myself
(Table 3.5)
JPS was the most common brand for current smokers (24%) who indicated a single cigarette brand when asked for their usual brand (37% suggested multiple brands). Winfield (22%) was also commonly used (Table 3.6). Rothmans, Bond St, Marlboro, Longbeach, and Just Smokes, were each smoked by between four and seven per cent of current smokers.
The most common cigarette pack size used by current smokers (Table 3.7) was packs of 20 (34%), followed by packs of roll-your-own (21%) and 25 (12%).
A small percentage of current smokers obtained their cigarettes from packs that contained ‘bonus’ cigarettes (packs of 22: 1%; packs of 26: 3%.). Packs of 25s and roll-your-own packs were more popular among older than younger students, while a greater proportion of younger students reported using packs of 20.
There were few sex differences in pack size, however, roll-your-own use was more common among male than female students in the younger age group.

ASSAD 2017: Statistics & Trends 19
Has it become more difficult for students to buy cigarettes?
Overall, the proportion of current smokers buying cigarettes has declined from the time the series of ASSAD surveys began (Figures 3.2 and 3.3). Among current smokers aged 12 to 15, the proportion buying cigarettes decreased markedly from 1987 to 2002, then declined again from 2005 to 2014, after a small increase was recorded in the 2005 survey (Figure 3.2).The proportion of 12 to 15 year old current smokers (9%) who bought their last cigarette in 2017was similar to 2011 or 2014.
Among older current smokers, the proportion who bought their own cigarettes also declined from 1990 (Figure 3.2). However, the proportion in 2017 was higher (24%) than in 2011 or 2014.
From 1990 to 2002, the proportion of current smokers getting someone else to buy cigarettes for them increased from 5% to 21% among young students, and from 1% to 18% of older students (Figure 3.2). After 2002, rates stayed between 15-19% for younger students (18%). Among older students, the proportion getting someone else to buy cigarettes for them rose from 15% in 2005 to 23% in 2014. In 2017, however, the rate dropped to 13%. Corresponding to this drop, we found more students reported getting cigarettes from friends (2014: 47%; 2017 53%) and other sources, as well as buying cigarettes themselves.
Bought cigarettes themselves
Someone else bought cigarettes for them
Current smokers who bought cigarettes
Figure 3.2

20 ASSAD 2017: Statistics & Trends
Student use of roll-your-own cigarettes
Roll-your-own cigarettes are made by the user from loose fine-cut tobacco, cigarette papers, and an optional filter. Our results showed a large increase since 2014 in students reporting roll-your-own cigarettes when asked about their usual cigarette or tobacco pack size (Table 3.7), most likely in response to price increases in factory-made cigarettes (Note: 11% of current smokers who gave multiple responses to the pack size question were excluded from these analyses).
We also asked students how many times, if ever, they had smoked roll-your-own cigarettes. Most past month smokers had used roll-your-own cigarettes at some time (73%, Table 3.8). While around 16% of past-month smokers had only used roll-your-own tobacco once or twice, 12% had used it three to five times, 17% had used it 6-19 times, and 29% had used it 20 or more times in their lifetime (up from 24% in 2014).
While there was no sex difference in the proportion of students who had ever tried roll-your-own products, male and female students differed in how frequently they were used. Females were more likely than males to have used roll-your-own cigarettes only once or twice, while male students were more likely to have used these products more regularly.
Overall, roll-your own use was greater among older than younger past month smokers. However, use did not increase with each successive year of age, and these patterns varied between the sexes (Table 3.8).
Use of other tobacco products
Since 2014, students have been asked about their use of smoking devices other than regular cigarettes, including electronic cigarettes (e-cigarettes) and shisha or waterpipe tobacco.
Use of shisha or waterpipe tobacco
Shisha tobacco, smoked through waterpipes or hookahs, is often smoked in a social setting with several people inhaling the smoke from a shared device. Only around 9% of all students had ever used shisha or waterpipe tobacco (Table 3.9). More older (16-17: 16%) than younger (12-15: 6%) students had tried it at least once. However, the proportion of older students who had smoked tobacco in this way ten or more times was lower than those who had smoked it only once (ten or more, 3%; less than ten, 5%) or reporting having a few puffs (16-17, 8%). More males (11%) than females (8%) had used shisha at each level, however, these sex differences were small.
Students most commonly used shisha tobacco with friends (74% of users) or family (15% of users), with few using it when alone (8% of users).

ASSAD 2017: Statistics & Trends 21
Use of cigars or cigarillos
Most students (92%) had never used cigars or cigarillos, but older students were slightly more likely to have tried them (e.g., 14% 16 year olds; 16% 17 year olds reported using at least once in their lifetime, Table 3.10). Among 16 to 17 year olds, male students were more likely to have smoked a cigar or cigarillo than female students. Overall, around 4% of all students had used cigars or cigarillos once or twice, and 5% reported smoking them at least three times.
Use of e-cigarettes (vaping)
E-cigarettes are battery-powered devices that heat a liquid to deliver vapour that can contain nicotine, flavour, and other chemicals. Vapers inhale this vapour in the same way as smoking a regular cigarette. In Australia, commercial sale by retail outlets of nicotine e-cigarettes or liquid nicotine for vaping (e-liquid) is illegal. It is also illegal to buy nicotine e-cigarettes or e-liquid nicotine for personal use online without a medical prescription.
For all 12 to 17 year old students, around 13% indicated they had ever used an e-cigarette at least once, and 32% of these students had used one in the past month (Table 3.11). Vaping experience increased with age (4% of 12 year olds, up to 21% of 17 year olds). At each age, male students were more likely to have tried vaping than female students.
Of those who had tried e-cigarettes, younger students were more likely to have used them recently. Around 34% of 12 to 15 year old users and 27% of 16 and 17 year old users reported vaping at least once during the past month. Younger vapers were also more likely to have used e-cigarettes at least three times in the past month (12-15: 16%; 16-17: 10%, Table 3.12). Overall, these results suggest that younger male students were more likely than other student groups to have experimented with vaping, and to have become more regular users.
Students who had vaped most commonly reported getting the last e-cigarette they had used from friends (57%), siblings (8%), or parents (7%). Around 12% of students reported buying an e-cigarette themselves. Students aged 16-17 were more likely to have bought a vaping device (17%) than younger students (9%).
Of the students who had ever used an e-cigarette (n = 2,410), 48% reported that they had never smoked a tobacco cigarette before their first vape (Table 3.13). Around 25% of these students who had vaped before ever smoking, reported later trying tobacco cigarettes (18% had smoked in the past year; 11% had smoked in the past month; and 5% became current smokers). These results showed significantly higher levels of experimentation and more regular smoking than in students who had not vaped or had vaped only after first smoking (17% had ever smoked; 12% in the past year; 7% in the past month). Our findings suggest that students who experiment with e-cigarettes are more likely to later try tobacco cigarettes than those who have never vaped.
Female students (59%) were more likely than male students (47%) to have smoked before trying e-cigarettes. This result is consistent with the idea that male students were more likely than female students to be attracted to novel vaping products, even when they had not previously experimented with cigarettes.
Of the students who had smoked before they tried e-cigarettes, 20% had only smoked a few puffs of a cigarette, 11% had smoked fewer than 10 cigarettes, and 21% (male 18%; female 27%) had smoked 10 or more. The proportion of e-cigarette users who had smoked more regularly before trying e-cigarettes was greater with age. It was more common among younger students (64%) than older students to try an e-cigarette without ever having previously smoked more than 10 tobacco cigarettes.
22 ASSAD 2017: Statistics & Trends
How do students see their own smoking?
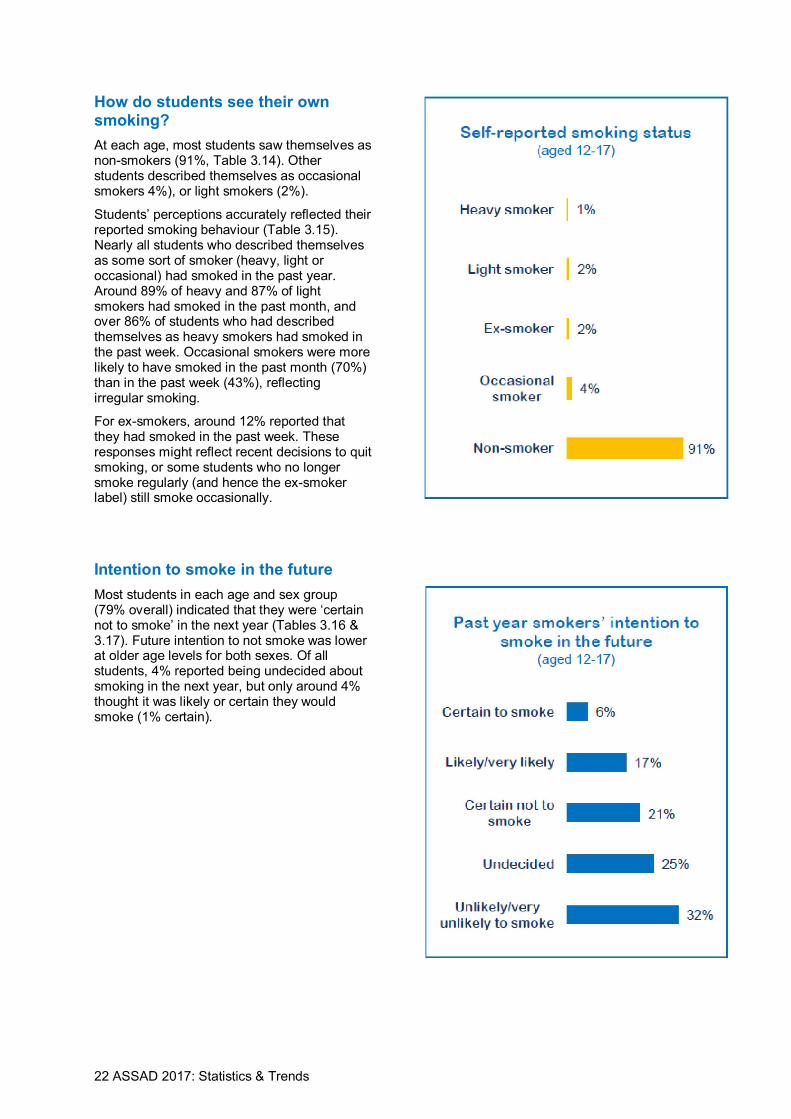
At each age, most students saw themselves as non-smokers (91%, Table 3.14). Other students described themselves as occasional smokers 4%), or light smokers (2%).
Students’ perceptions accurately reflected their reported smoking behaviour (Table 3.15). Nearly all students who described themselves as some sort of smoker (heavy, light or occasional) had smoked in the past year. Around 89% of heavy and 87% of light smokers had smoked in the past month, and over 86% of students who had described themselves as heavy smokers had smoked in the past week. Occasional smokers were more likely to have smoked in the past month (70%) than in the past week (43%), reflecting irregular smoking.
For ex-smokers, around 12% reported that they had smoked in the past week. These responses might reflect recent decisions to quit smoking, or some students who no longer smoke regularly (and hence the ex-smoker label) still smoke occasionally.
Intention to smoke in the future
Most students in each age and sex group (79% overall) indicated that they were ‘certain not to smoke’ in the next year (Tables 3.16 & 3.17). Future intention to not smoke was lower at older age levels for both sexes. Of all students, 4% reported being undecided about smoking in the next year, but only around 4% thought it was likely or certain they would smoke (1% certain).

ASSAD 2017: Statistics & Trends 23
ALCOHOL USE AMONG AUSTRALIAN SECONDARY STUDENTS
How many Australian secondary school students drank alcohol?
The prevalence of alcohol consumption among Australian secondary students in 2017 is an indicator of the importance of drinking alcohol in contemporary adolescent cultures. Student reports of alcohol use reflect the degree of non-adherence to current NHMRC guidelines recommending people under the age of 18 do not use any alcohol.
Of all students surveyed, 34% reported never having consumed alcohol (Table 4.1). Alcohol use was more common among older students, with 76% of 17 year olds having consumed alcohol in the past year, compared to 17% of 12 year olds (Table 4.1).
Current drinking (in the past week) was more common among older than younger students. Overall (excepting 14 year olds), a greater proportion of male (16%) than female (14%) students were current drinkers.
Risky drinking
While any alcohol consumption is risky for teenagers, drinking five or more drinks on one occasion in the past week indicates risky levels of drinking for adults, according to the NHMRC guidelines. In 2017, risky drinking was more common among males than females at all ages, except age 14 (Table 4.1).
Around 65% of all students surveyed reported risky drinking on at least one occasion in their lifetime (Table 4.2). Risky drinking in the last two weeks, past month, past year, and in their lifetime, was more common in older than younger students. Risky drinking was more common among male than female older students, but there were no sex differences in students aged 12 to 15.
Drinking five or more drinks on at least one occasion in the past week among current drinkers followed a similar pattern, with the proportion greater among male than female students, and among older than younger students (Table 4.3). Among current drinkers (Table 4.2), male students reported a higher average number of drinks consumed (M = 8) than female students (M = 5), and older students drank more on average (M = 7) than younger students (M = 5).

24 ASSAD 2017: Statistics & Trends
Changes in drinking behaviour
Among 12 to 15 year olds, current drinking declined during the 1980s, but increased in the 1990s to peak in 2002 (Table 4.4). Prevalence then again declined to 2014 but has not changed significantly between 2014 and 2017 (Figure 4.1).
There was little change in patterns of risky drinking in this age group (i.e., consuming five or more drinks on a single occasion in the past week) between 1984 and 1999, but prevalence declined between 2002 and 2014. Prevalence in the 12 to 15 year age group did not change between 2014 and 2017. However, lifetime drinking in this age group was lower in 2017 than in 2011 (Table 4.4).
Among 16 and 17 year olds, current drinking became more common through the mid to late 1990s but declined between 1999 and 2002 (Figure 4.1). This trend to lower prevalence continued to 2017, when current drinking was
significantly lower than in 2011. This was mainly due to lower proportions of older female students being current drinkers (Table 4.4).
Lifetime drinking prevalence in this older age group in 2017 was lower than in 2011 (Table 4.4). However, while there was a trend to lower past month drinking by older male and female students in 2017, changes from 2011 and 2014 were not significant.
Risky drinking in the past week was lower among both male and female 16 and 17 year olds in 2017 than in 2011. For older current drinkers, risky drinking levels were also lower in 2017 than in 2011 (Table 4.4). This suggests that while the percentage of older students that used alcohol in these time periods has declined only slightly from previous years, these older students who consumed alcohol were drinking less when they drank.
Current and risky drinkers
Figure 4.1 † Students who drank alcohol at least once in the past week were defined as current drinkers. The 2009 NHMRC Australian drinking guidelines recommend no alcohol consumption as the safest option for people under 18. Therefore, drinking prevalence reflects the proportion of students who did not adhere to this guideline.
# Those that drank five or more drinks on one occasion were considered to be putting themselves at risk of short-term harm according to the 2009 NHMRC drinking guidelines for adults.

ASSAD 2017: Statistics & Trends 25
What type of alcohol do students drink?
For current drinkers of all ages, premixed spirits (37%), and beer (22%) were the most commonly consumed types of alcohol, but male and female students differed markedly in the type of alcohol last consumed (Table 4.5). Drinking premixed spirits was more common among females (47%) than males (29%) for both younger and older students. Beer was predominantly preferred by males in both age groups (age 12-17, males: 34%; females; 6%). Younger current drinkers were more likely than older students to drink wine. Use of alcoholic energy drinks did not differ by sex.
Changes in the type of alcohol students drink
In 2017, consumption of non-premixed spirits was less common for male current drinkers than in 2011 or 2014. However, there was no change from 2014 in their use of premixed spirits (Table 4.6). Consumption of premixed spirits by female current drinkers was more common in 2017 than in 2014, largely due to increased use of alcoholic energy drinks (Tables 4.5 and 4.6).
How do students access alcohol?
Parents were the most common source of alcohol (Table 4.7). Both older (28%) and younger current drinkers (21%) more commonly obtained alcohol from a friend than had someone else buy it.
It was more common for older (13%) than younger (10%) current drinkers to get someone else to buy them alcohol. When someone else bought alcohol for students, this was most commonly a friend who was 18 or older (60%), rather than a stranger (11%, Table 4.8).
26 ASSAD 2017: Statistics & Trends
Drinking locations and adult supervision
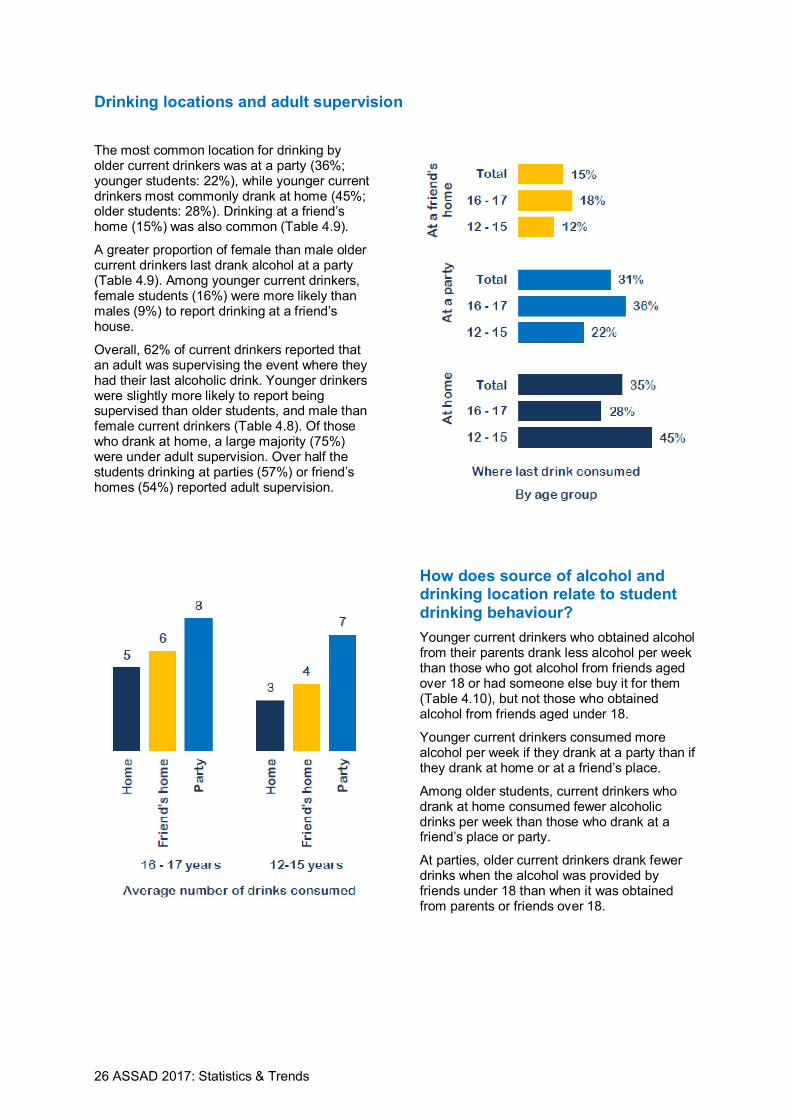
The most common location for drinking by older current drinkers was at a party (36%; younger students: 22%), while younger current drinkers most commonly drank at home (45%; older students: 28%). Drinking at a friend’s home (15%) was also common (Table 4.9).
A greater proportion of female than male older current drinkers last drank alcohol at a party (Table 4.9). Among younger current drinkers, female students (16%) were more likely than males (9%) to report drinking at a friend’s house.
Overall, 62% of current drinkers reported that an adult was supervising the event where they had their last alcoholic drink. Younger drinkers were slightly more likely to report being supervised than older students, and male than female current drinkers (Table 4.8). Of those who drank at home, a large majority (75%) were under adult supervision. Over half the students drinking at parties (57%) or friend’s homes (54%) reported adult supervision.
How does source of alcohol and drinking location relate to student drinking behaviour?
Younger current drinkers who obtained alcohol from their parents drank less alcohol per week than those who got alcohol from friends aged over 18 or had someone else buy it for them (Table 4.10), but not those who obtained alcohol from friends aged under 18.
Younger current drinkers consumed more alcohol per week if they drank at a party than if they drank at home or at a friend’s place.
Among older students, current drinkers who drank at home consumed fewer alcoholic drinks per week than those who drank at a friend’s place or party.
At parties, older current drinkers drank fewer drinks when the alcohol was provided by friends under 18 than when it was obtained from parents or friends over 18.

ASSAD 2017: Statistics & Trends 27
What do students think about their own drinking?
We asked students to select the most appropriate description of their drinking behaviour (Table 4.11). Around 70% of all students saw themselves as non-drinkers. This proportion was lower among older than younger students of both sexes.
It was more common for older students to perceive themselves to be occasional or party drinkers, and this peaked among 17 year olds (26% occasional drinkers; 30% party drinkers).
Among self-identified drinkers aged 14 and over, female students were more likely than males to describe themselves as party drinkers. At all ages, male students were more likely than female students to describe themselves as heavy drinkers.
Overall, students’ descriptions of their own drinking tended to accurately reflect where they had last consumed alcohol and how they had obtained their alcohol (Table 4.12). Students who had consumed alcohol in the past week but identified as non-drinkers or occasional drinkers had mainly accessed their alcohol through parents and drank at home. Nearly half of all current drinkers who identified as party drinkers had consumed their last drink at a party. Among party drinkers, younger students most commonly accessed alcohol through friends, but parents were the most common source for older students.
Intention to get drunk
Around 38% of current drinkers reported that they intended to get drunk most or every time they drank (Table 4.14). This was more likely for older than younger students. Among older current drinkers, male students were more likely than females to intend to get drunk.
Negative experiences after drinking
A greater proportion of male than female students reported having experienced only one negative outcome after drinking alcohol (Table 4.13). However, experiencing a higher number of negative outcomes was more common among female than male students, and older than younger students.
Overall, 28% of current drinkers reported doing something while drinking alcohol that they later regretted.
28 ASSAD 2017: Statistics & Trends
USE OF OVER-THE-COUNTER DRUGS BY AUSTRALIAN SECONDARY STUDENTS
Analgesics
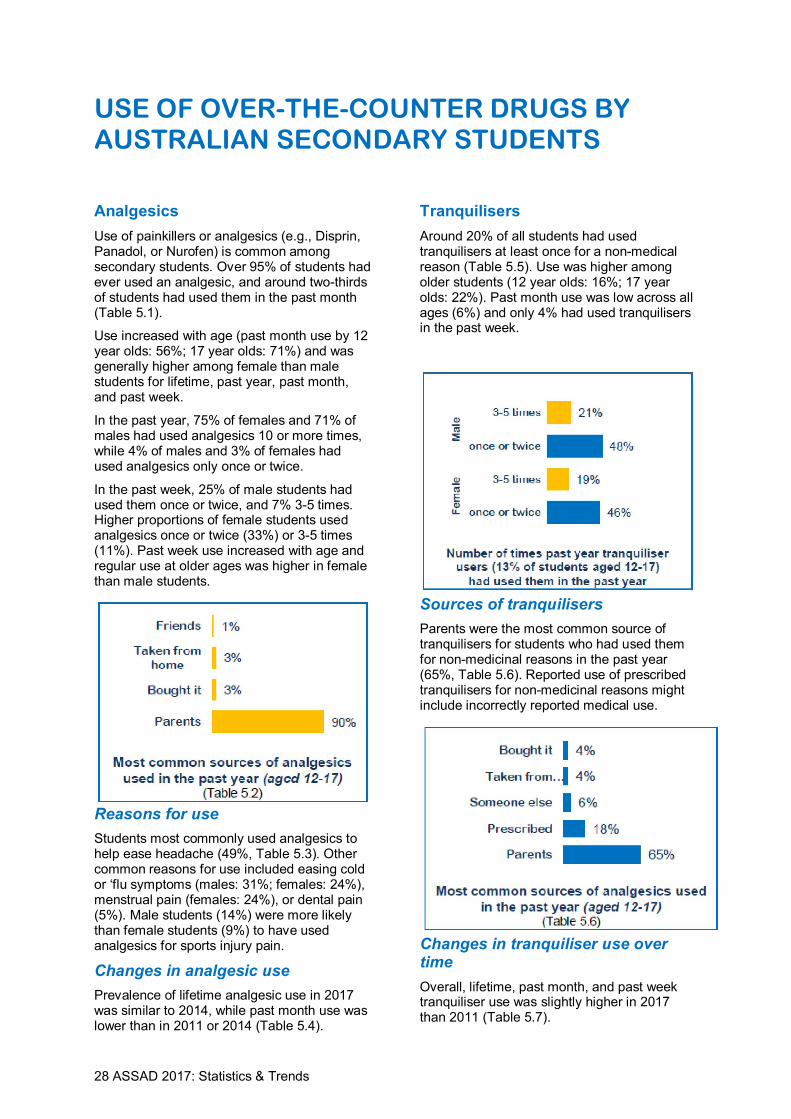
Use of painkillers or analgesics (e.g., Disprin, Panadol, or Nurofen) is common among secondary students. Over 95% of students had ever used an analgesic, and around two-thirds of students had used them in the past month (Table 5.1).
Use increased with age (past month use by 12 year olds: 56%; 17 year olds: 71%) and was generally higher among female than male students for lifetime, past year, past month, and past week.
In the past year, 75% of females and 71% of males had used analgesics 10 or more times, while 4% of males and 3% of females had used analgesics only once or twice.
In the past week, 25% of male students had used them once or twice, and 7% 3-5 times. Higher proportions of female students used analgesics once or twice (33%) or 3-5 times (11%). Past week use increased with age and regular use at older ages was higher in female than male students.
Reasons for use
Students most commonly used analgesics to help ease headache (49%, Table 5.3). Other common reasons for use included easing cold or ‘flu symptoms (males: 31%; females: 24%), menstrual pain (females: 24%), or dental pain (5%). Male students (14%) were more likely than female students (9%) to have used analgesics for sports injury pain.
Changes in analgesic use
Prevalence of lifetime analgesic use in 2017 was similar to 2014, while past month use was lower than in 2011 or 2014 (Table 5.4).
Tranquilisers
Around 20% of all students had used tranquilisers at least once for a non-medical reason (Table 5.5). Use was higher among older students (12 year olds: 16%; 17 year olds: 22%). Past month use was low across all ages (6%) and only 4% had used tranquilisers in the past week.
Sources of tranquilisers
Parents were the most common source of tranquilisers for students who had used them for non-medicinal reasons in the past year (65%, Table 5.6). Reported use of prescribed tranquilisers for non-medicinal reasons might include incorrectly reported medical use.
Changes in tranquiliser use over time
Overall, lifetime, past month, and past week tranquiliser use was slightly higher in 2017 than 2011 (Table 5.7).
ASSAD 2017: Statistics & Trends 29
ILLICIT SUBSTANCE USE AMONG AUSTRALIAN SECONDARY STUDENTS
Cannabis
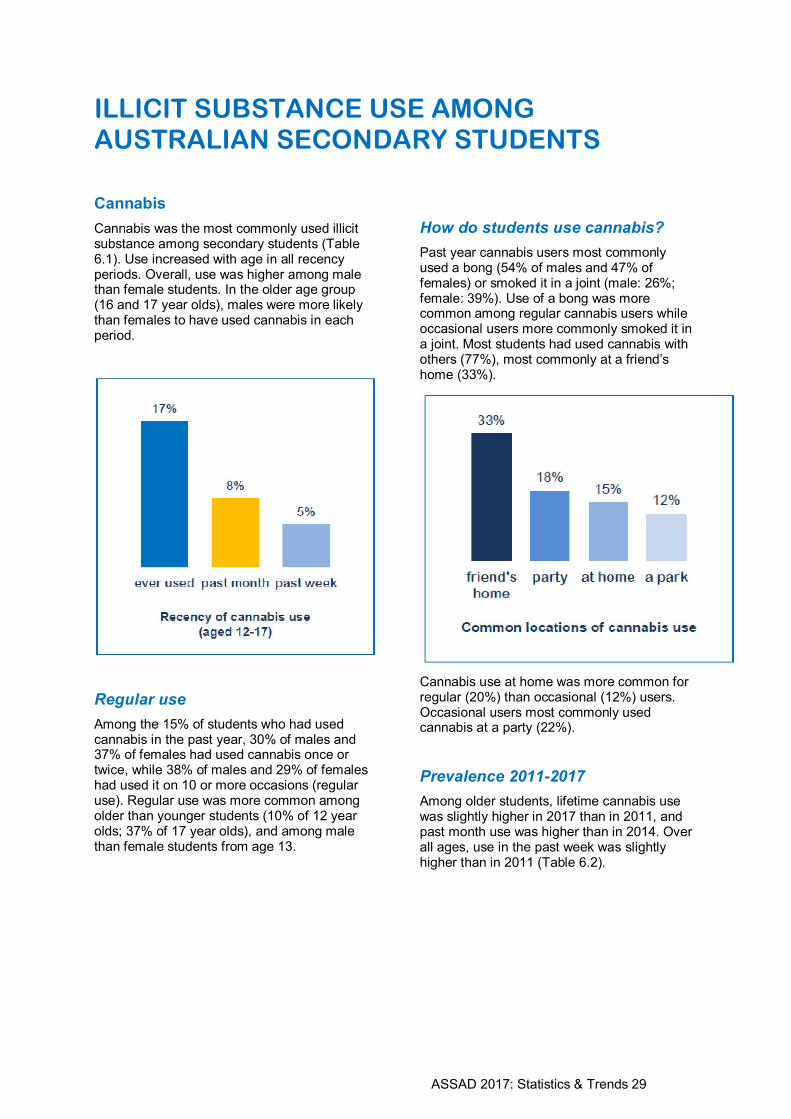
Cannabis was the most commonly used illicit substance among secondary students (Table 6.1). Use increased with age in all recency periods. Overall, use was higher among male than female students. In the older age group (16 and 17 year olds), males were more likely than females to have used cannabis in each period.
Regular use
Among the 15% of students who had used cannabis in the past year, 30% of males and 37% of females had used cannabis once or twice, while 38% of males and 29% of females had used it on 10 or more occasions (regular use). Regular use was more common among older than younger students (10% of 12 year olds; 37% of 17 year olds), and among male than female students from age 13.
How do students use cannabis?
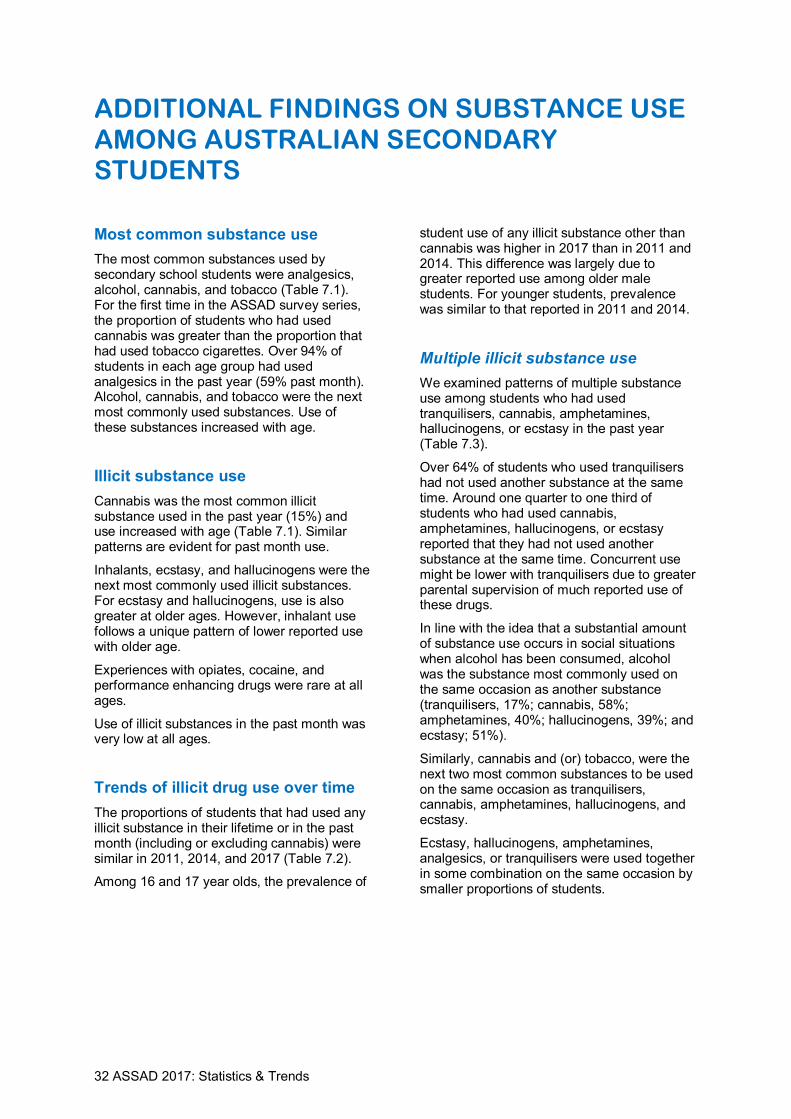
Past year cannabis users most commonly used a bong (54% of males and 47% of females) or smoked it in a joint (male: 26%; female: 39%). Use of a bong was more common among regular cannabis users while occasional users more commonly smoked it in a joint. Most students had used cannabis with others (77%), most commonly at a friend’s home (33%).
Cannabis use at home was more common for regular (20%) than occasional (12%) users. Occasional users most commonly used cannabis at a party (22%).
Prevalence 2011-2017
Among older students, lifetime cannabis use was slightly higher in 2017 than in 2011, and past month use was higher than in 2014. Over all ages, use in the past week was slightly higher than in 2011 (Table 6.2).

30 ASSAD 2017: Statistics & Trends
Amphetamines
In 2017, we asked students about their use of two categories of amphetamines: dexamphetamines (e.g., dex, dexies); and methamphetamines (e.g., speed, meth, ice) as patterns of use of these drug types were expected to differ.
Very few students reported that they had ever used amphetamines for non-medicinal reasons (dexamphetamines: 2%; methamphetamines: 2%, Table 6.3).
The highest prevalence of lifetime amphetamine use was among older students (16-17, dexamphetamines: 2%; methamphetamines: 3%). Only 1% of 12 year olds had ever tried any amphetamine for non-medicinal purposes.
Overall, use in the past month (1%) or year (1-2%) was also very low for any kind of amphetamine and 41% of students who reported past year use of dexamphetamines (methamphetamines: 34%) had tried them only once or twice.
Amphetamine use 2011-2017
In previous ASSAD surveys, students were asked about their use of amphetamines for non-medicinal reasons using only a single category (‘amphetamines’). Therefore, we report 2017 findings for both dexamphetamines and methamphetamines against longer term trends in use for the larger category of amphetamines (Table 6.4). Overall patterns of use showed no meaningful difference from previous survey years.
Opiates
Student use of heroin or other opiates (e.g., morphine, oxycodone, codeine) other than for medical reasons was extremely low (Table 6.5).
In the past year, 1% of students reported using heroin, and around 30% of these past year users had used it only once or twice.
For the first time in 2017, we asked students about their use of other opiates separate from their use of heroin (Table 6.5). Results suggest that students might have reported medicinal as well as non-medicinal use of these drugs (6% ever used). Around half of those who reported having used opiates in the past year had used them only once or twice. Past month use was reported by 2% of students.
Opiate use 2011-2017
We made no direct comparisons between reported use of heroin or other opiates in 2017 and levels of opiate use (including heroin) reported in earlier survey years, as students were asked to report use for different drug categories. However, we report 2011 and 2014 use of opiates (including heroin) against the 2017 figures for heroin (Table 6.6).
Generally, the very low prevalence of heroin use reported in 2017 is consistent with the similarly low prevalence of opiate use reported in 2011 and 2014.
The levels of other opiate use reported in 2017 are likely to reflect both prescribed and non-prescribed use of these drugs due to misinterpretation of the survey questions by students.

ASSAD 2017: Statistics & Trends 31
Cocaine
Most secondary school students had never tried cocaine (98%, Table 6.7). Only 1% of students had used cocaine in the past month.
Among the 2% who had used cocaine in the past year, 45% of males and 66% of females had used them only once or twice.
Overall, prevalence was very low in all years. Lifetime cocaine use in 2017 among older students was slightly higher than in 2011, and past month use was also very slightly higher.
Among younger students, prevalence did not differ meaningfully from that found in 2014 or 2011 (Table 6.8).
Inhalants
Unlike other illicit substances used by students, inhalant use tends to be reported at a higher rate among younger than older students. Overall, only 18% of all students had deliberately sniffed inhalants at least once in their lifetime (8% past month; 4% past week, Table 6.9).
Of the 13% of students who had used inhalants in the past year, 43% had tried them only once or twice, and 19% were regular users (used over 10 times in the past year).
Prevalence did not differ between 2011 and 2017 among younger students (Table 6.10). In older students, reported lifetime and past month inhalant use was higher in 2017 than in 2014.
Hallucinogens
Student use of hallucinogens such as LSD was extremely low (Table 6.11). Only 4% of all secondary students had ever used hallucinogens and over half of the students who had used hallucinogens in the past year had only used them once or twice.
Use increased with age, peaking at 6% of 17 year olds, but only 1% of all students reported use in the past month.
It was more common for male than female students to have tried hallucinogens in the older age group.
In 2017, a slightly higher proportion of male students reported having used hallucinogens in the past month than in 2014 (Table 6.12), but lifetime use of hallucinogens did not differ between 2011 and 2017. There was no difference observed for female students in past month or lifetime use.
Ecstasy
Most secondary school students (94%) had never used ecstasy (Table 6.13). Lifetime use increased with age (13 year olds, 3%; 17 year olds. 12%). In the past year, 5% of students had used ecstasy (past month, 2%), with around 47% of these students having used it only once or twice.
Male students were more likely than female students to have used ecstasy in each recency period.
For both younger and older students, the prevalence of lifetime ecstasy use was higher than in 2011 and 2014. While past month use has increased similarly since 2011 and 2014 in younger students, prevalence is very low (Table 6.14).
Performance enhancing drugs
Very few secondary school students reported use of performance or image enhancing drugs that had not been prescribed (Table 6.15). Only 3% of all students had ever used these kinds of drugs without a prescription to improve sporting ability, increase muscle size, or improve appearance. 1% reported use in the past month. Among older students, use was more common among male than female students.
The vast majority (98%) of past year users (2% of all students) had used these drugs only once or twice.
There was no change in lifetime or past month use of performance enhancing drugs from 2011 to 2017 (Table 6.16).
Ethno-botanicals
Most secondary school students had not used ethno-botanicals such as Salvia, Kraton, Khat, or Kava, in the past year (1%, Table 6.17)
Synthetic drugs
Student use of synthetic drugs, such as synthetic cannabis and MDPV, in the past year was also rare among secondary school students (97% had not used, Table 6.17). Of those reported, synthetic cannabis was the most common synthetic drug used (2%) and use increased with age.
32 ASSAD 2017: Statistics & Trends
ADDITIONAL FINDINGS ON SUBSTANCE USE AMONG AUSTRALIAN SECONDARY STUDENTS
Most common substance use
The most common substances used by secondary school students were analgesics, alcohol, cannabis, and tobacco (Table 7.1). For the first time in the ASSAD survey series, the proportion of students who had used cannabis was greater than the proportion that had used tobacco cigarettes. Over 94% of students in each age group had used analgesics in the past year (59% past month). Alcohol, cannabis, and tobacco were the next most commonly used substances. Use of these substances increased with age.
Illicit substance use
Cannabis was the most common illicit substance used in the past year (15%) and use increased with age (Table 7.1). Similar patterns are evident for past month use.
Inhalants, ecstasy, and hallucinogens were the next most commonly used illicit substances. For ecstasy and hallucinogens, use is also greater at older ages. However, inhalant use follows a unique pattern of lower reported use with older age.
Experiences with opiates, cocaine, and performance enhancing drugs were rare at all ages.
Use of illicit substances in the past month was very low at all ages.
Trends of illicit drug use over time
The proportions of students that had used any illicit substance in their lifetime or in the past month (including or excluding cannabis) were similar in 2011, 2014, and 2017 (Table 7.2).
Among 16 and 17 year olds, the prevalence of
student use of any illicit substance other than cannabis was higher in 2017 than in 2011 and 2014. This difference was largely due to greater reported use among older male students. For younger students, prevalence was similar to that reported in 2011 and 2014.
Multiple illicit substance use
We examined patterns of multiple substance use among students who had used tranquilisers, cannabis, amphetamines, hallucinogens, or ecstasy in the past year (Table 7.3).
Over 64% of students who used tranquilisers had not used another substance at the same time. Around one quarter to one third of students who had used cannabis, amphetamines, hallucinogens, or ecstasy reported that they had not used another substance at the same time. Concurrent use might be lower with tranquilisers due to greater parental supervision of much reported use of these drugs.
In line with the idea that a substantial amount of substance use occurs in social situations when alcohol has been consumed, alcohol was the substance most commonly used on the same occasion as another substance (tranquilisers, 17%; cannabis, 58%; amphetamines, 40%; hallucinogens, 39%; and ecstasy; 51%).
Similarly, cannabis and (or) tobacco, were the next two most common substances to be used on the same occasion as tranquilisers, cannabis, amphetamines, hallucinogens, and ecstasy.
Ecstasy, hallucinogens, amphetamines, analgesics, or tranquilisers were used together in some combination on the same occasion by smaller proportions of students.

ASSAD 2017: Statistics & Trends 33
Substance use education
Generally, the greatest focus on substance use education as part of school curricula is during years 8 to 10. ASSAD 2017 results reflect this approach, with student recall of lessons in the previous year (2016) about substance use being highest among 14 to 16 year olds (Table 7.4).
Close to half of all students aged 14 to 16 reported having had more than one lesson about smoking tobacco.
Over half of students aged 14 to 17 reported more than one lesson about drinking alcohol, indicating that alcohol education tends to extend into the year 11 curriculum.
Reports of lessons about illicit substance use were lowest among 12 year olds (50% did not recall any lessons) and highest among 15 and 16 year olds (84% recalled any lessons). Nearly 80% of 17 year olds also reported substance use education in the previous year
Student use of health services for substance use, emotional problems, or behavioural problems
To evaluate students’ access to health professionals for substance use, emotional or behavioural problems, we asked students to report if they had ever been diagnosed or told they have a mental health condition, and whether they had used a treatment service.
A small proportion of students (11%) reported that they had been diagnosed or told by a doctor or nurse that they had a mental health condition, while 74% had not (Table 7.5). The proportion of students who had received a diagnosis increased with age, from 5% of 12 year olds to 19% of 17 year olds and was higher among female than male students.
Around 17% of all students had seen a health professional in the past year for alcohol or drug use, or emotional or behavioural problems (Table 7.6). However, most health professionals were seen for emotional or behavioural problems. As with the proportions of students that had been diagnosed with a mental health condition, a greater proportion of female (20%) than male students (11%) had sought professional help for emotional or behaviour problems. The proportions of female students who had seen a health professional for emotional or behavioural problems tended to increase with age (12 year olds: 12%; 17 year olds: 27%). However, there was no age difference in the proportions of male students who had seen a health professional for these reasons.
Association between mental health diagnosis and substance use
For both sexes, substance use was higher among students who had reported a mental health diagnosis than those who had not (Table 7.7).
34 ASSAD 2017: Statistics & Trends
TABLES SHOWING TOBACCO USE AMONG SECONDARY STUDENTS IN AUSTRALIA
Table 3.1 Percentage of secondary students in Australia who have smoked in the past week, past month, past year, or lifetime, by age and sex, ASSAD 2017
#
Age in years
12
(%)
13
(%)
14
(%)
15
(%)
16
(%)
17
(%)
12-17
(%)
Never smoked
Male 94 92 87 79 73 64 82
Female 96 94 88 77 70 66 83
Total 95 93 88 78 72 65 83
More than 100 cigarettes in lifetime
Male <1 1 2 3 5 9 3
Female <1 <1 1 2 4 4 2
Total <1 <1 1 3 4 6 2
Past year
Male 4 5 8 17 22 29 13
Female 2 4 9 17 23 27 13
Total 3 5 9 17 23 28 13
Past month
Male 2 2 5 10 13 17 8
Female 2 2 5 8 13 15 7
Total 2 2 5 9 13 16 7
Current smokers (smoked in past seven days) check totals
Male 2 2 4 6 9 12 5
Female 1 1 3 5 8 9 4
Total 2 2 4 6 8 11 5
Committed smokers (3+ days in past 7 days)
Male 1 1 2 4 5 7 3
Female <1 <1 2 3 4 5 2
Total 1 1 2 3 4 6 3
Estimated number of current smokers
Male 2,877 2,471 5,760 8,434 12,049 12,666 44,257
Female 1,427 1,657 4,184 6,708 10,488 10,215 34,679
Total 4,304 4,128 9,944 15,142 22,537 22,881 78,936 # Prevalence estimates are within ±3.4% of population values. See Appendix 2 for 95% confidence intervals on percentages for each age and sex group.
^ Estimated number of current smokers is extrapolated from survey findings to population of 12-17 year old students enrolled in schools across Australia.
ASSAD 2017: Statistics & Trends 35
Table 3.2 Smoking behaviour of secondary students in Australia who smoked in the week before the survey (current smokers) by age group and sex, ASSAD 2017
Age in years
12-15 16-17 12-17
Male
(%)
Female
(%)
Total
(%)
Male
(%)
Female
(%)
Total
(%)
Male
(%)
Female
(%)
Total
(%)
Smoking behaviour
Smoked on 1 day
35 31 33 28 38 32 31 35 33
Smoked ≥ 3 days
50 53 51 57 47 52 54 49 52
Daily smoker
22 21 22 24 21 23 23 21 22
No. of cigarettes smoked in past week^
M
(se)Ŧ
15.4
(1.7)
M
(se)Ŧ
10.8
(1.8)
M
(se)Ŧ
13.1
(1.2)
M
(se)Ŧ
19.8
(1.3)
M
(se)Ŧ
15.0
(1.3)
M
(se)Ŧ
17.4
(0.9)
M
(se)Ŧ
17.6
(1.1)
M
(se)Ŧ
12.9
(1.1)
M
(se)Ŧ
15.2
(0.8)
n 228 165 393 292 245 537 520 410 930
Ŧ (se) Standard error.
^ Students indicating they had smoked more than 40 cigarettes on any of the preceding seven days were excluded from analysis. Average number of cigarettes smoked in past seven days is based on unweighted data.

36 ASSAD 2017: Statistics & Trends
Table 3.3 Percentage of students in Australia who had smoked in 2011, 2014 and 2017, by recency period, age group and sex, ASSAD.
Age in years
Recency period
12-15 16-17 12-17
2011
(%)
2014
(%)
2017
(%)
2011
(%)
2014
(%)
2017
(%)
2011
(%)
2014
(%)
2017
(%)
Lifetime
Male 18* 12 12 40* 33 31 24* 18 17
Female 16* 13 11 39* 37* 32 23* 20* 17
Total 17* 13 12 39* 25 31 23* 19 18
Smoked at least 100 cigarettes in lifetime
Male 2 1 1 9 8 7 4 3 3
Female 2* 1 1 7* 5 4 3* 2 2
Total 2* 1 1 8* 6 5 4* 3 2
Past month
Male 6 4 5 18 16 15 9 7 8
Female 6 5 4 16 14 14 9* 8 7
Total 6 4 5 17 15 14 9* 8 7
Current smokers (smoked in past seven days)
Male 4 3 3 13 12 10 7* 5 5
Female 4* 3 3 12* 9 9 6* 5 4
Total 4* 3 3 13* 10 10 7* 5 5
Committed smokers (Smoked on 3+ days in past seven days)
Male 2 2 2 8 7 6 4 3 3
Female 2* 2 1 7* 4 4 4* 3 2
Total 2* 2 2 7* 6 5 4* 3 3
Smoked daily in past seven days
Male 1 1 1 4 3 3 2 1 1
Female 1 1 1 3* 2 2 2* 1 1
Total 1 1 1 4* 3 2 2* 1 1
Daily smokers among current smokers
Male 24 22 22 29 29 24 27 26 23
Female 25 16 21 28 23 21 27 19 21
Total 24 19 22 28* 26 23 27 23 22
* Significantly different from 2017 at p <0.01.

ASSAD 2017: Statistics & Trends 37
Table 3.4 Secondary students in Australia who were current smokers# and bought their last cigarette
†
themselves, by age group and sex, ASSAD 2017
Age in years
12-15 16-17 12-17
Male
(%)
Female
(%)
Total
(%)
Male
(%)
Female
(%)
Total
(%)
Male
(%)
Female
(%)
Total
(%)
Bought last cigarette
10 8 9 29 18 24 21 14 18
n 166 145 312 247 221 468 413 367 780
# Current smokers: students who smoked on any of the past seven days.
† Current smokers indicating more than one cigarette source excluded from analyses.
Table 3.5 Source of last cigarette for current smokers# among secondary students in Australia†, by age group and sex, ASSAD 2017
Age in years
12-15 16-17 12-17
Male
(%)
Female
(%)
Total
(%)
Male
(%)
Female
(%)
Total
(%)
Male
(%)
Female
(%)
Total
(%)
Did not buy
Parents 7 10 8 4 7 5 5 8 6
Siblings 2 6 4 4 5 4 3 5 4
Took from home 19 19 14 2 4 3 5 10 7
Friend under 18 30 29 29 21 26 24 13 13 26
Friend over 18 17 13 15 27 25 26 23 21 22
Someone bought it 22 13 18 10 16 13 15 15 15
Bought
Convenience store 3 1 20 4 4 4 4 3 4
Milk bar <1 1 1 1 3 2 1 2 2
Tobacconist/
tobacco shop <1 2 1 6 2 4 4 2 3
Newsagency 0 3 1 2 1 2 1 2 2
Supermarket 2 <1 1 3 1 4 3 1 2
Petrol station 1 1 1 5 3 4 3 2 3
n 166 146 312 247 221 468 413 367 780
# Current smokers: students who smoked on any of the past seven days.
† Current smokers indicating more than one cigarette source excluded from analyses. Percentages do not add to 100 as only the most frequent responses are listed.
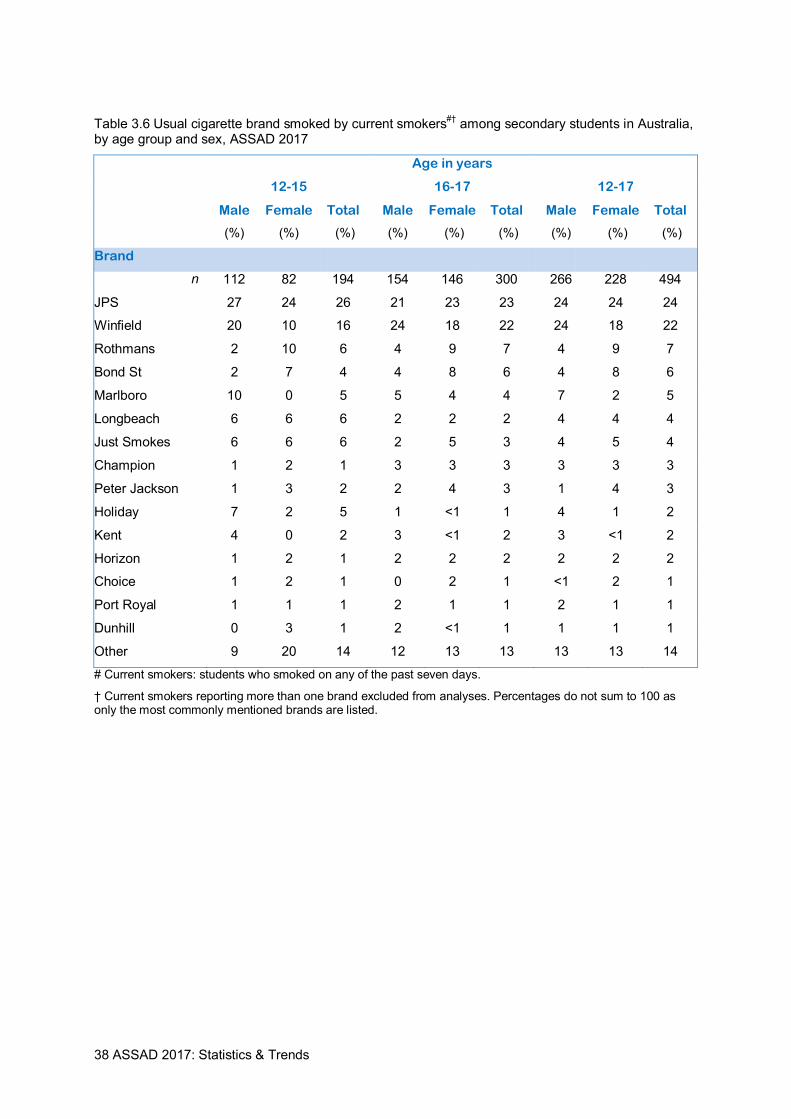
38 ASSAD 2017: Statistics & Trends
Table 3.6 Usual cigarette brand smoked by current smokers#†
among secondary students in Australia, by age group and sex, ASSAD 2017
Age in years
12-15 16-17 12-17
Male
(%)
Female
(%)
Total
(%)
Male
(%)
Female
(%)
Total
(%)
Male
(%)
Female
(%)
Total
(%)
Brand
n 112 82 194 154 146 300 266 228 494
JPS 27 24 26 21 23 23 24 24 24
Winfield 20 10 16 24 18 22 24 18 22
Rothmans 2 10 6 4 9 7 4 9 7
Bond St 2 7 4 4 8 6 4 8 6
Marlboro 10 0 5 5 4 4 7 2 5
Longbeach 6 6 6 2 2 2 4 4 4
Just Smokes 6 6 6 2 5 3 4 5 4
Champion 1 2 1 3 3 3 3 3 3
Peter Jackson 1 3 2 2 4 3 1 4 3
Holiday 7 2 5 1 <1 1 4 1 2
Kent 4 0 2 3 <1 2 3 <1 2
Horizon 1 2 1 2 2 2 2 2 2
Choice 1 2 1 0 2 1 <1 2 1
Port Royal 1 1 1 2 1 1 2 1 1
Dunhill 0 3 1 2 <1 1 1 1 1
Other 9 20 14 12 13 13 13 13 14
# Current smokers: students who smoked on any of the past seven days.
† Current smokers reporting more than one brand excluded from analyses. Percentages do not sum to 100 as only the most commonly mentioned brands are listed.

ASSAD 2017: Statistics & Trends 39
Table 3.7 Pack size of last cigarette† used by current smokers by age group and sex, ASSAD 2017
Age in years
12-15 16-17 12-17
Male
(%)
Female
(%)
Total
(%)
Male
(%)
Female
(%)
Total
(%)
Male
(%)
Female
(%)
Total
(%)
Factory-made cigarette pack size
20 37 45 40 31 29 30 34 35 34
25 5 11 7 15 16 15 11 14 12
30 12 6 10 7 15 11 9 12 10
35 0 3 2 1 <1 1 <1 2 1
40 7 14 10 12 10 11 10 12 11
50 11 6 9 3 4 4 6 5 6
22 3 2 3 1 0 <1 2 1 1
26 2 2 2 5 5 5 3 4 3
23 0 2 1 <1 <1 <1 <1 1 <1
Roll your own tobacco
24 11 18 26 21 24 25 17 21
n 164 131 295 218 204 421 381 335 716
# Current smokers: students who smoked on any of the past seven days.
† Current smokers reporting more than one response excluded from analyses.

40 ASSAD 2017: Statistics & Trends
Table 3.8 Roll-your-own tobacco use among past-month cigarette smokers by age group and sex, ASSAD 2017
Age in years Age group
12
(%)
13
(%)
14
(%)
15
(%)
16
(%)
17
(%)
12-15
(%)
16-17
(%)
Total
(%)
Past-month smokers
Never used
Males 48 18 28 22 26 24 26 25 25
Females 61 34 25 28 25 29 31 27 29
Total 54 25 26 25 25 27 28 26 27
Once or twice
Males 0 28 5 9 18 13 10 15 13
Females 0 24 24 20 18 19 19 18 19
Total 0 26 15 14 18 16 14 17 16
3-5 times
Males 12 23 9 10 7 10 12 9 10
Females 13 8 13 12 15 13 12 14 13
Total 13 16 11 11 11 12 12 11 12
6-9 times
Males 20 0 10 11 4 6 10 5 7
Females 0 8 10 6 10 7 6 9 7
Total 11 3 10 9 7 7 9 7 8
10-19 times
Males 14 6 7 13 6 8 11 7 8
Females 13 4 10 8 9 10 9 9 9
Total 13 5 9 11 7 9 10 8 9
20+ times
Males 7 26 41 35 39 39 32 39 36
Females 13 23 19 26 23 22 22 23 22
Total 10 25 29 31 31 31 27 31 29
n 59 72 150 263 397 382 544 779 1,323

ASSAD 2017: Statistics & Trends 41
Table 3.9 Frequency of shisha/waterpipe tobacco use by age and sex, ASSAD 2017
Age in years
12
(%)
13
(%)
14
(%)
15
(%)
16
(%)
17
(%)
12-17
(%)
Never used
Male 97 96 93 87 82 78 89
Female 98 97 95 91 87 84 92
Total 97 96 94 89 84 81 91
A few puffs
Male 2 2 4 4 8 8 5
Female 2 2 3 5 7 7 4
Total 2 2 3 4 8 8 4
Fewer than 10 times
Male 1 1 2 4 5 8 3
Female <1 1 2 2 4 6 2
Total 1 1 2 3 5 7 3
10 or more times
Male <1 1 1 3 4 4 2
Female <1 1 1 2 1 2 1
Total <1 1 1 3 3 3 2
More than 100 times
Male <1 <1 <1 2 1 2 1
Female 0 <1 <1 <1 1 <1 <1
Total <1 <1 <1 1 1 1 1
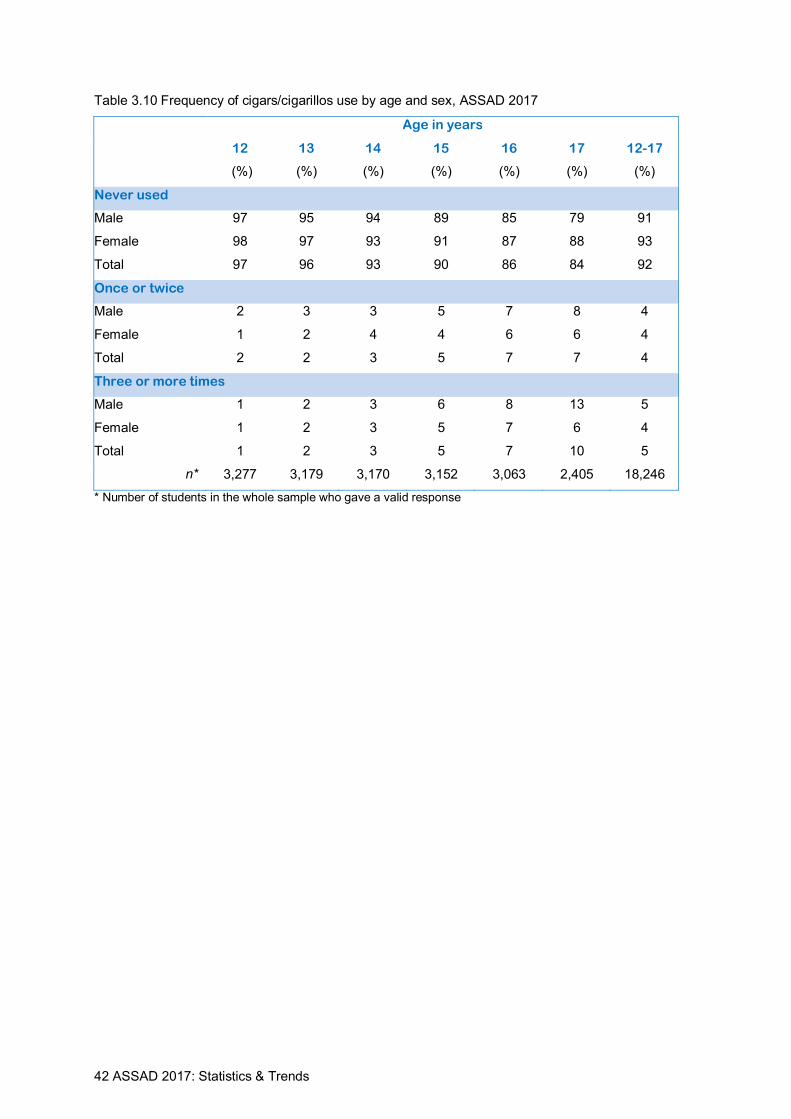
42 ASSAD 2017: Statistics & Trends
Table 3.10 Frequency of cigars/cigarillos use by age and sex, ASSAD 2017
Age in years
12
(%)
13
(%)
14
(%)
15
(%)
16
(%)
17
(%)
12-17
(%)
Never used
Male 97 95 94 89 85 79 91
Female 98 97 93 91 87 88 93
Total 97 96 93 90 86 84 92
Once or twice
Male 2 3 3 5 7 8 4
Female 1 2 4 4 6 6 4
Total 2 2 3 5 7 7 4
Three or more times
Male 1 2 3 6 8 13 5
Female 1 2 3 5 7 6 4
Total 1 2 3 5 7 10 5
n* 3,277 3,179 3,170 3,152 3,063 2,405 18,246
* Number of students in the whole sample who gave a valid response

ASSAD 2017: Statistics & Trends 43
Table 3.11 Use of e-cigarettes by age and sex, ASSAD 2017
Age in years
12
(%)
13
(%)
14
(%)
15
(%)
16
(%)
17
(%)
12-17
(%)
Never used
Male 95 91 85 78 73 73 83
Female 98 96 91 86 85 85 90
Total 96 93 88 82 79 79 87
Ever used
Male 5 9 15 22 27 27 17
Female 2 4 9 14 15 15 10
Total 4 7 12 18 21 21 13
n* 3,225 3,143 3,176 3,142 3,073 2,433 18,192
* Number of students in the whole sample who gave a valid response
Table 3.12 Frequency of e-cigarette use in the past month among ever users of e-cigarettes by age and sex, ASSAD 2017
Age in years
12
(%)
13
(%)
14
(%)
15
(%)
16
(%)
17
(%)
12-17
(%)
Of ever users, any use in the past month
Male 38 36 43 34 25 31 33
Female 55 43 41 28 24 27 31
Total 43 38 42 31 25 29 32
Of ever users, use on three or more days in the past month
Male 14 14 18 1 10 12 13
Female 20 24 20 13 8 10 13
Total 16 17 18 15 9 11 13
n 67 130 193 291 384 285 1,350

44 ASSAD 2017: Statistics & Trends
Table 3.13 Previous tobacco cigarette smoking (i.e., before trying an e-cigarette) among ever and past month e-cigarette users by age and sex, ASSAD 2017
Age in years
12
(%)
13
(%)
14
(%)
15
(%)
16
(%)
17
(%)
12-17
(%)
Ever used e-cigarette
Never smoked a tobacco cigarette before using e-cigarette
Male 59 64 59 62 50 36 53
Female 51 44 46 44 38 33 41
Total 57 58 54 55 46 35 48
A few puffs of a tobacco cigarette before using e-cigarette
Male 29 18 21 12 19 26 20
Female 48 19 23 17 17 19 19
Total 34 18 21 14 18 23 20
Less than 10 tobacco cigarettes
Male 5 9 10 12 11 11 10
Female 0 18 12 16 14 11 13
Total 4 11 11 13 12 11 11
10 or more tobacco cigarettes
Male 7 10 10 14 21 28 18
Female 1 20 19 23 31 37 27
Total 6 13 14 18 25 31 21
n 115 206 368 555 653 513 2,410
Past month e-cigarette user
Never smoked a tobacco cigarette before using e-cigarette
Male 57 52 45 53 31 20 40
Female 51 24 33 35 16 22 28
Total 3 4 8 11 6 4 36
A few puffs of a tobacco cigarette before using e-cigarette
Male 0 20 22 17 28 48 26
Female 46 17 23 10 22 18 20
Total 16 19 23 14 26 37 23
Less than 10 tobacco cigarettes
Male 18 18 15 10 12 7 12
Female 0 28 15 20 14 12 16
Total 12 21 15 14 13 9 13
10 or more tobacco cigarettes
Male 26 9 19 20 30 26 22
Female 3 31 28 36 47 49 37
Total 18 17 22 26 36 34 28
n 37 66 138 154 150 135 680

ASSAD 2017: Statistics & Trends 45
Table 3.14 Self-perceived smoking status among students in Australia by age and sex, ASSAD 2017
Age in years
12
(%)
13
(%)
14
(%)
15
(%)
16
(%)
17
(%)
12-17
(%)
Heavy smoker
Male <1 1 1 2 2 3 2
Female <1 <1 1 1 1 2 1
Total <1 1 1 2 2 2 1
Light smoker
Male 1 1 1 2 3 4 2
Female 0 1 1 2 3 3 2
Total <1 1 1 2 3 3 2
Occasional smoker
Male 1 1 3 5 7 9 4
Female 1 1 3 5 10 10 5
Total 1 1 3 5 9 9 4
Ex-smoker
Male 1 1 2 3 2 5 2
Female 1 <1 2 3 2 2 1
Total 1 1 2 3 2 3 2
Non-smoker
Male 98 96 93 88 86 80 91
Female 98 98 94 89 85 84 91
Total 98 97 93 89 85 82 91

46 ASSAD 2017: Statistics & Trends
Table 3.15 Smoking recency and average number of cigarettes smoked per week by self-perceived smoking status among secondary students in Australia, ASSAD 2017
Self-description of smoking
Heavy smoker
(%)
Light smoker
(%)
Occasional smoker
(%)
Ex- smoker
(%)
Non-smoker
(%)
Smoking recency
Smoked >100 cigarettes
76 45 10 13 <1
Smoked in past year 91 97 94 73 6
Smoked in past month 89 87 70 24 2
Smoked in past week 86 77 43 12 1
Smoked on 3 or more days of past week
74 56 12 4 <1
n 245 356 938 315 17,0421
Among current smokers#
Average number of cigarettes smoked per week†
M
(SD)
M
(SD)
M
(SD)
M
(SD)
M
(SD)
42.0 (32.2)
16.5 (14.9)
5.9 (8.3)
5.5 (8.4)
4.4 (15.0)
n 191 258 357 38 100
† Students indicating they had smoked more than 40 cigarettes on any one day of preceding 7 days excluded from analysis. Average number of cigarettes smoked adjusted for sex and age and are based on unweighted data
# Current smokers: students who smoked in the past week.

ASSAD 2017: Statistics & Trends 47
Table 3.16 Intention to smoke in the next year among secondary students in Australia by age and sex, ASSAD 2017
#
Age in years
12
(%)
13
(%)
14
(%)
15
(%)
16
(%)
17
(%)
12-17
(%)
Certain not to smoke
Male 90 85 82 73 74 67 79
Female 92 88 81 72 69 67 78
Total 91 86 81 72 71 67 79
Unlikely/ very unlikely to smoke
Male 9 12 13 17 16 17 14
Female 6 9 13 19 17 19 14
Total 7 11 13 18 16 18 14
Undecided
Male 1 2 3 5 6 9 4
Female 2 2 4 6 8 8 5
Total 1 2 3 6 7 9 4
Likely/ very likely to smoke
Male <1 1 1 3 4 5 2
Female 1 1 2 3 5 5 3
Total 1 1 2 3 5 5 3
Certain to smoke
Male <1 <1 1 1 1 2 1
Female <1 <1 1 1 1 1 1
Total <1 <1 1 1 1 2 1 # Percentage of students in each age group indicating each response category.
Table 3.17 Intention to smoke in the next year among past year smokers among secondary students in Australia, by age, ASSAD 2017
Age in years
12
(%)
13
(%)
14
(%)
15
(%)
16
(%)
17
(%)
12-17
(%)
Intention
Certain not to smoke 28 22 23 19 22 19 21
Unlikely/very unlikely to smoke
38 35 27 35 31 31 32
Undecided 12 20 24 26 24 27 25
Likely/very likely 14 17 17 16 19 16 17
Certain to smoke 8 6 9 5 4 6 6
n 88 148 283 552 715 700 2,486

48 ASSAD 2017: Statistics & Trends
TABLES SHOWING ALCOHOL USE AMONG SECONDARY STUDENTS IN AUSTRALIA
Table 4.1 Alcohol use by secondary students in Australia by age, sex, and recency, ASSAD 2017#
Age in years
12
(%)
13
(%)
14
(%)
15
(%)
16
(%)
17
(%)
12-17
(%)
Never used
Male 50 43 35 29 21 16 33
Female 65 54 36 24 16 14 36
Total 57 48 36 26 18 15 34
Used in past year
Male 19 32 40 54 65 76 46
Female 14 22 40 57 71 77 46
Total 17 27 40 56 68 76 46
Used in past month
Male 10 14 19 32 43 55 27
Female 6 9 18 31 46 52 26
Total 8 11 18 31 45 54 27
Current drinker (consumed alcohol in past seven days)
Male 6 7 10 18 26 37 16
Female 3 4 11 17 24 30 14
Total 4 6 10 17 25 33 15
Single occasion risky drinker (drank five or more drinks on one day in past seven days)
Male <1 2 2 6 11 16 6
Female <1 <1 2 4 8 9 4
Total <1 1 2 5 9 13 5
n* 3,366 3,311 3,288 3,284 3,168 2,506 18,923 # Prevalence estimates are within ±3.4% of population values. See Appendix 2 for 95% confidence interval
estimates for different percentages for each age and sex group.
* Number of students in the whole sample who gave a valid response

ASSAD 2017: Statistics & Trends 49
Table 4.2 Risky drinking by secondary students in Australia by recency, age group and sex, ASSAD 2017
Age in years
12-15 16-17 12-17
Male
(%)
Female
(%)
Total
(%)
Male
(%)
Female
(%)
Total
(%)
Male
(%)
Female
(%)
Total
(%)
All students
Last two weeks 11 10 10 29 23 26 18 15 16
Past month 15 15 15 38 35 37 24 23 23
Past year 31 30 30 60 58 59 44 40 41
Lifetime 36 33 34 63 59 61 46 43 44
Ever drinkers
Last two weeks 18 17 17 36 27 31 26 22 24
Past month 25 25 25 47 42 44 35 33 34
Past year 51 51 51 74 69 71 61 59 60
Lifetime 58 57 57 78 71 74 67 63 65
Current drinkers
Last two weeks 52 55 54 68 58 63 61 57 59
Past month 61 63 62 76 67 72 70 66 68
Past year 75 73 74 90 83 87 84 79 81
Lifetime 80 76 78 92 85 89 87 81 84
Table 4.3 Alcohol consumption among past week drinkers (current drinkers) in Australia by age group and sex, ASSAD 2017
Age group in years
12-15 16-17 12-17
Male Female Total Male Female Total Male Female Total
Drinking behaviour
Number of drinks in past seven days^
M
(se)‡
5.9
(0.4)
4.0
(0.4)
5.0
(0.2)
8.6
(0.3)
5.5
(0.3)
7.0
(0.2)
7.6
(0.2)
5.0
(0.2)
6.2
(0.1)
Five or more drinks on one occasion#
% 24 19 22 43 31 38 35 26 31
n 697 546 1,243 870 756 1,626 1,567 1,302 2,869
^ Means are based on unweighted data. Respondents indicating they consumed more than 20 drinks on any one day excluded from calculations of means.
‡ (se) Standard error
# Percentage of current drinkers consuming five or more drinks on one occasion in the past seven days

50 ASSAD 2017: Statistics & Trends
Table 4.4 Alcohol use among secondary students in Australia, by recency, age group and sex in 2011, 2014, and 2017^, ASSAD
Age in years
12-15 16-17 12-17
Recency period
2011
(%)
2014
(%)
2017
(%)
2011
(%)
2014
(%)
2017
(%)
2011
(%)
2014
(%)
2017
(%)
Lifetime
Male 70* 62 61 88* 84 81 75* 68 67
Female 66* 60 55 90* 86 85 73* 68 64
Total 68* 61 58 89* 85 83 74* 68 66
Past month
Male 21 16 18 52 47 49 30 25 27
Female 18 15 16 53 48 49 29* 25 26
Total 20 16 17 53 48 49 29* 25 27
Current drinkers (consumed alcohol in past seven days)
Male 12 9 10 34 30 31 18 15 16
Female 10 8 9 31 29 27 16* 15 14
Total 11* 8 9 33 30 29 17* 15 15
Consumed five or more drinks on one occasion in the past seven days (risky drinkers)
All students
Male 3 2 2 18 16 13 7 6 6
Female 2 1 2 13* 10 8 5* 4 4
Total 3 2 2 16* 13 11 6* 5 5
Current drinkers
Male 27 24 24 53 52 43 41 41 35
Female 20 16 19 43* 34 31 33* 27 26
Total 24 21 22 48* 43 38 37* 34 31
* Significantly different from 2017 at p < 0.01
^ 2009 NHMRC drinking guidelines recommend abstaining from alcohol consumption as the safest option for young people under the age of 18. Therefore, the proportions of students who report having consumed an alcoholic drink in their lifetime or in any recency period reflects the proportions of students who did not adhere to this guideline.

ASSAD 2017: Statistics & Trends 51
Table 4.5 Usual alcoholic beverage consumed by current drinkers^†#
in Australia, by age group and sex, ASSAD 2017
Age group in years
12-15 16-17 12-17
Male
(%)
Female
(%)
Total
(%)
Male
(%)
Female
(%)
Total
(%)
Male
(%)
Female
(%)
Total
(%)
Beverage type
Premixed spirits 25 41 32 32 50 40 29 47 37
Beer (ordinary) 36 10 25 33 4 20 34 6 22
Spirits 15 24 19 16 24 20 16 24 19
Alcoholic energy drinks 6 9 7 9 10 9 8 9 8
Wine 6 8 7 3 6 4 4 7 5
n 413 590 1,003 315 467 776 728 1,051 1,779 ^ Current drinkers: students who drank on any of the past seven days.
† Percentages exclude responses from students who gave more than one type of drink.
# Percentages do not add to 100% as only the most common beverage types shown.
Table 4.6 Most common usual drink for current drinkers^ aged 12-17 (only students indicating one
usual drink type included in analysis) by sex, ASSAD 2011-2017
2011 2014 2017
Male
(%)
Female
(%)
Male
(%)
Female
(%)
Male
(%)
Female
(%)
Beverage type
Premixed spirits (incl. alcoholic sodas and alcoholic energy drinks) 31 48 30 46* 31 49
Spirits 24* 30* 20 23 16 24
Cider 2* 2* 8 9 8 9
Beer (ordinary) 30* 4 29* 5 35 7
Wine 7* 8 7* 9 4 7
Liqueur 1 3 1 2 1 3
Champagne or sparkling wine 1 4* <1 3 <1 1 * Significantly different from 2017 at p < 0.01.
^ Current drinkers: students who drank on any of the past seven days.

52 ASSAD 2017: Statistics & Trends
Table 4.7 How current drinkers^ among secondary students in Australia accessed their last alcoholic
drink#†, by age group and sex, ASSAD 2017
Age group in years
12-15 16-17 12-17
Male
(%)
Female
(%)
Total
(%)
Male
(%)
Female
(%)
Total
(%)
Male
(%)
Female
(%)
Total
(%)
Supplied by others
Parents 42 44 43 41 45 43 41 45 43
Siblings 9 9 8 8 6 7 8 7 8
Took from home 14 9 12 3 3 3 8 5 7
Friend under 18 8 12 10 7 6 6 7 8 8
Friend over 18 12 11 11 20 23 22 17 18 17
Someone else bought 9 12 10 13 13 13 11 13 12
Bought themselves
Liquor store, supermarket, or bottle shop <1 <1 <1 4 1 3 3 1 2
Bar/Pub/RSL <1 <1 <1 1 1 1 1 1 1
Restaurant 0 <1 <1 <1 <1 <1 <1 <1 <1
n 558 459 1,017 773 694 1,467 1,331 1,153 2,484 ^ Current drinkers: students who drank in the past week.
# We show only the most common sources of those in the survey, so percentages do not add to 100%.
† Percentages exclude responses from students who gave more than one source of alcohol.
Table 4.8 Sources who bought alcohol for current drinkers^ among secondary students in Australia who were supplied by another, by sex, ASSAD 2017
Male
(%)
Female
(%)
Total
(%)
Person who bought alcohol for student
Friend 18 or over 55 65 60
Brother/sister or other relative 18 or over 3 13 8
Friend under 18 3 5 4
Brother/sister or other relative under 18 8 1 4
Stranger 16 6 11
n 148 145 293
^ Current drinkers: students who drank in the past week.
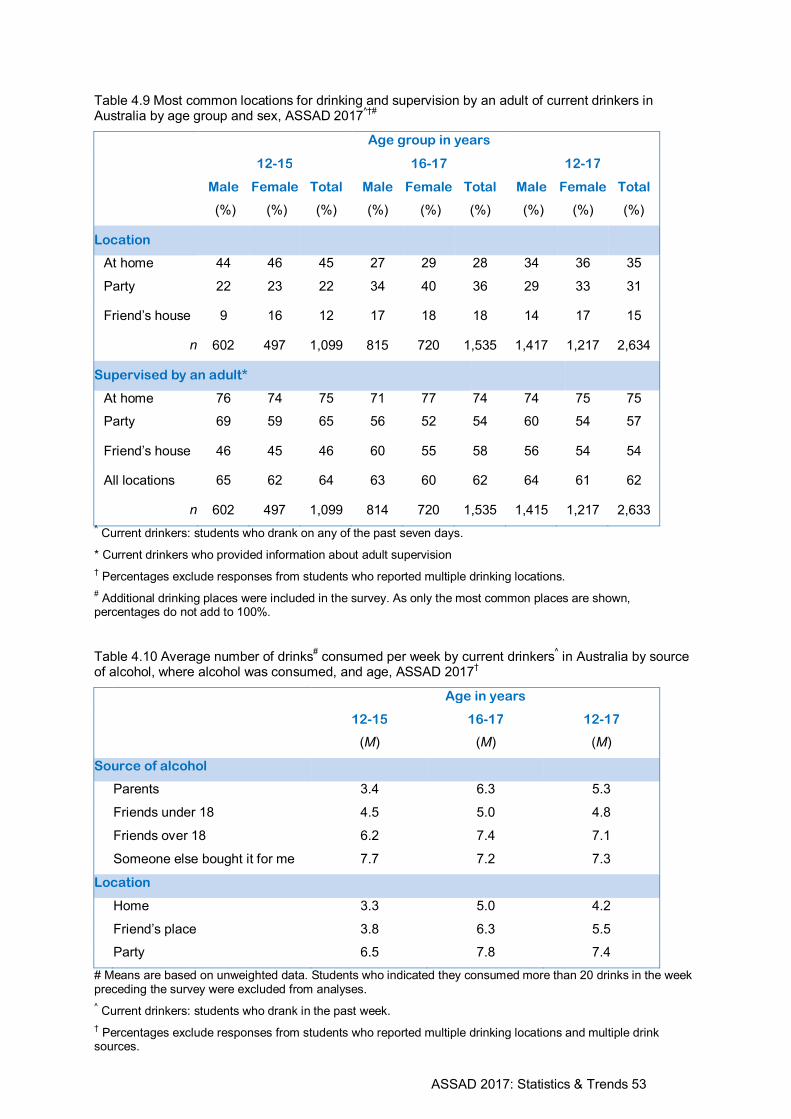
ASSAD 2017: Statistics & Trends 53
Table 4.9 Most common locations for drinking and supervision by an adult of current drinkers in Australia by age group and sex, ASSAD 2017
^†#
Age group in years
12-15 16-17 12-17
Male
(%)
Female
(%)
Total
(%)
Male
(%)
Female
(%)
Total
(%)
Male
(%)
Female
(%)
Total
(%)
Location
At home 44 46 45 27 29 28 34 36 35
Party 22 23 22 34 40 36 29 33 31
Friend’s house 9 16 12 17 18 18 14 17 15
n 602 497 1,099 815 720 1,535 1,417 1,217 2,634
Supervised by an adult*
At home 76 74 75 71 77 74 74 75 75
Party 69 59 65 56 52 54 60 54 57
Friend’s house 46 45 46 60 55 58 56 54 54
All locations 65 62 64 63 60 62 64 61 62
n 602 497 1,099 814 720 1,535 1,415 1,217 2,633 ^ Current drinkers: students who drank on any of the past seven days.
* Current drinkers who provided information about adult supervision
† Percentages exclude responses from students who reported multiple drinking locations.
# Additional drinking places were included in the survey. As only the most common places are shown,
percentages do not add to 100%.
Table 4.10 Average number of drinks# consumed per week by current drinkers
^ in Australia by source
of alcohol, where alcohol was consumed, and age, ASSAD 2017†
Age in years
12-15
(M)
16-17
(M)
12-17
(M)
Source of alcohol
Parents 3.4 6.3 5.3
Friends under 18 4.5 5.0 4.8
Friends over 18 6.2 7.4 7.1
Someone else bought it for me 7.7 7.2 7.3
Location
Home 3.3 5.0 4.2
Friend’s place 3.8 6.3 5.5
Party 6.5 7.8 7.4
# Means are based on unweighted data. Students who indicated they consumed more than 20 drinks in the week preceding the survey were excluded from analyses.
^ Current drinkers: students who drank in the past week.
† Percentages exclude responses from students who reported multiple drinking locations and multiple drink
sources.

54 ASSAD 2017: Statistics & Trends
Table 4.11 Self-described drinking status among secondary students in Australia, by age and sex, ASSAD 2017
Age in years
12
(%)
13
(%)
14
(%)
15
(%)
16
(%)
17
(%)
12-17
(%)
Non-drinker
Male 91 85 80 65 49 37 70
Female 94 92 81 62 47 38 70
Total 93 88 81 63 48 37 70
Occasional drinker
Male 5 9 11 19 23 26 15
Female 3 5 11 19 21 26 14
Total 4 7 11 19 22 26 14
Light drinker
Male 1 2 2 4 4 5 3
Female 1 2 2 3 4 5 3
Total 1 2 2 3 4 5 3
Party drinker
Male 1 2 4 10 22 29 10
Female <1 1 5 16 27 31 13
Total 1 2 5 13 24 30 11
Heavy drinker
Male 0 1 2 2 2 3 2
Female <1 <1 <1 1 1 1 <1
Total <1 <1 1 2 1 2 1
n 3,404 3,355 3,321 3,312 3,190 2,531 19,113
* Number of students in the whole sample who gave a valid response

ASSAD 2017: Statistics & Trends 55
Table 4.12 Source and location of last drink for secondary students in Australia by self-described drinking status and age group, ASSAD 2017#
Non-drinker Occasional drinker Party drinker
12-15
(%)
16-17
(%)
12-15
(%)
16-17
(%)
12-15
(%)
16-17
(%)
Source of alcohol
Parents 61 56 49 51 26 36
Friend over 18 6 13 10 24 17 21
Friend under 18 8 15 7 6 12 6
Someone else bought it for me 2 1 5 8 23 17
Location of last drink
Home 57 39 59 35 25 17
Party 10 20 15 32 48 45
Friend’s place 6 14 13 16 13 21 ^ Current drinkers: students who drank in the past week.
# Percentages exclude responses from students who reported multiple drinking locations and multiple drink
sources.

56 ASSAD 2017: Statistics & Trends
Table 4.13 Negative outcomes experienced by current drinkers# after drinking alcohol in the past year
by age group and sex, ASSAD 2017
Age group in years
12-15 16-17 12-17
Male
(%)
Female
(%)
Total
(%)
Male
(%)
Female
(%)
Total
(%)
Male
(%)
Female
(%)
Total
(%)
Negative Outcome
Health and wellbeing
Been sick (vomited) 29 35 32 44 43 44 37 40 39
Had an injury that needed to be seen by a doctor
5 6 5 3 4 3 4 4 4
Missed school or work 11 15 13 12 12 12 12 13 12
Tried smoking 19 29 24 38 43 40 30 37 33
Tried drugs 15 19 17 29 26 27 23 23 23
Lost something 15 16 15 24 23 24 20 20 20
Done something you later regretted
19 27 22 28 37 32 24 32 28
Interpersonal
Had an argument 13 24 18 23 25 24 19 24 21
Verbally abused someone 10 9 9 13 9 12 12 9 11
Physically threatened someone
5 5 5 8 2 5 7 3 5
Hit someone or had a fight 10 9 9 11 4 8 11 6 8
Civil or legal
Created a public disturbance or nuisance
5 6 6 10 5 8 8 6 7
Stolen something 7 6 6 9 3 6 8 4 6
Driven a motor vehicle 9 4 7 9 3 6 9 4 7
Caused damage to property 7 6 7 13 5 9 10 6 8
Been in trouble with the police
6 6 6 9 3 6 7 4 6
Number of Negative Outcomes ^
None 51 45 48 34 37 36 42 40 41
One or more 22 17 20 20 17 19 21 17 19
Two or more 9 11 10 14 14 14 12 13 12
Three or more 19 27 22 32 32 32 26 30 28
n 697 547 1,244 870 755 1,625 1,567 1,302 2,869 # Current drinkers: students who drank in the past week.
^ Includes responses to all negative outcomes listed in the survey, not just the main ones listed above (refer to
Q21 in the survey in Appendix 1 to see list of all negative outcomes). Includes multiple responses.

ASSAD 2017: Statistics & Trends 57
Table 4.14 Intention to get drunk when drinking for current drinkers
# by intention frequency, age group and sex, Australia, ASSAD 2017
Age group in years
12-15 16-17 12-17
Male
(%)
Female
(%)
Total
(%)
Male
(%)
Female
(%)
Total
(%)
Male
(%)
Female
(%)
Total
(%)
Intention to Get Drunk
Never 29 32 31 17 22 19 22 26 24
A few times/ sometimes 44 41 43 35 33 34 39 36 38
Most times/ every time 27 27 27 48 45 47 39 37 38
n 617 513 1,130 843 724 1,567 1,460 1,237 2,697 # Current drinkers: students who drank on any of the past seven days.

58 ASSAD 2017: Statistics & Trends
TABLES SHOWING USE OF OVER-THE-COUNTER DRUGS AMONG SECONDARY STUDENTS IN AUSTRALIA
Table 5.1 Use of analgesics among secondary students in Australia by recency, age and sex, ASSAD 2017
#
Age in years
12
(%)
13
(%)
14
(%)
15
(%)
16
(%)
17
(%)
12-17
(%)
Ever used
Male 92 94 93 94 95 95 94
Female 94 96 97 98 98 98 97
Total 93 95 95 96 96 97 95
Past year
Male 86 90 88 89 91 92 89
Female 92 93 95 97 97 96 95
Total 89 92 91 93 94 94 92
Past month
Male 48 58 57 62 61 63 58
Female 36 32 25 81 82 79 75
Total 56 63 66 71 72 71 66
Past week
Male 26 31 30 37 34 37 32
Female 32 37 47 51 54 54 46
Total 29 34 39 44 44 46 39 # Prevalence estimates are within ±3.4% of population values. See Appendix 4 for 95% confidence interval
estimates for different percentages for each age and sex group.

ASSAD 2017: Statistics & Trends 59
Table 5.2 Source of analgesics for past year users by age and sex, ASSAD 2017*
Age in years
12
(%)
13
(%)
14
(%)
15
(%)
16
(%)
17
(%)
12-17
(%)
Parents
Males 92 93 91 90 89 85 90
Females 94 94 93 90 85 81 90
Total 93 93 92 90 87 83 90
Took from home
Males 1 1 2 3 4 7 3
Females 2 1 3 3 6 5 3
Total 1 1 3 3 5 6 3
Bought it
Males 2 1 1 2 4 5 2
Females <1 1 1 3 6 11 4
Total 1 1 1 3 5 8 3
Friends
Males 0 <1 1 1 1 1 1
Females <1 1 2 2 2 3 2
Total <1 1 2 2 2 2 1
* Base: students using analgesics in past year.

60 ASSAD 2017: Statistics & Trends
Table 5.3 Reasons for most recent use among past year analgesic users (multiple responses allowed) by age and sex, ASSAD 2017*^
Age in years
12
(%)
13
(%)
14
(%)
15
(%)
16
(%)
17
(%)
12-17
(%)
Headache or migraine
Male 56 50 52 54 58 61 54
Female 44 45 44 43 47 46 44
Total 46 48 48 48 53 53 49
Cold/‘Flu
Male 36 32 31 31 29 28 31
Female 35 25 22 20 22 21 24
Total 35 29 26 25 25 24 28
Dental pain
Male 4 4 7 4 16 4 5
Female 5 7 7 6 7 4 5
Total 5 5 7 5 12 4 5
Menstrual pain
Male NA NA NA NA NA NA NA
Female 12 19 24 30 31 30 24
Total NA NA NA NA NA NA NA
Pain from sport injury or strains
Male 11 15 13 16 16 14 14
Female 8 10 9 10 7 10 9
Total 9 12 11 13 12 12 12
n 3,005 3,050 3,010 3,057 3,009 2,392 17,523 * Base: students using analgesics in past year.
^ Percentages may not sum to 100% as multiple responses were allowed and only the most common reasons are
shown.

ASSAD 2017: Statistics & Trends 61
Table 5.4 Analgesic use among secondary students in Australia by year, recency, age group, and sex, ASSAD
Age in years
12-15 16-17 12-17
2011
(%)
2014
(%)
2017
(%)
2011
(%)
2014
(%)
2017
(%)
2011
(%)
2014
(%)
2017
(%)
Lifetime
Male 95* 93 93 96 94 95 95* 93 94
Female 97 97 96 98 98 98 97 97 97
Total 96 95 95 97 96 97 96* 95 95
Past month
Male 61* 60 56 63 64 62 62* 61* 58
Female 74 75 72 83 82 81 77 77 75
Total 67* 67* 64 73 73 71 69* 69* 66
Past week
Male 32 33 31 34 36 35 33 34 32
Female 42 45* 42 53 53 54 45 48 46
Total 37 39* 36 44 44 45 39 41 39 * Significantly different from 2017 at p < 0.01.
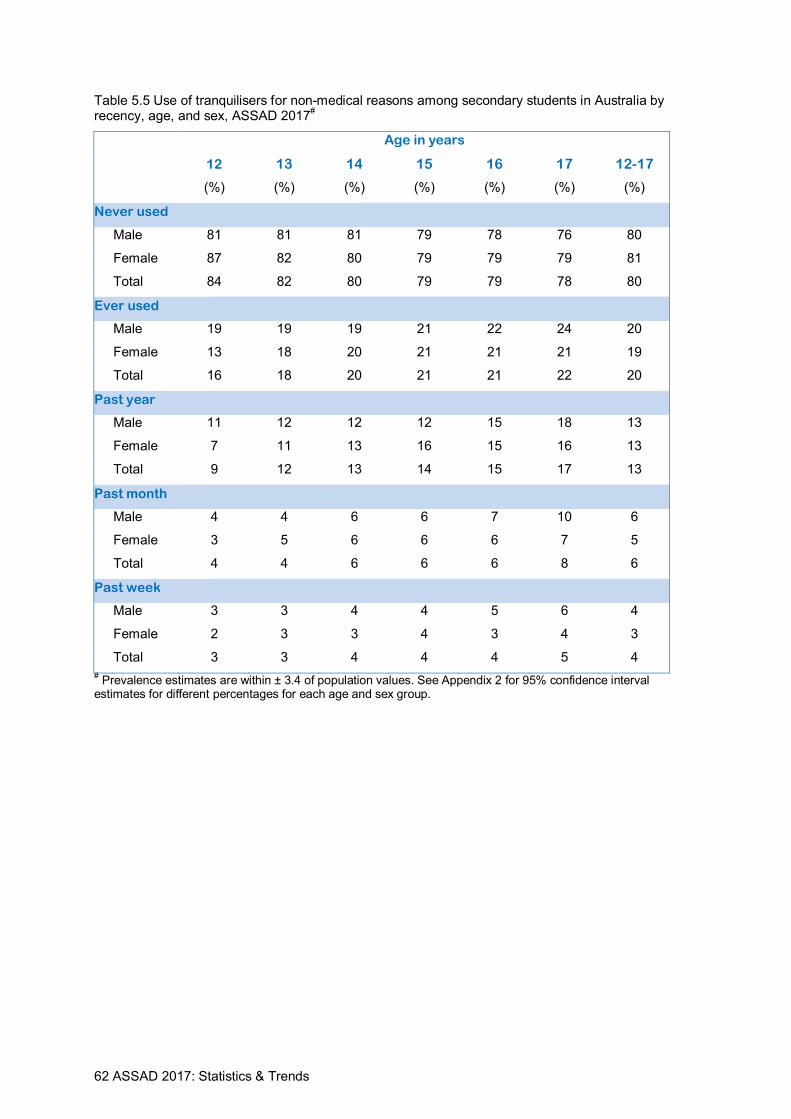
62 ASSAD 2017: Statistics & Trends
Table 5.5 Use of tranquilisers for non-medical reasons among secondary students in Australia by
recency, age, and sex, ASSAD 2017#
Age in years
12
(%)
13
(%)
14
(%)
15
(%)
16
(%)
17
(%)
12-17
(%)
Never used
Male 81 81 81 79 78 76 80
Female 87 82 80 79 79 79 81
Total 84 82 80 79 79 78 80
Ever used
Male 19 19 19 21 22 24 20
Female 13 18 20 21 21 21 19
Total 16 18 20 21 21 22 20
Past year
Male 11 12 12 12 15 18 13
Female 7 11 13 16 15 16 13
Total 9 12 13 14 15 17 13
Past month
Male 4 4 6 6 7 10 6
Female 3 5 6 6 6 7 5
Total 4 4 6 6 6 8 6
Past week
Male 3 3 4 4 5 6 4
Female 2 3 3 4 3 4 3
Total 3 3 4 4 4 5 4 # Prevalence estimates are within ± 3.4 of population values. See Appendix 2 for 95% confidence interval
estimates for different percentages for each age and sex group.

ASSAD 2017: Statistics & Trends 63
Table 5.6 Common sources of tranquilisers for past year users by age and sex, ASSAD 2017#
Age in years
12
(%)
13
(%)
14
(%)
15
(%)
16
(%)
17
(%)
12-17
(%)
Parents
Male 70 76 68 65 52 57 64
Female 79 76 68 61 60 57 65
Total 73 76 68 63 56 57 65
Prescribed
Male 24 15 13 11 13 15 15
Female 14 17 17 22 21 27 21
Total 20 16 15 17 17 22 18
Took from home
Male 1 1 1 3 6 4 3
Female 4 2 6 6 6 5 5
Total 2 2 4 4 6 5 4
Bought it
Male 0 <1 2 5 14 12 6
Female 0 1 <1 2 2 4 2
Total 0 1 1 3 8 8 4
From someone else
Male 2 3 8 8 11 9 7
Female 3 3 6 8 7 4 6
Total 2 3 7 8 9 6 6
n 216 314 327 388 395 341 1,981
# Base: students using tranquilisers in past year.

64 ASSAD 2017: Statistics & Trends
Table 5.7 Tranquiliser use among secondary students in Australia by year, recency, age group and sex, ASSAD.
Age in years
12-15 16-17 12-17
2011
(%)
2014
(%)
2017
(%)
2011
(%)
2014
(%)
2017
(%)
2011
(%)
2014
(%)
2017
(%)
Lifetime
Male 16 16* 20 19 20 23 17* 17* 20
Female 17 19 18 19 21 21 17 19 19
Total 16* 18 19 19 20 22 17* 18 20
Past month
Male 4 4 5 5* 5* 8 4* 5* 6
Female 4 5 5 5 6 6 4* 5 5
Total 4* 5 5 5* 5 7 4* 5 6
Past week
Male 2* 3 3 3* 3* 5 2* 3* 4
Female 2* 3 3 3 3 3 2* 3 3
Total 2* 3 3 3* 3 4 2* 3 4 * Significantly different from 2017 at p < 0.01.

ASSAD 2017: Statistics & Trends 65
TABLES SHOWING ILLICIT SUBSTANCE USE AMONG SECONDARY STUDENTS IN AUSTRALIA
Table 6.1 Cannabis use among students in Australia by recency, age and sex, ASSAD 2017#
Age in years
12
(%)
13
(%)
14
(%)
15
(%)
16
(%)
17
(%)
12-17
(%)
Never used
Male 96 93 88 78 70 63 82
Female 98 95 91 78 72 69 84
Total 97 94 90 78 71 66 83
Ever used
Male 4 7 12 22 30 37 18
Female 2 5 9 22 28 31 16
Total 3 6 10 22 29 34 17
Past year
Male 3 6 10 20 28 34 16
Female 2 3 8 21 26 29 14
Total 3 5 9 20 27 32 15
Past month
Male 2 3 6 11 17 20 9
Female 1 2 5 10 14 14 8
Total 2 3 6 10 15 17 8
Past week
Male 1 2 3 7 11 13 6
Female 1 1 3 5 7 6 4
Total 1 2 3 6 9 9 5
n* 2,954 2,892 2,890 2,891 2,866 2,283 16,766 # Prevalence estimates are within ± 3.4 of population values. See Appendix 2 for 95% confidence interval
estimates for different percentages for each age and sex group.
* Number of students in the whole sample who gave a valid response

66 ASSAD 2017: Statistics & Trends
Table 6.2 Cannabis use among secondary students in Australia by year, recency, age group and sex, ASSAD
Age in years
12-15 16-17 12-17
2011
(%)
2014
(%)
2017
(%)
2011
(%)
2014
(%)
2017
(%)
2011
(%)
2014
(%)
2017
(%)
Lifetime
Male 11 11 10 30 31 34 16 17 18
Female 9 9 9 24* 26 29 13* 14 16
Total 10 10 9 27* 28 31 15* 16 17
Past month
Male 5 5 5 15 16 18 8 8 9
Female 4 4 5 10* 10* 14 6* 6* 8
Total 4 5 5 13* 13 16 7* 7* 8
Past week
Male 3 3 4 9 9 12 5* 5 6
Female 2 2 2 5 5 6 3* 3 4
Total 2 3 3 7 7 9 4* 4 5
* Significantly different from 2017 at p < 0.01.

ASSAD 2017: Statistics & Trends 67
Table 6.3 Use of dexamphetamine and methamphetamine among secondary students in Australia by recency, age, and sex, ASSAD 2017
#
Age in years
12
(%)
13
(%)
14
(%)
15
(%)
16
(%)
17
(%)
12-17
(%)
Dexamphetamines
Never used
Male 98 99 98 98 97 97 98
Female 98 99 99 98 99 98 99
Total 98 99 98 98 98 98 98
Ever used
Male 2 1 2 2 3 3 2
Female 2 1 1 2 1 2 1
Total 2 1 2 2 2 2 2
Past year
Male 1 1 2 1 3 2 2
Female 1 <1 1 1 1 1 1
Total 1 1 1 1 2 2 1
Past month
Male <1 1 1 1 1 1 1
Female 1 <1 1 <1 1 1 1
Total <1 1 1 1 1 1 1
Methamphetamines
Never used
Male 99 99 97 98 96 96 97
Female 99 99 99 98 98 98 99
Total 99 99 98 98 97 97 98
Ever used
Male 1 1 3 2 4 4 3
Female 1 1 1 2 2 2 1
Total 1 1 2 2 3 3 2
Past year
Male 1 1 2 1 3 3 2
Female 1 1 1 1 1 1 1
Total 1 1 2 1 2 2 2
Past month
Male 1 1 2 1 1 2 1
Female <1 <1 1 1 1 1 1
Total 1 1 1 1 1 1 1 # Prevalence estimates are within ±3.4 of population values. See Appendix 2 for 95% confidence interval estimates for different percentages for each age and sex group.

68 ASSAD 2017: Statistics & Trends
Table 6.4 Amphetamine use among secondary students in Australia by year, recency, age group, and sex, ASSAD
12-15 16-17 12-17
2011
(%)
2014
(%)
2017*
(%)
2011
(%)
2014
(%)
2017
(%)
2011
(%)
2014
(%)
2017
(%)
Lifetime
Male 2 2 2 5 5 4 3 3 3
Female 2 2 1 4 2 2 3 2 1
Total 2 2 2 5 4 3 3 2 2
Past month
Male 1 1 1 2 3 2 1 1 1
Female 1 1 1 1 1 1 1 1 1
Total 1 1 1 2 2 1 1 1 1
*2011 and 2014 measure of ‘amphetamine’ use; 2017 measure of methamphetamine use. Note: no significance tests were run by survey year, due to change in key variables measuring use.

ASSAD 2017: Statistics & Trends 69
Table 6.5 Opiate use (for non-medicinal reasons) among secondary students in Australia by recency, age, and sex, ASSAD 2017
#
Age in years
12
(%)
13
(%)
14
(%)
15
(%)
16
(%)
17
(%)
12-17
(%)
Heroin Never used
Male 99 99 98 99 99 99 99
Female 99 99 99 99 99 99 99
Total 99 99 99 99 99 99 99
Ever used
Male 1 1 2 1 1 1 1
Female <1 1 <1 1 1 1 1
Total 1 1 1 1 1 1 1
Past year
Male 1 1 1 1 1 1 1
Female <1 1 <1 <1 1 <1 <1
Total <1 1 1 1 1 1 1
Past month
Male <1 <1 1 1 1 1 1
Female <1 <1 <1 <1 <1 <1 <1
Total <1 <1 1 1 1 1 1
n* 3,225 3,185 3,163 3,152 3,092 2,444 18,261
Other opiates Never used
Male 97 96 94 92 91 89 93
Female 97 97 96 94 93 93 95
Total 97 96 95 93 92 91 94
Ever used
Male 3 4 6 8 9 11 7
Female 3 3 4 6 7 7 5
Total 3 4 5 7 8 9 6
Past year
Male 3 3 4 6 7 8 5
Female 2 2 3 5 6 5 4
Total 2 2 3 5 7 6 4
Past month
Male 1 1 2 3 4 4 2
Female 1 1 1 2 2 3 2
Total 1 1 2 2 3 3 2
n* 3,206 3,169 3,133 3,155 3,088 2,436 18,187 # Prevalence estimates are within ±3.4 of population values. See Appendix 2 for 95% confidence interval
estimates for different percentages for each age and sex group. * Number of students in the whole sample who gave a valid response

70 ASSAD 2017: Statistics & Trends
Table 6.6 Lifetime and past month opiate use in 2011, 2014 and 2017, by age group and sex, ASSAD
Age in years
12-15 16-17 12-17
2011
(%)
2014
(%)
2017*
(%)
2011
(%)
2014
(%)
2017
(%)
2011
(%)
2014
(%)
2017
(%)
Lifetime
Male 2 1 1 2 3 1 2 2 1
Female 2 1 1 1 1 1 2 1 1
Total 2 1 1 1 2 1 2 2 1
Past month
Male 1 1 1 1 1 1 1 1 1
Female <1 <1 <1 <1 <1 <1 <1 <1 <1
Total 1 1 1 1 1 1 1 1 1
* Values show heroin use 2017. Note: no significance tests were run by survey year, due to change in key variables measuring use.

ASSAD 2017: Statistics & Trends 71
Table 6.7 Cocaine use by recency, age and sex, ASSAD 2017#
Age in years
12
(%)
13
(%)
14
(%)
15
(%)
16
(%)
17
(%)
12-17
(%)
Never used
Male 99 99 98 97 96 93 97
Female 99 99 99 98 98 95 98
Total 99 99 98 97 97 94 98
Ever used
Male 1 1 2 3 4 7 3
Female 1 1 1 2 2 5 2
Total 1 1 2 3 3 6 2
Past year
Male 1 1 2 2 3 6 2
Female 1 <1 1 2 2 2 1
Total 1 1 1 2 3 4 2
Past month
Male 1 1 1 2 2 3 2
Female <1 <1 <1 <1 1 1 <1
Total 1 1 1 1 1 2 1
n* 3,252 3,207 3,154 3,163 3,095 2,452 18,323 # Prevalence estimates are within ±3.4 of population values. See Appendix 2 for 95% confidence interval estimates for different percentages for each age and sex group. * Number of students in the whole sample who gave a valid response
Table 6.8 Cocaine use among secondary students in Australia by year, recency, age group, and sex, ASSAD
Age in years
12 – 15 16 – 17 12-17
2011
(%)
2014
(%)
2017
(%)
2011
(%)
2014
(%)
2017
(%)
2011
(%)
2014
(%)
2017
(%)
Lifetime
Male 2 2 2 3* 4 5 2 3 3
Female 1 1 1 2 2 4 1 1 2
Total 1 2 2 2* 3 5 2* 2 2
Past month
Male 1* 1 1 2 2 2 1* 1 2
Female <1 1 <1 <1 1 1 <1 1 <1
Total <1 1 1 1 1 2 1* 1 1
* Significantly different from 2017 at p < 0.01.

72 ASSAD 2017: Statistics & Trends
Table 6.9 Inhalant use among secondary students in Australia by recency, age and sex, ASSAD 2017#
Age in years
12
(%)
13
(%)
14
(%)
15
(%)
16
(%)
17
(%)
12-17
(%)
Ever used
Male 18 18 20 17 16 17 18
Female 20 20 20 19 17 13 18
Total 19 19 20 18 16 15 18
Past year
Male 13 12 14 14 12 13 13
Female 15 15 16 14 12 9 14
Total 14 14 15 14 12 11 13
Past month
Male 8 7 8 8 5 7 7
Female 9 10 9 8 7 5 8
Total 9 8 8 8 6 6 8
Past week
Male 5 4 4 5 4 4 4
Female 4 5 6 4 4 3 4
Total 5 5 5 5 4 4 4 # Prevalence estimates are within ±3.4 of population values. See Appendix 2 for 95% confidence interval
estimates for different percentages for each age and sex group.
Table 6.10 Inhalant use among secondary students in Australia by year, recency, age, and sex, ASSAD
Age in years
12-15 16-17 12-17
2011
(%)
2014
(%)
2017
(%)
2011
(%)
2014
(%)
2017
(%)
2011
(%)
2014
(%)
2017
(%)
Lifetime
Male 17 16 18 14 12* 17 16 15* 18
Female 21 19 20 12* 11* 15 18 17 18
Total 19 18 19 13* 12* 16 17 16* 18
Past month
Male 7 6* 8 4 4* 6 6 5* 7
Female 10 8 9 4* 4 6 8 7 8
Total 8 7 8 4* 4* 6 7 6* 8
* Significantly different from 2017 at p <0.01.

ASSAD 2017: Statistics & Trends 73
Table 6.11 Hallucinogen use among secondary students in Australia by recency, age and sex, ASSAD 2017
#
Age in years
12
(%)
13
(%)
14
(%)
15
(%)
16
(%)
17
(%)
12-17
(%)
Never used
Male 98 98 97 96 92 91 95
Female 99 99 98 97 96 96 98
Total 98 98 97 96 94 94 96
Ever used
Male 2 2 3 4 8 9 5
Female 1 1 2 3 4 4 2
Total 2 2 3 4 6 6 4
Past year
Male 1 2 3 4 7 7 4
Female <1 1 2 3 3 4 2
Total 1 1 2 3 5 5 3
Past month
Male 1 1 2 2 3 3 2
Female <1 <1 1 1 1 1 1
Total 1 1 1 1 2 2 1
n* 3,144 3,117 3,095 3,131 3,064 2,417 17,968 # Prevalence estimates are within ±3.4 of population values. See Appendix 2 for 95% confidence interval
estimates for different percentages for each age and sex group. * Number of students in the whole sample who gave a valid response
Table 6.12 Hallucinogen use among secondary students in Australia by year, recency, age, and sex, ASSAD
Age in years
12-15 16-17 12-17
2011
(%)
2014
(%)
2017
(%)
2011
(%)
2014
(%)
2017
(%)
2011
(%)
2014
(%)
2017
(%)
Lifetime
Male 2* 2 3 6 7 8 3 4 5
Female 1 1 2 4 4 4 2 2 2
Total 2 2 2 5 6 6 3 3 4
Past month
Male 1 1* 1 2 2 3 1 2* 2
Female <1 1 <1 1 1 1 1 1 1
Total 1 1 1 2 1 2 1 1 1
* Significantly different from 2017 at p <0.01.
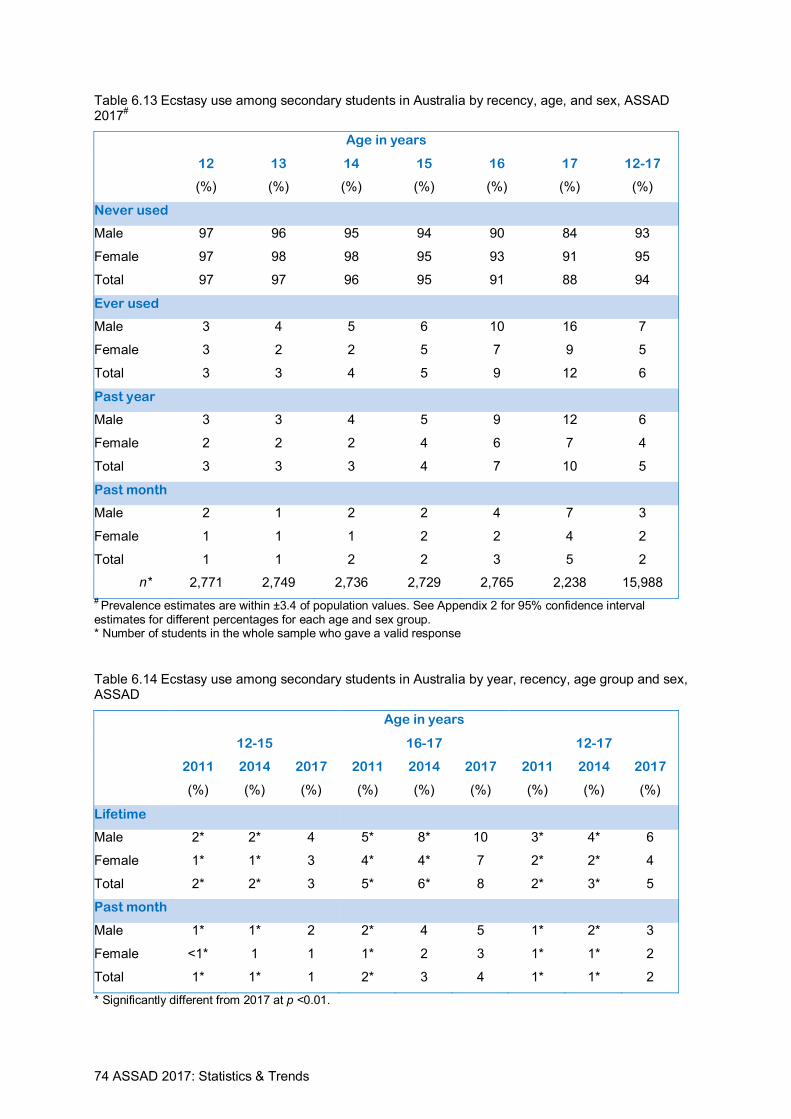
74 ASSAD 2017: Statistics & Trends
Table 6.13 Ecstasy use among secondary students in Australia by recency, age, and sex, ASSAD 2017#
Age in years
12
(%)
13
(%)
14
(%)
15
(%)
16
(%)
17
(%)
12-17
(%)
Never used
Male 97 96 95 94 90 84 93
Female 97 98 98 95 93 91 95
Total 97 97 96 95 91 88 94
Ever used
Male 3 4 5 6 10 16 7
Female 3 2 2 5 7 9 5
Total 3 3 4 5 9 12 6
Past year
Male 3 3 4 5 9 12 6
Female 2 2 2 4 6 7 4
Total 3 3 3 4 7 10 5
Past month
Male 2 1 2 2 4 7 3
Female 1 1 1 2 2 4 2
Total 1 1 2 2 3 5 2
n* 2,771 2,749 2,736 2,729 2,765 2,238 15,988 # Prevalence estimates are within ±3.4 of population values. See Appendix 2 for 95% confidence interval
estimates for different percentages for each age and sex group. * Number of students in the whole sample who gave a valid response
Table 6.14 Ecstasy use among secondary students in Australia by year, recency, age group and sex, ASSAD
Age in years
12-15 16-17 12-17
2011
(%)
2014
(%)
2017
(%)
2011
(%)
2014
(%)
2017
(%)
2011
(%)
2014
(%)
2017
(%)
Lifetime
Male 2* 2* 4 5* 8* 10 3* 4* 6
Female 1* 1* 3 4* 4* 7 2* 2* 4
Total 2* 2* 3 5* 6* 8 2* 3* 5
Past month
Male 1* 1* 2 2* 4 5 1* 2* 3
Female <1* 1 1 1* 2 3 1* 1* 2
Total 1* 1* 1 2* 3 4 1* 1* 2
* Significantly different from 2017 at p <0.01.

ASSAD 2017: Statistics & Trends 75
Table 6.15 Use of performance or image enhancing drugs without a doctor’s prescription by recency, age and sex, ASSAD 2017
#
Age in years
12
(%)
13
(%)
14
(%)
15
(%)
16
(%)
17
(%)
12-17
(%)
Never used
Male 97 98 97 96 97 97 97
Female 97 98 97 98 98 98 98
Total 97 98 97 97 98 98 97
Ever used
Male 3 2 3 4 3 3 3
Female 3 2 3 2 2 2 2
Total 3 2 3 3 2 2 3
Past year
Male 1 2 2 3 2 3 2
Female 2 2 2 1 2 1 2
Total 2 2 2 2 2 2 2
Past month
Male 1 1 2 2 2 2 1
Female 1 1 1 1 1 1 <1
Total 1 1 1 1 1 1 1
n* 3,273 3,208 3,178 3,174 3,110 2,484 18,427 # Prevalence estimates are within ±3.4 of population values. See Appendix 2 for 95% confidence interval
estimates for different percentages for each age and sex group. * Number of students in the whole sample who gave a valid response
Table 6.16 Use of performance or image enhancing drugs by year, recency, age group, and sex, ASSAD
Age in years
12-15 16-17 12-17
2011
(%)
2014
(%)
2017
(%)
2011
(%)
2014
(%)
2017
(%)
2011
(%)
2014
(%)
2017
(%)
Lifetime
Male 2 3 3 3 3 3 2 3 3
Female 2 2 3 1 1 2 2* 2 2
Total 2 2 3 2 2 2 2 2 3
Past month
Male 1 1 1 2 2 2 1 1 1
Female 1 1 1 <1 <1 1 1 1 1
Total 1 1 1 1 1 1 1 1 1
* Significantly different from 2017 at p <0.01.

76 ASSAD 2017: Statistics & Trends
Table 6.17 Use of ethno-botanicals or synthetic drugs in the past year by age and sex, ASSAD 2017#
Age in years
12
(%)
13
(%)
14
(%)
15
(%)
16
(%)
17
(%)
12-17
(%)
Ethno-botanicals
Male 1 2 2 2 2 2 2
Female 1 1 1 1 1 2 1
Total 1 1 1 1 2 2 1
Synthetic drugs
Synthetic cannabis 1 1 1 2 4 4 2
Emerging synthetic hallucinogens <1 1 1 1 1 1 1
MDPV <1 1 1 1 1 1 1
Mephedrone <1 1 <1 <1 <1 <1 <1
Other synthetic substance <1 <1 1 1 1 <1 <1
Did not use any synthetic drug 99 99 98 97 96 96 97 # Prevalence estimates are within ±3.4 of population values. See Appendix 2 for 95% confidence interval
estimates for different percentages for each age and sex group.
^ Percentages may not equal 100% as multiple responses were allowed.

ASSAD 2017: Statistics & Trends 77
TABLES SHOWING ADDITIONAL FINDINGS ABOUT SUBSTANCE USE AMONG SECONDARY STUDENTS IN AUSTRALIA
Any substance use by secondary students in 2014 and 2017
Table 7.1 Substance use in 2017 and 2014 by recency and age group, ASSAD
2014 2017
12–13
(%)
14–15
(%)
16–17
(%)
12–13
(%)
14–15
(%)
16–17
(%)
Ever used
Analgesics 94 96 96 94 95 97
Alcohol 52 70 85 48 69 83
Tobacco 7 18 35 6 17 31
Cannabis 5 15 28 4 16 32
Tranquilisers 16 19 20 17 20 22
Inhalants 19 17 12 19 19 16
Ecstasy 1 3 6 3 5 10
Hallucinogens 1 3 5 2 3 6
Amphetamines 1 2 4 1 (1)* 2 (2)* 2 (3)*
Opiates 1 2 2 1 (3)# 1 (6) # 1 (8) #
Cocaine 1 2 3 1 2 5
Performance enhancing drugs 2 3 2 3 2 2
Used in the past month
Analgesics 65 70 73 59 69 71
Alcohol 9 22 48 10 25 49
Tobacco 2 7 15 2 7 14
Cannabis 2 7 13 2 8 16
Tranquilisers 4 6 5 4 6 7
Inhalants 8 6 4 8 8 6
Ecstasy 0 1 3 1 2 4
Hallucinogens 0 1 2 1 1 2
Amphetamines 1 1 2 <1 (1)* 1 (1)* 1 (1)*
Opiates 0 1 1 1 (1) # 1 (2) # 1 (3) #
Cocaine 1 1 1 1 2 2
Performance enhancing drugs 1 1 1 1 1 1
*Dexamphetamines (Methamphetamines) # Heroin (Other opiates)

78 ASSAD 2017: Statistics & Trends
Table 7.2 Reported use of any illicit substance (including or excluding cannabis) among secondary students in Australia by year, recency, age group, and sex, ASSAD
12-15 16-17 12-17
2011
(%)
2014
(%)
2017#
(%)
2011
(%)
2014
(%)
2017#
(%)
2011
(%)
2014
(%)
2017#
(%)
Any illicit substance (including cannabis)
Lifetime
Male 12 11 12 (15) 30 30 32 (34) 17 16 18 (20)
Female 10 9 10 (13) 24 24 29 (32) 14 14 16 (18)
Total 11 10 11 (14) 27 27 30 (33) 16 15 17 (19)
Past month
Male 6 5 6 (9) 16 16 18 (22) 9 8 9 (13)
Female 5 4 5 (7) 11 9 13 (18) 7 6 7 (10)
Total 6 5 5 (8) 13 13 16 (20) 8 7 8 (12)
Any illicit substance (excluding cannabis)
Lifetime
Male 6 4 6 (9) 11 12 15 (19) 7 7 8 (12)
Female 5 4 4 (7) 9 7 10 (15) 6 5 6 (10)
Total 5 4 5 (8) 10 10 12 (17) 7 6 7 (11)
Past month
Male 3 2 3 (4) 5 5 6 (8) 4 3 4 (5)
Female 2 1 1 (3) 3 2 3 (6) 2 2 2 (3)
Total 2 2 2 (3) 4 4 5 (7) 3 2 3 (4)
* Significantly different from 2017 at p <0.01.
#Excluding substances not surveyed in 2011 or 2014 (Including all illicit substances).
Note: when all substances surveyed in 2017 are included, proportions might include responses from students who misinterpreted the use of ‘other opiates’ survey item and reported medically supervised use.

ASSAD 2017: Statistics & Trends 79
Table 7.3 Concurrent substance use among secondary students in Australia, ASSAD 2017#
Substance used in the past year
Tranquilisers
(%)
Cannabis
(%)
Amphetamines
(%)
Hallucinogens
(%)
Ecstasy
(%)
Substance used on same occasion
Alcohol 17 58 40 39 51
Tobacco 13 39 34 37 40
Cannabis 15 N/A^^ 33 45 43
Hallucinogens 4 8 13 N/A^^ 14
Amphetamines 3 3 N/A^^ 6 10
Ecstasy 5 3 18 18 N/A^^
Analgesics 19 8 14 8 11
Tranquilisers N/A^^ 4 9 8 9
None 64 30 35 33 26
n 2,229 2,516 369 486 685 ^^N/A = not applicable.
# Percentages may not equal 100% as multiple responses were allowed.

80 ASSAD 2017: Statistics & Trends
Substance use lessons recalled by students
Table 7.4 Recall of substance use education in the previous school year (2016) among secondary students in Australia by age and topic, ASSAD 2017
Age in years
12
(%)
13
(%)
14
(%)
15
(%)
16
(%)
17
(%)
12-17
(%)
Smoking Tobacco
None 36 32 22 18 23 30 27
Part of a lesson 14 15 15 15 16 19 16
One lesson 21 18 18 20 23 21 20
More than one lesson 29 35 45 48 38 31 38
n 3,306 3,241 3,218 3,227 3,128 4,486 18,606
Drinking Alcohol
None 31 26 15 10 11 15 18
Part of a lesson 16 15 13 10 11 14 13
One lesson 23 22 18 19 22 24 21
More than one lesson 31 38 54 61 56 47 47
n 3,276 3,227 3,210 3,228 3,11 2,477 18,539
Illicit substance use
None 50 41 24 16 16 21 28
Part of a lesson 16 16 14 10 12 15 14
One lesson 18 19 19 20 25 24 21
More than one lesson 16 24 43 54 48 40 37
n* 3,261 3,224 3,208 3,206 3,114 2,478 18,491
* Number of students in the whole sample who gave a valid response

ASSAD 2017: Statistics & Trends 81
Student use of health services for substance use, emotional problems, or behavioural problems
Table 7.5 Secondary students in Australia that reported being diagnosed with a mental health condition, by age and sex, ASSAD 2017
#
Age in years
12
(%)
13
(%)
14
(%)
15
(%)
16
(%)
17
(%)
12 -17
(%)
Yes
Male 4 5 8 8 10 12 7
Female 6 9 13 17 20 25 14
Total 5 7 10 12 15 19 11
No
Male 77 80 75 79 77 74 77
Female 80 76 72 69 70 62 72
Total 78 78 74 74 74 68 74
Don’t know
Male 20 15 17 14 12 14 15
Female 14 16 15 14 10 13 14
Total 17 15 16 14 11 13 15 # Prevalence estimates are within ±3.4 of population values. See Appendix 2 for 95% confidence interval
estimates for different percentages for each age and sex group.
Table 7.6 Use of a health professional in the past year by secondary students in Australia for substance use problems, or emotional or behavioural problems, by age and sex, ASSAD 2017
Age in years
12
(%)
13
(%)
14
(%)
15
(%)
16
(%)
17
(%)
12-17
(%)
No
Male 91 87 89 87 87 83 87
Female 87 84 80 75 74 72 79
Total 89 86 85 81 81 77 83
Yes – substance use
Male <1 1 2 1 2 2 1
Female 1 1 2 1 2 1 1
Total 1 1 2 1 2 2 1
Yes - emotional or behavioural problems
Male 9 12 10 12 11 15 11
Female 12 15 18 24 24 27 20
Total 11 13 14 18 18 21 16
n* 3,175 3,145 3,136 3,155 3,113 2,482 18,206
* Number of students in the whole sample who gave a valid response
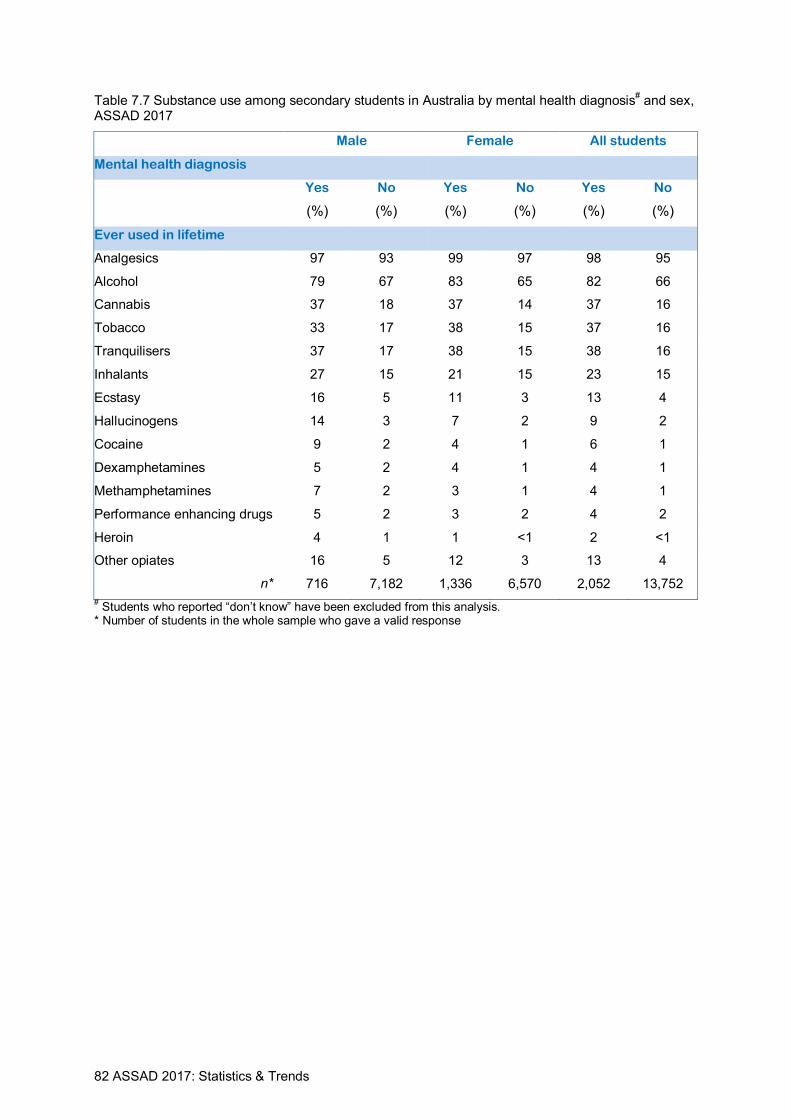
82 ASSAD 2017: Statistics & Trends
Table 7.7 Substance use among secondary students in Australia by mental health diagnosis# and sex,
ASSAD 2017
Male Female All students
Mental health diagnosis
Yes
(%)
No
(%)
Yes
(%)
No
(%)
Yes
(%)
No
(%)
Ever used in lifetime
Analgesics 97 93 99 97 98 95
Alcohol 79 67 83 65 82 66
Cannabis 37 18 37 14 37 16
Tobacco 33 17 38 15 37 16
Tranquilisers 37 17 38 15 38 16
Inhalants 27 15 21 15 23 15
Ecstasy 16 5 11 3 13 4
Hallucinogens 14 3 7 2 9 2
Cocaine 9 2 4 1 6 1
Dexamphetamines 5 2 4 1 4 1
Methamphetamines 7 2 3 1 4 1
Performance enhancing drugs 5 2 3 2 4 2
Heroin 4 1 1 <1 2 <1
Other opiates 16 5 12 3 13 4
n* 716 7,182 1,336 6,570 2,052 13,752 # Students who reported “don’t know” have been excluded from this analysis. * Number of students in the whole sample who gave a valid response

ASSAD 2017: Statistics & Trends 83
APPENDIX 1: NATIONAL QUESTIONNAIRE
To obtain a copy of the questionnaire, please email the Australian Government’s National Drug Strategy or the Centre for Behavioural Research in Cancer, Cancer Council Victoria:

84 ASSAD 2017: Statistics & Trends
APPENDIX 2: ASSAD DATA MATTERS
Data coding and editing
To maintain consistency across survey years, we followed data cleaning procedures established for the earlier surveys in this series.
For substance use questions, we checked for inconsistencies in reported use across time periods (lifetime, past year, past month, and past week). Our aim was to maximise use of the data and we operated on the principle that participants’ responses about personal use in the most recent time period was accurate. We checked that the response for the most recent time period was consistent with responses for subsequent time periods. If responses for other time periods were missing or not consistent with the response for the most recent time period, they were recoded to match the response for the recent time period.
For example, if students indicated they had used a substance in the past week and in the past month, but then also indicated that they had not used it in the past year (or, if the response to this question was missing), the response for the past year was recoded to indicate that the substance had been used within this time period. We considered this change appropriate as past week and past month use logically implied past year use. However, if respondents indicated that they did not use a substance in the past week and the response for past month use was missing or ‘yes’, we did not edit these responses, as it is possible for someone who had not used a substance in the past week to have used it in the past month. We retained missing responses for these cases, as we could not determine whether the student had used the substance. If students reported that they had used a substance in the past week, month, or year, but also that they had not used the substance in their lifetime, the response to this latter question was changed to ‘invalid’.
Regardless of the students’ reported substance use, we did not edit reported self-perceived substance use behaviour, as this question aimed to assess perceptions rather than behaviour. As in previous survey years, there was minimal impact of recodes on the data set.
Planned comparisons across survey years
We used logistic regression to test for differences in the proportions of students who had used each of the different substances within different time periods (e.g., lifetime, past month, past week) across the survey years of 2011, 2014, and 2017. For these analyses, we grouped students by age (12-15, 16-17; 12-17) and sex.
Our outcome variable was binary (0 = behaviour did not occur; 1 = behaviour occurred). We controlled for age, education sector (government, Catholic, and independent), state/territory, and sex (when appropriate).
Because ASSAD uses a two-stage sampling procedure, the sample was less efficient than a simple random sample of the same size. We used the statistical package Stata MP 14.2 to create models that adjusted for clustering of observations by student within school (i.e., non-independence of observations), so that standard errors for prevalence estimates were not underestimated.
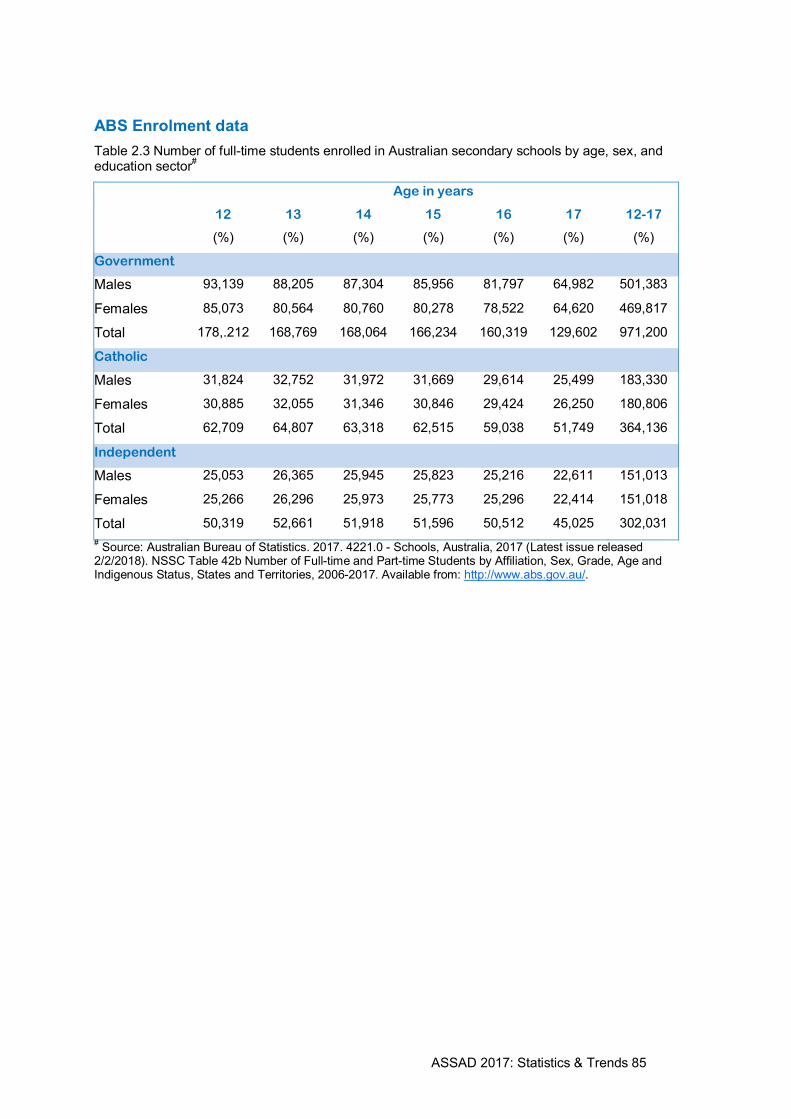
ASSAD 2017: Statistics & Trends 85
ABS Enrolment data
Table 2.3 Number of full-time students enrolled in Australian secondary schools by age, sex, and education sector#
Age in years
12
(%)
13
(%)
14
(%)
15
(%)
16
(%)
17
(%)
12-17
(%)
Government
Males 93,139 88,205 87,304 85,956 81,797 64,982 501,383
Females 85,073 80,564 80,760 80,278 78,522 64,620 469,817
Total 178,.212 168,769 168,064 166,234 160,319 129,602 971,200
Catholic
Males 31,824 32,752 31,972 31,669 29,614 25,499 183,330
Females 30,885 32,055 31,346 30,846 29,424 26,250 180,806
Total 62,709 64,807 63,318 62,515 59,038 51,749 364,136
Independent
Males 25,053 26,365 25,945 25,823 25,216 22,611 151,013
Females 25,266 26,296 25,973 25,773 25,296 22,414 151,018
Total 50,319 52,661 51,918 51,596 50,512 45,025 302,031 # Source: Australian Bureau of Statistics. 2017. 4221.0 - Schools, Australia, 2017 (Latest issue released 2/2/2018). NSSC Table 42b Number of Full-time and Part-time Students by Affiliation, Sex, Grade, Age and Indigenous Status, States and Territories, 2006-2017. Available from: http://www.abs.gov.au/.

86 ASSAD 2017: Statistics & Trends
Confidence intervals
Table 2.4 95% confidence intervals* for prevalence estimates for ASSAD 2017 sample sizes sex and
age
Prevalence (%)
Sex Age in years
n 90 80 70 60 50
Male
12 832 ±2.04 ±2.72 ±3.11 ±3.33 ±3.40
13 1,818 ±1.38 ±1.84 ±2.11 ±2.25 ±2.30
14 1,590 ±1.47 ±1.97 ±2.25 ±2.41 ±2.46
15 1,610 ±1.47 ±1.95 ±2.24 ±2.39 ±2.44
16 1,774 ±1.40 ±1.86 ±2.13 ±2.28 ±2.33
17 1,267 ±1.65 ±2.20 ±2.52 ±2.70 ±2.75
12-17 8,891 ±0.62 ±0.83 ±0.95 ±1.02 ±1.04
Female
12 1,030 ±1.83 ±2.44 ±2.80 ±2.99 ±3.05
13 1,871 ±1.36 ±1.81 ±2.08 ±2.22 ±2.27
14 1,745 ±1.41 ±1.88 ±2.15 ±2.30 ±2.35
15 1,729 ±1.41 ±1.89 ±2.16 ±2.31 ±2.36
16 2,238 ±1.24 ±1.66 ±1.90 ±2.03 ±2.07
17 1,611 ±1.46 ±1.95 ±2.24 ±2.39 ±2.44
12-17 10,224 ±0.58 ±0.78 ±0.89 ±0.95 ±0.97
95% Confidence intervals = ±Margin of Error (formula for confidence interval calculation). MOE = ± 1.96 multiplied by the square root of population standard deviation multiplied by 1 minus the population standard deviation and divided by the sample size.