Frost Sullivan Asean Automotive Markets Potential_The Final Frontier_November2011

ASEAN Motorcycle Markets and their
impact on Car Markets
AUTOMOTIVE | September 2021
2
Table of Contents
Summary ・・・・・・・・・・・・・・・・・・・・・・・・・・・・・ 03
Overview ・・・・・・・・・・・・・・・・・・・・・・・・・・・・・ 04
1. How does the motorcycle cycle market impact the car market?
Myanmar ・・・・・・・・・・・・・・・・・・・・・・・・・・・・・ 06
Thailand ・・・・・・・・・・・・・・・・・・・・・・・・・・・・・ 08
Vietnam ・・・・・・・・・・・・・・・・・・・・・・・・・・・・・ 10
Indonesia ・・・・・・・・・・・・・・・・・・・・・・・・・・・・・ 12
2. Conclusion
・・・・・・・・・・・・・・・・・・・・・・・・・・・・・ 14

3
Summary
Globally, the ASEAN region plays a key role in the global motorcycle market. For decades now, it is considered the
third in terms of production and sales units after India and China. The ASEAN market is led by Indonesia, Thailand,
and Vietnam, representing total motorcycle sales of more than 11 million units in 2019 out of the total sales of 13.7
million in the region. As of 2019, before the COVID-19 pandemic, the total number of motorcycles registered was 106
million in Indonesia, 62 million in Vietnam and 21 million in Thailand.
Myanmar is another interesting
market to compare as it has by far
the highest growth rate of
registered motorcycles in the
region with a 14% CAGR over the
last decade, resulting in a high
jump from 1.8 million to 6.1
million between 2010 and 2019,
while Malaysia and the
Philippines have larger numbers
of motorcycles in use in 2019 with
14 and 8 million units respectively.
The impact to the car and motorcycle market is mainly linked to the national income or GDP per capita which shows the
relative wealth of people in each country. In emerging countries like Vietnam and Myanmar, motorcycles are usually a key
mode of transportation, not only, in urban areas but also in rural areas, due to their flexibility, and lower prices compared
to cars. A recent study from Malaysia’s Road Safety Engineering and Environment Research Centre in 2020 indicates that
in the early stage of a developing economy, due to lower income levels, a strong growth in motorcycle sales can be
observed, going hand in hand with the increase in personal income. The tipping point is when income levels for the average
population are high enough to afford a car, resulting in a decrease in motorcycle sales. The relationship between GDP per
capita and the ratio between motorcycle and passenger car ownership shows a reversed U-shape.
On the other hand, people in more developed ASEAN countries like Thailand are slowing down their replacement of
older motorcycles and moving towards the purchase of entry-level passenger cars with key reasons such as rising
incomes, policy initiatives, and the expansion of infrastructure. It represents that the country is relying more on the
car market and at the same time gently shifting to a more premium motorcycle markets with larger engines (sports
vehicles) and electric vehicles.
Figure 1: Global motorcycle sales and production volume, 2019
Source: Marklines
21,036
15,430 15,578
7,479
17,418
15,194 13,714
16,088
0
5,000
10,000
15,000
20,000
25,000
India China ASEAN Others
x1000 U
nit
s
Production Sales

4
Overview
The ASEAN region is one of the markets with the
highest two-wheeler (motorcycle) penetration rates
in the world. By 2017, the number of registered
motorcycles in the region surpassed the 200
million units mark and is expected to keep
growing based on the assumed annual growth
rate.
ABeam’s objective for this paper is to describe the
situation of motorcycle markets of major
countries in ASEAN and estimate their turning
point and impact towards car markets.
The popularity of motorcycles has increased
significantly and become the key transportation
method for many countries in ASEAN, as they allow
riding ride through small alleys and traffic-
congested roads, as well as sporting cheaper prices
and better fuel economy than cars. Emerging
countries like Myanmar and Vietnam are still
dependent on the motorcycle market.
With the rising incomes of ASEAN nations,
policy initiatives, and expansion of
infrastructure, people in developing ASEAN
countries like Thailand are slowing down their
replacement of their old motorcycles and moving
to purchase entry-level passenger cars instead,
which will lead to a contraction of the
motorcycle market eventually and an
enlargement of the car market in the region.
Motorcycle sales in ASEAN grew with a CAGR of
2.9% from 12.2 million units in 2015 to
13.7 million units in 2019
Indonesia has the largest motorcycle market with
48% share of the total of 220 million registered
motorcycles in ASEAN in 2019
Myanmar is the fastest growing market in ASEAN
for motorcycles during the last decade with a
CAGR of
13.9%
5
How does the motorcycle market impact the car market?
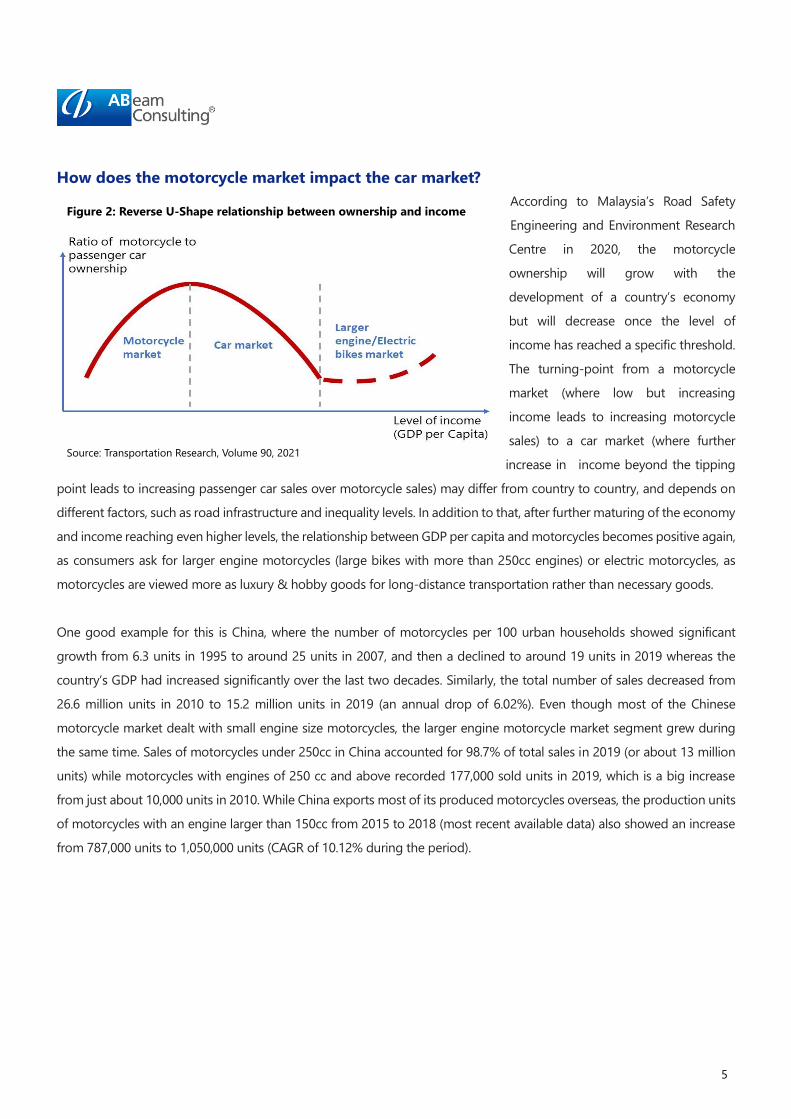
According to Malaysia’s Road Safety
Engineering and Environment Research
Centre in 2020, the motorcycle
ownership will grow with the
development of a country’s economy
but will decrease once the level of
income has reached a specific threshold.
The turning-point from a motorcycle
market (where low but increasing
income leads to increasing motorcycle
sales) to a car market (where further
increase in income beyond the tipping
point leads to increasing passenger car sales over motorcycle sales) may differ from country to country, and depends on
different factors, such as road infrastructure and inequality levels. In addition to that, after further maturing of the economy
and income reaching even higher levels, the relationship between GDP per capita and motorcycles becomes positive again,
as consumers ask for larger engine motorcycles (large bikes with more than 250cc engines) or electric motorcycles, as
motorcycles are viewed more as luxury & hobby goods for long-distance transportation rather than necessary goods.
One good example for this is China, where the number of motorcycles per 100 urban households showed significant
growth from 6.3 units in 1995 to around 25 units in 2007, and then a declined to around 19 units in 2019 whereas the
country’s GDP had increased significantly over the last two decades. Similarly, the total number of sales decreased from
26.6 million units in 2010 to 15.2 million units in 2019 (an annual drop of 6.02%). Even though most of the Chinese
motorcycle market dealt with small engine size motorcycles, the larger engine motorcycle market segment grew during
the same time. Sales of motorcycles under 250cc in China accounted for 98.7% of total sales in 2019 (or about 13 million
units) while motorcycles with engines of 250 cc and above recorded 177,000 sold units in 2019, which is a big increase
from just about 10,000 units in 2010. While China exports most of its produced motorcycles overseas, the production units
of motorcycles with an engine larger than 150cc from 2015 to 2018 (most recent available data) also showed an increase
from 787,000 units to 1,050,000 units (CAGR of 10.12% during the period).
Source: Transportation Research, Volume 90, 2021
Figure 2: Reverse U-Shape relationship between ownership and income

6
ABeam’s study reveals the position of each studied country within the ASEAN region on the mentioned relationship
pattern between the two markets in order to project potential future trends. The outlook of those countries’ markets
is analyzed based on various factors.
Myanmar
The motorcycle market in Myanmar has been spiking for over a decade due to their more affordable prices compared to
cars, easier process to buy, overall flexibility and the country’s lack of public transportation. The number of motorcycles
registered in Myanmar in 2019 was 6.1 million units, which was a significant increase from 2010 with only 1.9 million units
(an annual average growth of 14%, the highest in ASEAN). In comparison, there were just 564,000 cars in 2019, a number
which rose from 260,000 cars in 2010. (CAGR at 5.5%). The ratio between the number of motorcycles and passenger cars
registered as of 2019 was around 10.8 which was an increase from 7.2 in 2010, showing that Myanmar has been and still
is in the motorcycle market phase for the last decade. This upward trend is aligning with the level of income in Myanmar,
which during the past 5 years has had the lowest GDP per capita when compared to other ASEAN countries in this study.
This trend potentially comes from two main aspects: the growth of Myanmar’s economy, its transportation characteristics,
and its policy toward unregistered motorcycles.
Figure 3: Sales volume history of motorcycle in China Figure 4: Large engine motorcycles sales volume in China
Source: Chinese Automotive Industry Yearbooks Source: Chinese Automotive Industry Yearbooks
126
51
10 6 11.5 15 19.5
3848
92105
177
0
50
100
150
200
2010 2011 2012 2013 2014 2015 2016 2017 2018 2019
x1000 U
nit
s
250-400cc 400-750cc26,578
15,194
0
5,000
10,000
15,000
20,000
25,000
30,000
2010 2011 2012 2013 2014 2015 2016 2017 2018 2019
x1000 U
nit
s

7
Myanmar’s GDP per capita grew by 11.1% on average each year between 2000 and 2019. With its low per capita
income (GDP per capita was USD 1.4 thousand as of 2019), it is likely to see further growth in motorcycle purchases,
as it remains the first transportation option for most people. In addition to that, considering the transportation quality,
in 2018, the Department of Highway of Myanmar revealed that 20 million people (almost 40% if its total population)
still had no access to basic roads and that only 24% of all roads were paved road. Based on that, the main
transportation mode in Myanmar is more likely to rely on motorcycles rather than cars for the foreseeable future.
Myanmar’s government also announced a policy toward unregistered motorcycles. In the past, there were many
people in Myanmar using motorcycles without registration. With an updated policy in 2014, the Burmese government
started granting licenses to unregistered two-wheelers, as well as legal actions with fines equal to 50% of the
motorcycle price and to seize unregistered motorcycles for auction. Due to this, 450,000 illegally imported
motorcycles were registered over the course of just 4 months in 2014.
Importing motorcycles from neighboring countries offer cheaper prices to owners in Myanmar and it seems to be the
key reason behind that policy. Based on ABeam’s research, the average price of imported motorcycles without a license
from Thailand is between 2 million Kyat (USD 1,419) to 2.5 million Kyat (USD 1,774) and around 500,000 Kyat (USD 355)
to 1 million Kyat (USD 710) for motorcycles imported from China. The purchase price requires roughly an additional
500,000 Kyat (USD 355) in case of a licensed motorcycle. Thailand and China also represent most of the imported
motorcycle markets in Myanmar as the major export countries; with a market share of 40.5% and 34.8% respectively in
2019. Chinese brands such as Kenbo dominate the motorcycle market in Myanmar, however the two established brands,
Honda and Suzuki imported from Thailand are more popular. From the data of International Trade Centre, there were
Figure 5: Total number of registered motorcycles and
number of registered passenger cars in Myanmar
Figure 6: Ratio of number of motorcycles to number of
passenger cars and GDP per capita in Myanmar
Source: ASEANstats DataPortal Source: World Bank, ABeam analysis
7.2
10.8
6.0
7.0
8.0
9.0
10.0
11.0
12.0
800 1,000 1,200 1,400 1,600
GDP per capita (USD)
1,881
3,419
5,123
6,069
260 360 489 564
0
1,000
2,000
3,000
4,000
5,000
6,000
7,000
2010 2011 2012 2013 2014 2015 2016 2017 2018 2019
x1000 U
nit
s
Motorcycles Passenger cars

8
roughly 300,000 motorcycles estimated to be legally imported to Myanmar in 2019, while the number of total registered
vehicles were about 563,900 units in the same year.
Thailand
Thailand is one of the most important motorcycles markets in the region, with sales of 1.5 million units in 2020, the
estimated sales revenue of motorcycles domestically is around THB 86 billion (USD 2.75 billion). The statistics show that
the number of motorcycles in use in Thailand had increased from 17.3 million units in 2010 to 21.4 million units in 2019
considering about one-third of the total population owning motorcycles, representing an average annual growth rate of
2.4% which is the second-lowest in ASEAN, (The lowest is Singapore which has negative growth rate of 0.5% over the same
period) while the number of registered passenger cars went up from 9.9 million units to 17.3 million units in 2019 at a rate
of 6.4%. However, it can be said that the motorcycle sales have been fairly stable for the last 5 years in Thailand because
between 2015-2019, the number of motorcycle in Thailand had an annual growth rate of just 1% compared to the growth
rate between 2010-2014 which was around 4.1%.,. This lower growth in the Thai motorcycle market can be interpreted in
a way that shows that the country moved into the car market phase during the past decade. Official numbers of sales
volume show that, while the average annual growth rate from 2010 to 2019 for motorcycles decreased at 0.79%, the rate
for passenger cars increased by 5.01% over the same period. These numbers change the ratio between the number of
motorcycles and passenger cars registered in Thailand from 1.8 in 2010 to 1.2 in 2019.
Source: ABeam Analysis
Figure 7: Myanmar position in the reverse U-Shape relationship

9
Two main reasons for the lowered ratio are the increase of GDP per capita and the smaller price gap between the
motorcycle and car market; Thailand has had significant economic growth in GDP per capita from 5,076 USD in 2010
to USD 7,806 in 2020 (CAGR at 4.9% over the past 10 years). This growth is not considered high compared to other
emerging countries in the region like Vietnam or Cambodia, however, only in the last 5 years, Thailand’s GDP per
capita growth rate was the highest among the selected countries for this report with an annual growth rate of 7.5%
over the past 5 years (Vietnam’s growth rate during the same time was 6.8%). Another contributing fact was that
when the government had more income, highway kilometers and paved roads nationwide were improved, which further
pushed the trend towards long-distance transportation like cars. Also, as previously stated, when people have more
income, the shift from small motorcycles to more premium items like large-size motorcycles or passenger cars
becomes noticeable. Similar to China’s market, the new registration of larger engine motorbike in Thailand has grown
remarkably from 27,238 units in 2015 to 63,086 units in 2019 which is an estimated 4.0% of the total motorcycle
registration in the same year. Even with the impact of the pandemic and economic trends, the market still increased to
70,486 in units sold in 2020 with a 12% growth from 2019. In contrast, the sales of small-engine motorcycles decreased
at a negative 2.0% CAGR over the last 5 years.
With multiple promotions for low emission cars and incentives provided for investment projects in Thailand, the number
for local production – especially cars – increased tremendously and made the minimum car price in Thailand drop
significantly over the last decade, shifting more motorcycle buyers to become car buyers instead. Thailand produced less
than 500,000 cars in 2000, but in 2019, about 2 million cars were manufactured for domestic sales and export. Trade
agreements also played a significant role to lower the cost of imported parts, components, and machinery to produce cars
in Thailand. To illustrate, before 2008, the minimum passenger car price (4-doors) in Thailand started at above 500,000 THB
for models like the Vios or City. Since the engine downsizing technology came to the market, the 1.2l Nissan March was
Figure 8: Total number of registered motorcycles and
number of registered passenger cars in Thailand
Figure 9: Ratio of number of motorcycles to number of
passenger cars and GDP per capita in Thailand
Source: ASEANstats DataPortal Source: World Bank, ABeam analysis
1.8
1.2
0.0
1.0
2.0
3.0
4.0
4,500 5,500 6,500 7,500 8,500
GDP per capita (USD)
17,323
19,987 20,49721,425
9,888
13,02415,004
17,281
0
5,000
10,000
15,000
20,000
25,000
2010 2011 2012 2013 2014 2015 2016 2017 2018 2019
x1000 U
nit
s
Motorcycles Passenger cars

10
introduced with a price at around 400,000 THB in 2009. Currently, customers can also find passenger car prices at 318,000
THB for models like the Suzuki Celerio. The motorcycle market also had these benefits, but the impact was less noticeable
than it was for the car market. As a result, the gap between motorcycles and passenger cars has gradually become smaller.
Price Brand Model Key Spec Y2008 Y2019
Passenger
Cars
Toyota Vios 1.5L MT 514,000 -
Suzuki Celerio 1.0L MT - 318,000
Motorcycles Honda Wave 100 CC MT 33,500 -
Zongshen Ryuka 110 CC MT - 29,900
In a nutshell, ABeam sees that Thailand is already in the car market phase as the GDP per capita of Thailand stood at USD
7,806 in 2019 ranking as third in the region following Singapore and Malaysia. The middle-income population in the
country has become more likely to buy a car rather than a motorcycle. ABeam believes that after the pandemic, the overall
motorcycle market may not show any significant further growth, as it has reached its saturation, but the sales will remain
stable for the next few years. Most people are more
likely to choose a car as their main means of
transport, including the upcountry regions, but might
power at the same time further growth in the larger
engine motorcycle market. The share of large engine
motorcycles in Thailand will not go as high as it does
in western countries like the US or Germany where
the share of new registered motorcycles with 250cc
and higher stood at above 70% for both in 2019.
ABeam forecasts the average annual growth rate over
the next 3 years for larger engine motorcycles sales
units to be around 9.28%.
Vietnam
Motorcycles are the main transportation mode in Vietnam, with some people saying that Vietnam is a motorbike nation.
There were over 62 million registered motorcycles which for a total population of 96 million means that 2 in 3 people
owned a bike in 2019 (CAGR at 8.0%) whereas the total number of registered vehicles was recorded at merely 2 million
Table 1: Passenger cars and motorcycles minimum selling price between 2008 and 2019, THB
Source: Autospinn.com, JRmotor.com, Autofun.co.th and Boltech.co.th
Figure 10: Thailand position in the reverse U-Shape relationship
Source: ABeam Analysis
11
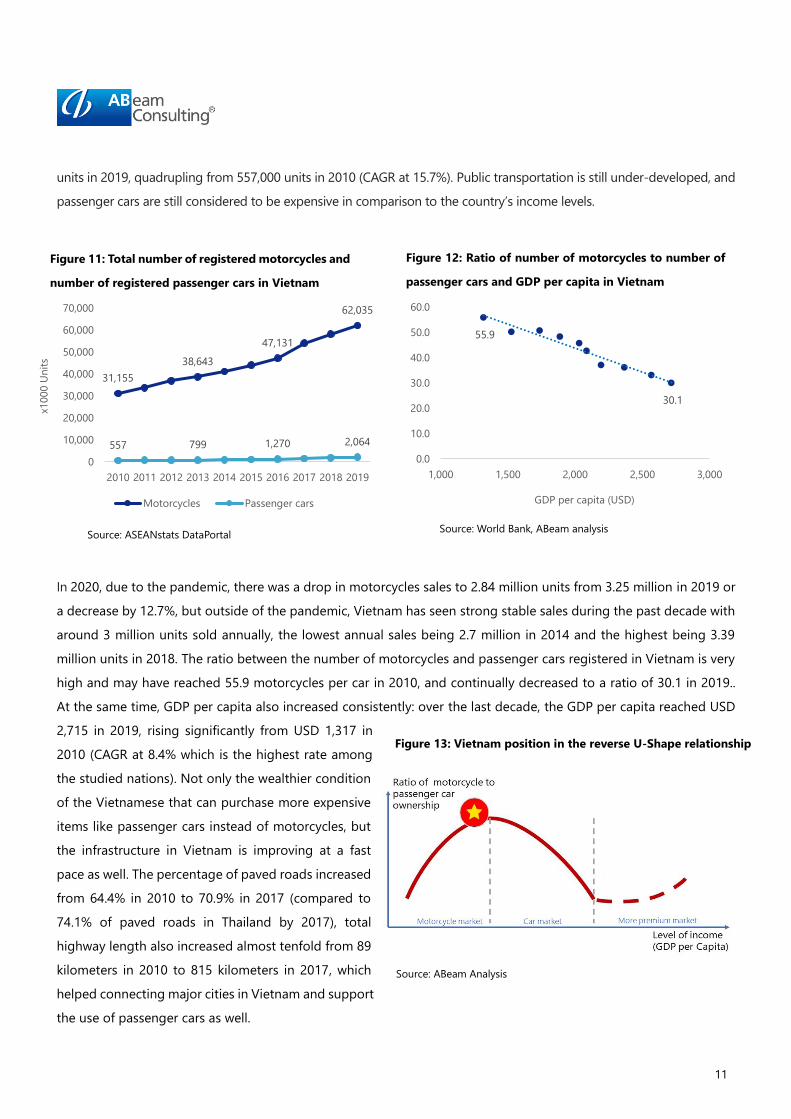
units in 2019, quadrupling from 557,000 units in 2010 (CAGR at 15.7%). Public transportation is still under-developed, and
passenger cars are still considered to be expensive in comparison to the country’s income levels.
In 2020, due to the pandemic, there was a drop in motorcycles sales to 2.84 million units from 3.25 million in 2019 or
a decrease by 12.7%, but outside of the pandemic, Vietnam has seen strong stable sales during the past decade with
around 3 million units sold annually, the lowest annual sales being 2.7 million in 2014 and the highest being 3.39
million units in 2018. The ratio between the number of motorcycles and passenger cars registered in Vietnam is very
high and may have reached 55.9 motorcycles per car in 2010, and continually decreased to a ratio of 30.1 in 2019..
At the same time, GDP per capita also increased consistently: over the last decade, the GDP per capita reached USD
2,715 in 2019, rising significantly from USD 1,317 in
2010 (CAGR at 8.4% which is the highest rate among
the studied nations). Not only the wealthier condition
of the Vietnamese that can purchase more expensive
items like passenger cars instead of motorcycles, but
the infrastructure in Vietnam is improving at a fast
pace as well. The percentage of paved roads increased
from 64.4% in 2010 to 70.9% in 2017 (compared to
74.1% of paved roads in Thailand by 2017), total
highway length also increased almost tenfold from 89
kilometers in 2010 to 815 kilometers in 2017, which
helped connecting major cities in Vietnam and support
the use of passenger cars as well.
Figure 11: Total number of registered motorcycles and
number of registered passenger cars in Vietnam
Figure 12: Ratio of number of motorcycles to number of
passenger cars and GDP per capita in Vietnam
Source: ASEANstats DataPortal Source: World Bank, ABeam analysis
Figure 13: Vietnam position in the reverse U-Shape relationship
Source: ABeam Analysis
55.9
30.1
0.0
10.0
20.0
30.0
40.0
50.0
60.0
1,000 1,500 2,000 2,500 3,000
GDP per capita (USD)
31,155
38,643
47,131
62,035
557 799 1,270 2,064
0
10,000
20,000
30,000
40,000
50,000
60,000
70,000
2010 2011 2012 2013 2014 2015 2016 2017 2018 2019
x1000 U
nit
s
Motorcycles Passenger cars

12
The Vietnamese market is dominated by five producers: Honda, Yamaha, Suzuki, SYM, and Piaggio, which together
represented over 97% of the motorcycle market in 2019 (both locally produced and imported bikes). In 2017, the
government announced the intention to shift from ICE motorized two-wheelers to 100% EVs by 2030, especially in
Hanoi and Ho Chi Min by 2030, the two largest cities in Vietnam to ease traffic congestion and lower the number of
traffic accidents as well as solving environmental pollution, to contribute to better living quality and cities’ sustainable
development in Vietnam. As a result, these makers are slowing down in introducing new features and models for the
current ICE line-up and aim for electric model sales in recent years. The Vietnam Association of Motorcycle
Manufacturers (VAMM) reported that Honda, Yamaha, Suzuki, Piaggio and SYM sold 3.3 million motorbikes in 2019
which is a reduction of 3.8% against the sales in 2018. In contrast, the coming wave of electric scooter manufacturers
can be seen by the entry of VinFast, a local manufacturing giant. VinFast Klara was marketed in November 2018 and
sold 30,000 units in the following year. The world’s largest electric motorcycle maker Yadea from China has also just
started their operations in Vietnam by 2019. Overall, ABeam believes that Vietnam is moving to the beginning of the
saturation for motorcycle market as the number of passenger cars increased more rapidly than the motorcycle
number, which in combination with the previously mentioned factors, points to a more mature future motorcycle
market with stable numbers but without significant growth over the next decade.
Indonesia
Globally, Indonesia is the third-largest motorcycle market after India and China. The current Indonesian market is
dominated by lightweight scooters (below 150cc) which accounted for over 80% of all domestic sales in 2020. Honda
and Yamaha are the top two players in the market, with Honda holding 76% market share in 2019. Registered
motorcycles have gradually been increasing from 61 million units in 2010 to 106 million units in 2019, representing a
6.4% growth annually. In 2020, due to the pandemic, sales of motorcycles dropped sharply by 43.7%, the worst drop
in the world. Before the pandemic, the market presented its highest figures at 8 million units sold in 2011 before a
drop to 7 million units in 2012, due to the Indonesian government tightening its monetary policy, making financing
for motorcycle purchases harder. After that, sales progressively declined from 7.7 million units in 2013 to 5.9 million
units in 2017, even so, the market slightly improved before 2020, with sales reaching 6.4 million and 6.5 million units
in 2018 and 2019 respectively. On the other hand, the number of registered passenger cars in Indonesia also rose
steadily at a similar growth rate as motorcycles at 5.9% over the same period. When looking at the ratio between
motorcycles and passenger cars, the ratio stayed constantly between around 6-7 over the past decade.

13
Reasons for this identical increase were economic trends and growing mobility services. The recent official numbers
show that the GDP per capita was USD 4,135 as of 2019 growing from USD 3,122 in 2010; its annual growth rate was
at 3.2% and was considered as the second lowest in the region. Even though Indonesian people’s wealth did not go
up as much compared to other countries in the region, there are many mobility service providers growing rapidly in
Indonesia like Gojek, Tokopedia and Bluebird, which accelerated the demand in motorcycles and passenger cars
parallelly over the past decade.
Another reason was the government announcing not to raise electricity tariffs in 2018 and postponing any increase
in fuel prices. Studies found that, the key factors for the growth were due to the increase in disposable income, rising
demand for cheaper personal transportation and
increase in female riders, improving road
infrastructure and growing popularity of credit &
loan facilities. From the ups and downs over the
past decade, the market can be considered fairly
sensitive to various factors such as, economic
trends that impact purchase power of the low-
income demographic of the country. ABeam
believes that Indonesia is in the transition from a
motorcycle market to a car market or just went
after the top of the U-Shape relationship line
due to the gradual decrease in the growth of
motorcycle sales each year, the current level of
income per capita and the expansion of mobility services in Indonesia. ABeam expects further slowdown for the
motorcycle growth, but an increase in the numbers of passenger vehicle sales for Indonesia in the next few years.
Figure 14: Total number of registered motorcycles and
number of registered passenger cars in Indonesia
Figure 15: Ratio of number of motorcycles to number
of passenger cars and GDP per capita in Indonesia
Source: ASEANstats DataPortal Source: World Bank, ABeam analysis
Figure 16: Indonesia position in the reverse U-Shape relationship
Source: ABeam Analysis
61,078
86,253
106,538114,786
106,654
8,891 10,540 13,278 14,849
0
20,000
40,000
60,000
80,000
100,000
120,000
140,000
2010 2011 2012 2013 2014 2015 2016 2017 2018 2019
x1000 U
nit
s
Motorcycles Passenger cars
6.9 7.2
5.0
6.0
7.0
8.0
9.0
10.0
2,500 3,000 3,500 4,000 4,500
GDP per capita (USD)

14
Conclusion
In summary we can see that most ASEAN motorcycle markets will still be profiting from stable sales over the next
years, but that overall, the trend will be moving towards a car market within the next few years. The figure below
shows the estimated position of each studied country with the ratio of registered motorcycles to passenger cars and
GDP per capita levels for the last 10 years.
Key factors that have accelerated the surge in two-wheeler ownership in ASEAN include the lack of public
transportation systems that are unable to support the growth of population and the need for higher living quality
like in Myanmar. The motorcycle will still be their main option due to traffic conditions, congestion and the lower
purchase cost and greater fuel efficiency. While Vietnam and Indonesia are still depending a lot on motorcycles, the
trend of replacing their motorcycles with passenger cars will become more and more apparent over the next few
years thanks to an increase of national income, policy initiatives and expansion of the car industry in their respective
countries. Thailand is likely to move from a car market towards a more premium motorcycle market as the growth in
large-engine size motorcycles is increasing and a decline of the ratio between motorcycles and cars can be observed.
Based on our insights and analysis, there are two major takeaways. Firstly, understanding the market and customers
is the key. Data and details of customer and market intelligence will enable manufacturers and mobility service
providers to prepare more appropriate products and strategies to ramp up the sales in the region. A wide range of
electric vehicles or e-bikes, chargers, ride-hailing services, e-commerce delivery fleet management, cold chain storage,
smart maintenance capabilities, etc. as well as engagement with digital platforms can help to increase market share.
Figure 17: Country position in the reverse U-Shape relationship
Source: ABeam Analysis

15
Players need to focus on and gather more data, not only about the market metrics, but driver behavior, bike usage
patterns, customer preferences, which are all essential for optimizing the user experience and achieving better results
to retain or convert customers. Historically dealers in the motorcycle business have been more passive than their
automotive counterparts when it comes to customer interaction and follow-ups. Looking for an upgrade of existing
services for better customer experience can help capitalize on stable markets and win over more users. Dealer
Management Systems and solutions supported by flexible low-code solution that can be deployed easily to mobile
devices can support dealers in new and innovative ways, maybe even helping the guide customers with history to a
more luxurious offering as income levels increase in the region.
About the Author(s)
Luk Saenprasarn is an Associate Manager working out of the Bangkok office, Jonathan Vargas Ruiz is a Senior
Manager and Thana Vivathirun is an Associate Manager from the Automotive Industry Unit located in Bangkok.
How can ABeam support motorcycle dealers and OEMs?
ABeam has been a leader in the implementation for countrywide Dealer Management Systems across South East
Asia, supporting clients in selecting the best solutions and or enhancing dealers with light-weight add-ons to
smoothen the sales & service process with its ABeam DRIVE suite.
Contact us if you are interested in our research and more information https://www.abeam.com/th/en/contact_th

16
Sources
https://www.bbc.com/news/world-asia-40498052
http://www.caam.org.cn/chn/4/cate_36/con_5228371.html
https://data.aseanstats.org/indicator/ASE.TRP.ROD.B.011
https://data.worldbank.org/
https://web.dlt.go.th/statistics/
http://www.jama-english.jp/statistics
https://www.krungsri.com/en/research/industry/industry-outlook/Hi-tech-Industries/Motorcycles/IO/io-motorcycles-20
https://www.globalyadea.com/newsdetails-68.html
https://www.marklines.com/en/report/rep2035_202007
https://www.mic.org/#/statistics
https://www.mmtimes.com/opinion/11570-can-motorcycle-import-policy-curb-illegal-trade.html
https://www.motorcyclesdata.com/
https://trid.trb.org/view/1757390
https://pdf.dfcfw.com/pdf/H3_AP202006031382035249_1.pdf?1591200284000.pdf
https://www.pewresearch.org/fact-tank/2015/04/16/car-bike-or-motorcycle-depends-on-where-you-live/
https://www.techsciresearch.com/report/indonesia-two-wheeler-
market/3196.html#:~:text=Indonesia%20two%20wheeler%20market%20is,world%20after%20India%20and%20China.
https://www.thaiauto.or.th/2012/backoffice/file_upload/research/11125561430391.pdf
https://www.unescap.org/sites/default/files/Myanmar_9.pdf
https://vietnamtimes.org.vn/vietnam-motorcycle-sales-dropped-amid-covid-19-19464.html
https://vneconomictimes.com/article/society/vietnam-has-4th-highest-number-of-motorbikes
https://vietnamnet.vn/en/business/what-is-the-future-of-vietnam-s-electric-motorbike-market-628145.html

17
About ABeam Consulting
ABeam Consulting provides business transformation services that create strategic advantage, improve business
processes, leverage technology innovation, and enhance organizational performance for leading multinational and
domestic companies worldwide. ABeam partners with clients to diagnose and solve their real challenges with
solutions that combine industry and operational best practices with technical expertise. Pragmatic approaches ensure
that clients gain measurable value more quickly. Headquartered in Tokyo, ABeam’s 6,600 professionals serve more
than 800 clients throughout Asia, the Americas and Europe. For more information, please visit
http://www.abeam.com/
© 2021 ABeam Consulting Ltd.
"ABeam" and its logo are registered trademarks of ABeam Consulting Ltd. in Japan and other countries.
All other trademarks and trade names are the property of their respective owners.