Assessing the impact of ASEAN economic integration on ... · Assessing the impact of ASEAN economic...
68
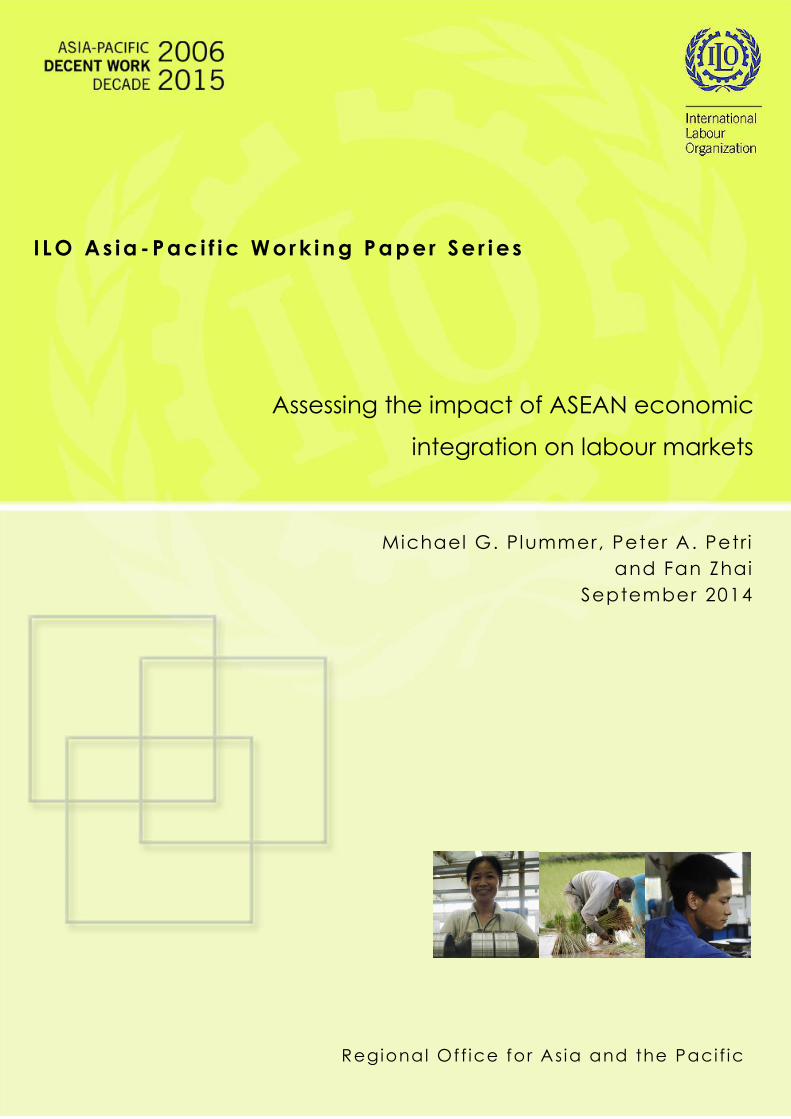
Michael G. Plummer, Peter A. Petri and Fan Zhai September 2014 Regional Office for Asia and the Pacific ILO Asia-Pacific Working Paper Series Assessing the impact of ASEAN economic integration on labour markets
Transcript of Assessing the impact of ASEAN economic integration on ... · Assessing the impact of ASEAN economic...
Michael G. Plummer, Peter A. Petr i
and Fan Zhai
September 2014
Regional Off ice for As ia and the Paci f ic
I LO As ia - Pa c i f i c Wor k i n g Pa per Se r i es
Assessing the impact of ASEAN economic
integration on labour markets
ILO Asia-Pacific Working Paper Series
Regional Office for Asia and the Pacific
Michael G. Plummer, Peter A. Petri
and Fan Zhai
September 2014
Assessing the impact of ASEAN economic
integration on labour markets
Copyright © International Labour Organization 2014
First published 2014
Publications of the International Labour Office enjoy copyright under Protocol 2 of the Universal Copyright
Convention. Nevertheless, short excerpts from them may be reproduced without authorization, on condition that
the source is indicated. For rights of reproduction or translation, application should be made to ILO Publications
(Rights and Permissions), International Labour Office, CH-1211 Geneva 22, Switzerland, or by email:
[email protected]. The International Labour Office welcomes such applications.
Libraries, institutions and other users registered with reproduction rights organizations may make copies in
accordance with the licences issued to them for this purpose. Visit www.ifrro.org to find the reproduction rights
organization in your country.
Plummer, Michael G; Petri, Peter A; Zhai, Fan
Assessing the impact of ASEAN economic integration on labour markets / Michael G. Plummer, Peter A. Petri
and Fan Zhai ; ILO Regional Office for Asia and the Pacific. - Bangkok: ILO, 2014
xi. 54 p. (ILO Asia-Pacific working paper series, ISSN: 2227-4405 (web pdf))
ILO Regional Office for Asia and the Pacific
labour market / employment / decent work / productivity / wages / economic integration / regional cooperation /
ASEAN countries
13.01.2
ILO Cataloguing in Publication Data
The designations employed in ILO publications, which are in conformity with United Nations practice, and the
presentation of material therein do not imply the expression of any opinion whatsoever on the part of the
International Labour Office concerning the legal status of any country, area or territory or of its authorities, or
concerning the delimitation of its frontiers.
The responsibility for opinions expressed in signed articles, studies and other contributions rests solely with their
authors, and publication does not constitute an endorsement by the International Labour Office of the opinions
expressed in them.
Reference to names of firms and commercial products and processes does not imply their endorsement by the
International Labour Office, and any failure to mention a particular firm, commercial product or process is not a
sign of disapproval.
ILO publications and electronic products can be obtained through major booksellers or ILO local offices in many
countries, or direct from ILO Publications, International Labour Office, CH-1211 Geneva 22, Switzerland, or ILO
Regional Office for Asia and the Pacific, 11th Floor, United Nations Building, Rajdamnern Nok Avenue, Bangkok
10200, Thailand, or by email: [email protected]. Catalogues or lists of new publications are available free of
charge from the above address, or by email: [email protected]
Visit our website: www.ilo.org/publns or www.ilo.org/asia
Printed in Thailand

Regional Office for Asia and the Pacific iii
Preface
In 2015, the ASEAN Economic Community (AEC), envisioned as a single common market and
production base, will become a reality. This will lead to the freer flow of goods, services, investment
capital and skilled labour in the region. Tariffs and non-tariff barriers will be reduced, which will have
implications for intraregional trade and investment. New opportunities for growth and prosperity are
likely to emerge, but the challenge is to ensure that growth is inclusive and prosperity is shared.
Ultimately, the success of ASEAN regional integration will depend on how it affects the labour market
and therefore how it improves the quality of life of women and men in the region. To prepare for the
impact and find the opportunities, the International Labour Organization and the Asian Development
Bank initiated a joint study to examine the impact of the AEC on labour. Findings from the series of
studies that were initiated are collected in the 2014 publication, ASEAN Community 2015: Managing
integration for better jobs and shared prosperity. That report highlights the challenges and opportunities
that will accompany the AEC, including managing labour migration, boosting productivity and wages
and improving job quality. The report offers policy recommendations for creating better jobs and
ensuring that the benefits of the AEC are equitably shared among different countries and sectors.
The background papers to the joint publication are available as part of the ILO Asia–Pacific Working
Paper Series, which is intended to enhance the body of knowledge, stimulate discussion and encourage
knowledge sharing and further research for the promotion of decent work in Asia and the Pacific. This
paper, by Michael Plummer, Peter Petri and Fan Zhai, uses a state-of-art computable general
equilibrium model to examine the impact of ASEAN economic integration on labour markets through
2025.
The ILO is devoted to advancing opportunities for women and men to obtain decent and productive
work. It aims to promote rights at work, encourage decent employment opportunities, enhance social
protection and strengthen dialogue in handling work-related issues. As countries in the Asia and the
Pacific region continue to recover from the global economic crisis, the ILO’s Decent Work Agenda and
the Global Jobs Pact provide critical policy frameworks to strengthen the foundations for a more
inclusive and sustainable future.
Yoshiteru Uramoto
Assistant Director-General and
Regional Director for Asia and the Pacific


Regional Office for Asia and the Pacific v
Contents
Preface……………………………………………………………………………………. iii
Acknowledgements………………………………………………………………………. vii
Abstract…………………………………………………………………………………………… ix
Acronyms………………………………………………………………………………………… xi
1. Introduction……………………………………………………………………………. 1
2. Progress on the ASEAN economic integration initiatives…………………………….. 2 2.1 Internal integration: The AEC and its four pillars…………………………………………4
2.2 External integration and ASEAN centrality………………………………………………..6
3. Review of the empirical literature on the effects
of ASEAN economic integration……………………………………………………… 7
3.1 Empirical estimates of ASEAN economic integration…………………………………… 8
4. Modelling methodology, specifications and data………………………………………10
4.1 Basics of the CGE model for this study…………………………………………………… 10
4.2 Economic integration scenarios…………………………………………………………… 12
4.3 Brief comments on the underlying data………………………………………………….... 13
5. Results…………………………………………………………………………………. 16
5.1 Aggregate effects………………………………………………………………………….. 16
5.2 Effects on wages and employment…………………………………………………………23
5.3 Sector effects……………………………………………………………………………… 32
6. Summary and policy implications…………………………………………………….. 41
References…………………………………………………………………………………43
Annexes
Annex A. The structure of nested constant elasticity of substitution
production functions in the CGE model…………………………………………………. 45
Figure A1. Production nesting for ASEAN-6………………………………………………… 45
Figure A2. Production nesting for other regions……………………………………………… 45
Annex B. Welfare effects on an annual basis 2010–25, by country and scenario………. 46
Table B1. Welfare effects relative to the baseline, estimated value 2010–25
($ billion, 2007 prices)………………………………………………………………….. 46
Table B2. Welfare effects relative to the baseline, 2010–25
(estimated value as % of baseline GDP) …………………………………………………... 51

vi Regional Office for Asia and the Pacific
List of tables
1. Overview of the AEC Blueprint…………………………………………………………………. 4
2. Tariff protection rates in 2007 (%)……………………………………………………………… 15
3. Skill composition of labour forces by sector in six ASEAN countries (%)……………………. 17
4. Skill and gender composition of employment in six ASEAN countries (%)…………………… 19
5. Welfare gains relative to the baseline, 2025……………………………………………………. 20
6. Effects on international trade (2025)…………………………………………………………… 21
7. Effects on consumption and real exchange rate, 2025…………………………………………. 22
8. Effects on factor return rates (% change from baseline, 2025)………………………………… 24
9. Effects on wages (% change from baseline, 2025)……………………………………………… 25
10. Effects on total employment (% from baseline, 2025)………………………………………… 28
11. Effects on total employment (change from baseline, ‘000 persons, 2025)……………………. 30
12. Effects on sector employment, 2025 (change from baseline, ‘000 persons)…………………… 35
13. Effects on sector value added (% change from baseline, 2025)………………………………... 39
Regional Office for Asia and the Pacific vii
Acknowledgements
The authors thank the participants of the November 2013 International Labour Organization (ILO) and
Asian Development Bank (ADB) conference, ASEAN Community 2015: Managing integration for
better jobs and shared prosperity, at which a first version of this paper was presented for their
constructive comments. The authors also thank Kee Beom Kim, Sukti Dasgupta, David Cheong and
Phu Huynh of the ILO and Myo Thant of the ADB for their detailed comments and encouragement.
Any factual errors within the document are the responsibility of the authors.

Regional Office for Asia and the Pacific ix
Abstract
Enhancing regional economic integration, both across Member States and with their neighbours in the
Asia–Pacific region, has become an important priority in Association of Southeast Asian Nations
(ASEAN). Building on the ASEAN Free Trade Area, ASEAN has been implementing the ASEAN
Economic Community (AEC) since 2007, scheduled for completion in 2015. The AEC is in many ways
the most ambitious economic cooperation programme in the developing world, with its goal being the
creation of an economic space in which there will be a free flow of goods, services, foreign direct
investment and skilled labour. In addition, ASEAN has cemented free trade areas with six regional
partners (Japan, Republic of Korea, People’s Republic of China, Australia, New Zealand and India)
and, together with these economies, launched the Regional Economic Comprehensive Partnership
(RCEP) in November 2012, also with the goal of completion in 2015. The RCEP is intended to be a
modern, comprehensive regional free-trade area, covering a wide variety of issues, from trade in goods
and services to intellectual property protection.
This study estimates the implications of the regional initiatives on ASEAN Member States using a
cutting-edge computable general equilibrium model. In addition to gauging the effects on welfare, trade
and economic structure, it considers the ramifications for labour markets. Using detailed data from the
Labour Force Surveys available for six ASEAN markets (Cambodia, Indonesia, the Lao People’s
Democratic Republic, the Philippines, Thailand and Viet Nam), the paper captures the effects of these
initiatives on seven categories of labour defined at the occupational level (three types of skilled labour,
three types of semi-skilled labour and unskilled labour). It also includes estimates of the distributional
effects of these initiatives for labour compared with other factors (capital and land) and on gender.
In general, the paper estimates impressive welfare and export gains from deepening and expanding
economic cooperation. These gains are larger than those estimated in other studies because our approach
– under the assumption of persistent unemployment for some categories of labour – also models how
overall employment would increase as liberalization improves the competitiveness of ASEAN
economies. All ASEAN economies benefit in the AEC and RCEP scenarios; overall income growth is
estimated to rise by 8 per cent (AEC scenario) and 18.4 per cent (RCEP scenario) at the aggregate
ASEAN level, and export growth mirrors these gains. We also estimate significant increases in wages
and employment, depending on the scenario, with the AEC and RCEP scenarios generating the largest
effects.
Results on wages and other factor returns vary across broad factors (labour, capital and land) and for
labour across skill levels and by gender. In particular, in terms of this latter point, in Indonesia, the Lao
People’s Democratic Republic and Thailand, the increase in men’s wages exceeds those of women in
every policy scenario. Although labour always gains, so do the returns to capital and, in most scenarios
and countries, to land. In addition, skilled labour usually benefits in terms of wages more than semi-
skilled labour, which in turn gains relative to unskilled labour. Taken together, these results suggest that
the economic “pie” will become much bigger with these initiatives, but lower-wage workers will feel
the benefits through better access to employment rather than higher wages.
The structural changes driving these results could also have an important effect on informality. In the
AEC and RCEP scenarios, the rise in sector employment tends to be dominated by increasing jobs in
the informal sectors, with the exception of the Philippines. For example, informal jobs account for
almost two-thirds of the impressive growth in total employment in Viet Nam under the AEC scenario
and more than three-fourths of employment growth in Indonesia under the RCEP scenario.
x Regional Office for Asia and the Pacific
Thus, even though we expect these initiatives to generate large returns to ASEAN countries and to
labour overall, it is important for governments to take into account the mixed effects on the distribution
of these gains and act accordingly to ensure that the benefits are fairly spread.
The responsibility for opinions expressed in articles, studies and other contributions rests
solely with the authors, and publication does not constitute an endorsement by the
International Labour Office of the opinions expressed in them, or of any products,
processes or geographical designations mentioned.
About the authors
Michael G. Plummer is the Director of SAIS Europe, Professor of International Economics at Johns
Hopkins University and (non-resident) Senior Fellow at the East–West Center; Peter A. Petri is the
Carl J. Shapiro Professor of International Finance at Brandeis University and (non-resident) Senior
Fellow at the East–West Center; and Fan Zhai is the Managing Director of Asset Allocation and
Strategic Research, Chinese Investment Corporation.
Regional Office for Asia and the Pacific xi
Acronyms
ACIA ASEAN Comprehensive Investment Agreement
AEC ASEAN Economic Community
AFTA ASEAN Free Trade Area
AIC ASEAN Industrial Complementation
AICO ASEAN Industrial Cooperation Scheme
AIJV ASEAN Industrial Joint Ventures
AIP ASEAN Industrial Projects
APEC Asia–Pacific Economic Cooperation
ASEAN Association of Southeast Asian Nations
BBC Brand-to-Brand Complementation
CEPT Common Effective Preferential Tariff
CES constant elasticity of substitution
CGE computable general equilibrium
FDI foreign direct investment
GDP gross domestic product
RCEP Regional Comprehensive Economic Partnership
TPP Trans-Pacific Partnership

ILO Regional Office for Asia and the Pacific 1
1. Introduction
Over the past quarter-century, the economies of the Association of Southeast Asian Nations (ASEAN) have
increasingly adopted an outward-oriented economic development strategy. Although the Asian financial crisis
that began in 1997 underscored the importance of a well-planned approach to financial liberalization, all
Member States have progressively reduced, to various degrees, their respective barriers to international trade
and investment, such that today the region is, perhaps, the most open among developing economies. The results
have been impressive, with the region registering among the highest growth rates in the world. The region is
inhabited by more than 600 million citizens, boasts a gross domestic product (GDP) of US$1.9 trillion and a
2011 GDP per capita of about $3,500–$4,500 for the ASEAN-6 (Brunei Darussalam, Indonesia, Malaysia, the
Philippines, Singapore and Thailand) and $1,100 for the newest members (Cambodia, the Lao People’s
Democratic Republic, Myanmar and Viet Nam – the CLMV economies) (ADBI, 2014). All but three members
are classified as middle- or high-income countries. As well, the Asian Development Bank estimates that these
figures will rise to 710 million population, $5.5 trillion GDP value and $7,700 GPD per capita by 2030 (ADBI,
2014). The region also is making great strides in terms of deepening economic cooperation, including the
ASEAN Free Trade Area (AFTA) already in place, the ASEAN Economic Community (AEC) in the works
since 2007 and the Regional Comprehensive Economic Partnership (RCEP) just beginning.
Deepening intraregional integration within ASEAN and with its neighbours in North-East Asia and beyond
has become an important policy priority for the region and its leaders. ASEAN is increasingly reliant on Asia
for its growth and prosperity, a trend that is likely to continue into the future as the Pacific Century unfolds.
The share of Asia in ASEAN trade and investment has been rising impressively over the past decade. China,
in particular, has increased its share of ASEAN total trade, from about 5 per cent in 2001 to 13 per cent in
2012, while the respective share of the United States and the European Union almost halved, to 18 per cent
from 30 per cent.1 Today ASEAN’s trade is relatively balanced between the shares of its own intraregional
trade (China and Japan, the United States and the European Union (EU) and the rest of the world. With its
outward-oriented development strategy, ASEAN has also been rapidly “internationalizing”, with exports as a
percentage of GDP rising in all Member States. For ASEAN as a whole, exports value to GDP came to 61 per
cent in 2010, up from just 28 per cent in 1984 (WTO, 2012). This is a phenomenal increase in absolute terms
and relative to the rest of the world. China and India, with respective export to GDP shares in 2010 of 27 per
cent and 13 per cent, were relatively closed when compared with ASEAN (WTO, 2012). Additionally, there
is a great deal of variance in trade as a share of GDP among the individual ASEAN member countries, from
28 per cent in Myanmar to 155 per cent in Viet Nam and 305 per cent in Singapore in 2012 (Chia and Plummer,
forthcoming 2014).
The rising importance of Asia and the growing internationalization of the ASEAN economies are to no small
degree being influenced by the increasing significance of regional production chains, which in turn are closely
related to trends in foreign direct investment (FDI). After a slowdown in FDI in the wake of the Asian financial
crisis, FDI inflows to ASEAN have made a strong comeback, despite the difficult global economic
environment since 2008. In fact, ASEAN has always pulled in considerably more FDI than India, and the
region substantially closed its gap with China in terms of FDI inflows in 2012, with its $111 billion total
comparing favourably with China’s $121 billion (and $26 billion for India).2
1 UNCOMTRADE.
2 UNCTAD, World Investment Report 2013, http://unctad.org/en/PublicationsLibrary/wir2013_en.pdf [accessed 24 Sep. 2014].
2 ILO Regional Office for Asia and the Pacific
As part of its integration strategy, ASEAN is pursuing internal and external approaches to enhancing economic
cooperation. With respect to internal integration, it launched the AEC in 2007 to create free flow of goods,
services, FDI and skilled labour as well as freer flow of capital by 2015. This “stylized common market” is
arguably the most ambitious among any major region in the developing world.3 At the external level, ASEAN
has five bilateral free-trade areas (FTAs) with six economies in Asia (China, India, Japan, Republic of Korea
and New Zealand and Australia together); in November 2012, ASEAN launched the RCEP initiative, which is
slated to be a cutting-edge regional FTA in 2015 (it finished its second round of negotiations in September
2013 and began its third round in January 2014). The RCEP represents a desire shared by ASEAN leaders to
take an economic leadership role, based on “ASEAN centrality”.
The goal of this paper is to capture the economic effects of these internal and external initiatives for the ASEAN
economies and, in particular, the workers of those Member States. Specifically, we have used a state-of-the-
art computable general equilibrium (CGE) model to estimate the economic effects of various ASEAN-based
initiatives (various scenarios of ASEAN economic integration) and the ongoing ASEAN-centric initiative,
RCEP. The study uses a detailed employment data set and special modelling features that make it possible to
calculate the expansion of employment as a result of integration, based on the assumption that some categories
of labour are initially not fully employed. In addition to welfare and trade effects, we have also examined the
implications of these agreements for factor returns, wages by occupation and sex as well as total employment
and its distribution across sectors.
The rest of the paper is organized as follows: In section 2, we review the progress to date of ASEAN economic
integration initiatives, followed in section 3 by a summary of the existing empirical literature of the effects of
economic cooperation accords in the region. Section 4 presents the details of the CGE model employed and
the data used, and section 5 summarizes the results of the simulations for various initiatives. Section 6
concludes.
2. Progress on the ASEAN economic integration initiatives
Embracing cooperation as a means of enhancing the interests of its Member States has been the goal of ASEAN
since its foundation with the Bangkok Declaration in 1967. But economic cooperation programmes established
in the wake of the First ASEAN Summit were nominal. The ASEAN Preferential Trading Agreement (PTA)
was signed in February 1977 by the ASEAN foreign ministers, but the limited positive-list approach with low
margins of preference ensured that the PTA would have little effect (one famous example is preferential
treatment of imports of snowploughs in South-East Asia, although not a particularly high-demand good in the
region). In 1984, the PTA was extended to include a negative-list approach, with extensive exclusion lists; the
margin of preferences was further deepened at the Third ASEAN Summit in 1987. No study, however, has
captured any significant effect on trade during those years preceding AFTA.4
3 We say “stylized” because a true common market would require a customs union and free flows of all labour and capital, whereas we
note below that the AEC envisions free flows of only goods, services, skilled labour and FDI, with freer flow of capital and no
mention of unskilled labour.
4 See, for example, Naya and Plummer (1991) for a survey.
ILO Regional Office for Asia and the Pacific 3
The same is true of the meagre attempts at investment cooperation in the 1970s and 1980s, which came in the
form of the ASEAN Industrial Projects (AIPs), ASEAN Industrial Complementation (AIC) and ASEAN
Industrial Joint Ventures (AIJV) programmes. The AIP initiative was an attempt to allocate state-owned
projects across ASEAN countries, consistent with the “import substitution” approach to development
embraced by most ASEAN Member States at that time. The AICs were intended to foster vertically integrated
production across the region. Neither had much effect; a few AIPs emerged but with little to do with the
ASEAN programme, and the AIC did not have any takers until the Brand-to-Brand Complementation (BBC)
scheme was devised, with success mainly limited to auto parts (Shimizu, 1999). The AIJV approach, created
in 1983 and expanded at the Third ASEAN Summit, was aimed at stimulating ASEAN joint ventures in the
private sector, but it, too, produced disappointing results due to a variety of inhibiting factors, including:
bureaucratic costs, some confusion in terms of regional and national legal applications and jurisdictions and
lack of active promotion (Naya and Plummer, 1991).
In short, ASEAN economic cooperation before AFTA in 1992 was limited. Hence, the decision to create an
FTA in 1992 was highly significant because it sent the message that ASEAN cooperation would continue and
that economics would take on an increasing priority. AFTA was established at the Fourth ASEAN Summit in
1992 and originally was envisioned to cover ten manufacturing sectors, with intraregional tariffs between 0
and 5 per cent; later, it was expanded to include all goods (subject to some exclusion lists) and zero tariffs. It
has essentially been completed, with the exception of the CLMV economies, which were given more time for
implementation.
ASEAN also embarked on deeper cooperation in the area of investment as AFTA proceeded. Because it
rendered the tariff preferences under the AIJV and AIC/BBC schemes essentially redundant, a transitional
programme was put in place in 1996, called the ASEAN Industrial Cooperation Scheme (AICO), to supersede
them. The AICO reduced preferential tariff rates on ASEAN joint ventures to between 0 and 5 per cent and
featured some additional advantages, such as a guaranteed rapid turnaround on applications, references to
dispute settlement and benefits in terms of more liberal equity restrictions for foreign investors. The ASEAN
Investment Area (AIA) superseded the AICO in October 1998. Rather than merely expanding existing
programmes in the new context of AFTA (like the AICO), the AIA was designed to enhance a process of FDI
policy liberalization, promotion and, to some extent, harmonization across ASEAN Member States as well as
having certain investment facilitation features. The ASEAN Comprehensive Investment Agreement (ACIA),
which entered into force in April 2012, constitutes the groundwork for investment cooperation in the context
of the AEC.
Although the AFTA and the AIA/ACIA represent considerable progress in economic cooperation, the AEC
goes much further in trying to create a borderless South-East Asia. It is one of the three pillars of the ASEAN
Community, the others being the ASEAN Political-Security Community and the ASEAN Socio-Cultural
Community. The inclusion of these pillars under the ASEAN Community umbrella implicitly underscores the
important interdependence of these three areas. For example, as discussed further on, the AEC includes the
“equitable economic region” component, with its roots in the other two pillars. As well, the Political-Security
and Socio-Cultural Communities have clear economic dimensions. This interrelationship is also an important
feature of the European economic integration experience.
In November 2002, leaders at the ASEAN Heads of Government meeting in Phnom Penh proposed that
ASEAN consider the possibility of establishing an economic community by 2020. The ASEAN leaders agreed
4 ILO Regional Office for Asia and the Pacific
at the Bali ASEAN Summit in October 2003 to create a region in which goods, services and skilled labour
would flow freely and capital would enjoy freer movement. In the 2007 Cebu Declaration, the ASEAN leaders
pushed the AEC deadline forward to 2015. In November 2007, the region approved the ASEAN Economic
Community Blueprint, which puts flesh to the bones of the commitment to create a unified market. The
Blueprint was accompanied by a Strategic Schedule, which stipulates a timetable for the implementation of
the various measures in the AEC. As part of this process, ASEAN developed the ASEAN Charter, which
significantly enhances the formal nature of ASEAN integration by making it an international legal entity. The
Charter was signed in November 2007 and went into effect after being ratified by the ASEAN Member States
in December 2008.
2.1 Internal integration: The AEC and its four pillars
The AEC Blueprint has four principle components: (i) single market and production base, including the free
flow of goods, services, investment, skilled labour and a freer flow of capital; (ii) competitive economic region,
with competition policy, consumer protection, commitments to greater protection of intellectual property
rights, infrastructure development, e-commerce and avoidance of double-taxation; (iii) equitable economic
development to help close development gaps in the region; and (iv) integration into the global economy,
including the need for ASEAN centrality and enhanced participation in global supply networks (Plummer and
Chia, 2009). Table 1 gives a brief summary of the basic elements of these components.
Table 1. Overview of the AEC Blueprint
Core elements Actions
A. Single market and production base
1. Goods Eliminate duties and non-tariff barriers
Simplify rules of origin
Trade facilitation, customs integration, single window
Harmonize standards and regulations
2. Services Remove restrictions on service trade
Allow at least 70% equity participation
Schedule commitments for mode 4
Extend mutual recognition arrangements, liberalize financial services
3. Investment Investment protection, facilitation, promotion, liberalization
Non-discrimination, national treatment
4. Capital Harmonize regulations
Promote cross-border capital raising
5. Labour Facilitate movement of skilled and professional labour in cross-border trade
Enhance movement of students
Work towards harmonizing qualifications
6. Priority sectors Projects in 12 priority sectors
7. Food, agriculture,
forestry
Harmonize best practices, sanitary and phytosanitary standards, safety and quality standards, chemical use, regulation of products derived from biotechnology
Promote technology transfer
B. Competitive economic region
1. Competition policy Introduce competition policies and develop regional networks and guidelines
2. Consumer
protection
Develop regional networks and guidelines
3. Intellectual property
rights (IPR)
Implement ASEAN IPR Action Plan
Promote regional cooperation

ILO Regional Office for Asia and the Pacific 5
4. Infrastructure Facilitate multimodal transport
Complete Singapore–Kunming rail link
Integrated maritime transport, open sky policies, single aviation market
High-speed IT interconnections
ASEAN power grid, gas pipeline
5. Taxation Complete bilateral agreements
6. E-commerce Adopt best practices and harmonize legal infrastructure
C. Equitable economic development
1. SMEs ASEAN Blueprint of best practices
2. Initiative for
integration
Technical assistance and capacity building in CLMV economies
D. Integration in to the global economy
1. Coherent approach Review free trade area and closer economic partnership commitments
Establish coordination and possibly common external approaches
2. Supply networks International best practices and standards
Technical assistance Source: Petri, Plummer and Zhai, 2012.
According to the ASEAN Scorecard, intended to assess progress made by Member States in meeting the
implementation goals of the AEC Blueprint, approximately two-thirds of the measures under the first three
components had been achieved by 2011 and more than three-fourths of the integration-into-the-global-
economy measures were on track.5 In October 2013, the Chairman’s Statement at the 23rd ASEAN Summit
(in Bandar Seri Begawan) noted that 279 measures (or 79.7 per cent of the total) had already been
implemented.6 Although the region has a long way to go before reaching its goal of a single market and
production base, it has made tremendous progress.
Much remains to be done, however.7 Progress has been achieved in terms of tariffs; since January 2010, 99 per
cent of ASEAN-6 (original ASEAN economies plus Brunei Darussalam) total tariff lines had fallen to zero on
intraregional trade (Chia and Plummer, forthcoming). For the transitional ASEAN countries, tariff levels were
down to the 0–5 per cent level by 2010 and are on track to be eliminated by 2015. Thus, AFTA is essentially in
place. However, non-tariff barriers (NTBs) continue to constitute serious impediments to intraregional trade and
FDI, though they were supposed to be eliminated by 2012 for the ASEAN-6 (up to 2018 for the CLMV
economies). In addition, there are problems associated with the implementation of the ASEAN Single Window,
trade facilitation, technical barriers, trade logistics and services liberalization, particularly for the transitional
economies (even with extra implementation time). There have been several rounds of services negotiations under
the ASEAN Framework Agreement on Services, with considerable progress in cross-border services liberalization
(mode 1). But much less has been accomplished in other areas. As Deuden (2012) argues, the AEC ambitions
actually fall far below what would be considered a unified market in services, especially with respect to
“commercial presence” (mode 3) and “movement of natural persons” (mode 4). With respect to FDI, the
commitment to free and open investment by 2015 with most favoured nation status and national treatment for
5 ASEAN Secretariat, 2012, ASEAN Economic Community Scorecard.
6See www.asean.org/images/archive/23rdASEANSummit/chairmans%20statement%20-%2023rd%20asean%20summit%20-
%20text%20-%20final.pdf, paragraph 22. Nevertheless, the Chairman’s Statement noted that countries needed to step up
implementation in order to achieve the desired AEC goals by the end of 2015.
7 See, for example, Das (2013) for a recent detailed assessment of progress thus far and remaining challenges.

6 ILO Regional Office for Asia and the Pacific
investors (with limited exceptions), fewer restrictions on priority sectors and removal of restrictive investment
measures under the ACIA continue to pose formidable domestic policy challenges in many ASEAN economies.
Even with the 79.7 per cent implementation rate underscored at the 23rd ASEAN Summit, no doubt the remaining
20 per cent will prove to be the most challenging. Indeed, both the 22nd ASEAN Summit and the 23rd ASEAN
Summit recognized the need to develop a post-2015 programme to deepening economic cooperation.8
2.2 External integration and ASEAN centrality
The RCEP was launched in November 2012 by the ten countries of ASEAN and six of its dialogue partners:
Australia, China, India, Japan, Republic of Korea and New Zealand. The RCEP explicitly places ASEAN
centrality at its core; even eligibility underscores this – partners either have to be ASEAN Member States or
have in place an FTA with ASEAN. It is the second “mega-regional” agreement being negotiated in the Asia–
Pacific region, the other being the Trans-Pacific Partnership (TPP), which includes 12 Asia–Pacific Economic
Cooperation (APEC) economies (Australia, Brunei Darussalam, Canada, Chile, Malaysia, Mexico, New
Zealand, Peru, Singapore, United States, Viet Nam and, as of July 2013, Japan) and recently finished its 19th
round of negotiations. The TPP was launched as a twenty-first century agreement, covering a variety of trade
and trade-related issues, including intellectual property protection, financial services, competition policy, state-
owned enterprises, science and technology and even labour and the environment.9 The current goal of the TPP
leaders is to finish an agreement by the end of 2013. Because the TPP includes four ASEAN Member States,
with others (such as the Philippines and Thailand) expressing interest, some scholars and commentators have
suggested that it is in competition with the RCEP – for example, it has significant overlapping membership
and competes with RCEP for ASEAN Member States. Some commentators also suggested that the TPP is
being used as a means to contain China.10 Petri and Plummer emphasize (2013) that this need not be the case
because they both are based on open regionalism, envision inclusive expansion and have been supported by
APEC as paths to the creation of the free trade area of the Asia–Pacific region. Additionally, they point out,
overlapping membership will ensure that the agreements will not be exclusionary.
The first round of RCEP negotiations began in May 2013 and the second round took place in September 2013.
The Chairman’s Statement of the 23rd ASEAN Summit notes that groundwork is being laid in working groups
on goods, services, investment and an implementation approach that will allow for the RCEP to be operational
by the end of 2015. The third round of negotiations will take place in Malaysia in January 2014. Still, the exact
scope of the agreement is not yet clear. On the one hand, the November 2012 declaration underscored that the
agreement should be ambitious in terms of its scope and coverage. On the other hand, in sharp contrast with
the TPP, there is a focus on “flexibility”, justified by the fact that the 16 negotiating partners are so diverse. It
is not clear what exactly flexibility means, and emphasizing it as a key characteristic of RCEP has generated
a good deal of scepticism: Will it just mean special and differential treatment for low-income economies? Or
will it mean only “lowest common denominator” coverage of trade-related issues? If it is the latter, the benefits
8 Chairman’s Statement, www.asean.org/news/asean-statement-communiques/item/chairmans-statement-of-the-22nd-asean-summit-
our-people-our-future-together [accessed 24 Sep. 2014].
9 The contents of proposals regarding the components of the TPP chapters are generally not publicly available, though some documents
have been leaked, such as with respect to intellectual property protection. The labour chapter is not clear, but there is a good deal of
interest in it in the United States, for example, with some congress people demanding strong wording in order to support “trade
promotion authority” legislation.
10 For a more in-depth discussion of these arguments, see Petri, Plummer and Zhai, 2012.
ILO Regional Office for Asia and the Pacific 7
of the agreement would be questionable because it would suggest that the value added of the agreement would
be low. For example, the ASEAN–India agreement only covers goods and has only 70 per cent coverage. If
this is the template, RCEP will likely not be very effective in stimulating intraregional economic integration
and creating excitement among foreign investors. Moreover, a weak agreement would not bode well for the
future influence of ASEAN centrality.
Given the stakes involved, there is reason to be optimistic. RCEP leaders have stressed the need for RCEP to
be ambitious. And although RCEP may not address all the issues covered in the TPP, the latter will no doubt
provide a benchmark in negotiations that could facilitate the process of arriving at an ambitious accord. Still,
the uncertainties as to coverage render modelling a RCEP scenario difficult. For example, when Petri, Plummer
and Zhai (2012) undertook empirical estimates of the effects of region-wide Asian integration, they assumed
that the ultimate template would be based on past ASEAN accords. The modelling discussed in this paper
used a similar approach.
3. Review of the empirical literature on the effects
of ASEAN economic integration
Before reviewing the empirical work that has been done on ASEAN economic integration in the next section,
we look first at what the economic effects of integration are expected to be.
Non-discriminatory trade liberalization allows countries to export their products if they are the most efficient
producers and to source their imports from the lowest-cost suppliers. In contrast, an FTA might have both
positive and negative effects, given that it discriminates by giving preferences in favour of partner-country
producers, who may not be the most efficient, so that a member will not necessarily source from the lowest-
cost producer. Hence, although an FTA may generate a more efficient division of labour by increasing regional
competition and reducing inefficient domestic production due to greater regional competition (trade creation),
a Member State may be able to export its products to another Member State simply because it enjoys tariff
preferences under the FTA (trade diversion). This suggests that the importing partner will be paying more for
its imports; in other words, its terms of trade (the price of exports in terms of imports) deteriorate. The
efficiency effects of the FTA would be the net of the positive (trade creation) and negative (trade diversion)
effects. Only if the former exceeds the latter would we expect countries to be better off within the context of
an FTA. This is unlike multilateral liberalization, which has only positive effects because it is non-
discriminatory. Disagreements among economists regarding the economic desirability of preferential trading
arrangements centres on this difference. This “second-best” nature of FTAs has provided a strong incentive
for empirical work on various FTAs and customs unions for the past half-century.
In addition to these static welfare effects, there are a number of other potentially welfare-changing implications
of regional integration, known as “dynamic” effects. These include economies of scale and greater variety of
inputs on consumption goods, increases in FDI and technology transfer, greater competition in markets
characterized by imperfect competition and incentives to enhance competition via domestic policy reform.11
Of course, even if an FTA is efficient and leads to increases in aggregate economic welfare, as with any policy
innovation that leads to greater specialization, there will be an asymmetric effect on participating countries
11 There are many excellent literature reviews of these effects, such as Frankel (1998) and ADB (2008).

8 ILO Regional Office for Asia and the Pacific
and factors of production, depending on a variety of factors: initial conditions, structure of production, factor
endowments, market failures and so forth. The economic literature has been mostly concerned with the overall
welfare effects, but the distributive effects are especially relevant from a policy point of view (see, for example,
ILO and WTO, 2007). This is why in our modelling we focus on both.
3.1 Empirical estimates of ASEAN economic integration
Several past studies have examined the implications of reducing tariffs and non-tariff barriers in AFTA, which
forms the core of the AEC, and there are a few studies that consider explicitly the AEC. The following gives
a brief review of them.12
Even though modelling a “traditional” FTA that focuses on tariff liberalization is a straightforward exercise,
it is an unsatisfactory approach in gauging the effects of modern FTAs in general and ASEAN economic
integration in particular. As noted, ASEAN tariffs tend to be relatively low and thus the potential gains from
further liberalization would be limited. However, the AEC focuses on non-traditional areas, from NTBs to
services and investment policy. Trying to incorporate these latter effects into a CGE modelling is more realistic
but makes the estimation template much more complicated. This is why there tends to be a good deal of
variance in the empirical literature when it comes to modelling non-tariff and non-border effects.
To begin, Brooks, Roland-Holst and Zhai (2005) estimated the differences between narrow measures of
liberalization, such as the removal of tariff and obvious NTBs, and broad measures, such as improving customs
clearance, aligning standards, lower transaction costs and facilitation of international market access. They used
simulations to compare the impact of narrow and broad liberalization efforts on real income, exports and terms
of trade.13 Under a narrow scenario limited to tariff changes, real income rises in the range of 0.9–2.9 per cent
for East Asia, 1.9–6.6 per cent for South-East Asia and 0.3–0.6 per cent for South Asia. Such magnitudes are
typical of the literature. In the broad scenario, they assumed that non-tariff-related trade costs were around 120
per cent; they also cut those impediments into half over a 20-year period for East Asia, South-East Asia and
South Asia.14 These assumptions make the gains many times as large, in the ranges of 8–54 per cent, 36–116
per cent and 10–22 per cent for the three subregions, respectively. The AEC aims at efficiency increases similar
to those in the broad scenario, and the comparison suggests that the gains could be a multiple of those obtained
through AFTA.
Other studies of trade facilitation also show large gains. De Dios (2006) estimated that a 10 per cent savings
in transport costs would increase trade by approximately 6 per cent. Wilson and Shepherd (2008) showed that
the gains from improvements in trade facilitation in ASEAN would yield far greater gains than comparable
tariff reforms. For example, improving port facilities alone in ASEAN should expand trade by 7.5 per cent, or
$22 billion. Infrastructure improvements noted in the AEC Blueprint in Indonesia, Malaysia, the Philippines
and Thailand should increase per capita GDP by 2–12 per cent.15
12 This section builds on Petri, Plummer and Zhai (2012).
13 Brooks, Roland-Holst and Zhai (2005) model the scenario 2 liberalization as an “iceberg effect,” in which a fraction of goods and
services “melt away in transit due to the trade costs” (p. 4, fn 4).
14 This value is a guesstimate and is not derived systematically or empirically.
15 As is discussed at length in Plummer and Chia (2009, Chapter 5), this assumes convergence to the level of efficiency of the best-
performing ASEAN countries in this regard, which is Singapore. Although 2–12 per cent is a wide range (which is to be expected,

ILO Regional Office for Asia and the Pacific 9
A natural experiment for gauging the benefits of the AEC is the European Community’s single market
programme. At the time the single market was adopted, the European Community was already a customs
union, but it did not have a common commercial policy,16 and its markets were still segmented in various ways.
The Cecchini Report (Cecchini, 1988) estimated that the Single Market Programme would increase the
European Community’s GDP by up to 6.5 per cent. This gain would come on top of integration measures
already in place after 30 years of regional cooperation. Economies of scale, seen as a key motivation for the
single market and production base, accounted for a 2 per cent increase in the European Community’s GDP. A
direct comparison, however, is not possible; the European project included measures that go beyond those
incorporated in the AEC, and the AEC envisions steps that were not required in Europe. ASEAN has further
to go,17 and potentially more to gain, from integration than Europe at the time of the single market. The AEC
also places more emphasis on best practices than mere national treatment, and its effects might well be larger
for some countries and areas.
Hertel, Walmsley and Itakura (2001) analysed the potential gains from the Japan–Singapore free trade area,
which was a “new age”, deep-integration initiative that had many of the measures outlined now in the AEC
Blueprint. Because Japan’s average tariff is less than 2 per cent in manufacturing and Singapore has a zero
average tariff, all the effects come from other dimensions of liberalization, making the exercise comparable to
moving from AFTA to the AEC.18 Hertel, Walmsley and Itakura developed a dynamic CGE model using an
ex ante simulation but with some ex post features to estimate dynamic policy changes associated with a deep-
integration accord. These include the harmonization of e-commerce standards, the liberalization of services,
automating customs services in Japan (to be consistent with Singapore) and an improved climate for investment
flows. Interestingly, this “new age” agreement led to gains in all regions of the world, not only Japan and
Singapore.
Our own estimates in previous work suggest that the AEC could generate substantial gains for all ASEAN
countries, particularly the smaller ones. In Petri, Plummer and Zhai (2012), we used a state-of-the-art CGE
model to estimate the potential economic effects of the AEC as well as several other potential cooperative
scenarios (the model is similar to the one used in this study):
1. AFTA: Full completion of AFTA by reducing all remaining tariffs on intra-ASEAN trade.
given the difficulties associated with measuring efficiency in this context), even the most conservative results are large: a 2 per cent
increase in per capita income is greater than estimates of the effects of AFTA, for example.
16 The European Community did have a common external tariff, but non-tariff barriers and other controls varied widely across member
countries. For example, while Italy and Germany applied the same tariff on Japanese auto imports, Italy only allowed in 3,000
Japanese cars per year, and Germany had no quantitative restrictions at all. This kind of diversity leads to significant market
segmentation.
17 For example, prior to the single market programme, the European Community was already a customs union (unlike ASEAN, which
at present does not have any plans to unite external commercial policies). As well, the European Community already had integrated
several key sectors, including agriculture, whereas some agricultural products are still excluded from AFTA.
18 Of course, this does not make them completely comparable, because external tariffs are greater than zero in the post-AFTA
commercial policy regimes of the ASEAN Member States. The point here is that tariff changes are insignificant for the simulation
results.
10 ILO Regional Office for Asia and the Pacific
2. AFTA+: AFTA plus the intensification of AFTA by removing NTBs, including such regulatory barriers
as diverging standards and testing requirements (not having detailed information on these complicated
measures, we assumed a horizontal reduction of trade costs equal to 5 per cent of trade values).
3. AEC: AFTA+ and reforms that improve the investment climate, modelled via increasing FDI inflows
to levels expected in “model” ASEAN countries (see Petri, Plummer and Zhai, 2012 for details).
4. AEC+: AEC plus bilateral FTAs with other RCEP economies.
5. AEC++: AEC+ and including bilateral FTAs with the United States and the European Union.
The results regarding changes in welfare under these scenarios suggest three things. (i) The full implementation
of the AEC would raise ASEAN real incomes by $69 billion, or 5.3 per cent over 2004 baseline income. These
are large magnitudes compared with those usually estimated in free trade area studies in general and CGE
studies in particular; (ii) Much of the increase in real incomes is attributable to features of the AEC that go
beyond AFTA. The overall income effects of the AEC are seven times as large as those attributable to the
remaining liberalization under AFTA. Roughly half of this difference comes from trade facilitation (the
difference between AFTA and AFTA+) and half from investment facilitation (the difference between AFTA+
and the AEC); and (iii) All ASEAN Member States gain from the AEC, with the largest economy experiencing
the greatest absolute gains. The benefits do not appear to be related to per capita income levels; for example,
Cambodia and Singapore – countries at opposite ends of the ASEAN income spectrum – both have unusually
large gains.
We want to emphasize the importance of structural adjustment as a driving force in these efficiency gains.
Structural adjustment is costly, at least in the short term, and the winners and losers from integration are
different agents, with potential negative effects on the most vulnerable. Hence, priority needs to be placed on
a compensation mechanism at the country and, ideally, at the regional level, the latter falling under the purview
of the “equitable economic region” component of the AEC.
4. Modelling methodology, specifications and data
The CGE model we use in this study is based on a global general equilibrium model developed by van der
Mensbrugghe (2005) and Zhai (2008). The model has its intellectual roots in a long tradition of multi-country,
applied general equilibrium models (see Shoven and Whalley, 1992; Hertel, 1997). A novel feature of the
model is its incorporation of recent innovations in heterogeneous-firms trade theory into an empirical global
CGE framework. The model features intra-industry firm heterogeneity in productivity and fixed cost of
exporting, which enables us to investigate the intra-industry reallocation of resources and the exporting
decision by firms and thereby capture both the intensive and extensive margin of trade. The following section
describes the model.
ILO Regional Office for Asia and the Pacific 11
4.1 Basics of the CGE model for this study
i. Production and trade
Agriculture, mining and government services sectors are assumed to exhibit perfect competition. In each of
these sectors, a representative firm operates under constant returns to scale technology. Trade is modelled
using the Armington assumption for import demand. Manufacturing and private services are characterized by
monopolistic competition, and their structure of production and trade follows the seminal Melitz (2003)
approach. Each sector with monopolistic competition consists of a continuum of firms that are differentiated
by the varieties they produce and their productivity. Firms face fixed production costs, resulting in increasing
returns to scale. There are also fixed costs and variable costs associated with exporting activities. On the
demand side, agents have Dixit–Stiglitz preference over the continuum of varieties. Because each firm is a
monopolist for the variety it produces, it sets the price of its product at a constant mark-up over marginal costs.
A firm enters domestic or export markets if, and only if, the net profit generated from such sales is sufficient
to cover fixed costs. This zero cut-off profit condition defines the productivity thresholds for a firm’s decision
to enter domestic and export markets and, in turn, determines the equilibrium distribution of non-exporting
firms and exporting firms as well as their average productivities. Usually, the combination of a fixed export
cost and a variable (“iceberg”) export cost ensures that the exporting productivity threshold is higher than that
for production for the domestic market, so that only a fraction of firms with high productivity export. These
firms thus supply for both domestic and export markets. The number of firms in the monopolistic sectors is
assumed to be fixed.
Production technology in each sector is modelled using nested constant elasticity of substitution (CES)
functions. At the top level, the output is produced as a combination of aggregate non-energy intermediate
demand and a value-added energy bundle. At the second level, non-energy aggregate intermediate demand is
split into each commodity according to a Leontief technology. The value-added energy bundle is produced by
a capital-land energy bundle and aggregate labour. The capital-land energy bundle is further decomposed into
a capital-land bundle and aggregate energy. Finally, at the bottom level, aggregate labour is decomposed into
unskilled and skilled labour, and the capital-land bundle is decomposed into capital and land (for the agriculture
sector) or natural resources (for the forestry, fishing and mining sectors). The energy composite good is
subsequently decomposed into various fuel components (such as coal, oil and gas) where relevant. At each
level of production, there is a unit cost function that is dual to the CES aggregator function and demand
functions for corresponding inputs. The top-level unit cost function defines the marginal cost of sector output.
As discussed further in the next section, we use Labour Force Survey data that allows us to decompose the
impact of regional cooperation at the occupational and gender levels. However, we only have data for six
ASEAN countries (Cambodia, Indonesia, the Lao People’s Democratic Republic, the Philippines, Thailand
and Viet Nam). For these economies, we could incorporate a more realistic labour market structure in which
the labour force possesses different skill levels. At the second level of the production structure in these
countries, the value added cum energy bundle is decomposed into less skilled aggregate labour, on the one
hand, and a capital-land energy bundle on the other hand. The capital bundle is split into its human (skilled
labour) and physical capital components, and the less skilled aggregate labour is decomposed into semi-skilled
and unskilled labour. Skilled and semi-skilled labour are further divided into three occupations: managers,
professionals and para-professionals for skilled labour and clerks, machinery workers and craft workers for

12 ILO Regional Office for Asia and the Pacific
semi-skilled labour. At the bottom level, the six occupational groups as well as unskilled labour are further
decomposed into male and female labour (see Annex B for diagrams illustrating the nested structure of CES
production functions).
ii. Income distribution, demand and factor markets
Incomes generated from production accrue to a single representative household in each region. A household
maximizes utility using an extended linear expenditure system, which is derived from maximizing the Stone–
Geary utility function. The consumption/savings decision is completely static. Savings enter the utility function
as a “good”, and its price is set as equal to the average price of consumer goods. Investment demand and
government consumption are specified as a Leontief function. In each sector, a composite good defined by the
Dixit–Stiglitz aggregator over domestic and imported varieties is used for final and intermediate demand.
There are five primary factors of production. Capital, agricultural land and labour are fully mobile across
sectors within a region. In the natural resource sectors of forestry, fishing and mining, a sector-specific factor
is introduced into the production function to reflect the resource constraints. In each period, the aggregate
capital stock is predetermined by the investment and savings decision of the previous periods. The supply of
land and sector-specific factors is assumed to be elastic, with response to the changes in their respective prices.
The model differs from most other CGE approaches (including our earlier work cited previously) in the
treatment of labour markets. Usually, the supply of labour is assumed to be fixed, and its market is cleared
through wage adjustment. However, for the six ASEAN countries, we assume persistent unemployment for
some categories of workers. We then differentiate the ASEAN economies from other regions by distinguishing
three labour supply mechanisms according to different skill levels. Especially in these six ASEAN countries,
the supply of skilled labour is fixed in each period, given the tight markets for skilled labour in the region. For
unskilled labour, we assume infinite supply and a fixed real wage rate to reflect the persistent large-scale
underemployment in this category of labour in most ASEAN countries. Semi-skilled labour falls between these
extremes; hence, we assume a constant-elasticity supply function with a unitary elasticity of labour supply,
with respect to its real wage.
In this specification, shocks that make ASEAN firms more competitive internationally – including the policy
changes examined in this paper – enable firms to expand with less binding labour constraints than are typically
imposed by CGE models. The employment of unskilled workers can expand without limit at constant wage
rates, and the employment of semi-skilled workers can grow with only moderate wage increases. Unskilled
and semi-skilled workers, in turn, can be substituted to some extent for skilled workers and other inputs whose
supply is subject to conventional limits. In our simulations of integration alternatives, this modelling approach
typically yields solid increases in output, trade and employment as well as overall benefits in excess of the
usual gains from trade.
iii. Macro closure
There are three macro closures in the model: (i) the net government balance, (ii) the trade balance and (iii) the
investment and savings balance. We assume that government consumption and savings are exogenous in real
ILO Regional Office for Asia and the Pacific 13
terms: Any changes in the government budget are automatically compensated by changes in income tax rates
on households.
The second closure concerns the current account balance. In each region, the foreign savings are set
exogenously. With the United States’ GDP deflator chosen as the numéraire of the model, equilibrium in the
foreign account is achieved by changing the relative price across regions; for example, it is the real exchange
rate.
Domestic investment is the endogenous sum of household savings, government savings and foreign savings.
Because government and foreign savings are exogenous, changes in investment are determined by changes in
the levels of household savings. This closure rule corresponds to the neoclassical macroeconomic closure in
the CGE literature.
iv. Recursive dynamics
The model is recursive dynamic, beginning with the base year of 2007 and solved annually through 2025. The
dynamics of the model are driven by exogenous population and labour growth as well as capital accumulation
and exogenous technological progress. Population and labour force projections are based on the United
Nation’s medium variant forecast. Technological progress is assumed to be labour-augmented, so the model
can reach a steady state in the long run.
4.2 Economic integration scenarios
Using this model just described, we estimate the effects of four ASEAN policy scenarios:
i. ASEAN-based initiatives
1. AFTA. This scenario envisions the removal over time of the remaining intraregional tariffs across the
ASEAN economies. Note that we are calibrating our model to 2007 data; hence, we use the status quo
of applied intra-ASEAN tariffs as of that year.
2. AFTA+. In addition to the liberalization of intraregional tariffs under AFTA, the ASEAN Plus scenario
envisions the liberalization of non-tariff barriers, assuming that 50 per cent of intraregional NTBs for
both goods and services are phased out over time. The NTBs are estimated via the disaggregated trade
restrictiveness indices constructed by the World Bank (goods) and the Peterson Institute for
International Economics (services) and modelled using both rent-generated tariff equivalent and
“iceberg” cost approaches.
14 ILO Regional Office for Asia and the Pacific
3. AEC. The AEC scenario builds on AFTA+ to include trade facilitation via lower (by 20 per cent) fixed-
trade costs and, as in the other scenarios, is implemented over time.
ii. ASEAN-centric initiative
4. RCEP. RCEP includes the liberalization under the AEC scenario and assumes a regional FTA with the
six existing partners of ASEAN. The RCEP scenario includes liberalization of the remaining NTBs,
accumulation of rules of origin and the partial liberalization of services. It is modelled through full
liberalization of tariff barriers among the ASEAN+6 economies, a 40 per cent reduction in regional
goods NTBs, a 30 per cent reduction of regional services NTBs, as well as a 20 per cent cut in fixed
trade costs among FTA members from 2017 to 2022. We based these assumptions on “best guesses”
from our own modelling and literature surveys (Petri, Plummer and Zhai, 2012).
Under these four policy scenarios, all tariff and NTB reductions are linearly implemented within the eight
years between 2008 and 2015 (for AFTA Plus and AEC) or the six years between 2017 and 2022 (for RCEP).
4.3 Brief comments on the underlying data
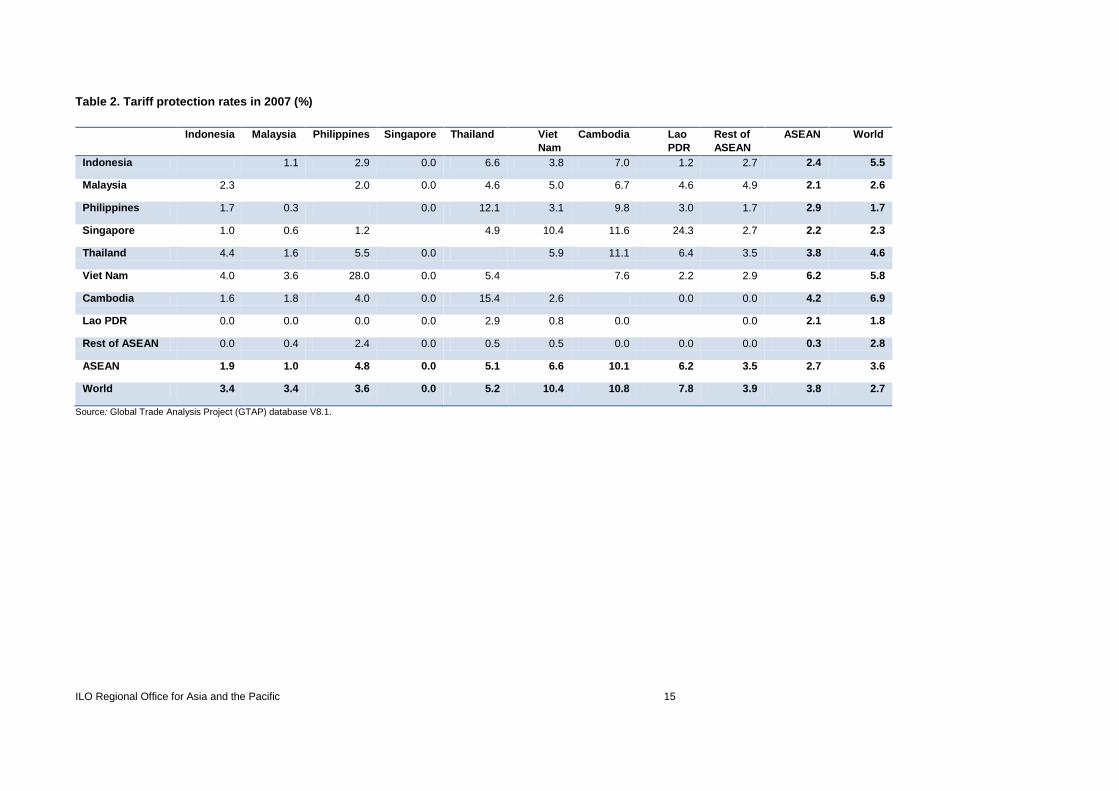
It is useful to underscore some salient characteristics in the underlying data. In terms of protection levels, the
Global Trade Analysis Project database reveals that, although there had been significant progress in reducing
protection levels overall in the context of AFTA as of 2007, much remained to be done (Table 2). For example,
ASEAN exporters still faced average tariffs of 2.7 per cent in ASEAN markets, only slightly lower than
average tariffs they faced in global markets generally (3.6 per cent). In particular, tariffs placed on ASEAN
exports of vehicles in the region were higher than they were globally (7 per cent versus 6 per cent). At the
country level, exporters from the Lao People’s Democratic Republic, the Philippines and Viet Nam faced
higher average tariffs in ASEAN than in the world as a whole. Thus, although these tariffs had come down
considerably with AFTA, by 2007 the region still had much work ahead of it in establishing a true FTA, thereby
suggesting continued potential efficiency gains via the completion of AFTA.
As noted, for our simulations we use Labour Force Survey (LFS) data to break down employment into seven
categories: three types of skilled labour (managers; professionals; and para-professionals), three types of semi-
skilled labour (clerks, machinery workers; and craft workers) and unskilled labour. This relatively
disaggregated breakdown allows us to better identify the distributive effects of regional initiatives. However,
complete surveys exist for only a small majority of the ASEAN countries (Cambodia, Indonesia, the Lao
People’s Democratic Republic, the Philippines, Thailand and Viet Nam); hence, we are not able to consider
the entire region. Labour force surveys do not exist in Brunei Darussalam and Myanmar, and the necessary
microdata files are not available for public use in Singapore and Malaysia. Still, the included countries account
for a large majority of the ASEAN population (86 per cent), and they offer a good sampling of middle-income
and low-income Member States and, in this sense, should give us a good idea of distributive effects.
ILO Regional Office for Asia and the Pacific 15
Table 2. Tariff protection rates in 2007 (%)
Indonesia Malaysia Philippines Singapore Thailand Viet
Nam
Cambodia Lao
PDR
Rest of
ASEAN
ASEAN World
Indonesia 1.1 2.9 0.0 6.6 3.8 7.0 1.2 2.7 2.4 5.5
Malaysia 2.3 2.0 0.0 4.6 5.0 6.7 4.6 4.9 2.1 2.6
Philippines 1.7 0.3 0.0 12.1 3.1 9.8 3.0 1.7 2.9 1.7
Singapore 1.0 0.6 1.2 4.9 10.4 11.6 24.3 2.7 2.2 2.3
Thailand 4.4 1.6 5.5 0.0 5.9 11.1 6.4 3.5 3.8 4.6
Viet Nam 4.0 3.6 28.0 0.0 5.4 7.6 2.2 2.9 6.2 5.8
Cambodia 1.6 1.8 4.0 0.0 15.4 2.6 0.0 0.0 4.2 6.9
Lao PDR 0.0 0.0 0.0 0.0 2.9 0.8 0.0 0.0 2.1 1.8
Rest of ASEAN 0.0 0.4 2.4 0.0 0.5 0.5 0.0 0.0 0.0 0.3 2.8
ASEAN 1.9 1.0 4.8 0.0 5.1 6.6 10.1 6.2 3.5 2.7 3.6
World 3.4 3.4 3.6 0.0 5.2 10.4 10.8 7.8 3.9 3.8 2.7
Source: Global Trade Analysis Project (GTAP) database V8.1.
16 ILO Regional Office for Asia and the Pacific
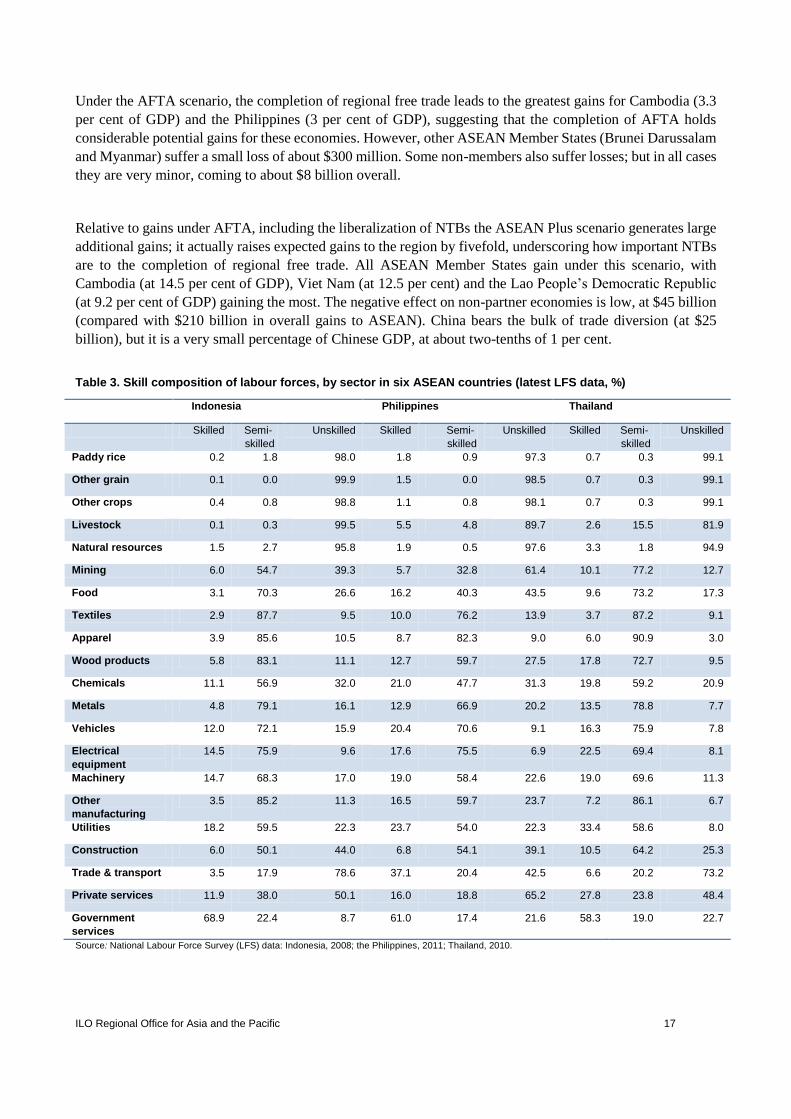
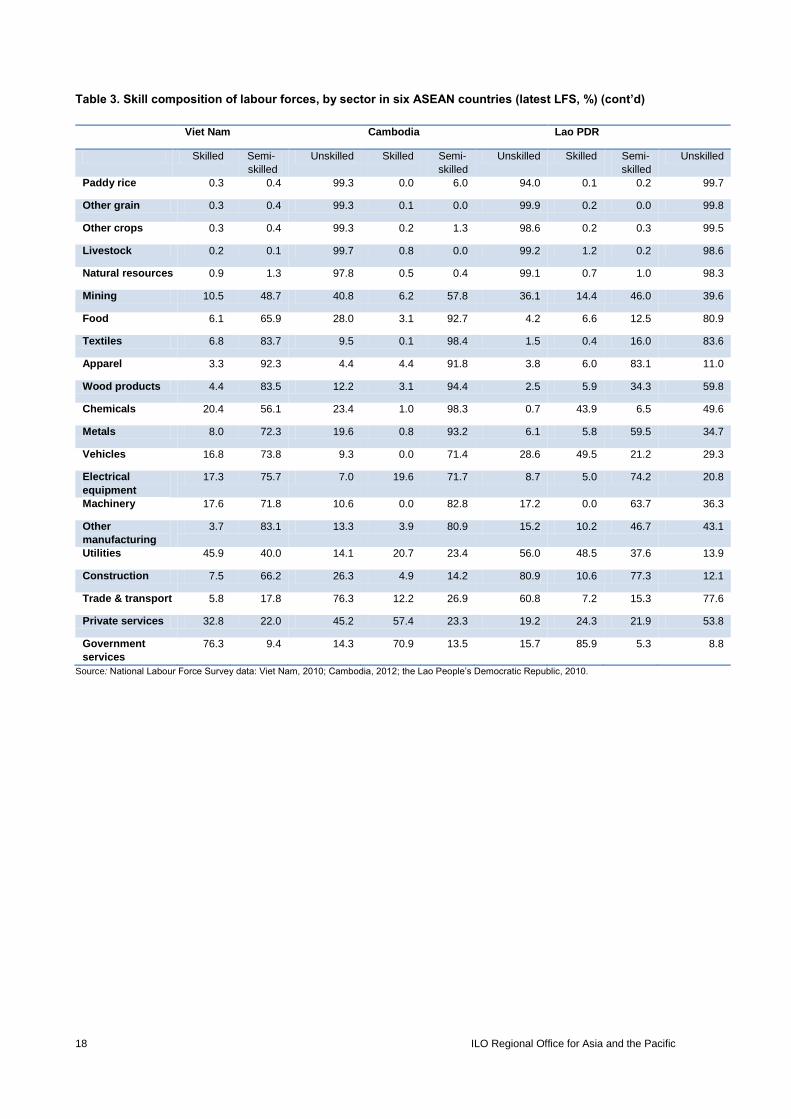
A particular characteristic that emerges is that the factor composition of production differs significantly across
ASEAN not only at the country level – as one would expect in the case of a highly diverse region like ASEAN
– but also at the sector level (Table 3). For example, in textiles, which is often considered a typical unskilled
labour-intensive sector in developing economies, unskilled labour constitutes 14 per cent or less of total labour
in all economies except the Lao People’s Democratic Republic, where it is 84 per cent. For Cambodia,
Indonesia, the Philippines, Thailand and Viet Nam, textiles is a semi-skilled intensive sector. However, for
electronics, which is dominated by production networks in ASEAN, there is far more consistency across all
economies, with semi-skilled labour constituting two-thirds to three-fourths of the total.
Diversity also shows up in the gender breakdown across countries and occupations (Table 4). Skilled labour
is dominated by men in Indonesia and the Lao People’s Democratic Republic, but in the other four economies
the distribution is fairly even, in the range of 44–53 per cent for female labour. Semi-skilled labour is
dominated by men in all economies (68–78 per cent of the total) except Cambodia, where female labour makes
up 74 per cent of the workforce. Unskilled labour is mainly made up of men in Indonesia and the Philippines
(62 per cent and 65 per cent, respectively) but is fairly even across genders in the other countries (49–53 per
cent female).
5. Results
5.1 Aggregate effects
The overall welfare effects of the simulations are presented in Table 5, with details in Annex B, Tables B1 and
B2, in millions of dollars (based on the equivalent variation technique and 2007 prices) and as a percentage of
GDP, respectively. For simplicity, we report the results relative to the baseline in 2025, but details on an annual
basis (2010–25) can be found in the Annex B tables.
In general, the potential gains to ASEAN under the various scenarios are impressive, with the region gaining
a great deal due to the deepening of integration and the expansion of country coverage to include its RCEP
partners. The increase in ASEAN aggregate welfare as a percentage of GDP relative to the baseline under the
two AFTA scenarios comes to 1.2 per cent and 6.3 per cent of GDP in 2025. Larger welfare gains flow from
the AEC and RCEP scenarios, at 8 per cent and 18.4 per cent, respectively. These numbers are large when
compared with the survey of empirical estimates of the effects of the AEC discussed in the previous section.19
19 In particular, the gains are larger than the results reported from our earlier study summarized in section 3 (Peter, Plummer and Zhai,
2012). The reasons for these differences are as follows; (i) the labour-market closure assumptions of the present model permit
increases in the supply of unskilled and semi-skilled workers, while the earlier study assumed fixed employment levels for labour;
(ii) this model is dynamic and captures the effects of greater capital accumulation due to static income gains; (iii) the base years are
different (2008 in this study; 2004 in the earlier study), which is significant due to rising trade links across these economies; (iv) the
assumptions regarding changes in trade costs differ; and (v) the RCEP scenario of this study differs from a similar scenario in the
previous study, which simulated “hub and spoke” agreements between ASEAN and other RCEP partners rather than an FTA across
all RCEP members. An off-setting difference, however, is that the earlier study included FDI, whereas the present simulations do
not.
ILO Regional Office for Asia and the Pacific 17
Under the AFTA scenario, the completion of regional free trade leads to the greatest gains for Cambodia (3.3
per cent of GDP) and the Philippines (3 per cent of GDP), suggesting that the completion of AFTA holds
considerable potential gains for these economies. However, other ASEAN Member States (Brunei Darussalam
and Myanmar) suffer a small loss of about $300 million. Some non-members also suffer losses; but in all cases
they are very minor, coming to about $8 billion overall.
Relative to gains under AFTA, including the liberalization of NTBs the ASEAN Plus scenario generates large
additional gains; it actually raises expected gains to the region by fivefold, underscoring how important NTBs
are to the completion of regional free trade. All ASEAN Member States gain under this scenario, with
Cambodia (at 14.5 per cent of GDP), Viet Nam (at 12.5 per cent) and the Lao People’s Democratic Republic
(at 9.2 per cent of GDP) gaining the most. The negative effect on non-partner economies is low, at $45 billion
(compared with $210 billion in overall gains to ASEAN). China bears the bulk of trade diversion (at $25
billion), but it is a very small percentage of Chinese GDP, at about two-tenths of 1 per cent.
Table 3. Skill composition of labour forces, by sector in six ASEAN countries (latest LFS data, %)
Indonesia Philippines Thailand
Skilled Semi-
skilled
Unskilled Skilled Semi-
skilled
Unskilled Skilled Semi-
skilled
Unskilled
Paddy rice 0.2 1.8 98.0 1.8 0.9 97.3 0.7 0.3 99.1
Other grain 0.1 0.0 99.9 1.5 0.0 98.5 0.7 0.3 99.1
Other crops 0.4 0.8 98.8 1.1 0.8 98.1 0.7 0.3 99.1
Livestock 0.1 0.3 99.5 5.5 4.8 89.7 2.6 15.5 81.9
Natural resources 1.5 2.7 95.8 1.9 0.5 97.6 3.3 1.8 94.9
Mining 6.0 54.7 39.3 5.7 32.8 61.4 10.1 77.2 12.7
Food 3.1 70.3 26.6 16.2 40.3 43.5 9.6 73.2 17.3
Textiles 2.9 87.7 9.5 10.0 76.2 13.9 3.7 87.2 9.1
Apparel 3.9 85.6 10.5 8.7 82.3 9.0 6.0 90.9 3.0
Wood products 5.8 83.1 11.1 12.7 59.7 27.5 17.8 72.7 9.5
Chemicals 11.1 56.9 32.0 21.0 47.7 31.3 19.8 59.2 20.9
Metals 4.8 79.1 16.1 12.9 66.9 20.2 13.5 78.8 7.7
Vehicles 12.0 72.1 15.9 20.4 70.6 9.1 16.3 75.9 7.8
Electrical
equipment
14.5 75.9 9.6 17.6 75.5 6.9 22.5 69.4 8.1
Machinery 14.7 68.3 17.0 19.0 58.4 22.6 19.0 69.6 11.3
Other
manufacturing
3.5 85.2 11.3 16.5 59.7 23.7 7.2 86.1 6.7
Utilities 18.2 59.5 22.3 23.7 54.0 22.3 33.4 58.6 8.0
Construction 6.0 50.1 44.0 6.8 54.1 39.1 10.5 64.2 25.3
Trade & transport 3.5 17.9 78.6 37.1 20.4 42.5 6.6 20.2 73.2
Private services 11.9 38.0 50.1 16.0 18.8 65.2 27.8 23.8 48.4
Government
services
68.9 22.4 8.7 61.0 17.4 21.6 58.3 19.0 22.7
Source: National Labour Force Survey (LFS) data: Indonesia, 2008; the Philippines, 2011; Thailand, 2010.
18 ILO Regional Office for Asia and the Pacific
Table 3. Skill composition of labour forces, by sector in six ASEAN countries (latest LFS, %) (cont’d)
Viet Nam Cambodia Lao PDR
Skilled Semi-
skilled
Unskilled Skilled Semi-
skilled
Unskilled Skilled Semi-
skilled
Unskilled
Paddy rice 0.3 0.4 99.3 0.0 6.0 94.0 0.1 0.2 99.7
Other grain 0.3 0.4 99.3 0.1 0.0 99.9 0.2 0.0 99.8
Other crops 0.3 0.4 99.3 0.2 1.3 98.6 0.2 0.3 99.5
Livestock 0.2 0.1 99.7 0.8 0.0 99.2 1.2 0.2 98.6
Natural resources 0.9 1.3 97.8 0.5 0.4 99.1 0.7 1.0 98.3
Mining 10.5 48.7 40.8 6.2 57.8 36.1 14.4 46.0 39.6
Food 6.1 65.9 28.0 3.1 92.7 4.2 6.6 12.5 80.9
Textiles 6.8 83.7 9.5 0.1 98.4 1.5 0.4 16.0 83.6
Apparel 3.3 92.3 4.4 4.4 91.8 3.8 6.0 83.1 11.0
Wood products 4.4 83.5 12.2 3.1 94.4 2.5 5.9 34.3 59.8
Chemicals 20.4 56.1 23.4 1.0 98.3 0.7 43.9 6.5 49.6
Metals 8.0 72.3 19.6 0.8 93.2 6.1 5.8 59.5 34.7
Vehicles 16.8 73.8 9.3 0.0 71.4 28.6 49.5 21.2 29.3
Electrical
equipment
17.3 75.7 7.0 19.6 71.7 8.7 5.0 74.2 20.8
Machinery 17.6 71.8 10.6 0.0 82.8 17.2 0.0 63.7 36.3
Other
manufacturing
3.7 83.1 13.3 3.9 80.9 15.2 10.2 46.7 43.1
Utilities 45.9 40.0 14.1 20.7 23.4 56.0 48.5 37.6 13.9
Construction 7.5 66.2 26.3 4.9 14.2 80.9 10.6 77.3 12.1
Trade & transport 5.8 17.8 76.3 12.2 26.9 60.8 7.2 15.3 77.6
Private services 32.8 22.0 45.2 57.4 23.3 19.2 24.3 21.9 53.8
Government
services
76.3 9.4 14.3 70.9 13.5 15.7 85.9 5.3 8.8
Source: National Labour Force Survey data: Viet Nam, 2010; Cambodia, 2012; the Lao People’s Democratic Republic, 2010.

ILO Regional Office for Asia and the Pacific 19
Table 4. Skill and gender composition of employment in six ASEAN countries (latest LFS, %)
Male Female Male Female
Indonesia Viet Nam
Total employment 100.0 63.1 36.9 100.0 52.8 47.2
Skilled 9.5 57.7 42.3 12.1 52.8 47.2
Managers 2.2 84.4 15.6 1.3 78.6 21.4
Professionals 5.2 43.3 56.7 6.2 51.2 48.8
Para-professionals 2.1 65.8 34.2 4.5 47.3 52.7
Semi-skilled 21.4 70.8 29.2 20.2 68.4 31.6
Clerks 4.3 59.1 40.9 1.7 53.9 46.1
Machinery workers 6.5 86.4 13.6 6.7 64.8 35.2
Craft workers 10.6 66.0 34.0 11.8 72.4 27.6
Unskilled 69.0 61.5 38.5 67.8 48.2 51.8
Philippines Cambodia
Total employment 100.0 60.9 39.1 100.0 46.0 54.0
Skilled 22.2 44.3 55.7 12.0 45.3 54.7
Managers 14.4 48.1 51.9 3.9 45.9 54.1
Professionals 5.1 31.4 68.6 5.2 53.5 46.5
Para-professionals 2.7 48.8 51.2 2.9 29.7 70.3
Semi-skilled 19.3 68.2 31.8 17.9 26.0 74.0
Clerks 5.3 37.1 62.9 2.3 46.1 53.9
Machinery workers 7.0 79.7 20.3 9.3 21.3 78.7
Craft workers 7.0 80.3 19.7 6.3 25.6 74.4
Unskilled 58.5 64.8 35.2 70.1 51.2 48.8
Thailand Lao PDR
Total employment 100.0 54.3 45.7 100.0 50.9 49.1
Skilled 11.6 51.9 48.1 8.6 64.2 35.8
Managers 3.1 73.8 26.2 2.5 76.6 23.4
Professionals 4.4 40.7 59.3 4.9 57.0 43.0
Para-professionals 4.1 47.2 52.8 1.3 67.3 32.7
Semi-skilled 23.4 63.0 37.0 6.4 78.4 21.6
Clerks 3.8 30.4 69.6 0.7 52.0 48.0
Machinery workers 8.7 67.6 32.4 2.7 67.8 32.2
Craft workers 10.9 71.0 29.0 3.0 93.9 6.1
Unskilled 65.0 51.6 48.4 85.0 47.5 52.5
Source: National Labour Force Survey data: Indonesia, 2008; Viet Nam, 2010; the Philippines, 2011; Cambodia, 2012; Thailand, 2010; and the Lao People’s
Democratic Republic, 2010.
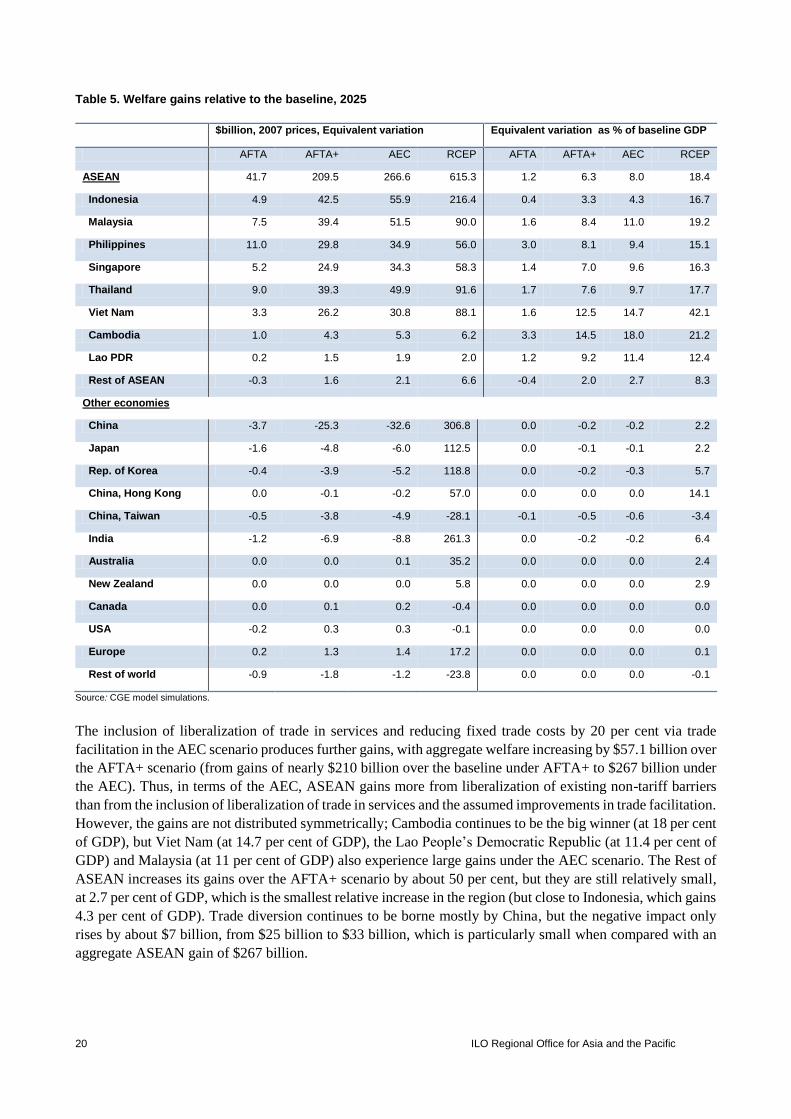
20 ILO Regional Office for Asia and the Pacific
Table 5. Welfare gains relative to the baseline, 2025
$billion, 2007 prices, Equivalent variation Equivalent variation as % of baseline GDP
AFTA AFTA+ AEC RCEP AFTA AFTA+ AEC RCEP
ASEAN 41.7 209.5 266.6 615.3 1.2 6.3 8.0 18.4
Indonesia 4.9 42.5 55.9 216.4 0.4 3.3 4.3 16.7
Malaysia 7.5 39.4 51.5 90.0 1.6 8.4 11.0 19.2
Philippines 11.0 29.8 34.9 56.0 3.0 8.1 9.4 15.1
Singapore 5.2 24.9 34.3 58.3 1.4 7.0 9.6 16.3
Thailand 9.0 39.3 49.9 91.6 1.7 7.6 9.7 17.7
Viet Nam 3.3 26.2 30.8 88.1 1.6 12.5 14.7 42.1
Cambodia 1.0 4.3 5.3 6.2 3.3 14.5 18.0 21.2
Lao PDR 0.2 1.5 1.9 2.0 1.2 9.2 11.4 12.4
Rest of ASEAN -0.3 1.6 2.1 6.6 -0.4 2.0 2.7 8.3
Other economies
China -3.7 -25.3 -32.6 306.8 0.0 -0.2 -0.2 2.2
Japan -1.6 -4.8 -6.0 112.5 0.0 -0.1 -0.1 2.2
Rep. of Korea -0.4 -3.9 -5.2 118.8 0.0 -0.2 -0.3 5.7
China, Hong Kong 0.0 -0.1 -0.2 57.0 0.0 0.0 0.0 14.1
China, Taiwan -0.5 -3.8 -4.9 -28.1 -0.1 -0.5 -0.6 -3.4
India -1.2 -6.9 -8.8 261.3 0.0 -0.2 -0.2 6.4
Australia 0.0 0.0 0.1 35.2 0.0 0.0 0.0 2.4
New Zealand 0.0 0.0 0.0 5.8 0.0 0.0 0.0 2.9
Canada 0.0 0.1 0.2 -0.4 0.0 0.0 0.0 0.0
USA -0.2 0.3 0.3 -0.1 0.0 0.0 0.0 0.0
Europe 0.2 1.3 1.4 17.2 0.0 0.0 0.0 0.1
Rest of world -0.9 -1.8 -1.2 -23.8 0.0 0.0 0.0 -0.1
Source: CGE model simulations.
The inclusion of liberalization of trade in services and reducing fixed trade costs by 20 per cent via trade
facilitation in the AEC scenario produces further gains, with aggregate welfare increasing by $57.1 billion over
the AFTA+ scenario (from gains of nearly $210 billion over the baseline under AFTA+ to $267 billion under
the AEC). Thus, in terms of the AEC, ASEAN gains more from liberalization of existing non-tariff barriers
than from the inclusion of liberalization of trade in services and the assumed improvements in trade facilitation.
However, the gains are not distributed symmetrically; Cambodia continues to be the big winner (at 18 per cent
of GDP), but Viet Nam (at 14.7 per cent of GDP), the Lao People’s Democratic Republic (at 11.4 per cent of
GDP) and Malaysia (at 11 per cent of GDP) also experience large gains under the AEC scenario. The Rest of
ASEAN increases its gains over the AFTA+ scenario by about 50 per cent, but they are still relatively small,
at 2.7 per cent of GDP, which is the smallest relative increase in the region (but close to Indonesia, which gains
4.3 per cent of GDP). Trade diversion continues to be borne mostly by China, but the negative impact only
rises by about $7 billion, from $25 billion to $33 billion, which is particularly small when compared with an
aggregate ASEAN gain of $267 billion.

ILO Regional Office for Asia and the Pacific 21
Expanding the AEC to include RCEP countries more than doubles the gains to ASEAN as a whole. Indonesia
and the Rest of ASEAN experience the largest relative gains, compared with the AEC scenario, with increases
relative to GDP at more than threefold. But in absolute terms, it is Viet Nam that clearly enjoys the greatest
gains, as GDP increases by more than two-fifths over the baseline. Cambodia (at 21.2 per cent of GDP),
Malaysia (at 19.2 per cent of GDP) and Thailand (at 17.7 per cent of GDP) also experience large gains. Outside
of ASEAN, the trade diversion of previous scenarios turns into large positive gains for China and India, whose
joint welfare increases by $568 billion, compared with $615 billion for ASEAN as a whole. Trade diversion
under the RCEP scenario is extremely small (at $52 billion), compared with the aggregate gains globally (at
about $1.5 trillion).
Not surprising, trade is an important source of the strong welfare improvements generated by these commercial
policy initiatives (Table 6). In general, increases in exports tend to be in the range of two to three times faster
than increases in welfare; thus, all ASEAN economies experience a greater internationalization of their
respective economies.20 In comparative terms, the trade figures mirror the income gains, with the best-
performing Member States in terms of welfare also registering a superior trade performance. Exceptions
include Indonesia and the Lao People’s Democratic Republic, which tend to do relatively better with trade,
mainly due to their low trade dependency in the baseline. The extraordinary welfare improvements in the case
of Viet Nam under the RCEP scenario are also underpinned by strong export growth. In the case of the Rest
of ASEAN, which experiences a negative welfare effect in the AFTA scenario, exports rise under AFTA by
2.8 per cent and imports by 3.7 per cent over the baseline. Even though import growth always exceeds export
growth for the Rest of ASEAN, it experiences a very large increase in both as cooperation is deepened and
expanded; in the RCEP scenario, exports are fully 41 per cent above the baseline, while imports are 52 per
cent above the baseline.
Contrary to external demand, increases in consumption in ASEAN are always somewhat less than gains in
welfare in all scenarios, which is mainly driven by the low consumption-to-welfare growth relationship in
Indonesia (Table 7). With respect to other macro effects, the ASEAN real exchange rates slightly depreciate,
on average, in the range of 0.3–0.9 per cent in the ASEAN-based scenarios. But the RCEP scenario suggests
a slight appreciation of 0.8 per cent in 2025. However, real exchange rate changes are asymmetric, with the
Philippines and Singapore having a real appreciation in all four scenarios while Cambodia, the Lao People’s
Democratic Republic, Thailand and Viet Nam experience a real depreciation in these scenarios.
Table 6. Effects on international trade, 2025
Changes in exports, % from baseline Changes in imports, % from baseline
AFTA AFTA+ AEC RCEP AFTA AFTA+ AEC RCEP
ASEAN 4.3 16.4 20.2 48.4 4.5 17.0 21.0 50.3
Indonesia 3.5 12.7 15.8 62.3 3.7 13.6 16.9 65.2
Malaysia 3.0 15.2 19.5 42.2 3.3 17.3 22.2 47.7
Philippines 5.0 17.1 20.4 45.4 5.1 18.1 21.5 47.6
Singapore 3.0 17.2 23.0 30.2 3.0 16.0 21.5 31.4
Thailand 6.7 19.0 23.0 47.8 6.9 19.1 23.1 48.0
20 Given our closure rules, imports rise with exports to keep the exogenous trade balance.
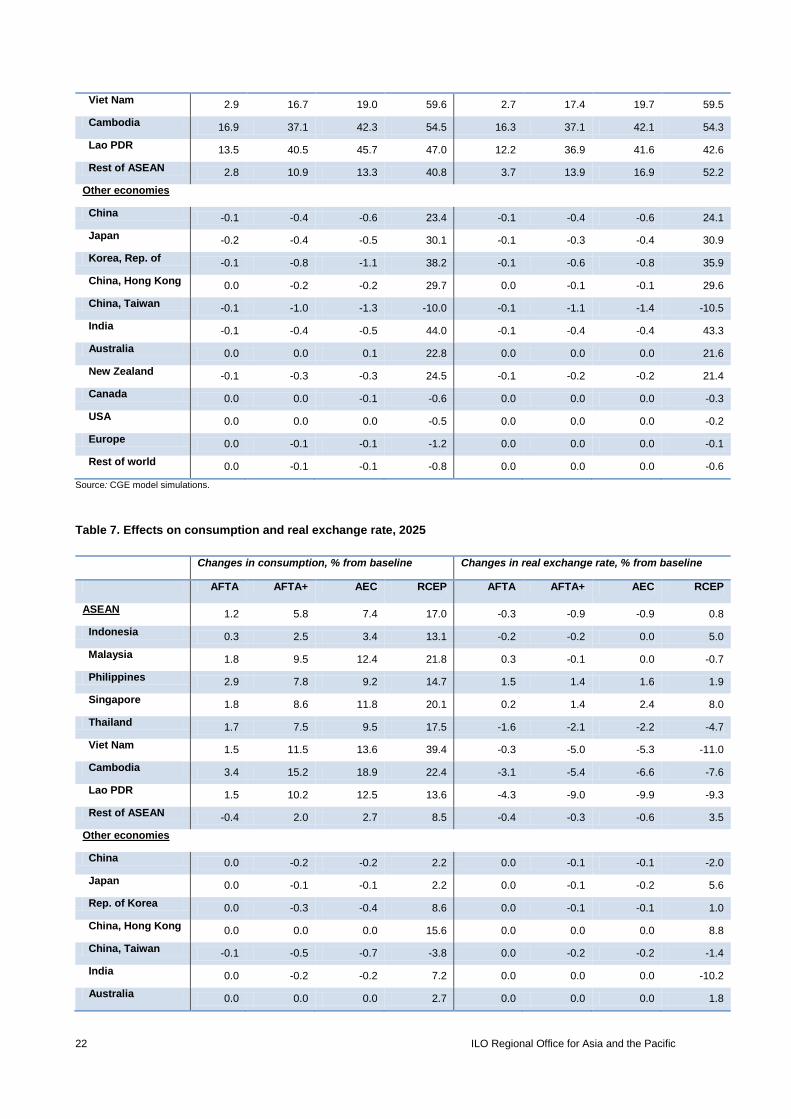
22 ILO Regional Office for Asia and the Pacific
Viet Nam 2.9 16.7 19.0 59.6 2.7 17.4 19.7 59.5
Cambodia 16.9 37.1 42.3 54.5 16.3 37.1 42.1 54.3
Lao PDR 13.5 40.5 45.7 47.0 12.2 36.9 41.6 42.6
Rest of ASEAN 2.8 10.9 13.3 40.8 3.7 13.9 16.9 52.2
Other economies
China -0.1 -0.4 -0.6 23.4 -0.1 -0.4 -0.6 24.1
Japan -0.2 -0.4 -0.5 30.1 -0.1 -0.3 -0.4 30.9
Korea, Rep. of -0.1 -0.8 -1.1 38.2 -0.1 -0.6 -0.8 35.9
China, Hong Kong 0.0 -0.2 -0.2 29.7 0.0 -0.1 -0.1 29.6
China, Taiwan -0.1 -1.0 -1.3 -10.0 -0.1 -1.1 -1.4 -10.5
India -0.1 -0.4 -0.5 44.0 -0.1 -0.4 -0.4 43.3
Australia 0.0 0.0 0.1 22.8 0.0 0.0 0.0 21.6
New Zealand -0.1 -0.3 -0.3 24.5 -0.1 -0.2 -0.2 21.4
Canada 0.0 0.0 -0.1 -0.6 0.0 0.0 0.0 -0.3
USA 0.0 0.0 0.0 -0.5 0.0 0.0 0.0 -0.2
Europe 0.0 -0.1 -0.1 -1.2 0.0 0.0 0.0 -0.1
Rest of world 0.0 -0.1 -0.1 -0.8 0.0 0.0 0.0 -0.6
Source: CGE model simulations.
Table 7. Effects on consumption and real exchange rate, 2025
Changes in consumption, % from baseline Changes in real exchange rate, % from baseline
AFTA AFTA+ AEC RCEP AFTA AFTA+ AEC RCEP
ASEAN 1.2 5.8 7.4 17.0 -0.3 -0.9 -0.9 0.8
Indonesia 0.3 2.5 3.4 13.1 -0.2 -0.2 0.0 5.0
Malaysia 1.8 9.5 12.4 21.8 0.3 -0.1 0.0 -0.7
Philippines 2.9 7.8 9.2 14.7 1.5 1.4 1.6 1.9
Singapore 1.8 8.6 11.8 20.1 0.2 1.4 2.4 8.0
Thailand 1.7 7.5 9.5 17.5 -1.6 -2.1 -2.2 -4.7
Viet Nam 1.5 11.5 13.6 39.4 -0.3 -5.0 -5.3 -11.0
Cambodia 3.4 15.2 18.9 22.4 -3.1 -5.4 -6.6 -7.6
Lao PDR 1.5 10.2 12.5 13.6 -4.3 -9.0 -9.9 -9.3
Rest of ASEAN -0.4 2.0 2.7 8.5 -0.4 -0.3 -0.6 3.5
Other economies
China 0.0 -0.2 -0.2 2.2 0.0 -0.1 -0.1 -2.0
Japan 0.0 -0.1 -0.1 2.2 0.0 -0.1 -0.2 5.6
Rep. of Korea 0.0 -0.3 -0.4 8.6 0.0 -0.1 -0.1 1.0
China, Hong Kong 0.0 0.0 0.0 15.6 0.0 0.0 0.0 8.8
China, Taiwan -0.1 -0.5 -0.7 -3.8 0.0 -0.2 -0.2 -1.4
India 0.0 -0.2 -0.2 7.2 0.0 0.0 0.0 -10.2
Australia 0.0 0.0 0.0 2.7 0.0 0.0 0.0 1.8
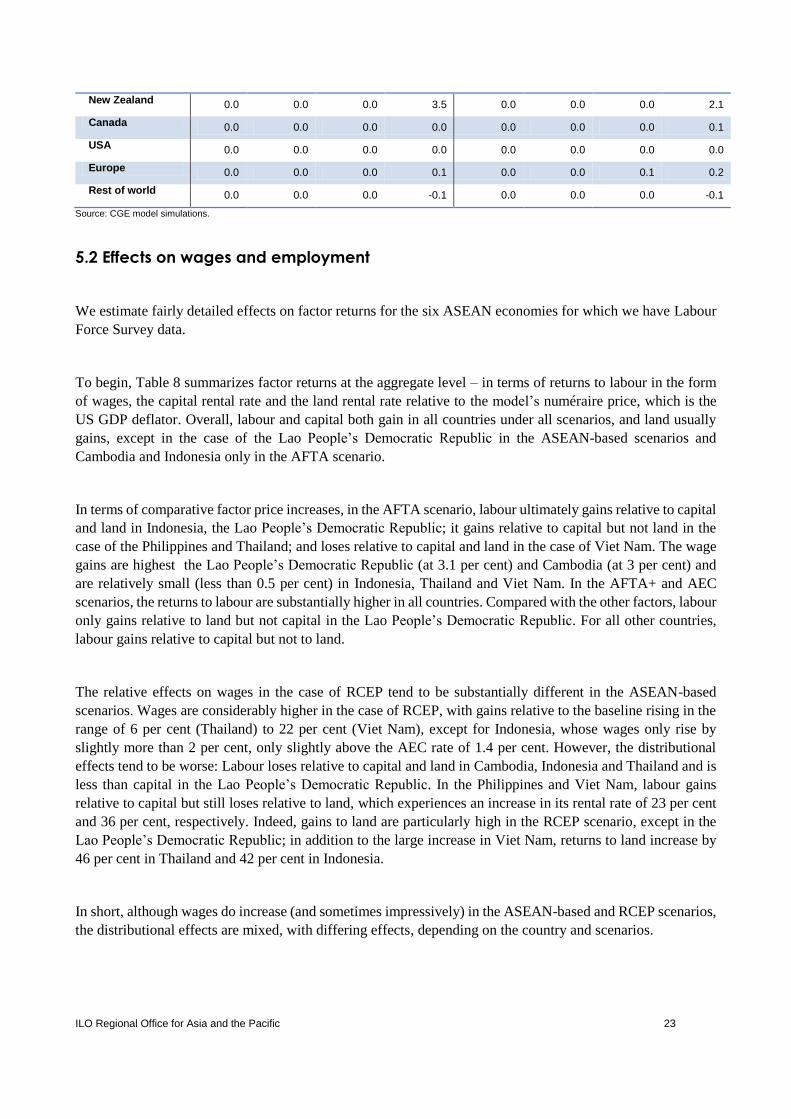
ILO Regional Office for Asia and the Pacific 23
New Zealand 0.0 0.0 0.0 3.5 0.0 0.0 0.0 2.1
Canada 0.0 0.0 0.0 0.0 0.0 0.0 0.0 0.1
USA 0.0 0.0 0.0 0.0 0.0 0.0 0.0 0.0
Europe 0.0 0.0 0.0 0.1 0.0 0.0 0.1 0.2
Rest of world 0.0 0.0 0.0 -0.1 0.0 0.0 0.0 -0.1
Source: CGE model simulations.
5.2 Effects on wages and employment
We estimate fairly detailed effects on factor returns for the six ASEAN economies for which we have Labour
Force Survey data.
To begin, Table 8 summarizes factor returns at the aggregate level – in terms of returns to labour in the form
of wages, the capital rental rate and the land rental rate relative to the model’s numéraire price, which is the
US GDP deflator. Overall, labour and capital both gain in all countries under all scenarios, and land usually
gains, except in the case of the Lao People’s Democratic Republic in the ASEAN-based scenarios and
Cambodia and Indonesia only in the AFTA scenario.
In terms of comparative factor price increases, in the AFTA scenario, labour ultimately gains relative to capital
and land in Indonesia, the Lao People’s Democratic Republic; it gains relative to capital but not land in the
case of the Philippines and Thailand; and loses relative to capital and land in the case of Viet Nam. The wage
gains are highest the Lao People’s Democratic Republic (at 3.1 per cent) and Cambodia (at 3 per cent) and
are relatively small (less than 0.5 per cent) in Indonesia, Thailand and Viet Nam. In the AFTA+ and AEC
scenarios, the returns to labour are substantially higher in all countries. Compared with the other factors, labour
only gains relative to land but not capital in the Lao People’s Democratic Republic. For all other countries,
labour gains relative to capital but not to land.
The relative effects on wages in the case of RCEP tend to be substantially different in the ASEAN-based
scenarios. Wages are considerably higher in the case of RCEP, with gains relative to the baseline rising in the
range of 6 per cent (Thailand) to 22 per cent (Viet Nam), except for Indonesia, whose wages only rise by
slightly more than 2 per cent, only slightly above the AEC rate of 1.4 per cent. However, the distributional
effects tend to be worse: Labour loses relative to capital and land in Cambodia, Indonesia and Thailand and is
less than capital in the Lao People’s Democratic Republic. In the Philippines and Viet Nam, labour gains
relative to capital but still loses relative to land, which experiences an increase in its rental rate of 23 per cent
and 36 per cent, respectively. Indeed, gains to land are particularly high in the RCEP scenario, except in the
Lao People’s Democratic Republic; in addition to the large increase in Viet Nam, returns to land increase by
46 per cent in Thailand and 42 per cent in Indonesia.
In short, although wages do increase (and sometimes impressively) in the ASEAN-based and RCEP scenarios,
the distributional effects are mixed, with differing effects, depending on the country and scenarios.
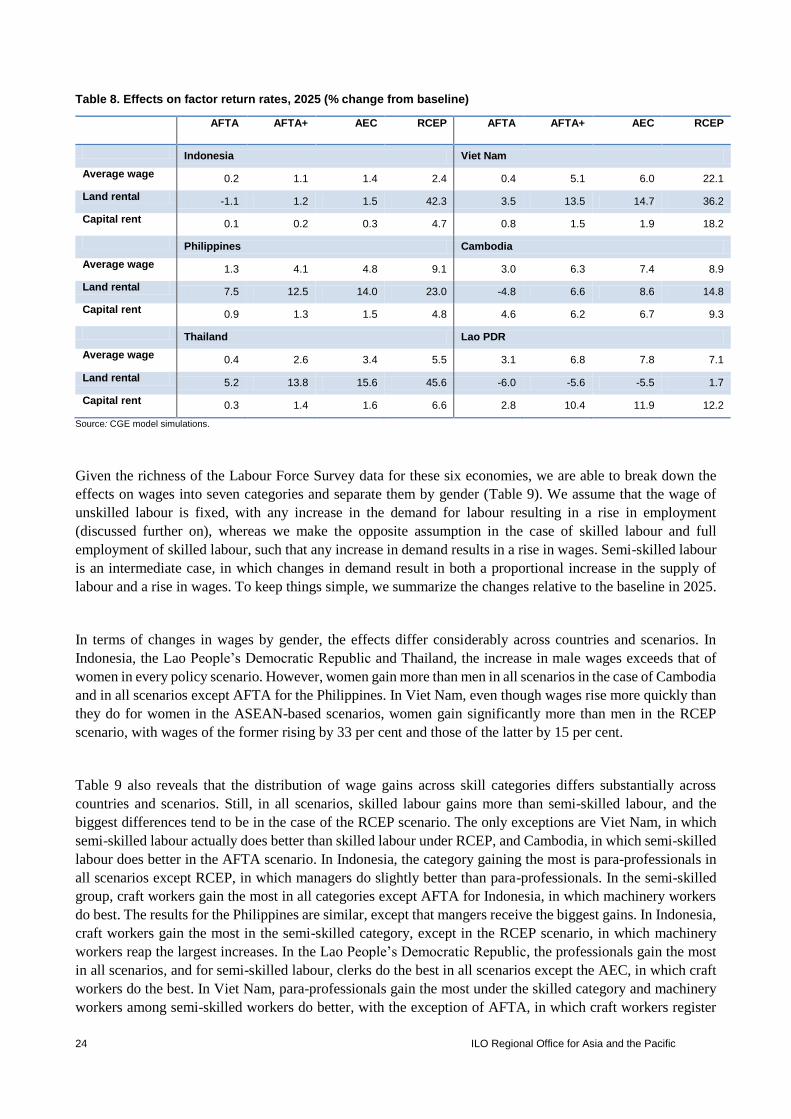
24 ILO Regional Office for Asia and the Pacific
Table 8. Effects on factor return rates, 2025 (% change from baseline)
AFTA AFTA+ AEC RCEP AFTA AFTA+ AEC RCEP
Indonesia Viet Nam
Average wage 0.2 1.1 1.4 2.4 0.4 5.1 6.0 22.1
Land rental -1.1 1.2 1.5 42.3 3.5 13.5 14.7 36.2
Capital rent 0.1 0.2 0.3 4.7 0.8 1.5 1.9 18.2
Philippines Cambodia
Average wage 1.3 4.1 4.8 9.1 3.0 6.3 7.4 8.9
Land rental 7.5 12.5 14.0 23.0 -4.8 6.6 8.6 14.8
Capital rent 0.9 1.3 1.5 4.8 4.6 6.2 6.7 9.3
Thailand Lao PDR
Average wage 0.4 2.6 3.4 5.5 3.1 6.8 7.8 7.1
Land rental 5.2 13.8 15.6 45.6 -6.0 -5.6 -5.5 1.7
Capital rent 0.3 1.4 1.6 6.6 2.8 10.4 11.9 12.2
Source: CGE model simulations.
Given the richness of the Labour Force Survey data for these six economies, we are able to break down the
effects on wages into seven categories and separate them by gender (Table 9). We assume that the wage of
unskilled labour is fixed, with any increase in the demand for labour resulting in a rise in employment
(discussed further on), whereas we make the opposite assumption in the case of skilled labour and full
employment of skilled labour, such that any increase in demand results in a rise in wages. Semi-skilled labour
is an intermediate case, in which changes in demand result in both a proportional increase in the supply of
labour and a rise in wages. To keep things simple, we summarize the changes relative to the baseline in 2025.
In terms of changes in wages by gender, the effects differ considerably across countries and scenarios. In
Indonesia, the Lao People’s Democratic Republic and Thailand, the increase in male wages exceeds that of
women in every policy scenario. However, women gain more than men in all scenarios in the case of Cambodia
and in all scenarios except AFTA for the Philippines. In Viet Nam, even though wages rise more quickly than
they do for women in the ASEAN-based scenarios, women gain significantly more than men in the RCEP
scenario, with wages of the former rising by 33 per cent and those of the latter by 15 per cent.
Table 9 also reveals that the distribution of wage gains across skill categories differs substantially across
countries and scenarios. Still, in all scenarios, skilled labour gains more than semi-skilled labour, and the
biggest differences tend to be in the case of the RCEP scenario. The only exceptions are Viet Nam, in which
semi-skilled labour actually does better than skilled labour under RCEP, and Cambodia, in which semi-skilled
labour does better in the AFTA scenario. In Indonesia, the category gaining the most is para-professionals in
all scenarios except RCEP, in which managers do slightly better than para-professionals. In the semi-skilled
group, craft workers gain the most in all categories except AFTA for Indonesia, in which machinery workers
do best. The results for the Philippines are similar, except that mangers receive the biggest gains. In Indonesia,
craft workers gain the most in the semi-skilled category, except in the RCEP scenario, in which machinery
workers reap the largest increases. In the Lao People’s Democratic Republic, the professionals gain the most
in all scenarios, and for semi-skilled labour, clerks do the best in all scenarios except the AEC, in which craft
workers do the best. In Viet Nam, para-professionals gain the most under the skilled category and machinery
workers among semi-skilled workers do better, with the exception of AFTA, in which craft workers register
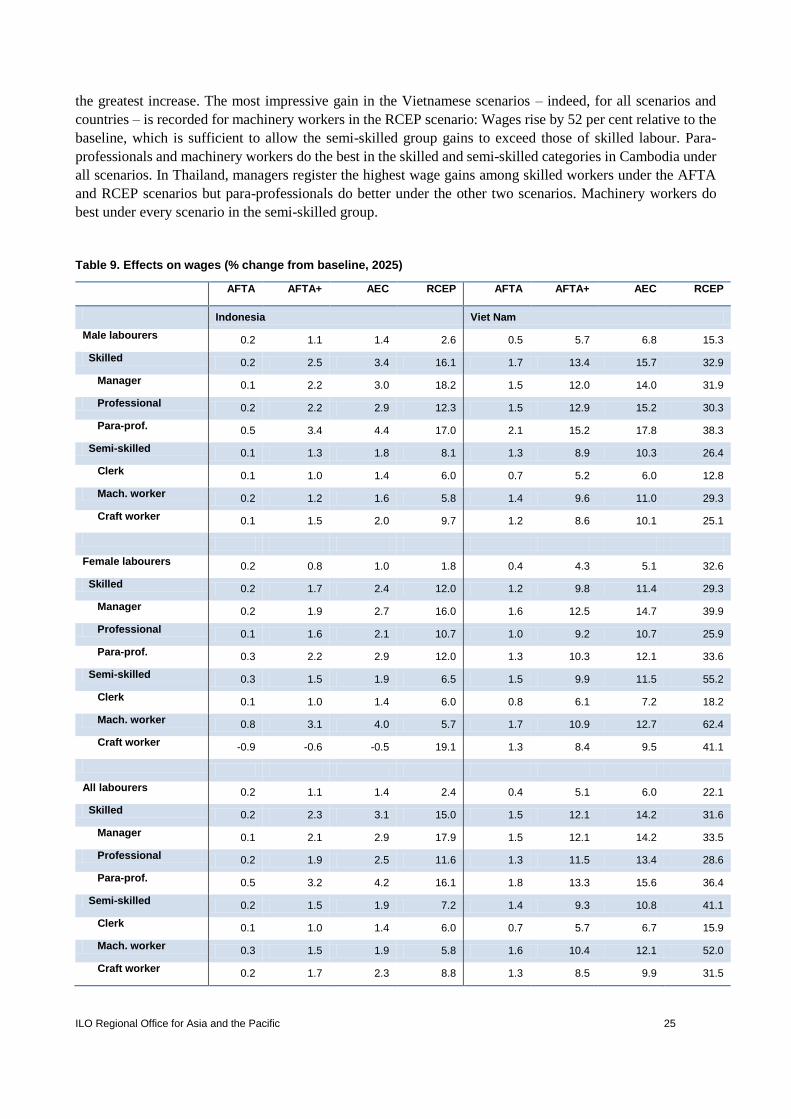
ILO Regional Office for Asia and the Pacific 25
the greatest increase. The most impressive gain in the Vietnamese scenarios – indeed, for all scenarios and
countries – is recorded for machinery workers in the RCEP scenario: Wages rise by 52 per cent relative to the
baseline, which is sufficient to allow the semi-skilled group gains to exceed those of skilled labour. Para-
professionals and machinery workers do the best in the skilled and semi-skilled categories in Cambodia under
all scenarios. In Thailand, managers register the highest wage gains among skilled workers under the AFTA
and RCEP scenarios but para-professionals do better under the other two scenarios. Machinery workers do
best under every scenario in the semi-skilled group.
Table 9. Effects on wages (% change from baseline, 2025)
AFTA AFTA+ AEC RCEP AFTA AFTA+ AEC RCEP
Indonesia Viet Nam
Male labourers 0.2 1.1 1.4 2.6 0.5 5.7 6.8 15.3
Skilled 0.2 2.5 3.4 16.1 1.7 13.4 15.7 32.9
Manager 0.1 2.2 3.0 18.2 1.5 12.0 14.0 31.9
Professional 0.2 2.2 2.9 12.3 1.5 12.9 15.2 30.3
Para-prof. 0.5 3.4 4.4 17.0 2.1 15.2 17.8 38.3
Semi-skilled 0.1 1.3 1.8 8.1 1.3 8.9 10.3 26.4
Clerk 0.1 1.0 1.4 6.0 0.7 5.2 6.0 12.8
Mach. worker 0.2 1.2 1.6 5.8 1.4 9.6 11.0 29.3
Craft worker 0.1 1.5 2.0 9.7 1.2 8.6 10.1 25.1
Female labourers 0.2 0.8 1.0 1.8 0.4 4.3 5.1 32.6
Skilled 0.2 1.7 2.4 12.0 1.2 9.8 11.4 29.3
Manager 0.2 1.9 2.7 16.0 1.6 12.5 14.7 39.9
Professional 0.1 1.6 2.1 10.7 1.0 9.2 10.7 25.9
Para-prof. 0.3 2.2 2.9 12.0 1.3 10.3 12.1 33.6
Semi-skilled 0.3 1.5 1.9 6.5 1.5 9.9 11.5 55.2
Clerk 0.1 1.0 1.4 6.0 0.8 6.1 7.2 18.2
Mach. worker 0.8 3.1 4.0 5.7 1.7 10.9 12.7 62.4
Craft worker -0.9 -0.6 -0.5 19.1 1.3 8.4 9.5 41.1
All labourers 0.2 1.1 1.4 2.4 0.4 5.1 6.0 22.1
Skilled 0.2 2.3 3.1 15.0 1.5 12.1 14.2 31.6
Manager 0.1 2.1 2.9 17.9 1.5 12.1 14.2 33.5
Professional 0.2 1.9 2.5 11.6 1.3 11.5 13.4 28.6
Para-prof. 0.5 3.2 4.2 16.1 1.8 13.3 15.6 36.4
Semi-skilled 0.2 1.5 1.9 7.2 1.4 9.3 10.8 41.1
Clerk 0.1 1.0 1.4 6.0 0.7 5.7 6.7 15.9
Mach. worker 0.3 1.5 1.9 5.8 1.6 10.4 12.1 52.0
Craft worker 0.2 1.7 2.3 8.8 1.3 8.5 9.9 31.5
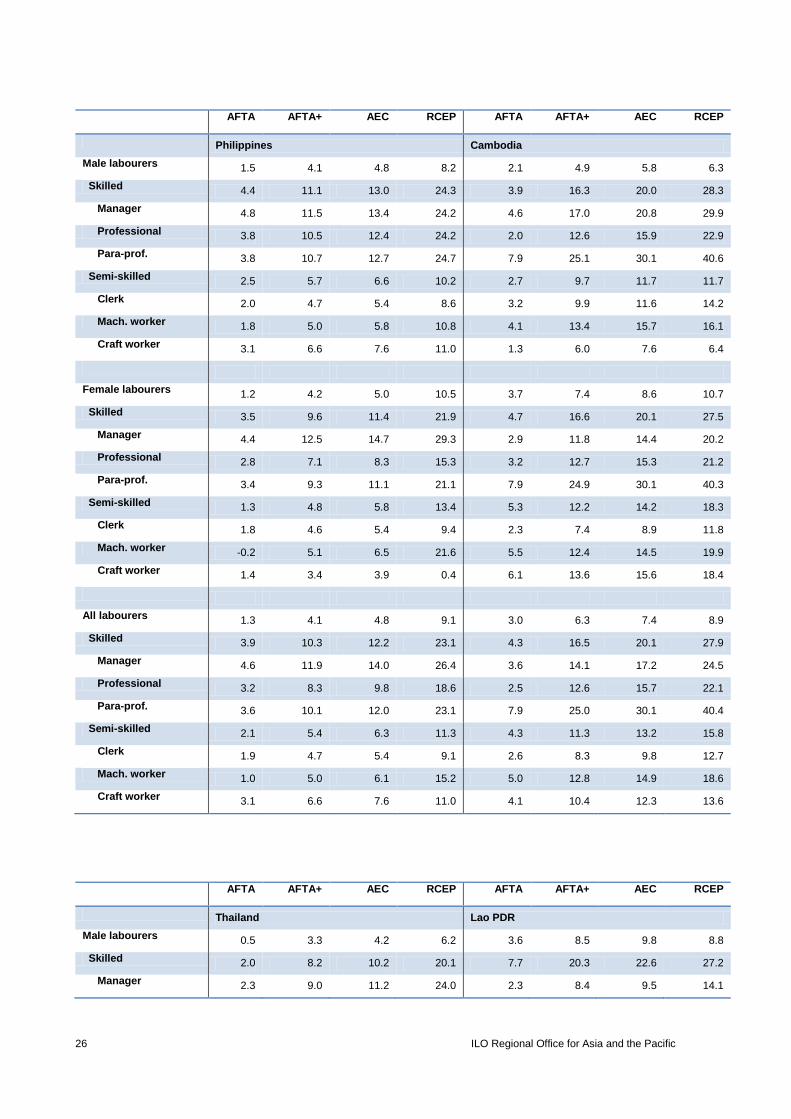
26 ILO Regional Office for Asia and the Pacific
AFTA AFTA+ AEC RCEP AFTA AFTA+ AEC RCEP
Philippines Cambodia
Male labourers 1.5 4.1 4.8 8.2 2.1 4.9 5.8 6.3
Skilled 4.4 11.1 13.0 24.3 3.9 16.3 20.0 28.3
Manager 4.8 11.5 13.4 24.2 4.6 17.0 20.8 29.9
Professional 3.8 10.5 12.4 24.2 2.0 12.6 15.9 22.9
Para-prof. 3.8 10.7 12.7 24.7 7.9 25.1 30.1 40.6
Semi-skilled 2.5 5.7 6.6 10.2 2.7 9.7 11.7 11.7
Clerk 2.0 4.7 5.4 8.6 3.2 9.9 11.6 14.2
Mach. worker 1.8 5.0 5.8 10.8 4.1 13.4 15.7 16.1
Craft worker 3.1 6.6 7.6 11.0 1.3 6.0 7.6 6.4
Female labourers 1.2 4.2 5.0 10.5 3.7 7.4 8.6 10.7
Skilled 3.5 9.6 11.4 21.9 4.7 16.6 20.1 27.5
Manager 4.4 12.5 14.7 29.3 2.9 11.8 14.4 20.2
Professional 2.8 7.1 8.3 15.3 3.2 12.7 15.3 21.2
Para-prof. 3.4 9.3 11.1 21.1 7.9 24.9 30.1 40.3
Semi-skilled 1.3 4.8 5.8 13.4 5.3 12.2 14.2 18.3
Clerk 1.8 4.6 5.4 9.4 2.3 7.4 8.9 11.8
Mach. worker -0.2 5.1 6.5 21.6 5.5 12.4 14.5 19.9
Craft worker 1.4 3.4 3.9 0.4 6.1 13.6 15.6 18.4
All labourers 1.3 4.1 4.8 9.1 3.0 6.3 7.4 8.9
Skilled 3.9 10.3 12.2 23.1 4.3 16.5 20.1 27.9
Manager 4.6 11.9 14.0 26.4 3.6 14.1 17.2 24.5
Professional 3.2 8.3 9.8 18.6 2.5 12.6 15.7 22.1
Para-prof. 3.6 10.1 12.0 23.1 7.9 25.0 30.1 40.4
Semi-skilled 2.1 5.4 6.3 11.3 4.3 11.3 13.2 15.8
Clerk 1.9 4.7 5.4 9.1 2.6 8.3 9.8 12.7
Mach. worker 1.0 5.0 6.1 15.2 5.0 12.8 14.9 18.6
Craft worker 3.1 6.6 7.6 11.0 4.1 10.4 12.3 13.6
AFTA AFTA+ AEC RCEP AFTA AFTA+ AEC RCEP
Thailand Lao PDR
Male labourers 0.5 3.3 4.2 6.2 3.6 8.5 9.8 8.8
Skilled 2.0 8.2 10.2 20.1 7.7 20.3 22.6 27.2
Manager 2.3 9.0 11.2 24.0 2.3 8.4 9.5 14.1
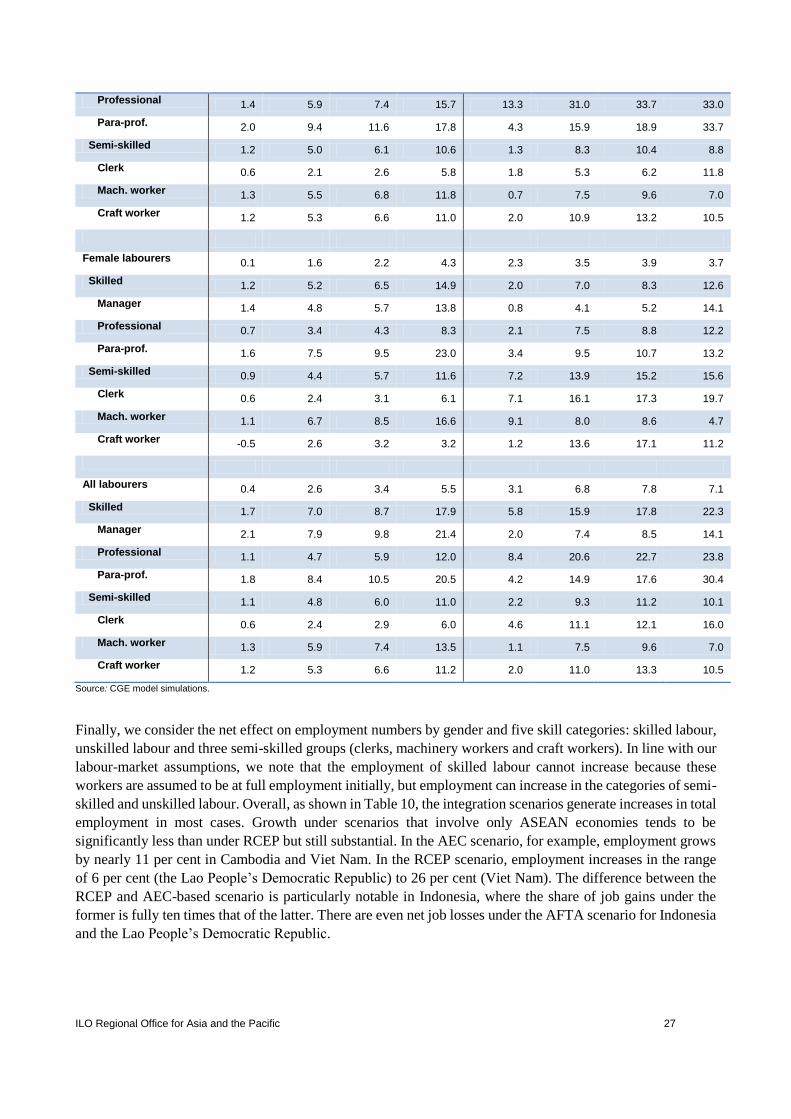
ILO Regional Office for Asia and the Pacific 27
Professional 1.4 5.9 7.4 15.7 13.3 31.0 33.7 33.0
Para-prof. 2.0 9.4 11.6 17.8 4.3 15.9 18.9 33.7
Semi-skilled 1.2 5.0 6.1 10.6 1.3 8.3 10.4 8.8
Clerk 0.6 2.1 2.6 5.8 1.8 5.3 6.2 11.8
Mach. worker 1.3 5.5 6.8 11.8 0.7 7.5 9.6 7.0
Craft worker 1.2 5.3 6.6 11.0 2.0 10.9 13.2 10.5
Female labourers 0.1 1.6 2.2 4.3 2.3 3.5 3.9 3.7
Skilled 1.2 5.2 6.5 14.9 2.0 7.0 8.3 12.6
Manager 1.4 4.8 5.7 13.8 0.8 4.1 5.2 14.1
Professional 0.7 3.4 4.3 8.3 2.1 7.5 8.8 12.2
Para-prof. 1.6 7.5 9.5 23.0 3.4 9.5 10.7 13.2
Semi-skilled 0.9 4.4 5.7 11.6 7.2 13.9 15.2 15.6
Clerk 0.6 2.4 3.1 6.1 7.1 16.1 17.3 19.7
Mach. worker 1.1 6.7 8.5 16.6 9.1 8.0 8.6 4.7
Craft worker -0.5 2.6 3.2 3.2 1.2 13.6 17.1 11.2
All labourers 0.4 2.6 3.4 5.5 3.1 6.8 7.8 7.1
Skilled 1.7 7.0 8.7 17.9 5.8 15.9 17.8 22.3
Manager 2.1 7.9 9.8 21.4 2.0 7.4 8.5 14.1
Professional 1.1 4.7 5.9 12.0 8.4 20.6 22.7 23.8
Para-prof. 1.8 8.4 10.5 20.5 4.2 14.9 17.6 30.4
Semi-skilled 1.1 4.8 6.0 11.0 2.2 9.3 11.2 10.1
Clerk 0.6 2.4 2.9 6.0 4.6 11.1 12.1 16.0
Mach. worker 1.3 5.9 7.4 13.5 1.1 7.5 9.6 7.0
Craft worker 1.2 5.3 6.6 11.2 2.0 11.0 13.3 10.5
Source: CGE model simulations.
Finally, we consider the net effect on employment numbers by gender and five skill categories: skilled labour,
unskilled labour and three semi-skilled groups (clerks, machinery workers and craft workers). In line with our
labour-market assumptions, we note that the employment of skilled labour cannot increase because these
workers are assumed to be at full employment initially, but employment can increase in the categories of semi-
skilled and unskilled labour. Overall, as shown in Table 10, the integration scenarios generate increases in total
employment in most cases. Growth under scenarios that involve only ASEAN economies tends to be
significantly less than under RCEP but still substantial. In the AEC scenario, for example, employment grows
by nearly 11 per cent in Cambodia and Viet Nam. In the RCEP scenario, employment increases in the range
of 6 per cent (the Lao People’s Democratic Republic) to 26 per cent (Viet Nam). The difference between the
RCEP and AEC-based scenario is particularly notable in Indonesia, where the share of job gains under the
former is fully ten times that of the latter. There are even net job losses under the AFTA scenario for Indonesia
and the Lao People’s Democratic Republic.
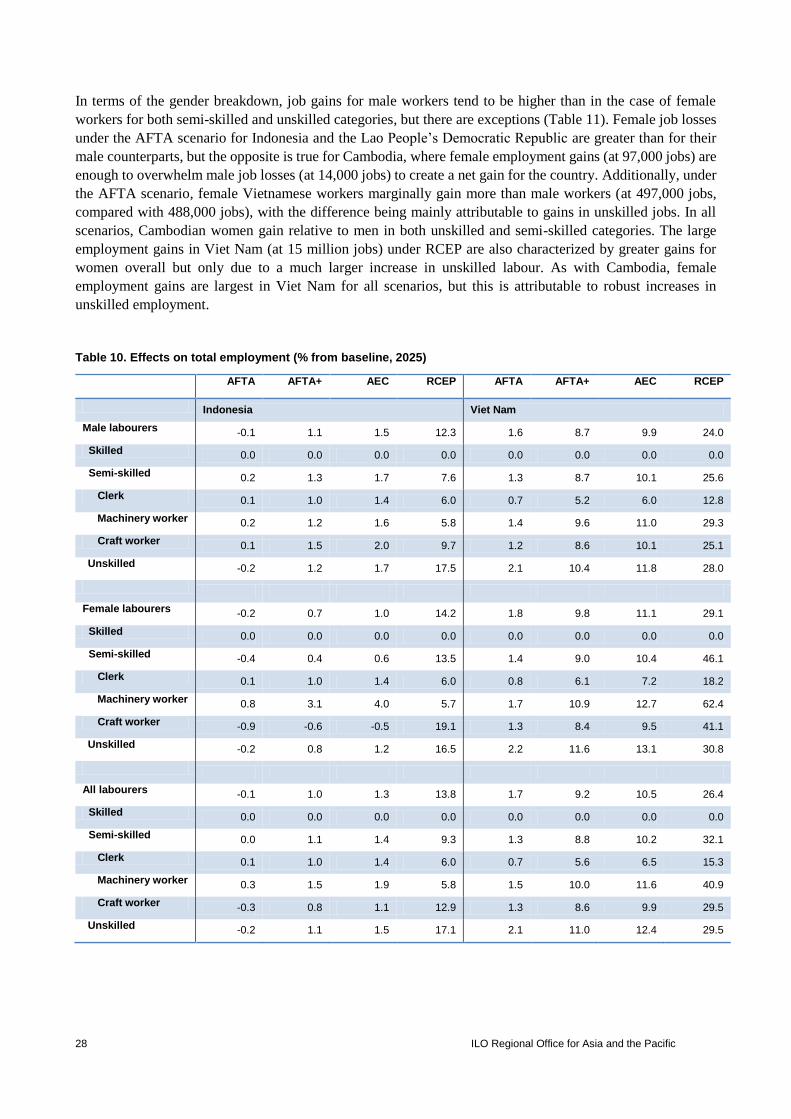
28 ILO Regional Office for Asia and the Pacific
In terms of the gender breakdown, job gains for male workers tend to be higher than in the case of female
workers for both semi-skilled and unskilled categories, but there are exceptions (Table 11). Female job losses
under the AFTA scenario for Indonesia and the Lao People’s Democratic Republic are greater than for their
male counterparts, but the opposite is true for Cambodia, where female employment gains (at 97,000 jobs) are
enough to overwhelm male job losses (at 14,000 jobs) to create a net gain for the country. Additionally, under
the AFTA scenario, female Vietnamese workers marginally gain more than male workers (at 497,000 jobs,
compared with 488,000 jobs), with the difference being mainly attributable to gains in unskilled jobs. In all
scenarios, Cambodian women gain relative to men in both unskilled and semi-skilled categories. The large
employment gains in Viet Nam (at 15 million jobs) under RCEP are also characterized by greater gains for
women overall but only due to a much larger increase in unskilled labour. As with Cambodia, female
employment gains are largest in Viet Nam for all scenarios, but this is attributable to robust increases in
unskilled employment.
Table 10. Effects on total employment (% from baseline, 2025)
AFTA AFTA+ AEC RCEP AFTA AFTA+ AEC RCEP
Indonesia Viet Nam
Male labourers -0.1 1.1 1.5 12.3 1.6 8.7 9.9 24.0
Skilled 0.0 0.0 0.0 0.0 0.0 0.0 0.0 0.0
Semi-skilled 0.2 1.3 1.7 7.6 1.3 8.7 10.1 25.6
Clerk 0.1 1.0 1.4 6.0 0.7 5.2 6.0 12.8
Machinery worker 0.2 1.2 1.6 5.8 1.4 9.6 11.0 29.3
Craft worker 0.1 1.5 2.0 9.7 1.2 8.6 10.1 25.1
Unskilled -0.2 1.2 1.7 17.5 2.1 10.4 11.8 28.0
Female labourers -0.2 0.7 1.0 14.2 1.8 9.8 11.1 29.1
Skilled 0.0 0.0 0.0 0.0 0.0 0.0 0.0 0.0
Semi-skilled -0.4 0.4 0.6 13.5 1.4 9.0 10.4 46.1
Clerk 0.1 1.0 1.4 6.0 0.8 6.1 7.2 18.2
Machinery worker 0.8 3.1 4.0 5.7 1.7 10.9 12.7 62.4
Craft worker -0.9 -0.6 -0.5 19.1 1.3 8.4 9.5 41.1
Unskilled -0.2 0.8 1.2 16.5 2.2 11.6 13.1 30.8
All labourers -0.1 1.0 1.3 13.8 1.7 9.2 10.5 26.4
Skilled 0.0 0.0 0.0 0.0 0.0 0.0 0.0 0.0
Semi-skilled 0.0 1.1 1.4 9.3 1.3 8.8 10.2 32.1
Clerk 0.1 1.0 1.4 6.0 0.7 5.6 6.5 15.3
Machinery worker 0.3 1.5 1.9 5.8 1.5 10.0 11.6 40.9
Craft worker -0.3 0.8 1.1 12.9 1.3 8.6 9.9 29.5
Unskilled -0.2 1.1 1.5 17.1 2.1 11.0 12.4 29.5
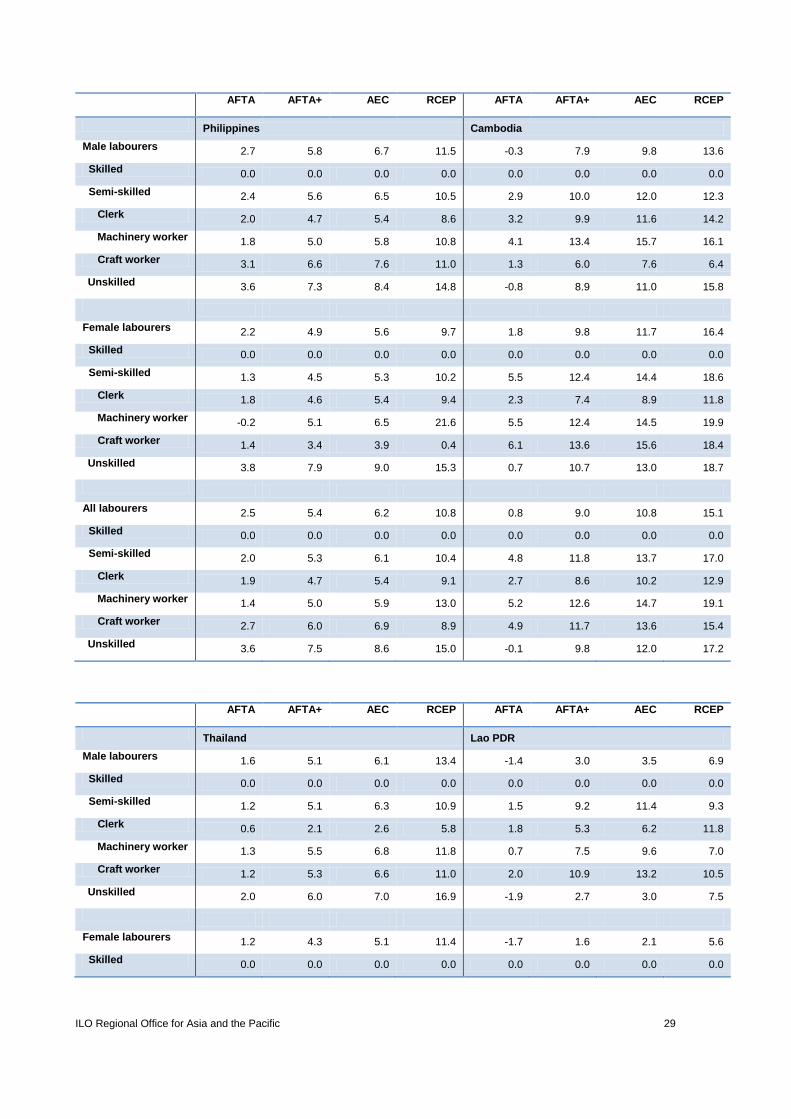
ILO Regional Office for Asia and the Pacific 29
AFTA AFTA+ AEC RCEP AFTA AFTA+ AEC RCEP
Philippines Cambodia
Male labourers 2.7 5.8 6.7 11.5 -0.3 7.9 9.8 13.6
Skilled 0.0 0.0 0.0 0.0 0.0 0.0 0.0 0.0
Semi-skilled 2.4 5.6 6.5 10.5 2.9 10.0 12.0 12.3
Clerk 2.0 4.7 5.4 8.6 3.2 9.9 11.6 14.2
Machinery worker 1.8 5.0 5.8 10.8 4.1 13.4 15.7 16.1
Craft worker 3.1 6.6 7.6 11.0 1.3 6.0 7.6 6.4
Unskilled 3.6 7.3 8.4 14.8 -0.8 8.9 11.0 15.8
Female labourers 2.2 4.9 5.6 9.7 1.8 9.8 11.7 16.4
Skilled 0.0 0.0 0.0 0.0 0.0 0.0 0.0 0.0
Semi-skilled 1.3 4.5 5.3 10.2 5.5 12.4 14.4 18.6
Clerk 1.8 4.6 5.4 9.4 2.3 7.4 8.9 11.8
Machinery worker -0.2 5.1 6.5 21.6 5.5 12.4 14.5 19.9
Craft worker 1.4 3.4 3.9 0.4 6.1 13.6 15.6 18.4
Unskilled 3.8 7.9 9.0 15.3 0.7 10.7 13.0 18.7
All labourers 2.5 5.4 6.2 10.8 0.8 9.0 10.8 15.1
Skilled 0.0 0.0 0.0 0.0 0.0 0.0 0.0 0.0
Semi-skilled 2.0 5.3 6.1 10.4 4.8 11.8 13.7 17.0
Clerk 1.9 4.7 5.4 9.1 2.7 8.6 10.2 12.9
Machinery worker 1.4 5.0 5.9 13.0 5.2 12.6 14.7 19.1
Craft worker 2.7 6.0 6.9 8.9 4.9 11.7 13.6 15.4
Unskilled 3.6 7.5 8.6 15.0 -0.1 9.8 12.0 17.2
AFTA AFTA+ AEC RCEP AFTA AFTA+ AEC RCEP
Thailand Lao PDR
Male labourers 1.6 5.1 6.1 13.4 -1.4 3.0 3.5 6.9
Skilled 0.0 0.0 0.0 0.0 0.0 0.0 0.0 0.0
Semi-skilled 1.2 5.1 6.3 10.9 1.5 9.2 11.4 9.3
Clerk 0.6 2.1 2.6 5.8 1.8 5.3 6.2 11.8
Machinery worker 1.3 5.5 6.8 11.8 0.7 7.5 9.6 7.0
Craft worker 1.2 5.3 6.6 11.0 2.0 10.9 13.2 10.5
Unskilled 2.0 6.0 7.0 16.9 -1.9 2.7 3.0 7.5
Female labourers 1.2 4.3 5.1 11.4 -1.7 1.6 2.1 5.6
Skilled 0.0 0.0 0.0 0.0 0.0 0.0 0.0 0.0
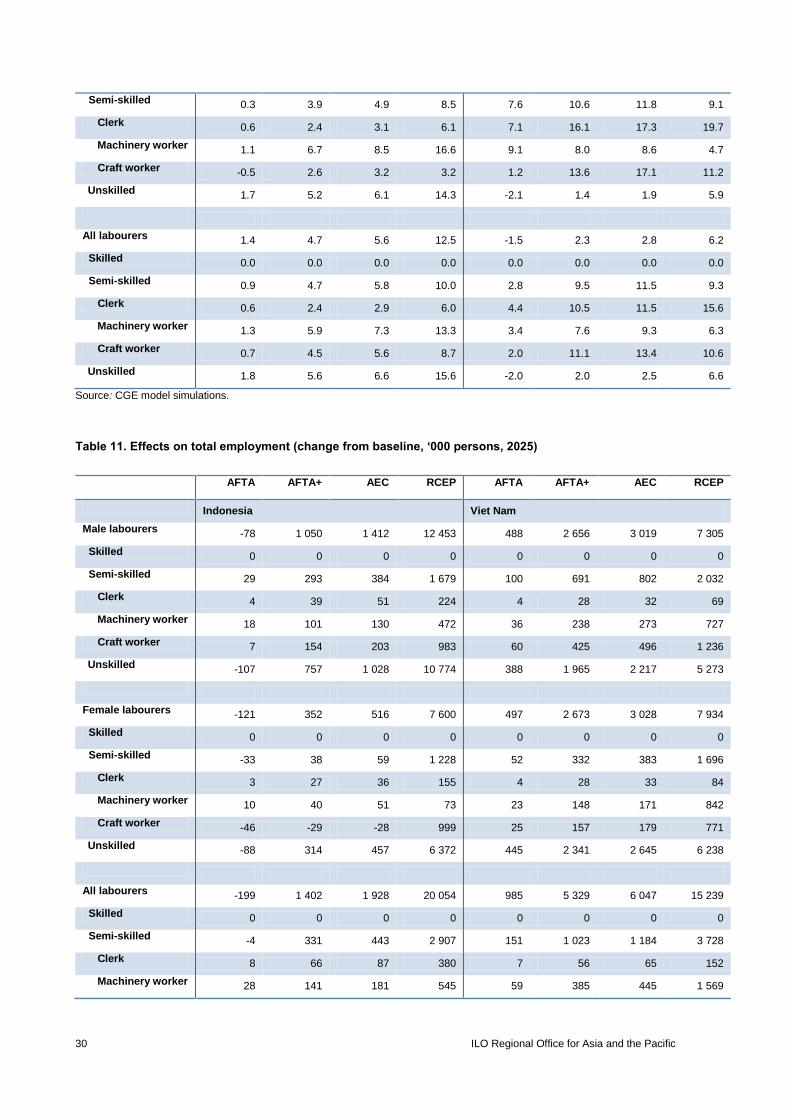
30 ILO Regional Office for Asia and the Pacific
Semi-skilled 0.3 3.9 4.9 8.5 7.6 10.6 11.8 9.1
Clerk 0.6 2.4 3.1 6.1 7.1 16.1 17.3 19.7
Machinery worker 1.1 6.7 8.5 16.6 9.1 8.0 8.6 4.7
Craft worker -0.5 2.6 3.2 3.2 1.2 13.6 17.1 11.2
Unskilled 1.7 5.2 6.1 14.3 -2.1 1.4 1.9 5.9
All labourers 1.4 4.7 5.6 12.5 -1.5 2.3 2.8 6.2
Skilled 0.0 0.0 0.0 0.0 0.0 0.0 0.0 0.0
Semi-skilled 0.9 4.7 5.8 10.0 2.8 9.5 11.5 9.3
Clerk 0.6 2.4 2.9 6.0 4.4 10.5 11.5 15.6
Machinery worker 1.3 5.9 7.3 13.3 3.4 7.6 9.3 6.3
Craft worker 0.7 4.5 5.6 8.7 2.0 11.1 13.4 10.6
Unskilled 1.8 5.6 6.6 15.6 -2.0 2.0 2.5 6.6
Source: CGE model simulations.
Table 11. Effects on total employment (change from baseline, ‘000 persons, 2025)
AFTA AFTA+ AEC RCEP AFTA AFTA+ AEC RCEP
Indonesia Viet Nam
Male labourers -78 1 050 1 412 12 453 488 2 656 3 019 7 305
Skilled 0 0 0 0 0 0 0 0
Semi-skilled 29 293 384 1 679 100 691 802 2 032
Clerk 4 39 51 224 4 28 32 69
Machinery worker 18 101 130 472 36 238 273 727
Craft worker 7 154 203 983 60 425 496 1 236
Unskilled -107 757 1 028 10 774 388 1 965 2 217 5 273
Female labourers -121 352 516 7 600 497 2 673 3 028 7 934
Skilled 0 0 0 0 0 0 0 0
Semi-skilled -33 38 59 1 228 52 332 383 1 696
Clerk 3 27 36 155 4 28 33 84
Machinery worker 10 40 51 73 23 148 171 842
Craft worker -46 -29 -28 999 25 157 179 771
Unskilled -88 314 457 6 372 445 2 341 2 645 6 238
All labourers -199 1 402 1 928 20 054 985 5 329 6 047 15 239
Skilled 0 0 0 0 0 0 0 0
Semi-skilled -4 331 443 2 907 151 1 023 1 184 3 728
Clerk 8 66 87 380 7 56 65 152
Machinery worker 28 141 181 545 59 385 445 1 569

ILO Regional Office for Asia and the Pacific 31
Craft worker -40 125 175 1 983 85 582 675 2 006
Unskilled -195 1071 1485 17 146 833 4 306 4 862 11 511
AFTA AFTA+ AEC RCEP AFTA AFTA+ AEC RCEP
Philippines Cambodia
Male labourers 839 1 765 2 040 3 528 -14 370 456 633
Skilled 0 0 0 0 0 0 0 0
Semi-skilled 158 374 434 700 14 47 56 58
Clerk 20 46 53 85 3 10 12 15
Machinery worker 51 140 164 304 8 27 32 32
Craft worker 87 188 217 311 2 10 12 11
Unskilled 681 1391 1607 2 828 -28 323 400 575
Female labourers 431 957 1 104 1 904 97 537 641 896
Skilled 0 0 0 0 0 0 0 0
Semi-skilled 39 138 164 316 73 166 192 249
Clerk 31 78 91 158 3 9 11 15
Machinery worker -2 37 47 156 41 92 107 147
Craft worker 10 24 27 3 29 65 74 88
Unskilled 392 819 939 1 588 24 371 449 647
All labourers 1 270 2 722 3 144 5 432 83 907 1 098 1 529
Skilled 0 0 0 0 0 0 0 0
Semi-skilled 197 513 598 1017 87 213 249 307
Clerk 51 124 144 243 6 20 23 30
Machinery worker 50 177 210 460 49 119 138 179
Craft worker 97 212 244 314 31 75 87 98
Unskilled 1 073 2 210 2 546 4 415 -4 694 849 1 222
AFTA AFTA+ AEC RCEP AFTA AFTA+ AEC RCEP
Thailand Lao PDR
Male labourers 332 1 085 1 293 2 857 -33 71 83 161
Skilled 0 0 0 0 0 0 0 0
Semi-skilled 70 297 368 631 3 21 26 21
Clerk 3 10 12 27 0 1 1 2
Machinery worker 31 128 157 272 1 6 8 6
Craft worker 36 160 199 332 3 14 17 14
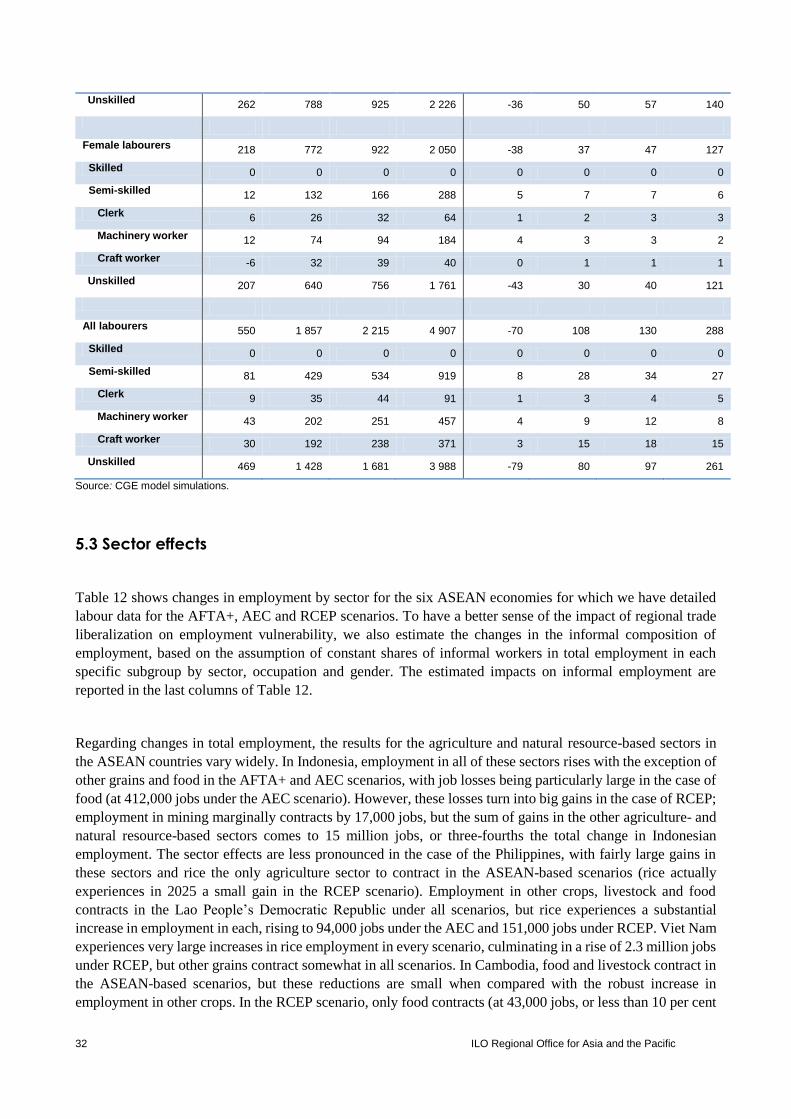
32 ILO Regional Office for Asia and the Pacific
Unskilled 262 788 925 2 226 -36 50 57 140
Female labourers 218 772 922 2 050 -38 37 47 127
Skilled 0 0 0 0 0 0 0 0
Semi-skilled 12 132 166 288 5 7 7 6
Clerk 6 26 32 64 1 2 3 3
Machinery worker 12 74 94 184 4 3 3 2
Craft worker -6 32 39 40 0 1 1 1
Unskilled 207 640 756 1 761 -43 30 40 121
All labourers 550 1 857 2 215 4 907 -70 108 130 288
Skilled 0 0 0 0 0 0 0 0
Semi-skilled 81 429 534 919 8 28 34 27
Clerk 9 35 44 91 1 3 4 5
Machinery worker 43 202 251 457 4 9 12 8
Craft worker 30 192 238 371 3 15 18 15
Unskilled 469 1 428 1 681 3 988 -79 80 97 261
Source: CGE model simulations.
5.3 Sector effects
Table 12 shows changes in employment by sector for the six ASEAN economies for which we have detailed
labour data for the AFTA+, AEC and RCEP scenarios. To have a better sense of the impact of regional trade
liberalization on employment vulnerability, we also estimate the changes in the informal composition of
employment, based on the assumption of constant shares of informal workers in total employment in each
specific subgroup by sector, occupation and gender. The estimated impacts on informal employment are
reported in the last columns of Table 12.
Regarding changes in total employment, the results for the agriculture and natural resource-based sectors in
the ASEAN countries vary widely. In Indonesia, employment in all of these sectors rises with the exception of
other grains and food in the AFTA+ and AEC scenarios, with job losses being particularly large in the case of
food (at 412,000 jobs under the AEC scenario). However, these losses turn into big gains in the case of RCEP;
employment in mining marginally contracts by 17,000 jobs, but the sum of gains in the other agriculture- and
natural resource-based sectors comes to 15 million jobs, or three-fourths the total change in Indonesian
employment. The sector effects are less pronounced in the case of the Philippines, with fairly large gains in
these sectors and rice the only agriculture sector to contract in the ASEAN-based scenarios (rice actually
experiences in 2025 a small gain in the RCEP scenario). Employment in other crops, livestock and food
contracts in the Lao People’s Democratic Republic under all scenarios, but rice experiences a substantial
increase in employment in each, rising to 94,000 jobs under the AEC and 151,000 jobs under RCEP. Viet Nam
experiences very large increases in rice employment in every scenario, culminating in a rise of 2.3 million jobs
under RCEP, but other grains contract somewhat in all scenarios. In Cambodia, food and livestock contract in
the ASEAN-based scenarios, but these reductions are small when compared with the robust increase in
employment in other crops. In the RCEP scenario, only food contracts (at 43,000 jobs, or less than 10 per cent
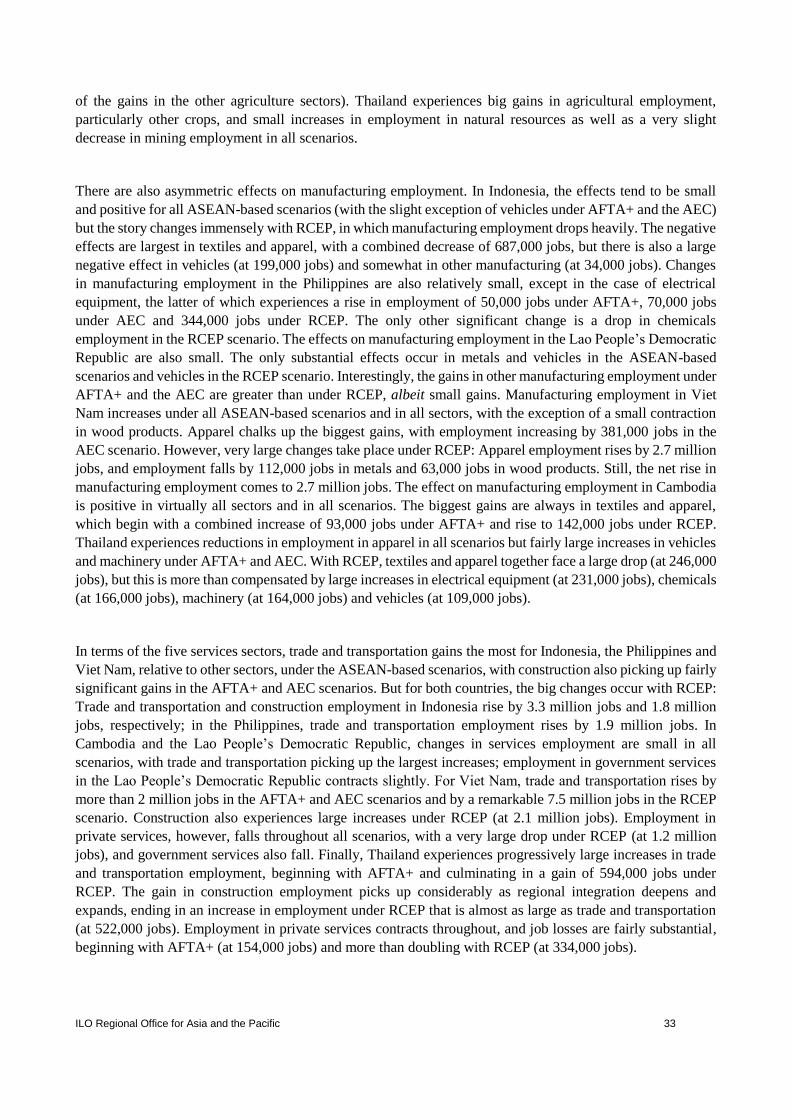
ILO Regional Office for Asia and the Pacific 33
of the gains in the other agriculture sectors). Thailand experiences big gains in agricultural employment,
particularly other crops, and small increases in employment in natural resources as well as a very slight
decrease in mining employment in all scenarios.
There are also asymmetric effects on manufacturing employment. In Indonesia, the effects tend to be small
and positive for all ASEAN-based scenarios (with the slight exception of vehicles under AFTA+ and the AEC)
but the story changes immensely with RCEP, in which manufacturing employment drops heavily. The negative
effects are largest in textiles and apparel, with a combined decrease of 687,000 jobs, but there is also a large
negative effect in vehicles (at 199,000 jobs) and somewhat in other manufacturing (at 34,000 jobs). Changes
in manufacturing employment in the Philippines are also relatively small, except in the case of electrical
equipment, the latter of which experiences a rise in employment of 50,000 jobs under AFTA+, 70,000 jobs
under AEC and 344,000 jobs under RCEP. The only other significant change is a drop in chemicals
employment in the RCEP scenario. The effects on manufacturing employment in the Lao People’s Democratic
Republic are also small. The only substantial effects occur in metals and vehicles in the ASEAN-based
scenarios and vehicles in the RCEP scenario. Interestingly, the gains in other manufacturing employment under
AFTA+ and the AEC are greater than under RCEP, albeit small gains. Manufacturing employment in Viet
Nam increases under all ASEAN-based scenarios and in all sectors, with the exception of a small contraction
in wood products. Apparel chalks up the biggest gains, with employment increasing by 381,000 jobs in the
AEC scenario. However, very large changes take place under RCEP: Apparel employment rises by 2.7 million
jobs, and employment falls by 112,000 jobs in metals and 63,000 jobs in wood products. Still, the net rise in
manufacturing employment comes to 2.7 million jobs. The effect on manufacturing employment in Cambodia
is positive in virtually all sectors and in all scenarios. The biggest gains are always in textiles and apparel,
which begin with a combined increase of 93,000 jobs under AFTA+ and rise to 142,000 jobs under RCEP.
Thailand experiences reductions in employment in apparel in all scenarios but fairly large increases in vehicles
and machinery under AFTA+ and AEC. With RCEP, textiles and apparel together face a large drop (at 246,000
jobs), but this is more than compensated by large increases in electrical equipment (at 231,000 jobs), chemicals
(at 166,000 jobs), machinery (at 164,000 jobs) and vehicles (at 109,000 jobs).
In terms of the five services sectors, trade and transportation gains the most for Indonesia, the Philippines and
Viet Nam, relative to other sectors, under the ASEAN-based scenarios, with construction also picking up fairly
significant gains in the AFTA+ and AEC scenarios. But for both countries, the big changes occur with RCEP:
Trade and transportation and construction employment in Indonesia rise by 3.3 million jobs and 1.8 million
jobs, respectively; in the Philippines, trade and transportation employment rises by 1.9 million jobs. In
Cambodia and the Lao People’s Democratic Republic, changes in services employment are small in all
scenarios, with trade and transportation picking up the largest increases; employment in government services
in the Lao People’s Democratic Republic contracts slightly. For Viet Nam, trade and transportation rises by
more than 2 million jobs in the AFTA+ and AEC scenarios and by a remarkable 7.5 million jobs in the RCEP
scenario. Construction also experiences large increases under RCEP (at 2.1 million jobs). Employment in
private services, however, falls throughout all scenarios, with a very large drop under RCEP (at 1.2 million
jobs), and government services also fall. Finally, Thailand experiences progressively large increases in trade
and transportation employment, beginning with AFTA+ and culminating in a gain of 594,000 jobs under
RCEP. The gain in construction employment picks up considerably as regional integration deepens and
expands, ending in an increase in employment under RCEP that is almost as large as trade and transportation
(at 522,000 jobs). Employment in private services contracts throughout, and job losses are fairly substantial,
beginning with AFTA+ (at 154,000 jobs) and more than doubling with RCEP (at 334,000 jobs).
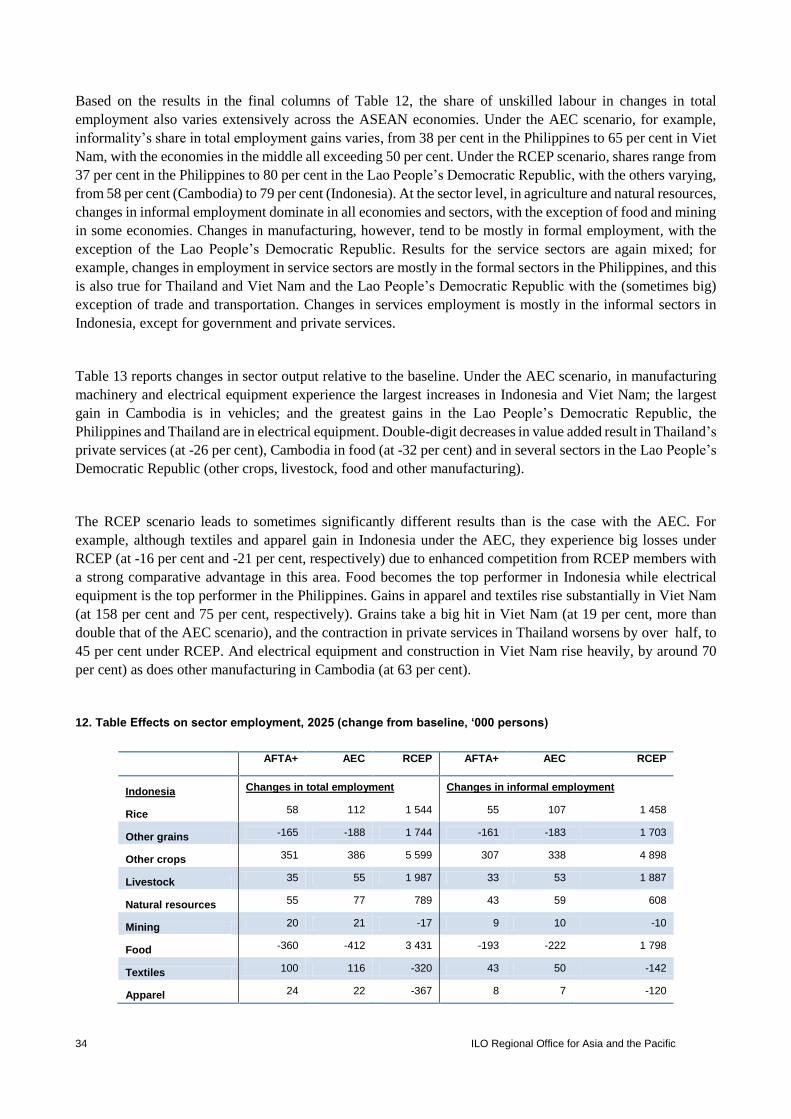
34 ILO Regional Office for Asia and the Pacific
Based on the results in the final columns of Table 12, the share of unskilled labour in changes in total
employment also varies extensively across the ASEAN economies. Under the AEC scenario, for example,
informality’s share in total employment gains varies, from 38 per cent in the Philippines to 65 per cent in Viet
Nam, with the economies in the middle all exceeding 50 per cent. Under the RCEP scenario, shares range from
37 per cent in the Philippines to 80 per cent in the Lao People’s Democratic Republic, with the others varying,
from 58 per cent (Cambodia) to 79 per cent (Indonesia). At the sector level, in agriculture and natural resources,
changes in informal employment dominate in all economies and sectors, with the exception of food and mining
in some economies. Changes in manufacturing, however, tend to be mostly in formal employment, with the
exception of the Lao People’s Democratic Republic. Results for the service sectors are again mixed; for
example, changes in employment in service sectors are mostly in the formal sectors in the Philippines, and this
is also true for Thailand and Viet Nam and the Lao People’s Democratic Republic with the (sometimes big)
exception of trade and transportation. Changes in services employment is mostly in the informal sectors in
Indonesia, except for government and private services.
Table 13 reports changes in sector output relative to the baseline. Under the AEC scenario, in manufacturing
machinery and electrical equipment experience the largest increases in Indonesia and Viet Nam; the largest
gain in Cambodia is in vehicles; and the greatest gains in the Lao People’s Democratic Republic, the
Philippines and Thailand are in electrical equipment. Double-digit decreases in value added result in Thailand’s
private services (at -26 per cent), Cambodia in food (at -32 per cent) and in several sectors in the Lao People’s
Democratic Republic (other crops, livestock, food and other manufacturing).
The RCEP scenario leads to sometimes significantly different results than is the case with the AEC. For
example, although textiles and apparel gain in Indonesia under the AEC, they experience big losses under
RCEP (at -16 per cent and -21 per cent, respectively) due to enhanced competition from RCEP members with
a strong comparative advantage in this area. Food becomes the top performer in Indonesia while electrical
equipment is the top performer in the Philippines. Gains in apparel and textiles rise substantially in Viet Nam
(at 158 per cent and 75 per cent, respectively). Grains take a big hit in Viet Nam (at 19 per cent, more than
double that of the AEC scenario), and the contraction in private services in Thailand worsens by over half, to
45 per cent under RCEP. And electrical equipment and construction in Viet Nam rise heavily, by around 70
per cent) as does other manufacturing in Cambodia (at 63 per cent).
12. Table Effects on sector employment, 2025 (change from baseline, ‘000 persons)
AFTA+ AEC RCEP AFTA+ AEC RCEP
Indonesia Changes in total employment Changes in informal employment
Rice 58 112 1 544 55 107 1 458
Other grains -165 -188 1 744 -161 -183 1 703
Other crops 351 386 5 599 307 338 4 898
Livestock 35 55 1 987 33 53 1 887
Natural resources 55 77 789 43 59 608
Mining 20 21 -17 9 10 -10
Food -360 -412 3 431 -193 -222 1 798
Textiles 100 116 -320 43 50 -142
Apparel 24 22 -367 8 7 -120
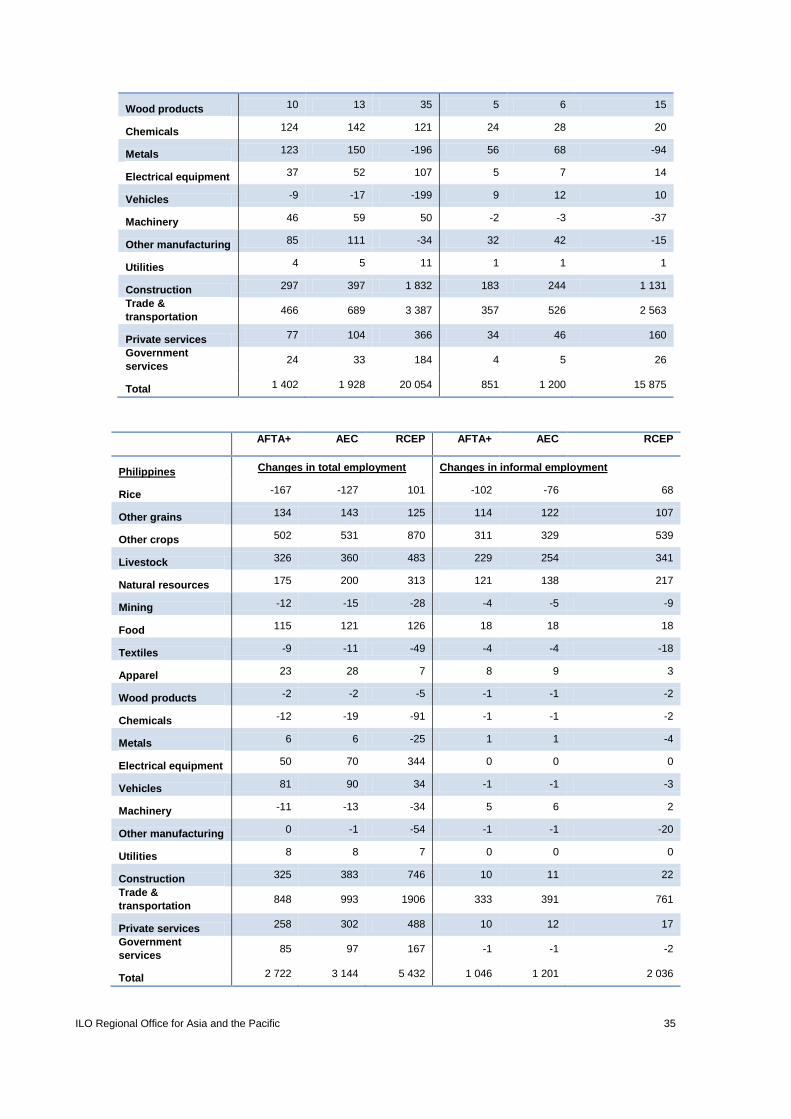
ILO Regional Office for Asia and the Pacific 35
Wood products 10 13 35 5 6 15
Chemicals 124 142 121 24 28 20
Metals 123 150 -196 56 68 -94
Electrical equipment 37 52 107 5 7 14
Vehicles -9 -17 -199 9 12 10
Machinery 46 59 50 -2 -3 -37
Other manufacturing 85 111 -34 32 42 -15
Utilities 4 5 11 1 1 1
Construction 297 397 1 832 183 244 1 131
Trade &
transportation 466 689 3 387 357 526 2 563
Private services 77 104 366 34 46 160
Government
services 24 33 184 4 5 26
Total 1 402 1 928 20 054 851 1 200 15 875
AFTA+ AEC RCEP AFTA+ AEC RCEP
Philippines Changes in total employment Changes in informal employment
Rice -167 -127 101 -102 -76 68
Other grains 134 143 125 114 122 107
Other crops 502 531 870 311 329 539
Livestock 326 360 483 229 254 341
Natural resources 175 200 313 121 138 217
Mining -12 -15 -28 -4 -5 -9
Food 115 121 126 18 18 18
Textiles -9 -11 -49 -4 -4 -18
Apparel 23 28 7 8 9 3
Wood products -2 -2 -5 -1 -1 -2
Chemicals -12 -19 -91 -1 -1 -2
Metals 6 6 -25 1 1 -4
Electrical equipment 50 70 344 0 0 0
Vehicles 81 90 34 -1 -1 -3
Machinery -11 -13 -34 5 6 2
Other manufacturing 0 -1 -54 -1 -1 -20
Utilities 8 8 7 0 0 0
Construction 325 383 746 10 11 22
Trade &
transportation 848 993 1906 333 391 761
Private services 258 302 488 10 12 17
Government
services 85 97 167 -1 -1 -2
Total 2 722 3 144 5 432 1 046 1 201 2 036

36 ILO Regional Office for Asia and the Pacific
AFTA+ AEC RCEP AFTA+ AEC RCEP
Thailand Changes in total employment Changes in informal employment
Rice 246 273 564 212 235 485
Other grains 150 152 194 128 131 166
Other crops 442 510 1 623 380 439 1 393
Livestock 201 234 724 151 175 540
Natural resources 41 52 161 29 37 115
Mining 0 -1 0 0 0 0
Food 142 161 562 27 31 108
Textiles 3 3 -75 1 1 -22
Apparel -47 -52 -171 -12 -13 -44
Wood products 0 -1 -7 0 0 -2
Chemicals 61 67 166 5 5 13
Metals 36 41 -32 5 5 -4
Electrical equipment 36 58 231 0 0 1
Vehicles 125 156 109 3 4 6
Machinery 84 104 164 2 2 1
Other manufacturing -16 -18 -84 -3 -3 -15
Utilities 4 5 11 0 0 0
Construction 197 251 522 13 17 36
Trade &
transportation 312 413 594 217 287 419
Private services -154 -192 -334 -43 -53 -92
Government
services -5 -2 -13 -1 -1 -2
Total 1 857 2 215 4 907 1 114 1 298 3 101
AFTA+ AEC RCEP AFTA+ AEC RCEP
Viet Nam Changes in total employment Changes in informal employment
Rice 1 196 1 280 2 320 1 106 1 184 2 146
Other grains -19 -19 -45 -18 -18 -41
Other crops 200 203 803 186 189 744
Livestock 323 369 884 318 363 870
Natural resources 121 146 349 91 110 262
Mining 11 8 -20 5 4 -2
Food 88 86 -18 24 23 -25
Textiles 45 54 134 13 15 37
Apparel 332 381 2 657 66 76 524
Wood products -6 -8 -63 -3 -4 -34
Chemicals 33 40 30 3 3 3
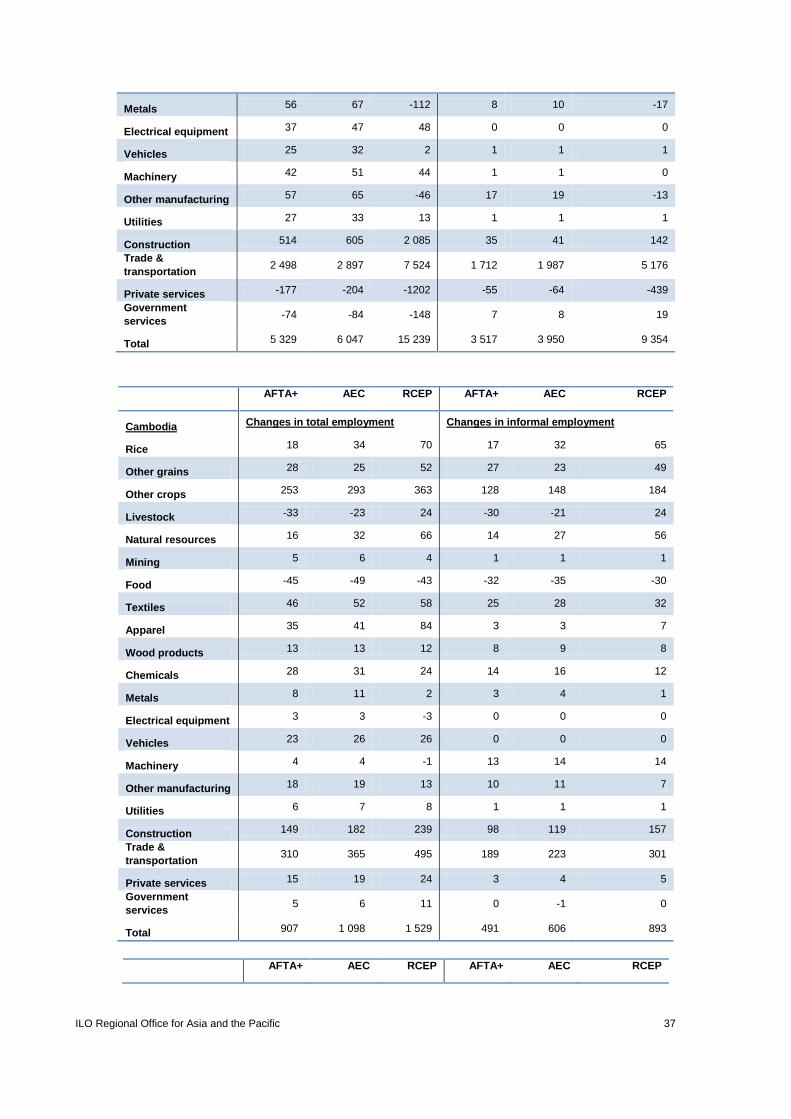
ILO Regional Office for Asia and the Pacific 37
Metals 56 67 -112 8 10 -17
Electrical equipment 37 47 48 0 0 0
Vehicles 25 32 2 1 1 1
Machinery 42 51 44 1 1 0
Other manufacturing 57 65 -46 17 19 -13
Utilities 27 33 13 1 1 1
Construction 514 605 2 085 35 41 142
Trade &
transportation 2 498 2 897 7 524 1 712 1 987 5 176
Private services -177 -204 -1202 -55 -64 -439
Government
services -74 -84 -148 7 8 19
Total 5 329 6 047 15 239 3 517 3 950 9 354
AFTA+ AEC RCEP AFTA+ AEC RCEP
Cambodia Changes in total employment Changes in informal employment
Rice 18 34 70 17 32 65
Other grains 28 25 52 27 23 49
Other crops 253 293 363 128 148 184
Livestock -33 -23 24 -30 -21 24
Natural resources 16 32 66 14 27 56
Mining 5 6 4 1 1 1
Food -45 -49 -43 -32 -35 -30
Textiles 46 52 58 25 28 32
Apparel 35 41 84 3 3 7
Wood products 13 13 12 8 9 8
Chemicals 28 31 24 14 16 12
Metals 8 11 2 3 4 1
Electrical equipment 3 3 -3 0 0 0
Vehicles 23 26 26 0 0 0
Machinery 4 4 -1 13 14 14
Other manufacturing 18 19 13 10 11 7
Utilities 6 7 8 1 1 1
Construction 149 182 239 98 119 157
Trade &
transportation 310 365 495 189 223 301
Private services 15 19 24 3 4 5
Government
services 5 6 11 0 -1 0
Total 907 1 098 1 529 491 606 893
AFTA+ AEC RCEP AFTA+ AEC RCEP

38 ILO Regional Office for Asia and the Pacific
Lao PDR Changes in total employment Changes in informal employment
Rice 73 94 151 72 94 150
Other grains 15 14 55 15 14 55
Other crops -62 -68 -42 -59 -64 -39
Livestock -32 -36 -28 -32 -36 -28
Natural resources 48 46 65 43 42 59
Mining 1 2 3 0 0 1
Food -48 -55 -52 -35 -40 -38
Textiles -3 -3 -4 -3 -3 -4
Apparel 5 6 3 2 2 1
Wood products 15 15 17 8 8 9
Chemicals 0 0 2 0 0 1
Metals 19 26 6 9 13 3
Electrical equipment 0 0 0 0 0 0
Vehicles 30 31 22 0 0 0
Machinery 7 7 5 6 6 4
Other manufacturing -2 -2 -4 -1 -1 -2
Utilities 2 2 8 0 0 1
Construction 7 8 10 2 2 3
Trade &
transportation 24 30 38 21 27 33
Private services 17 20 40 9 11 20
Government
services -7 -8 -8 0 0 0
Total 108 130 288 58 75 229
Source: CGE model simulations.
Table 13. Effects on sector value added (% change from baseline, 2025)
AFTA+ AEC RCEP AFTA+ AEC RCEP
Indonesia Viet Nam
Rice 0.5 1.0 19.5 20.8 22.5 46.2
Other grains -4.1 -4.6 48.4 -8.3 -7.9 -18.8
Other crops 2.0 2.2 39.3 5.2 5.6 20.0
Livestock 0.6 1.0 44.0 14.4 16.5 43.3
Natural resources 1.2 1.7 22.7 6.4 7.7 20.5
Mining 3.5 4.0 3.3 11.5 11.5 17.7
Food -6.5 -7.3 80.3 8.9 9.6 20.6
Textiles 7.1 8.4 -15.7 19.1 22.5 74.8
Apparel 2.7 2.9 -20.5 18.6 21.5 157.5
Wood products 2.3 2.9 11.6 6.2 7.0 4.6
Chemicals 4.6 5.4 7.9 14.5 17.6 31.9
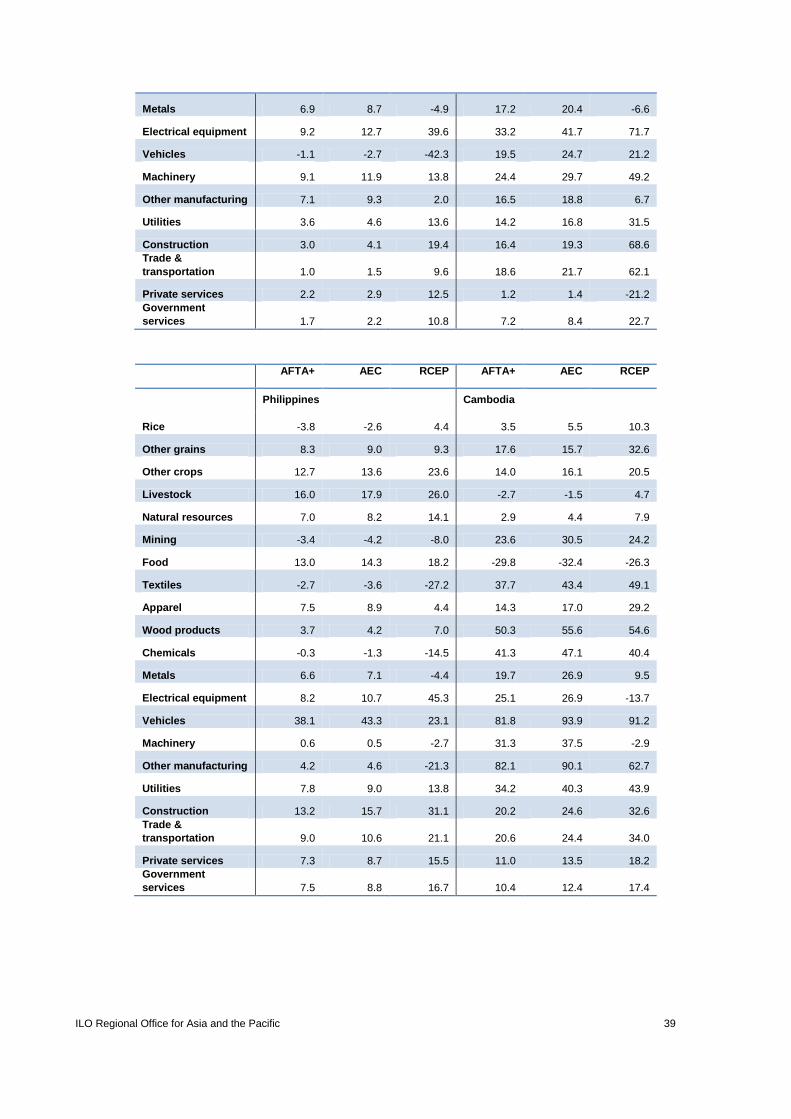
ILO Regional Office for Asia and the Pacific 39
Metals 6.9 8.7 -4.9 17.2 20.4 -6.6
Electrical equipment 9.2 12.7 39.6 33.2 41.7 71.7
Vehicles -1.1 -2.7 -42.3 19.5 24.7 21.2
Machinery 9.1 11.9 13.8 24.4 29.7 49.2
Other manufacturing 7.1 9.3 2.0 16.5 18.8 6.7
Utilities 3.6 4.6 13.6 14.2 16.8 31.5
Construction 3.0 4.1 19.4 16.4 19.3 68.6
Trade &
transportation 1.0 1.5 9.6 18.6 21.7 62.1
Private services 2.2 2.9 12.5 1.2 1.4 -21.2
Government
services 1.7 2.2 10.8 7.2 8.4 22.7
AFTA+ AEC RCEP AFTA+ AEC RCEP
Philippines Cambodia
Rice -3.8 -2.6 4.4 3.5 5.5 10.3
Other grains 8.3 9.0 9.3 17.6 15.7 32.6
Other crops 12.7 13.6 23.6 14.0 16.1 20.5
Livestock 16.0 17.9 26.0 -2.7 -1.5 4.7
Natural resources 7.0 8.2 14.1 2.9 4.4 7.9
Mining -3.4 -4.2 -8.0 23.6 30.5 24.2
Food 13.0 14.3 18.2 -29.8 -32.4 -26.3
Textiles -2.7 -3.6 -27.2 37.7 43.4 49.1
Apparel 7.5 8.9 4.4 14.3 17.0 29.2
Wood products 3.7 4.2 7.0 50.3 55.6 54.6
Chemicals -0.3 -1.3 -14.5 41.3 47.1 40.4
Metals 6.6 7.1 -4.4 19.7 26.9 9.5
Electrical equipment 8.2 10.7 45.3 25.1 26.9 -13.7
Vehicles 38.1 43.3 23.1 81.8 93.9 91.2
Machinery 0.6 0.5 -2.7 31.3 37.5 -2.9
Other manufacturing 4.2 4.6 -21.3 82.1 90.1 62.7
Utilities 7.8 9.0 13.8 34.2 40.3 43.9
Construction 13.2 15.7 31.1 20.2 24.6 32.6
Trade &
transportation 9.0 10.6 21.1 20.6 24.4 34.0
Private services 7.3 8.7 15.5 11.0 13.5 18.2
Government
services 7.5 8.8 16.7 10.4 12.4 17.4
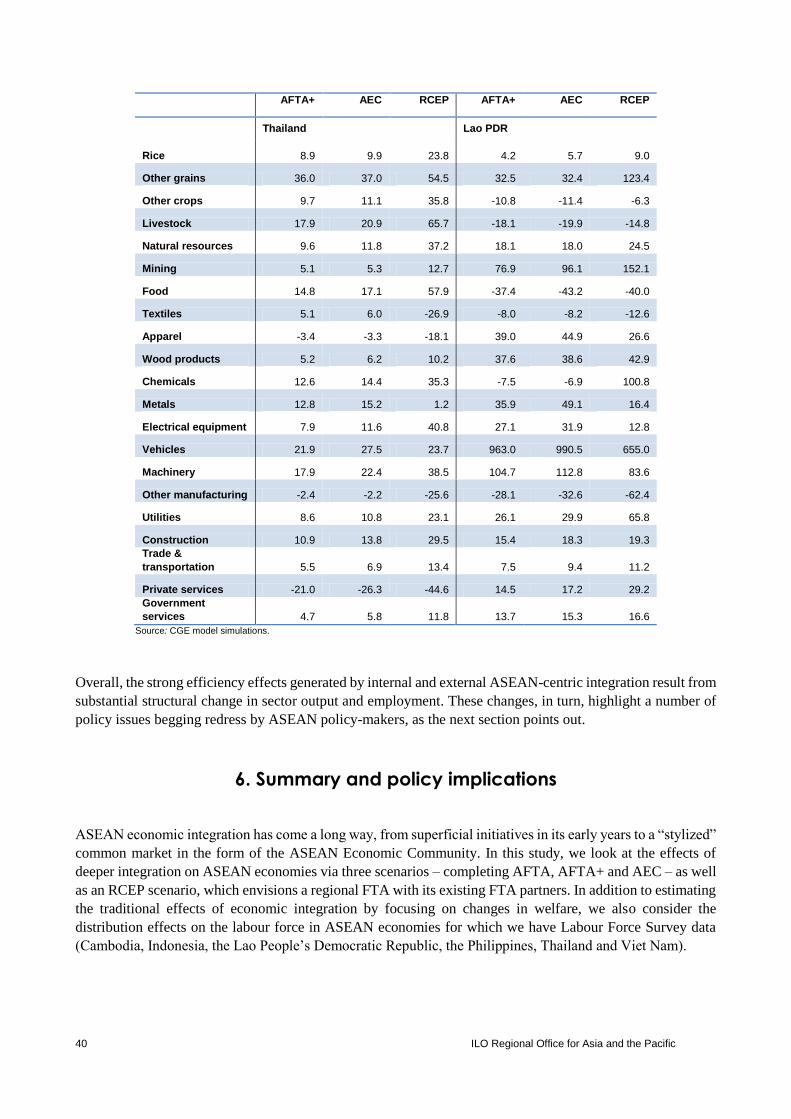
40 ILO Regional Office for Asia and the Pacific
AFTA+ AEC RCEP AFTA+ AEC RCEP
Thailand Lao PDR
Rice 8.9 9.9 23.8 4.2 5.7 9.0
Other grains 36.0 37.0 54.5 32.5 32.4 123.4
Other crops 9.7 11.1 35.8 -10.8 -11.4 -6.3
Livestock 17.9 20.9 65.7 -18.1 -19.9 -14.8
Natural resources 9.6 11.8 37.2 18.1 18.0 24.5
Mining 5.1 5.3 12.7 76.9 96.1 152.1
Food 14.8 17.1 57.9 -37.4 -43.2 -40.0
Textiles 5.1 6.0 -26.9 -8.0 -8.2 -12.6
Apparel -3.4 -3.3 -18.1 39.0 44.9 26.6
Wood products 5.2 6.2 10.2 37.6 38.6 42.9
Chemicals 12.6 14.4 35.3 -7.5 -6.9 100.8
Metals 12.8 15.2 1.2 35.9 49.1 16.4
Electrical equipment 7.9 11.6 40.8 27.1 31.9 12.8
Vehicles 21.9 27.5 23.7 963.0 990.5 655.0
Machinery 17.9 22.4 38.5 104.7 112.8 83.6
Other manufacturing -2.4 -2.2 -25.6 -28.1 -32.6 -62.4
Utilities 8.6 10.8 23.1 26.1 29.9 65.8
Construction 10.9 13.8 29.5 15.4 18.3 19.3
Trade &
transportation 5.5 6.9 13.4 7.5 9.4 11.2
Private services -21.0 -26.3 -44.6 14.5 17.2 29.2
Government
services 4.7 5.8 11.8 13.7 15.3 16.6
Source: CGE model simulations.
Overall, the strong efficiency effects generated by internal and external ASEAN-centric integration result from
substantial structural change in sector output and employment. These changes, in turn, highlight a number of
policy issues begging redress by ASEAN policy-makers, as the next section points out.
6. Summary and policy implications
ASEAN economic integration has come a long way, from superficial initiatives in its early years to a “stylized”
common market in the form of the ASEAN Economic Community. In this study, we look at the effects of
deeper integration on ASEAN economies via three scenarios – completing AFTA, AFTA+ and AEC – as well
as an RCEP scenario, which envisions a regional FTA with its existing FTA partners. In addition to estimating
the traditional effects of economic integration by focusing on changes in welfare, we also consider the
distribution effects on the labour force in ASEAN economies for which we have Labour Force Survey data
(Cambodia, Indonesia, the Lao People’s Democratic Republic, the Philippines, Thailand and Viet Nam).
ILO Regional Office for Asia and the Pacific 41
In general, we estimate impressive welfare and export gains from deepening and expanding economic
cooperation. These gains are larger than those estimated in other studies because our approach – under the
assumption of persistent unemployment for some categories of labour – also models how overall employment
would increase as liberalization improves the competitiveness of ASEAN economies. All ASEAN economies
benefit in the AEC and RCEP scenarios; overall income growth is estimated to rise by 8 per cent and 18.4 per
cent, respectively, at the aggregate ASEAN level, and export growth mirrors these gains. We also estimate
significant increases in wages and employment, depending on the scenario, with the AEC and RCEP scenarios
generating the largest effects.
Results on wages and other factor returns vary across broad factors (labour, capital and land) and for labour
across skill levels and by gender. In particular, in terms of this latter point, in Indonesia, the Lao People’s
Democratic Republic and Thailand, the increase in men’s wages exceeds those of women in every policy
scenario. Although labour always gains, so do the returns to capital and, in most scenarios and countries, to
land. In addition, skilled labour usually benefits more than semi-skilled labour, which in turn gains relative to
unskilled labour. Taken together, these results suggest that the “pie” will become much bigger with these
initiatives, but lower-wage workers will feel the benefits through better access to employment rather than
higher wages.
The structural changes driving these results could also have an important effect on informality. In the AEC
and RCEP scenarios, the rise in sector employment tends to be dominated by increasing jobs in the informal
sectors, with the exception of the Philippines. At the country level, informal jobs account for almost two-thirds
of the impressive growth in total employment in Viet Nam under the AEC scenario and more than three-fourths
of employment growth in Indonesia under the RCEP scenario. These results reflect the fact that semi-skilled
and unskilled workers, whose employment expands, are often employed in the informal sectors. Thus, the rise
in employment, although a key positive aspect of ASEAN internal and external integration, could result in the
growth of the more precarious segments of ASEAN labour markets.
Even though we expect these initiatives to generate large returns to ASEAN countries and to labour overall, it
is important for governments to take into account the mixed effects on the distribution of these gains and act
accordingly to ensure that the benefits are fairly spread and that the “winners” will compensate the “losers”.
An extensive analysis of the options that might be pursued to create adequate compensation mechanisms is
beyond the scope of this study (see, for example, proposals in ILO and WTO, 2007; OECD, 2012), our results
underscore a strong case for active government policies that smooth structural change and minimize
unemployment of resources (efficiency grounds), compensate losers (equity grounds) and reassure the people
of ASEAN that economic integration is not only pro-growth but pro-poor (political-economy grounds). Thus,
establishing effective social safety nets, including social protection floors, which in most ASEAN countries
tend to be underdeveloped, need to be imperative priorities as ASEAN deepens its integration internally and
externally.
The leaders of ASEAN countries understand this point, as evidenced by their placing such a strong priority on
closing development gaps and creating an equitable economic region. The fact that the ASEAN Community
is composed of the Economic Community, the Political-Security Community and the Socio-Cultural
Community pillars also testifies to their recognition of interdependence and the priority that needs to be placed
on inclusive growth. Our results demonstrate that deepening economic integration and cooperation will boost
growth and development and are certainly worthwhile initiatives, but they need to be accompanied by effective,

42 ILO Regional Office for Asia and the Pacific
complementary measures to ensure a widespread sharing of the attendant gains as well as political
sustainability of these initiatives.

ILO Regional Office for Asia and the Pacific 43
References
Asian Development Bank (ADB). 2008. “Integrating production”, in Emerging Asian regionalism:
Partnership for shared prosperity (Manila), pp. 58–105.
Asian Development Bank Institute (ADBI). 2014. ASEAN 2030: Toward a borderless economic community
(Tokyo). Available at: www.adbi.org/files/2014.07.18.book.asean.2030.borderless.economic.community.pdf
[16 Sep. 2014].
Brooks, D.H.; Roland-Holst, D.; Zhai, F. 2005. “Asia’s long-term growth and integration: Reaching beyond
trade policy barriers”, in ADB ERD Policy Brief No. 38, Sep. 2005.
Cecchini, P. 1988. The costs of non-Europe (Brussels, European Commission).
Chia, S.Y.; Plummer, M.G. forthcoming 2014. ASEAN economic cooperation and integration: Progress,
challenges and future directions (Cambridge, Cambridge University Press).
de Dios, L.C. 2006. An investigation into the measures affecting the integration of ASEAN’s priority sectors
(phase 2): Overview: Non-tariff barriers to trade in the ASEAN priority goods sectors, REPSF Project No.
06/001a.
Hertel, T.; Walmsley, T.; Itakura, K. 2001. “Dynamic effects of the ‘new age’ free trade agreement between
Japan and Singapore”, in Journal of Economic Integration, Vol. 16, No. 4, pp. 446–484.
International Labour Organization; World Trade Organization. Trade and employment: Challenges for policy
research (Geneva). Available at: www.ilo.org/wcmsp5/groups/public/---dgreports/---dcomm/---
publ/documents/publication/wcms_091038.pdf [22 Sep. 2014].
Lippoldt, D. (ed.). 2012. Policy priorities for international trade and jobs (Paris, OECD). Available at:
http://www.oecd.org/site/tadicite/50258009.pdf [24 Sep. 2014].
Organisation for Economic Co-operation and Development. Available at: www.oecd.org/site/tadicite/ [22 Sep.
2014].
Melitz, M.J. 2003. “The impact of trade on intra-industry reallocations and aggregate industry productivity”,
in Econometrica, Vol. 71, No. 6, pp. 1695–1725.
Naya, S.; Plummer, M.G. 1991. "ASEAN economic cooperation in the new international economic
environment", in ASEAN Economic Bulletin, Vol. 7, No. 3, Mar., pp. 261–276.
Petri, P.A.; Plummer, M.G.; Zhai, F. 2012. The Trans-Pacific partnership and Asia–Pacific integration: A
quantitative assessment (Washington, DC, Peterson Institute for International Economics).
Plummer, M.G.; Chia, S.Y. (eds.). 2009. Realizing the ASEAN Economic Community: A comprehensive
assessment (Singapore, Institute of Southeast Asian Studies).
Shimizu, K. 1999. “The proposal and implementation of the brand-to-brand complementation scheme: Intra-
ASEAN Economic Cooperation 1987–1995”, in Economic Journal of Hokkaido University, Vol. 28, pp. 95–
116. Available at: http://eprints.lib.hokudai.ac.jp/dspace/bitstream/2115/30578/1/28_P95-116.pdf [22 Sep.
2014].

44 ILO Regional Office for Asia and the Pacific
Shoven, J.B.; Whalley, J. 1992. Applying general equilibrium (Cambridge, Cambridge University Press).
van der Mensbrugghe, D. 2005. “LINKAGE technical reference document: Version 6.0”, mimeo, (Washington,
DC, World Bank).
Wilson, J.; Shepherd, B. 2008. Trade facilitation in ASEAN: Measuring progress and assessing priorities,
World Bank Policy Research Working Paper (Washington, DC, World Bank). Available at:
www.worldbank.org [22 Sep. 2014].
Zhai, F. 2008. “Armington meets Melitz: Introducing firm heterogeneity in a global CGE model of trade”, in
Journal of Economic Integration, Vol. 23, No. 3, Sep., pp. 575–604.
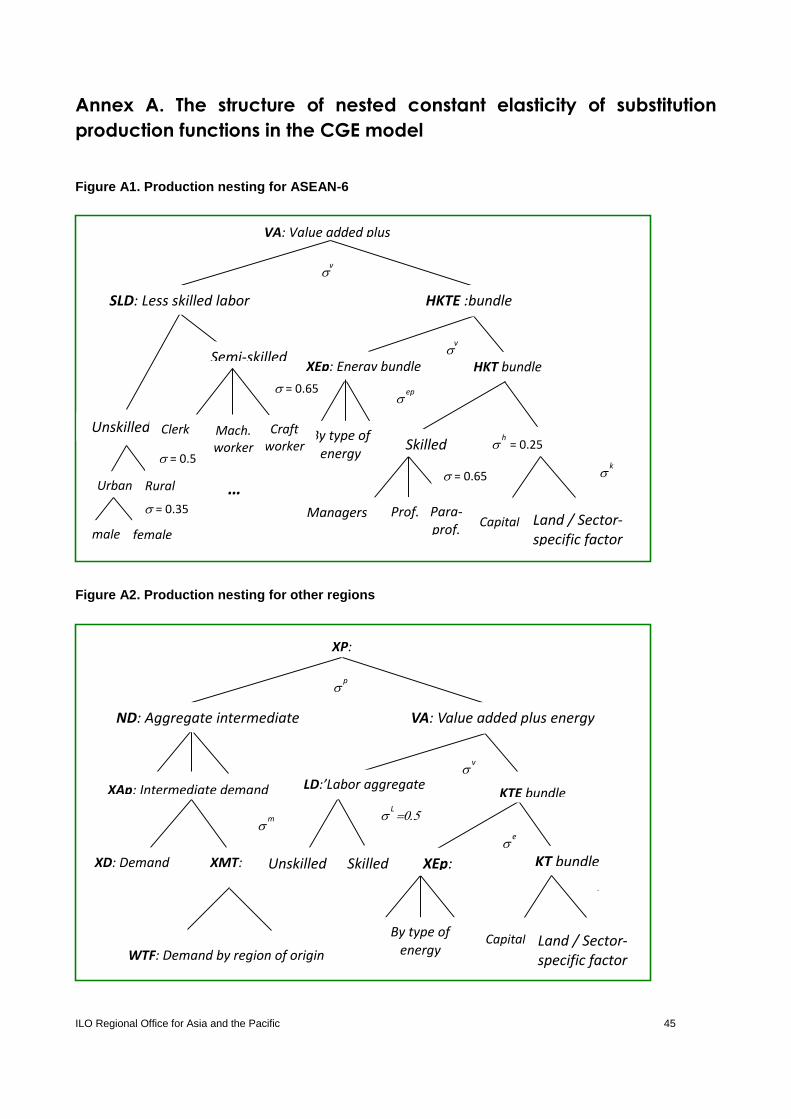
ILO Regional Office for Asia and the Pacific 45
Annex A. The structure of nested constant elasticity of substitution
production functions in the CGE model
Figure A1. Production nesting for ASEAN-6
Figure A2. Production nesting for other regions
VA: Value added plus energy
SLD: Less skilled labor aggregate
HKTE :bundle
XEp: Energy bundle
Unskilled
Semi-skilled HKT bundle
KT Skilled labor
Managers
v
Land / Sector-specific factor
h = 0.25
k
ep
=
Capital
Urban Rural
male female
By type of energy
Clerk Mach.
Craft worker
Mach. worker
…
…
Prof. Para-prof.
= 0.65
= 0.5
= 0.35
= 0.65
XP:
Output
ND: Aggregate intermediate demand
VA: Value added plus energy
XAp: Intermediate demand
XD: Demand for domestic
XMT: Aggregate
WTF: Demand by region of origin
LD:’Labor aggregate
Unskilled Skilled
KTE bundle
KT bundle XEp: Energy
By type of energy
p
Land / Sector-specific factor
v
e
k
m
w
L
= 0
Capital
v

46 ILO Regional Office for Asia and the Pacific
Annex B. Welfare effects on an annual basis, 2010–25, by country and scenario Table B1. Welfare effects relative to the baseline, estimated value 2010–25 ($ billion, 2007 prices)
2010 2011 2012 2013 2014 2015 2016 2017 2018 2019 2020 2012 2022 2023 2024 2025
AFTA
Australia 0.0 0.0 0.0 0.0 -0.1 -0.1 -0.1 -0.1 -0.1 0.0 0.0 0.0 0.0 0.0 0.0 0.0
New Zealand 0.0 0.0 0.0 0.0 0.0 0.0 0.0 0.0 0.0 0.0 0.0 0.0 0.0 0.0 0.0 0.0
China 0.0 -0.2 -0.3 -0.5 -0.8 -1.2 -1.4 -1.6 -1.8 -2.1 -2.3 -2.6 -2.9 -3.1 -3.4 -3.7
China, Hong
Kong 0.0 0.0 0.0 0.0 0.0 0.0 0.0 0.0 0.0 0.0 0.0 0.0 0.0 0.0 0.0 0.0
Japan -0.1 -0.1 -0.3 -0.4 -0.6 -0.9 -0.9 -1.0 -1.1 -1.2 -1.2 -1.3 -1.4 -1.4 -1.5 -1.6
Korea, Rep. of 0.0 -0.1 -0.1 -0.1 -0.2 -0.3 -0.3 -0.3 -0.3 -0.4 -0.4 -0.4 -0.4 -0.4 -0.4 -0.4
China, Taiwan 0.0 0.0 -0.1 -0.1 -0.2 -0.2 -0.3 -0.3 -0.3 -0.3 -0.4 -0.4 -0.4 -0.4 -0.5 -0.5
Indonesia 0.2 0.4 0.7 1.0 1.5 2.1 2.3 2.6 2.8 3.1 3.4 3.7 4.0 4.3 4.6 4.9
Malaysia 0.1 0.4 0.7 1.1 1.7 2.6 3.0 3.4 3.9 4.3 4.8 5.3 5.9 6.4 6.9 7.5
Philippines 0.1 0.3 0.6 1.0 1.9 3.3 3.9 4.5 5.2 5.9 6.6 7.4 8.2 9.1 10.0 11.0
Singapore 0.2 0.4 0.8 1.1 1.8 2.5 2.8 3.0 3.3 3.6 3.9 4.1 4.4 4.7 4.9 5.2
Thailand 0.2 0.6 1.1 1.7 2.4 3.0 3.4 4.0 4.6 5.2 5.8 6.4 6.9 7.6 8.3 9.0
Viet Nam 0.1 0.2 0.4 0.7 1.0 1.4 1.6 1.7 1.9 2.1 2.3 2.5 2.7 2.9 3.1 3.3
Cambodia 0.0 0.0 0.0 0.1 0.1 0.2 0.3 0.3 0.4 0.4 0.5 0.6 0.7 0.7 0.9 1.0
Lao PDR 0.0 0.0 0.0 0.0 0.0 0.0 0.1 0.1 0.1 0.1 0.1 0.1 0.1 0.2 0.2 0.2
Rest of ASEAN 0.0 0.0 0.0 0.0 0.0 0.0 -0.1 -0.1 -0.1 -0.1 -0.2 -0.2 -0.2 -0.3 -0.3 -0.3
India 0.0 -0.1 -0.1 -0.2 -0.2 -0.3 -0.4 -0.4 -0.5 -0.6
Canada 0.0 0.0 0.0 0.0 0.0 0.0 0.0 0.0 0.0 0.0 0.0 0.0 0.0 0.0 0.0 0.0
USA 0.0 0.0 0.0 0.0 -0.1 -0.1 -0.2 -0.2 -0.2 -0.2 -0.2 -0.2 -0.2 -0.2 -0.2 -0.2
Europe 0.0 0.0 -0.1 -0.1 -0.1 -0.1 -0.1 -0.1 0.0 0.0 0.0 0.0 0.1 0.1 0.2 0.2

Regional Office for Asia and the Pacific 47
Rest of the
world 0.0 -0.1 -0.1 -0.2 -0.3 -0.4 -0.5 -0.6 -0.6 -0.7 -0.7 -0.8 -0.8 -0.8 -0.9 -0.9
ASEAN 0.9 2.4 4.2 6.6 10.4 15.1 17.2 19.5 22.0 24.5 27.2 29.9 32.6 35.6 38.6 41.7
2010 2011 2012 2013 2014 2015 2016 2017 2018 2019 2020 2012 2022 2023 2024 2025
AFTA+
Australia -0.1 -0.2 -0.2 -0.2 -0.3 -0.3 -0.3 -0.3 -0.2 -0.2 -0.2 -0.1 -0.1 -0.1 0.0 0.0
New Zealand 0.0 0.0 0.0 0.0 0.0 -0.1 -0.1 -0.1 -0.1 -0.1 -0.1 0.0 0.0 0.0 0.0 0.0
China -2.3 -3.6 -5.2 -6.8 -8.9 -11.2 -12.6 -14.1 -15.5 -16.9 -18.4 -19.8 -21.3 -22.6 -24.0 -25.3
China, Hong
Kong -0.1 -0.1 -0.2 -0.2 -0.2 -0.3 -0.3 -0.3 -0.2 -0.2 -0.2 -0.2 -0.2 -0.2 -0.2 -0.1
Japan -0.8 -1.2 -1.7 -2.1 -2.7 -3.4 -3.6 -3.8 -3.9 -4.0 -4.2 -4.3 -4.5 -4.6 -4.7 -4.8
Korea, Rep. of -0.7 -1.1 -1.5 -1.9 -2.4 -3.0 -3.1 -3.2 -3.3 -3.4 -3.5 -3.6 -3.7 -3.8 -3.8 -3.9
China, Taiwan -0.5 -0.8 -1.0 -1.3 -1.7 -2.1 -2.3 -2.5 -2.7 -2.9 -3.0 -3.2 -3.4 -3.5 -3.7 -3.8
Indonesia 2.8 4.6 6.8 9.2 12.2 15.6 17.8 20.2 22.7 25.2 27.9 30.7 33.5 36.4 39.5 42.5
Malaysia 3.4 5.2 7.4 9.8 12.8 16.5 18.6 20.8 23.1 25.3 27.7 30.0 32.4 34.7 37.1 39.4
Philippines 1.3 2.1 3.2 4.6 6.6 9.6 11.2 12.9 14.7 16.6 18.5 20.6 22.8 25.0 27.4 29.8
Singapore 2.9 4.4 6.1 7.9 10.1 12.6 13.9 15.2 16.5 17.7 19.0 20.3 21.5 22.7 23.8 24.9
Thailand 3.6 5.6 8.2 10.7 13.9 17.0 18.9 21.0 23.3 25.6 27.9 30.0 32.3 34.6 37.0 39.3
Viet Nam 3.0 4.7 6.5 8.3 10.4 12.9 14.2 15.4 16.7 18.0 19.3 20.6 22.0 23.3 24.7 26.2
Cambodia 0.3 0.4 0.5 0.7 0.9 1.3 1.5 1.7 1.9 2.2 2.5 2.8 3.1 3.5 3.9 4.3
Lao PDR 0.1 0.2 0.2 0.3 0.4 0.6 0.7 0.7 0.8 0.9 1.0 1.1 1.2 1.3 1.4 1.5
Rest of ASEAN 0.1 0.2 0.3 0.3 0.4 0.5 0.6 0.7 0.8 0.9 1.0 1.1 1.2 1.3 1.5 1.6
India -0.7 -1.0 -1.4 -1.7 -2.2 -2.7 -3.0 -3.4 -3.8 -4.2
Canada 0.0 0.0 0.0 0.0 0.0 0.0 0.0 0.0 0.0 0.0 0.1 0.1 0.1 0.1 0.1 0.1
USA -0.2 -0.3 -0.3 -0.3 -0.4 -0.5 -0.4 -0.4 -0.3 -0.2 -0.1 -0.1 0.0 0.1 0.2 0.3

48 ILO Regional Office for Asia and the Pacific
Europe -0.6 -0.8 -0.9 -0.9 -0.9 -0.8 -0.7 -0.5 -0.3 -0.2 0.0 0.3 0.5 0.8 1.0 1.3
Rest of the
world -0.5 -0.7 -1.0 -1.3 -1.7 -2.1 -2.2 -2.3 -2.3 -2.3 -2.3 -2.2 -2.1 -2.0 -1.9 -1.8
ASEAN 17.5 27.3 39.1 51.8 67.7 86.5 97.2 108.6 120.4 132.5 144.7 157.1 169.9 182.9 196.1 209.5
2010 2011 2012 2013 2014 2015 2016 2017 2018 2019 2020 2012 2022 2023 2024 2025
AEC
Australia -0.1 -0.2 -0.2 -0.3 -0.3 -0.4 -0.3 -0.3 -0.3 -0.2 -0.2 -0.1 -0.1 0.0 0.0 0.1
New Zealand 0.0 0.0 0.0 0.0 0.0 -0.1 -0.1 -0.1 -0.1 -0.1 -0.1 0.0 0.0 0.0 0.0 0.0
China -2.5 -4.1 -6.0 -8.2 -10.9 -14.1 -15.9 -17.8 -19.7 -21.5 -23.4 -25.3 -27.2 -29.1 -30.9 -32.6
China, Hong
Kong -0.1 -0.1 -0.2 -0.2 -0.3 -0.3 -0.3 -0.3 -0.3 -0.3 -0.3 -0.2 -0.2 -0.2 -0.2 -0.2
Japan -0.9 -1.4 -1.9 -2.5 -3.3 -4.2 -4.4 -4.6 -4.8 -5.0 -5.2 -5.4 -5.5 -5.7 -5.9 -6.0
Korea, Rep. of -0.8 -1.3 -1.8 -2.4 -3.0 -3.8 -4.0 -4.1 -4.3 -4.4 -4.6 -4.7 -4.9 -5.0 -5.1 -5.2
China, Taiwan -0.5 -0.8 -1.2 -1.6 -2.1 -2.6 -2.9 -3.1 -3.3 -3.6 -3.8 -4.0 -4.3 -4.5 -4.7 -4.9
Indonesia 3.1 5.2 8.0 11.1 15.1 19.7 22.7 25.9 29.2 32.6 36.2 39.9 43.7 47.6 51.7 55.9
Malaysia 3.7 6.0 8.8 12.1 16.3 21.3 24.1 27.0 30.0 33.0 36.1 39.2 42.3 45.4 48.5 51.5
Philippines 1.3 2.3 3.5 5.1 7.5 11.0 12.9 14.9 17.0 19.2 21.5 24.0 26.5 29.2 32.0 34.9
Singapore 3.2 5.2 7.6 10.0 13.2 16.8 18.6 20.4 22.3 24.1 25.9 27.6 29.4 31.0 32.7 34.3
Thailand 3.9 6.4 9.5 12.8 16.9 21.3 23.8 26.4 29.4 32.3 35.1 37.9 40.8 43.8 46.9 49.9
Viet Nam 3.2 5.0 7.1 9.2 11.8 14.8 16.3 17.9 19.4 20.9 22.4 24.0 25.7 27.3 29.0 30.8
Cambodia 0.3 0.4 0.6 0.8 1.1 1.6 1.8 2.1 2.4 2.7 3.1 3.4 3.9 4.3 4.8 5.3
Lao PDR 0.1 0.2 0.3 0.4 0.5 0.7 0.8 0.9 1.0 1.1 1.2 1.4 1.5 1.6 1.7 1.9
Rest of ASEAN 0.2 0.2 0.3 0.4 0.5 0.6 0.7 0.9 1.0 1.1 1.3 1.4 1.6 1.8 1.9 2.1
India -0.7 -1.1 -1.6 -2.1 -2.7 -3.4 -3.8 -4.3 -4.7 -5.3 -5.8 -6.3 -6.9 -7.5 -8.1 -8.8
Canada 0.0 0.0 0.0 0.0 0.0 0.0 0.0 0.0 0.1 0.1 0.1 0.1 0.1 0.2 0.2 0.2

Regional Office for Asia and the Pacific 49
USA -0.2 -0.3 -0.4 -0.5 -0.7 -0.9 -0.8 -0.7 -0.6 -0.5 -0.4 -0.3 -0.1 0.0 0.1 0.3
Europe -0.6 -0.9 -1.1 -1.2 -1.3 -1.3 -1.1 -0.9 -0.7 -0.5 -0.2 0.1 0.4 0.7 1.0 1.4
Rest of the
world -0.5 -0.8 -1.1 -1.5 -1.9 -2.4 -2.5 -2.5 -2.4 -2.4 -2.2 -2.1 -1.9 -1.7 -1.5 -1.2
ASEAN 18.9 30.9 45.7 62.1 83.0 108.0 121.8 136.3 151.5 166.9 182.7 198.7 215.2 232.1 249.2 266.6
2010 2011 2012 2013 2014 2015 2016 2017 2018 2019 2020 2012 2022 2023 2024 2025
RCEP
Australia -0.1 -0.2 -0.2 -0.3 -0.3 -0.4 -0.3 3.5 6.7 10.8 15.7 22.0 26.3 29.1 32.1 35.2
New Zealand 0.0 0.0 0.0 0.0 0.0 -0.1 -0.1 0.6 1.1 1.8 2.7 3.8 4.5 4.9 5.3 5.8
China -2.5 -4.1 -6.0 -8.2 -10.9 -14.1 -15.9 12.8 43.8 85.0 129.1 182.4 227.7 253.8 280.1 306.8
China, Hong
Kong -0.1 -0.1 -0.2 -0.2 -0.3 -0.3 -0.3 5.1 10.8 18.5 26.6 37.0 44.8 48.8 52.9 57.0
Japan -0.9 -1.4 -1.9 -2.5 -3.3 -4.2 -4.4 14.6 27.3 42.7 60.0 79.6 91.1 98.1 105.2 112.5
Korea, Rep. of -0.8 -1.3 -1.8 -2.4 -3.0 -3.8 -4.0 13.1 26.6 43.5 62.8 85.5 99.3 105.8 112.3 118.8
China, Taiwan -0.5 -0.8 -1.2 -1.6 -2.1 -2.6 -2.9 -5.9 -8.6 -11.9 -15.5 -19.6 -22.7 -24.5 -26.3 -28.1
Indonesia 3.1 5.3 8.0 11.2 15.1 19.8 22.7 37.3 51.8 71.1 95.2 125.0 147.4 169.0 192.0 216.4
Malaysia 3.7 6.0 8.9 12.1 16.3 21.3 24.1 30.1 36.2 43.4 51.3 60.2 68.8 75.7 82.8 90.0
Philippines 1.3 2.3 3.5 5.1 7.5 11.0 12.9 15.8 19.3 23.3 27.9 33.2 39.0 44.4 50.0 56.0
Singapore 3.3 5.3 7.6 10.1 13.2 16.8 18.6 22.3 26.0 30.4 35.4 41.4 46.5 50.5 54.4 58.3
Thailand 3.9 6.4 9.5 12.8 17.0 21.4 23.8 30.4 36.6 43.9 52.0 61.3 70.0 77.1 84.3 91.6
Viet Nam 3.2 5.0 7.1 9.2 11.8 14.8 16.3 22.3 28.7 36.7 45.8 56.7 66.1 73.1 80.5 88.1
Cambodia 0.3 0.4 0.6 0.8 1.1 1.6 1.8 2.1 2.5 2.9 3.3 3.8 4.4 5.0 5.6 6.2
Lao PDR 0.1 0.2 0.3 0.4 0.5 0.7 0.8 0.9 1.0 1.1 1.3 1.4 1.6 1.7 1.9 2.0
Rest of ASEAN 0.2 0.2 0.3 0.4 0.5 0.6 0.7 1.0 1.3 1.7 2.2 3.2 4.0 4.8 5.7 6.6
Lao PDR -0.7 -1.1 -1.6 -2.1 -2.7 -3.4 -3.8 27.4 52.2 84.4 121.5 166.3 194.9 215.7 237.8 261.3
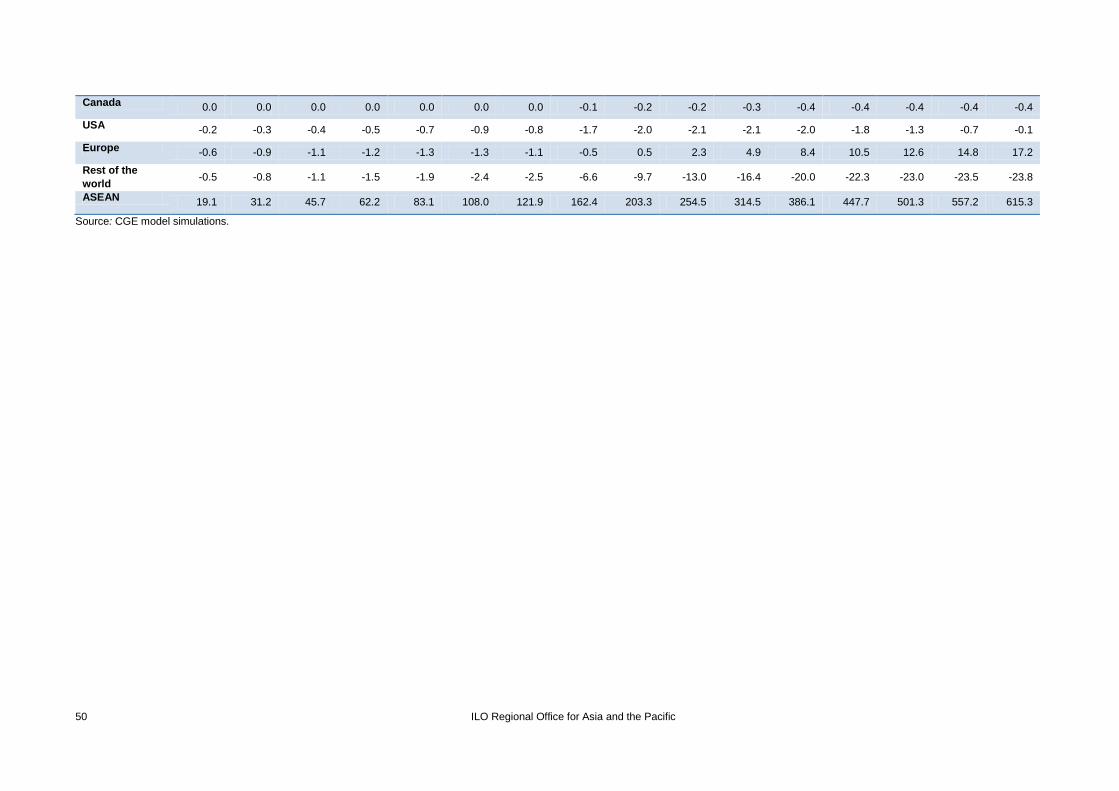
50 ILO Regional Office for Asia and the Pacific
Canada 0.0 0.0 0.0 0.0 0.0 0.0 0.0 -0.1 -0.2 -0.2 -0.3 -0.4 -0.4 -0.4 -0.4 -0.4
USA -0.2 -0.3 -0.4 -0.5 -0.7 -0.9 -0.8 -1.7 -2.0 -2.1 -2.1 -2.0 -1.8 -1.3 -0.7 -0.1
Europe -0.6 -0.9 -1.1 -1.2 -1.3 -1.3 -1.1 -0.5 0.5 2.3 4.9 8.4 10.5 12.6 14.8 17.2
Rest of the
world -0.5 -0.8 -1.1 -1.5 -1.9 -2.4 -2.5 -6.6 -9.7 -13.0 -16.4 -20.0 -22.3 -23.0 -23.5 -23.8
ASEAN 19.1 31.2 45.7 62.2 83.1 108.0 121.9 162.4 203.3 254.5 314.5 386.1 447.7 501.3 557.2 615.3
Source: CGE model simulations.

Regional Office for Asia and the Pacific 51
Table B2. Welfare effects relative to the baseline, 2010–25 (estimated value as % of baseline GDP)
2010 2011 2012 2013 2014 2015 2016 2017 2018 2019 2020 2012 2022 2023 2024 2025
AFTA
Australia 0.0 0.0 0.0 0.0 0.0 0.0 0.0 0.0 0.0 0.0 0.0 0.0 0.0 0.0 0.0 0.0
New Zealand 0.0 0.0 0.0 0.0 0.0 0.0 0.0 0.0 0.0 0.0 0.0 0.0 0.0 0.0 0.0 0.0
China 0.0 0.0 0.0 0.0 0.0 0.0 0.0 0.0 0.0 0.0 0.0 0.0 0.0 0.0 0.0 0.0
China, Hong
Kong 0.0 0.0 0.0 0.0 0.0 0.0 0.0 0.0 0.0 0.0 0.0 0.0 0.0 0.0 0.0 0.0
Japan 0.0 0.0 0.0 0.0 0.0 0.0 0.0 0.0 0.0 0.0 0.0 0.0 0.0 0.0 0.0 0.0
Rep. of Korea 0.0 0.0 0.0 0.0 0.0 0.0 0.0 0.0 0.0 0.0 0.0 0.0 0.0 0.0 0.0 0.0
China, Taiwan 0.0 0.0 0.0 0.0 0.0 0.0 0.0 0.0 -0.1 -0.1 -0.1 -0.1 -0.1 -0.1 -0.1 -0.1
Indonesia 0.0 0.1 0.1 0.2 0.2 0.3 0.3 0.3 0.3 0.3 0.4 0.4 0.4 0.4 0.4 0.4
Malaysia 0.1 0.2 0.3 0.4 0.6 0.9 1.0 1.1 1.1 1.2 1.3 1.4 1.4 1.5 1.5 1.6
Philippines 0.1 0.2 0.3 0.5 0.9 1.5 1.7 1.9 2.0 2.2 2.3 2.5 2.6 2.7 2.8 3.0
Singapore 0.1 0.2 0.3 0.5 0.7 1.0 1.1 1.1 1.2 1.2 1.3 1.3 1.4 1.4 1.4 1.4
Thailand 0.1 0.2 0.4 0.5 0.7 0.9 1.0 1.1 1.2 1.3 1.4 1.5 1.5 1.6 1.7 1.7
Viet Nam 0.1 0.3 0.4 0.6 0.9 1.2 1.2 1.3 1.3 1.4 1.4 1.5 1.5 1.5 1.6 1.6
Cambodia 0.1 0.2 0.4 0.5 0.9 1.5 1.7 1.9 2.0 2.2 2.4 2.6 2.8 2.9 3.1 3.3
Lao PDR 0.0 0.0 0.0 0.1 0.2 0.5 0.6 0.7 0.8 0.9 1.0 1.0 1.1 1.1 1.2 1.2
Rest of ASEAN 0.0 0.0 0.0 0.0 0.0 -0.1 -0.1 -0.2 -0.2 -0.3 -0.3 -0.3 -0.3 -0.4 -0.4 -0.4
India 0.0 0.0 0.0 0.0 0.0 0.0 0.0 0.0 0.0 0.0 0.0 0.0 0.0 0.0 0.0 0.0
Canada 0.0 0.0 0.0 0.0 0.0 0.0 0.0 0.0 0.0 0.0 0.0 0.0 0.0 0.0 0.0 0.0
USA 0.0 0.0 0.0 0.0 0.0 0.0 0.0 0.0 0.0 0.0 0.0 0.0 0.0 0.0 0.0 0.0
Europe 0.0 0.0 0.0 0.0 0.0 0.0 0.0 0.0 0.0 0.0 0.0 0.0 0.0 0.0 0.0 0.0
Rest of the
world 0.0 0.0 0.0 0.0 0.0 0.0 0.0 0.0 0.0 0.0 0.0 0.0 0.0 0.0 0.0 0.0
ASEAN 0.1 0.1 0.3 0.4 0.6 0.8 0.8 0.9 0.9 1.0 1.1 1.1 1.1 1.2 1.2 1.2

52 ILO Regional Office for Asia and the Pacific
2010 2011 2012 2013 2014 2015 2016 2017 2018 2019 2020 2012 2022 2023 2024 2025
AFTA+
Australia 0.0 0.0 0.0 0.0 0.0 0.0 0.0 0.0 0.0 0.0 0.0 0.0 0.0 0.0 0.0 0.0
New Zealand 0.0 0.0 0.0 0.0 0.0 0.0 0.0 0.0 0.0 0.0 0.0 0.0 0.0 0.0 0.0 0.0
China 0.0 -0.1 -0.1 -0.1 -0.1 -0.2 -0.2 -0.2 -0.2 -0.2 -0.2 -0.2 -0.2 -0.2 -0.2 -0.2
China, Hong
Kong 0.0 -0.1 -0.1 -0.1 -0.1 -0.1 -0.1 -0.1 -0.1 -0.1 -0.1 -0.1 -0.1 0.0 0.0 0.0
Japan 0.0 0.0 0.0 0.0 -0.1 -0.1 -0.1 -0.1 -0.1 -0.1 -0.1 -0.1 -0.1 -0.1 -0.1 -0.1
Rep. of Korea -0.1 -0.1 -0.1 -0.1 -0.2 -0.2 -0.2 -0.2 -0.2 -0.2 -0.2 -0.2 -0.2 -0.2 -0.2 -0.2
China, Taiwan -0.1 -0.2 -0.2 -0.3 -0.3 -0.4 -0.4 -0.4 -0.4 -0.5 -0.5 -0.5 -0.5 -0.5 -0.5 -0.5
Indonesia 0.6 0.8 1.2 1.5 1.8 2.2 2.4 2.5 2.7 2.8 2.9 3.0 3.1 3.2 3.2 3.3
Malaysia 1.5 2.2 2.9 3.7 4.6 5.7 6.1 6.5 6.8 7.1 7.4 7.7 7.9 8.1 8.2 8.4
Philippines 0.8 1.2 1.7 2.3 3.2 4.4 4.9 5.3 5.8 6.2 6.5 6.9 7.2 7.5 7.8 8.1
Singapore 1.4 2.0 2.8 3.5 4.2 5.1 5.4 5.7 5.9 6.1 6.3 6.5 6.7 6.8 6.9 7.0
Thailand 1.3 2.1 2.8 3.5 4.3 5.1 5.4 5.8 6.1 6.4 6.7 6.9 7.1 7.3 7.5 7.6
Viet Nam 3.3 4.8 6.3 7.6 9.1 10.7 11.2 11.5 11.8 12.1 12.2 12.4 12.5 12.5 12.5 12.5
Cambodia 2.5 3.5 4.5 5.6 7.0 8.9 9.6 10.2 10.9 11.5 12.1 12.6 13.1 13.6 14.1 14.5
Lao PDR 2.0 2.8 3.7 4.6 5.7 7.2 7.5 7.9 8.2 8.5 8.7 8.9 9.0 9.1 9.2 9.2
Rest of ASEAN 0.4 0.6 0.7 0.9 1.0 1.1 1.2 1.3 1.4 1.5 1.6 1.7 1.8 1.9 1.9 2.0
India 0.0 -0.1 -0.1 -0.1 -0.1 -0.1 -0.1 -0.1 -0.1 -0.1 -0.2 -0.2 -0.2 -0.2 -0.2 -0.2
Canada 0.0 0.0 0.0 0.0 0.0 0.0 0.0 0.0 0.0 0.0 0.0 0.0 0.0 0.0 0.0 0.0
USA 0.0 0.0 0.0 0.0 0.0 0.0 0.0 0.0 0.0 0.0 0.0 0.0 0.0 0.0 0.0 0.0
Europe 0.0 0.0 0.0 0.0 0.0 0.0 0.0 0.0 0.0 0.0 0.0 0.0 0.0 0.0 0.0 0.0
Rest of the
world 0.0 0.0 0.0 0.0 0.0 0.0 0.0 0.0 0.0 0.0 0.0 0.0 0.0 0.0 0.0 0.0
ASEAN 1.1 1.7 2.3 2.9 3.6 4.4 4.7 4.9 5.2 5.4 5.6 5.8 5.9 6.0 6.2 6.3

Regional Office for Asia and the Pacific 53
2010 2011 2012 2013 2014 2015 2016 2017 2018 2019 2020 2012 2022 2023 2024 2025
AEC
Australia 0.0 0.0 0.0 0.0 0.0 0.0 0.0 0.0 0.0 0.0 0.0 0.0 0.0 0.0 0.0 0.0
New Zealand 0.0 0.0 0.0 0.0 0.0 0.0 0.0 0.0 0.0 0.0 0.0 0.0 0.0 0.0 0.0 0.0
China -0.1 -0.1 -0.1 -0.1 -0.2 -0.2 -0.2 -0.2 -0.2 -0.2 -0.2 -0.2 -0.2 -0.2 -0.2 -0.2
China, Hong
Kong 0.0 -0.1 -0.1 -0.1 -0.1 -0.1 -0.1 -0.1 -0.1 -0.1 -0.1 -0.1 -0.1 -0.1 0.0 0.0
Japan 0.0 0.0 0.0 -0.1 -0.1 -0.1 -0.1 -0.1 -0.1 -0.1 -0.1 -0.1 -0.1 -0.1 -0.1 -0.1
Rep. of Korea -0.1 -0.1 -0.1 -0.2 -0.2 -0.3 -0.3 -0.3 -0.3 -0.3 -0.3 -0.3 -0.3 -0.3 -0.3 -0.3
China, Taiwan -0.1 -0.2 -0.3 -0.3 -0.4 -0.5 -0.5 -0.5 -0.6 -0.6 -0.6 -0.6 -0.6 -0.6 -0.6 -0.6
Indonesia 0.6 1.0 1.4 1.8 2.3 2.8 3.0 3.2 3.4 3.6 3.8 3.9 4.0 4.1 4.2 4.3
Malaysia 1.6 2.5 3.5 4.6 5.9 7.3 7.9 8.4 8.9 9.3 9.7 10.0 10.3 10.6 10.8 11.0
Philippines 0.8 1.3 1.9 2.6 3.7 5.1 5.6 6.2 6.7 7.1 7.6 8.0 8.4 8.8 9.1 9.4
Singapore 1.6 2.4 3.4 4.5 5.6 6.8 7.2 7.6 8.0 8.3 8.6 8.9 9.1 9.3 9.4 9.6
Thailand 1.4 2.3 3.3 4.2 5.3 6.4 6.8 7.2 7.7 8.1 8.4 8.7 9.0 9.2 9.5 9.7
Viet Nam 3.4 5.1 6.8 8.5 10.4 12.3 12.9 13.3 13.7 14.0 14.3 14.4 14.6 14.7 14.7 14.7
Cambodia 2.7 3.9 5.2 6.7 8.5 11.0 11.8 12.6 13.4 14.2 14.9 15.6 16.3 16.9 17.5 18.0
Lao PDR 2.2 3.2 4.3 5.4 7.0 8.9 9.3 9.7 10.1 10.4 10.7 10.9 11.1 11.3 11.3 11.4
Rest of ASEAN 0.5 0.6 0.8 1.0 1.3 1.5 1.6 1.7 1.8 2.0 2.1 2.2 2.4 2.5 2.6 2.7
India 0.0 -0.1 -0.1 -0.1 -0.1 -0.2 -0.2 -0.2 -0.2 -0.2 -0.2 -0.2 -0.2 -0.2 -0.2 -0.2
Canada 0.0 0.0 0.0 0.0 0.0 0.0 0.0 0.0 0.0 0.0 0.0 0.0 0.0 0.0 0.0 0.0
USA 0.0 0.0 0.0 0.0 0.0 0.0 0.0 0.0 0.0 0.0 0.0 0.0 0.0 0.0 0.0 0.0
Europe 0.0 0.0 0.0 0.0 0.0 0.0 0.0 0.0 0.0 0.0 0.0 0.0 0.0 0.0 0.0 0.0
Rest of the
world 0.0 0.0 0.0 0.0 0.0 0.0 0.0 0.0 0.0 0.0 0.0 0.0 0.0 0.0 0.0 0.0
ASEAN 1.2 1.9 2.7 3.5 4.4 5.5 5.8 6.2 6.5 6.8 7.1 7.3 7.5 7.7 7.8 8.0
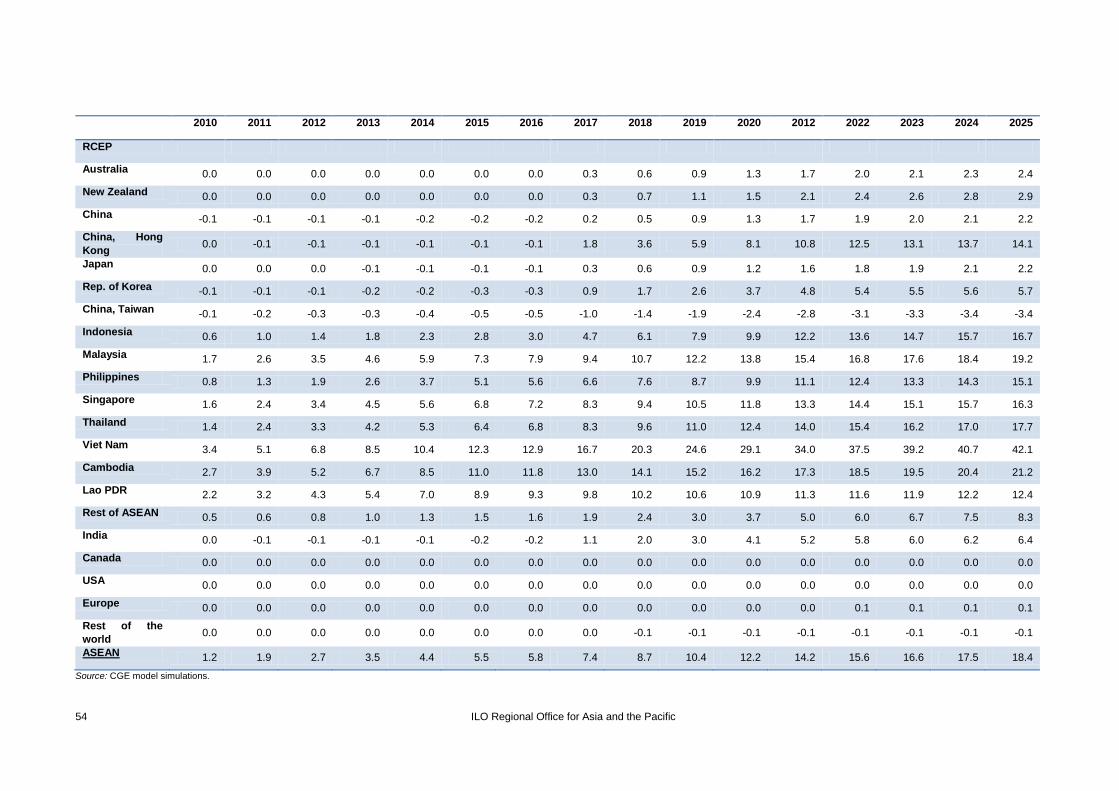
54 ILO Regional Office for Asia and the Pacific
2010 2011 2012 2013 2014 2015 2016 2017 2018 2019 2020 2012 2022 2023 2024 2025
RCEP
Australia 0.0 0.0 0.0 0.0 0.0 0.0 0.0 0.3 0.6 0.9 1.3 1.7 2.0 2.1 2.3 2.4
New Zealand 0.0 0.0 0.0 0.0 0.0 0.0 0.0 0.3 0.7 1.1 1.5 2.1 2.4 2.6 2.8 2.9
China -0.1 -0.1 -0.1 -0.1 -0.2 -0.2 -0.2 0.2 0.5 0.9 1.3 1.7 1.9 2.0 2.1 2.2
China, Hong
Kong 0.0 -0.1 -0.1 -0.1 -0.1 -0.1 -0.1 1.8 3.6 5.9 8.1 10.8 12.5 13.1 13.7 14.1
Japan 0.0 0.0 0.0 -0.1 -0.1 -0.1 -0.1 0.3 0.6 0.9 1.2 1.6 1.8 1.9 2.1 2.2
Rep. of Korea -0.1 -0.1 -0.1 -0.2 -0.2 -0.3 -0.3 0.9 1.7 2.6 3.7 4.8 5.4 5.5 5.6 5.7
China, Taiwan -0.1 -0.2 -0.3 -0.3 -0.4 -0.5 -0.5 -1.0 -1.4 -1.9 -2.4 -2.8 -3.1 -3.3 -3.4 -3.4
Indonesia 0.6 1.0 1.4 1.8 2.3 2.8 3.0 4.7 6.1 7.9 9.9 12.2 13.6 14.7 15.7 16.7
Malaysia 1.7 2.6 3.5 4.6 5.9 7.3 7.9 9.4 10.7 12.2 13.8 15.4 16.8 17.6 18.4 19.2
Philippines 0.8 1.3 1.9 2.6 3.7 5.1 5.6 6.6 7.6 8.7 9.9 11.1 12.4 13.3 14.3 15.1
Singapore 1.6 2.4 3.4 4.5 5.6 6.8 7.2 8.3 9.4 10.5 11.8 13.3 14.4 15.1 15.7 16.3
Thailand 1.4 2.4 3.3 4.2 5.3 6.4 6.8 8.3 9.6 11.0 12.4 14.0 15.4 16.2 17.0 17.7
Viet Nam 3.4 5.1 6.8 8.5 10.4 12.3 12.9 16.7 20.3 24.6 29.1 34.0 37.5 39.2 40.7 42.1
Cambodia 2.7 3.9 5.2 6.7 8.5 11.0 11.8 13.0 14.1 15.2 16.2 17.3 18.5 19.5 20.4 21.2
Lao PDR 2.2 3.2 4.3 5.4 7.0 8.9 9.3 9.8 10.2 10.6 10.9 11.3 11.6 11.9 12.2 12.4
Rest of ASEAN 0.5 0.6 0.8 1.0 1.3 1.5 1.6 1.9 2.4 3.0 3.7 5.0 6.0 6.7 7.5 8.3
India 0.0 -0.1 -0.1 -0.1 -0.1 -0.2 -0.2 1.1 2.0 3.0 4.1 5.2 5.8 6.0 6.2 6.4
Canada 0.0 0.0 0.0 0.0 0.0 0.0 0.0 0.0 0.0 0.0 0.0 0.0 0.0 0.0 0.0 0.0
USA 0.0 0.0 0.0 0.0 0.0 0.0 0.0 0.0 0.0 0.0 0.0 0.0 0.0 0.0 0.0 0.0
Europe 0.0 0.0 0.0 0.0 0.0 0.0 0.0 0.0 0.0 0.0 0.0 0.0 0.1 0.1 0.1 0.1
Rest of the
world 0.0 0.0 0.0 0.0 0.0 0.0 0.0 0.0 -0.1 -0.1 -0.1 -0.1 -0.1 -0.1 -0.1 -0.1
ASEAN 1.2 1.9 2.7 3.5 4.4 5.5 5.8 7.4 8.7 10.4 12.2 14.2 15.6 16.6 17.5 18.4
Source: CGE model simulations.
Regional Office for Asia and the Pacific 1
ILO Regional Office for Asia and the Pacific
United Nations Building, 11th Floor
Rajdamnern Nok Avenue,
Bangkok 10200, Thailand
Tel.: +66 2288 1234, Fax.: +66 2288 3062
Email: [email protected]
www.ilo.org/asia
ISSN: 2227-4405 (web pdf)
Assessing the impact of ASEAN economic integration on labour
markets
Enhancing regional economic integration has become an important priority for the
Association of Southeast Asian Nations (ASEAN). Building on the ASEAN Free Trade Area,
ASEAN has been implementing the ASEAN Economic Community (AEC) since 2007,
scheduled for completion in 2015. The AEC is in many ways the most ambitious economic
cooperation programme in the developing world, with its goal being the creation of an
economic space in which there will be a free flow of goods, services, foreign direct
investment and skilled labour. In addition, ASEAN has cemented free trade areas with six
regional partners (Japan, Republic of Korea, People’s Republic of China, Australia, New
Zealand and India) and, together with these economies, launched the Regional
Economic Comprehensive Partnership (RCEP) in November 2012, also with the goal of
completion in 2015.
This study estimates the implications of the regional integration initiatives on ASEAN
Member States using a cutting-edge computable general equilibrium model. In addition
to gauging the effects on welfare, trade and economic structure, it considers the
ramifications for labour markets. Using detailed data from the labour force surveys
available for six ASEAN markets, the paper captures the effects of these initiatives on
seven categories of labour at the occupational level. It also includes estimates of the
distributional effects of these initiatives for labour relative to other factors (capital and
land) and on gender.
![The ASEAN and the ASEAN Integration[1]](https://static.fdocuments.in/doc/165x107/577cc1201a28aba711924c3b/the-asean-and-the-asean-integration1.jpg)