Ascertaining the Role of Taiwan as a Source for the ... · PDF fileAscertaining the Role of...
14
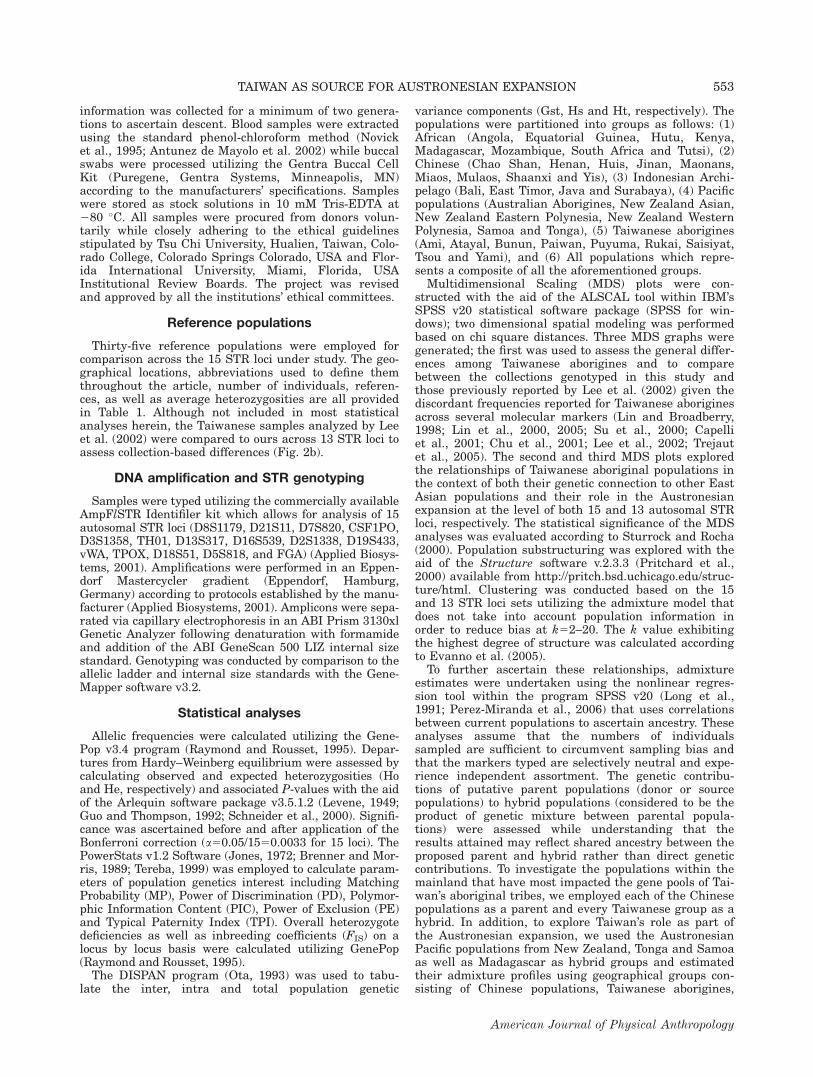
Ascertaining the Role of Taiwan as a Source for the Austronesian Expansion Sheyla Mirabal, 1,2 Alicia M. Cadenas, 2 Ralph Garcia-Bertrand, 3 and Rene J. Herrera 2 * 1 Department of Molecular and Human Genetics, College of Medicine, Florida International University, Miami, FL 33199 2 Department of Molecular and Cell Biology, The Rockefeller University, New York, NY 10065 3 Department of Biological Sciences, Colorado College, Colorado Springs, CO KEY WORDS YSTRs; Austronesian expansion; Taiwanese aborigines ABSTRACT Taiwanese aborigines have been deemed the ancestors of Austronesian speakers which are cur- rently distributed throughout two-thirds of the globe. As such, understanding their genetic distribution and diver- sity as well as their relationship to mainland Asian groups is important to consolidating the numerous mod- els that have been proposed to explain the dispersal of Austronesian speaking peoples into Oceania. To better understand the role played by the aboriginal Taiwanese in this diaspora, we have analyzed a total of 451 individ- uals belonging to nine of the tribes currently residing in Taiwan, namely the Ami, Atayal, Bunun, Paiwan, Puyuma, Rukai, Saisiyat, Tsou, and the Yami from Orchid Island off the coast of Taiwan across 15 autosomal short tandem repeat loci. In addition, we have compared the genetic profiles of these tribes to populations from mainland China as well as to collections at key points throughout the Austronesian domain. While our results suggest that Daic populations from Southern China are the likely forefathers of the Taiwanese aborigines, popu- lations within Taiwan show a greater genetic impact on groups at the extremes of the current domain than popu- lations from Indonesia, Mainland, or Southeast Asia lend- ing support to the “Out of Taiwan” hypothesis. We have also observed that specific Taiwanese aboriginal groups (Paiwan, Puyuma, and Saisiyat), and not all tribal popu- lations, have highly influenced genetic distributions of Austronesian populations in the pacific and Madagascar suggesting either an asymmetric migration out of Taiwan or the loss of certain genetic signatures in some of the Taiwanese tribes due to endogamy, isolation, and/or drift. Am J Phys Anthropol 150:551–564, 2013. V C 2013 Wiley Periodicals, Inc. Language of the Austronesian family are spoken in a wide geographical range bound by Madagascar to the west, Easter Island to the East, New Zealand to the south and Taiwan to the north (Gray and Jordan, 2000). Though several theories have been proposed to explain the origin, routes of dispersal, timing of migratory pauses and pulses, as well as the current genetic rela- tionships of Austronesian groups, no single conjecture has been able to bridge all of the data (linguistic, molec- ular and archaeological) available. Since nine out of the ten currently spoken Austronesian linguistic subgroups can only be found in Taiwan (Blust, 1999), the island lies at the root of these interrogatives. Taiwan’s current population is largely composed of Han Chinese (of the Min and Hakka subgroups) who migrated to the island from southeast China in the last half millennium (Chiung, 2001). It is the Taiwanese abo- rigines, however, who comprise about 1.5% of the popu- lace and speak Austronesian languages, which are considered indigenous to the country (Trejaut et al., 2005). Though these tribal groups are believed to be de- scendants of mainland Asians, the timing of their arrival in Formosa is still debatable and it is unclear whether they represent a single or several Paleolithic or Neolithic waves of migration (Tsang, 2002; Sagart, 2004; Sagart, 2005). Archaeological evidence suggests that humans were present in Taiwan about 15,000 years before present (YBP) (Tsang, 2002), but most remains are more recent dating to Neolithic times and are largely associated with the arrival of pastoral agriculturalists from mainland China around 8,000 YBP (Ruhlen, 1994; Rolett and Tsang, 2001; Diamond and Bellwood, 2003). Several stud- ies indicate that southern Chinese Daic populations are the likely ancestors of Formosan tribal groups (Li et al., 2008; Wu et al., 2009) and it has been claimed that the Daic domain within South China, and not Taiwan, is the homeland of all Austronesian groups (Li et al., 2008). The Daic are considered to be the original inhabitants of Chi- na’s southeast coast and their origins can be traced to 20,000 YBP (Li et al., 2007). Today, Daic people are second only to the Han in numbers within China and have a strong presence in Thailand, Laos, Vietnam, Myanmar and India (Grimes, 2002). It is generally accepted that the Austronesian diaspora began around 6,000 years ago (Zhang, 1987; Diamond, 1988; Bellwood et al., 1995). Of the several theories pro- posed to explain the series of events that ensued, three have received widespread genetic, linguistic and Additional Supporting Information may be found in the online version of this article. *Correspondence to: R. J. Herrera, College of Medicine, Florida International University, University Park, OE 304, Miami, FL 33199, USA. E-mail: [email protected] Received 10 July 2012; accepted 14 December 2012 DOI: 10.1002/ajpa.22226 Published online 26 February 2013 in Wiley Online Library (wileyonlinelibrary.com). Ó 2013 WILEY PERIODICALS, INC. AMERICAN JOURNAL OF PHYSICAL ANTHROPOLOGY 150:551–564 (2013)
Transcript of Ascertaining the Role of Taiwan as a Source for the ... · PDF fileAscertaining the Role of...
Ascertaining the Role of Taiwan as a Source for theAustronesian Expansion
Sheyla Mirabal,1,2 Alicia M. Cadenas,2 Ralph Garcia-Bertrand,3 and Rene J. Herrera2*
1Department of Molecular and Human Genetics, College of Medicine, FloridaInternational University, Miami, FL 331992Department of Molecular and Cell Biology, The Rockefeller University, New York, NY 100653Department of Biological Sciences, Colorado College, Colorado Springs, CO
KEY WORDS YSTRs; Austronesian expansion; Taiwanese aborigines
ABSTRACT Taiwanese aborigines have been deemedthe ancestors of Austronesian speakers which are cur-rently distributed throughout two-thirds of the globe. Assuch, understanding their genetic distribution and diver-sity as well as their relationship to mainland Asiangroups is important to consolidating the numerous mod-els that have been proposed to explain the dispersal ofAustronesian speaking peoples into Oceania. To betterunderstand the role played by the aboriginal Taiwanesein this diaspora, we have analyzed a total of 451 individ-uals belonging to nine of the tribes currently residing inTaiwan, namely the Ami, Atayal, Bunun, Paiwan,Puyuma, Rukai, Saisiyat, Tsou, and the Yami fromOrchid Island off the coast of Taiwan across 15 autosomalshort tandem repeat loci. In addition, we have comparedthe genetic profiles of these tribes to populations frommainland China as well as to collections at key points
throughout the Austronesian domain. While our resultssuggest that Daic populations from Southern China arethe likely forefathers of the Taiwanese aborigines, popu-lations within Taiwan show a greater genetic impact ongroups at the extremes of the current domain than popu-lations from Indonesia, Mainland, or Southeast Asia lend-ing support to the “Out of Taiwan” hypothesis. We havealso observed that specific Taiwanese aboriginal groups(Paiwan, Puyuma, and Saisiyat), and not all tribal popu-lations, have highly influenced genetic distributions ofAustronesian populations in the pacific and Madagascarsuggesting either an asymmetric migration out of Taiwanor the loss of certain genetic signatures in some of theTaiwanese tribes due to endogamy, isolation, and/or drift.Am J Phys Anthropol 150:551–564, 2013. VC 2013 Wiley
Periodicals, Inc.
Language of the Austronesian family are spoken in awide geographical range bound by Madagascar to thewest, Easter Island to the East, New Zealand to thesouth and Taiwan to the north (Gray and Jordan, 2000).Though several theories have been proposed to explainthe origin, routes of dispersal, timing of migratorypauses and pulses, as well as the current genetic rela-tionships of Austronesian groups, no single conjecturehas been able to bridge all of the data (linguistic, molec-ular and archaeological) available. Since nine out of theten currently spoken Austronesian linguistic subgroupscan only be found in Taiwan (Blust, 1999), the islandlies at the root of these interrogatives.
Taiwan’s current population is largely composed ofHan Chinese (of the Min and Hakka subgroups) whomigrated to the island from southeast China in the lasthalf millennium (Chiung, 2001). It is the Taiwanese abo-rigines, however, who comprise about 1.5% of the popu-lace and speak Austronesian languages, which areconsidered indigenous to the country (Trejaut et al.,2005). Though these tribal groups are believed to be de-scendants of mainland Asians, the timing of their arrivalin Formosa is still debatable and it is unclear whetherthey represent a single or several Paleolithic or Neolithicwaves of migration (Tsang, 2002; Sagart, 2004; Sagart,2005).
Archaeological evidence suggests that humans werepresent in Taiwan about 15,000 years before present(YBP) (Tsang, 2002), but most remains are more recentdating to Neolithic times and are largely associated withthe arrival of pastoral agriculturalists from mainland
China around 8,000 YBP (Ruhlen, 1994; Rolett andTsang, 2001; Diamond and Bellwood, 2003). Several stud-ies indicate that southern Chinese Daic populations arethe likely ancestors of Formosan tribal groups (Li et al.,2008; Wu et al., 2009) and it has been claimed that theDaic domain within South China, and not Taiwan, is thehomeland of all Austronesian groups (Li et al., 2008). TheDaic are considered to be the original inhabitants of Chi-na’s southeast coast and their origins can be traced to20,000 YBP (Li et al., 2007). Today, Daic people are secondonly to the Han in numbers within China and have astrong presence in Thailand, Laos, Vietnam, Myanmarand India (Grimes, 2002).
It is generally accepted that the Austronesian diasporabegan around 6,000 years ago (Zhang, 1987; Diamond,1988; Bellwood et al., 1995). Of the several theories pro-posed to explain the series of events that ensued, threehave received widespread genetic, linguistic and
Additional Supporting Information may be found in the onlineversion of this article.
*Correspondence to: R. J. Herrera, College of Medicine, FloridaInternational University, University Park, OE 304, Miami, FL33199, USA. E-mail: [email protected]
Received 10 July 2012; accepted 14 December 2012
DOI: 10.1002/ajpa.22226Published online 26 February 2013 in Wiley Online Library
(wileyonlinelibrary.com).
� 2013 WILEY PERIODICALS, INC.
AMERICAN JOURNAL OF PHYSICAL ANTHROPOLOGY 150:551–564 (2013)

archeological support; namely the “express train,”“entangled bank,” and “slow boat” hypotheses. The“express train” model (also coined as “out of Taiwan”) pos-tulates that Austronesians originated in Taiwan and trav-ersed rapidly through Micronesia and Melanesia, leadingto minimal admixture with the pre-existing substrata ofthe area, before settling throughout Oceania (Meltonet al., 1995; Bellwood, 1997; Lum, 1998; Green, 1999;Hagelberg et al., 1999; Diamond, 2000; Gray and Jordan,2000; Trejaut et al., 2005; Gray et al., 2009; Tofanelliet al., 2009; Greenhill et al., 2010). On the other hand, the“entangled bank” hypothesis proposes that a migrationfrom Mainland Asia to the Pacific during the Mid-Holo-cene, along with continued and extensive integration withnatives throughout the routes traversed, is responsiblefor the current genetic characteristics of Austronesiangroups (Terrel et al., 1997; Capelli et al., 2001; Oppen-heimer and Richards, 2001; Hurles et al., 2002). The “slowboat” model, which combines some of the main elementsof both aforementioned ideas, posits that though Austro-nesian migrants are of Asian descent (most likely Taiwan-ese), they traveled slowly through Island Southeast Asiaassimilating some of the pre-existing genetic substrataand eventually reaching Near and Far Oceania (Kayseret al., 2000, 2003, 2006, 2008).
The distributions of mtDNA haplogroup B4a1a1 (theso dubbed “Polynesian motif) and its ancestral lineageB4a1a provided the first direct genetic evidence tyingPolynesians to Taiwanese aborigines (Trejaut et al.,2005). A phylogeny based on these mtDNA subtypesdirectly mirrors linguistic relationships (Bellwood, 1990;Donohue and Denham, 2010) and follows a route origi-nating in Taiwan, where it is most diverse, travelingsouth toward the Philippines and Indonesia (Meltonet al., 1995; Hill et al., 2007; Tabbada et al., 2010; Raza-findrazaka et al., 2010). However, subsequent studieshave unearthed previously undiscovered genetic affin-ities between mtDNAs in the Bismarck Archipelago ofIndonesia and Oceanian populations that may predatethe Austronesian expansion by as much as 3,000 yearsobscuring previous conclusions (Soares et al., 2011).
Y-chromosomal studies have also proven controversialand though some early analyses alluded to ties betweenAsian populations and Polynesian groups (Su et al.,2000), most reports indicate close genetic ties betweenMelanesia and Polynesia and no clear connections toTaiwan (Lum, 1998; Kayser et al., 2000, 2003, 2006,2008). Recently, however, Karafet et al. (2010) demon-strated that a subgroup of haplogroup O3, specificallyO3a2, is widely distributed throughout Island SoutheastAsians, Indonesians and Polynesians but absent frommainland Asian populations. Subsequently, Mirabalet al. (2012) reported that a close genetic relationshipexists between the Ami (one of the Taiwanese aboriginaltribes) and Polynesian populations by finding that allO3a2 (P201) chromosomes in the Ami and Polynesiansalso belong to the rare downstream undifferentiated sub-haplogroup O3a2c* (P164), that had previously onlybeen detected at low levels in some mainland East Asianpopulations (Yan et al., 2011). These findings establisheda direct genetic link between Taiwanese aborigines andPolynesian groups previously undetected due to the lackof resolution of O3 derived Y-chromosomes afforded byprevious studies (Su et al., 2000; Kayser et al., 2000,2003, 2006, 2008).
In an attempt to consolidate the wealth of data obtainedfrom uniparental loci, other authors have turned to auto-
somal markers. By using autosomal short tandem repeat(STR) loci, Kayser et al. (2008) and Regueiro et al. (2008)both proposed independently that East Asians and Mela-nesians are the source of 79% (Kayser) / 76% / (Regueiro)and 21% (Kayser) / 24% (Regueiro) of the current Polyne-sian gene pool, respectively. By using genome wide scansincluding both microsatellites and insertions/deletions,Fried Laender et al. (2008) resolved close genetic tiesamong Austronesian speakers and concluded that signalsshared by populations of Austronesian ancestry were onlypresent at low frequencies in Austronesian speaking Mel-anesian groups leading to the suggestion that movementthrough Melanesia was rapid. Subsequently, high densityautosomal single nucleotide polymorphisms (SNPs) havealso facilitated admixture time estimates between Asianand Papuan populations in Eastern Indonesia which arehighly congruent with linguistic time estimates corre-sponding to the time of the Austronesian expansion (Xuet al., 2012). Other autosomal SNPs investigations havefound only minute contributions from Austronesiangroups throughout Southeast Asia and instead suggestthat mainland Asians have shaped these regions (Jinamet al., 2012).
In the current study, we have analyzed a total of 451individuals from Taiwan (95 Ami, 45 Atayal, 47 Bunun, 40Paiwan, 40 Puyuma, 33 Rukai, 39 Saisiyat, 42 Tsou and 70Yami) across a set of 15 autosomal STR loci and comparedthem to previously published collections from mainlandAsia, Island Southeast Asia, Indonesia, Australia, Polyne-sia and Madagascar (an Austronesian-speaking islandapproximately 200 km off the south east coast of Africa) inorder to assess their current genetic relationships.
Autosomal STRs are selectively neutral, hypervariablemarkers particularly helpful when elucidating geneticrelationships between closely related, recently separatedor admixed populations given their large number of al-leles, high heterozygosity, abundance and widespreaddistribution throughout the genome (Jorde et al., 1997;Rowold and Herrera, 2003; Perez-Miranda et al., 2005;Shepard et al., 2005; Shepard and Herrera, 2006;Ibarra-Rivera et al., 2008; Regueiro et al., 2008). Theyvary solely on the basis of mutation and drift, lendingthemselves to varied applications including detailed for-ensic analyses (Leibelt et al., 2003) and populationgenetics investigations since they provide the high reso-lution needed to investigate closely related or recentlyseparated populations (Rowold and Herrera, 2003). Inthe present study, we aim to shed light onto the popula-tions from mainland Asia that contributed to the geneticmakeup of Taiwanese aborigines, to understand the dif-ferentiation among these Formosan tribal groups andtheir role in the dispersal of Austronesian speakers.Moreover, we hope to establish whether influencesexerted throughout the Austronesian domain are homog-enous among the Taiwanese tribes, or whether certaintribes have played more significant roles.
MATERIALS AND METHODS
Populations, sample collection, and DNAisolation
Peripheral blood samples or buccal swabs were col-lected from a total of 451 unrelated individuals native tonine of the aboriginal tribes present in Taiwan (95 Ami,45 Atayal, 47 Bunun, 40 Paiwan, 40 Puyuma, 33 Rukai,39 Saisiyat, 42 Tsou and 70 Yami). Genealogical
552 S. MIRABAL ET AL.
American Journal of Physical Anthropology
information was collected for a minimum of two genera-tions to ascertain descent. Blood samples were extractedusing the standard phenol-chloroform method (Novicket al., 1995; Antunez de Mayolo et al. 2002) while buccalswabs were processed utilizing the Gentra Buccal CellKit (Puregene, Gentra Systems, Minneapolis, MN)according to the manufacturers’ specifications. Sampleswere stored as stock solutions in 10 mM Tris-EDTA at280 �C. All samples were procured from donors volun-tarily while closely adhering to the ethical guidelinesstipulated by Tsu Chi University, Hualien, Taiwan, Colo-rado College, Colorado Springs Colorado, USA and Flor-ida International University, Miami, Florida, USAInstitutional Review Boards. The project was revisedand approved by all the institutions’ ethical committees.
Reference populations
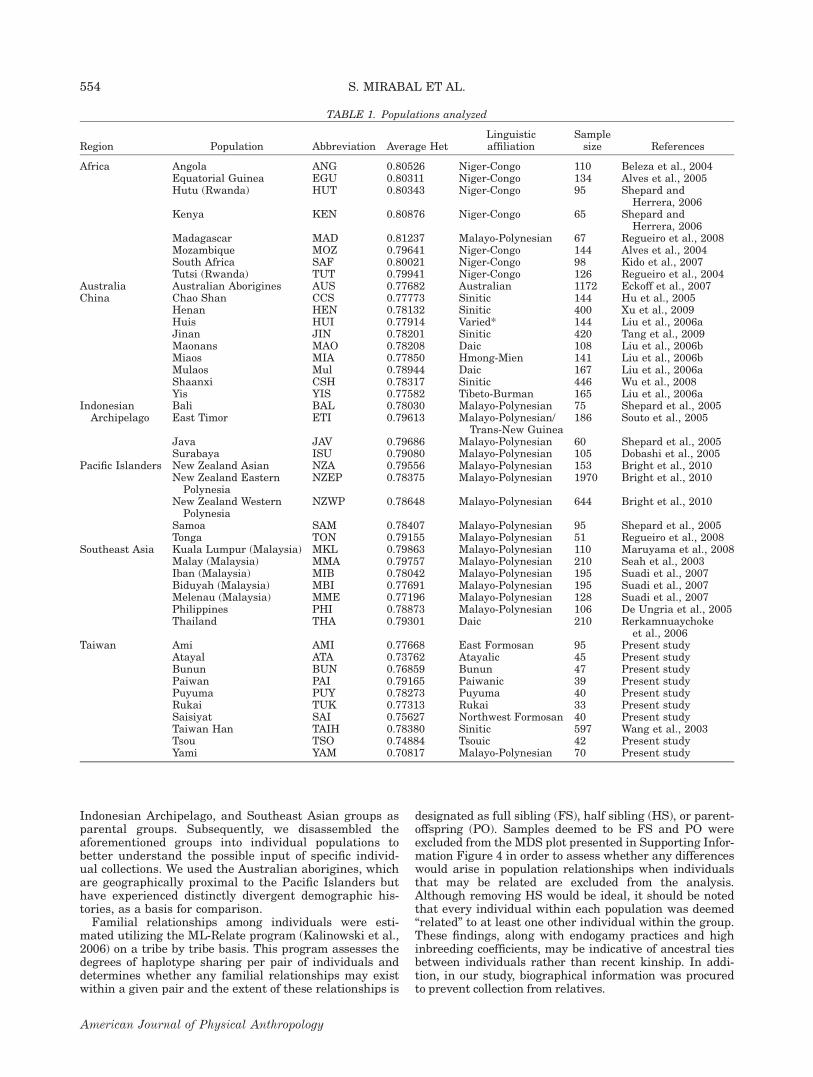
Thirty-five reference populations were employed forcomparison across the 15 STR loci under study. The geo-graphical locations, abbreviations used to define themthroughout the article, number of individuals, referen-ces, as well as average heterozygosities are all providedin Table 1. Although not included in most statisticalanalyses herein, the Taiwanese samples analyzed by Leeet al. (2002) were compared to ours across 13 STR loci toassess collection-based differences (Fig. 2b).
DNA amplification and STR genotyping
Samples were typed utilizing the commercially availableAmpFlSTR Identifiler kit which allows for analysis of 15autosomal STR loci (D8S1179, D21S11, D7S820, CSF1PO,D3S1358, TH01, D13S317, D16S539, D2S1338, D19S433,vWA, TPOX, D18S51, D5S818, and FGA) (Applied Biosys-tems, 2001). Amplifications were performed in an Eppen-dorf Mastercycler gradient (Eppendorf, Hamburg,Germany) according to protocols established by the manu-facturer (Applied Biosystems, 2001). Amplicons were sepa-rated via capillary electrophoresis in an ABI Prism 3130xlGenetic Analyzer following denaturation with formamideand addition of the ABI GeneScan 500 LIZ internal sizestandard. Genotyping was conducted by comparison to theallelic ladder and internal size standards with the Gene-Mapper software v3.2.
Statistical analyses
Allelic frequencies were calculated utilizing the Gene-Pop v3.4 program (Raymond and Rousset, 1995). Depar-tures from Hardy–Weinberg equilibrium were assessed bycalculating observed and expected heterozygosities (Hoand He, respectively) and associated P-values with the aidof the Arlequin software package v3.5.1.2 (Levene, 1949;Guo and Thompson, 1992; Schneider et al., 2000). Signifi-cance was ascertained before and after application of theBonferroni correction (a50.05/1550.0033 for 15 loci). ThePowerStats v1.2 Software (Jones, 1972; Brenner and Mor-ris, 1989; Tereba, 1999) was employed to calculate param-eters of population genetics interest including MatchingProbability (MP), Power of Discrimination (PD), Polymor-phic Information Content (PIC), Power of Exclusion (PE)and Typical Paternity Index (TPI). Overall heterozygotedeficiencies as well as inbreeding coefficients (FIS) on alocus by locus basis were calculated utilizing GenePop(Raymond and Rousset, 1995).
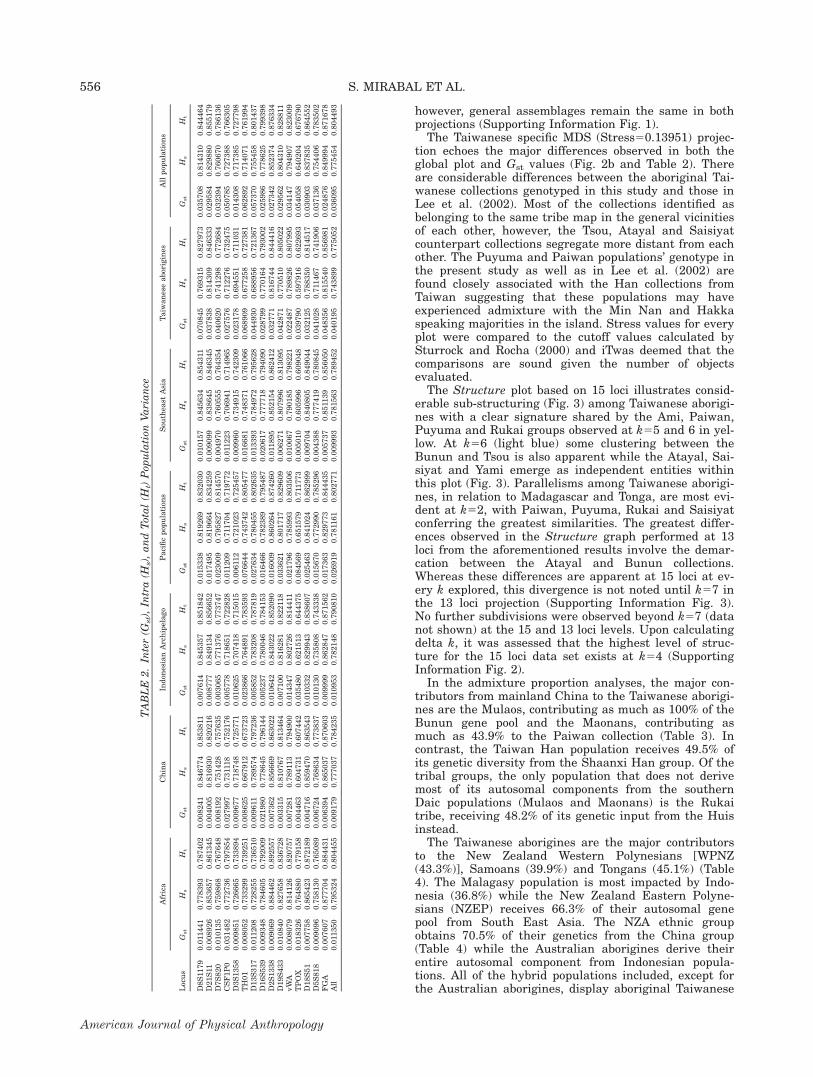
The DISPAN program (Ota, 1993) was used to tabu-late the inter, intra and total population genetic
variance components (Gst, Hs and Ht, respectively). Thepopulations were partitioned into groups as follows: (1)African (Angola, Equatorial Guinea, Hutu, Kenya,Madagascar, Mozambique, South Africa and Tutsi), (2)Chinese (Chao Shan, Henan, Huis, Jinan, Maonans,Miaos, Mulaos, Shaanxi and Yis), (3) Indonesian Archi-pelago (Bali, East Timor, Java and Surabaya), (4) Pacificpopulations (Australian Aborigines, New Zealand Asian,New Zealand Eastern Polynesia, New Zealand WesternPolynesia, Samoa and Tonga), (5) Taiwanese aborigines(Ami, Atayal, Bunun, Paiwan, Puyuma, Rukai, Saisiyat,Tsou and Yami), and (6) All populations which repre-sents a composite of all the aforementioned groups.
Multidimensional Scaling (MDS) plots were con-structed with the aid of the ALSCAL tool within IBM’sSPSS v20 statistical software package (SPSS for win-dows); two dimensional spatial modeling was performedbased on chi square distances. Three MDS graphs weregenerated; the first was used to assess the general differ-ences among Taiwanese aborigines and to comparebetween the collections genotyped in this study andthose previously reported by Lee et al. (2002) given thediscordant frequencies reported for Taiwanese aboriginesacross several molecular markers (Lin and Broadberry,1998; Lin et al., 2000, 2005; Su et al., 2000; Capelliet al., 2001; Chu et al., 2001; Lee et al., 2002; Trejautet al., 2005). The second and third MDS plots exploredthe relationships of Taiwanese aboriginal populations inthe context of both their genetic connection to other EastAsian populations and their role in the Austronesianexpansion at the level of both 15 and 13 autosomal STRloci, respectively. The statistical significance of the MDSanalyses was evaluated according to Sturrock and Rocha(2000). Population substructuring was explored with theaid of the Structure software v.2.3.3 (Pritchard et al.,2000) available from http://pritch.bsd.uchicago.edu/struc-ture/html. Clustering was conducted based on the 15and 13 STR loci sets utilizing the admixture model thatdoes not take into account population information inorder to reduce bias at k52–20. The k value exhibitingthe highest degree of structure was calculated accordingto Evanno et al. (2005).
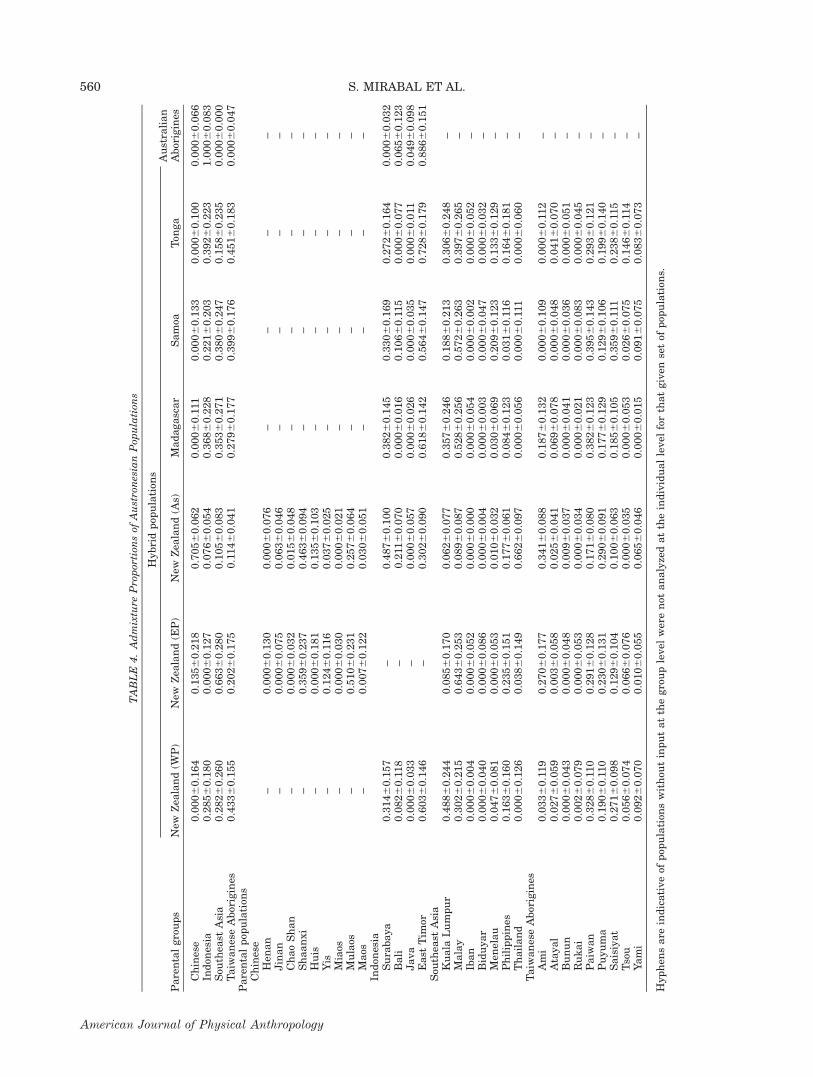
To further ascertain these relationships, admixtureestimates were undertaken using the nonlinear regres-sion tool within the program SPSS v20 (Long et al.,1991; Perez-Miranda et al., 2006) that uses correlationsbetween current populations to ascertain ancestry. Theseanalyses assume that the numbers of individualssampled are sufficient to circumvent sampling bias andthat the markers typed are selectively neutral and expe-rience independent assortment. The genetic contribu-tions of putative parent populations (donor or sourcepopulations) to hybrid populations (considered to be theproduct of genetic mixture between parental popula-tions) were assessed while understanding that theresults attained may reflect shared ancestry between theproposed parent and hybrid rather than direct geneticcontributions. To investigate the populations within themainland that have most impacted the gene pools of Tai-wan’s aboriginal tribes, we employed each of the Chinesepopulations as a parent and every Taiwanese group as ahybrid. In addition, to explore Taiwan’s role as part ofthe Austronesian expansion, we used the AustronesianPacific populations from New Zealand, Tonga and Samoaas well as Madagascar as hybrid groups and estimatedtheir admixture profiles using geographical groups con-sisting of Chinese populations, Taiwanese aborigines,
TAIWAN AS SOURCE FOR AUSTRONESIAN EXPANSION 553
American Journal of Physical Anthropology
Indonesian Archipelago, and Southeast Asian groups asparental groups. Subsequently, we disassembled theaforementioned groups into individual populations tobetter understand the possible input of specific individ-ual collections. We used the Australian aborigines, whichare geographically proximal to the Pacific Islanders buthave experienced distinctly divergent demographic his-tories, as a basis for comparison.
Familial relationships among individuals were esti-mated utilizing the ML-Relate program (Kalinowski et al.,2006) on a tribe by tribe basis. This program assesses thedegrees of haplotype sharing per pair of individuals anddetermines whether any familial relationships may existwithin a given pair and the extent of these relationships is
designated as full sibling (FS), half sibling (HS), or parent-offspring (PO). Samples deemed to be FS and PO wereexcluded from the MDS plot presented in Supporting Infor-mation Figure 4 in order to assess whether any differenceswould arise in population relationships when individualsthat may be related are excluded from the analysis.Although removing HS would be ideal, it should be notedthat every individual within each population was deemed“related” to at least one other individual within the group.These findings, along with endogamy practices and highinbreeding coefficients, may be indicative of ancestral tiesbetween individuals rather than recent kinship. In addi-tion, in our study, biographical information was procuredto prevent collection from relatives.
TABLE 1. Populations analyzed
Region Population Abbreviation Average HetLinguisticaffiliation
Samplesize References
Africa Angola ANG 0.80526 Niger-Congo 110 Beleza et al., 2004Equatorial Guinea EGU 0.80311 Niger-Congo 134 Alves et al., 2005Hutu (Rwanda) HUT 0.80343 Niger-Congo 95 Shepard and
Herrera, 2006Kenya KEN 0.80876 Niger-Congo 65 Shepard and
Herrera, 2006Madagascar MAD 0.81237 Malayo-Polynesian 67 Regueiro et al., 2008Mozambique MOZ 0.79641 Niger-Congo 144 Alves et al., 2004South Africa SAF 0.80021 Niger-Congo 98 Kido et al., 2007Tutsi (Rwanda) TUT 0.79941 Niger-Congo 126 Regueiro et al., 2004
Australia Australian Aborigines AUS 0.77682 Australian 1172 Eckoff et al., 2007China Chao Shan CCS 0.77773 Sinitic 144 Hu et al., 2005
Henan HEN 0.78132 Sinitic 400 Xu et al., 2009Huis HUI 0.77914 Varied* 144 Liu et al., 2006aJinan JIN 0.78201 Sinitic 420 Tang et al., 2009Maonans MAO 0.78208 Daic 108 Liu et al., 2006bMiaos MIA 0.77850 Hmong-Mien 141 Liu et al., 2006bMulaos Mul 0.78944 Daic 167 Liu et al., 2006aShaanxi CSH 0.78317 Sinitic 446 Wu et al., 2008Yis YIS 0.77582 Tibeto-Burman 165 Liu et al., 2006a
IndonesianArchipelago
Bali BAL 0.78030 Malayo-Polynesian 75 Shepard et al., 2005East Timor ETI 0.79613 Malayo-Polynesian/
Trans-New Guinea186 Souto et al., 2005
Java JAV 0.79686 Malayo-Polynesian 60 Shepard et al., 2005Surabaya ISU 0.79080 Malayo-Polynesian 105 Dobashi et al., 2005
Pacific Islanders New Zealand Asian NZA 0.79556 Malayo-Polynesian 153 Bright et al., 2010New Zealand Eastern
PolynesiaNZEP 0.78375 Malayo-Polynesian 1970 Bright et al., 2010
New Zealand WesternPolynesia
NZWP 0.78648 Malayo-Polynesian 644 Bright et al., 2010
Samoa SAM 0.78407 Malayo-Polynesian 95 Shepard et al., 2005Tonga TON 0.79155 Malayo-Polynesian 51 Regueiro et al., 2008
Southeast Asia Kuala Lumpur (Malaysia) MKL 0.79863 Malayo-Polynesian 110 Maruyama et al., 2008Malay (Malaysia) MMA 0.79757 Malayo-Polynesian 210 Seah et al., 2003Iban (Malaysia) MIB 0.78042 Malayo-Polynesian 195 Suadi et al., 2007Biduyah (Malaysia) MBI 0.77691 Malayo-Polynesian 195 Suadi et al., 2007Melenau (Malaysia) MME 0.77196 Malayo-Polynesian 128 Suadi et al., 2007Philippines PHI 0.78873 Malayo-Polynesian 106 De Ungria et al., 2005Thailand THA 0.79301 Daic 210 Rerkamnuaychoke
et al., 2006Taiwan Ami AMI 0.77668 East Formosan 95 Present study
Atayal ATA 0.73762 Atayalic 45 Present studyBunun BUN 0.76859 Bunun 47 Present studyPaiwan PAI 0.79165 Paiwanic 39 Present studyPuyuma PUY 0.78273 Puyuma 40 Present studyRukai TUK 0.77313 Rukai 33 Present studySaisiyat SAI 0.75627 Northwest Formosan 40 Present studyTaiwan Han TAIH 0.78380 Sinitic 597 Wang et al., 2003Tsou TSO 0.74884 Tsouic 42 Present studyYami YAM 0.70817 Malayo-Polynesian 70 Present study
554 S. MIRABAL ET AL.
American Journal of Physical Anthropology

RESULTS
Intra-population diversity
Allelic frequency distributions, observed and expectedheterozygosities along with associated P-values, as wellas parameters of population genetics interest are pre-sented in Supporting Information Tables 1–9. Statisti-cally significant departures from Hardy–Weinbergequilibrium (HWE) expectations can be observed in sev-eral loci within every population (see Supporting Infor-mation Tables 1–9). However, the only statisticallysignificant departures after applying the Bonferroni cor-rection for multiple observations (a50.05/1550.003)were D21S11 in the Atayal population (P-value50.0018)and D19S433 in the Yami collection (P-value50.0000).
Once analyzed as a whole (using all loci as a completedataset), heterozygote deficiencies were more prominentand statistically significant in the Bunun, Puyuma, Rukai,Saisiyat and Yami (Supporting Information Table 10).Combined Matching Probabilities (CMP) are two orders ofmagnitude lower in the Atayal and Tsou groups (Support-ing Information Table 10) than in the other populationswhile Combined Power of Discrimination (CPD) and Com-bined Power of Exclusion (CPE) are the lowest in the Tsouand Bunun collections, respectively (Supporting Informa-tion Table 10), when either 13 or 15 autosomal STR lociare employed. It should be noted that the robustness ofthe values for all the population genetics important pa-rameters examined were affected by the inclusion of thetwo additional loci genotyped in this study; specifically,CMP values are two order of magnitude higher whenemploying 13 versus 15 STR loci (Supporting InformationTable 10). Inbreeding coefficients on a locus-by-locus basisare presented in Supporting Information Table 11. The
Bunun collection contains the highest number of loci (10)with P-values indicating statistically insignificant diver-sity correlations suggesting that it has experienced themost inbreeding/endogamy. On the other hand, the Tsoupopulation only contains two loci that exhibit statisticallyinsignificant P-values which is indicative of less inter-fam-ilial coupling. We also employed the ML-Relate programto investigate the degree of relatedness among individualsgenotyped in our study (Supporting Information Table 12).Although some potential relationships are indicated, theseaboriginal populations have likely experienced continuedinbreeding, founder and/or bottleneck events in the past,and therefore, it is expected that there may be extensiveallele sharing between some individuals. Number of al-leles in common should not necessarily be taken as indica-tive of different degrees of familial relationships since theyinstead may be representative of distant common ancestryrather than a shared bloodline. When grouped based ongeographic divides, intra-population variance is lowestamong Taiwanese aborigines (HS50.743899) and highestin African populations (HS50.795324) (Table 2) againattesting to the decreased diversity in these aboriginalgroups.
Inter-population diversity and populationrelationships
Inter-population diversity values (GST) are lowestamong the Chinese (GST50.009179) and Southeast Asian(GST50.009993) populations (Table 2). The Taiwanesetribes display the highest variance values(GST50.040195) of any of the groups examined, followedby the Pacific collections (GST50.026919). The markeddifferences in inter-population diversity observed in theTaiwanese aborigines are also readily observed in Struc-ture projections (Fig. 3) and in both the global and Tai-wan specific MDS plots (Fig. 2a,b).
In the global MDS (Stress50.12633), the Taiwaneseaborigines plot to the right of the chart with the Ami,Paiwan and Puyuma populations partitioning close to agrouping composed of South Chinese, Indonesian andSoutheast Asian collections (Fig. 2a). The rest of thetribes are found scattered to the right of this cluster anddistant from each other in both axes. With the exemp-tion of the Yis, all of the southern Chinese populationsare found in a tight conglomerate at the center of theChinese/Southeast Asian/Taiwanese/Indonesian group-ing. The Northern Chinese are found to the left of thisensemble except for the Jihnan collection which segre-gates with the Yis while the Malaysian populations, thePhilippine group, and the Thailand collection are foundintertwined and surrounding the southern and northernChinese aggregates. The Pacific populations are locatedto the lower left quadrant following an almost geograph-ical partition. The New Zealand Asians (NZA) collectionon the other hand plots near the Southeast Asian popu-lations following ethnic rather than geographic relation-ships. The Australian aborigines are located at a similarlocation within the first dimension of the graph; how-ever, they are found completely isolated from any othercollection across the second dimension of the plot. TheAfrican populations form a tightly packed agglutinationat the extreme left of the projection with the Malagasyplotting in between this aggregate and the Asian cluster.There are some differences in positioning observedwithin the 13 loci Global MDS plot (Stress50.13267),
Fig. 1. Map delineating the locations within Taiwan of pop-ulations included in this study.
TAIWAN AS SOURCE FOR AUSTRONESIAN EXPANSION 555
American Journal of Physical Anthropology
however, general assemblages remain the same in bothprojections (Supporting Information Fig. 1).
The Taiwanese specific MDS (Stress50.13951) projec-tion echoes the major differences observed in both theglobal plot and Gst values (Fig. 2b and Table 2). Thereare considerable differences between the aboriginal Tai-wanese collections genotyped in this study and those inLee et al. (2002). Most of the collections identified asbelonging to the same tribe map in the general vicinitiesof each other, however, the Tsou, Atayal and Saisiyatcounterpart collections segregate more distant from eachother. The Puyuma and Paiwan populations’ genotype inthe present study as well as in Lee et al. (2002) arefound closely associated with the Han collections fromTaiwan suggesting that these populations may haveexperienced admixture with the Min Nan and Hakkaspeaking majorities in the island. Stress values for everyplot were compared to the cutoff values calculated bySturrock and Rocha (2000) and iTwas deemed that thecomparisons are sound given the number of objectsevaluated.
The Structure plot based on 15 loci illustrates consid-erable sub-structuring (Fig. 3) among Taiwanese aborigi-nes with a clear signature shared by the Ami, Paiwan,Puyuma and Rukai groups observed at k55 and 6 in yel-low. At k56 (light blue) some clustering between theBunun and Tsou is also apparent while the Atayal, Sai-siyat and Yami emerge as independent entities withinthis plot (Fig. 3). Parallelisms among Taiwanese aborigi-nes, in relation to Madagascar and Tonga, are most evi-dent at k52, with Paiwan, Puyuma, Rukai and Saisiyatconferring the greatest similarities. The greatest differ-ences observed in the Structure graph performed at 13loci from the aforementioned results involve the demar-cation between the Atayal and Bunun collections.Whereas these differences are apparent at 15 loci at ev-ery k explored, this divergence is not noted until k57 inthe 13 loci projection (Supporting Information Fig. 3).No further subdivisions were observed beyond k57 (datanot shown) at the 15 and 13 loci levels. Upon calculatingdelta k, it was assessed that the highest level of struc-ture for the 15 loci data set exists at k54 (SupportingInformation Fig. 2).
In the admixture proportion analyses, the major con-tributors from mainland China to the Taiwanese aborigi-nes are the Mulaos, contributing as much as 100% of theBunun gene pool and the Maonans, contributing asmuch as 43.9% to the Paiwan collection (Table 3). Incontrast, the Taiwan Han population receives 49.5% ofits genetic diversity from the Shaanxi Han group. Of thetribal groups, the only population that does not derivemost of its autosomal components from the southernDaic populations (Mulaos and Maonans) is the Rukaitribe, receiving 48.2% of its genetic input from the Huisinstead.
The Taiwanese aborigines are the major contributorsto the New Zealand Western Polynesians [WPNZ(43.3%)], Samoans (39.9%) and Tongans (45.1%) (Table4). The Malagasy population is most impacted by Indo-nesia (36.8%) while the New Zealand Eastern Polyne-sians (NZEP) receives 66.3% of their autosomal genepool from South East Asia. The NZA ethnic groupobtains 70.5% of their genetics from the China group(Table 4) while the Australian aborigines derive theirentire autosomal component from Indonesian popula-tions. All of the hybrid populations included, except forthe Australian aborigines, display aboriginal Taiwanese
TA
BL
E2.
Inte
r(G
st),
Intr
a(H
s),
an
dT
ota
l(H
t)P
opu
lati
onV
ari
an
ce
Loc
us
Afr
ica
Ch
ina
Ind
ones
ian
Arc
hip
elago
Paci
fic
pop
ula
tion
sS
outh
east
Asi
aT
aiw
an
ese
abor
igin
esA
llp
opu
lati
ons
Gst
Hs
Ht
Gst
Hs
Ht
Gst
Hs
Ht
Gst
Hs
Ht
Gst
Hs
Ht
Gst
Hs
Ht
Gst
Hs
Ht
D8S
1179
0.0
11441
0.7
78393
0.7
87402
0.0
08241
0.8
46774
0.8
53811
0.0
07614
0.8
45357
0.8
51842
0.0
15338
0.8
19269
0.8
32030
0.0
10157
0.8
45634
0.8
54311
0.0
70845
0.7
69315
0.8
27973
0.0
35708
0.8
14310
0.8
44464
D21S
110.0
08926
0.8
53657
0.8
61345
0.0
04005
0.8
16930
0.8
20216
0.0
08777
0.8
49134
0.8
56652
0.0
17495
0.8
19664
0.8
34259
0.0
09099
0.8
38645
0.8
46345
0.0
37838
0.8
14309
0.8
46333
0.0
29584
0.8
29880
0.8
55179
D7S
820
0.0
10135
0.7
59868
0.7
67648
0.0
08192
0.7
51428
0.7
57635
0.0
03065
0.7
71376
0.7
73747
0.0
23009
0.7
95827
0.8
14570
0.0
04970
0.7
60555
0.7
64354
0.0
40620
0.7
41298
0.7
72684
0.0
32394
0.7
60670
0.7
86136
CS
F1P
00.0
31482
0.7
72736
0.7
97854
0.0
27997
0.7
311
18
0.7
52176
0.0
05778
0.7
18651
0.7
22828
0.0
11209
0.7
11704
0.7
19772
0.0
11223
0.7
06941
0.7
14965
0.0
27576
0.7
12276
0.7
32475
0.0
50785
0.7
27388
0.7
66305
D3S
1358
0.0
09851
0.7
26665
0.7
33894
0.0
09677
0.7
18748
0.7
25771
0.0
10625
0.7
07418
0.7
15015
0.0
0611
20.7
21023
0.7
25457
0.0
09960
0.7
34915
0.7
42309
0.0
23178
0.6
94551
0.7
11031
0.0
14308
0.7
17385
0.7
27798
TH
01
0.0
08052
0.7
33299
0.7
39251
0.0
08625
0.6
67912
0.6
73723
0.0
23866
0.7
64891
0.7
83593
0.0
76644
0.7
43742
0.8
05477
0.0
16681
0.7
48371
0.7
61066
0.0
68909
0.6
77258
0.7
27381
0.0
62892
0.7
14071
0.7
61994
D13S
317
0.0
11208
0.7
28255
0.7
36510
0.0
09611
0.7
89574
0.7
97236
0.0
05852
0.7
83208
0.7
87819
0.0
27634
0.7
80455
0.8
02635
0.0
13393
0.7
84972
0.7
95628
0.0
44930
0.6
88956
0.7
21367
0.0
57370
0.7
55458
0.8
01437
D16S
539
0.0
09348
0.7
84605
0.7
92009
0.0
21980
0.7
78645
0.7
96144
0.0
05237
0.7
80046
0.7
84153
0.0
16466
0.7
82389
0.7
95487
0.0
20617
0.7
77718
0.7
94090
0.0
28799
0.7
70164
0.7
93002
0.0
25986
0.7
78625
0.7
99398
D2S
1338
0.0
09069
0.8
84462
0.8
92557
0.0
07362
0.8
56669
0.8
63022
0.0
10642
0.8
43022
0.8
52090
0.0
16009
0.8
60264
0.8
74260
0.0
11895
0.8
52154
0.8
62412
0.0
32771
0.8
16744
0.8
44416
0.0
27342
0.8
52374
0.8
76334
D19S
433
0.0
10840
0.8
27658
0.8
36728
0.0
03315
0.8
10767
0.8
13464
0.0
07100
0.8
16281
0.8
2211
80.0
33621
0.8
01717
0.8
29609
0.0
06271
0.8
07996
0.8
13095
0.0
42871
0.7
70510
0.8
05022
0.0
29562
0.8
04310
0.8
28811
vW
A0.0
08079
0.8
14126
0.8
20757
0.0
07281
0.7
8911
30.7
94900
0.0
14347
0.8
02726
0.8
14411
0.0
21796
0.7
85993
0.8
03506
0.0
10067
0.7
90185
0.7
98221
0.0
22487
0.7
89826
0.8
07995
0.0
34147
0.7
94907
0.8
23009
TP
OX
0.0
18326
0.7
64880
0.7
79158
0.0
04463
0.6
04731
0.6
07442
0.0
35480
0.6
21513
0.6
44375
0.0
84569
0.6
51579
0.7
11773
0.0
05010
0.6
05996
0.6
09048
0.0
39790
0.5
97916
0.6
22693
0.0
54058
0.6
40204
0.6
76790
D18S
51
0.0
07758
0.8
65423
0.8
72189
0.0
04716
0.8
59470
0.8
63543
0.0
10332
0.8
29943
0.8
38607
0.0
25463
0.8
41024
0.8
62999
0.0
09704
0.8
40805
0.8
49044
0.0
32125
0.7
88350
0.8
14517
0.0
30903
0.8
37835
0.8
64552
D5S
818
0.0
09096
0.7
58130
0.7
65089
0.0
06724
0.7
68634
0.7
73837
0.0
10130
0.7
35808
0.7
43338
0.0
15670
0.7
72990
0.7
85296
0.0
04388
0.7
77419
0.7
80845
0.0
41028
0.7
11467
0.7
41906
0.0
37136
0.7
54406
0.7
83502
FG
A0.0
07607
0.8
77704
0.8
84431
0.0
06394
0.8
65037
0.8
70603
0.0
09999
0.8
62847
0.8
71562
0.0
17363
0.8
29773
0.8
44435
0.0
05737
0.8
511
39
0.8
56050
0.0
48356
0.8
15540
0.8
56981
0.0
24876
0.8
49994
0.8
71678
All
0.0
11350
0.7
95324
0.8
04455
0.0
09179
0.7
77037
0.7
84235
0.0
10953
0.7
82148
0.7
90810
0.0
26919
0.7
811
61
0.8
02771
0.0
09993
0.7
81563
0.7
89452
0.0
40195
0.7
43899
0.7
75052
0.0
36095
0.7
75454
0.8
04493
556 S. MIRABAL ET AL.
American Journal of Physical Anthropology
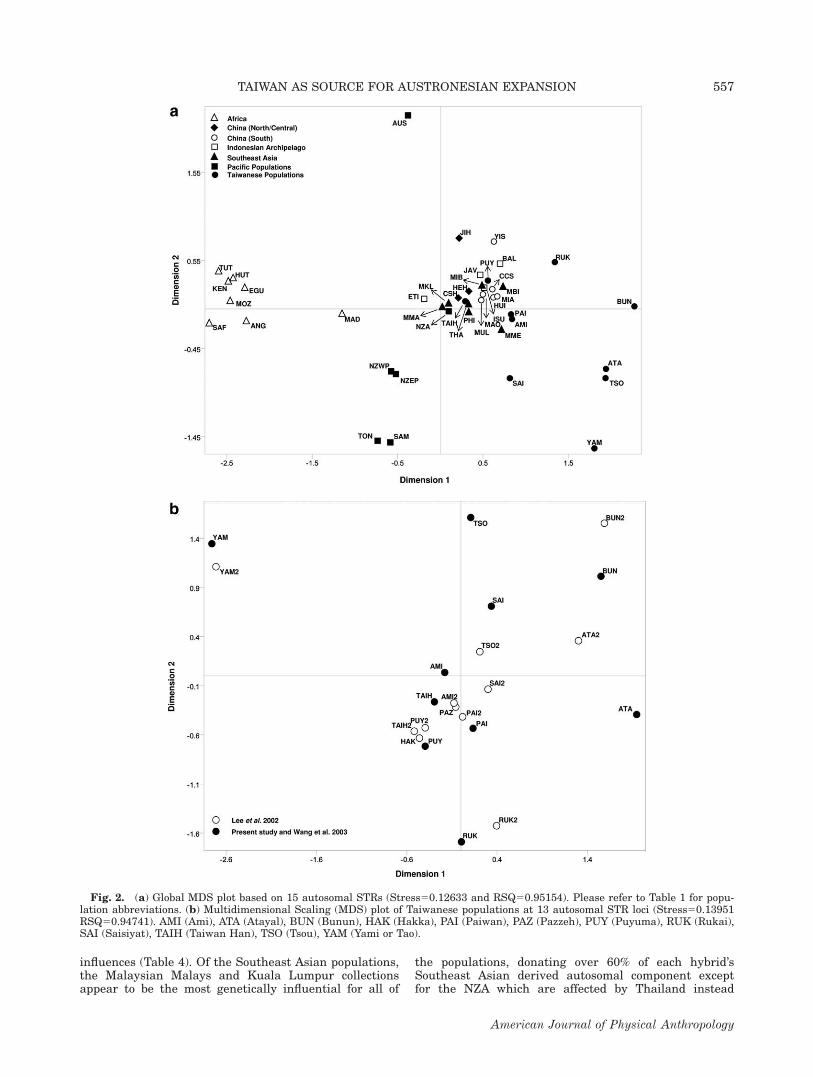
influences (Table 4). Of the Southeast Asian populations,the Malaysian Malays and Kuala Lumpur collectionsappear to be the most genetically influential for all of
the populations, donating over 60% of each hybrid’sSoutheast Asian derived autosomal component exceptfor the NZA which are affected by Thailand instead
Fig. 2. (a) Global MDS plot based on 15 autosomal STRs (Stress50.12633 and RSQ50.95154). Please refer to Table 1 for popu-lation abbreviations. (b) Multidimensional Scaling (MDS) plot of Taiwanese populations at 13 autosomal STR loci (Stress50.13951RSQ50.94741). AMI (Ami), ATA (Atayal), BUN (Bunun), HAK (Hakka), PAI (Paiwan), PAZ (Pazzeh), PUY (Puyuma), RUK (Rukai),SAI (Saisiyat), TAIH (Taiwan Han), TSO (Tsou), YAM (Yami or Tao).
TAIWAN AS SOURCE FOR AUSTRONESIAN EXPANSION 557
American Journal of Physical Anthropology

(Table 4). East Timor (the only Melanesian collection inthis study) is the greatest individual donor within theIndonesian grouping with values ranging from 88.6% inthe Australian aborigines to 30.2% in the NZA (Table 4).
Pair-wise familial relationships between individualswithin tribes are presented in Supporting InformationTable 12. It is apparent that considerable allele sharingexists within all the Taiwanese tribes examined in thisstudy, given that each individual within every popula-tion was determined by the software to be a HS to atleast one other individual within the tribes investigated.In order to ascertain whether familial ties lie at the rootof the population relationships observed in our study,individuals that appear to be FS or PO were removedfrom the analyses employed to generate the MDS plotpresented in Supporting Information Figure 4. It isapparent that although some minor changes haveoccurred (for example, the Puyuma population typed inthis article no longer maps together with the TaiwanHan, Hakka and Puyuma populations from Lee et al.,2002, see Fig. 2b), the overall relationships depicted inthis plot have not changed dramatically suggesting thatthe trends observed throughout this study are not
merely due to recent familial relationships but likely toancestral relatedness.
DISCUSSION
Genetic relationships within Taiwan and withmainland China
Population relationships in the global MDS plot (Fig.2a) display a clear agglutination of Southern Chinesegroups independent of ethno-linguistic affiliations (seeTable 1 for linguistic affiliations). Three Taiwanesepopulations (Ami, Paiwan and Puyuma) are found inclose proximity to the aforementioned cluster; however,the rest of the Taiwanese aborigines are found scat-tered to the right of the chart with no clear partition-ing among them. The relationship between southernmainland populations and aboriginal groups is furthersupported by admixture proportions indicating stronggenetic relationships between the Tai-Kadai (Daic)speaking groups (Mulaos and Maonans) and all Formo-san collections (Table 3). It is interesting to note thatthe other (non-Daic) southern mainland groups displaylittle influence in comparison, and only the Huis make
Fig. 3. Structure projections of Taiwanese aborigines, Madagascar and Tonga utilizing 15 autosomal STRs.
558 S. MIRABAL ET AL.
American Journal of Physical Anthropology

a major contribution (48.2% in the Rukai) attesting tothe plausibility of a Daic origin for Taiwanese aborigi-nes (Li et al., 2008). This presence from the Huis inthe Rukai and to a lesser extent in the Atayal (15.3%)and Puyuma (21.7%) may emanate from the highlyadmixed nature of the Huis which represents an amal-gamation of descendants from Silk Road travelers thatdistinguish themselves from other Chinese ethnicgroups by their practice of Islam. On the other hand,the Taiwanese Han collection is most influenced by theShaanxi (a northern Han population) and the ChaoShan (a southern Han group) and receives only 1–10%of its genetics from each of the remaining populationsincluded except for the Yis who are Tibeto-Burmanspeakers (Table 3). This is expected, considering thatthe Min Nan and Hakka languages (Han Chinese lin-guistic groups) are both largely represented within Tai-wan (Chiung, 2001).
Despite some overall similarities in the populationsthat exert genetic effects on the Formosan tribes (Table3), there exists high variability between the degrees ofadmixture with Han groups and in the contributions ofany given southern Chinese collection to each of the abo-riginal populations (Table 3). These differences are ech-oed in all MDS plots (Fig. 2a,b, Supporting InformationFig. 1) where Taiwanese aborigines exhibit no clear par-titioning among them and appear as separate from eachother as they are from Island Southeast Asian, Indone-sians and mainland Asian populations (Fig. 2a). Fur-thermore, sampling appears to make a definitive impacton the results from studies utilizing Taiwanese aborigi-nes [For example Kayser et al., 2003, 2006, 2008 seevery few O-M122 derived Y-chromosomes whereas Suet al. (2000) and Mirabal et al. (2012) observe this hap-logroup at considerable frequencies in the Ami (37%)],leading to the widespread differences between groupsidentified as belonging to the same tribes but publishedelsewhere (Lee et al., 2002) and our results (Fig. 2b).These differences may be the result of reduced gene flowamong sub-tribal communities which has previouslybeen observed in the Yami of Orchid Island (Loo et al.,2011). It should also be noted that when individuals thatmay be related to each other are removed from the gen-eral collections, the observed differences in the MDS plotare not substantial (see Supporting Information Fig. 4and Fig. 2b) suggesting that the relationships observedthroughout this study are not due to recent contact butmay emanate from ancestral ties.
Genetic distances among Taiwanese aborigines(Gst50.040195) are such that inter-population varianceindices are higher than those found among Pacific popu-lations (Gst50.026919) which are geographically isolatedand contain major biogeographical barriers betweenthem in the form of vast open oceanic distances. Corrob-orating these statements are the low heterozygosityvalues (Table 1), severe heterozygote deficiencies (Sup-porting Information Table 10), high number of lociexhibiting positive inbreeding coefficient correlations(Supporting Information Table 11) and the lowest intra-population variance of all the groups of populations ana-lyzed (Hs50.743899) exhibited by the Taiwanese tribes(Table 2). Altogether, these data suggest that while Tai-wanese tribes are genetically different from each other,they are internally highly homogenous, likely due to con-tinued endogamy and genetic drift. These data parallellinguistic divergences between tribes given that thoughsome words are shared across the various Formosan
TA
BL
E3.
Au
toso
ma
lC
ontr
ibu
tion
sof
Ch
ines
eP
opu
lati
ons
toT
aiw
an
ese
Abor
igin
es
Pare
nta
lp
opu
lati
on
Hybri
dP
opu
lati
ons
Am
iA
tayal
Bu
nu
nP
aiw
an
Pu
yu
ma
Ru
kai
Sais
iyat
Tso
uY
am
iT
aiw
an
Han
Ch
ao
Sh
an
0.0
006
0.0
95
0.0
006
0.0
53
0.0
006
0.0
08
0.0
006
0.0
74
0.0
006
0.0
75
0.0
006
0.0
84
0.0
006
0.0
54
0.0
006
0.0
15
0.0
006
0.0
28
0.1
976
0.0
73
Hen
an
0.1
426
0.1
54
0.0
006
0.0
58
0.0
006
0.0
16
0.0
006
0.0
36
0.0
006
0.1
54
0.0
006
0.1
31
0.0
006
0.0
39
0.0
006
0.0
83
0.3
296
0.2
73
0.0
236
0.0
68
Hu
is0.0
006
0.0
02
0.1
536
0.2
22
0.0
006
0.0
92
0.0
006
0.1
47
0.2
176
0.1
87
0.4
826
0.2
87
0.0
006
0.0
87
0.0
006
0.0
40
0.0
006
0.0
86
0.0
816
0.0
60
Jin
an
0.0
006
0.0
07
0.0
006
0.0
22
0.0
006
0.0
47
0.0
736
0.0
81
0.0
006
0.0
19
0.0
006
0.0
39
0.0
566
0.0
92
0.0
006
0.0
28
0.2
756
0.1
88
0.0
106
0.0
22
Maos
0.4
266
0.1
70
0.0
006
0.0
83
0.0
006
0.0
79
0.4
396
0.2
41
0.0
006
0.1
22
0.3
476
0.2
22
0.0
006
0.1
01
0.0
476
0.1
83
0.0
006
0.0
85
0.0
406
0.0
46
Mia
os0.0
006
0.0
77
0.0
006
0.1
14
0.0
006
0.0
15
0.0
006
0.0
56
0.0
006
0.0
87
0.0
006
0.0
33
0.0
006
0.0
82
0.0
436
0.2
20
0.0
006
0.1
71
0.0
546
0.0
47
Mu
laos
0.2
156
0.1
41
0.8
476
0.2
46
1.0
006
0.1
40
0.3
706
0.2
16
0.4
186
0.2
13
0.0
256
0.1
53
0.9
256
0.1
74
0.8
146
0.2
65
0.3
806
0.2
55
0.0
996
0.0
57
Sh
aan
xi
0.2
176
0.1
85
0.0
006
0.0
21
0.0
006
0.0
49
0.0
736
0.1
30
0.3
656
0.2
33
0.0
316
0.1
38
0.0
006
0.0
43
0.0
006
0.0
22
0.0
006
0.0
51
0.4
956
0.0
87
Yis
0.0
006
0.0
38
0.0
006
0.0
44
0.0
006
0.0
14
0.0
456
0.0
68
0.0
006
0.0
64
0.1
166
0.1
13
0.0
196
0.0
81
0.0
976
0.1
22
0.0
166
0.0
86
0.0
006
0.0
09
TAIWAN AS SOURCE FOR AUSTRONESIAN EXPANSION 559
American Journal of Physical Anthropology
TA
BL
E4.
Ad
mix
ture
Pro
por
tion
sof
Au
stro
nes
ian
Pop
ula
tion
s
Pare
nta
lgro
up
s
Hybri
dp
opu
lati
ons
New
Zea
lan
d(W
P)
New
Zea
lan
d(E
P)
New
Zea
lan
d(A
s)M
ad
agasc
ar
Sam
oaT
onga
Au
stra
lian
Abor
igin
es
Ch
ines
e0.0
006
0.1
64
0.1
356
0.2
18
0.7
056
0.0
62
0.0
006
0.1
110.0
006
0.1
33
0.0
006
0.1
00
0.0
006
0.0
66
Ind
ones
ia0.2
856
0.1
80
0.0
006
0.1
27
0.0
766
0.0
54
0.3
686
0.2
28
0.2
216
0.2
03
0.3
926
0.2
23
1.0
006
0.0
83
Sou
thea
stA
sia
0.2
826
0.2
60
0.6
636
0.2
80
0.1
056
0.0
83
0.3
536
0.2
71
0.3
806
0.2
47
0.1
586
0.2
35
0.0
006
0.0
00
Taiw
an
ese
Abor
igin
es0.4
336
0.1
55
0.2
026
0.1
75
0.1
146
0.0
41
0.2
796
0.1
77
0.3
996
0.1
76
0.4
516
0.1
83
0.0
006
0.0
47
Pare
nta
lp
opu
lati
ons
Ch
ines
eH
enan
–0.0
006
0.1
30
0.0
006
0.0
76
––
––
Jin
an
–0.0
006
0.0
75
0.0
636
0.0
46
––
––
Ch
ao
Sh
an
–0.0
006
0.0
32
0.0
156
0.0
48
––
––
Sh
aan
xi
–0.3
596
0.2
37
0.4
636
0.0
94
––
––
Hu
is–
0.0
006
0.1
81
0.1
356
0.1
03
––
––
Yis
–0.1
246
0.1
16
0.0
376
0.0
25
––
––
Mia
os–
0.0
006
0.0
30
0.0
006
0.0
21
––
––
Mu
laos
–0.5
106
0.2
31
0.2
576
0.0
64
––
––
Maos
–0.0
076
0.1
22
0.0
306
0.0
51
––
––
Ind
ones
iaS
ura
baya
0.3
146
0.1
57
–0.4
876
0.1
00
0.3
826
0.1
45
0.3
306
0.1
69
0.2
726
0.1
64
0.0
006
0.0
32
Bali
0.0
826
0.1
18
–0.2
116
0.0
70
0.0
006
0.0
16
0.1
066
0.1
15
0.0
006
0.0
77
0.0
656
0.1
23
Java
0.0
006
0.0
33
–0.0
006
0.0
57
0.0
006
0.0
26
0.0
006
0.0
35
0.0
006
0.0
110.0
496
0.0
98
East
Tim
or0.6
036
0.1
46
–0.3
026
0.0
90
0.6
186
0.1
42
0.5
646
0.1
47
0.7
286
0.1
79
0.8
866
0.1
51
Sou
thea
stA
sia
Ku
ala
Lu
mp
ur
0.4
886
0.2
44
0.0
856
0.1
70
0.0
626
0.0
77
0.3
576
0.2
46
0.1
886
0.2
13
0.3
066
0.2
48
–M
ala
y0.3
026
0.2
15
0.6
436
0.2
53
0.0
896
0.0
87
0.5
286
0.2
56
0.5
726
0.2
63
0.3
976
0.2
65
–Ib
an
0.0
006
0.0
04
0.0
006
0.0
52
0.0
006
0.0
00
0.0
006
0.0
54
0.0
006
0.0
02
0.0
006
0.0
52
–B
idu
yar
0.0
006
0.0
40
0.0
006
0.0
86
0.0
006
0.0
04
0.0
006
0.0
03
0.0
006
0.0
47
0.0
006
0.0
32
–M
enel
au
0.0
476
0.0
81
0.0
006
0.0
53
0.0
106
0.0
32
0.0
306
0.0
69
0.2
096
0.1
23
0.1
336
0.1
29
–P
hil
ipp
ines
0.1
636
0.1
60
0.2
356
0.1
51
0.1
776
0.0
61
0.0
846
0.1
23
0.0
316
0.1
16
0.1
646
0.1
81
–T
hail
an
d0.0
006
0.1
26
0.0
386
0.1
49
0.6
626
0.0
97
0.0
006
0.0
56
0.0
006
0.1
110.0
006
0.0
60
–T
aiw
an
ese
Abor
igin
esA
mi
0.0
336
0.1
19
0.2
706
0.1
77
0.3
416
0.0
88
0.1
876
0.1
32
0.0
006
0.1
09
0.0
006
0.1
12
–A
tayal
0.0
276
0.0
59
0.0
036
0.0
58
0.0
256
0.0
41
0.0
696
0.0
78
0.0
006
0.0
48
0.0
416
0.0
70
–B
un
un
0.0
006
0.0
43
0.0
006
0.0
48
0.0
096
0.0
37
0.0
006
0.0
41
0.0
006
0.0
36
0.0
006
0.0
51
–R
uk
ai
0.0
026
0.0
79
0.0
006
0.0
53
0.0
006
0.0
34
0.0
006
0.0
21
0.0
006
0.0
83
0.0
006
0.0
45
–P
aiw
an
0.3
286
0.1
10
0.2
916
0.1
28
0.1
716
0.0
80
0.3
826
0.1
23
0.3
956
0.1
43
0.2
936
0.1
21
–P
uyu
ma
0.1
906
0.1
10
0.2
306
0.1
31
0.2
906
0.0
91
0.1
776
0.1
29
0.1
296
0.1
06
0.1
996
0.1
40
–S
ais
iyat
0.2
716
0.0
98
0.1
296
0.1
04
0.1
006
0.0
63
0.1
856
0.1
05
0.3
596
0.1
110.2
386
0.1
15
–T
sou
0.0
566
0.0
74
0.0
666
0.0
76
0.0
006
0.0
35
0.0
006
0.0
53
0.0
266
0.0
75
0.1
466
0.1
14
–Y
am
i0.0
926
0.0
70
0.0
106
0.0
55
0.0
656
0.0
46
0.0
006
0.0
15
0.0
916
0.0
75
0.0
836
0.0
73
–
Hyp
hen
sare
ind
icati
ve
ofp
opu
lati
ons
wit
hou
tin
pu
tat
the
gro
up
level
wer
en
otan
aly
zed
at
the
ind
ivid
ual
level
for
that
giv
ense
tof
pop
ula
tion
s.
560 S. MIRABAL ET AL.
American Journal of Physical Anthropology
languages, they are mostly intelligible from each other(Blust, 1999).
The Structure analyses provide another clue into thecurrent genetic relationships within Taiwan, illustratingsignatures shared by the Ami, Paiwan, Puyuma andRukai (yellow) and between the Bunun and Tsou (blue),while the Atayal, Saisiyat and Yami emerge as highlydifferentiated from each other and any of the othergroups (k56, Fig. 3). No further subpopulation structurewas observed by increasing the number of sources (kvalues).
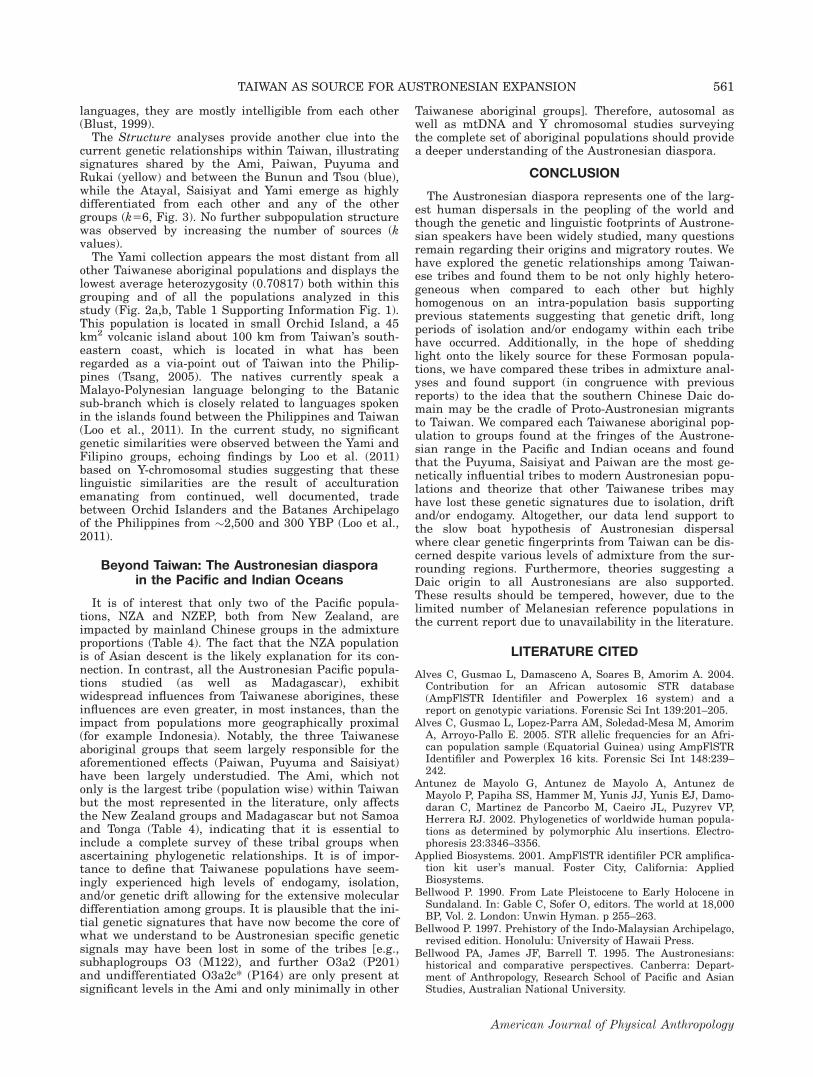
The Yami collection appears the most distant from allother Taiwanese aboriginal populations and displays thelowest average heterozygosity (0.70817) both within thisgrouping and of all the populations analyzed in thisstudy (Fig. 2a,b, Table 1 Supporting Information Fig. 1).This population is located in small Orchid Island, a 45km2 volcanic island about 100 km from Taiwan’s south-eastern coast, which is located in what has beenregarded as a via-point out of Taiwan into the Philip-pines (Tsang, 2005). The natives currently speak aMalayo-Polynesian language belonging to the Batanicsub-branch which is closely related to languages spokenin the islands found between the Philippines and Taiwan(Loo et al., 2011). In the current study, no significantgenetic similarities were observed between the Yami andFilipino groups, echoing findings by Loo et al. (2011)based on Y-chromosomal studies suggesting that theselinguistic similarities are the result of acculturationemanating from continued, well documented, tradebetween Orchid Islanders and the Batanes Archipelagoof the Philippines from �2,500 and 300 YBP (Loo et al.,2011).
Beyond Taiwan: The Austronesian diasporain the Pacific and Indian Oceans
It is of interest that only two of the Pacific popula-tions, NZA and NZEP, both from New Zealand, areimpacted by mainland Chinese groups in the admixtureproportions (Table 4). The fact that the NZA populationis of Asian descent is the likely explanation for its con-nection. In contrast, all the Austronesian Pacific popula-tions studied (as well as Madagascar), exhibitwidespread influences from Taiwanese aborigines, theseinfluences are even greater, in most instances, than theimpact from populations more geographically proximal(for example Indonesia). Notably, the three Taiwaneseaboriginal groups that seem largely responsible for theaforementioned effects (Paiwan, Puyuma and Saisiyat)have been largely understudied. The Ami, which notonly is the largest tribe (population wise) within Taiwanbut the most represented in the literature, only affectsthe New Zealand groups and Madagascar but not Samoaand Tonga (Table 4), indicating that it is essential toinclude a complete survey of these tribal groups whenascertaining phylogenetic relationships. It is of impor-tance to define that Taiwanese populations have seem-ingly experienced high levels of endogamy, isolation,and/or genetic drift allowing for the extensive moleculardifferentiation among groups. It is plausible that the ini-tial genetic signatures that have now become the core ofwhat we understand to be Austronesian specific geneticsignals may have been lost in some of the tribes [e.g.,subhaplogroups O3 (M122), and further O3a2 (P201)and undifferentiated O3a2c* (P164) are only present atsignificant levels in the Ami and only minimally in other
Taiwanese aboriginal groups]. Therefore, autosomal aswell as mtDNA and Y chromosomal studies surveyingthe complete set of aboriginal populations should providea deeper understanding of the Austronesian diaspora.
CONCLUSION
The Austronesian diaspora represents one of the larg-est human dispersals in the peopling of the world andthough the genetic and linguistic footprints of Austrone-sian speakers have been widely studied, many questionsremain regarding their origins and migratory routes. Wehave explored the genetic relationships among Taiwan-ese tribes and found them to be not only highly hetero-geneous when compared to each other but highlyhomogenous on an intra-population basis supportingprevious statements suggesting that genetic drift, longperiods of isolation and/or endogamy within each tribehave occurred. Additionally, in the hope of sheddinglight onto the likely source for these Formosan popula-tions, we have compared these tribes in admixture anal-yses and found support (in congruence with previousreports) to the idea that the southern Chinese Daic do-main may be the cradle of Proto-Austronesian migrantsto Taiwan. We compared each Taiwanese aboriginal pop-ulation to groups found at the fringes of the Austrone-sian range in the Pacific and Indian oceans and foundthat the Puyuma, Saisiyat and Paiwan are the most ge-netically influential tribes to modern Austronesian popu-lations and theorize that other Taiwanese tribes mayhave lost these genetic signatures due to isolation, driftand/or endogamy. Altogether, our data lend support tothe slow boat hypothesis of Austronesian dispersalwhere clear genetic fingerprints from Taiwan can be dis-cerned despite various levels of admixture from the sur-rounding regions. Furthermore, theories suggesting aDaic origin to all Austronesians are also supported.These results should be tempered, however, due to thelimited number of Melanesian reference populations inthe current report due to unavailability in the literature.
LITERATURE CITED
Alves C, Gusmao L, Damasceno A, Soares B, Amorim A. 2004.Contribution for an African autosomic STR database(AmpFlSTR Identifiler and Powerplex 16 system) and areport on genotypic variations. Forensic Sci Int 139:201–205.
Alves C, Gusmao L, Lopez-Parra AM, Soledad-Mesa M, AmorimA, Arroyo-Pallo E. 2005. STR allelic frequencies for an Afri-can population sample (Equatorial Guinea) using AmpFlSTRIdentifiler and Powerplex 16 kits. Forensic Sci Int 148:239–242.
Antunez de Mayolo G, Antunez de Mayolo A, Antunez deMayolo P, Papiha SS, Hammer M, Yunis JJ, Yunis EJ, Damo-daran C, Martinez de Pancorbo M, Caeiro JL, Puzyrev VP,Herrera RJ. 2002. Phylogenetics of worldwide human popula-tions as determined by polymorphic Alu insertions. Electro-phoresis 23:3346–3356.
Applied Biosystems. 2001. AmpFlSTR identifiler PCR amplifica-tion kit user’s manual. Foster City, California: AppliedBiosystems.
Bellwood P. 1990. From Late Pleistocene to Early Holocene inSundaland. In: Gable C, Sofer O, editors. The world at 18,000BP, Vol. 2. London: Unwin Hyman. p 255–263.
Bellwood P. 1997. Prehistory of the Indo-Malaysian Archipelago,revised edition. Honolulu: University of Hawaii Press.
Bellwood PA, James JF, Barrell T. 1995. The Austronesians:historical and comparative perspectives. Canberra: Depart-ment of Anthropology, Research School of Pacific and AsianStudies, Australian National University.
TAIWAN AS SOURCE FOR AUSTRONESIAN EXPANSION 561
American Journal of Physical Anthropology

Beleza S. Alves C, Reis F, Amorim A, Carracedo A, Gusmao L.2004. 17 STR data (AmpFlSTR Identifiler and Powerplex 16system) from Cabinda (Angola). Forensic Sci Int 14:193–196.
Bright JA, Buckelton JS, McGovern CE. 2010. Allele frequen-cies for the four major sub-populations of New Zealand forthe 15 Identifiler loci. Forensic Sci Int Genet 4:265–266.
Blust R. 1999. Subgrouping, circularity and extinction: someissues in Austronesian comparative linguistics. Symp Ser InstLinguist Acad Sinica I:31–94.
Brenner C, Morris J. 1989. Paternity index calculations in singlelocus hypervariable DNA probes: validation and other studies.In: Proceedings for the International Symposium on HumanIdentification Promega Corporation, Madison. p 21–53.
Capelli C, Wilson JF, Richards M, Stumpf MP, Gratrix F,Oppenheimer S, Underhill P, Pascali VL, Ko TM, GoldsteinDB. 2001. A predominantly indigenous paternal heritage forthe Austronesian-speaking peoples of insular Southeast Asiaand Oceania. AJHG 68:432–443.
Chiung WVT. 2001. Language attitudes toward written Taiwan-ese. J Multiling Multicult Dev 22:502–523.
Chu CC, Nakajima LM, Lee HL, Chang SL, Juji T, TokunagaK. 2001. Diversity of HLA among Taiwan’s indigenous tribesand the Ivatans in the Philippines. Tissue Antigens 58:9–18.
De Ungria MCA, Roby RK, Tabbada KA, Rao Coticone S, TanMM, Hernandez KN. 2005. Allele frequencies of 19 STR loci ina Philippine population generated using AmpFlSTR multiplexand ALF singleplex systems. Forensic Sci Int 152:281–284.
Diamond JM. 1988. Express train to Polynesia. Nature336:307–308.
Diamond JM. 2000. Taiwan’s gift to the world. Nature 403:709–710.Diamond JM, Bellwood P. 2003. Farmers and their languages:
the first expansions. Science 300:597–603.Dobashi Y, Kido A, Fujitani N, Hara M, Susukida R, Oya M.
2005. STR data for the AmpFLSTR Identifiler loci in Bangla-deshi and Indonesian populations. Legal Med 7:222–226.
Donohue M, Denham T. 2010. Farming and language in islandSoutheast Asia: reframing Austronesian history. Curr Anthro-pol 51:223–256.
Eckhoff C, Walsh S, Buckleton J. 2007. Population data fromsub-populations of the Northern Territory of Australia for 15autosomal short tandem repeat (STR) loci. Forensic Sci Int171:237–249.
Evanno G, Regnaut S, Goudet J. 2005. Detecting the number ofclusters of individuals using the software STRUCTURE: asimulation study. Mol Ecol 14:2611–2620.
Friedlaender JS, Friedlaender FR, Reed FA, Kidd KK, Kidd JR,Chambers GK, Lea RA, Loo JH, Koki G, Hodgson JA, Merri-wether DA, Weber JL, 2008. The genetic structure of Pacificislanders. PLoS Genet 4:e19.
Gray RD, Drummond AJ, and Greenhill SJ. 2009. Languagephylogenies reveal expansion pulses and pauses in Pacific set-tlement. Science 323:479–483.
Gray RD, Jordan FM. 2000. Language trees support theexpress-train sequence of Austronesian expansion. Nature405:1052–1055.
Green RC. 1999. Integrating historical linguistics with archaeol-ogy: insights from research in Remote Oceania. Indo-Pac Pre-hist Assoc Bull 18:3–16.
Greenhill SJ, Drummond AJ, Gray RD. 2010. How accurateand robust are the phylogenetic estimates of Austronesianlanguage relationships? PLoS One 5:e9573.
Grimes BF. 2002. Ethnologue: languages of the world, 14th ed.Dallas: International Academic Bookstore.
Guo S, Thompson E. 1992. Performing the exact test of Hardy–Weinberg proportion for multiple alleles. Biometrics 48:361–372.
Hagelberg E, Goldman N, Lio P, Whelan S, Schiefenhovel W,Clegg JV, Bowden DK. 1999. Evidence for mitochondrial DNArecombination in a human population of island Melanesia.Proc R Soc Lond B 226:485–492.
Hill C, Soares P, Mormina M, Macaulay V, Clarke D, BlumbachPB, Vizuete-Forster M, Forster P, Bulbeck D, Oppenheimer S,Richards M. 2007. A mitochondrial stratigraphy for islandSoutheast Asia. Am J Hum Genet 80:29–43.
Hu SP, Yu XJ, Liu JW, Cai KL. 2005. Analysis of STR polymor-phisms in the Chao Shan population in South China. ForensicSci Int 147:93–95.
Hurles ME, Nicholson J, Bosch E, Renfrew C, Sykes BC,Jobling MA. 2002. Y Chromosomal evidence for the origins ofOceanic-speaking peoples. Genetics 160:289–303.
Ibarra-Rivera L, Mirabal S, Regueiro M, Herrera RJ. 2008.Delineating genetic relationships among the Maya. Am JPhys Anthropol 135:329–347.
Jinam TA, Hong LC, Phipps ME, Stoneking M, Ameen M, EdoJ. 2012. Evolutionary history of continental Southeast Asians:“early train” hypothesis based on genetic analysis of mito-chondrial and autosomal DNA data. HUGO Pan-Asian SNPConsortium, Saitou N. Mol Biol Evol 29:3513–3527.
Jones DA. 1972. Blood samples: probability of discrimination. JForensic Sci Soc 12:355–359.
Jorde LB, Rogers AR, Bamshad M, Watkins WS, Krakowiak P,Sung S, Kere J, Harpending HC. 1997. Microsatellite diver-sity and the demographic history of modern humans. ProcNatl Acad Sci USA 94:3100–3103.
Kalinowski ST, AP Wagner, ML Taper. 2006. ML-Relate: a com-puter program for maximum likelihood estimation of related-ness and relationship. Mol Ecol Notes 6:576–579.
Karafet T, Hallmark B, Cox M, Sudoyo H, Downey S, LansingS, Hammer M. 2010. Major East-West division underlies Ychromosome stratification across Indonesia. Mol Biol Evol27:1833–1844.
Kayser M, Brauer S, Weiss G, Underhill PA, Roewer L, Schie-fenh€ovel W, Stoneking M. 2000. Melanesian origin of Polyne-sian Y chromosomes. Curr Biol 10:1237–1246.
Kayser M, Brauer S, Weiss G, Schiefenh€ovel W, Underhill P,Shen P, Oefner P, Tommaseo-Ponzetta M, Stoneking M. 2003.Reduced Y-chromosome, but not mitochondrial DNA, diversityin human populations from West New Guinea. Am J HumGenet 72:281–302.
Kayser M, Brauer S, Cordaux R, Casto A, Lao O, ZhivotovskyLA, Moyse-Faurie C, Rutledge RB, Schiefenhoevel W, Gil D,Lin AA, Underhill PA, Oefner PJ, Trent RJ, Stoneking M.2006. Melanesian and Asian origins of Polynesians: mtDNAand Y chromosome gradients across the Pacific. Mol Biol Evol23:2234–2244.
Kayser M, Lao O, Saar K, Brauer S, Wang X, N€urnberg P,Trent RJ, Stoneking M. 2008. Genome-wide analysis indicatesmore Asian than Melanesian ancestry of Polynesians. Am JHum Genet 82:194–198.
Kido A, Dobashi Y, Fujitani N, hara M, Susukida R, Kimura H,Oya M. 2007. Population data on the AmpFlSTR Identifilerloci in Africans and Europeans from South Africa ForensicSci Int 168:232–235.
Lee JC, Lin M, Tsai L, Hsu C, Hsieh H, Huang N, Shih RT,Wun J, Chang J, Ko Y, Tzeng C, Linacre A. 2002. Populationstudy of polymorphic microsatellite DNA in Taiwan. ForensicSci J 1:31–37.
Leibelt C, Budowle B, Collins P, Daoudi Y, Moretti T, Nunn G,Reeder D, Roby R. 2003. Identification of a D8S1179 primerbinding site mutation and the validation of a primer designedto recover null alleles. Forensic Sci Int 133:220–227.
Levene H. 1949. On a matching problem arising in genetics.Ann Math Stat 20: 91–94.
Li H, Cai X, Winograd-Cort ER, Wen B, Cheng X, Qin Z, Liu W,Liu Y, Pan S, Qian J, Tan C, Jin L. 2007. Mitochondrial DNAdiversity and population differentiation in southern EastAsia. Am J Phys Anthropol 134:481–488.
Li H, Wen B, Chen S, Su B, Pramoonjago P, Liu Y, Pan S, QinZ, Liu W, Cheng X, Yang N, Li X, Tran D, Lu D, Hsu M,Deka R, Marzuki S, Tan C, Jin L. 2008. Paternal genetic af-finity between western Austronesians and Daic populations.BMC Evol Biol 8:146.
Lin M, Broadberry RE. 1998. Immunohematology in Taiwan.Transfus Med Rev 12:56–72.
Lin M, Chu CC, Broadberry RE, Yu LC Loo JH, Trejaut JA.2005. Genetic diversity of Taiwan’s indigenous peoples: pos-sible relationship with insular Southeast Asia. In: Sagart L,Blench R, and A Sanchez-Mazas, editors. The peopling of
562 S. MIRABAL ET AL.
American Journal of Physical Anthropology
East Asia: putting together archaeology, linguistics andgenetics. London and New York: RoutledgeCurzon. p 230–247.
Lin M, Chu CC, Lee HL, Chang SL, Ohashi J, Tokunaga K,Akaza T, Juji T. 2000. Heterogeneity of Taiwan’s indigenouspopulation: possible relation to prehistoric Mongoloid disper-sals. Tissue Antigens 55:1–9.
Liu C, Liu C, Wang H. 2006a. STR data for the 15 loci fromthree minority populations in Guangxi municipality in SouthChina. Forensic Sci Int 162:49–52.
Liu C, Liu C, Wang H. 2006b. Genetic diversity at 15 STR lociin two tribal populations in Southern China. Forensic Sci Int162:28–32.
Long JC, Williams RC, McAuley JE, Medis R, Partel R, Tregel-las WM, South SF, Rea AE, McCormick SB, Iwaniec U. 1991.Genetic variation in Arizona Mexican Americans: estimationand interpretation of admixture proportions. Am J PhysAnthropol 84:141–157.
Loo J, Trejaut J, Yen J, Chen Z, Lee C, Lin M. 2011. Geneticaffinities between the Yami tribe people of Orchid Island andthe Philippine islanders of the Batanes Archipelago. BMCGenet 12:21.
Lum JK. 1998. Central and Eastern Micronesia: genetics, theovernight voyage, and linguistic divergence. Man Cult Oce-ania 14:69–80.
Maruyama S, Minaguchi K, Takezaki N, Nambiar P. 2008. Pop-ulation data on 15 STR loci using AmpF/STR Identifiler kit ina Malay population living in and around Kuala Lumpur,Malaysia. Legal Med 10:160–162.
Melton T, Peterson R, Redd AJ, Saha N, Sofro AS, Martinson J,Stoneking M. 1995. Evolutionary history of the CoII/tRNALysintergenic 9 base pair deletion in human mitochondrial DNAsfrom the Pacific. Mol Biol Evol 12:60–615.
Mirabal S, Herrera KJ, Gayden T, Regueiro M, Underhill PA.2012. Increased Y-chromosome resolution of haplogroup O sug-gests genetic ties between the Ami aborigines of Taiwan andthe Polynesian Islands of Samoa and Tonga. Gene 492:339–348.
Novick GE, Novick CC, Yunis J, Yunis E, Martinez K, Duncan GG,Troup GM, Deininger PL, Stoneking M, Batzer MA, Herrera RJ.1995. Polymorphic human specific Alu insertions as markers forhuman identification. Electrophoresis 16:1596–1601.
Oppenheimer SJ, Richards M. 2001. Polynesian origins. Slowboat to Melanesia? Nature 410:166–167.
Ota T. 1993. DISPAN: genetic distance and phylogenetic analy-sis. University Park, PA: Institute of Molecular EvolutionaryGenetics, Pennsylvania State University.
Perez-Miranda AM, Alfonso-Sanchez MA, Pena JA, Herrera RJ.2006. Qatari DNA variation at a crossroad of human migra-tions. Hum Hered 61:67–79.
Perez-Miranda AM, Alfonso-Sanchez MA, Pe~na JA, PancorboMM de , Herrera RJ. 2005. Genetic polymorphisms at 13 STRloci in autochthonous Basques from Alava province (Spain).Legal Med 7:58–61.
Pritchard JK, Stephens M, Donnelly P. 2000. Inference of popu-lation structure using multilocus genotype data. Genetics155:945–959.
Razafindrazaka H, Ricaut FX, Cox MP, Mormina M, DugoujonJM, Randriamarolaza LP, Guitard E, Tonasso L, Ludes B,Crub�ezy E. 2010. Complete mitochondrial DNA sequencesprovide new insights into the Polynesian motif and the peopleof Madagascar. Eur J Hum Genet 18:575–581.
Raymond M, Rousset F. 1995. An exact test for population dif-ferentiation. Evolution 149:1280–1283.
Regueiro M, Carril JC, Pontes ML, Pinheiro MF, Luis JR,Caeiro B. 2004. Allele distribution of 15 PCR-based loci in theRwanda Tutsi population by multiplex amplification and cap-illary electrophoresis. Forensic Sci Int 143:61–63.
Regueiro M, Mirabal S, Lacau H, Caeiro JL, Garcia-Bertrand R,Herrera RJ. 2008. Austronesian genetic signature in East AfricanMadagascar and Polynesia. J Hum Genet 53:106–120.
Rerkamnuaychoke B, Rinthachai T, Shotivaranon J, JomsawatU, Siriboonpiputtana T, Chaiatchanarat K, Pasomsub E,Chantratita W. 2006. Thai population data on 15 tetrameric
STR loci—D8S1179, D21S11, D7S820, CSF1PO, D3S1358,TH01, D13S317, D16S539, D2S1338, D19S433, vWA, TPOX,D18S51, D5S818 and FGA. Forensic Sci Int 158:234–237.
Rolett VB, Tsang CH. 2001. The Austronesian homeland: newevidence for early voyaging. In: International Symposium onAustronesian cultures: Issues Relating to Taiwan (Archaeol-ogy). Dec 8–11. Taipei (Taiwan): Academia Sinica. p 1–2.
Rowold DJ, Herrera RJ. 2003. Inferring recent phylogeniesusing forensic STR technology. Forensic Sci Int 133:260–265.
Ruhlen M. 1994. The origin of language: tracing the evolutionof the mother tongue. New York: Wiley. p170–180.
Sagart L. 2004. Sino-Tibetan-Austronesian: an updated andimproved argument. In: Sagart L, Blench R, Sanchez-MazasA, editors. The peopling of East Asia: putting togetherarchaeology, linguistics and genetics. London: RoutledgeCur-zon. p 161–176.
Sagart L. 2005. The higher phylogeny of Austronesian and theposition of Tai-Kadai. Oceanic Linguist 43:411–444.
Schneider S, Roessli D, Excoffier L. 2000. Arlequin v.2000: asoftware for population genetics data analysis. Geneva:Genetics and Biometry Laboratory, University of Geneva.
Shepard EM, Chow RA, Suafo E, Addison D, Perez-Miranda PE,Garcia-Bertrand RL, Herrera RJ. 2005. Autosomal STR varia-tion in five Austronesian populations. Hum Biol 77:825–851.
Seah LH, Jeevan NH, Othman MI, Jaya P, Ooi YS, Wang PR,Kee SS. 2003. STR data for the AmpFlSTR Identifiler loci inthree ethnic groups (Malay, Chinese, Indian) of the Malaysianpopulation. Forensic Sci Int 138:134–137.
Shepard EM, Herrera RJ. 2006. Genetic encapsulation amongNear Eastern populations. J Hum Genet 51:467–476.
Soares P, Rito T, Trejaut J, Mormina M, Hill C, Tinkler-HundalE, Braid M, Clarke DJ, Loo JH, Thomson N, Derham T,Donohue M, Macaulay V, Lin M, Oppenheimer S, RichardsMB. 2011. Ancient voyaging and Polynesian origins. Am JHum Gen 88:239–247.
Souto L, Alves C, Gusmao L, Ferreira E, Amorim A, Corte-RealF, Vieira DN. 2005. Population data on 15 autosomal STRs ina sample from East Timor. Forensic Sci Int 155:77–80.
Sturrock K, Rocha J. 2000. A multidimensional scaling stressevaluation table. Field Methods 12:49–60.
Suadi Z, Siew LC, Tie R, Hui WB Adam A, Thiew SH, BoonLK. 2007. STR data for the AmpFlSTR Identifiler loci fromthe three main ethnic indigenous population groups (Iban,Bidayuh) and Melanau) in Sarawak, Malaysia. J Forensic Sci52:231–234.
Su B, Jin L, Underhill P, Martinson J, Saha N, McGarvey ST,Shriver MD, Chu J, Oefner P, Chakraborty R, Deka R. 2000.Polynesian origins: insights from the Y chromosome. ProcNatl Acad Sci USA 97:8225–8228.
Tabbada KA, Trejaut J, Loo JH, Chem YM, Lin M, Mirazon-Lahr M, Kivisild T, De Ungria MC. 2010. Philippine mito-chondrial DNA diversity: a population viaduct between Tai-wan and Indonesia? Mol Biol Evol 27:21–31.
Tang J, Zhang J, Jiang F, Yu X. 2009. Genetic analyzing of 15STR loci in a Han population of Jinan (northern China).Legal Med 11:144–146.
Tereba A. 1999. Tools for analysis of population statistics. Pro-files in DNA 2:14–16.
Terrel JE, Hunt TL, Gosden C. 1997. The dimensions of sociallife in the Pacific. Curr Anthropol 38:155–195.
Tofanelli S, Bertonchi S, Castri L, Luiselli D, Donati G, Paoli G.2009. On the origins and admixture of Malagasy: new evi-dence from high-resolution analyses of paternal and maternallineages. Mol Biol Evol 26:2109–2124.
Trejaut JA, Kivisild T, Loo JH, Lee CL, He CL, Hsu CJ, Li ZY,Lin M. 2005. Traces of archaic mitochondrial lineages in Aus-tronesian-speaking Formosan populations. PLoS Biol 3:e247.
Tsang CH. 2002. The prehistory of Taiwan: a brief introduction.In: Seventeenth Congress of the Indo-Pacific Prehistory Asso-ciation Sep 9–15. Taipei (Taiwan): Academia Sinica. p 47–52.
Tsang CH. 2005. On the origin of the Yami People of Lanyu asviewed from archaeological data. J Austronesian Stud 1:135–151.
TAIWAN AS SOURCE FOR AUSTRONESIAN EXPANSION 563
American Journal of Physical Anthropology

Wang C, Chen D, Chen C, Lu S, Sun C. 2003. STR data for theAmpFlSTR SGM Plus and Profiler loci from Taiwan. ForensicSci Int 138:119–122.
Wu F, Ho C, Pu C, Hu K, Liu DH. 2009. Genetic polymorphismsof 17 Y-chromosomal short tandem repeat loci in Atayal popu-lation of Taiwan. Croat Med J 50:313–320.
Wu Y, Zhang X, Zhou Y, Chen Z, Wang X. 2008. Genetic poly-morphisms of 15 STR loci in Chinese Han population livingin Xi’an city of Shaanxi province. Forensic Sci Int: Gen2:e15–e18.
Xu S, Pugach I, Stoneking M, Kayser M, Jin L, Pan Asian SNPConsortium. 2012. Genetic dating indicates that the Asian-
Papuan admixture through Eastern Indonesia corresponds tothe Austronesian expansion. PNAS 109:4574–4579.
Xu L, Hu S, Feng G. 2009. STR polymorphisms of the Henanpopulation and investigation of the Central Plains Han originof Chaoshanese. Biochem Genet 47:569–581.
Yan S. Wang CC, Li H, Li SL, Jin L, Genographic Consortium.2011. An updated tree of Y haplogroup O and revised phylo-genetic positions of mutations P164 and PK4. Eur J HumGenet 19:1013–1015.
Zhang GZ. 1987. Archaeology on the coast of Southeast Chinaand origin of Austronesian. Southern ethnic archaeology 1.Chengdu: Sichuan University Press.
564 S. MIRABAL ET AL.
American Journal of Physical Anthropology