AS Tallinna Vesi · The sales from the operation and maintenance of the storm water and...
23
AS Tallinna Vesi Results of operations – for the 1 st half-year of 2011
Transcript of AS Tallinna Vesi · The sales from the operation and maintenance of the storm water and...

AS Tallinna Vesi Results of operations – for the 1st half-year of 2011

Currency Thousand euros
Start of reporting period 1 January 2011
End of reporting period 30 June 2011
Address Tallinn, Ädala 10
Chairman of the Management Board Ian John Alexander Plenderleith
Commercial register number 10 257 326
Telephone +372 62 62 202
Telefax +372 62 62 300
E-mail [email protected]
Web page www.tallinnavesi.ee
Field of activity Production, treatment and distribution of water; storm and wastewater disposal and treatment CONTENTS PageMANAGEMENT REPORT 3 MANAGEMENT CONFIRMATION 12 CONSOLIDATED STATEMENTS OF FINANCIAL POSITION 13CONSOLIDATED STATEMENTS OF COMPREHENSIVE INCOME 14CONSOLIDATED CASH FLOW STATEMENTS 15CONSOLIDATED STATEMENTS OF CHANGES IN EQUITY 16 NOTES TO THE ACCOUNTS NOTE 1. ACCOUNTING PRINCIPLES 17NOTE 2. CASH AND CASH EQUIVALENTS 17NOTE 3. PROPERTY, PLANT AND EQUIPMENT, AND INTANGIBLE ASSETS 18NOTE 4. REVENUE 19NOTE 5. STAFF COSTS 19NOTE 6. COST OF GOODS SOLD, MARKETING AND GENERAL ADMINISTRATIONS
EXPENSES 20NOTE 7. OTHER INCOME AND EXPENSES 20NOTE 8. FINANCIAL INCOME AND EXPENSES 21NOTE 9. DIVIDENDS 21NOTE 10. EARNINGS PER SHARE 21NOTE 11. RELATED PARTIES 22NOTE 12. LIST OF SUPERVISORY BOARD MEMBERS 23

MANAGEMENT REPORT Privatization Contract and Regulation Overview The Company’s tariffs are still frozen due to the ongoing debate with the Competition Authority (CA). The Company applied for a contractual 3.5% tariff increase on 9th November 2010. The Competition Authority rejected the tariff application without any analysis of the privatization contract and the Company’s performance during the contractual period. The Company’s tariff mechanism and stable regulatory regime has enabled the delivery of all the objectives required by the privatization without giving excessive returns to shareholders of the Company. The Company would like its shareholders to note that the Company has a contract until 2020 and that the financial performance of the company should be evaluated over this period of time and not on a single year basis. The privatization contracts signed in 2001 were structured to produce lower returns in the early years, increasing over the lifetime of the contract to give a real (net of inflation) rate of return on invested capital of 7.0% over the contract period. The Company believes in best practice operating performance on behalf of its customers, and this includes providing that the financial terms and conditions of the fully legal privatization contract deliver rates of return that are consistent with the degree of risk being taken and benchmarking this against other regulatory determinations. The Company has chosen the average real return on invested capital1 (ARRIC) calculation in order to prove its returns since 2001, which is the classical formula used for verifying utility profits. The ARRIC is expected to remain on a level of 6.2% throughout 2011. The annual return is expected to increase in 2011 to 6.5% from 6.4% in 2010. The average return is still lower than the annual return due to the much lower returns earned in the early years of the contract. ARRIC calculation uses the capital paid for the 50.4% of the shares at privatization to calculate the Regulatory Asset Base (RAB). This calculation is recommended by the World Bank for tariff setting for privatized utilities. For further information on the RAB calculation please see paragraph 3.2 and the tables 4 and 5 of Appendix 5 of the tariff application2. Using such a well-established methodology gives clarity and enables investors to independently verify the financial performance of the Company using the principles applied in internationally accepted regulatory regimes that have already been subject to a significant level of economic analysis and challenge. Furthermore, in accordance with good governance and to ensure the Company’s results are evidence based the Company has had its financial performance independently verified by the international economics consulting company Oxera. Oxera completed its analysis of the Company’s financial performance in November 2010 and a copy of this report can be found as Appendix 13 to the tariff application. Our shareholders will be aware that the Competition Authority is stating that the profitability is too high, and insisting that their methodology must be used. With such approach the CA fully disregards the fully legal privatization contract and the tariff regulation (CPI +/- k) chosen by the earlier regulator in 2001. 1 ARRIC – EBIT from regulated services/regulatory asset base during the contract period from 2001 2 http://www.tallinnavesi.ee/static/files/932.AS Tallinna Vesi Tariff Application for 2011-2015.pdf 3 http://www.tallinnavesi.ee/static/files/729.2010-11-09 to CA tariff application Annex 1 Annex 4 Eng.pdf
3

Estonian Authorities have claimed that the amendments to the PWSSA enforced in 2010 did not change anything regarding the justified profitability calculations and that only the regulator has changed. The Company has explained via Stock Exchange announcements that in August 2010 a restriction was included to the law about the body who has made the investment limiting it only to the investment made by the water undertaking itself. During the privatization and until August 2010 the wording of the law enabled to earn a reasonable return on capital invested by the investors.
According to the Company’s best knowledge the new regulator stepping into existing valid contract is required to consider the privatization contract and the regulatory regime chosen by the earlier regulator unless they can prove that the contract was illegal.
The CA is only able to claim the excessive profitability by doing the following:
1) From a contractual perspective a. Disregarding all aspects of the fully legal privatization contract b. Assigning zero value to the service improvements made as a result of the
privatization c. Without ever analyzing the financial performance of the contract from 2001 to 2011
2) And secondly from a regulatory perspective
a. Ignoring the privatization value of the company, thus denying investors the opportunity to earn a return on the full amount of capital invested at privatization. This is also in complete contradiction with the CA’s own references4 to the World Bank Guidelines5 used in its analyses of the Company’s tariffs and also in its methodology for energy sector6.
b. Applying the inconsistent treatment of inflation within its calculations. The CA ignores the World Bank recommendation to index the asset value of the company by inflation and declares the usage of nominal WACC, but despite of repeated enquiries7 from the Company has not proved the inclusion of the inflation to the nominal WACC calculation.
The Company continues to try to engage with the authorities to have a professional dialogue regarding the fully legal privatization contract and best practice regulation. RESULTS OF OPERATIONS - FOR THE 1st HALF-YEAR 2011 Overview of the financial statements During the 2nd quarter of 2011 the sales increased by 2.3%, mainly due to the slight increase in sales volumes. As result of excellent operational performance and related efficiencies the gross profit increased by 7.1%. Still the operating profit decreased by 4.0% and the profit before taxes decreased by 1.3%, being impacted by slimmer profits from non-related activities and negative movement in fair value of financial instruments, both with no cash impacts.
4 http://www.konkurentsiamet.ee/?id=14642, pages 30 and 36. 5 http://books.google.com/books?id=VYEcSJCWbBUC&lpg=PP1&ots=eri8Xz-21P&dq=martin%20pardina&pg=PR1#v=onepage&q&f=false (Green, Richard; Pardina, Martin Rodriguez (1999). Resetting Price Controls for Privatized Utilities. A Manual for Regulators. Washington, D.C.: The World Bank) 6 http://www.konkurentsiamet.ee/file.php?18565, page 3 7 http://www.tallinnavesi.ee/static/files/821.2011-04-07 response4 to CA re their WACC and inflation Eng.pdf
4

mln € 2 Q 2011
2 Q 2010 Change
6 months
2011
6 months
2010 Change Sales 12,8 12,5 2,3% 25,2 24,7 1,8%Gross profit 7,8 7,3 7,1% 15,4 14,9 2,9%Gross profit margin % 61,4 58,6 4,7% 61,0 60,4 1,1%Operating profit 6,9 7,2 -4,0% 13,8 13,9 -0,7%
Operating profit - main business 6,7 6,1 8,5% 13,2 12,6 5,4%Operating profit margin % 54,0 57,5 -6,1% 54,8 56,2 -2,4%Profit before taxes 5,7 5,8 -1,3% 13,7 11,1 24,3%Net profit 1,5 -2,7 -155,7% 9,5 2,6 270,9%Net profit margin % 11,7 -21,4 -154,5% 37,6 10,3 264,3%ROA % 0,8 -1,5 -155,0% 5,3 1,4 266,1%Debt to total capital employed 62,9 66,5 -5,5% 62,9 66,5 -5,5%
Gross profit margin – Gross profit / Net sales Operating profit margin – Operating profit / Net sales Net Profit margin – Net Profit / Net sales ROA – Net profit /Total Assets Debt to Total capital employed – Total Liabilities / Total capital employed Main business – water and wastewater activities, excl. connections profit and government grants Profit and Loss Statement 2nd quarter 2011 Sales In the 2nd quarter of 2011 the Company’s total sales increased, year on year, by 2.3% to 12.8 mln EUR. Sales in the main operating activity principally comprise of sales of water and treatment of wastewater to domestic and commercial customers within and outside of the service area, and fees received from the City of Tallinn for operating and maintaining the storm water system. Sales of water and wastewater services were 11.7 mln EUR, a 2.6% increase compared to the 2nd quarter of 2010, resulting from the slight rise in sales volumes as described below. Within the service area, sales to residential customers increased by 0.2% to 5.9 mln EUR. Sales to commercial customers increased by 6.7% to 4.6 mln EUR. Sales to customers outside of the service area increased by 0.7% to 0.92 mln EUR in the 2nd quarter of 2011. Over pollution fees received were 0.23 mln EUR, a 6.7% decrease compared to the 2nd quarter of 2010. In the 2nd quarter of 2011, the volumes sold to residential customers increased by 0.6% year on year, compared to decrease we faced in 1st quarter of 2011 and previous quarters of 2010. The volumes sold to commercial customers inside the service area have risen, reflecting a 7.3% increase compared to the same period in 2010. The sales volumes increased mainly due to improvement in leisure sector and related industrial services as result of pick up in tourism sector.
5

The volume increase exceeds the sales increase due to the proportionally higher increase in waste water services which tariffs are a bit lower compared to the water tariffs. Outside service area sales volumes were 4.3% lower than in the 2nd quarter of 2010. The main factor in this decrease was lower storm water volumes in the 2nd quarter of 2011 compared to 2010, resulting in sales increase year on year as storm water tariffs are considerably lower as sewage tariffs. The sales from the operation and maintenance of the storm water and fire-hydrant system decreased by 2.8% to 0.78 mln EUR in the 2nd quarter of 2011 compared to the same period in 2010. This is in accordance with the terms and conditions of the contract whereby the storm water and fire hydrant costs are invoiced based on actual costs and volumes treated. Cost of Goods Sold and Gross Margin The cost of goods sold for the main operating activity was 4.9 mln EUR in the 2nd quarter of 2011, a decrease of 0.24 mln EUR or 4.5% from the equivalent period in 2010. The cost reduction was mainly the result of nitrogen removal from the waste water and related reduction in pollution tax. The pollution tax calculation depends on waste water treatment results and concentration of different waste components in treated waste water. In the 2nd quarter of 2011 the Company was successful to remove all pollutants below the level required for the application of the beneficial coefficient. Thereby the Company achieved in the 2nd quarter of 2011 the beneficial 0.5 tax coefficient in contrary to the 2nd quarter of 2010 with coefficient 1.0, and thereby the amount of pollution tax payable was 0.32 mln EUR compared to 0.70 mln EUR in the 2nd quarter of 2010. The decrease in volumes treated in 2nd quarter of 2011 also contributed to lower pollution tax payable, partly balanced by the increase in tax rates year on year by 14.8%. To mitigate the nitrogen treatment and tax risks discussed throughout the 2010, we are continuing with the investment into an additional stage of waste water treatment and according to the construction schedule the works should be completed in the beginning of the 3rd quarter of 2011. Chemical costs were 0.31 mln EUR, representing a 6.2% decrease compared to the corresponding period in 2010 despite of the slight increase in rates. The need to dose chemicals was lower in combination of the volumes, concentration of pollutants and water temperature. Electricity costs increased by 0.02 mln EUR or 2.5% in the 2nd quarter of 2011 compared to the 2nd quarter of 2010, mainly due to higher electricity prices as result of the purchase from the open market. Salary expenses within costs of goods sold increased in the 2nd quarter of 2011, year on year, by 0.07 mln EUR or 6.6% in combination of redundancy payments, performance related pay accrual and small increase in basic salaries. Other salary lines had similar impact. Other cost of goods sold in the main operating activity increased 0.09 mln EUR, or 9.0% year on year, mainly due to increased asphalting cost compared to 2nd quarter of 2010. As a result of all of the above the Company’s gross profit for the 2nd quarter of 2011 was 7.8 mln EUR, which is an increase of 0.50 mln EUR, or 7.1%, compared to the gross profit of 7.3 mln EUR for the 2nd quarter of 2010.
6

Operating Costs and Operating Margin Marketing expenses increased by 0.002 mln EUR to 0.18 mln EUR during the 2nd quarter of 2011 compared to the corresponding period in 2010. This is mainly the result of a discussed increase in salaries expenses, partly balanced by savings in other items. In the 2nd quarter of 2011 the General administration expenses increased by 0.32 mln EUR year on year to 1.2 mln EUR. Within this group the salary costs increase was partly related to the transfer of management services to the salary line. Still the increase in legal consultancies acquired in the process of tariff dispute exceeded the transfer of cost within other costs. Other net income/expenses The majority of the income in Other net income/expenses relates to constructions and government grants. The drivers for this income stream are the networks extension program and the connections activity in Tallinn. Income and expenses from constructions and government grants totaled a net income of 0.25 mln EUR in the 2nd quarter of 2011 compared to a net income of 1.1 mln EUR in the 2nd quarter of 2010, this line varies throughout the year depending on construction volumes and estimates to the profit margins on projects completed. 2011 2nd quarter profits from government grants profits were influenced mainly by delays in construction and the shortage will be compensated in forthcoming quarters during the construction program. The rest of the other income/expenses totaled an income of 0.20 mln EUR in the 2nd quarter of 2011 compared to an expense of 0.13 mln EUR in the 2nd quarter of 2010. This line was mainly impacted by the excellent debt collection and related decrease in bad debt accrual in the 2nd quarter of 2011. As a result the Company’s underlying operating profit from sales of water and wastewater for the 2nd quarter of 2011 totaled 6.7 mln EUR compared to 6.1 mln EUR in the corresponding quarter in 2010. In total the Company’s operating profit for all activities for the 2nd quarter of 2011 was 6.9 mln EUR, a decrease of 0.30 mln EUR compared to an operating profit of 7.2 mln EUR achieved in the 2nd quarter of 2010. Year on year the operating profit for the 2nd quarter has decreased by 4.0%. Financial expenses Net Financial revenues/expenses were 1.2 mln EUR in the 2nd quarter of 2011, which is a positive variance of 0.21 mln EUR or 15.5% compared to the net expenses in the 2nd quarter of 2010. In both years the financial costs had adverse impact from the non-cash revaluation of the fair value of swap agreements, the related cost increase was still lower in the 2nd quarter of 2011. The Company has mitigated majority of the long term floating interest risk with 5 interest swap agreements, each with a principal value of 15 mln EUR. At this point in time the estimated fair value of these swap contracts is still negative, totaling 1.5 mln EUR, with a negative revaluation in the 2nd quarter 2011 in the amount of 0.77 mln EUR. Profit Before Tax The Company’s profit before taxes for the 2nd quarter of 2011 was 5.7 mln EUR, which is 0.10 mln EUR lower than the profit before taxes of 5.8 mln EUR for the 2nd quarter of 2010.
7

Results for the six months of 2011 During the six months of 2011 the Company’s total sales increased, year on year, by 1.8% to 25.2 mln EUR. Sales of water and wastewater treatment were 23.1 mln EUR, a 1.8% increase compared to the six months of 2010. The underlying operating profit from the Company’s main business activity, sales of water and wastewater, for the six months of 2011 increased by 5.4% to 13.2 mln EUR compared to the six months of 2010. The Company’s profit before taxes for the six months of 2011 was 13.7 mln EUR, which is a 24.3% increase compared to the relevant period in 2010. The Company’s net profit for the six months of 2011 was 9.5 mln EUR, which is 6.9 mln EUR higher than the net profit of 2.6 mln EUR in the equivalent period in 2010. Balance sheet During the six months of 2011 the Company invested 6.6 mln EUR into fixed assets. Non-current assets were 153.5 mln EUR at 30 June 2011. Current assets decreased by 7.3 mln EUR to 26.4 mln EUR in the six months of the year, with customer receivables decreasing by 4.9 mln EUR due to payment of long term debts by the customers and cash at bank decreasing by 2.4 mln EUR as result of dividend payment in June 2011. Current liabilities decreased by 4.5 mln EUR to 11.4 mln EUR in the six months of the year. This was mainly due to a 7.6 mln EUR reclassification of Current portion of long-term borrowings to Non-current liabilities after renewal of the loan agreement, balanced by increase in Trade payables by 2.9 mln EUR. The Equity has decreased by 6.5 mln EUR reflecting the dividend payment partly balanced by the profit generated during the six months of the year. The Company has a leverage level as expected of 62.9%, as usually at end of the 2nd quarter slightly above the target range of 60%, reflecting the temporary decrease in Equity. Long-term liabilities stood at 101.7 mln EUR at the end of June 2011, consisting almost entirely of the outstanding balance of three long-term bank loans. As of 30 June 2011 the total 95 mln EUR loan capital was recorded within long term liabilities in accordance with the signed loan agreements. In April 2011 the Company renewed its loan agreement and according to the loan agreements the first repayment of loans or refinancing should take place in 2013. The weighted average interest margin for the total available facility is 0.82%. Cash flow During the six months of 2011, the Company generated 15.7 mln EUR of cash flows from operating activities, an increase of 1.3 mln EUR compared to the corresponding period in 2010. 2011 operating cash flows were above 2010 cash flows mainly due to the payments of overdue debts in 2011. Underlying operating profit still continues to be the main contributor to operating cash flows.
8

In the six months of 2011 net cash outflows from investing activities were 2.1 mln EUR, which is 1.7 mln EUR more than in 2010. Within the group the increased compensations received for the construction of pipelines is partly balancing increase in capital expenditures. In 2011 the Company has given the 1.4 mln EUR loan to Maardu according to the Operating agreement signed in 2008. The total 20 year loan depends on construction cost and will remain below the total agreed loan facility of 5.1 mln EUR. At the end of 2nd quarter of 2011 the cash outflows related to the fixed asset investments were 7.8 mln EUR. The cash outflows from financing activities were 16.0 mln EUR during the six months of 2011 compared to a cash outflow of 12.0 mln EUR during the same six months of 2010, representing the payouts of the dividends in both years and loans received in 2010. As a result of all of the above factors, the total cash outflow in the six months of 2011 was 2.4 mln EUR compared to a cash inflow of 2.0 mln EUR in the six months of 2010. Cash and cash equivalents stood at 10.8 mln EUR as at 30 June 2011 which is 9.9 mln EUR lower than at the corresponding period of 2010. Employees At the end of the 2nd quarter of 2011, the total number of employees was 311 compared to 319 at the end of the 2nd quarter of 2010. The full time equivalent (FTE) was respectively 297 in 2011 compared to the 303 in 2010. The management is looking actively for the efficiencies in processes to balance the increase in individual salaries with more productive company structure. Corporate structure At the end of the quarter, 30 June 2011, the Group consisted of 2 companies. The subsidiary Watercom OÜ is wholly owned by AS Tallinna Vesi and consolidated to the results of the Company. Share performance AS Tallinna Vesi is listed on OMX Main Baltic Market with trading code TVEAT and ISIN EE3100026436. As of 30 June 2011 AS Tallinna Vesi shareholders, with a direct holding over 5%, were: United Utilities (Tallinn) BV 35.3% City of Tallinn 34.7% Parvus Asset Management has informed the Company that they own in total 8.96% of the shares of the Company. At the end of the quarter, 30 June 2011, the closing price of the AS Tallinna Vesi share was 7.40 EUR, which is a 14.99% decrease compared to the closing price of 8.705 EUR at the beginning of the quarter. During the same period the OMX Tallinn index dropped by 12.61%.
9

5 000
10 000
15 000
20 000
25 000
30 000
4
6
8
10
12
14
16
18
20
Turnover th
EUR
Price EU
R/share
Closing Price & Adjusted OMXT vs Transaction Turnover
Transaction turnover Closing price of AS Tallinna Vesi share Adjusted OMXT
Operational highlights in 2011
• Company’s overall operating performance is continuously good, most of the quality aspects exceeding the level of 2010. As result of excellent nitrogen removal from the waste water we received the beneficial coefficient and reduction in the amount of pollution tax.
• Total number of unplanned customer interruptions has decreased by 5 times and also the average time of interruptions has decreased by 12%.
• The leakage level was by 1.55% less than in 2010. • As a very important development for the customers, the Company has updated its promises
to the customers, according to which AS Tallinna Vesi would compensate any discomfort to its contractual customers based on the promises plan if the Company has failed to deliver against one of its own customer service pledges. AS Tallinna Vesi’s promises are part of an on-going commitment to continuously improve service on behalf of our customers. These promises require the Company to achieve a standard of service that is much higher than that required by the contract with the City of Tallinn, and is the only customer focused scheme of its type within the utilities sector in the Baltics.
• The Company signed the changes to the Nordea’s loan agreement on 27 of April 2011. The original loan agreement for the amount of 37.5 mln EUR was signed in 2005. The repayment term was changed and instead of the semiannual repayments from May 2011 the whole loan amount shall be repaid at the end of 2015. As result of the change the weighted average interest margin will increase to 0.82%.
• In the 2nd quarter the Company renewed all its ISO, environmental and safety certificates. According to the Company’s knowledge we are the only water company in Estonia whose operational and environmental performance indicators are independently verified.
10

Key contractual events
• Tariffs are still frozen on the 2010 level despite of the fact that on 9 November 2010 the Company submitted its contract based tariff application to the new regulator. The tariff application is fully in accordance with the law and the best practice regulation for privatized utilities, such as that favoured by Ofwat in the UK and recommended by the World Bank for privatized utilities. On 2nd May the Competition Authority (CA) informed the Company about the rejection of the tariff application. The CA completely ignored the privatization contract and did not perform any analysis of the contractual and financial performance of the Company during the period after privatization. The CA is arguing that the Company’s profitability is too high using their own unverified methodology that is not in accordance with the World Bank guidelines for privatized utilities. The Company has calculated that the average real return on invested capital from 2001 till 2011 has been 6.2% and the Company has also had these returns independently verified by the international economics consulting company, Oxera. The Company and its investors cannot accept such unilateral breach of the privatization terms and contract by Estonian Authorities and the Company submitted an appeal to the court on 2 June 2011. The CA should comment their position to the court before the end of August. In parallel, on 10th December 2010 AS Tallinna Vesi lodged a complaint to the European Commission regarding certain measures adopted by the Estonian authorities. The company believes these measures unilaterally alter the terms of AS Tallinna Vesi's privatization regime, and without any objective justification, any form of meaningful prior discussion, or willingness to engage in dialogue. Therefore they violate EU rules on the freedom of establishment and the free movement of capital (articles 49 and 63 TFEU).
As a consequence of this complaint, on 22 February 2011 the European Commission sent a Request For Information to the Estonian authorities regarding the points raised by AS Tallinna Vesi in its complaint. The Estonian authorities were due to respond in early May, however requested and were granted a 30 day extension. The Estonian authorities did respond to the Commission in early June.
The Company has published its tariff application and all relevant correspondence with the CA on its website (http://www.tallinnavesi.ee/?op=body&id=728) and to the Tallinn Stock Exchange and will keep its investors informed of all future developments regarding the further key developments regarding the processing of the tariff application. Still, at this point in time the Company is unable to say what next year’s tariffs will be as it is unclear at the moment how the CA intends to respond to the Court and what would be the next steps by the European Commission.
Additional information: Siiri Lahe Chief Financial Officer +372 6262 262 [email protected]
11

12
tanel
Text Box

AS TALLINNA VESIConsolidated Unaudited Interim Condensed Financial Statementfor the 1st half-year period of financial year 2011 ended 30 June 2011
CONSOLIDATED STATEMENTS OF FINANCIAL POSITION (thousand EUR)
as of 31 December ASSETS Note 2011 2010 2010
CURRENT ASSETSCash and equivalents 2 10 830 20 687 13 235
15 183 11 439 20 088Inventories 327 262 306Non-current assets held for sale 76 77 76
TOTAL CURRENT ASSETS 26 416 32 465 33 705
NON-CURRENT ASSETSLong-term investment assets 1 362 0 0Property, plant and equipment 3 150 439 142 866 148 179Intangible assets 3 1 731 2 275 1 972Derivatives 0 0 0
TOTAL NON-CURRENT ASSETS 153 532 145 141 150 151
TOTAL ASSETS 179 948 177 606 183 856
LIABILITIES AND EQUITY
CURRENT LIABILITIESCurrent portion of long-term borrowings 0 3 860 7 624Trade and other payables 9 257 13 264 6 367Derivatives 791 773 963Short-term provisions 114 171 117Prepayments and deferred income 1 250 843 810
TOTAL CURRENT LIABILITIES 11 412 18 911 15 881
NON-CURRENT LIABILITIESDeferred income from connection fees 5 901 5 390 5 765Borrowings 94 930 91 183 87 428Derivatives 751 2 494 1 304Other payables 115 115 115
TOTAL NON-CURRENT LIABILITIES 101 697 99 182 94 612
TOTAL LIABILITIES 113 109 118 093 110 493
EQUITY Share capital 12 000 12 782 12 782Share premium 24 734 24 734 24 734Statutory legal reserve 1 278 1 278 1 278Retained earnings 28 827 20 719 34 569
TOTAL EQUITY 66 839 59 513 73 363
TOTAL LIABILITIES AND EQUITY 179 948 177 606 183 856
Notes to the consolidated financial statements on pages 6 to 12 form an integral part of the condenced financial statements.
Customer receivables, accrued income and prepaid expenses
as of 30 June
2 13
tanel
Text Box

AS TALLINNA VESIConsolidated Unaudited Interim Condensed Financial Statementfor the 1st half-year period of financial year 2011 ended 30 June 2011
CONSOLIDATED STATEMENTS OF COMPREHENSIVE INCOME (thousand EUR)
for the year ended 31 December
Note 2011 2010 2011 2010 2010
Revenue 4 12 781 12 499 25 186 24 734 49 680Costs of goods sold 6 -4 937 -5 172 -9 820 -9 801 -20 684
GROSS PROFIT 7 844 7 327 15 366 14 933 28 996
Marketing expenses 6 -181 -179 -381 -383 -787General administration expenses 6 -1 214 -894 -2 088 -1 711 -3 651Other income/ expenses (-) 7 448 928 912 1 062 2 906
OPERATING PROFIT 6 897 7 182 13 809 13 901 27 464Financial income 8 362 224 1 345 463 1 060Net financial expenses 8 -1 515 -1 588 -1 424 -3 314 -3 624
PROFIT BEFORE TAXES 5 744 5 818 13 730 11 050 24 900
Income tax on dividends 9 -4 253 -8 495 -4 253 -8 495 -8 495
1 491 -2 677 9 477 2 555 16 405
1 491 -2 677 9 477 2 555 16 405
Attributable profit to:Equity holders of A-shares 1 490 0 9 476 2 554 16 404B-share holder 0,64 0,00 0,64 0,64 0,64
Earnings per A share (in euros) 10 0,07 0,00 0,47 0,13 0,82Earnings per B share (in euros) 10 639 0 639 639 639
Notes to the consolidated financial statements on pages 6 to 12 form an integral part of the condenced financial statements.
COMPREHENSIVE INCOME FOR THE PERIOD
Quarter 2
NET PROFIT FOR THE PERIOD
6 months
3
14
tanel
Text Box

AS TALLINNA VESIConsolidated Unaudited Interim Condensed Financial Statementfor the 1st half-year period of financial year 2011 ended 30 June 2011
CONSOLIDATED CASH FLOW STATEMENTS (thousand EUR)
for the year ended 31 December
Note 2011 2010 2010CASH FLOWS FROM OPERATING ACTIVITIES
Operating profit 13 809 13 901 27 464Adjustment for depreciation/amortisation 6 2 777 2 817 5 620
Adjustment for profit from government grants and connection fees -560 -1 335 -3 312Other finance expenses 8 -1 -29 -14Profit from sale of property, plant and equipment, and intangible assets -1 0 -3Expensed property, plant and equipment 0 5 70
Change in current assets involved in operating activities 1 090 -680 -8 894Change in liabilities involved in operating activities 47 859 6 297Interest paid -1 418 -1 090 -2 443
Total cash flow from operating activities 15 743 14 448 24 785
CASH FLOWS FROM INVESTING ACTIVITIESLoans granted -1 362 0 0
-7 793 -4 100 -17 055Compensations received for construction of pipelines 6 285 3 327 6 139
2 1 16Interest received 721 275 1 109
Total cash flow used in investing activities -2 147 -497 -9 791
CASH FLOWS FROM FINANCING ACTIVITIESReceived loans 0 20 000 20 000Dividends paid 9 -16 001 -31 956 -31 956Income tax on dividends 9 0 0 -8 495
Total cash flow used in financing activities -16 001 -11 956 -20 451
Change in cash and cash equivalents -2 405 1 995 -5 457
13 235 18 692 18 692
2 10 830 20 687 13 235
Notes to the consolidated financial statements on pages 6 to 12 form an integral part of the condenced financial statements.
Proceeds from sale of property, plant and equipment, and
CASH AND EQUIVALENTS AT THE BEGINNING OF THE PERIOD
CASH AND EQUIVALENTS AT THE END OF THE PERIOD
Acquisition of property, plant and equipment, and intangible assets
6 months
4
15
tanel
Text Box

AS TALLINNA VESIConsolidated Unaudited Interim Condensed Financial Statementfor the 1st half-year period of financial year 2011 ended 30 June 2011
CONSOLIDATED STATEMENTS OF CHANGES IN EQUITY (thousand EUR)
Share capital Share premiumStatutory legal
reserve Retained earnings Total equity
as of 31 December 2009 12 782 24 734 1 278 50 120 88 914
Dividends 0 0 0 -31 956 -31 956
Net profit of the financial year 0 0 0 16 405 16 405
as of 31 December 2010 12 782 24 734 1 278 34 569 73 363
as of 31 December 2009 12 782 24 734 1 278 50 120 88 914
Dividends 0 0 0 -31 956 -31 956
Net profit of the financial period 0 0 0 2 555 2 555
as of 30 June 2010 12 782 24 734 1 278 20 719 59 513
as of 31 December 2010 12 782 24 734 1 278 34 569 73 363
Reduction of the share capital -782 0 0 782 0
Dividends 0 0 0 -16 001 -16 001
Net profit of the financial period 0 0 0 9 477 9 477
as of 30 June 2011 12 000 24 734 1 278 28 827 66 839
Notes to the consolidated financial statements on pages 6 to 12 form an integral part of the condenced financial statements.
516
tanel
Text Box

AS TALLINNA VESIConsolidated Unaudited Interim Condensed Financial Statementfor the 1st half-year period of financial year 2011 ended 30 June 2011
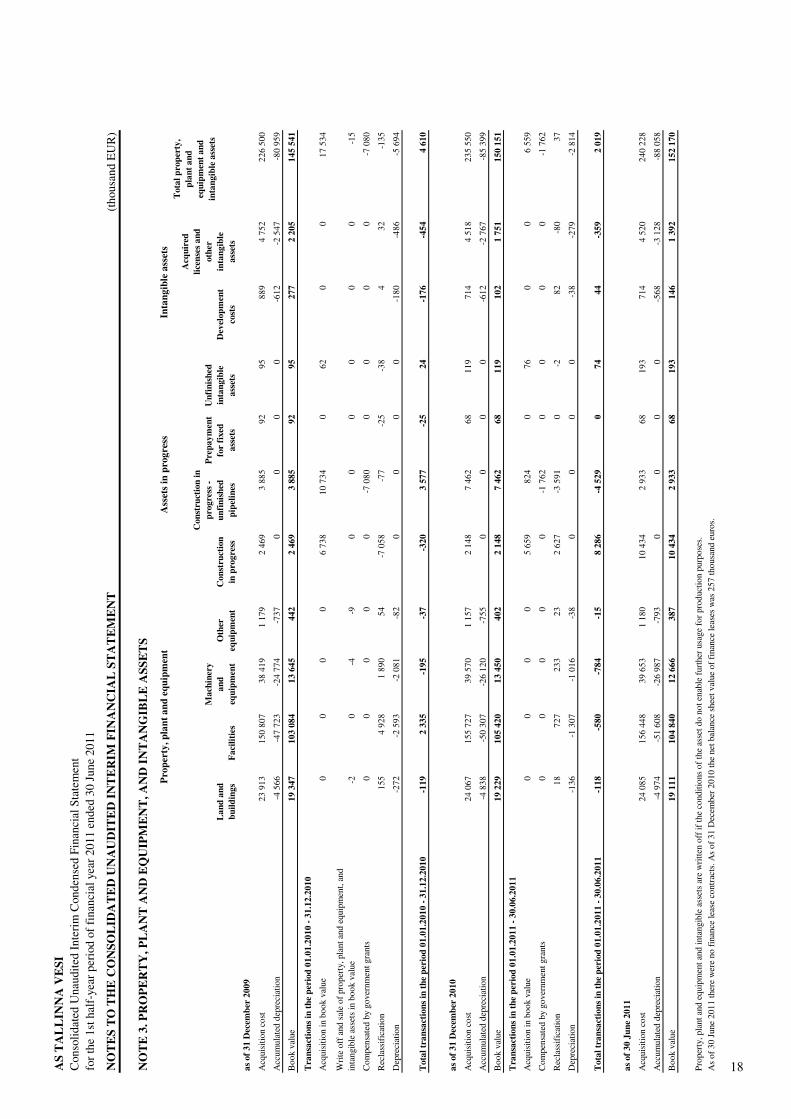
NOTES TO THE CONSOLIDATED UNAUDITED INTERIM FINANCIAL STATEMENT (thousand EUR)
NOTE 1. ACCOUNTING PRINCIPLES
NOTE 2. CASH AND CASH EQUIVALENTS
as of 31 December
2011 2010 2010
Cash in hand and in bank 308 215 651Short-term deposits 10 522 20 472 12 584Total cash and cash equivalents 10 830 20 687 13 235
The interim accounts have been prepared according to International Financial Reporting Standards as adopted by the EU. The same accounting policies are followed in the interim financial statements as in the most recent annual financial statements. The interim report is prepared in accordance with IAS 34 Interim Financial Reporting.
as of 30 June
On the 1st January 2011 Estonia joined the Eurozone and Estonian kroon (EEK) was replaced by euro (EUR). As a result of that, since that day the Group converted its accounting into euros and the financial statements of 2011 and further years is compiled in euros. Comparative data is converted by an official exchange rate for transition of 15.6466 EEK/EUR.
6 17
tanel
Text Box
AS
TA
LL
INN
A V
ESI
Con
solid
ated
Una
udite
d In
teri
m C
onde
nsed
Fin
anci
al S
tate
men
tfo
r the
1st
hal
f-ye
ar p
erio
d of
fina
ncia
l yea
r 201
1 en
ded
30 J
une
2011
NO
TE
S T
O T
HE
CO
NSO
LID
AT
ED
UN
AU
DIT
ED
INT
ER
IM F
INA
NC
IAL
ST
AT
EM
EN
T(t
hous
and
EU
R)
NO
TE
3. P
RO
PER
TY
, PL
AN
T A
ND
EQ
UIP
ME
NT
, AN
D IN
TA
NG
IBL
E A
SSE
TS
Lan
d an
d bu
ildin
gsFa
cilit
ies
Mac
hine
ry
and
equi
pmen
tO
ther
eq
uipm
ent
Con
stru
ctio
n in
pro
gres
s
Con
stru
ctio
n in
pr
ogre
ss -
unfin
ishe
d pi
pelin
es
Prep
aym
ent
for
fixed
as
sets
Unf
inis
hed
inta
ngib
le
asse
ts
Dev
elop
men
t co
sts
Acq
uire
d lic
ense
s and
ot
her
inta
ngib
le
asse
ts
as o
f 31
Dec
embe
r 20
09
Acq
uisi
tion
cost
23
913
150
807
38 4
191
179
2 46
93
885
9295
889
4 75
222
6 50
0
Acc
umul
ated
dep
reci
atio
n-4
566
-47
723
-24
774
-737
00
00
-612
-2 5
47-8
0 95
9
Boo
k va
lue
19 3
4710
3 08
413
645
442
2 46
93
885
9295
277
2 20
514
5 54
1
Tra
nsac
tions
in th
e pe
riod
01.
01.2
010
- 31.
12.2
010
Acq
uisi
tion
in b
ook
valu
e 0
00
06
738
10 7
340
620
017
534
Writ
e of
f and
sal
e of
pro
pert
y, p
lant
and
equ
ipm
ent,
and
inta
ngib
le a
sset
s in
boo
k va
lue
-20
-4-9
00
00
00
-15
Com
pens
ated
by
gove
rnm
ent g
rant
s 0
00
00
-7 0
800
00
0-7
080
Rec
lass
ifica
tion
155
4 92
81
890
54-7
058
-77
-25
-38
432
-135
Dep
reci
atio
n-2
72-2
593
-2 0
81-8
20
00
0-1
80-4
86-5
694
Tot
al tr
ansa
ctio
ns in
the
peri
od 0
1.01
.201
0 - 3
1.12
.201
0-1
192
335
-195
-37
-320
3 57
7-2
524
-176
-454
4 61
0
as o
f 31
Dec
embe
r 20
10
Acq
uisi
tion
cost
24
067
155
727
39 5
701
157
2 14
87
462
6811
971
44
518
235
550
Acc
umul
ated
dep
reci
atio
n-4
838
-50
307
-26
120
-755
00
00
-612
-2 7
67-8
5 39
9
Boo
k va
lue
19 2
2910
5 42
013
450
402
2 14
87
462
6811
910
21
751
150
151
Tra
nsac
tions
in th
e pe
riod
01.
01.2
011
- 30.
06.2
011
Acq
uisi
tion
in b
ook
valu
e0
00
05
659
824
076
00
6 55
9
Com
pens
ated
by
gove
rnm
ent g
rant
s0
00
00
-1 7
620
00
0-1
762
Rec
lass
ifica
tion
1872
723
323
2 62
7-3
591
0-2
82-8
037
Dep
reci
atio
n -1
36-1
307
-1 0
16-3
80
00
0-3
8-2
79-2
814
Tot
al tr
ansa
ctio
ns in
the
peri
od 0
1.01
.201
1 - 3
0.06
.201
1-1
18-5
80-7
84-1
58
286
-4 5
290
7444
-359
2 01
9
as o
f 30
June
201
1
Acq
uisi
tion
cost
24
085
156
448
39 6
531
180
10 4
342
933
6819
371
44
520
240
228
Acc
umul
ated
dep
reci
atio
n-4
974
-51
608
-26
987
-793
00
00
-568
-3 1
28-8
8 05
8
Boo
k va
lue
19 1
1110
4 84
012
666
387
10 4
342
933
6819
314
61
392
152
170
Prop
erty
, pla
nt a
nd e
quip
men
t and
inta
ngib
le a
sset
s ar
e w
ritte
n of
f if t
he c
ondi
tions
of t
he a
sset
do
not e
nabl
e fu
rthe
r usa
ge fo
r pro
duct
ion
purp
oses
.A
s of
30
June
201
1 th
ere
wer
e no
fina
nce
leas
e co
ntra
cts.
As
of 3
1 D
ecem
ber 2
010
the
net b
alan
ce s
heet
val
ue o
f fin
ance
leas
es w
as 2
57 th
ousa
nd e
uros
.
Prop
erty
, pla
nt a
nd e
quip
men
tIn
tang
ible
ass
ets
Tot
al p
rope
rty,
pl
ant a
nd
equi
pmen
t and
in
tang
ible
ass
ets
Ass
ets
in p
rogr
ess
7
18
tanel
Text Box

AS TALLINNA VESIConsolidated Unaudited Interim Condensed Financial Statementfor the 1st half-year period of financial year 2011 ended 30 June 2011
NOTES TO THE CONSOLIDATED UNAUDITED INTERIM FINANCIAL STATEMENT (thousand EUR)
NOTE 4. REVENUEfor the year ended 31
December
2011 2010 2011 2010 2010Revenues from main operating activities
Total water supply and waste water disposal service, incl: 11 713 11 417 23 084 22 672 45 167
Private clients, incl: 5 934 5 921 11 906 11 934 23 797 Water supply service 3 271 3 293 6 561 6 637 13 232 Waste water disposal service 2 663 2 628 5 345 5 297 10 565
Corporate clients, incl: 4 634 4 342 9 006 8 502 17 108 Water supply service 2 541 2 396 4 854 4 683 9 441 Waste water disposal service 2 093 1 946 4 152 3 819 7 667
Outside service area clients, incl: 920 913 1 744 1 778 3 415 Water supply service 216 212 421 423 840 Waste water disposal service 704 701 1 323 1 355 2 575
Overpollution fee 225 241 428 458 847
Stormwater treatment and disposal service 726 749 1 529 1 498 3 286Fire hydrants service 48 48 96 96 193Other works and services 294 285 477 468 1 034
Total revenue 12 781 12 499 25 186 24 734 49 680
100 % of AS Tallinna Vesi revenue was generated within the Estonian Republic.Code of Estonian Classification of Economic Activities (EMTAK) is 36001.
NOTE 5. STAFF COSTSfor the year ended 31
December2011 2010 2011 2010 2010
Salaries and wages -1 148 -1 053 -2 333 -2 105 -4 340Social security and unemployment insurance taxation -383 -350 -778 -700 -1 445Staff costs total -1 531 -1 403 -3 111 -2 805 -5 785
Number of employees at the end of reporting period 311 319 319
Quarter 2
Quarter 2
6 months
6 months
8 19
tanel
Text Box

AS TALLINNA VESIConsolidated Unaudited Interim Condensed Financial Statementfor the 1st half-year period of financial year 2011 ended 30 June 2011
NOTES TO THE CONSOLIDATED UNAUDITED INTERIM FINANCIAL STATEMENT (thousand EUR)
for the year ended 31 December
Cost of goods sold 2011 2010 2011 2010 2010
Tax on special use of water -231 -213 -457 -433 -847Chemicals -311 -332 -559 -660 -1 433Electricity -705 -688 -1 382 -1 271 -2 704Pollution tax -324 -701 -603 -937 -2 290Staff costs -1 050 -985 -2 167 -1 984 -4 030Development 0 0 -8 0 -8Depreciation and amortization -1 253 -1 278 -2 519 -2 555 -5 092Other costs of goods sold -1 063 -975 -2 125 -1 961 -4 280
Total cost of goods sold -4 937 -5 172 -9 820 -9 801 -20 684
Marketing expenses
Staff costs -81 -68 -171 -150 -320Depreciation and amortization -81 -84 -163 -168 -334Other marketing expenses -19 -27 -47 -65 -133
Total cost of marketing expenses -181 -179 -381 -383 -787
General administration expenses
Staff costs -400 -350 -773 -671 -1 435Depreciation and amortization -48 -48 -95 -94 -194Other general administration expenses -766 -496 -1 220 -946 -2 022
Total cost of general administration expenses -1 214 -894 -2 088 -1 711 -3 651
NOTE 7. OTHER INCOME / EXPENSESfor the year ended
31 December
2011 2010 2011 2010 2010
Profit from government grant 246 1 053 561 1 335 3 310Other income / expenses (-) 202 -125 351 -273 -404
Total other income / expenses 448 928 912 1 062 2 906
NOTE 6. COST OF GOODS SOLD, MARKETING AND GENERAL ADMINISTRATIONS EXPENSES
6 months Quarter 2
Quarter 2 6 months
9 20
tanel
Text Box

AS TALLINNA VESIConsolidated Unaudited Interim Condensed Financial Statementfor the 1st half-year period of financial year 2011 ended 30 June 2011
NOTES TO THE CONSOLIDATED UNAUDITED INTERIM FINANCIAL STATEMENT (thousand EUR)
NOTE 8. FINANCIAL INCOME AND EXPENSES
for the year ended 31 December
2011 2010 2011 2010 2010
Interest income 361 224 621 463 1 060Interest expense, incl swap interests -748 -586 -1 423 -1 047 -2 372Swap fair value -767 -995 724 -2 238 -1 238Other financial expenses 1 -7 -1 -29 -14
Total financial income / expenses -1 153 -1 364 -79 -2 851 -2 564
NOTE 9. DIVIDENDSfor the year ended
31 December
2011 2010 2011 2010 2010
Dividends declared during the period 16 001 31 956 16 001 31 956 31 956Dividends paid during the period 16 001 31 956 16 001 31 956 31 956
Income tax on dividends paid -4 253 -8 495 -4 253 -8 495 -8 495
Income tax accounted for -4 253 -8 495 -4 253 -8 495 -8 495
Paid-up dividends per shares:Dividends per A-share (in euros) 0,80 1,60 0,80 1,60 1,60Dividends per B-share (in euros) 639 639 639 639 639
The income tax rates were 21/79 in 2011 and 2010.
NOTE 10. EARNINGS PER SHARE
for the year ended 31 December
2011 2010 2011 2010 2010
Net profit minus B-share preference rights 1 490 0 9 476 2 554 16 404
Weighted average number of ordinary shares for the purposes of basic earnings per share (in pieces) 20 000 000 20 000 000 20 000 000 20 000 000 20 000 000
Earnings per A share (in euros) 0,07 0 0,47 0,13 0,82
Earnings per B share (in euros) 639 0 639 639 639
Diluted earnings per share for the periods ended 30 June 2011 and 2010 and 31 December 2010 do not vary significantly from the earnings per share figures stated above.
Quarter 2
Quarter 2
Quarter 2
6 months
6 months
6 months
10
21
tanel
Text Box

AS TALLINNA VESIConsolidated Unaudited Interim Condensed Financial Statementfor the 1st half-year period of financial year 2011 ended 30 June 2011
NOTES TO THE CONSOLIDATED UNAUDITED INTERIM FINANCIAL STATEMENT (thousand EUR)
NOTE 11. RELATED PARTIES
Shareholders having the significant influence
as of 31 December
Balances recorded in working capital on the statement of financial position of the Group 2011 2010 2010
Accounts receivable 4 533 2 904 7 194Accrued income 4 883 2 834 7 256Accounts payable - short-term trade and other payables 182 424 200
for the year ended 31 December
2011 2010 2011 2010 2010
Transactions with the related parties
Sales services 765 787 1 606 1 574 3 440Compensation receivable from the local governments for constructing new pipelines 281 1 018 2 285 1 565 10 390
Purchase of administrative and consulting services 252 282 480 575 1 032Financial income 278 115 498 220 732
Management Board fees excluding social tax 58 38 121 76 199Supervisory Board fees excluding social tax 10 10 20 19 38
The market prices were implemented in transactions with related parties.
Company shares belonging to the Management Board and Supervisory Board membersAs at report generation date Siiri Lahe owned 700 AS Tallinna Vesi shares.
The fees disclosed above are contractual payments made by the Company to the management board members. In addition to this the board members have also received direct compensations from the companies belonging to the group of United Utilities (Tallinn) B.V. as overseas secondees.
Transactions with related parties are considered to be transactions with members of the Supervisory Board and Management Board, their relatives and the companies in which they have control or significant influence and transactions with shareholder having the significant influence. Dividend payments are indicated in the Statement of Changes in Equity.
Quarter 2
as of 30 June
6 months
11
22
tanel
Text Box

AS TALLINNA VESIConsolidated Unaudited Interim Condensed Financial Statementfor the 1st half-year period of financial year 2011 ended 30 June 2011
NOTES TO THE CONSOLIDATED UNAUDITED INTERIM FINANCIAL STATEMENT
NOTE 12. LIST OF SUPERVISORY BOARD MEMBERS
Robert John Gallienne Chairman of the Supervisory BoardLeslie Anthony Bell Member of the Supervisory BoardSimon Gardiner Member of the Supervisory BoardPhilip Anthony Aspin Member of the Supervisory BoardToivo Tootsen Member of the Supervisory BoardMart Mägi Member of the Supervisory BoardRein Ratas Member of the Supervisory BoardValdur Laid Member of the Supervisory BoardDeniss Boroditš Member of the Supervisory Board
Introduction and photos of the Management Board members are published in 2010 Yearbook and at www.tallinnavesi.ee
12 23
tanel
Text Box