ARAYA RAIWA - Dissertationen Online an der FU Berlin - Freie
124
FORMULATION DEVELOPMENT STRATEGIES FOR ORAL EXTENDED RELEASE DOSAGE FORMS Dissertation zur Erlangung des akademischen Grades des Doktors der Naturwissenschaften (Dr. rer. nat.) eingereicht im Fachbereich Biologie, Chemie, Pharmazie der Freien Universität Berlin vorgelegt von ARAYA RAIWA aus Bangkok, Thailand May, 2011
Transcript of ARAYA RAIWA - Dissertationen Online an der FU Berlin - Freie

FORMULATION DEVELOPMENT STRATEGIES FOR ORAL EXTENDED RELEASE DOSAGE FORMS
Dissertation
zur Erlangung des akademischen Grades des
Doktors der Naturwissenschaften (Dr. rer. nat.)
eingereicht im Fachbereich Biologie, Chemie, Pharmazie
der Freien Universität Berlin
vorgelegt von
ARAYA RAIWA aus
Bangkok, Thailand
May, 2011

1. Gutachter: Prof. Dr. Roland Bodmeier
2. Gutachter: Prof. Dr. Jürgen Siepmann
Disputation am 9.Juni 2011

TO MY FAMILY

ACKNOWLEDGEMENTS
First and foremost, I wish to express my deepest gratitude to my supervisor, Prof. Dr.
Roland Bodmeier for his professional guidance, helpful advices and encouragement. I am
very grateful for his scientific and financial support and for providing me such an interesting
topic. Furthermore, I am very thankful to him for the opportunity to support his editorial
role in the European Journal of Pharmaceutical Sciences.
I would like to thank Prof. Dr. Jürgen Siepmann for co-evaluating this thesis. Thanks are
extended to Prof. Dr. Herbert Kolodziej, Prof. Dr. Johannes Peter Surmann and Dr. Martin
Körber for serving as members of my thesis advisor committee.
I am particular thankful to Dr. Andrei Dashevsky, Dr. Nantharat Pearnchob and Dr. Martin
Körber for their very useful discussion; Dr. Burkhard Dickenhorst for evaluating parts of
this thesis; Mrs. Angelika Schwarz for her assistance with administrative issues; Mr.
Andreas Krause, Mrs. Eva Ewest and Mr. Stefan Walter for the prompt and diligent
technical support. Sincere thanks are extended to Dr. Ildiko Terebesi, Dr. Burkhard
Dickenhorst, Dr. Soravoot Rujivipat and Dr. Samar El-Samaligy for the friendly atmosphere
in the lab
My special thanks are owing to all members from the Kelchstrasse for their practical advice,
enjoyable discussion and kindness throughout the years. In addition, I would like to thank
Dr. Nantharat Pearnchob, Dr. Saowanee Jaraswekin, Dear and all my friends in Germany
for excellent support and companionship during the time in Berlin.
Most importantly, with my deep gratitude, I wish to thank my family for their love, constant
encouragement and never-ending support over the years.


I
TABLE OF CONTENTS
Chapter Page
1. INTRODUCTION.................................................................................................. 1
1.1 Extended release solid oral dosage form....................................................... 2
1.1.1 Single unit dosage forms................................................................... 2
1.1.2 Multiparticulate pellet systems.......................................................... 4
1.2 Data analysis................................................................................................. 4
1.2.1 Multivariate statistical approach....................................................... 5
1.2.2 Data mining approach....................................................................... 6
1.3 In vitro performance of oral extended release formulations......................... 7
1.3.1 Dissolution testing............................................................................. 7
1.3.2 Biorelevant dissolution testing.......................................................... 8
1.3.3 Drug release in the presence of alcohol............................................. 22
1.3.4 Dissolution conditions for extended release dosage forms............... 28
1.4 Objectives...................................................................................................... 31
2. MATERIALS AND METHODS........................................................................... 33
2.1 Materials........................................................................................................ 34
2.1.1 Drugs……………………………………………………………… 34
2.1.2 Drug products………...…………………………………................. 34
2.1.3 Buffer components…………………………………….................... 34
2.2 Experimental methods................................................................................... 38
2.2.1 Drug solubility determinations.......................................................... 38
2.2.2 In vitro drug release studies............................................................... 38
2.2.3 Comparison of release profiles.......................................................... 39
2.3 Theoretical methods...................................................................................... 40
2.3.1 Data set.............................................................................................. 40
2.3.2 Calculation of dose number............................................................... 41
2.3.3 Statistical analysis............................................................................. 41
II
3. RESULTS AND DISCUSSION……….................................................................. 43
3.1 In vitro performance and dissolution robustness of bioequivalent extended
release solid oral dosage forms..................................................................... 44
3.1.1 Introduction………........................................................................... 44
3.1.2 Results and discussion………………............................................... 45
3.1.3 Conclusion…………………............................................................. 62
3.2 Effect of sodium dodecyl sulphate on the in vitro dissolution of extended
release solid oral dosage forms..................................................................... 63
3.2.1 Introduction………........................................................................... 63
3.2.2 Results and discussion………………............................................... 64
3.2.3 Conclusion…………………............................................................. 74
3.3 Evaluation of drug properties for the selection of extended release solid
oral dosage form: Application of principal component analysis................... 76
3.3.1 Introduction………........................................................................... 76
3.3.2 Results and discussion………………............................................... 77
3.3.3 Conclusion…………………............................................................. 89
4. SUMMARY……………………............................................................................ 91
5. ZUSAMMENFASSUNG………………................................................................. 95
6. REFERENCES…………………........................................................................... 101
7. PUBLICATIONS & PRESENTATIONS RESULTING FROM THIS WORK 113
8. CURRICULUM VITAE…………........................................................................ 115

1. INTRODUCTION
Chapter 1. Introduction ________________________________________________________________________________
2
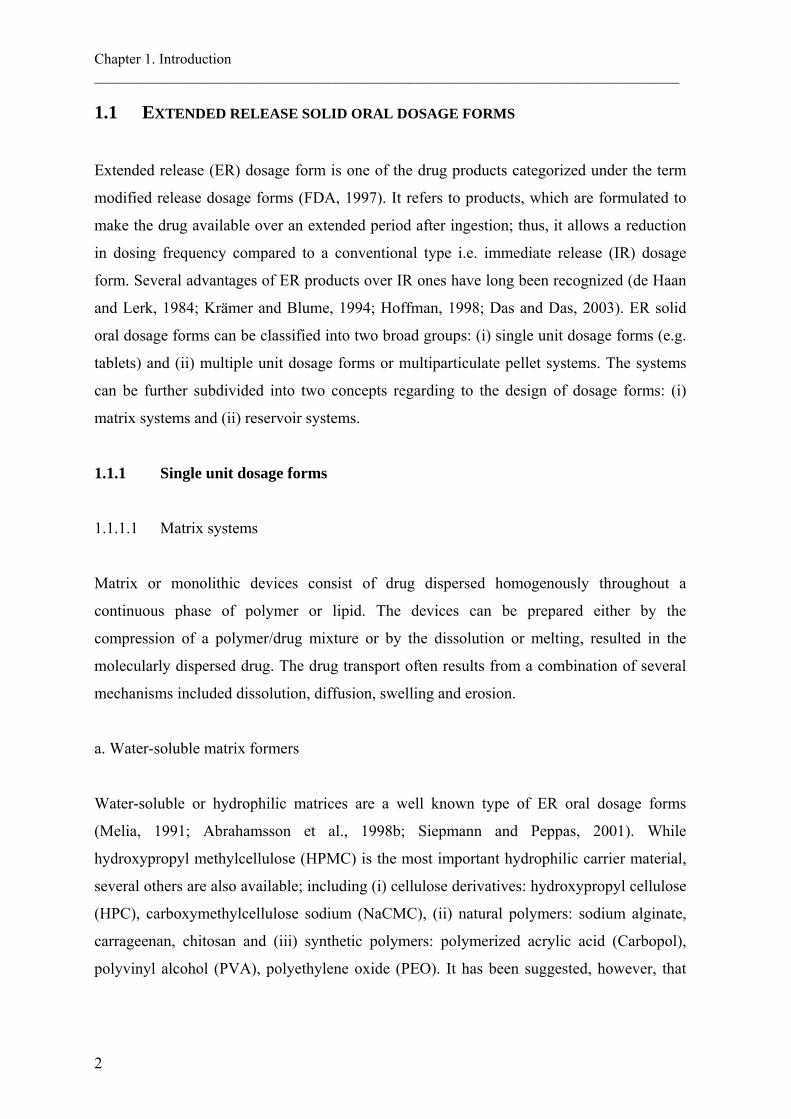
1.1 EXTENDED RELEASE SOLID ORAL DOSAGE FORMS
Extended release (ER) dosage form is one of the drug products categorized under the term
modified release dosage forms (FDA, 1997). It refers to products, which are formulated to
make the drug available over an extended period after ingestion; thus, it allows a reduction
in dosing frequency compared to a conventional type i.e. immediate release (IR) dosage
form. Several advantages of ER products over IR ones have long been recognized (de Haan
and Lerk, 1984; Krämer and Blume, 1994; Hoffman, 1998; Das and Das, 2003). ER solid
oral dosage forms can be classified into two broad groups: (i) single unit dosage forms (e.g.
tablets) and (ii) multiple unit dosage forms or multiparticulate pellet systems. The systems
can be further subdivided into two concepts regarding to the design of dosage forms: (i)
matrix systems and (ii) reservoir systems.
1.1.1 Single unit dosage forms
1.1.1.1 Matrix systems
Matrix or monolithic devices consist of drug dispersed homogenously throughout a
continuous phase of polymer or lipid. The devices can be prepared either by the
compression of a polymer/drug mixture or by the dissolution or melting, resulted in the
molecularly dispersed drug. The drug transport often results from a combination of several
mechanisms included dissolution, diffusion, swelling and erosion.
a. Water-soluble matrix formers
Water-soluble or hydrophilic matrices are a well known type of ER oral dosage forms
(Melia, 1991; Abrahamsson et al., 1998b; Siepmann and Peppas, 2001). While
hydroxypropyl methylcellulose (HPMC) is the most important hydrophilic carrier material,
several others are also available; including (i) cellulose derivatives: hydroxypropyl cellulose
(HPC), carboxymethylcellulose sodium (NaCMC), (ii) natural polymers: sodium alginate,
carrageenan, chitosan and (iii) synthetic polymers: polymerized acrylic acid (Carbopol),
polyvinyl alcohol (PVA), polyethylene oxide (PEO). It has been suggested, however, that
Chapter 1. Introduction ________________________________________________________________________________
3
the term ‘swellable matrices’ is more appropriate as it better explains the characteristic of
the systems (Colombo et al., 2000).
b. Water-insoluble matrix formers
Water-insoluble carrier materials include (i) lipid-base excipients: white wax, carnauba wax,
glyceryl monostearate, hydrogenated vegetable oil, paraffin and (ii) polymer-based
excipients: ethylcellulose (EC), cellulose acetate. In comparison to the hydrophilic matrices,
the system has a greater physical stability, resulting in the less variable drug release and the
lower incidence of ‘dose dumping’ in presence of food (Huang et al., 1994).
1.1.1.2 Reservoir systems
Reservoir systems are characterized by a drug-containing core surrounded by release-rate
controlling polymer(s). The mechanism of the drug transport across the polymeric
membrane has been extensively described by Lecomte (2004).
a. Coated tablets
An example of technology for ER coated tablet is MODAS (Multiporous Oral Drug
Absorption System; Elan Corporation, Ireland). The tablet core consists of the mixture of
active drug and other excipients, subsequently coated with a solution of water-insoluble
polymers and water-soluble excipients. Upon exposure to aqueous media, the surrounded
coating is transformed into a semi-permeable membrane through which the drug diffuses in
a rate-limiting manner (Verma and Garg, 2001).
b. Osmotic pump systems
Osmotic device is a special type of the reservoir systems, where the release rate of the drug
is controlled dynamically by an incorporated osmotic agent in the active drug core. The
rigid surrounding semi-permeable membrane consists for example of cellulose acetate. The
drug is released through a defined, laser drilled delivery orifice in the membrane (Verma et
al., 2002).

Chapter 1. Introduction ________________________________________________________________________________
4
1.1.2 Multiparticulate pellet systems
Several advantages of multiparticulate systems over the single unit ones have been well
documented (Digenis, 1994; Steward, 1995; Bodmeier, 1997). Following a proper
preparation method, the ER pellets are either filled into a capsule or are compressed into a
tablet (Bodmeier, 1997).
1.1.2.1 Matrix systems
The matrix type of multiparticulate systems can be prepared by several techniques such as
extrusion/spheronisation (Flament et al., 2004), spherical crystal agglomeration
(Kachrimanis et al., 2000) and melt-solidification (Paradkar et al., 2003). Although, the
production of multiparticulate matrix systems is considered to be easier than that of the
reservoir systems, their extent of retardation is limited because of pellet geometry (Knoch,
1994).
1.1.2.2 Reservoir systems
Coated pellets as a mean to control drug delivery are widely used in the pharmaceutical
industry, although the development and optimisation of the systems are rather complex
(McGinity, 1997; Lecomte, 2004). Numerous aspects of the system performance have been
investigated, for instance, the influence of formulation and coating technique (Nastruzzi et
al., 2000; Ganesan et al., 2003; Pearnchob and Bodmeier, 2003; Lecomte et al., 2004), the
effect of drug solubility and core material (Steiner and Bodmeier, 2007), the use of polymer
blends (Lecomte, 2004), in vitro/in vivo evaluation (Li et al., 1995; Mohamad and
Dashevsky, 2007; Cui et al., 2008) and the influence of release medium (Bodmeier et al.,
1996).
1.2 DATA ANALYSIS
Data analysis is a process of collecting, modeling and transforming data with the goal of
extracting useful information, facilitating conclusions and supporting decision making.
Chapter 1. Introduction ________________________________________________________________________________
5
When the analysis involves a number of variables at a time (e.g. several drug properties),
techniques such as multivariate statistics or data mining are generally applied.
1.2.1 Multivariate statistical approach
Multivariate statistics refer to any statistical technique that looks at interrelationships or
pattern between several variables simultaneously. When the overall focus of analysis is
mainly related to the practical and problem-specific use of the structure part rather than the
random error part of data (i.e. noise), hypothesis testing and other statistical considerations,
the term multivariate data analysis (MVA) is inferred (Esbensen et al., 2006).
The major objectives of the MVA include (i) data description, (ii) discrimination and
classification and (iii) regression and prediction. Several MVA techniques are available,
such as factor analysis (e.g. principal component analysis), discriminant analysis, logistic
regression analysis and cluster analysis. The choice of technique depends on data analytical
problems or the desired type of answer.
Principal component analysis (PCA)
PCA is a technique for simplifying data by reducing multidimensional data to lower
dimensions while retaining as much as possible the variation of the data set (Jolliffe, 2002).
It is a linear transformation that transforms the data to a new coordinate system, so called
the principal components (PCs). The first few, i.e. lower-order, PCs are able to explain the
largest structural variation of the original data set, whereas the higher-order ones are
generally considered as less relevant and hence, being dropped from further analysis. It
should be noted, however, that the lower-order PCs, such as PC1 and PC2, are not always
the most relevant for some particular interpretation purposes because they are unable to
reveal the targeted answer. Therefore, the use of the higher-order PCs, when they have the
largest problem-specific information, is more appropriate in certain cases (Esbensen et al.,
2006).
PCA can also be used to classify data. The method facilitates the classification of objects
(e.g. drugs) considering conformity with the extracted model and variables (e.g. drug
Chapter 1. Introduction ________________________________________________________________________________
6
properties) describing the objects (Esbensen et al., 2006). This classification can be
interpreted through the map of samples so called score plots, the map of variables so called
loading plots as well as the relationship between both plots. The interpretation can be further
simplified by the rotation of PCs using, for example, varimax rotation (Kaiser, 1958). The
rotation is performed so as to maximize the variance of factor loading by making high
loadings higher and low ones lower for each factor.
The PCA technique has found application in many diverse fields such as environmental
science (Soh and Abdullah, 2007), marketing (Petroni and Braglia, 2000), psychology (El
Yazaji et al., 2002), food science (Cotroneo et al., 1990; Krauze and Zalewski, 1991; Muir
et al., 1996) and pharmaceutical science (Tarvainen et al., 2001; Karalis et al., 2002; Tho et
al., 2002).
1.2.2 Data mining approach
Data mining or Knowledge-Discovery in Databases (KDD) is the synthesis of several
technologies, including data management, statistics, machine learning (which can include
pattern recognition techniques) and visualization. The techniques are applied for extracting
hidden knowledge and describing structural patterns in data as a tool for helping to explain
and make predictions from the data. The entire process of data mining includes collection,
abstraction and cleansing of the data, use of data mining tools to find patterns, validation
and verification of the patterns, visualization of the developed models and refinement of the
collection process.
Among several data mining modeling techniques, an appropriate one can be selected
according to the problem type, for example classification, prediction and description. Many
modeling tools are capable of generating models which at the same time solve classification
task and provide an informative description of the model behind the data, i.e. descriptive
task.

Chapter 1. Introduction ________________________________________________________________________________
7
Decision tree induction
Decision tree induction is a well known and widely used data mining technique (Jong Woo
et al., 2001; Slonim, 2002; Ordonez, 2006). It is a decision support tool that maps
observations from a given dataset (e.g. drug properties) to possible consequences or target
values (e.g. dosage form). Many popular algorithms, such as ID3 (Quinlan, 1986), C4.8
(Quinlan, 1992) or its open-source implementation J4.8 (Witten and Frank, 2005), are
applied to the data for the construction of a classifier that is expressed as a tree. The
generated model is used for classification and subsequently is applied for prediction. For
example, the dosage form of drugs whose properties are known can be predicted from the
decision tree model by following the set of classifiers (i.e. selected drug properties), starting
at the root of the tree and moving through it until a leaf node, where the classification of the
drug is provided (Fig. 1). Several advantages of decision tree model include; (i) useful for
both classification and prediction tasks, (ii) simple to understand and interpret, (iii) requires
little data preparation, (iv) handles both numerical and categorical data, (v) uses a white box
model, (vi) possible to validate a model using statistical tests and (vii) robust and performs
well with large data in a short time (Witten and Frank, 2005).
Fig. 1 Example of a decision tree model
1.3 IN VITRO PERFORMANCE OF ORAL ER FORMULATIONS
1.3.1 Dissolution testing
Dissolution testing is an official evaluation method for solid oral dosage forms. Several
pharmacopeial standard dissolution media and apparatuses are well documented. The

Chapter 1. Introduction ________________________________________________________________________________
8
method was initially developed for IR solid oral dosage form and then extended to modified
release solid oral dosage forms as well as other novel/special dosage forms. Guidelines to
dissolution testing for a range of novel dosage forms, such as chewable tablets,
suppositories, transdermal patches, aerosols, implants and liposomes have been extensively
discussed (Siewert et al., 2003; Azarmi et al., 2007).
The application of dissolution testing was conventionally known as a tool for ensuring batch
to batch consistency. It is also an essential mean for deciding on a candidate formulation in
product development. The tests should be sensitive enough to demonstrate any small
variable in manufacturing of a product as well as the type and level of excipients used.
Therefore, it is possible that an over-discriminatory test, although in vivo irrelevance, might
be suitable for these purposes (Azarmi et al., 2007).
The value of dissolution test was later shifted to bioavailability prediction. Challenges in
selecting the test conditions which reflect in vivo drug release have been of interested to
many researchers (Uppoor, 2001; Gu et al., 2004; Royce et al., 2004). The tests may not be
pharmacopeial standard, they should, however, be sensitive, reliable and discriminatory
with regard to the in vivo drug release characteristics (Qureshi, 2006; Azarmi et al., 2007).
The ultimate goal of the dissolution test is to predict the in vivo performance of products
from in vitro test by a proper correlation, so called in vitro/in vivo correlation (IVIVC)
(Emami, 2006). In certain cases, dissolution tests can be used for providing biowaivers for
lower strengths of a product once the higher strength is approved. The waivers can also be
granted to some categories of postapproval changes, based on the appropriate
bioavailability/bioequivalence test procedure (FDA, 1997; FDA, 2000).
1.3.2 Biorelevant dissolution testing
1.3.2.1 Physiological properties of the gastrointestinal tract
Physiological conditions vary wildly along the gastrointestinal (GI) tract. Not to mention
intersubject variability, various factors within an individual, such as disease states, physical
activity level, stress level and food ingestion, considerably influence the GI conditions
(Dressman et al., 1998). The effects of this variability on the performance of ER systems are

Chapter 1. Introduction ________________________________________________________________________________
9
even more pronounced given that the dosage forms are designed to remain in the GI tract for
the substantially longer period of time and transit through various conditions compared with
IR systems. Inhomogeneous distribution of fluid in the small and large intestine (Schiller et
al., 2005) is one of many factors that potentially contributes to the variability of drug release
and absorption. Physiological properties in various GI compartments with and without
effect of food are presented in Table 1 and Table 2.
Table 1 Physiology of the GI tract of healthy humans in fasted state
Location Fluid volume
(ml)
Transit time
(h) pH
Osmolality
(mOsm/kg)
Buffer capacity
(mmol/L·∆pH)
Surface tension
(mN/m)
Stomach 451 1-22-3 1.5-1.93-7 98-1404 7-184 42-464 Duodenum
1051 3.63 6.53 1784 5.64 32.34
Jejunum 6.83 2718 2.49 289 Ileum 7.23 n/a n/a n/a Colon 131 7-202 6.53 n/a n/a n/a
Table 2 Physiology of the GI tract of healthy humans in fed state
Location
Fluid
volume*
(ml)
Transit time
(h) pH
Osmolality
(mOsm/kg)
Buffer capacity
(mmol/L·∆pH)
Surface tension
(mN/m)
Stomach 800-90010 1.4-4.03 3-72, 4, # 217-5594, # 14-284 30-314 Duodenum
900-100010 3.83 5.1-5.42 3904 18-304 28.1-28.84
Jejunum 5.2-6.011 n/a 14.69 279 Ileum 7.511 n/a n/a n/a Colon n/a n/a 52 n/a n/a n/a * including the volume of meal # changed with time, see text 1 Schiller et al. (2005) 2 Dressman et al. (1998) 3 Ibekwe et al. (2008) 4 Kalantzi et al. (2006) 5 Dressman et al. (1990) 6 Evans et al. (1988) 7 Vertzoni et al. (2005) 8 Lindahl et al. (1997) 9 Persson et al. (2005) 10 Custodio et al. (2008) 11 Hörter and Dressmann (2001) n/a: information not available
Schiller et al. (2005) investigated the transit of non-disintegrating capsules in relation to the
presence of fluid in the GI tract as well as the effect of meal. Instead of a continuous fluid
compartment, four and six fluid-filled pockets were found discontinuously located in the
small intestine in fasted and fed state, respectively. A solid dosage form was, therefore, not

Chapter 1. Introduction ________________________________________________________________________________
10
at all time accessible to the fluid as found from the study that 27% and 90% of the capsules
located in the small and larger intestine, respectively, were not in contact with the fluid
pocket. Interestingly, the total fluid volume of the small intestine reduced at one hour after
meal, where chyme had not yet presented, from 105 ml to 54 ml. This reduction was due to
the gastro-ileocaecal reflex mechanism that caused the distal part of the small intestine
pushing the remaining content, including the preceding dose of a dosage form, forward into
the colon. This phenomenon, however, did not increase the total fluid in the colon because
of the high water absorption capacity.
Gastric emptying time of a solid dosage form changes dramatically with the effect of co-
administered food. One out of twelve capsules taken three hours before meal and all twelve
capsules taken immediately after meal remained in the stomach for at least one hour, while
in the fasted state, the majority of the capsules had left the stomach within one hour
(Schiller et al., 2005). The total time for a dosage form to empty from the stomach in the
fasted state depends on the size of the dosage form, i.e. the longer time is needed for the
larger, as well as the motility cycle of the stomach which is two hours in average. The
emptying for most non-disintegrating solid dosage forms with larger than one millimeter
diameter occurred in the late phase II or phase III of the cycle (Dressman et al., 1998). Co-
administered food even further altered the emptying time depending on the calorie content.
Davis et al. (1984) and Velchik et al. (1989) reported that the higher the calories contained
in the meal, the longer the gastric emptying time. A delay for several hours to empty a
relatively large solid dosage form can also occur as the food will be first cleared from the
stomach and return to the normal gastric motility cycle in the fasted state. The dosage form
is then emptied under the phase III activity (Dressman et al., 1998). Unlike the gastric
emptying, transit time in the small intestine in both fasted and fed states are not significantly
different, regardless of the type of dosage forms (Dressman et al., 1998; Ibekwe et al.,
2008).
pH and osmolality of the stomach and the upper small intestine is greatly influence by co-
administered food. In healthy humans, their values for the stomach increased from pH 1.7/
140 mOsm kg-1 up to pH 6.4/559 mOsm kg-1 within thirty minutes postprandially and then
gradually decreased to pH 2.7/217 mOsm kg-1 after 3.5 hours. Composition and quantity of
the meal significantly affected the time require to re-establish the fasting gastric pH more

Chapter 1. Introduction ________________________________________________________________________________
11
than did the pH value of the meal. For example, two hours was required after a 651
mOsm/1000 kcal (pH 5.6) meal whereas only one hour was needed for a 540 mOsm/458
kcal meal (pH 6) (Kalantzi et al., 2006). As the average time for restoring the pH of the
stomach was two to three hours (Dressman et al., 1998), dosage forms with pH-dependent
controlled release, such as an enteric coated tablet, may fail to control the release when
taken with or soon after meal. Recently, Jantratid et al. (2008) proposed the biorelevant
dissolution media simulating the characteristic of the GI fluids in both fasted and fed states.
As the postprandial conditions vary according to the time, the diverse compositions of the
media for different states were presented accordingly.
Physiology of the colon has not much influence by co-administered food. As previously
mentioned, the fluid volume of the colon was not significantly changed with meal induction
(13 ± 12 ml vs. 11 ± 26 ml) because of the high water absorption capacity (Schiller et al.,
2005). Unlike the stomach and the small intestine, the movement of luminal contents in the
colon did not always occur longitudinally, but also laterally in order to assist the mixing of
the contents and to facilitate absorption (Price et al., 1993). A food effect study with
radiography revealed the remaining of some of the radio-opaque markers after 36 h at the
ascending colon, whilst some of them taken only 12 h before the study were found at the
end of the transverse colon (Dressman et al., 1998). The transit time of a dosage form was,
therefore, considered as no effect of food intake. This is in agreement with a study by
Edsbacker et al. (2002) which reported that delivery to the colon and ileum was independent
of co-administered meal.
1.3.2.2 Effect of food on the bioavailability of drugs and dosage forms
The presence of food within the GI tract can significantly influence the bioavailability of
drugs, both by the nature of food and the drug formulations. Factors deserving critical
attention for predicting bioavailability under fed conditions are;
1. An increase in solubilisation capacity by higher concentrations of bile salts and fatty
acids. This factor can alter the release profiles of lipophilic drugs (TenHoor et al.,
1991; Kostewicz et al., 2002) or from dosage forms that drug released is controlled
by hydrophilicity (Khan, 1996).

Chapter 1. Introduction ________________________________________________________________________________
12
2. A prolonged gastric emptying time (increased GI-residence time), thus increasing the
total time available for dissolution and improve the bioavailability (Marvola et al.,
1989; Kenyon et al., 1995; Ishibashi et al., 1999; Fabre and Timmer, 2003). This
factor, however, can also inversely affect acid labile drugs that would expose to the
acidic environment of the stomach for a significantly longer period of time.
3. An elevation of the pH in the stomach altered the release pattern of pH-dependent
controlling formulations as well as affected the dissolution rate of drugs with pH-
dependent solubility (Marvola et al., 1989).
4. Changes in the physical and biochemical barrier function of the GI tract (Crison,
1999; Porter and Charman, 2001). The increased fluidity of the intestinal wall by
lipid as well as the increased leakiness of tight junctions by high concentration of
glucose can enhance the permeability of the small intestine (Crison, 1999).
5. Stimulation of intestinal lymphatic transport (Porter and Charman, 2001).
a. Drugs
Highly water soluble drugs
BCS Class I compounds, which are highly soluble across a wide range of pH values
(Amidon et al., 1995), are unlikely to be affected by ingested food. However, a delay in
gastric emptying may increase the time to peak drug concentrations (tmax). Simulated Gastric
Fluid (SGF) and milk can be used as in vitro dissolution media to predict the performance of
the drugs in vivo (Galia et al., 1998). Food components that alter mucosal enzymatic
activity and/or P-glycoprotein activity are also expected to change the absorption of
compounds of BCS Class III (high solubility - low permeability). It was also evident that
co-administered food reduced the bioavailability of atenolol and sotalol, the very
hydrophilic compounds. This was due to an interaction of the drugs with bile acid produced
in the fed state (Welling, 1996).
Poorly water soluble drugs
In general, food intake results in an increase in both rate (Cmax) and/or extent (AUC) of
absorption because of the improved drug solubility. This higher solubility of drug was

Chapter 1. Introduction ________________________________________________________________________________
13
attributed to the presence of fat content in the co-administered food as well as bile acid
producing in the fed state. For BCS Class II compounds (low solubility - high permeability),
an increase in absorption is expected when the product is administered with high fat meals.
In vitro dissolution study in two media simulating the small intestinal contents in the fed
(FeSSIF) and fasted (FaSSIF) states as well as the modified versions of the two (Wei and
Löbenberg, 2006; Zoeller and Klein, 2007) can provide good information of the in vivo
behaviour of weak basic and weak acid compounds, while FaSSIF is recommended for
neutral compounds (Galia et al., 1998).
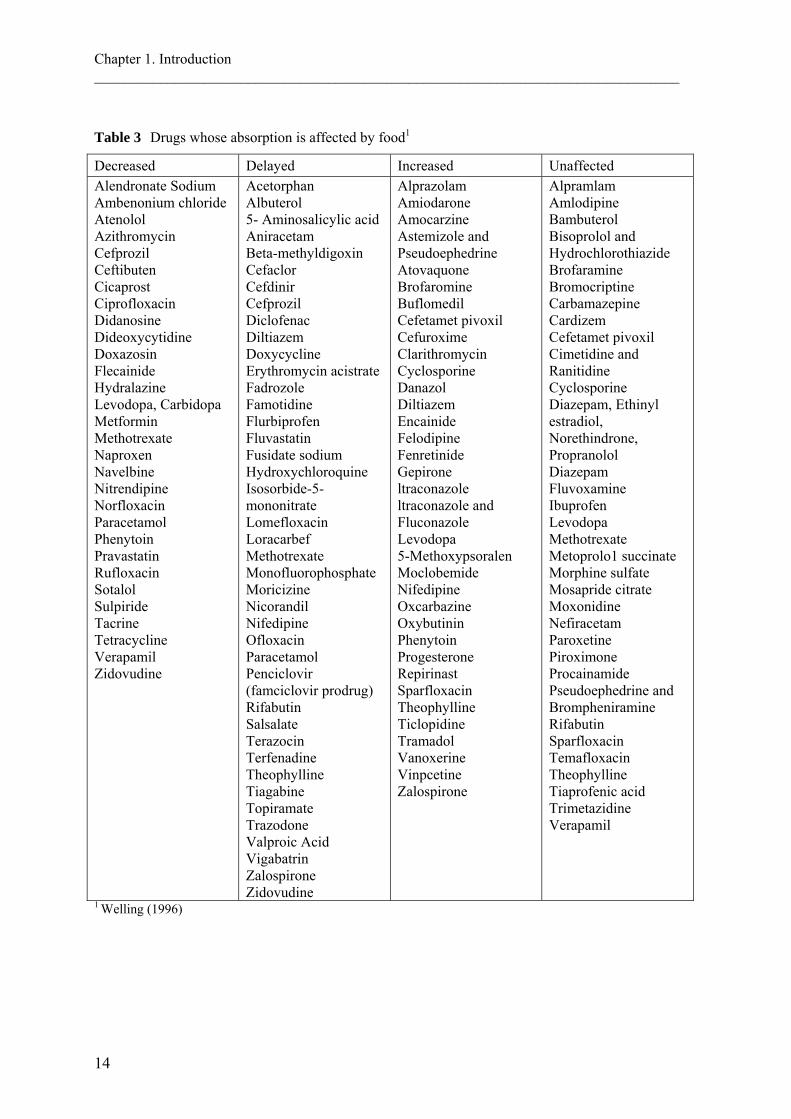
A review by Welling (1996) reported a number of drugs that co-administered food
influenced their absorption. The author categorized the drugs with regard to the effect of
food into four groups (Table 3); drugs whose absorption is decreased, delayed, increased
and those in which food has no effect.
It can be noted from Table 3, however, that a drug could be categorized into more than one
group according to the results obtained under various study conditions, such as single vs.
multiple doses, light vs. heavy meals. Consequently, the effect of food on drug absorption
could only be predicted partially from physicochemical point of view. A conclusive decision
based solely on a single study was unwarranted. In addition, a very important factor pointed
out by the author as well as by several researchers (Davis et al., 1984; Abrahamsson et al.,
1998a; Halsas et al., 1999; Schug et al., 2002a; Schug et al., 2002b; Wei and Löbenberg,
2006) was that the effect of food on the bioavailability of a drug is more likely to be
formulation/dosage form-dependent.
Chapter 1. Introduction ________________________________________________________________________________
14
Table 3 Drugs whose absorption is affected by food1
Decreased Delayed Increased Unaffected Alendronate Sodium Ambenonium chloride Atenolol Azithromycin Cefprozil Ceftibuten Cicaprost Ciprofloxacin Didanosine Dideoxycytidine Doxazosin Flecainide Hydralazine Levodopa, Carbidopa Metformin Methotrexate Naproxen Navelbine Nitrendipine Norfloxacin Paracetamol Phenytoin Pravastatin Rufloxacin Sotalol Sulpiride Tacrine Tetracycline Verapamil Zidovudine
Acetorphan Albuterol 5- Aminosalicylic acid Aniracetam Beta-methyldigoxin Cefaclor Cefdinir Cefprozil Diclofenac Diltiazem Doxycycline Erythromycin acistrate Fadrozole Famotidine Flurbiprofen Fluvastatin Fusidate sodium Hydroxychloroquine Isosorbide-5-mononitrate Lomefloxacin Loracarbef Methotrexate Monofluorophosphate Moricizine Nicorandil Nifedipine Ofloxacin Paracetamol Penciclovir (famciclovir prodrug) Rifabutin Salsalate Terazocin Terfenadine Theophylline Tiagabine Topiramate Trazodone Valproic Acid Vigabatrin Zalospirone Zidovudine
Alprazolam Amiodarone Amocarzine Astemizole and Pseudoephedrine Atovaquone Brofaromine Buflomedil Cefetamet pivoxil Cefuroxime Clarithromycin Cyclosporine Danazol Diltiazem Encainide Felodipine Fenretinide Gepirone ltraconazole ltraconazole and Fluconazole Levodopa 5-Methoxypsoralen Moclobemide Nifedipine Oxcarbazine Oxybutinin Phenytoin Progesterone Repirinast Sparfloxacin Theophylline Ticlopidine Tramadol Vanoxerine Vinpcetine Zalospirone
Alpramlam Amlodipine Bambuterol Bisoprolol and Hydrochlorothiazide Brofaramine Bromocriptine Carbamazepine Cardizem Cefetamet pivoxil Cimetidine and Ranitidine Cyclosporine Diazepam, Ethinyl estradiol, Norethindrone, Propranolol Diazepam Fluvoxamine Ibuprofen Levodopa Methotrexate Metoprolo1 succinate Morphine sulfate Mosapride citrate Moxonidine Nefiracetam Paroxetine Piroximone Procainamide Pseudoephedrine and Brompheniramine Rifabutin Sparfloxacin Temafloxacin Theophylline Tiaprofenic acid Trimetazidine Verapamil
1 Welling (1996)

Chapter 1. Introduction ________________________________________________________________________________
15
b. Dosage forms
Immediate release dosage form (IR)
The prolonged gastric emptying and the reduced hydrodynamic flow under fed state led to a
delay of tmax, while the AUC remained unaffected. Those effects depend, however, on
formulation characteristics. Panchagnula et al. (2003) found that the tablet of rifampicin
having the fast release (≥ 85% in 10 min) showed similar in vitro release profiles under
fasted and fed conditions while the formulation with the slower release rate (≥ 75% in 45
min), though comply with the USP dissolution criteria, demonstrated the varied release
profiles at different percentage of sunflower oil in SGF without pepsin and the reduced
release rates at lower agitation intensities. A further retardation of the release can be caused
by a slower tablet disintegration and drug dissolution through the formation of a protein film
around the tablet (Abrahamsson et al., 2004). Complexation of food contents and
bioadhesive materials such as polycarbophil, an excipient in bioadhesive tablet, can cause a
decrease in both Cmax and AUC (Hosny et al., 1994). However, a longer GI-residence time
also allows a better site-specific absorption, resulting in an increase of AUC (Gouda et al.,
1987).
Extended release dosage form (ER)
Multiparticulates
Multiparticulate pellet systems demonstrate less influence of co-administered food with
regard to the gastric emptying/GI-residence time compared to single unit dosage forms
(Davis et al., 1984). Pellets (size range 0.7-1.2 mm) were emptied from the stomach much
faster (4-5.5 h) than that of an osmotic tablet (9 h) when administered shortly after a heavy
meal (3600 kJ). While, following a light meal (1500 kJ), the gastric emptying times of both
systems were approximately the same (~2 h). Co-administered food, especially with high
caloric content, also allowed the higher degree of spreading of the pellets in comparison to
that under fasted state. The delayed GI-residence time of pellets in the upper GI tract allows
a longer time for dissolution and absorption, thereby increases bioavailability. The higher
and earlier peak plasma concentration of verapamil and its main metabolite norverapamil
Chapter 1. Introduction ________________________________________________________________________________
16
were more pronounced when multiparticulate pellets formulation was compared to the
single-unit tablet, given that the in vitro release characteristics of both formulations were
similar (Marvola et al., 1989). This increased bioavailability of ethylcellulose-coated
verapamil hydrochloride pellets was attributed to the higher solubility of the drug at lower
pH values, thus promoted the drug solubility and absorption.
Similar to the single-unit systems, changes of pH in the GI tract by food altered the
dissolution pattern of the pH-dependent dissolving particles (De Jaeghere et al., 2000). The
premature release and precipitation in the stomach of captopril formulated as pH-sensitive
matrix-type particles, thus decreased bioavailability, were attributed to the higher pH in the
stomach under fed state.
Swellable matrix
An in vivo study on a hydrophilic matrix system showed significant variation in
pharmacokinetic parameters when given with food (Dennis et al., 2000). The Cmax and AUC
of HPMC matrix tablets increased under fed conditions due to a greater tablet erosion rate,
which induced by intense motility as well as physicochemical effects of food components
and gastric secretions (Abrahamsson et al., 1998a). Swellable matrix tablet of the very low
water soluble drugs, nifedipine and felodipine, were used in the investigation of this effect
postprandially (Abrahamsson et al., 1999). Mechanical stress on the tablet, which adjusted
by varying the agitation intensities of dissolution apparatus, was the key factor enhancing
the rate of erosion corresponded to postprandial effect in vivo. Other factors investigated in
vitro including the used of simulated fed conditions and the elevated osmolality or viscosity
did not contribute to the higher erosion rate as the opposite effect, i.e. retarded erosion, to
those found in vivo was observed. The role of the GI mechanical destructive forces in
accelerating drug released under fed conditions has also been reported for acetaminophen
matrix tablets in other study (Shameem et al., 1995).
A remarkably increase of the oral bioavailability of an erosive tablet nifedipine for once
daily administration under fed state was explained as a pH-sensitive of the system (Schug et
al., 2002a). This was due to pH-dependent in vitro release characteristics, which were
observed when aqueous buffer solutions pH range 1-8 containing 1% SDS were used as

Chapter 1. Introduction ________________________________________________________________________________
17
dissolution media. The tablet was robust with regard to the effect of agitation, osmotic
pressure and different concentrations and types of surface active ingredients.
There are also contradicting reports showed, however, that the bioavailability of swelling
matrix tablets was reduced under fed conditions. Halsas et al. (1999) reported the prolonged
tmax and the decreased AUC of the HPMC press-coated tablet of ibuprofen when taken with
meal. A stable HPMC is formed over the pH range 3-11. With a lower pH, e.g. under fasted
conditions, a less stable gel around the tablet is formed and the formulation losses its
integrity. The elevated pH and viscosity in the stomach in fed state let to a more
mechanically stable HPMC gel resulting in the reduced drug release. Another study from
Crevoisier et al. (2003) showed postprandial effect on the release of levodopa from a
Geomatrix® tablet. Though the AUC was unaffected, the lower Cmax and the longer tmax
compared to those under fasted conditions were reported when the tablet was co-
administered with food. The reduced absorption rate of levodopa was explained as the
prolonged gastric emptying time.
Osmotic tablets
Co-administered food has less impact on osmotic systems compared with other ER systems.
A drug releases independently from the GI environment. For example, the oral
bioavailability of nifedipine-containing ER formulations were studied in healthy subjects
(Schug et al., 2002a). The osmotically driven gastrointestinal therapeutic system (GITS) i.e.
Adalat® OROS showed no significant effect of co-administered food on the nifedipine
bioavailability after a high fat meal when compared to that observed under fasted state. The
same study conditions were applied to an erosive matrix tablet, CORAL® (D.R. Drug
Research S.R.L., Italy) and a mini-tablets-containing capsule, Nifedicron (Searle
farmaceutici, Italy) (Schug et al., 2002b). Unlike the osmotic tablet, both generic products
showed a strikingly increased bioavailability (matrix tablet: 186% for AUC(0-24) and 317%
for Cmax, mini-tablets: 136% for AUC(0-24) and 243% for Cmax) under fed state due to dose
dumping of these formulations. In addition, the erosion rate of the osmotic systems did not
alter when co-administered with food as observed with the HPMC matrix tablets
(Abrahamsson et al., 1998a). Many studies suggested the similar results that food had no
effect on the clinical performance of osmotic systems (Lecaillon et al., 1985; van den Berg

Chapter 1. Introduction ________________________________________________________________________________
18
et al., 1990; Gupta et al., 1995; Grundy and Foster, 1996), although the prolonged tmax could
be observed because of a delayed gastric emptying (Davis et al., 1984; Modi et al., 2000).
1.3.2.3 Drug delivery systems independent of food intake
Not only have the osmotic pump systems demonstrated the drug released independently of
co-administered food, some other formulation designs were reported the lack of food effect.
For instant, an ER matrix tablet of nefazodone hydrochloride, an antidepressant drug which
required a dose of 200-600 mg daily, has shown no effect of food intake (Dennis et al.,
2000). The tablet composed of HPMC (the ratio of a 5 cps viscosity to a 100 cps viscosity
was 1:2), sodium alginate and microcrystalline cellulose (MCC) as the main inactive
ingredients. A mixture of the non-ionic gelling polymer, HPMC, and the ionic one, sodium
alginate as well as the insoluble hydrophilic agent, MCC, which was incorporated into the
formulation for encouraging water penetration into the dosage form but not causing the
ready disintegration, were properly combined in a ratio that provided a pH-modulated
erosion rate of the tablet. The release rates were faster at higher pH values in order to
compensate the lower solubility of this basic drug with pH-dependent solubility (sparingly
soluble as defined by USP, pKa=6.4). The HPMC matrix tablet of the same drug showed
effect of co-administered food by the increased bioavailability from 28 to 66%.
A patent has been issued on the ER formulation of Levetiracetam for once daily
administration that showed no effect of food (Kshirsagar et al., 2008). The tablet composed
of a core of the drug disperses in a high viscosity HPMC matrix (greater than 15 cps in a 2%
w/w solution), then coated with the dispersion of ethylcellulose as a release rate controlling
polymer and optionally with HPMC (low viscosity) as a pour former in the coating. The
tablet comprised between 20% and 40% HPMC matrix, between 1% and 10% ethylcellulose
and up to 5% of the pour former, per weight of the coated tablet. This formulation exhibited
a mean (AUCfasted)/(AUCfed) in human subjects of at least 0.80.
1.3.2.4 In vitro studies of food effect and the in vivo correlation
Biorelevant GI media, i.e. FaSSIF and FeSSIF were demonstrated as the potential in vitro
dissolution media for poorly soluble drugs in order to predict the in vivo performance
Chapter 1. Introduction ________________________________________________________________________________
19
especially with the effect of food on drug absorption (Nicolaides et al., 1999; Kostewicz et
al., 2002). Aqueous buffer solutions with varying pH (range 2.5-6.5), concentration of bile
salt and lecithin as well as the biorelevant GI media were used to evaluate the solubility and
dissolution characteristics of the compounds. The higher concentration of bile salt and
lecithin (combined with the lower pH, in case of weak bases) improved the solubility of the
compounds, thus increased dissolution rate. The release of the drugs in FaSSIF and FeSSIF
were much faster than those in water and Simulated Intestinal Fluid without pancreatin
(SIFsp) (Nicolaides et al., 1999). In addition, the calculation of dose to solubility ratios from
the solubility data of the drugs in different media revealed the potential site for dissolution
and absorption, based on fluid available in the particular regions of the GI tract (Kostewicz
et al., 2002). The higher solubility and the faster dissolution rate in FaSSIF and FeSSIF
were in agreement with the in vivo studies of these compounds that demonstrated the
positive impact of co-administered food on the bioavailability. Dipyridamoles, one of the
compounds studied, showed increased AUC and tmax when co-administered with food in
healthy volunteers. It could, therefore, be explained as the improved drug solubility that
caused by the high concentration of bile salt and lecithin together with the reduced pH
during the prolonged GI residence time.
The updated versions of FaSSIF and FeSSIF, which more closely mimic the human
physiological conditions under both fasted and fed states, were recently published (Jantratid
et al., 2008). Based on the in vivo data available from human aspirates, FaSSIF-V2 was
recommended as the medium to simulate preprandial conditions, while the three ‘snapshot’
media as well as the FeSSIF-V2 were recommended for the postprandial ones in the upper
small intestine. These updated biorelevant media showed the better agreement with the in
vivo bioavailability of glibenclamide in comparison to the results obtained from FaSSIF and
FeSSIF (Janssen et al., 2008).
According to simulated stomach media, Vertzoni et al. (2005) suggested the use of FaSSGF
as an in vitro dissolution medium in the fasted stomach for weakly basic compounds. The
medium exhibited the better reflection of the in vivo release of GR253035X, a weak base,
than the profiles obtained from SGF with sodium lauryl sulphate (SGFSLS) or TritonX100
(SGFTriton). With regard to the study of food effects on the drug released in the stomach,

Chapter 1. Introduction ________________________________________________________________________________
20
FeSSGF or the combination of UHT-milk and aqueous buffer solutions in different ratios,
depending on the digestion phases, were recommended (Jantratid et al., 2008).
Prior to the introduction of FaSSIF and FeSSIF, several in vitro studies of food effects were
summarized in a review article by Khan (1996) as shown in Table 4. Those conditions
included pre-treating the dosage forms with peanut oil (Maturu et al., 1986; El-Arini et al.,
1989), the use of milk as dissolution medium (Macheras et al., 1989) and the addition of oil
in dissolution media (El-Arini et al., 1990).
Table 4 In vitro studies of food-induced conditions1
Drug/dosage form In vitro conditions Results Reference Theophylline • matrix tablet • beads filled in
capsule
Pre-treatment of the dosage form (or content) in peanut oil for 2 h prior to standard dissolution testing
The in vitro dissolution data correlated well with in vivo percent dissolved in humans after high fat breakfast
Maturu et al. 1986
Propranolol HCl • capsule
Pre-treatment of the dosage form content in peanut oil for 1 h at 37°C prior to standard dissolution testing
A significant decrease in dissolution rate of the drug was observed as a result of pre-treatment of the dosage form with peanut oil when compared with untreated dosage form
E1-Arini et al. 1989
Theophylline • matrix tablet • capsule
Milk with various levels of fat content (0.1%, 2.0%, 5.0% and 7.5%) was used as dissolution medium
A direct relationship was established between fat contents of milk and dissolution data with a good correlation between data obtained using 7.5% fat content milk and in vivo data obtained in humans after a high fat meal
Macheras et al. 1989
Theophylline • beads
embedded in matrix tablet
• beads filled in capsule
A dialysis cell containing the dosage form in a small volume of fluid is immersed in the dissolution medium in a dissolution vessel. The physiological conditions are simulated by adjusting the fluid of the dialysis cell
The method allowed testing of the extended release dosage forms under various food induced conditions
El-Arini et al. 1990
1 modified from Khan (1996)
The study from Al-Behaisi et al. (2002) reported the use of milk, sunflower oil and sucrose
as the favourable dietary components for in vitro dissolution studies under fed conditions
(Table 5). Film-coated IR tablets of deramciclane, an acid-labile drug, were used in the
study of food effects. The dissolution testing was performed with USP paddle method, at
100 rpm in 500 ml of the test media. The comparable tendencies of in vitro dissolution and
in vivo studies in healthy male volunteers for cumulative AUC (AUCcum) under fasted and
fed states were demonstrated. Moreover, the ratio of AUCcum, fed/AUCcum, fasting showed the

Chapter 1. Introduction ________________________________________________________________________________
21
linear relationship between the in vitro dissolution time and the logarithmic in vivo blood
sampling time (Fig. 2). It was also speculated that an increased pH under fed conditions
improved the bioavailability by reducing the drug degradation.
Table 5 Compositions of artificial gastric juice and the dietary components added during the in
vitro dissolution testing for simulated fasted and fed states1
Dietary components Simulated fasting state: artificial gastric juice pH 1.2
Simulated fed state: dietary components added to artificial gastric juice, end-result pH 2.98
1 N HCl 94 ml 94 ml NaCl 0.35 g 0.35 g Glycine 0.5 g 0.5 g Whole-milk powder - 30 g 1% methylcellulose - 450 ml Sunflower oil - 50 ml Sucrose - 65.5 g H2O add 1 L add 1 L 1 modified from Al-Behaisi et al. (2002)
Fig. 2 Correlation between logarithmic in vivo blood sampling time and in vitro dissolution time
assigned to equal AUCcum ratio (AUCcum, fed/AUCcum, fasting). Modified from Al-Behaisi et al.
(2002).
In vitro study of food effect on the bioavailability of rifampicin was carried out in the
different concentration of sunflower oil (10-35%) in SGF without pepsin (Panchagnula et
al., 2003). The USP Apparatus II at 30 and 50 rpm were used to simulate hydrodynamic
stress under fed conditions, while the 75 rpm was used for fasted conditions. It was found
0.1
1
10
100
0 0.25 0.5 0.75
in vitro dissolution time, h
in v
ivo
bloo
d sa
mpl
ing
time,
h
0.63
0.97
1.06
1.11
1.24
1.30
Chapter 1. Introduction ________________________________________________________________________________
22
that, neither agitation intensities nor sunflower oil added influenced the release of the
formulation that releases 90-100% rifampicin within 10 min in fasted state. The drug
released from the slower released formulation (75-100% within 45 min), however,
decreased with decreasing agitation rate. The profiles also varied with the addition of
sunflower oil, though without a clear trend. In vivo data supported the effect of co-
administered food on the bioavailability of rifampicin by the reduced Cmax and the increased
tmax, while AUC was unaffected. This was due to the decreased dissolution rate and the
increased disintegration of the formulation when food was presented.
1.3.3 Drug release in the presence of alcohol
Co-administered alcoholic beverages with drugs may severely cause adverse consequence,
particularly with formulations containing a narrow therapeutic index drugs or strong
opioids. An unintended overdose of hydromorphone from once-daily ER pellets-containing-
capsule (Palladone™) was reported as alcohol-drug interaction, leading to the voluntarily
withdrawal of the product by its manufacturer from the US market (FDA, 2005a). The
pharmacokinetic studies were subsequently performed in healthy subjects receiving 240 ml
of high concentration of ethanol (40% v/v), equivalent to the one-third of a bottle of spirit,
taken over five min immediately before Palladone™ dosing. The results revealed the fatally
rise in hydromorphone plasma concentration with the average sixfold increase in Cmax
(maximum of 16-fold in one subject) and the 1.3-fold increase in AUC, in comparison to
when taken with water. In vitro dissolution result of this product was reported by Walden et
al. (2007), which correlated well with the in vivo data. Consequently, a regulatory decision
framework has been develop in order to assess, thus minimise, the risk of ethanol-induced
dose dumping for oral modified release formulations (Meyer and Hussain, 2005). Suitable
in vitro tests are encouraged for new drug applications and currently marketed modified
release products, since in vivo pharmacokinetic studies may post a risk to subjects.
Recently, draft guidance for industry for several ER preparations has been issued with
regard to additional dissolution testing in the presence of 5-40% ethanol in HCl for 2 h
(FDA, 2007).
Attempts were made on designing in vitro conditions to evaluate the possible effects of
concomitant alcoholic beverages on the release of various drug products (Table 6). Fadda et

Chapter 1. Introduction ________________________________________________________________________________
23
al. (2008) studied the release of mesalazine from three marketed ER products, which aim for
colonic targeting. 0.1 M HCl (pH 1.2) containing up to 40% v/v ethanol was used to
simulate the gastric environment on ingestion of alcohol. This highest concentration of
ethanol was expected to represent the most extreme conditions likely to be encountered in
vivo (Walden et al., 2007). After pre-determined HCl/ethanol exposure times, successive pH
transitions to simulate different regions of the GI tract were then performed. Dissolution
profiles of Asacol® exhibited the highest variability (Fig. 3), while Pentasa® showed the
most consistency when their releases were compared between different scenarios. It was
found that, 40% ethanol led to the complete dose dumping of Pentasa® in most scenarios.
The authors suggested that, the effect of alcohol on the release of drugs in vivo will be
highly dependent on the kinetics of alcohol absorption and emptying, as the diverse release
patterns for the same preparation were observed in different scenarios. The solubility of
mesalazine was found to be independent of ethanol concentration, therefore, a complex
interplay between the formulation, the release medium and the duration to its exposure was
proposed. Moreover, no clear tendency, either as the form or extent, of alteration induced by
ethanol was observed. This finding is consistent with those by Walden et al. (2007) where
they found no clear correlation between the ethanol solubility of the ingredients and the
ethanol susceptibility of several opioid formulations. Similarly, they suggested the
occurrence of complex interactions between active and inactive ingredients and dosage form
design. The authors claimed no risk of ethanol-induced dose dumping on various ER
formulations of opiates employing different release technologies (Table 6), by utilising the
in vitro dissolution tests over 2 h in standard aqueous dissolution media containing 4-40%
v/v ethanol.
A 50% aspirin-loaded HPMC matrix tablet showed no dose dumping with regard to the
effect of ethanol (Roberts et al., 2007). The kinetics and mechanism of aspirin released
were, however, affected by the exposure to 40% v/v ethanol. The release of aspirin
increased proportionally to the concentration of ethanol, because of the improved drug
solubility. The polymer-alcohol interaction led to the initial fast release observed in the first
30 min as the polymer hydration rate was suppressed by the high concentration of ethanol.
Similarly, Levina et al. (2007) reported no dose dumping of the HPMC matrix tablet
containing felodipine, gliclazide or metformin hydrochloride when exposed to ethanol
solutions. The release of metformin hydrochloride was slightly decreased in comparison to

Chapter 1. Introduction ________________________________________________________________________________
24
the release in water, after exposed to the 40% v/v ethanol aqueous solution for 1 h. This was
due to the reduced drug solubility (295 mg/ml in 40% v/v ethanol) compared with that in
water (450 mg/ml). In contrast to the result obtained by Roberts et al. (2007), the three
HPMC grades studied by Levina et al. (2007) exhibited consistent swelling and gel
formation when exposed to hydro-alcoholic media. Koziara et al. (2006) also reported no
dose dumping from OROS® system subjected to ethanol concentration up to 60%, although
the drug released increased slightly. The permeability, the elasticity and the swelling of
cellulose acetate membranes used for the osmotic system increased with increasing ethanol
concentration.

Fig. 3 Dissolution of Asacol tablets in (a) 0.1 M HCl with ethanol for 2 h followed by pH 6.8 phosphate buffer for 2 h then pH 7.4 phosphate buffer, (b)
0.1 M HCl with ethanol for 30 min followed by 0.1 M HCl with no ethanol for 90 min followed by pH 6.8 phosphate buffer for 2 h then by pH 7.4
phosphate buffer, (c) 0.1 M HCl with ethanol for 30 min followed by pH 6.8 phosphate buffer for 2 h then pH 7.4 phosphate buffer and (d) 0.1 M
HCl with ethanol for 30 min followed by pH 6.8 phosphate buffer for 2 h (first 15 min containing ethanol equivalent to half the concentration in
acid) followed by pH 7.4 phosphate buffer. Dissolution profiles presented as mean (±S.D.) (Fadda et al., 2008).
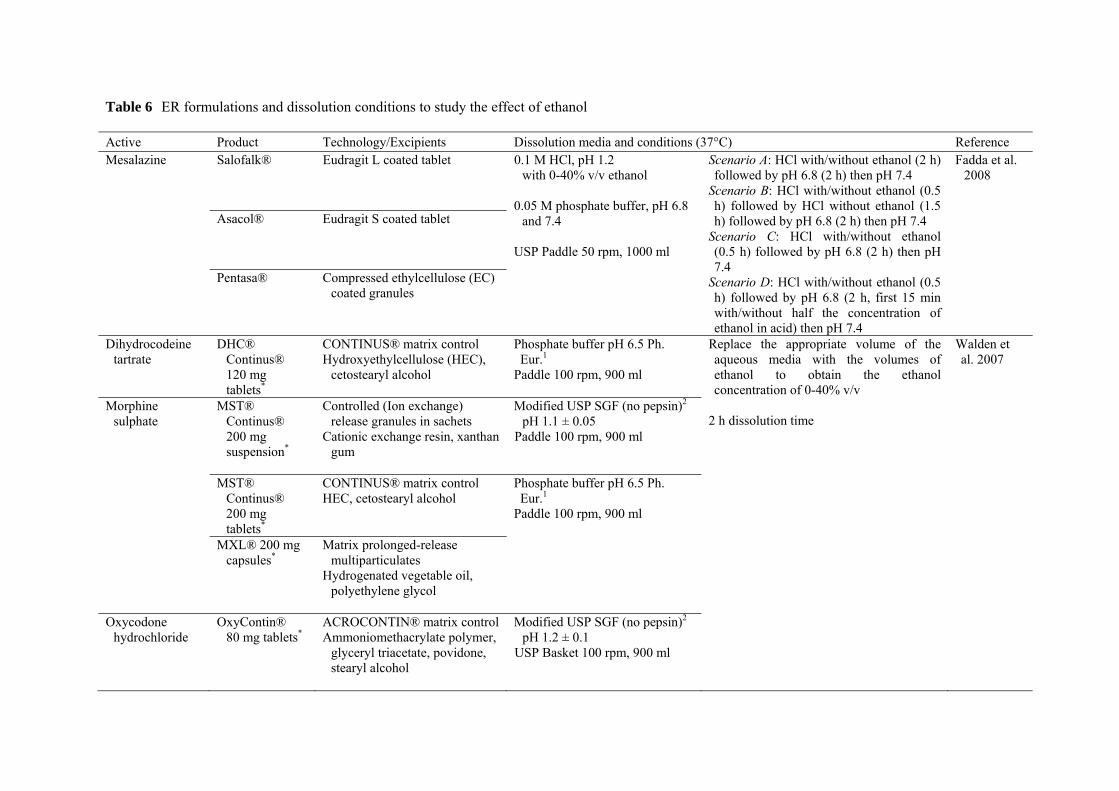
Table 6 ER formulations and dissolution conditions to study the effect of ethanol
Active Product Technology/Excipients Dissolution media and conditions (37°C) Reference Mesalazine Salofalk® Eudragit L coated tablet 0.1 M HCl, pH 1.2
with 0-40% v/v ethanol 0.05 M phosphate buffer, pH 6.8
and 7.4 USP Paddle 50 rpm, 1000 ml
Scenario A: HCl with/without ethanol (2 h) followed by pH 6.8 (2 h) then pH 7.4
Scenario B: HCl with/without ethanol (0.5 h) followed by HCl without ethanol (1.5 h) followed by pH 6.8 (2 h) then pH 7.4
Scenario C: HCl with/without ethanol (0.5 h) followed by pH 6.8 (2 h) then pH 7.4
Scenario D: HCl with/without ethanol (0.5 h) followed by pH 6.8 (2 h, first 15 min with/without half the concentration of ethanol in acid) then pH 7.4
Fadda et al. 2008
Asacol® Eudragit S coated tablet
Pentasa® Compressed ethylcellulose (EC) coated granules
Dihydrocodeine tartrate
DHC® Continus® 120 mg tablets*
CONTINUS® matrix control Hydroxyethylcellulose (HEC),
cetostearyl alcohol
Phosphate buffer pH 6.5 Ph. Eur.1
Paddle 100 rpm, 900 ml
Replace the appropriate volume of the aqueous media with the volumes of ethanol to obtain the ethanol concentration of 0-40% v/v
2 h dissolution time
Walden et al. 2007
Morphine sulphate
MST® Continus® 200 mg suspension*
Controlled (Ion exchange) release granules in sachets
Cationic exchange resin, xanthan gum
Modified USP SGF (no pepsin)2 pH 1.1 ± 0.05
Paddle 100 rpm, 900 ml
MST® Continus® 200 mg tablets*
CONTINUS® matrix control HEC, cetostearyl alcohol
Phosphate buffer pH 6.5 Ph. Eur.1
Paddle 100 rpm, 900 ml
MXL® 200 mg capsules*
Matrix prolonged-release multiparticulates
Hydrogenated vegetable oil, polyethylene glycol
Oxycodone hydrochloride
OxyContin® 80 mg tablets*
ACROCONTIN® matrix control Ammoniomethacrylate polymer,
glyceryl triacetate, povidone, stearyl alcohol
Modified USP SGF (no pepsin)2 pH 1.2 ± 0.1
USP Basket 100 rpm, 900 ml
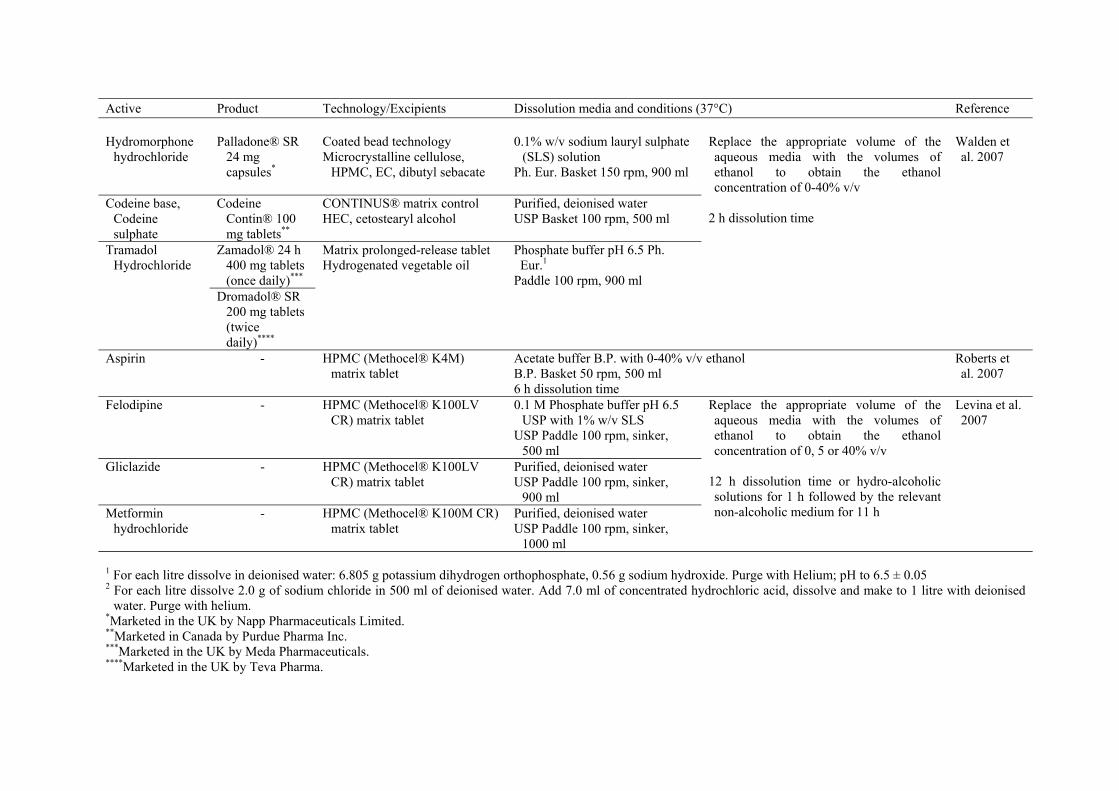
Active Product Technology/Excipients Dissolution media and conditions (37°C) Reference Hydromorphone
hydrochloride
Palladone® SR
24 mg capsules*
Coated bead technology Microcrystalline cellulose,
HPMC, EC, dibutyl sebacate
0.1% w/v sodium lauryl sulphate
(SLS) solution Ph. Eur. Basket 150 rpm, 900 ml
Replace the appropriate volume of the aqueous media with the volumes of ethanol to obtain the ethanol concentration of 0-40% v/v
2 h dissolution time
Walden et al. 2007
Codeine base, Codeine sulphate
Codeine Contin® 100 mg tablets**
CONTINUS® matrix control HEC, cetostearyl alcohol
Purified, deionised water USP Basket 100 rpm, 500 ml
Tramadol Hydrochloride
Zamadol® 24 h 400 mg tablets (once daily)***
Matrix prolonged-release tablet Hydrogenated vegetable oil
Phosphate buffer pH 6.5 Ph. Eur.1
Paddle 100 rpm, 900 ml Dromadol® SR
200 mg tablets (twice daily)****
Aspirin - HPMC (Methocel® K4M) matrix tablet
Acetate buffer B.P. with 0-40% v/v ethanol B.P. Basket 50 rpm, 500 ml 6 h dissolution time
Roberts et al. 2007
Felodipine - HPMC (Methocel® K100LV CR) matrix tablet
0.1 M Phosphate buffer pH 6.5 USP with 1% w/v SLS
USP Paddle 100 rpm, sinker, 500 ml
Replace the appropriate volume of the aqueous media with the volumes of ethanol to obtain the ethanol concentration of 0, 5 or 40% v/v
12 h dissolution time or hydro-alcoholic solutions for 1 h followed by the relevant non-alcoholic medium for 11 h
Levina et al. 2007
Gliclazide - HPMC (Methocel® K100LV CR) matrix tablet
Purified, deionised water USP Paddle 100 rpm, sinker,
900 ml Metformin
hydrochloride - HPMC (Methocel® K100M CR)
matrix tablet Purified, deionised water USP Paddle 100 rpm, sinker,
1000 ml
1 For each litre dissolve in deionised water: 6.805 g potassium dihydrogen orthophosphate, 0.56 g sodium hydroxide. Purge with Helium; pH to 6.5 ± 0.05 2 For each litre dissolve 2.0 g of sodium chloride in 500 ml of deionised water. Add 7.0 ml of concentrated hydrochloric acid, dissolve and make to 1 litre with deionised
water. Purge with helium. *Marketed in the UK by Napp Pharmaceuticals Limited. **Marketed in Canada by Purdue Pharma Inc. ***Marketed in the UK by Meda Pharmaceuticals. ****Marketed in the UK by Teva Pharma.
Chapter 1. Introduction ________________________________________________________________________________
28
1.3.4 Dissolution conditions for ER dosage forms
Standard conditions for dissolution testing (apparatuses, media compositions and volume,
agitation rates, and temperatures) for various ER formulations are readily available in the
official monographs. Often, those compendial dissolution tests are ‘too general’ because the
diversity of technologies in formulation designs are utilized; thus, there are variety of
product characteristics that dictate the test parameters (Jorgensen and Bhagwat, 1998).
Several dissolution studies of ER products and various methods recommended by the FDA,
see for example FDA (2005b), suggested the modifications of the existing dissolution tests
in order to achieve a more reproducible and more realistic situation in vivo (Grundy et al.,
1997; Dürig and Fassihi, 2000; Morita et al., 2003; Mu et al., 2003; Missaghi and Fassihi,
2005). The major considerations of the modifications include (i) dissolution testing
equipment and (ii) physiological conditions, such as gastric emptying/intestinal transit time,
variable pH, mechanical destructive forces, metabolism and food effects.
1.3.4.1 Dissolution testing for water-soluble matrix system
In spite of its popularity, the physicochemical characteristics of water-soluble matrix tablets,
such as the formation of a highly viscous mass when fully hydrated, are subject to the
difficulty of using compendial dissolution test methods. The large variation of drug released
from each matrix tablet is caused by the unpredictable sticking and/or floating of the tablet
to different positions within a dissolution vessel (Dürig and Fassihi, 2000). This random
stickiness occurred either immediately at the bottom of the vessel or following a certain
time of floating due to the reduction in tablet density once released. The varied release
profiles of such tablets was attributed to the different limitation of the tablet surface that
exposed to the release medium as well as an inconsistent hydrodynamic conditions which
rely on the position of the sticking tablets. Moreover, the sampling process could be
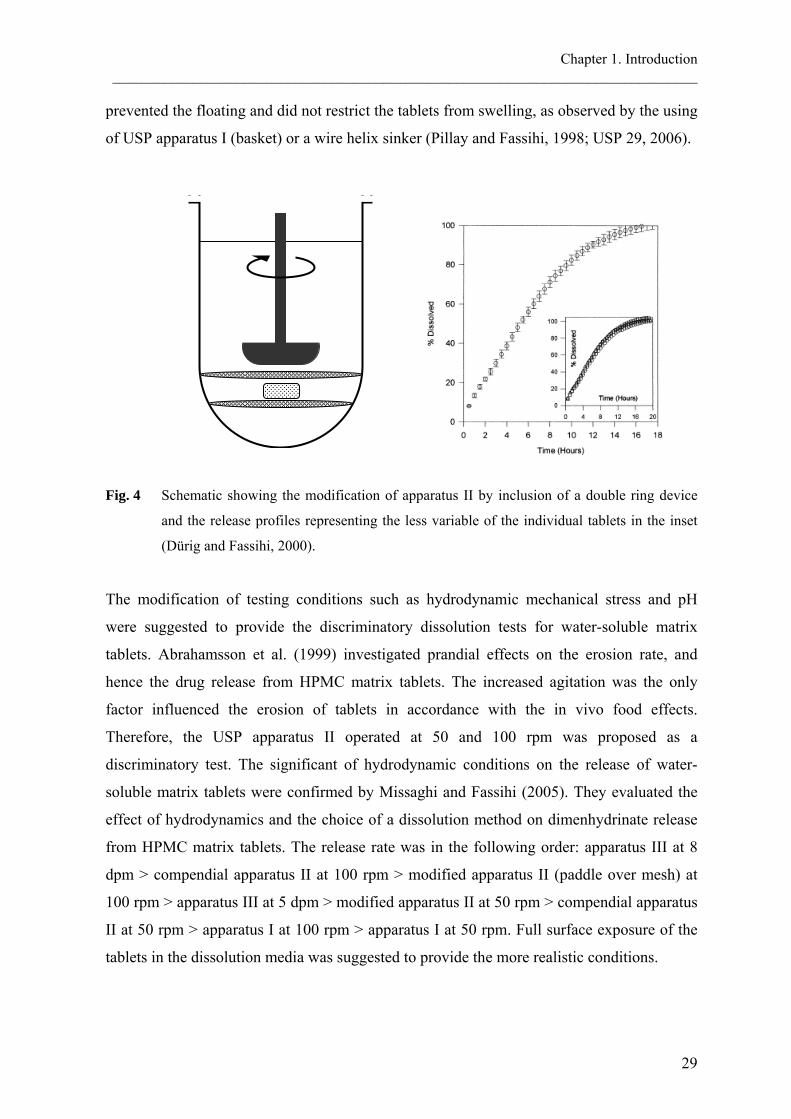
obstructed once the tablet stuck on the sampling filter. To overcome these difficulties, Dürig
and Fassihi (2000) suggested the addition of a double ring mesh to the dissolution vessel of
the USP apparatus II (Fig. 4). This setting was able to produce a more reliable release. The
double mesh device created a space, to which the tablet will be placed. This method allowed
full tablet surface exposure as expected to be the behavior of the tablets in vivo. It also
Chapter 1. Introduction ________________________________________________________________________________
29
prevented the floating and did not restrict the tablets from swelling, as observed by the using
of USP apparatus I (basket) or a wire helix sinker (Pillay and Fassihi, 1998; USP 29, 2006).
Fig. 4 Schematic showing the modification of apparatus II by inclusion of a double ring device
and the release profiles representing the less variable of the individual tablets in the inset
(Dürig and Fassihi, 2000).
The modification of testing conditions such as hydrodynamic mechanical stress and pH
were suggested to provide the discriminatory dissolution tests for water-soluble matrix
tablets. Abrahamsson et al. (1999) investigated prandial effects on the erosion rate, and
hence the drug release from HPMC matrix tablets. The increased agitation was the only
factor influenced the erosion of tablets in accordance with the in vivo food effects.
Therefore, the USP apparatus II operated at 50 and 100 rpm was proposed as a
discriminatory test. The significant of hydrodynamic conditions on the release of water-
soluble matrix tablets were confirmed by Missaghi and Fassihi (2005). They evaluated the
effect of hydrodynamics and the choice of a dissolution method on dimenhydrinate release
from HPMC matrix tablets. The release rate was in the following order: apparatus III at 8
dpm > compendial apparatus II at 100 rpm > modified apparatus II (paddle over mesh) at
100 rpm > apparatus III at 5 dpm > modified apparatus II at 50 rpm > compendial apparatus
II at 50 rpm > apparatus I at 100 rpm > apparatus I at 50 rpm. Full surface exposure of the
tablets in the dissolution media was suggested to provide the more realistic conditions.
Chapter 1. Introduction ________________________________________________________________________________
30
pH dependence of drug release from matrix tablets has been reported in the literature. The
release of 6-N-Cyclohexyl-2′-O-methyladenosine sesquihydrate, a weak base with a pKa of
3.01, was pH-dependent when formulated into a HPMC matrix tablet. This pH dependence
of the drug release was not found when the drug was formulated into an osmotic tablet or
EC-coated pellets (Royce et al., 2004). The effect of pH on the release of Nifedipine from a
water-soluble matrix tablet was also reported (Schug et al., 2002a). While the drug release
from the osmotic tablet (Adalat® OROS) was unaffected by the change of pH, the release
from the matrix tablet was in the following order: pH 6.8 > pH 8.0 > pH 4.5 > pH 1.0. As a
result, a discriminatory dissolution test for a water-soluble matrix tablet should include the
effect of pH on the drug release.
1.3.4.2 Dissolution testing for osmotic system
The drug release from the osmotic system usually followed zero-order fashion. As reported
by several researchers, the system was robust to environmental conditions. Hence, there is
no specific dissolution apparatus or testing conditions recommended. As from experimental
experience, however, the release of drugs from the osmotic tablets was in some cases
inconsistent. This was due to the opening of the laser drill was blocked by the vessel wall.
The inconsistency of the drug release was more pronounced when the drug was poorly
soluble and the agitation rate was slow, since the drug was release as a suspension and
accumulated at the delivery orifice. This retarded apparent release was the slower drug
dissolution once released, and not the slower drug release (Wen and Park, 2010). Therefore,
the appropriate dissolution media for the osmotic system should provide sink condition for
the drug. The dissolution should also be rapid and complete, so the dissolution rate can be a
surrogate for drug release.
1.3.4.3 Dissolution testing for multiparticulate pellet system
USP apparatus III (reciprocating cylinder) is considered as the first line apparatus in product
development of controlled release products and especially the pellets (Joshi et al., 2008).
The advantage of the system is the ability to mimic the changes of media, including pH
gradient, buffer concentration, ionic strengths and mechanical forces of the GI tract, as it
allows the dissolution tube to move between the successive rows of vessels containing

Chapter 1. Introduction ________________________________________________________________________________
31
different media. The apparatus also offers sound hydrodynamic conditions, compared to that
of the USP apparatus I or II. Jantratid et al. (2009) reported the successful of predicting food
effect on the diclofenac release from modified release pellets by the application of the USP
apparatus III and biorelevant dissolution media. Other studies have shown that the apparatus
III was an attractive system for the dissolution testing of multiparticulate pellet system
(Joshi et al., 2008; Chevalier et al., 2009).
1.4 OBJECTIVES
The purposes of this work were:
1.4.1 to examine the performance of commercially available bioequivalent products in
vitro by performing release studies in various dissolution conditions and to
evaluate the discriminating ability of those test conditions. Compendial dissolution
methods with minor modification that mimic conditions in vivo were used to
evaluate the performance of two pentoxifylline BE products and three verapamil
hydrochloride bioequivalent products.
1.4.2 to investigate the effect of sodium dodecyl sulphate on the releases of drugs from
different ER solid oral dosage forms. The release of poorly soluble drug and the
drug formulated with ionic excipients are also explored. The influence of sodium
dodecyl sulphate will be discussed mainly on formulation aspects.
1.4.3 to understand the relationships between the properties of drugs and their available
ER dosage forms and to establish a guide for ER technology selection by the
application of principal component analysis. The classification of single- vs.
multiple-unit dosage form and the carrier systems of matrix tablets were examined.
Significant properties distinguishing the dosage forms and matrix types were
investigated


2. MATERIALS AND METHODS

Chapter 2. Materials and Methods ________________________________________________________________________________
34
2.1 MATERIALS
2.1.1 Drugs
Verapamil hydrochloride (HCl) (Knoll AG, Ludwigshafen, Germany), diltiazem HCl,
carbamazepine (CBZ) (BASF AG, Ludwigshafen, Germany), pentoxifylline (Sigma-Aldrich
Chemie GmbH, Steinheim, Germany).
2.1.2 Drug products
Thirteen commercially available extended release (ER) solid oral dosage form products
were purchased from retail drugstores in Germany and the USA. Their compositions (Table
7), the pharmacokinetic data of bioequivalent products (pentoxifylline and verapamil HCl,
Table 8) and the physicochemical properties of the drugs (Table 9) were collected from
literature.
2.1.3 Buffer components
Hydrochloric acid (Carl Roth GmbH, Karlsruhe, Germany), sodium chloride (Carl Roth
GmbH, Karlsruhe, Germany), potassium dihydrogen phosphate (Carl Roth GmbH,
Karlsruhe, Germany), sodium hydroxide (Carl Roth GmbH, Karlsruhe, Germany), sodium
acetate trihydrate (Carl Roth GmbH, Karlsruhe, Germany), glacial acetic acid (Carl Roth
GmbH, Karlsruhe, Germany), sodium dihydrogen phosphate monohydrate (Merck KGaA,
Darmstadt, Germany) and sodium dodecyl sulphate (SDS) (Carl Roth GmbH, Karlsruhe,
Germany), polyoxyethylene sorbitan monooleate (Tween 80) (Carl Roth GmbH, Karlsruhe,
Germany) and sorbitan monooleate (Span 80) (Merck Schuchardt OHG, Hohenbrunn,
Germany). All chemicals and reagents were of analytical grade and were used as received.

Table 7 Composition of ER formulations (extended release polymers in bold)
Active Type Name Company Excipients Verapamil HCl 120 mg
Matrix tablet Isoptin Abbott Sodium alginate, HPMC, Microcrystalline Cellulose (MCC), Povidone K30, Mg stearate, [Film coating: HPMC, Montanglycol wax, Macrogol 400, Macrogol 6000, Talc]
Coated pellets VeraHexal Hexal Ethylcellulose, Eudragit® L100-55, Sucrose, Corn starch, Mg stearate, Povidone K30, Talc, Triethyl citrate, TiO2
Coated pellets Verelan Elan Drug Shellac, Fumaric acid, Sucrose, Povidone, Talc, Titatium dioxide (TiO2), Methylparaben, Propylparaben, Silicon dioxide, Sodium dodecyl sulphate (SDS)
Osmotic tablet Covera-HS1 G.D. Searle LLC
Cellulose acetate, HEC, HPMC, Hydroxypropyl cellulose, Butylated hydroxytoluene, Lactose, Mg stearate, Polyethylene glycol (PEG), Polyethylene oxide, Polysorbate 80, Povidone, Sodium chloride, TiO2
Diltiazem HCl 180 mg
Matrix tablet Dilzem retard
Pfizer HEC, HPMC, Lactose monohydrate, Macrogol 6000, Mg stearate, Hydrogenated castor oil, Stearic acid, Simeticon, Talc, TiO2
Coated pellets Diltiazem-ratiopharm
Ratiopharm Ethylcellulose, Sucrose, Corn starch, Cetyl alcohol, SDS, Povidone K30, Talc, Dibutyl decandioat, TiO2
Coated pellets Dilzem uno Pfizer Eudragit® RS and RL, Sucrose, Corn starch, Fumaric acid, Povidone K30, Propylene glycol, Talc, TiO2
Pentoxifylline 400 mg
Matrix tablet Trental Sanofi Aventis
HEC 4000 mPa·s, Povidone K25, Macrogol 8000, HPMC 5 mPa·s, Mg stearate, TiO2, Talc
Matrix tablet Rentylin Amdipharm Eudragit® RS and RL, Eudragit® E, Povidone K25, Macrogol 6000, Mg stearate, TiO2 Carbamazepine 200 mg
Matrix tablet Tegretal Novartis Eudragit® NE 30D, Aquacoat ECD (Ethylcellulose, Cetyl alcohol and SDS), Colloidal silicon dioxide, Mg stearate, Talc, MCC, Carboxymethylcellulose sodium [Film coating: HPMC, Macrogolglycerol hydroxystearate, Talc]
Matrix tablet Espa-lepsin Esparma Eudragit® RS, Eudragit® L 100-55, Triacetin, Talc, MCC, Crospovidone, Colloidal silicon dioxide, Mg stearate, Sorbic acid, Sodium hydroxide, SDS, Polysorbate 80
Coated pellets Carbatrol2 Shire Citric acid, Colloidal silicon dioxide, Lactose monohydrate, MCC, PEG, Povidone, SDS, Talc, Triethyl citrate
Osmotic tablet Tegretol-XR Novartis Cellulose acetate, Dextrates, Iron oxide, Mg stearate, Mannitol, PEG, SDS, TiO2 1 180 mg 2 tree types of pellet: 25%-IR, 40%-ER and 35%-enteric coated

Chapter 2. Materials and Methods ________________________________________________________________________________
36
Table 8 Pharmacokinetic parameters of bioequivalent products (a) Pentoxifylline: 600 mg, single dose1 HEC
matrix tablet (Trental) Eudragit RS/RL
matrix tablet (Rentylin) Cmax (µg/ml) 111.8 ± 57.1 116.1 ± 65.7 tmax (h) 2.1 ± 1.1 1.4 ± 0.9 AUC (h-µg/ml) 637.7 ± 282.0 583.0 ± 331.7 (b) Verapamil HCl: 240 mg per day for 5 days1 Sodium alginate/HPMC
matrix tablet (Isoptin) EC/Eudragit L100-55
coated pellets (VeraHexal) Cmax (ng/ml) 191.8 ± 134.2 163.1 ± 63.2 tmax (h) 5.5 ± 2.5 5.1 ± 1.2 AUC (h-ng/ml) 2043.6 ± 1106.3 1943.1 ± 846.1 (c) Verapamil HCl: 240 mg, single dose2 Sodium alginate/HPMC
matrix tablet (Isoptin) Shellac/Fumaric acid
coated pellets (Verelan) Cmax (ng/ml) 171.0 ± 78.2 114.3 ± 33.9 tmax (h) 5.0 ± 2.0 7.3 ± 1.6 AUC (h-ng/ml) 1670.9 ± 909.3 1675.0 ± 518.1 t1/2 (h) 6.2 ± 1.4 9.2 ± 2.1 Peak-to-24 h trough ratio 10.1 ± 4.1 3.8 ± 2.8 1Fachinformation Online Database 2Devane et al. (1990)

Chapter 2. Materials and Methods ________________________________________________________________________________
37
Table 9 Physicochemical properties of drugs Drug Solubility
Verapamil HCl
0
30
60
90
120
150
5 6 7 8 9pH
conc
entr
atio
n, m
g/m
l
pH-solubility profile of verapamil HCl (water, 37 °C), reproduced from Streubel et al. (2000)
Diltiazem HCl
0
100
200
300
400
500
2 4 6 8 10pH
conc
entr
atio
n, m
g/m
l
pH-solubility profile of diltiazem HCl (water, room temperature)
Carbamazepine
0.22 mg/ml (water, 37 °C) 0.51 mg/ml (water, 0.25% SDS, 37 °C)
Pentoxifylline
191 mg/ml (water, 37 °C) (El-Gazayerly, 2003)
CH3
CH3
CH3
CH3
CH3
CH3
NNHO
O
O
O
ClH
O
OS
NO
N
O
ClH
CH3
O
N
O
N
NCH3
NOCH3
N
O NH2

Chapter 2. Materials and Methods ________________________________________________________________________________
38
2.2 EXPERIMENTAL METHODS
2.2.1 Drug solubility determinations
Diltiazem HCl
Solubility measurements of diltiazem HCl were conducted in the pH range from 3.5 to 9.0 at
room temperature (n=2). An excess amount of drug was added to 100 ml deionized water.
The sample was stirred at 500 rpm with magnetic stirrer. After 1 h stirring time at each pH
step (modified with 1 N sodium hydroxide), 5 ml samples were repeatedly taken and
centrifuged (DIGIFUGE GL, Heraeus-Christ GmbH, Osterode) at 4500 rpm for 30 min. The
drug concentration in the supernatant was determined spectrophotometrically at 260 nm and
the final pH value was measured (pH-Meter CG711, Schott-Geräte GmbH, Hofheim,
Germany).
Carbamazepine
An excess amount of drug was added to deionized water containing 0–1% w/v sodium
dodecyl sulphate (n=2). After equilibrium was reached (24 h, horizontal shaking, 37 °C) the
drug concentration in the supernatant was determined spectrophotometrically at 312 nm
(HP8453, Hewlett-Packard, Waldbronn, Germany).
2.2.2 In vitro drug release studies
In vitro drug release was determined using the USP rotating paddle method (900 ml
medium; 10-150 rpm; 37 °C; n=2-3) (VanKel 7010 or VanKel 7025, Varian Inc., NC, USA)
equipped with an online UV-visible spectrophotometer (Cary 50 Tablet, Varian Inc. NC,
USA). At predetermined time intervals, samples were automatically withdrawn and assayed
spectrophotometrically at 278 nm for verapamil HCl, 260 nm for diltiazem HCl, 312 nm for
carbamazepine and 295 nm for pentoxifylline.
The dissolution media were prepared according to the USP XXVI as followed: simulated
gastric fluid without enzyme pH 1.2, simulated intestinal fluid without enzyme pH 6.8,
acetate buffer pH 4.5 and simulated intestinal fluid without enzyme pH 6.8. Osmolality of
the media (Semi-Micro Osmometer K-7400, Knauer GmbH, Berlin, Germany) was adjusted
with sodium chloride. The dissolution media for the lower surface tension of 30-48 mN/m

Chapter 2. Materials and Methods ________________________________________________________________________________
39
(detachable ring method, Digital-Tensiometer K 10 ST, Krüss GmbH, Hamburg, Germany),
which are close to that of the human GI fluid (33 mN/m) (Pedersen et al., 2000; Kalantzi et
al., 2006), were prepared by the addition of 0.25% w/v and 0.50% w/v sodium dodecyl
sulphate, 0.25% w/v Tween 80 or 0.05% w/v Span 80 into sodium phosphate buffer solution
pH 6.8 (one litre contained 6.9 g sodium dihydrogen phosphate monohydrate and 0.89 g
sodium hydroxide). The sodium dodecyl sulphate concentration of 0.25% was according to
the recommendation of the International Pharmaceutical Federation (FIP) guidelines, 1997.
It was also the lowest sodium dodecyl sulphate concentration above the critical micelle
concentration that provided sink condition for carbamazepine products (200 mg).
2.2.3 Comparison of release profiles
Similarity factor (f2) was applied to compare the difference between percent drug released
per unit time for a pair of drug products. It is defined as followed (Moore and Flanner,
1996):
( )⎪⎭
⎪⎬⎫
⎪⎩
⎪⎨⎧
×⎥⎦
⎤⎢⎣
⎡−+=
−
=∑ 10011log50
5.0
1
22
n
ttt TR
nf
where n is the number of dissolution sample times, and Rt and Tt are the mean percent drug
dissolved at each time point t for the reference and test products, respectively. An f2 value
between 50 and 100 suggests the two dissolution profiles are similar (FDA, 1997). A robust
formulation within the scope of this study refers to a product that releases its drug similarly
in various dissolution conditions.
Chapter 2. Materials and Methods ________________________________________________________________________________
40
2.3 THEORETICAL METHODS
Nomenclature
IR Immediate release
ER Extended release
Mwa Molecular weight
LogPa Logarithm of the ratio of the concentrations of the un-ionized
compound between octanol and water
H-bond donorsb Number of the hydrogen bond donor (OH and NH) of a compound
H-bond acceptorsb Number of the hydrogen bond acceptor (N and O) of a compound
PSAb Summation of polar surface area of all polar fragments (A°)
Max dose Maximum dose strength of a product (mg)
Do Dose number
t1/2 IR Elimination half-life of a drug as IR formulation (h)
t1/2 ER Elimination half-life of a drug as ER formulation (h)
t1/2 ratio Ratio of t1/2 ER to t1/2 IR
tmax IR Time to peak plasma concentration of a drug as IR formulation (h)
tmax ER Time to peak plasma concentration of a drug as ER formulation (h)
tmax ratio Ratio of tmax ER to tmax IR
aNCBI (1993) bCalculated through Molinspiration Property Calculation Service (http://www.molinspiration.com) using the JME molecular editor
2.3.1 Data set
145 samples (85 tablets and 60 reservoir-typed multiparticulate pellet systems) of
commercially available ER solid oral dosage form products were include in the
classification of single- vs. multiple-unit dosage forms, while 62 matrix tablets were used in
the classification of matrix carrier systems. The formulation compositions and the drug
properties were retrospectively collected from readily available literature and various
databases. The physicochemical, biopharmaceutical and pharmacokinetic properties
included in the classification of dosage forms and the matrix carrier systems are: Mw, pKa,

Chapter 2. Materials and Methods ________________________________________________________________________________
41
LogP, H-bond donors, H-bond acceptors, PSA (°A), Solubility (mg/ml), Max dose (mg),
Dose number (Do), t1/2 IR (h), t1/2 ER (h), t1/2 ratio, tmax IR (h), tmax ER (h) and tmax ratio
2.3.2 Calculation of dose number
The dimensionless dose number (Do) is the ratio of drug concentration in the administered
volume (250 ml) to the saturation solubility of the drug in water (Oh et al., 1993). Eq. 1 was
used to calculate the Do:
(mg/ml)solubility50mldose(mg)/2Do =
(Eq. 1)
A drug with Do less than or equal to one is defined as a highly soluble drug.
2.3.3 Statistical analysis
To ensure the normal distribution of input data, square root transformation or logarithmic
transformation was applied to the variables (i.e. drug properties) which have non-normal
distributed values. A standard score (Z-score) was then calculated for each (transformed)
variable by Eq. 2:
σμ−
=xz
(Eq. 2)
where x is a raw score to be standardized, μ is the mean of the population and σ is the
standard deviation of the population. This standardization was performed so that each
variable was mean-centered with a standard deviation of one, hence contributed equally to
the analysis regardless of their respective values. The Z-scores of all variables were used as
input data for PCA, which was carried out using JMP® 8.0 (SAS Institute Inc., Cary, NC).


3. RESULTS AND DISCUSSION

Chapter 3. Results and Discussion ________________________________________________________________________________
44
3.1 In vitro performance and dissolution robustness of bioequivalent
extended release solid oral dosage forms
3.1.1 Introduction
Bioequivalence (BE) is defined by the Food and Drug Administration (FDA) (2003) as “the
absence of a significant difference in the rate and extent to which the active ingredient or
active moiety in pharmaceutical equivalents or pharmaceutical alternatives becomes
available at the site of drug action when administered at the same molar dose under similar
conditions in an appropriately designed study.” Under certain circumstances indicated in the
regulatory guidance (FDA, 2003), an in vitro approach, i.e. dissolution test, can replace in
vivo studies for BE assessment.
The selection of appropriate dissolution media, apparatus and test parameters which reflect
in vivo drug release is challenging (Uppoor, 2001; Gu et al., 2004; Royce et al., 2004). The
ultimate goal of the dissolution test is to predict the in vivo performance of products from in
vitro test by a proper in vitro/in vivo correlation (IVIVC) (Emami, 2006). The tests may not
be pharmacopeial standard, however, they should be sensitive, reliable and discriminatory
with regard to the in vivo drug released characteristics (Qureshi, 2006; Azarmi et al., 2007).
Physiological conditions vary considerably along the gastrointestinal (GI) tract. Various
factors within an individual as well as the influence of co-administered food significantly
influence the GI conditions (Dressman et al., 1998). Those aspects, among other things,
include the changes of pH, osmolality, agitation and mechanical destructive forces, and
surface tension. The variation of these parameters can be critical for the performance of
extended release (ER) systems, given that the dosage forms are designed to remain in the GI
tract over a longer period and transit through various conditions. Therefore, a robust ER
formulation which demonstrates a reliable performance over a wide range of the GI
conditions is highly desirable.
Efforts have been made to simulate biorelevant dissolution media (Galia et al., 1998; Al-
Behaisi et al., 2002; Sunesen et al., 2005; Jantratid et al., 2008). Although, they were used
successfully to establish IVIVC (Nicolaides et al., 1999; Dressman and Reppas, 2000; Wei

Chapter 3. Results and Discussion ________________________________________________________________________________
45
and Löbenberg, 2006), the application of these media is less likely to be a standard practice
because they are expensive and less stable. Since the compositions of the biorelevant media
are complex, it is difficult to understand the influences of an individual factor on dosage
form performance. The present study simulated various dissolution conditions, which ER
dosage forms would encounter in vivo. The pharmacopeial standard buffer solutions were
properly adjusted to meet those conditions.
The objective of this study was to examine the in vitro release patterns of BE products of
pentoxifylline and verapamil hydrochloride, which are commercially available as ER
formulations. There release profiles were expected to be similar once tested in
discriminatory dissolution conditions. Factors affecting the release were also investigated.
3.1.2 Results and discussion
Upon contact with release media, the dissolution characteristics of each drug product vary
from one to the other. This variation depends on several factors such as the physicochemical
properties of drugs (e.g. solubility), type of dosage forms/technologies, formulation
compositions as well as test conditions. Discriminatory dissolution test should be used to
evaluate the drug release as it represents the product performance in vivo. Compendial
dissolution methods with minor modification that mimic conditions in vivo were used to
evaluate the performance of two drugs, pentoxifylline (Trental and Rentylin) and verapamil
HCl (Isoptin, VeraHexal and Verelan).
3.1.2.1 Pentoxifylline
In vitro performance of bioequivalent pentoxifylline products
The release of pentoxifylline (Fig. 5-7) and the characteristic of the tablets (Fig. 8) of water-
soluble, hydroxyethyl cellulose (HEC) (Trental) and water-insoluble, poly(ethyl acrylate,
methyl methacrylate) trimethylammonioethyl methacrylate chloride (Eudragit RS/RL)
(Rentylin) matrix formers are presented. After 24 h release, the remaining of the HEC
matrix tablet was a small gel mass (Fig. 8a), while the Eudragit RS/RL matrix was intact but
soft and fell apart when touched (Fig. 8b).

Chapter 3. Results and Discussion ________________________________________________________________________________
46
0
25
50
75
100
0 6 12 18 24time, h
drug
rele
ased
, %
0
25
50
75
100
0 6 12 18 24time, h
drug
rele
ased
, %
0
25
50
75
100
0 6 12 18 24time, h
drug
rele
ased
, %
Fig. 5 Pentoxifylline release from two bioequivalent products as a function of pH: (■) HEC
tablets (Trental) and (□) Eudragit RS/RL tablets (Rentylin).
pH 1.2
(b)
pH 4.5
pH 6.8
(c)
(a)

Chapter 3. Results and Discussion ________________________________________________________________________________
47
0
25
50
75
100
0 6 12 18 24time, h
drug
rele
ased
, %
0
25
50
75
100
0 6 12 18 24time, h
drug
rele
ased
, %
Fig. 6 Pentoxifylline release from two bioequivalent products as a function of osmolality: (■)
HEC tablets (Trental) and (□) Eudragit RS/RL tablets (Rentylin).
100 mOsm/kg
390 mOsm/kg
(a)
(b)
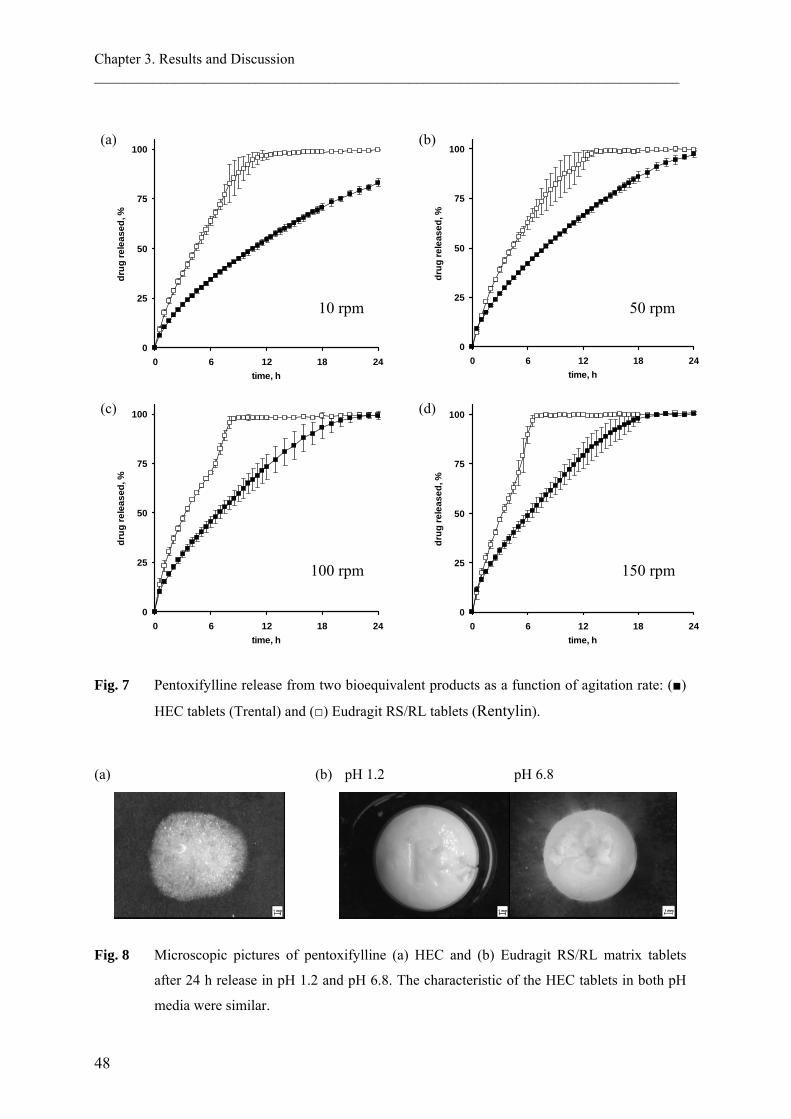
Chapter 3. Results and Discussion ________________________________________________________________________________
48
0
25
50
75
100
0 6 12 18 24time, h
drug
rele
ased
, %
0
25
50
75
100
0 6 12 18 24time, h
drug
rele
ased
, %
0
25
50
75
100
0 6 12 18 24time, h
drug
rele
ased
, %
Fig. 7 Pentoxifylline release from two bioequivalent products as a function of agitation rate: (■)
HEC tablets (Trental) and (□) Eudragit RS/RL tablets (Rentylin).
(a) (b) pH 1.2 pH 6.8
Fig. 8 Microscopic pictures of pentoxifylline (a) HEC and (b) Eudragit RS/RL matrix tablets
after 24 h release in pH 1.2 and pH 6.8. The characteristic of the HEC tablets in both pH
media were similar.
0
25
50
75
100
0 6 12 18 24time, h
drug
rele
ased
, %
10 rpm
100 rpm
(a)
(c)
(b)
50 rpm
(d)
150 rpm

Chapter 3. Results and Discussion ________________________________________________________________________________
49
Pentoxifylline release from the HEC matrix tablet was significantly slower (f2 < 50, Table
10) under all test conditions when compared to Eudragit RS/RL tablets (Fig. 5-7). The most
comparable profiles, although f2 is 48.6 (Table 10), was seen when the osmolality of the
dissolution medium was 390 mOsm/kg (Fig. 6b). Both products had extended dissolution
profiles with 50% release times in pH 6.8 (t50%) of approximately 7 h and 3 h for the HEC-
and the Eudragit RS/RL matrix tablets, respectively. The extended in vitro profile was
confirmed in vivo where the HEC matrix had the longer tmax of 2.1 h compared with 1.4 h
for the Eudragit RS/RL one (Table 8a). It could be assumed from their tmax values that the
release from both tablets in vivo was much faster than those in vitro, particularly in the case
of the less mechanically stable HEC matrix. This rapid release could be caused by the
stronger mechanical destructive force of the GI tract, thereby accelerating the drug release.
Table 10 Similarity factor (f2) calculated from mean dissolution data of BE pentoxifylline matrix
tablets in various dissolution conditions
Dissolution condition f2 value HEC vs. Eudragit RS/RL matrix tablets
pH 1.2 36.0 pH 4.5 19.6 pH 6.8 41.0 100 mOsm/kg 33.0 390 mOsm/kg 48.6 10 rpm 28.5 50 rpm 35.5 100 rpm 33.0 150 rpm 33.8
Robustness of pentoxifylline ER products
The drug release from the HEC matrix tablet was robust to changes in pH and osmolality,
but varied with agitation rate (Fig. 9). However, only the release at 10 rpm was considered
different from the others (f2 = 48.8, 42.7 and 37.4: at 10 rpm vs. 50, 100 and 150 rpm,
respectively). The f2 values of all other comparison pairs ranged between 50 and 100 (Table
11a).

Chapter 3. Results and Discussion ________________________________________________________________________________
50
Although a pH-independent drug release is expected from the Eudragit RS/RL matrix tablet,
Fig. 9 (top) shows the fastest release of pentoxifylline in pH 4.5, followed by release in pH
1.2 and pH 6.8; however, the release in the latter two pH media were similar (f2 = 65.0,
Table 11b). This variation was caused by the effect of anionic buffer species, which have
different selectivity coefficient (chloride > phosphate > acetate) (Bodmeier et al., 1996). The
drug release in different pH composed of those buffer species, therefore, demonstrated
different release profiles. The anionic interaction between the fixed groups and the
counterions was also contributed to the decreased drug release in the medium with higher
osmolality. The pentoxifylline release from the Eudragit RS/RL matrix tablet in 390
mOsm/kg (as in fed state) (Kalantzi et al., 2006) decreased significantly (f2 = 46.2) when
compared to that in 100 mOsm/kg (Fig. 9, middle). This was due to the greater amount of
chloride ions in the media of the higher osmolality and thus, the stronger chloride ion effect.
A lower degree of polymer hydration, swelling and drug released were then expected.
The effect of agitation rates on the drug release from the Eudragit RS/RL matrix (Fig. 9,
bottom) was less pronounced than that of the HEC tablets. This could be explained by the
higher physical stability of the water-insoluble matrix former (Huang et al., 1994).
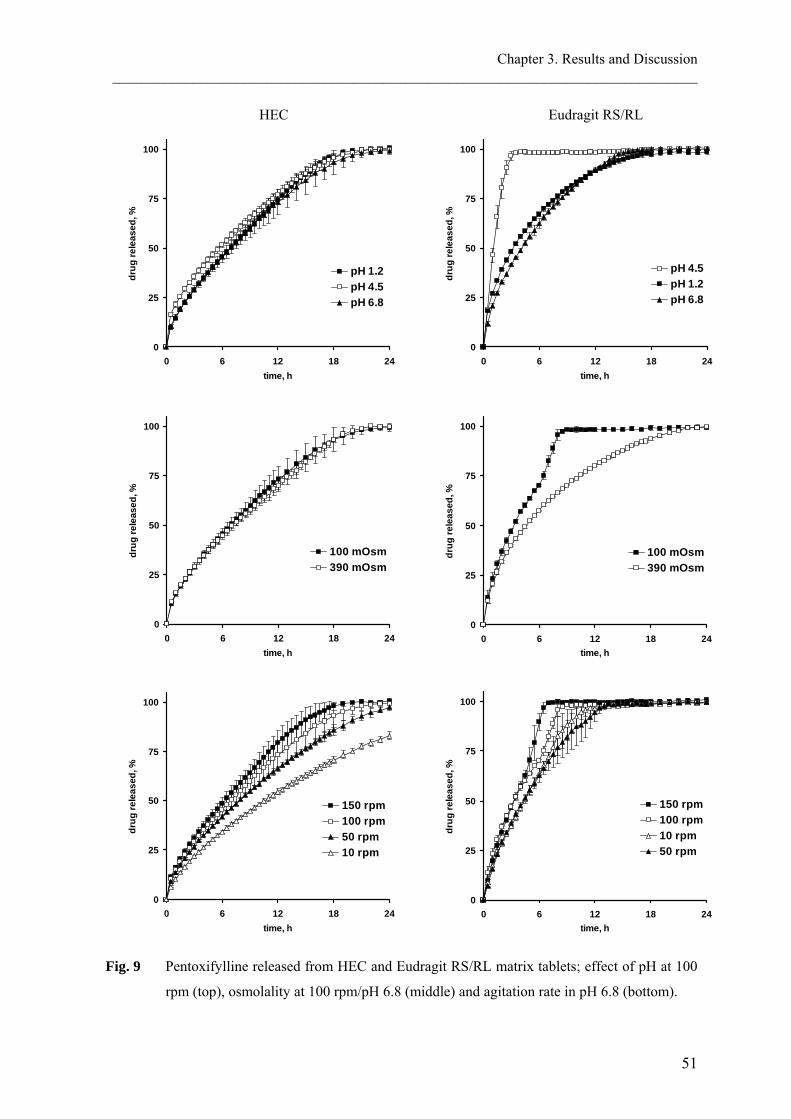
Chapter 3. Results and Discussion ________________________________________________________________________________
51
0
25
50
75
100
0 6 12 18 24time, h
drug
rele
ased
, %
150 rpm100 rpm50 rpm10 rpm
0
25
50
75
100
0 6 12 18 24time, h
drug
rele
ased
, %
100 mOsm390 mOsm
0
25
50
75
100
0 6 12 18 24time, h
drug
rele
ased
, %
pH 1.2pH 4.5pH 6.8
Fig. 9 Pentoxifylline released from HEC and Eudragit RS/RL matrix tablets; effect of pH at 100
rpm (top), osmolality at 100 rpm/pH 6.8 (middle) and agitation rate in pH 6.8 (bottom).
0
25
50
75
100
0 6 12 18 24time, h
drug
rele
ased
, %
150 rpm100 rpm10 rpm50 rpm
0
25
50
75
100
0 6 12 18 24time, h
drug
rele
ased
, %
100 mOsm390 mOsm
0
25
50
75
100
0 6 12 18 24time, h
drug
rele
ased
, %
pH 4.5pH 1.2pH 6.8
Eudragit RS/RL HEC

Chapter 3. Results and Discussion ________________________________________________________________________________
52
Table 11 Similarity factor (f2)* calculated from mean dissolution data of pentoxifylline matrix
tablets in various dissolution conditions
(a) HEC matrix
Test Reference
pH 4.5
pH 6.8
390 mOsm/kg
50 rpm
100 rpm
150 rpm
Effect of pH at 100 rpm pH 1.2 63.7 92.6 - - - - pH 4.5 - 62.7 - - - -
Effect of osmolality at 100 rpm/pH 6.8
100 mOsm/kg - - 85.3 - - - Effect of agitation rate in pH 6.8
10 rpm - - - 48.8 42.7 37.4 50 rpm - - - - 65.0 52.3 100 rpm - - - - - 69.8
(b) Eudragit RS/RL matrix
Test Reference
pH 4.5
pH 6.8
390 mOsm/kg
50 rpm
100 rpm
150 rpm
Effect of pH at 100 rpm pH 1.2 24.4 65.0 - - - - pH 4.5 - 20.8 - - - -
Effect of osmolality at 100 rpm/pH 6.8
100 mOsm/kg - - 46.2 - - - Effect of agitation rate in pH 6.8
10 rpm - - - 76.3 52.9 45.1 50 rpm - - - - 51.7 45.2 100 rpm - - - - - 56.8
*bold: the releases were similar

Chapter 3. Results and Discussion ________________________________________________________________________________
53
3.1.2.2 Verapamil HCl
In vitro performance of bioequivalent verapamil HCl products
Fig. 10-12 and Table 12 show the release and the similarity factor of verapamil HCl from
there bioequivalent ER products (Isoptin, VeraHexal and Verelan) in various pH media,
osmolalities and agitation rates. In most test conditions, the matrix tablet released faster than
did the pellets, where the shellac/fumaric acid coated ones exhibited the slowest release. The
more similar release profiles between the matrix tablet and the EC/Eudragit L100-55 coated
pellets, when compared to shellac/fumaric acid coated pellets, was also demonstrated in the
more comparable pharmacokinetic parameters (Table 8b). While the extent of absorption
(AUC) of the matrix tablet and the shellac/fumaric acid coated pellets were similar, the slow
release profile of the latter was confirmed in vivo by the lower Cmax of 114.3 ng/ml and the
longer tmax of 7.3 h compared to the tablet (171 ng/ml and 5 h, respectively) (Table 8c). It
can be noted that the drug release from shellac/fumaric acid coated pellets was incomplete
within 24 h in all studied conditions, except when 0.25% w/v sodium dodecyl sulphate was
added into the dissolution medium (Fig. 10c). This release profile was very similar to the
release obtained using rotating basket method at 75 rpm, pH 3.0, which was suggested by
the FDA (2005b) and has been reported previously (Devane et al., 1990). It can be
speculated that, the GI physiological conditions accelerate the release of pellets to a much
faster rate than that observed in vitro. This could be attributed to the effect of the lower
surface tension. Accordingly, the addition of 0.25% w/v sodium dodecyl sulphate to the
media recommended in the compendial dissolution test conditions, i.e. paddle method, 50
rpm, pH 1.2 and 6.8 (USP XXVI) could provide the better dissolution conditions, as it
mimics those in vivo.

Chapter 3. Results and Discussion ________________________________________________________________________________
54
Fig. 10 Verapamil HCl release from three bioequivalent products as a function of pH: (■) sodium
alginate/HPMC matrix tablet (Isoptin), (□) EC/Eudragit L100-55 coated pellets
(VeraHexal), (▬) shellac/fumaric acid coated pellets (Verelan), with 0.25% w/v sodium
dodecyl sulphate and (▲) Verelan without sodium dodecyl sulphate.
0
25
50
75
100
0 6 12 18 24time, h
drug
rele
ased
, %
pH 6.8
(a)
(c)
(b)
0
25
50
75
100
0 6 12 18 24time, h
drug
rele
ased
, %
0
25
50
75
100
0 6 12 18 24time, h
drug
rele
ased
, %
pH 4.5
pH 1.2

Chapter 3. Results and Discussion ________________________________________________________________________________
55
0
25
50
75
100
0 6 12 18 24time, h
drug
rele
ased
, %
0
25
50
75
100
0 6 12 18 24time, h
drug
rele
ased
, %
Fig. 11 Verapamil HCl release from three bioequivalent products as a function of osmolality: (■)
sodium alginate/HPMC matrix tablet (Isoptin), (□) EC/Eudragit L100-55 coated pellets
(VeraHexal) and (▲)shellac/fumaric acid coated pellets (Verelan).
100 mOsm/kg
390 mOsm/kg
(a)
(b)

Chapter 3. Results and Discussion ________________________________________________________________________________
56
0
25
50
75
100
0 6 12 18 24time, h
drug
rele
ased
, %
0
25
50
75
100
0 6 12 18 24time, h
drug
rele
ased
, %
0
25
50
75
100
0 6 12 18 24time, h
drug
rele
ased
, %
Fig. 12 Verapamil HCl release from three bioequivalent products as a function of agitation rate:
(■) sodium alginate/HPMC matrix tablet (Isoptin), (□) EC/Eudragit L100-55 coated
pellets (VeraHexal) and (▲)shellac/fumaric acid coated pellets (Verelan).
10 rpm
(a)
(c)
(b)
50 rpm
150 rpm
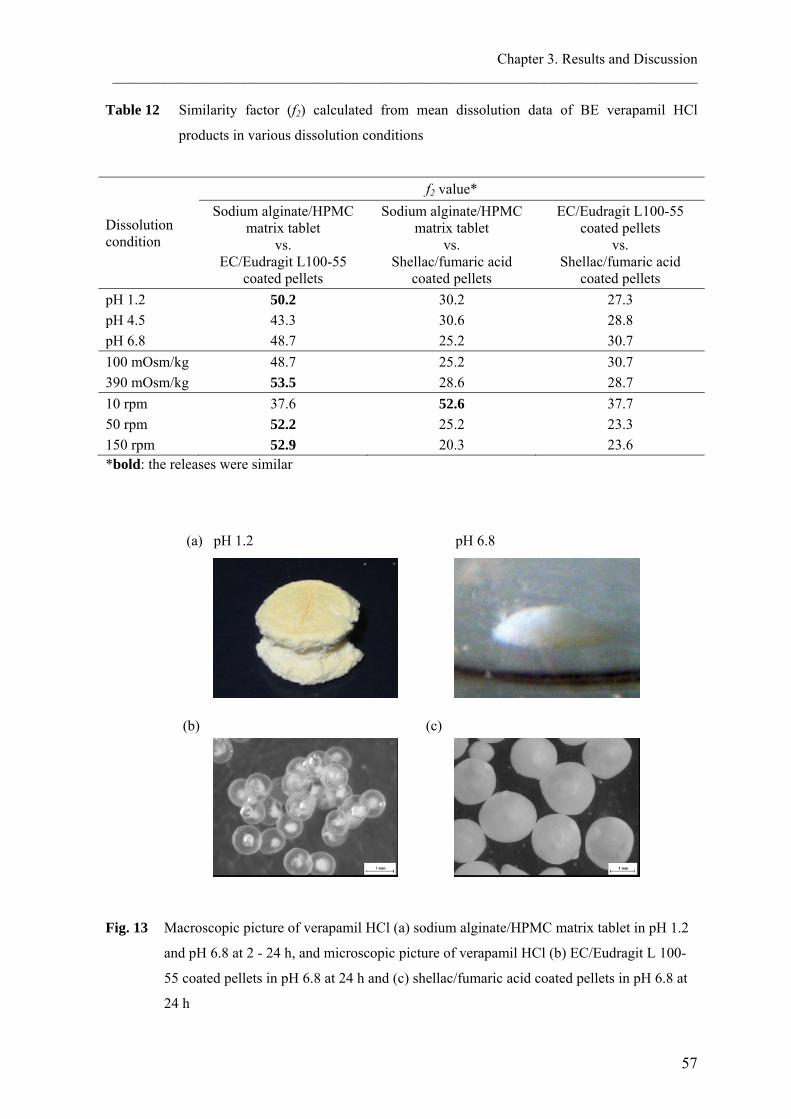
Chapter 3. Results and Discussion ________________________________________________________________________________
57
Table 12 Similarity factor (f2) calculated from mean dissolution data of BE verapamil HCl
products in various dissolution conditions
Dissolution condition
f2 value* Sodium alginate/HPMC
matrix tablet vs.
EC/Eudragit L100-55 coated pellets
Sodium alginate/HPMC matrix tablet
vs. Shellac/fumaric acid
coated pellets
EC/Eudragit L100-55 coated pellets
vs. Shellac/fumaric acid
coated pellets pH 1.2 50.2 30.2 27.3 pH 4.5 43.3 30.6 28.8 pH 6.8 48.7 25.2 30.7 100 mOsm/kg 48.7 25.2 30.7 390 mOsm/kg 53.5 28.6 28.7 10 rpm 37.6 52.6 37.7 50 rpm 52.2 25.2 23.3 150 rpm 52.9 20.3 23.6 *bold: the releases were similar
(a) pH 1.2 pH 6.8
(b) (c)
Fig. 13 Macroscopic picture of verapamil HCl (a) sodium alginate/HPMC matrix tablet in pH 1.2
and pH 6.8 at 2 - 24 h, and microscopic picture of verapamil HCl (b) EC/Eudragit L 100-
55 coated pellets in pH 6.8 at 24 h and (c) shellac/fumaric acid coated pellets in pH 6.8 at
24 h

Chapter 3. Results and Discussion ________________________________________________________________________________
58
Robustness of verapamil HCl ER products
Sodium alginate and HPMC were used to control the release of verapamil HCl, a weakly
basic drug with pH-dependent solubility (Table 9). Sodium alginate (pKa = 3.2) retarded the
drug release in the pH lower than its pKa by swelling and forming a rigid matrix, whereas it
dissolved and eroded in a higher pH and hence, facilitating the drug release (Fig. 13a). The
slight overcompensation for drug solubility was exhibited in Fig. 14a (top), where the
release was in the following order: pH 6.8 > pH 4.5 > pH 1.2. Fig. 14a (middle) shows a
decreased drug release in the higher osmolality (f2 = 42.7, Table 13a). This slower drug
release could be caused by the effect of common salt, as the medium of 390 mOsm/kg
contained the higher amount of sodium chloride.
With regard to the effect of agitation intensity, the drug released similarly at above 100 rpm
(Fig. 14a, bottom). This was due to the erosion rate reached its maximum. The release at 50
rpm and 10 rpm was significantly slower (Table 13a).
The coated pellet formulations of verapamil HCl offered robust release profiles in different
pH media and osmolality. Fig. 14b and 14c show the release from pellets coated by
EC/Eudragit L100-55 and shellac/fumaric acid, respectively. Eudragit L100-55 and shellac
are enteric polymers which dissolve at pH above 5.5 and 6.9, respectively. The low
solubility of verapamil HCl and, thus the slower drug released, in a higher pH is then able to
compensate when these pH-sensitive polymers are incorporated into the matrix. Fig. 14b
and 14c (top) and Table 13b and 13c demonstrate the drug release as ‘unaffected’ by
varying pH, including at pH 7.5 for shellac coated ones. In addition, acidic excipients such
as enteric polymers (e.g. Eudragit L100-55) as well as organic acids (e.g. fumaric acid) can
lower the micro-environmental pH of the formulation and, hence improve drug solubility
(Streubel et al., 2000). The dissolution medium of 390 mOsm/kg slightly reduced the drug
release when compared with that of 100 mOsm/kg (Fig 14b and 14c, middle), but they were
considered similar according to the f2 values (Table 13b and 13c).
The drug release from the EC/Eudragit L100-55 coated pellets at 50 and 150 rpm were
significantly faster than that at 10 rpm (Fig. 14b, bottom) (f2 = 39.8: at 10 vs. 50 rpm). The
release from the shellac/fumaric acid coated pellets, on the other hand, remained unaffected
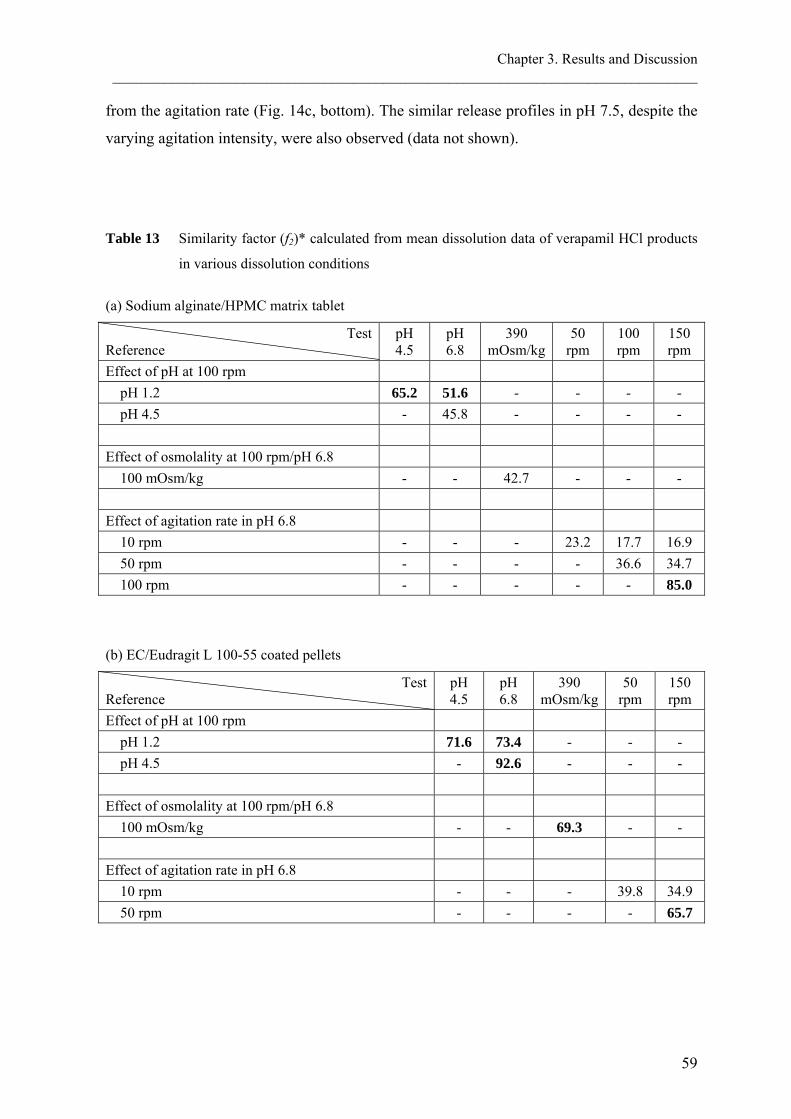
Chapter 3. Results and Discussion ________________________________________________________________________________
59
from the agitation rate (Fig. 14c, bottom). The similar release profiles in pH 7.5, despite the
varying agitation intensity, were also observed (data not shown).
Table 13 Similarity factor (f2)* calculated from mean dissolution data of verapamil HCl products
in various dissolution conditions
(a) Sodium alginate/HPMC matrix tablet
Test Reference
pH 4.5
pH 6.8
390 mOsm/kg
50 rpm
100 rpm
150 rpm
Effect of pH at 100 rpm pH 1.2 65.2 51.6 - - - - pH 4.5 - 45.8 - - - -
Effect of osmolality at 100 rpm/pH 6.8
100 mOsm/kg - - 42.7 - - - Effect of agitation rate in pH 6.8
10 rpm - - - 23.2 17.7 16.9 50 rpm - - - - 36.6 34.7 100 rpm - - - - - 85.0
(b) EC/Eudragit L 100-55 coated pellets
Test Reference
pH 4.5
pH 6.8
390 mOsm/kg
50 rpm
150 rpm
Effect of pH at 100 rpm pH 1.2 71.6 73.4 - - - pH 4.5 - 92.6 - - -
Effect of osmolality at 100 rpm/pH 6.8
100 mOsm/kg - - 69.3 - - Effect of agitation rate in pH 6.8
10 rpm - - - 39.8 34.9 50 rpm - - - - 65.7

Chapter 3. Results and Discussion ________________________________________________________________________________
60
(c) Shellac/fumaric acid coated pellets
Test Reference
pH 4.5
pH 6.8
pH 7.5
390 mOsm/kg
50 rpm
100 rpm
150 rpm
Effect of pH at 100 rpm pH 1.2 74.6 87.1 55.0 - - - - pH 4.5 - 70.7 50.9 - - - - pH 6.8 - - 57.6 - - - -
Effect of osmolality at 100 rpm/pH 6.8 100 mOsm/kg - - - 58.0 - - -
Effect of agitation rate in pH 6.8
10 rpm - - - - 88.4 69.7 61.7 50 rpm - - - - - 72.1 64.5 100 rpm - - - - - - 82.8
*bold: the releases were similar

0
25
50
75
100
0 6 12 18 24time, h
drug
rele
ased
, %
150 rpm100 rpm50 rpm10 rpm
0
25
50
75
100
0 6 12 18 24time, h
drug
rele
ased
, %
150 rpm50 rpm10 rpm
0
25
50
75
100
0 6 12 18 24time, h
drug
rele
ased
, %
100 mOsm390 mOsm
0
25
50
75
100
0 6 12 18 24time, h
drug
rele
ased
, %
100 mOsm390 mOsm
0
25
50
75
100
0 6 12 18 24time, h
drug
rele
ased
, %
pH 6.8pH 4.5pH 1.2
0
25
50
75
100
0 6 12 18 24time, h
drug
rele
ased
, %
pH 1.2pH 4.5pH 6.8
0
25
50
75
100
0 6 12 18 24time, h
drug
rele
ased
, %
150 rpm100 rpm50 rpm10 rpm
0
25
50
75
100
0 6 12 18 24time, h
drug
rele
ased
, %
100 mOsm390 mOsm
0
25
50
75
100
0 6 12 18 24time, h
drug
rele
ased
, %
pH 7.5pH 6.8pH 1.2pH 4.5
(a) (b) (c) Fig. 14 Verapamil HCl released
from (a) sodium
alginate/HPMC matrix
tablets (Isoptin), (b)
EC/Eudragit L 100-55
coated pellets
(VeraHexal) and (c)
shellac/fumaric acid
coated pellets (Verelan);
effect of pH at 50 rpm
(top), osmolality at 50
rpm/pH 6.8 (middle)
and agitation rate in pH
6.8 (bottom).
Chapter 3. Results and Discussion ________________________________________________________________________________
62
3.1.3 Conclusion
The drug products are bioequivalent when their active ingredients in pharmaceutical
equivalents or pharmaceutical alternatives are available at the site of action with similar rate
and extent when administered at the same molar dose under similar conditions. A
discriminatory dissolution test should be able to demonstrate the similarity between
bioequivalent products as well as the dissimilarity between bioinequivalent products. The
objective of this study was to observe the performance of commercially available
bioequivalent products in vitro by performing release studies in various dissolution
conditions and to evaluate the discriminating ability of those test conditions. The release
profiles of bioequivalent products were different in most test conditions. HEC matrix tablets
of pentoxifylline (Trental) released slower than Eudragit RS/RL tablets (Rentylin). This
could be due to the less mechanical stress in vitro as compared to the condition in vivo. The
release of verapamil HCl was in the following order: sodium alginate/HPMC matrix tablets
(Isoptin) > EC/Eudragit L 100-55 coated pellets (VeraHexal)> shellac/fumaric acid coated
pellets (Verelan). The latter was the most robust formulation. The difference of
bioequivalent verapamil HCl releases could be attributed to the high surface tension in vitro,
which led to the decreased drug release. Compendial in vitro dissolution methods used in
this study were not discriminating because they were unable to reflect the in vivo behaviour
of the products. The results of robustness test indicated potential factors influencing the in
vitro releases of both drugs. The simulation of in vivo osmolality, such as the addition of
sodium chloride into the standard dissolution media, and/or the optimization of mechanical
destructive force, by adjusting the agitation intensity or the addition of glass beads, should
be further investigated to obtain the discriminatory dissolution test for pentoxifylline ER
tablets. Likewise, the decreased mechanical destructive force and surface tension should be
considered for the dissolution studies of verapamil HCl ER products.

Chapter 3. Results and Discussion ________________________________________________________________________________
63
3.2 Effect of sodium dodecyl sulphate on the in vitro dissolution of
extended release solid oral dosage forms
3.2.1 Introduction
Many factors influence in vitro drug dissolution. They include physicochemical properties
of the drug (e.g. solubility, particle size and crystalline forms), formulation characteristics
(e. g. types of dosage form, excipients and manufacturing parameters) and dissolution
testing (e.g. volume, pH, surface tension, ionic strength and viscosity of the dissolution
medium, hydrodynamic conditions and types of apparatus). Meaningful dissolution tests
recognized by both regulatory agencies and pharmaceutical industries are those with
discriminatory power and physiological relevance. Setting up such specifications is
challenging, especially when dealing with poorly soluble drugs.
To overcome the drug solubility issue, the addition of surfactants into the dissolution media,
has been recommended (FDA, 2005b). Many researchers start with sodium dodecyl sulphate
(SDS) due to its excellent solubilizing capacity. An increase in drug release by the addition
of SDS was reported in many studies. Most of them dealt with its effect on physicochemical
properties of the drugs (Rohrs, 2001; Alkhamis et al., 2003; Balakrishnan et al., 2004; Park
and Choi, 2006). Only few discussed the effect on formulation characteristics. For example,
Marchais et al. (2003) reported the negative impact of SDS on the release of carbamazepine
from cross-linked hard gelatin capsules. Similarly, the drug release is slower because the
solubility of the gelatin capsule shell is reduce when SDS was added in the dissolution
medium at pH less than 5 (Zhao et al., 2004). This was caused by the formation of a less-
soluble precipitate from the interaction between SDS and gelatin. A better in vitro/in vivo
relationship of felodipine extended release (ER) matrix tablet was found with SDS in the
dissolution medium, as compared to polyoxyethylene 20 sorbitan monooleate (Tween) and
cetyltrimethylammonium bromide (CTAB) (Abrahamsson et al., 1994). The
physicochemical interactions between the matrix forming agent and the surfactants were
thought to play an important role on the drug release rate.
The objective of this study was to investigate the effect of SDS on the release of drugs from
commercially available ER solid oral dosage forms. The release of poorly soluble drug and
Chapter 3. Results and Discussion ________________________________________________________________________________
64
the drug formulated with ionic excipients are also explored. The influence of SDS will be
discussed mainly on formulation aspects. 0.25% w/v SDS in pH 6.8 was used in this study
as a standard concentration, as it lowered the surface tension of dissolution media to 33
mN/m which is similar to that in vivo (Pedersen et al., 2000; Kalantzi et al., 2006). In
addition, this is a minimum concentration that increases the solubility of carbamazepine
(Table 8) so that sink condition can be maintained.
3.2.2 Results and discussion
The addition of surfactants, such as sodium dodecyl sulphate, into dissolution media have
been recommended by several researchers and the regulatory agencies (Shah et al., 1989;
Galia et al., 1998; FDA, 2005b; USP 29, 2006). The goal was to lower surface tension of the
release media, so that to mimic the condition in vivo. Types and concentrations of
surfactants are especially important in this simulated in vitro condition, as they influence the
drug release. The physicochemical properties of the drugs and excipients as well as the
dosage forms play a role on the drug release with the presence of surfactants. This study
investigated the effect of sodium dodecyl sulphate on the releases of drugs from different
ER dosage forms including: matrix tablets, coated pellets and osmotic tablets.
3.2.2.1 Effect of sodium dodecyl sulphate on drug release from ER dosage forms
The release profiles of verapamil HCl from four ER products are presented in Fig. 15. While
the release of drug from sodium alginate/HPMC matrix tablet (Isoptin, Fig. 15a) and that
from osmotic tablet (Covera-HS, Fig. 15d) were not influenced by the addition of 0.25%
w/v sodium dodecyl sulphate (Table 14), the releases from coated pellets formulations
(VeraHexal, Fig. 15b and Verelan, Fig. 15c) were faster when sodium dodecyl sulphate was
added. This is similar to the release of diltiazem HCl ER products (Fig. 16); the effect of
sodium dodecyl sulphate was only seen with the release of coated pellets (Diltiazem-
ratiopharm, Fig. 16b and Dilzem uno, Fig. 16c). Although, the f2 values of the releases of
verapamil HCl and diltiazem HCl from shellac/fumaric acid coated pellets and Eudragit
RS/RL coated pellets, respectively, indicated the similarity (Table 14), the effect of the
addition of sodium dodecyl sulphate into the dissolution media was more pronounced when
compared with that on the drug releases from matrix tablet formulations.
Chapter 3. Results and Discussion ________________________________________________________________________________
65
The solubility of weakly basic drugs such as verapamil HCl and diltiazem HCl are pH-
dependent. At pH 6.8, which is close to their pKa (8.6 for verapamil HCl (Kasim et al.,
2004) and 7.7 for diltiazem HCl (Reza et al., 2003)) the drug solubility decreased
dramatically (Table 9). With this low solubility, the drug release from matrix tablets was
primarily caused by the erosion of the polymer matrix. Therefore, the improved wettability
resulting from the decreased surface tension did not have much effect on the drug release
from this matrix system. Likewise, the more water accessible did not accelerate the release
of verapamil HCl from osmotic tablet. Although, the drug incorporated in the osmotic
system releases by osmotic pressure generated by water penetrates into the tablet (Fig. 17),
it is eventually the permeability of the semi-permeable, rigid membrane that controls the
water penetration rate and in turn the drug released (Wen and Park, 2010).
With regard to the release of drugs from coated pellets, it is generally controlled by a
combination of two or more processes (Lecomte, 2004). For example, a drug is released by
convection through water-filled channels and, in parallel, diffuses through the polymeric
membrane. In contrast to the semi-permeable membrane of the osmotic tablets, the water-
filled channels were created by hydrostatic pressure developed within the pellet core or by
the leaching of water soluble components, e.g. sugar, into the bulk fluid. The more water
accessible to the pellets as a result of the increased wettability is, therefore, contributes to
the faster drug release.
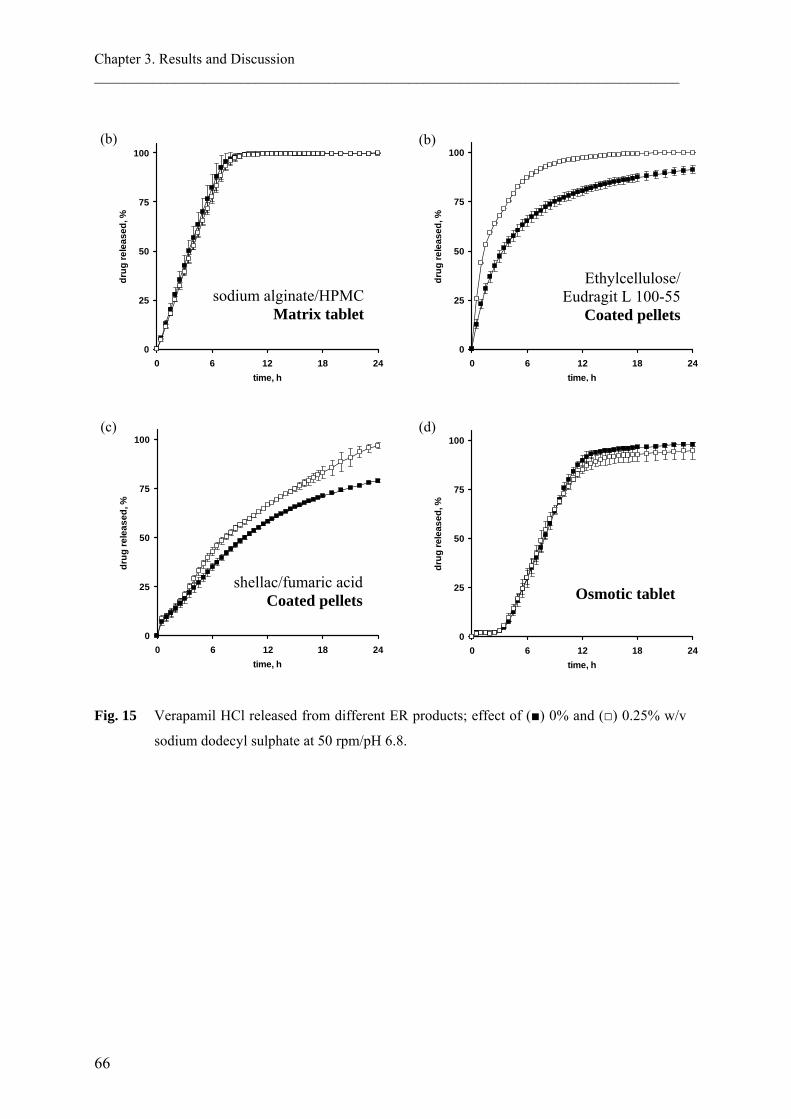
Chapter 3. Results and Discussion ________________________________________________________________________________
66
0
25
50
75
100
0 6 12 18 24time, h
drug
rele
ased
, %
0
25
50
75
100
0 6 12 18 24time, h
drug
rele
ased
, %
0
25
50
75
100
0 6 12 18 24time, h
drug
rele
ased
, %
0
25
50
75
100
0 6 12 18 24time, h
drug
rele
ased
, %
Fig. 15 Verapamil HCl released from different ER products; effect of (■) 0% and (□) 0.25% w/v
sodium dodecyl sulphate at 50 rpm/pH 6.8.
sodium alginate/HPMC Matrix tablet
(c)
(b)
Ethylcellulose/ Eudragit L 100-55
Coated pellets
(d)
Osmotic tablet
(b)
shellac/fumaric acid Coated pellets

Chapter 3. Results and Discussion ________________________________________________________________________________
67
0
25
50
75
100
0 6 12 18 24time, h
drug
rele
ased
, %
0
25
50
75
100
0 6 12 18 24time, h
drug
rele
ased
, %
0
25
50
75
100
0 6 12 18 24time, h
drug
rele
ased
, %
Fig. 16 Diltiazem HCl released from different ER products; effect of (■) 0% and (□) 0.25% w/v
sodium dodecyl sulphate at 100 rpm/pH 6.8.
HEC/HPMC Matrix tablet
(b)
Ethylcellulose Coated pellets
Eudragit RS/RL Coated pellets
(c)
(a)

Chapter 3. Results and Discussion ________________________________________________________________________________
68
Table 14 Similarity factor (f2)* calculated from mean dissolution data of drugs in buffer solution
pH 6.8 with 0% and 0.25% w/v sodium dodecyl sulphate (SDS).
Dosage form
f2 value Drug released in 0% vs. 0.25% w/v SDS
Verapamil HCl
Diltiazem HCl Pentoxifylline Carbamazepine
Matrix tablet
Sodium alginate / HPMC 71.5 - - -
HEC / HPMC - 60.6 - - HEC - - 95.9 - Eudragit RS / RL - - 35.5 - Eudragit NE 30D / Aquacoat ECD - - - 25.0
Eudragit RS / L 100-55 - - - 25.9
Coated pellets
Ethylcellulose / Eudragit L 100-55 33.9 - - -
Shellac / fumaric acid 54.1 - - - Ethylcellulose - 48.1 - - Eudragit RS / RL - 69.2 - - mix - - - 19.8
Osmotic tablet 81.9 - 38.3 *bold: the releases were similar
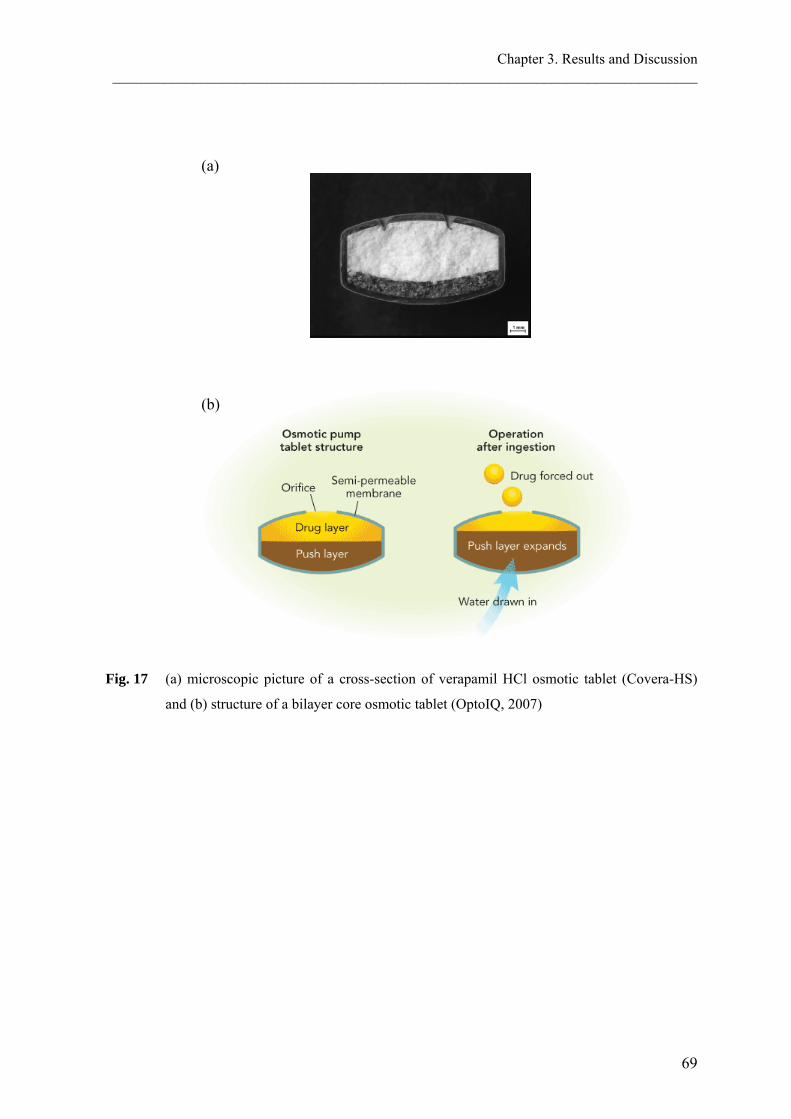
Chapter 3. Results and Discussion ________________________________________________________________________________
69
(a)
(b) Fig. 17 (a) microscopic picture of a cross-section of verapamil HCl osmotic tablet (Covera-HS)
and (b) structure of a bilayer core osmotic tablet (OptoIQ, 2007)
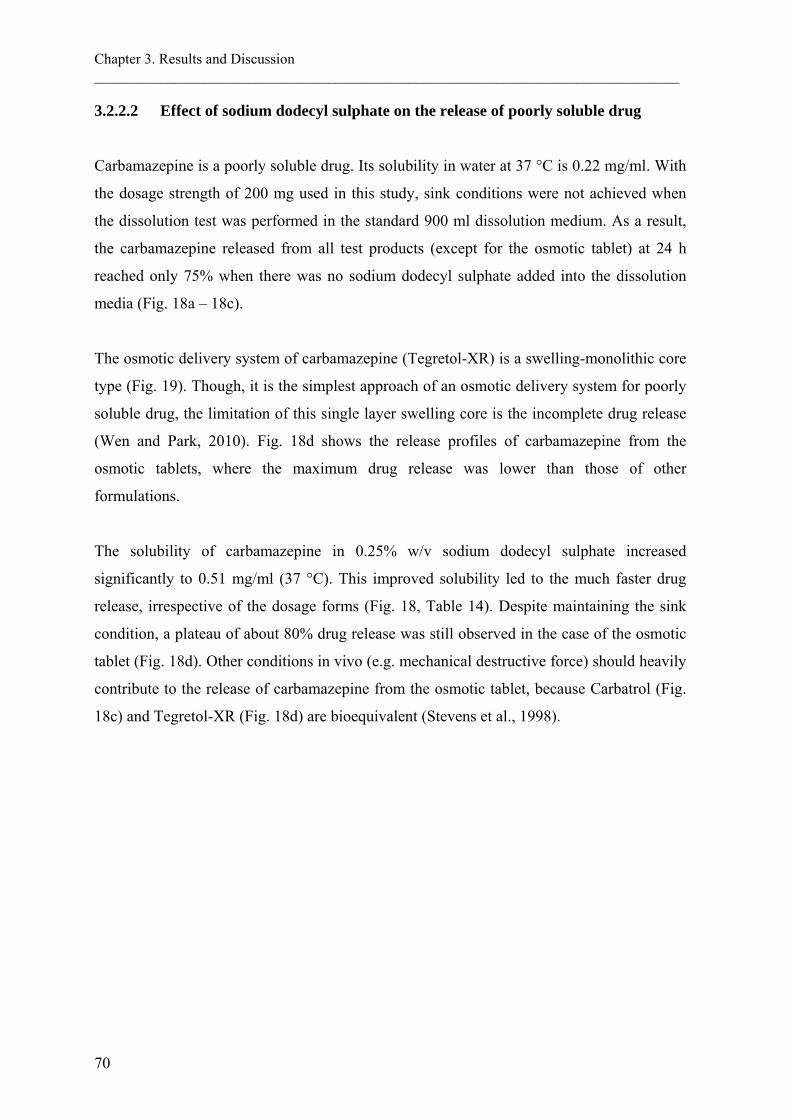
Chapter 3. Results and Discussion ________________________________________________________________________________
70
3.2.2.2 Effect of sodium dodecyl sulphate on the release of poorly soluble drug
Carbamazepine is a poorly soluble drug. Its solubility in water at 37 °C is 0.22 mg/ml. With
the dosage strength of 200 mg used in this study, sink conditions were not achieved when
the dissolution test was performed in the standard 900 ml dissolution medium. As a result,
the carbamazepine released from all test products (except for the osmotic tablet) at 24 h
reached only 75% when there was no sodium dodecyl sulphate added into the dissolution
media (Fig. 18a – 18c).
The osmotic delivery system of carbamazepine (Tegretol-XR) is a swelling-monolithic core
type (Fig. 19). Though, it is the simplest approach of an osmotic delivery system for poorly
soluble drug, the limitation of this single layer swelling core is the incomplete drug release
(Wen and Park, 2010). Fig. 18d shows the release profiles of carbamazepine from the
osmotic tablets, where the maximum drug release was lower than those of other
formulations.
The solubility of carbamazepine in 0.25% w/v sodium dodecyl sulphate increased
significantly to 0.51 mg/ml (37 °C). This improved solubility led to the much faster drug
release, irrespective of the dosage forms (Fig. 18, Table 14). Despite maintaining the sink
condition, a plateau of about 80% drug release was still observed in the case of the osmotic
tablet (Fig. 18d). Other conditions in vivo (e.g. mechanical destructive force) should heavily
contribute to the release of carbamazepine from the osmotic tablet, because Carbatrol (Fig.
18c) and Tegretol-XR (Fig. 18d) are bioequivalent (Stevens et al., 1998).

Chapter 3. Results and Discussion ________________________________________________________________________________
71
0
25
50
75
100
0 6 12 18 24time, h
drug
rele
ased
, %
0
25
50
75
100
0 6 12 18 24time, h
drug
rele
ased
, %
0
25
50
75
100
0 6 12 18 24time, h
drug
rele
ased
, %
0
25
50
75
100
0 6 12 18 24time, h
drug
rele
ased
, %
Orifice
Semi-permeable membrane
Drug forced out (suspension)
Monolithic core containing drug
Fig. 18 Carbamazepine released from different ER products; effect of (■) 0% and (□) 0.25% w/v
sodium dodecyl sulphate at 100 rpm/pH 6.8.
Fig. 19 Structure of a swelling-monolithic core osmotic tablet. Modified from Wen and Park
(2010).
Eudragit NE 30D/ Aquacoat ECD Matrix tablet
(a)
(c)
(b)
Eudragit RS/L 100-55 Matrix tablet
(d)
Osmotic tablet Coated pellets

Chapter 3. Results and Discussion ________________________________________________________________________________
72
3.2.2.3 Effect of sodium dodecyl sulphate on the release of pentoxifylline from
matrix tablets of ionic and nonionic excipients
The characteristic of the tablets and the release of pentoxifylline from hydroxyethyl
cellulose (HEC) (Trental) and poly(ethyl acrylate, methyl methacrylate)
trimethylammonioethyl methacrylate chloride (Eudragit RS/RL) (Rentylin) matrix formers
are presented in Fig. 20 and 21, respectively. The remaining of the HEC matrix tablet after
24 h release was a small gel mass (Fig. 20a), while granules were observed from the
Eudragit RS/RL matrices in the release media containing surfactants (Fig. 20b).
The drug release from the HEC matrix tablet was robust to the addition of sodium dodecyl
sulphate (Fig. 21a, Table 14), whereas, it decreased significantly in the case of Eudragit
RS/RL ones (Fig 21b). The release in 0.25% and 0.50% w/v sodium dodecyl sulphate (33
mN/m) were similar (Table 15), but they were much slower than those in the media
containing 0.25% w/v Tween 80 (48 mN/m) and 0.05% w/v Span 80 (30 mN/m), which are
nonionic surfactants. The drug release in the presence of the latter two surfactants was also
comparable to that in medium without surfactant (69 mN/m). As a result, the reduced drug
release in the sodium dodecyl sulphate solutions was attributed to the cationic/anionic
interaction between the Eudragit polymers and sodium dodecyl sulphate, and not the change
of surface tensions.
(a) (b)
Fig. 20 Microscopic picture of pentoxifylline (a) HEC and (b) Eudragit RS/RL matrix tablets after
24 h release in pH 6.8 with surfactant.

Chapter 3. Results and Discussion ________________________________________________________________________________
73
Fig. 21 Pentoxifylline released from (a) HEC and (b) Eudragit RS/RL matrix tablets; effect of
surfactant at 100 rpm/pH 6.8.
0
25
50
75
100
0 6 12 18 24time, h
drug
rele
ased
, %
0.25% Tween 800.05% Span 800% surfactant0.50% SDS0.25% SDS
0
25
50
75
100
0 6 12 18 24time, h
drug
rele
ased
, %
0% SDS0.25% SDS
(a)
(b)

Chapter 3. Results and Discussion ________________________________________________________________________________
74
Table 15 Similarity factor (f2)* calculated from mean dissolution data of Eudragit RS/RL matrix
tablets of pentoxifylline in buffer solution pH 6.8 with various concentrations of
surfactants.
Test Reference
0.25% SDS
0.50% SDS
0.25% Tween 80
0.05% Span 80
0% surfactant 35.5 39.8 69.7 55.9 0.25% SDS - 70.3 35.2 42.0 0.50% SDS - - 39.0 46.7 0.25% Tween 80 - - - 57.2 *bold: the releases were similar
3.2.3 Conclusion
The goal of adding surfactants into dissolution media was to mimic the condition in vivo by
lowering surface tension. The drug release in this simulated media is, however, influenced
by the type of surfactant. In addition, the physicochemical properties of drugs, excipients
and the dosage forms also contribute to the release pattern. The purpose of this study was to
investigate the effect of sodium dodecyl sulphate on the releases of drugs from different ER
dosage forms. The matrix tablets of verapamil HCl and diltiazem HCl were robust to the
addition of sodium dodecyl sulphate. Their release patterns were unchanged because the
improved wettability did not have much effect on the erosion rate of the polymer. In
contrast, this increased water accessibility facilitated the release from coated pellets, as
could be seen from the release of both drugs. There was no effect of sodium dodecyl
sulphate on the drug release from osmotic tablet because the rate of water penetration into
the tablet, which controlled by the semi-permeable membrane, was unchanged. The
significantly increase solubility of carbamazepine outperformed the effect of sodium
dodecyl sulphate on the drug release from different types of dosage form. Therefore, all
formulations of carbamazepine show the considerably increase drug release when sodium
dodecyl sulphate was added. Another concern of adding ionic surfactant into dissolution
medium is the cationic/anionic interaction between the surfactant and the drug or other
excipients. Pentoxifylline released from matrix tablets composed of HEC, a nonionic matrix
former, were unaffected by the addition of sodium dodecyl sulphate, an anionic surfactant.
On the contrary, the decreased drug release was observed when the matrix former was
Eudragit RS/RL, a cationic polymer. Despite the dissolution was performed in the similar

Chapter 3. Results and Discussion ________________________________________________________________________________
75
surface tension as of sodium dodecyl sulphate solution, the decreased drug release was not
seen when Tween 80 or Span 80, the nonionic surfactants, were added. In conclusion, the
effect of sodium dodecyl sulphate on drug release could be attributed to many formulation
factors. Although the use of sodium dodecyl sulphate is recommended for dissolution
studies of several products, the contributions of those factors as for example reported in this
study should not be disregarded.

Chapter 3. Results and Discussion ________________________________________________________________________________
76
3.3 Evaluation of drug properties for the selection of extended release
solid oral dosage form: Application of principal component analysis
3.3.1 Introduction
Success of an extended release (ER) formulation depends not only on the performance of
the formulation, but also the suitability of the chosen dosage form. Cost and effort are
greatly required throughout the development and assessment processes; it is therefore, even
more sensible to identify whether the selected delivery system would possibly be the most
promising achievement. Several research studies have been focused on novel delivery
technologies (see, for example, (McGinity, 1997; Flament et al., 2004; Kshirsagar et al.,
2008; Tiwari and Rajabi-Siahboomi, 2008). There were, however, only few reports
suggesting the selection of a particular delivery system for a particular drug (Lipper, 1999;
Thombre, 2005). The understanding of the relationship between properties of drug such as
solubility, maximum dose strength and elimination half-life, and the dosage form selection,
is essential for identifying the most promising formulation development. In order to
understand this relationship and to establish a guide for ER technology selection, a
multivariate data analysis approach, namely, principal component analysis (PCA) was
employed.
PCA is a technique for simplifying data by reducing multidimensional data to lower
dimensions while retaining as much as possible the variation of the data set (Jolliffe, 2002).
It is a linear transformation that transforms the data to a new coordinate system, so called
the principal components (PCs). The first few, i.e. lower-order, PCs are able to explain the
largest structural variation of the original data set, whereas the higher-order ones are
generally considered as less relevant and hence, being dropped from further analysis. It
should be noted, however, that the lower-order PCs, such as PC1 and PC2, are not always
the most relevant for some particular interpretation purposes because they may not reveal
the targeted answer. Therefore, the use of the higher-order PCs, when they have the largest
problem-specific information, is more appropriate in certain cases (Esbensen et al., 2006).
PCA can also be used to classify data. The method facilitates the classification of objects
(e.g. drugs) considering conformity with the extracted model and variables (e.g. drug

Chapter 3. Results and Discussion ________________________________________________________________________________
77
properties) describing the objects (Esbensen et al., 2006). This classification can be
interpreted through the map of samples so called score plots, the map of variables so called
loading plots as well as the relationship between both plots. The interpretation can be further
simplified by the rotation of PCs using, for example, varimax rotation (Kaiser, 1958). The
rotation is performed so as to maximize the variance of factor loading by making high
loadings higher and low ones lower for each factor.
The PCA technique has found application in many diverse fields such as environmental
science (Soh and Abdullah, 2007), marketing (Petroni and Braglia, 2000), psychology (El
Yazaji et al., 2002), food science (Cotroneo et al., 1990; Krauze and Zalewski, 1991; Muir
et al., 1996) and pharmaceutical science (Tarvainen et al., 2001; Karalis et al., 2002; Tho et
al., 2002). The present study explored the relationships between properties of drugs and
their available ER dosage forms. The classification of single- vs. multiple-unit dosage form
and the carrier systems of matrix tablets were examined. Significant properties
distinguishing the dosage forms/matrix types and the guideline for ER system selections
were investigated.
3.3.2 Results and discussion
Many different types of ER solid oral dosage forms exist. These include among others
reservoir or matrix systems, osmotic systems and specialized drug delivery systems, such as
pulsatile and gastroretentive drug delivery systems. The investigation of successful
marketed ER products could provide a valuable clue for formulation scientists to select a
system over another one for a particular drug. In this respect, the correlation of drugs
properties and their available dosage forms was examined.
3.3.2.1 Classification of single- vs. multiple-unit dosage form
The 59 percent of the collected samples were classified as ‘tablet’, while 41 percent were
multiparticulate pellet systems (will be referred to as ‘multiparticulate’). Within the tablet
group, 43 percent were matrix tablets, 13 percent were osmotic and 3 percent were coated
ones. Various drug properties and their value distribution were presented in Table 16 and

Chapter 3. Results and Discussion ________________________________________________________________________________
78
Fig. 22. Most properties of tablet and multiparticulate groups showed the values overlay to
each other.
Table 16 Mean values and ranges of variables: Tablet vs. Multiparticulate systems
Variables Tablet; n = 85 Multiparticulate; n = 60 Mw 287.08 (41.99 - 484.63) 310.25 (144.21 - 591.74) pKa 7.55 (0.00 - 13.94) 7.85 (0.00 - 13.94) LogP 2.14 (-5.03 - 5.69) 2.46 (-1.03 - 5.82) H-bond donors 1.93 (0 - 10) 2.30 (0 - 10) H-bond acceptors 5.39 (0 - 14) 6.17 (1 - 14) PSA (°A) 58.27 (0.00 - 130.15) 64.27 (3.24 - 134.23) Solubility (mg/ml) 163.24 (0.001 - 2000) 165.68 (0.01 - 2000) Max dose (mg) 221.59 (0.40 - 1000) 150.30 (0.25 - 500) Dose number (Do) 5.60 (0.0001 - 160.16) 4.70 (0.00001 - 100.00) t1/2 IR (h) 7.46 (0.75 - 23.00) 6.19 (0.03 - 26.90) t1/2 ER (h) 10.96 (2.30 - 24.00) 9.85 (1.64 - 37.00) t1/2 ratio 2.13 (0.77 - 10.00) 15.42 (0.97 - 533.33) tmax IR (h) 1.88 (0.50 - 6.30) 1.99 (0.50 - 6.30) tmax ER (h) 6.39 (1.40 - 25.70) 5.46 (2.04 - 13.30) tmax ratio 4.30 (1.06 - 24.00) 3.58 (1.00 - 9.36)
Contributing drug properties and pattern
PCA was used to identify the significance of drug properties for dosage form selection. The
interpretation of variance is straightforward given that scores and loadings are orthogonal.
Fig. 23a illustrated the score plot of PC1 vs. PC2 for 125 samples and 10 properties. The
samples presented in the lower part of the plot had the highest values of maximum dose
strength, while those occurring in the upper part reached the lowest values. According to
sample distribution, there were two subgroups of ‘tablet’. The first group (1) exhibited the
samples with elimination half-life of their drugs as immediate release (IR) formulation (t1/2
IR) greater than 11 h, all of which too showed LogP above 1.8. There was, however, an
exception for four multiparticulate samples i.e. amitriptyline hydrochloride, clonidine
hydrochloride, dextromethorphan hydrobromide and fluvoxamine maleate. Insight into the
specific reason for these samples having similar properties to tablets requires further
investigation. The second group of tablets (2) formed among those with maximum dose

Chapter 3. Results and Discussion ________________________________________________________________________________
79
strength greater than 500 mg, corresponding with the positions of the properties in the
loading plot (Fig. 23b). Samples positioned outer the two ellipses formed no separated
groups.
Although the half-life of greater than 10 h is, in general, sufficiently long for a drug to be
self-sustaining (Thombre, 2005), ER formulations may be required when the drug has Cmax-
related side effects. In such cases, tablet formulations appeared to be the dosage form of
choice. This could be due to the lower Cmax produced by tablets as compared with
multiparticulates (Hovi et al., 1983; Anon, 1995). Dose limitation was also evident for
multiparticulate systems. The maximum dose strength of not-more-than-500 mg was
observed for all multiparticulate samples. This limitation was attributed to the
proportionally higher need for excipients in the formulations (Bussemer et al., 2001). A very
high drug loading of a multiparticulate system thus requires a large capacity beyond an
acceptable capsule size.
Table 17 Multivariate analysis of drug properties: PCA with varimax rotation on ER products
Drug properties Correlation of scores on the extracted components1
PC1 PC2 LogP 0.794 0.186 t1/2 IR 0.665 -0.061 tmax IR 0.600 -0.093 H-bond acceptors -0.525 0.642 PSA -0.494 0.691 H-bond donors -0.433 0.163 Max dose -0.401 -0.503 Mw 0.309 0.790 pKa 0.180 -0.287 Do -0.056 0.441 Variance explained by component, after rotation
24.3 21.2
1bolded values thought to be important
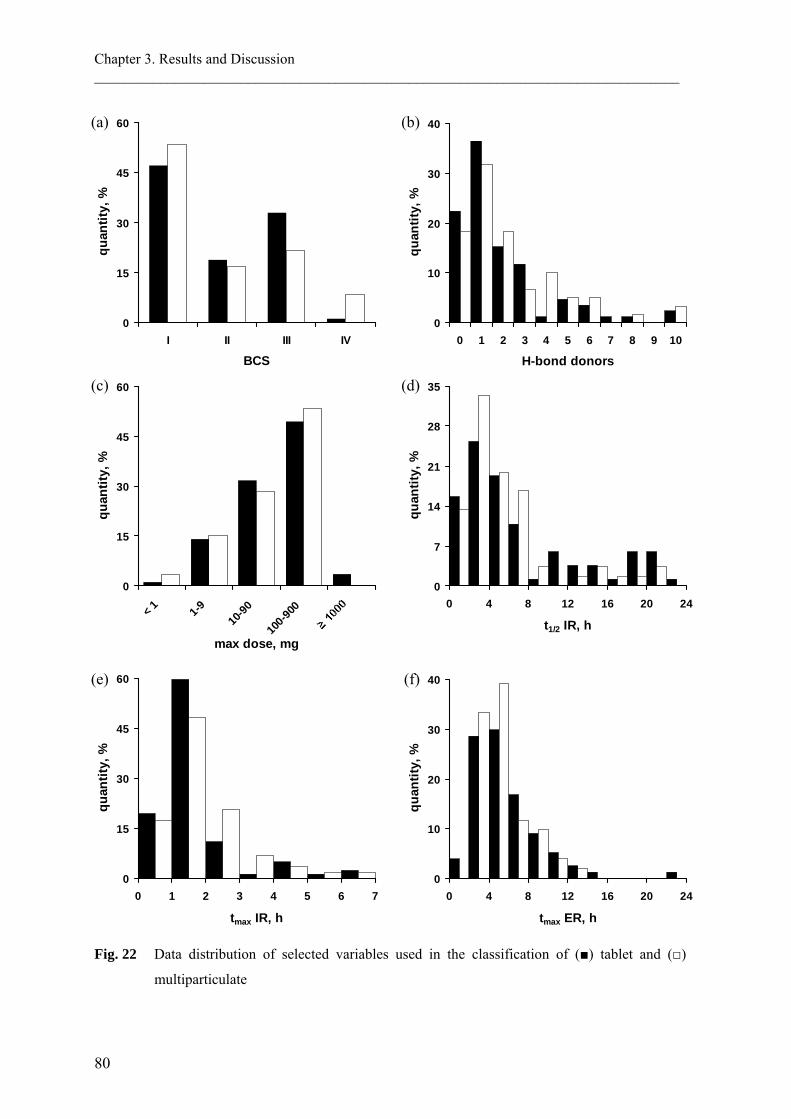
Chapter 3. Results and Discussion ________________________________________________________________________________
80
0
15
30
45
60
0 1 2 3 4 5 6 7
tmax IR, h
quan
tity,
%
0
10
20
30
40
0 4 8 12 16 20 24
tmax ER, h
quan
tity,
%
0
15
30
45
60
< 1 1-910
-90
100-9
00
max dose, mg
quan
tity,
%
0
7
14
21
28
35
0 4 8 12 16 20 24
t1/2 IR, h
quan
tity,
%
0
15
30
45
60
I II III IV
BCS
quan
tity,
%
0
10
20
30
40
0 1 2 3 4 5 6 7 8 9 10
H-bond donors
quan
tity,
%
Fig. 22 Data distribution of selected variables used in the classification of (■) tablet and (□)
multiparticulate
(a)
(c)
(b)
(e)
(d)
(f)

Chapter 3. Results and Discussion ________________________________________________________________________________
81
After identifying the distribution of samples, the variables were rotated using varimax
rotation to form the new set of score and loading. Fig. 23c and 23d showed score and
loading plots after varimax rotation of the same data set, respectively. Distribution of the
samples and the drug properties were better aligned on the PCs axes. All samples belonged
to the group (1) were in the positive region of PC1 and those of the group (2) were in the
negative region of both PCs. This new data distribution yielded the stronger correlation
between the samples/variables and the PCs.
The significance of individual properties in classifying the type of dosage forms based on
the values of PCs could be identified from the loading plots. The two or three initial PCs
usually explained the majority of data variability. A strong association was found when a
variable has the large value of, for example, PC1 and the relatively low (close to zero) of
PC2. Table 17 and Fig. 23d represented the correlation scores of each drug properties on the
extracted components. LogP and t1/2 IR were strongly associated with PC1, while Mw and
PSA were with PC2. However, the latter two could not be used to discriminate the type of
dosage forms when the score plot (Fig. 23c) and loading plot (Fig. 23d) from the same data
set were evaluated together.

Chapter 3. Results and Discussion ________________________________________________________________________________
82
Fig. 23 Score plots (left column) and loading plots (right column) of PC1 vs. PC2, (a-b) before
and (c-d) after varimax rotation of 125 ER samples and 10 properties, explaining 45.5% of
the total variance; (■) tablet and (□) multiparticulate. Group (1) and (2) showed the
accumulation of tablet samples.
Application of PCA model
Although the maximum dose strength (>500 mg) or the t1/2 IR (>11 h) played more
significant roles for a drug to be formulated as a single unit dosage form, other properties
included in this study also involved to the distribution of samples and hence, contributed to
-5
-2.5
0
2.5
-6 -3 0 3
PC1
PC2
-3
-1.5
0
1.5
3
-3 -1.5 0 1.5 3
PC1
PC2
Mw
pKa
H-donors
H-acceptors
Max dose
Do
LogP
t½ IRtmax IR
PSA
-1
-0.5
0
0.5
1
-1 -0.5 0 0.5 1
PC1
PC2(c) (d)
1
2
1
2
(a)Mw
pKa H-donors
Max dose
Do
LogP
H-acceptors
t½ IRtmax IR
PSA
-1
-0.5
0
0.5
1
-1 -0.5 0 0.5 1
PC1
PC2(b)

Chapter 3. Results and Discussion ________________________________________________________________________________
83
the classification. The values of PCs that define the location of both tablet groups can be
used for the prediction of tablet. As read out directly from Fig. 23c, the position of the
groups are (1) PC1 > 0.80 and (2) PC1 < -1.20 and PC2 < -0.25. Therefore, tablet is
recommended for a drug that has the PC scores fall within those ranges, or else it can be
formulated as either system. For a given drug with known properties, PC scores are
determined by the following equations:
PC1 = 0.196(LogP) + 0.045(t1/2 IR) + 0.218(tmax IR) - 0.056(H-bond acceptors)
- 0.005(PSA) - 0.073(H-bond donors) - 0.001(Max dose) + 0.002(Mw)
+ 0.022(pKa) + 0.004(Do) - 0.935 (Eq. 3)
PC2 = 0.08(LogP) + 0.002(t1/2 IR) - 0.005(tmax IR) + 0.086(H-bond acceptors)
+ 0.01(PSA) + 0.022(H-bond donors) - 0.001(Max dose) + 0.004(Mw)
- 0.048(pKa) + 0.161(Do) - 2.063 (Eq. 4)
where the drug properties are substituted by their values.

Chapter 3. Results and Discussion ________________________________________________________________________________
84
3.3.2.2 Classification of matrix tablets: hydrophilic-, lipophilic- and mix carrier
systems
Among ER solid oral drug products, monolithic matrix systems especially those composed
of hydrophilic polymeric materials are the most common (Skinner et al., 2002; Tiwari and
Rajabi-Siahboomi, 2008). Cellulose ethers such as hydroxypropylmethylcellulose (HPMC)
and hydroxyethylcellulose (HEC) are widely employed as the water soluble, swellable
matrices, whereas those composed for example of ethylcellulose (EC) and acrylic polymers
are for hydrophobic ones. Within the studied data set, 51 percent of the matrix tablets were
comprised of hydrophilic carrier, while 31 percent were lipophilic one. The rest, 18 percent,
were the mixture of both carrier systems. Table 18 and Fig. 24 showed the drug properties
and the distribution of variables used in the study.
Table 18 Mean values and ranges of variables for matrix tablets
Variables Hydrophilic matrix; n = 32 Lipophilic matrix; n = 19 Mix systems; n = 11
Mw 296.86 (41.99 - 454.60) 273.15 (74.55 - 484.63) 276.41 (144.21 - 389.45)
pKa 7.28 (1.00 - 13.70) 6.84 (0.00 - 13.94) 7.72 (3.61 - 9.67)
LogP 2.26 (-5.03 - 5.69) 1.61 (-4.51 - 4.55) 1.99 (-1.03 - 5.19)
H-bond donors 1.82 (0 - 7) 1.35 (0 - 10) 2.67 (0 - 8)
H-bond acceptors 5.38 (0 - 11) 5.29 (1 - 12) 6.08 (2 - 14)
PSA (°A) 59.97 (0.00 - 130.15) 55.05 (0.00 - 128.58) 53.84 (6.48 - 111.85)
Solubility (mg/ml) 131.95 (0.001 - 2000) 100.15 (0.03 - 400) 218.74 (0.01 - 1000)
Max dose (mg) 193.78 (0.40 - 1000) 296.79 (4.00 - 1000) 285.42 (10.00 - 800)
Dose number (Do) 4.60 (0.0002 - 65.31) 1.45 (0.0001 - 21.82) 18.95 (0.0004 - 160.16)
t1/2 IR (h) 7.07 (0.75 - 21.00) 7.41 (0.75 - 20.00) 6.17 (1.70 - 20.40)
t1/2 ER (h) 10.09 (2.30 - 24.00) 11.98 (6.50 - 20.30) 9.29 (3.00 - 20.40)
t1/2 ratio 1.80 (0.83 - 3.89) 3.95 (1.00 - 10.00) 1.69 (1.00 - 2.59)
tmax IR (h) 1.80 (0.50 - 6.30) 1.93 (1.00 - 4.50) 1.83 (1.00 - 4.83)
tmax ER (h) 5.23 (2.25 - 12.00) 5.47 (1.40 - 12.00) 5.04 (2.40 - 9.67)
tmax ratio 3.73 (1.25 - 10.60) 3.16 (1.17 - 6.84) 2.94 (1.86 - 6.45)

Chapter 3. Results and Discussion ________________________________________________________________________________
85
0
15
30
45
60
< 0.1
0.1-1
1-10
10-33
33-10
0
100-1
000
solubility, mg/ml
quan
tity,
%
0
10
20
30
40
50
< 0.00
1
0.001
-0.00
9
0.01-0
.09
0.1-0.
9
dose number
quan
tity,
%
0
15
30
45
60
I II III IV
BCS
quan
tity,
%
0
5
10
15
20
0 2 4 6 8 10 12 14
H-bond acceptors
quan
tity,
%
0
15
30
45
60
0 20 40 60 80 100 120 140
PSA, °A
quan
tity,
%
0
10
20
30
40
50
0 4 8 12 16 20 24
t1/2 IR, h
quan
tity,
%
Fig. 24 Data distribution of selected variables used in the classification of (■) hydrophilic-, (□)
lipophilic- and ( ) mix matrix systems
(a)
(c)
(b)
(d)
(e) (f)

Chapter 3. Results and Discussion ________________________________________________________________________________
86
Contributing drug properties and pattern
The score plot of 58 matrix tablets and the loading plot of their contributed variables were
presented in Fig. 25a and Fig. 25b, respectively. The samples located in the negative region
of PC1 had the lowest solubility or the highest dose number when compared with the
matrices in the positive region. The majority of samples located on the left side (group 1) of
the dashed line (PC1 = -0.75) were hydrophilic matrices, whereas those on the right side
(group 2) were the samples of all matrix types. Due to this distribution pattern, properties of
drugs which were highly correlated with PC1 were responsible for the classification of
matrix systems. Table 19 listed the correlation values of the drug properties on the extracted
components. The scores on the first component were correlated highly with solubility (r =
0.871) and dose number (r = -0.759).
Table 19 Multivariate analysis of drug properties: PCA with varimax rotation on matrix tablets
Drug properties Correlation of scores on the extracted components1
PC1 PC2 Solubility 0.871 -0.185 Do -0.759 0.055 pKa 0.615 0.092 PSA -0.568 -0.631 Mw -0.541 0.104 LogP -0.368 0.705 H-acceptors -0.237 -0.680 Max dose 0.144 -0.281 t1/2IR -0.065 0.796 Variance explained by component, after rotation
28.3 23.6
1bolded values thought to be important
The limited solubility of a drug was found to be the key parameter for identifying the matrix
type. The studied drugs whose solubility values are the least or dose numbers are greater
than one (i.e. poorly soluble) were presented in Table 20. Among those belonged to group
(1), all of them are practically insoluble according to the USP. Nonetheless, alprazolam and
indapamide are highly soluble with regard to their dose numbers. It was unlikely for a
poorly soluble drug to be formulated as a lipophilic matrix system because an incomplete
drug release from the dosage from was expected. The penetration of aqueous media through
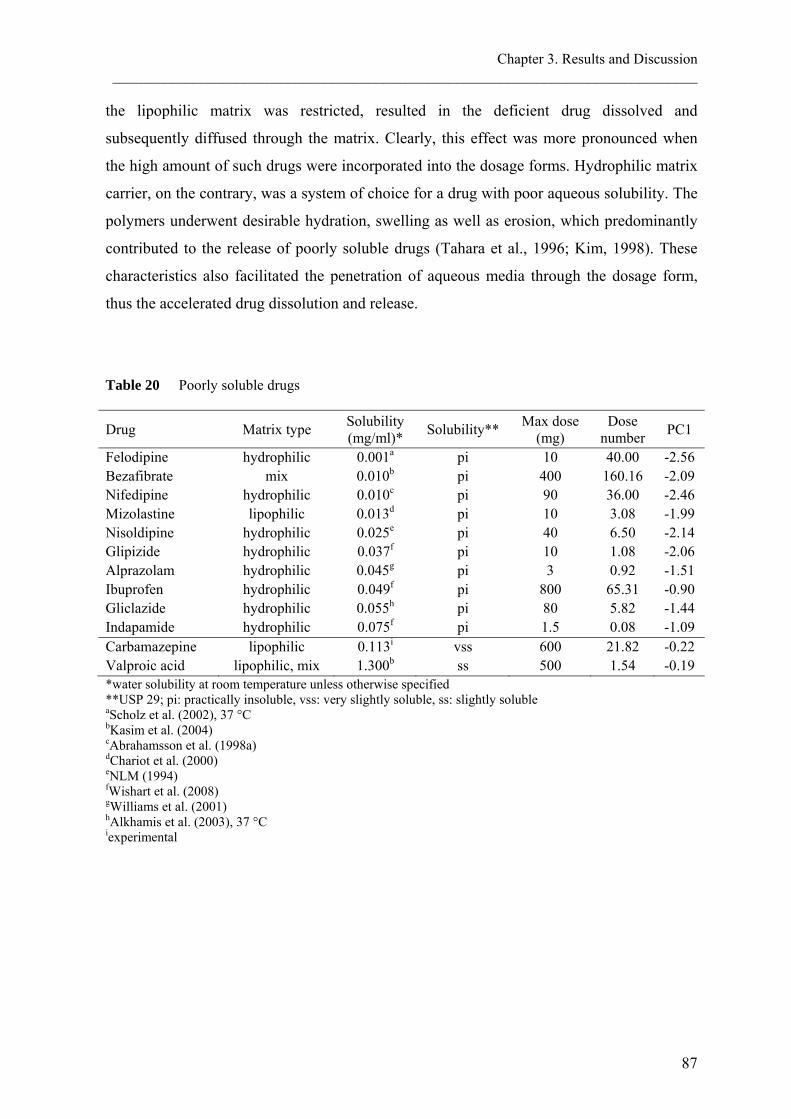
Chapter 3. Results and Discussion ________________________________________________________________________________
87
the lipophilic matrix was restricted, resulted in the deficient drug dissolved and
subsequently diffused through the matrix. Clearly, this effect was more pronounced when
the high amount of such drugs were incorporated into the dosage forms. Hydrophilic matrix
carrier, on the contrary, was a system of choice for a drug with poor aqueous solubility. The
polymers underwent desirable hydration, swelling as well as erosion, which predominantly
contributed to the release of poorly soluble drugs (Tahara et al., 1996; Kim, 1998). These
characteristics also facilitated the penetration of aqueous media through the dosage form,
thus the accelerated drug dissolution and release.
Table 20 Poorly soluble drugs
Drug Matrix type Solubility (mg/ml)* Solubility** Max dose
(mg) Dose
number PC1
Felodipine hydrophilic 0.001a pi 10 40.00 -2.56 Bezafibrate mix 0.010b pi 400 160.16 -2.09 Nifedipine hydrophilic 0.010c pi 90 36.00 -2.46 Mizolastine lipophilic 0.013d pi 10 3.08 -1.99 Nisoldipine hydrophilic 0.025e pi 40 6.50 -2.14 Glipizide hydrophilic 0.037f pi 10 1.08 -2.06 Alprazolam hydrophilic 0.045g pi 3 0.92 -1.51 Ibuprofen hydrophilic 0.049f pi 800 65.31 -0.90 Gliclazide hydrophilic 0.055h pi 80 5.82 -1.44 Indapamide hydrophilic 0.075f pi 1.5 0.08 -1.09 Carbamazepine lipophilic 0.113i vss 600 21.82 -0.22 Valproic acid lipophilic, mix 1.300b ss 500 1.54 -0.19 *water solubility at room temperature unless otherwise specified **USP 29; pi: practically insoluble, vss: very slightly soluble, ss: slightly soluble aScholz et al. (2002), 37 °C bKasim et al. (2004) cAbrahamsson et al. (1998a) dChariot et al. (2000) eNLM (1994) fWishart et al. (2008) gWilliams et al. (2001) hAlkhamis et al. (2003), 37 °C iexperimental

Chapter 3. Results and Discussion ________________________________________________________________________________
88
Fig. 25 (a) Score plot and (b) loading plot of PC1 vs. PC2 after varimax rotation of 58 matrix
tablet samples and 9 properties, explaining 51.9% of the total variance; (■) hydrophilic-,
(□) lipophilic- and ( ) mix matrix systems. The majority of samples in group (1) were
hydrophilic matrices.
(a)
(b)
-3
-1.5
0
1.5
3
-3 -1.5 0 1.5
PC1
PC2
pKa
H-acceptors
Do
LogPt½ IR
PSA
Mw
Max dose
Solubility
-1
-0.5
0
0.5
1
-1 -0.5 0 0.5 1
PC1
PC2
1 2

Chapter 3. Results and Discussion ________________________________________________________________________________
89
Application of PCA model
Similar to the classification of single- vs. multiple-unit dosage forms, the values of PC1 that
define the location of the samples can be used for the suggestion of the matrix type. As
mentioned earlier, the dashed line in Fig. 25a clearly divided the group of the hydrophilic
matrices from the non-separated ones. Therefore, hydrophilic matrix is recommended for a
drug that has the PC1 score less than -0.75, or otherwise it can be formulated as either
system. For a given drug with known properties, PC1 are determined by the following
equation:
PC1 = 0.223Log(Solubility) - 0.191Log(Do) + 0.083(pKa) - 0.008(PSA)
- 0.002(Mw) - 0.067(LogP) - 0.031(H-bond acceptors)
+ 0.006(Max dose)1/2 - 0.019(t1/2 IR)1/2 + 0.175 (Eq. 5)
where the drug properties are substituted by their values.
3.3.3 Conclusion
While the maximum dose strength and the t1/2 IR of a drug were the most significant
properties for the classification of single- vs. multiple-unit dosage form, the solubility was a
key parameter for the selection of the matrix type. The single unit dosage form was
recommended when the dose strength was greater than 500 mg or when the t1/2 IR was
longer than 11 h. The hydrophilic matrix tablet was suggested when the aqueous solubility
of a drug was practically insoluble. Despite these factors, PC scores calculated by Eq. 3-5
offered the better classification of the dosage form and the matrix type, since all relevant
drug properties were employed.
The PCA technique provided possibility to classify type of the ER systems with respect to
their correspondence with the extracted model. The location of the samples depends on the
values of various variables, which were described in the new co-ordinate system. The PCA
model for the dosage form selection created from a quality data set would be beneficial to
formulation scientists in dosage form design, thus facilitate the successful of formulation
development.


4. SUMMARY
Chapter 4. Summary ________________________________________________________________________________
92
4.1 In vitro performance and dissolution robustness of bioequivalent
extended release solid oral dosage forms
The drug products are bioequivalent (BE) when their active ingredients in pharmaceutical
equivalents or pharmaceutical alternatives are available at the site of action with similar rate
and extent when administered at the same molar dose under similar conditions. A
discriminatory in vitro dissolution test should be able to demonstrate the similarity between
BE products as well as the dissimilarity between bioinequivalent products. The objective of
this study was to examine the performance of commercially available BE products in vitro
by performing release studies in various dissolution conditions and to evaluate the
discriminating ability of those test conditions. Compendial dissolution methods with minor
modification that mimic conditions in vivo were used to evaluate the performance of two
pentoxifylline BE products and three verapamil hydrochloride (HCl) BE products.
Upon contact with release media, the release profiles of the BE products were different in
most test conditions. Pentoxifylline released slower from hydroxyethyl cellulose (HEC)
matrix tablets when compared to that from Poly(ethyl acrylate-co-methyl methacrylate-co-
trimethylammonioethyl methacrylate chloride) (Eudragit RS/RL) tablets. The less
mechanical stress that the tablets encountered in vitro was responsible for the dissimilarity
of the two products. The release of verapamil HCl was in the following order: sodium
alginate/hydroxypropyl methylcellulose (HPMC) matrix tablets > ethylcellulose (EC)/
Poly(methacylic acid-co-ethyl acrylate) 1:1 (Eudragit L 100-55) coated pellets >
shellac/fumaric acid coated pellets. The latter was the most robust formulation. The
difference of BE verapamil HCl releases could be attributed to the high surface tension in
vitro, which led to the decreased drug release. Compendial in vitro dissolution methods used
in this study were not discriminating because they were unable to reflect the in vivo
behaviour of the products. The results of robustness test indicated potential factors
influencing the in vitro releases of both drugs. The simulation of in vivo osmolality, such as
the addition of sodium chloride into the standard dissolution media, and/or the optimization
of mechanical destructive force, by adjusting the agitation intensity or the addition of glass
beads, should be further investigated to obtain the discriminatory dissolution tests for
pentoxifylline extended release (ER) tablets. Likewise, the decreased mechanical destructive

Chapter 4. Summary ________________________________________________________________________________
93
force and surface tension should be considered for the dissolution studies of verapamil HCl
ER products.
4.2 Effect of sodium dodecyl sulphate on the in vitro dissolution of
extended release solid oral dosage forms
The goal of adding surfactants into dissolution media was to mimic the condition in vivo by
lowering surface tension. The drug release in this simulated media is, however, influenced
by the type of surfactant. In addition, the physicochemical properties of drugs, excipients
and the dosage forms also contribute to the release pattern. The purpose of this study was to
investigate the effect of sodium dodecyl sulphate (SDS) on the releases of drugs from
different ER dosage forms. The matrix tablets of verapamil HCl and diltiazem HCl were
robust to the addition of SDS. Their release patterns were unchanged because the
availability of water resulting from the lower surface tension did not have much effect on
the erosion rate of the polymer matrix. In contrast, this increase water availability facilitated
the release from coated pellets, as could be seen from the release of both drugs. There was
no effect of SDS on the drug release from osmotic tablet because the rate of water
penetration into the tablet, which controlled by the semi-permeable membrane, was
unchanged. The significantly increase solubility of carbamazepine (CBZ) outperformed the
effect of SDS on the drug release from different types of dosage form. Therefore, all
formulations of CBZ show the considerably increase drug release when SDS was added.
Another concern of adding ionic surfactant into dissolution medium is the cationic/anionic
interaction between the surfactant and the drug or other excipients. Pentoxifylline released
from matrix tablets composed of HEC, a nonionic matrix former, were unaffected by the
addition of SDS, an anionic surfactant. On the contrary, the decreased drug release was
observed when the matrix former was Eudragit RS/RL, a cationic polymer. Despite the
dissolution was performed in the similar surface tension as of SDS solution, the decreased
drug release was not seen when the nonionic surfactants, Tween 80 or Span 80, were added.
In conclusion, the effect of SDS on drug release could be attributed to many formulation
factors. Although the use of SDS is recommended for dissolution studies of several
products, the contributions of those factors as for example reported in this study should not
be disregarded.

Chapter 4. Summary ________________________________________________________________________________
94
4.3 Evaluation of drug properties for the selection of extended release
solid oral dosage form: Application of principal component analysis
Success of an ER formulation depends not only on the performance of the formulation, but
also the suitability of the chosen dosage form. The investigation of successful marketed ER
products could provide a valuable clue for formulation scientists to select a system over
another one for a particular drug. The objective of this study was: (1) to understand the
relationships between properties of drugs; such as solubility, maximum dose strength and
elimination half-life; and their available ER dosage forms, and (2) to establish a guide for
ER technology selection by the application of principal component analysis (PCA). The
classification of single- vs. multiple-unit dosage form and the carrier systems of matrix
tablets were examined. Significant properties distinguishing the dosage forms and matrix
types were investigated
While the maximum dose strength of a product and the elimination half-life of a drug as
immediate release formulation (t1/2 IR) were the most significant properties for the
classification of single- vs. multiple-unit dosage form, the solubility was a key parameter for
the selection of the matrix type. The single unit dosage form was recommended when the
dose strength was greater than 500 mg or when the t1/2 IR was longer than 11 h. The
hydrophilic matrix tablet was suggested when the aqueous solubility of a drug was
practically insoluble. Despite these factors, principal component scores calculated by Eq. 3-
5 offered the better classification of the dosage form and the matrix type, since all relevant
drug properties were employed.
The PCA technique provided a possibility to classify type of the ER systems with respect to
their correspondence with the extracted model. The location of the samples depends on the
values of various variables, which were described in the new co-ordinate system. The PCA
model for the dosage form selection created from a quality data set would be beneficial to
formulation scientists in dosage form design, thus facilitate the successful of formulation
development.

5. ZUSAMMENFASSUNG

Chapter 5. Zusammenfassung ________________________________________________________________________________
96
5.1 In-vitro-Performance und Robustheit der Freisetzung von
bioäquivalenten, retardiert freisetzenden, festen oralen
Arzneiformen
Arzneimittel sind bioäquivalent, wenn ihre Wirkstoffe in pharmazeutischen Äquivalenten
oder pharmazeutischen Alternativen am Wirkort mit ähnlicher Geschwindigkeit und in
ähnlichem Ausmaß verfügbar sind, wenn sie in der gleichen molaren Dosis und unter
ähnlichen Bedingungen appliziert werden. Ein diskriminierender In-vitro-Freisetzungstest
sollte in der Lage sein die Ähnlichkeit zwischen bioäquivalenten Arzneimittel zu zeigen
ebenso wie den Unterschied zwischen bioinäquivalenten Arzneimitteln. Ziel dieser Studie
war es, die Performance kommerziell verfügbarer, bioäquivalenter Arzneimittel in vitro
mittels der Durchführung von Freisetzungsstudien unter verschiedenen
Freisetzungsbedingungen zu untersuchen und die Unterscheidungsfähigkeit dieser
Testbedingungen zu bewerten. Es wurden leicht modifizierte Arzneibuch-
Freisetzungsmethoden benutzt, welche die In-vivo-Bedingungen imitieren, um die
Performance von zwei bioäquivalenten Pentoxifyllin-Produkten und drei bioäquivalenten
Verapamilhydrochlorid (HCl)-Produkten zu evaluieren.
Nach Kontakt mit dem Freigabemedium, waren die Freisetzungsprofile der bioäquivalenten
Produkte bei den meisten Testbedingungen unterschiedlich. Pentoxifyllin wurde langsamer
aus Hydroxyethylcellulose (HEC)-Matrixtabletten freigesetzt als aus Poly(ethylacrylat-co-
methyl-methacrylat-co-trimethylammonioethylmethacrylatchlorid) (Eudragit RS/RL)-
Tabletten. Die geringere mechanische Belastung, welcher die Tabletten in vitro ausgesetzt
waren, war für den Unterschied zwischen den beiden Produkten verantwortlich. Die
Freisetzung von Verapamil-HCl geschah in der Reihenfolge: Natriumalginat/Hydroxypropyl
methylcellulose (HPMC)-Matrixtabletten > Ethylcellulose (EC)/ Poly(methacylsäure-co-
ethylacrylat) 1:1 (Eudragit L 100-55)-überzogene Pellets > Schellack/Fumarsäure-
überzogene Pellets. Letztere war die robusteste Formulierung. Der Unterschied in der
Freisetzung der bioäquivalenten Verapamil-HCl-Produkte konnte der hohen
Oberflächenspannung in vitro zugeschrieben werden, welche zur verminderten
Arzneistofffreisetzung führte. Die in dieser Studie verwendeten Arzneibuch-
Freisetzungsmethoden waren nicht diskriminierend, weil sie das In-vivo-Verhalten der
Arzneimittel nicht widerspiegeln konnten. Die Ergebnisse des Robustheits-Tests wiesen auf

Chapter 5. Zusammenfassung ________________________________________________________________________________
97
potentielle Faktoren hin, welche die In-vitro-Freisetzung beider Arzneistoffe beeinflussen.
Die Simulation der In-vivo-Osmolalität, wie zum Beispiel die Zugabe von Natriumchlorid
zum Standardfreisetzungsmedium, und/oder die Optimierung der mechanischen
Zerstörungskraft durch Anpassung der Bewegungsintensität oder die Zugabe von
Glaskugeln, sollte weiter untersucht werden, um diskriminierende Freisetzungstests für
Pentoxifyllin-Retardtabletten zu erhalten. Desgleichen sollten die verminderte mechanische
Zerstörungskraft und die Oberflächenspannung für die Freisetzungsstudien von Verapamil-
HCl-Retardprodukten berücksichtigt werden.
5.2 Einfluss von Natriumdodecylsulfat auf die In-vitro-Freisetzung von
retardiert freisetzenden, festen, oralen Arzneiformen
Das Ziel der Zugabe von oberflächenaktiven Substanzen zum Freisetzungsmedium war es,
die Bedingungen in vivo durch das Absenken der Oberflächenspannung zu imitieren. Die
Arzneistofffreigabe in dieses nachgeahmte Medium wird jedoch von der Art des Netzmittels
beeinflusst. Zusätzlich tragen auch noch die physico-chemischen Eigenschaften der
Arzneistoffe, der Hilfsstoffe und der Arzneiformen zum Freisetzungsprofil bei. Die
Zielsetzung dieser Studie war es den Einfluss von Natriumdodecylsulfat (SDS) auf die
Freisetzung von Arzneistoffen aus verschiedenen Retardarzneiformen zu untersuchen. Die
Verapamil-HCl- und die Diltiazem-HCl-Matrixtabletten waren robust bei Zugabe von SDS.
Ihre Freisetzungsprofile waren unverändert, weil die aus der niedrigeren
Oberflächenspannung resultierende Verfügbarkeit von Wasser keine große Auswirkung auf
die Erosionsgeschwindigkeit der Polymermatrix hatte. Im Gegensatz dazu förderte diese
gestiegene Verfügbarkeit von Wasser die Freisetzung beider Arzneistoffe aus überzogenen
Pellets. Es gab keinen Effekt von SDS auf die Freisetzung aus osmotischen Tabletten, weil
die Geschwindigkeit der Wasser-Penetration in die Tablette, welche durch die
semipermeable Membran kontrolliert wird, unverändert blieb. Der signifikante Anstieg der
Löslichkeit von Carbamazepin (CBZ) übertraf den Effekt von SDS auf die
Arzneistofffreisetzung verschiedener Arzneiformen. Deshalb zeigten alle CBZ-
Formulierungen einen wesentlichen Anstieg der Arzneistofffreisetzung bei SDS-
Anwesenheit. Bei der Zugabe von ionischen Tensiden zum Freisetzungsmedium ist zudem
die mögliche kationische/anionische Wechselwirkung zwischen Tensid und Arzneistoff
oder anderen Hilfsstoffen zu berücksichtigen. Die Pentoxifyllin-Freisetzung aus

Chapter 5. Zusammenfassung ________________________________________________________________________________
98
Matrixtabletten bestehend aus dem nichtionischen Matrixbildner HEC wurde durch die
Zugabe des anionischen Tensids SDS nicht beeinflusst. Hingegen wurde eine verminderte
Arzneistofffreisetzung beobachtet, wenn der Matrixbildner das kationische Polymer
Eudragit RS/RL war. Trotzdem die Freisetzungstests bei ähnlicher Oberflächenspannung
wie der der SDS-Lösung durchgeführt wurden, war diese verminderte
Arzneistofffreisetzung nicht beobachtbar, wenn die nichtionischen Tenside Tween 80 oder
Span 80 zugesetzt wurden. Schließlich konnte der Einfluss von SDS auf die
Arzneistofffreisetzung vielen Formulierungsparametern zugeschrieben werden. Obwohl die
Verwendung von SDS für die Freisetzungsstudien verschiedener Produkte empfohlen wird,
sollte die Kontribution dieser Parameter, wie sie zum Beispiel in dieser Untersuchung
dargestellt wurden, nicht unberücksichtigt bleiben.
5.3 Bewertung der Arzneistoffeigenschaften in Hinblick auf die Auswahl
geeigneter fester oraler Darreichungsformen mit verlängerter
Wirkstofffreisetzung: Anwendung der Hauptkomponentenanalyse
Der Erfolg einer Formulierung mit verlängerter Wirkstofffreigabe hängt nicht nur von den
Eigenschaften der Formulierung selbst, sondern auch von der gewählten Darreichungsform
ab. Die Untersuchung von bereits auf dem Markt erhältlichen Produkten könnte daher
wertvolle Hinweise für die Auswahl der geeignetsten Darreichungsform für einen
bestimmten Arzneistoff liefern. Die Zielstellungen dieser Arbeit waren: (1) Die
Abhängigkeiten zwischen bestimmten Eigenschaften eines Arzneistoffs (z.B. Löslichkeit,
maximaler therapeutischer Einzeldosis und Eliminationshalbwertszeit) und dessen bereits
verfügbaren Darreichungsformen mit verlängerter Wirkstofffreisetzung zu verstehen. (2)
Durch Anwendung der Hauptkomponentenanalyse („principal component analysis“, PCA)
eine Entscheidungshilfe für die Auswahl der geeignetsten Technologie zur Erzielung der
gewünschten verlängerten Wirkstofffreisetzung zu entwickeln. Dabei wurden Einzeldosis-
und Mehrdosissysteme, sowie der Einfluss verschiedener Tablettenmatrizes unter
besonderer Betrachtung ihrer wichtigsten Eigenschaften untersucht.
Während die Arzneistoffdosis und die Eliminationshalbwertszeit des Arzneistoffs die
wichtigsten Eigenschaften für die Auswahl zwischen Einzeldosis- und Mehrdosissystem
waren, wurde die Löslichkeit des Arzneistoffs als wichtigster Parameter für die Auswahl des

Chapter 5. Zusammenfassung ________________________________________________________________________________
99
Matrixtyps identifiziert. Einzeldosissysteme wurden vor allem dann empfohlen, wenn die
Einzeldosis über 500 mg lag oder die Eliminationshalbwertszeit 11 h überschritt. Eine
hydrophile Tablettenmatrix wurde dann empfohlen, wenn die Wasserlöslichkeit des
Arzneistoffs sehr schlecht war. Ungeachtet dieser Aussagen, lieferte die PCA eine noch
bessere Möglichkeit zur Auswahl der Darreichungsform und des Matrixtyps, da alle
relevanten Arzneistoffeigenschaften berücksichtigt wurden.
Auf Basis des erstellten Modells und seiner Variablen konnten die untersuchten Proben in
ein Koordinatensystem eingeordnet werden. Dieses kann nun dazu dienen, eine
wahrscheinlich erfolgreiche Formulierungsstrategie für einen beliebigen Arzneistoff zu
ermitteln.

6. REFERENCES

Chapter 6. References ________________________________________________________________________________
102
Abrahamsson, B., Albery, T., Eriksson, A., Gustafsson, I. and Sjöberg, M., 2004. Food effects on tablet disintegration. European Journal of Pharmaceutical Sciences, 22(2-3), p. 165-172.
Abrahamsson, B., Alpsten, M., Bake, B., Jonsson, U.E., Eriksson-Lepkowska, M. and Larsson, A., 1998a. Drug absorption from nifedipine hydrophilic matrix extended-release (ER) tablet-comparison with an osmotic pump tablet and effect of food. Journal of Controlled Release, 52(3), p. 301-310.
Abrahamsson, B., Alpsten, M., Bake, B., Larsson, A. and Sjogren, J., 1998b. In vitro and in vivo erosion of two different hydrophilic gel matrix tablets. European Journal of Pharmaceutics and Biopharmaceutics, 46(1), p. 69-75.
Abrahamsson, B., Johansson, D., Torstensson, A. and Wingstrand, K., 1994. Evaluation of Solubilizers in the Drug Release Testing of Hydrophilic Matrix Extended-Release Tablets of Felodipine. Pharmaceutical Research, 11(8), p. 1093-1097.
Abrahamsson, B., Roos, K. and Sjögren, J., 1999. Investigation of Prandial Effects on Hydrophilic Matrix Tablets. Drug Development and Industrial Pharmacy, 25(6), p. 765-771.
Al-Behaisi, S., Antal, I., Morovjan, G., Szunyog, J., Drabant, S., Marton, S. and Klebovich, I., 2002. In vitro simulation of food effect on dissolution of deramciclane film-coated tablets and correlation with in vivo data in healthy volunteers. European Journal of Pharmaceutical Sciences, 15(2), p. 157-162.
Alkhamis, K.A., Allaboun, H. and Al-Momani, W.Y., 2003. Study of the solubilization of gliclazide by aqueous micellar solutions. Journal of Pharmaceutical Sciences, 92(4), p. 839-846.
Amidon, G.L., Lennernäs, H., Shah, V.P. and Crison, J.R., 1995. A Theoretical Basis for a Biopharmaceutic Drug Classification: The Correlation of in Vitro Drug Product Dissolution and in Vivo Bioavailability. Pharmaceutical Research, 12(3), p. 413-420.
Anon, 1995. Giving erythromycin by mouth. Drug and Therapeutics Bulletin, 33(10), p. 77-79.
Azarmi, S., Roa, W. and Löbenberg, R., 2007. Current perspectives in dissolution testing of conventional and novel dosage forms. International Journal of Pharmaceutics, 328(1), p. 12-21.
Balakrishnan, A., Rege, B.D., Amidon, G.L. and Polli, J.E., 2004. Surfactant-mediated dissolution: contributions of solubility enhancement and relatively low micelle diffusivity. Journal of Pharmaceutical Sciences, 93(8), p. 2064-2075.
Bodmeier, R., 1997. Tableting of coated pellets. European Journal of Pharmaceutics and Biopharmaceutics, 43(1), p. 1-8.
Bodmeier, R., Guo, X., Sarabia, R.E. and Skultety, P.F., 1996. The influence of buffer species and strength on diltiazem HCl release from beads coated with the aqueous cationic polymer dispersions, Eudragit RS, RL 30D. Pharmaceutical Research, 13(1), p. 52-56.
Bussemer, T., Otto, I. and Bodmeier, R., 2001. Pulsatile drug-delivery systems. Critical Reviews in Therapeutic Drug Carrier Systems, 18(5), p. 433-458.
Chariot, M., Lewis, G. and Montel, J., Slow-release pharmaceutical formulations containing mizolastine. U.S. Patent 6,165,507, Dec 26, 2000.
Chevalier, E., Viana, M., Artaud, A., Chomette, L., Haddouchi, S., Devidts, G. and Chulia, D., 2009. Comparison of Three Dissolution Apparatuses for Testing Calcium Phosphate Pellets used as Ibuprofen Delivery Systems. AAPS PharmSciTech, 10(2), p. 597-605.
Chapter 6. References ________________________________________________________________________________
103
Colombo, P., Santi, P., Bettini, R., Brazel, C.S. and Peppas, N.A., 2000. Drug release from swelling-controlled systems. In D.L. Wise, ed. Handbook of pharmaceutical controlled release technology. New York: CRC Press. p. 183-210.
Cotroneo, A., Dugo, G., Favretto, L. and Favretto, L.G., 1990. Variations in essential oils of mandarine related to processing and ripening. Journal of Chemometrics, 4(5), p. 379-385.
Crevoisier, C., Zerr, P., Calvi-Gries, F. and Nilsen, T., 2003. Effects of food on the pharmacokinetics of levodopa in a dual-release formulation. European Journal of Pharmaceutics and Biopharmaceutics, 55(1), p. 71-76.
Crison, J.R., 1999. Developing Dissolution Tests for Modified Release Dosage Forms: General Considerations. Dissolution Technologies, [Online] 6 (1), Available at: http://www.dissolutiontech.com/DTresour/299articles/299Crison.htm [25 June 2008]
Cui, Y., Zhang, Y. and Tang, X., 2008. In vitro and in vivo evaluation of ofloxacin sustained release pellets. International Journal of Pharmaceutics, 360(1-2), p. 47-52.
Custodio, J.M., Wu, C.-Y. and Benet, L.Z., 2008. Predicting drug disposition, absorption/elimination/transporter interplay and the role of food on drug absorption. Advanced Drug Delivery Reviews, 60(6), p. 717-733.
Das, N.G. and Das, S.K., 2003. Controlled-Release of Oral Dosage Forms. Formulation, Fill & Finish, [Online] 10-16. Available at: http://pharmtech.findpharma.com/pharmtech/data/articlestandard//pharmtech/232003/59302/article.pdf [07 November 2008]
Davis, S.S., Hardy, J.G., Taylor, M.J., Whalley, D.R. and Wilson, C.G., 1984. The effect of food on the gastrointestinal transit of pellets and an osmotic device (Osmet). International Journal of Pharmaceutics, 21(3), p. 331-340.
de Haan, P. and Lerk, C.F., 1984. Oral controlled release dosage forms. A review. Pharmacy World and Science, 6(2), p. 57-67.
De Jaeghere, F., Allémann, E., Kubel, F., Galli, B., Cozens, R., Doelker, E. and Gurny, R., 2000. Oral bioavailability of a poorly water soluble HIV-1 protease inhibitor incorporated into pH-sensitive particles: effect of the particle size and nutritional state. Journal of Controlled Release, 68(2), p. 291-298.
Dennis, A.B., Timmins, P. and Hodsdon, A.C., Nefazodone dosage form. U.S. Patent 6,143,325, Nov 7, 2000.
Devane, J.G., Kelly, J.G. and Geoghegan, B., 1990. Pharmacokinetic and in-vitro characteristics of sustained release verapamil products. Drug Development and Industrial Pharmacy 16(7), p. 1233 - 1248.
Digenis, G.A., 1994. In vivo behavior of multiparticulate versus single-unit dose formulations. In I. Ghebre-Sellassie, ed. Multiparticulate oral drug delivery. New York: Informa Health Care. p. 333-356.
Dressman, J.B., Amidon, G.L., Reppas, C. and Shah, V.P., 1998. Dissolution testing as a prognostic tool for oral drug absorption: immediate release dosage forms. Pharmaceutical Research, 15(1), p. 11-22.
Dressman, J.B., Berardi, R.R., Dermentzoglou, L.C., Russell, T.L., Schmaltz, S.P., Barnett, J.L. and Jarvenpaa, K.M., 1990. Upper gastrointestinal (GI) pH in young, healthy men and women. Pharmaceutical Research, 7(7), p. 756-761.
Dressman, J.B. and Reppas, C., 2000. In vitro-in vivo correlations for lipophilic, poorly water-soluble drugs. European Journal of Pharmaceutical Sciences, 11(Supplement 2), p. S73-S80.

Chapter 6. References ________________________________________________________________________________
104
Dürig, T. and Fassihi, R., 2000. Evaluation of floating and sticking extended release delivery systems: an unconventional dissolution test. Journal of Controlled Release, 67(1), p. 37-44.
Edsbacker, S., Larsson, P. and Wollmer, P., 2002. Gut delivery of budesonide, a locally active corticosteroid, from plain and controlled-release capsules. European Journal of Gastroenterology and Hepatology, 14(12), p. 1357-1362.
El-Arini, S.K., Shiu, G.K. and Skelly, J.P., 1989. An in vitro study of possible food-drug interactions of the controlled-release propranolol products. International Journal of Pharmaceutics, 55(1), p. 25-30.
El-Arini, S.K., Shiu, G.K. and Skelly, J.P., 1990. Theophylline-Controlled Release Preparations and Fatty Food: An in Vitro Study Using the Rotating Dialysis Cell Method. Pharmaceutical Research, 7(11), p. 1134-1140.
El-Gazayerly, O.N., 2003. Release of pentoxifylline from xanthan gum matrix tablets. Drug Development and Industrial Pharmacy 29(2), p. 241-246.
El Yazaji, M., Battas, O., Agoub, M., Moussaoui, D., Gutknecht, C., Dalery, J., d'Amato, T. and Saoud, M., 2002. Validity of the depressive dimension extracted from principal component analysis of the PANSS in drug-free patients with schizophrenia. Schizophrenia Research, 56(1-2), p. 121-127.
Emami, J., 2006. In vitro - in vivo correlation: from theory to applications. J Pharm Pharm Sci, 9(2), p. 169-189.
Esbensen, K.H., Guyot, D., Westad, F. and Houmøller, L.P., 2006. Multivariate data analysis - In practice : An introduction to multivariate data analysis and experimental design. 5th ed. Oslo, Norway: Multivariate Data Analysis.
Evans, D.F., Pye, G., Bramley, R., Clark, A.G., Dyson, T.J. and Hardcastle, J.D., 1988. Measurement of gastrointestinal pH profiles in normal ambulant human subjects. Gut, 29(8), p. 1035-1041.
Fabre, L.F. and Timmer, C.J., 2003. Effects of food on the bioavailability of gepirone from extended-release tablets in humans: results of two open-label crossover studies. Current Therapeutic Research, 64(8), p. 580-598.
Fachinformation, Rote Liste® Service GmbH, Frankfurt/Main, FachInfo-Service. [Online] Available at: http://www.fachinfo.de [15 May 2011]
Fadda, H.M., Mohamed, M.A.M. and Basit, A.W., 2008. Impairment of the in vitro drug release behaviour of oral modified release preparations in the presence of alcohol. International Journal of Pharmaceutics, 360(1-2), p. 171-176.
Food and Drug Administration (FDA), Center for Drug Evaluation and Research (CDER), 1997. Guidance for Industry, SUPAC-MR: Modified Release Solid Oral Dosage Forms.
Food and Drug Administration (FDA), Center for Drug Evaluation and Research (CDER), 2000. Guidance for Industry, Waiver of In Vivo Bioavailability and Bioequivalence Studies for Immediate-Release Solid Oral Dosage Forms Based on a Biopharmaceutics Classification System.
Food and Drug Administration (FDA), Center for Drug Evaluation and Research (CDER), 2003. Guidance for Industry, Bioavailability and Bioequivalence Studies for Orally Administered Drug Products - General Considerations.
Food and Drug Administration (FDA), Center for Drug Evaluation and Research (CDER), 2005a. Alert for Healthcare Professionals Hydromorphone Hydrochloride Extende-Release Capsules. [Online] Available at: http://www.fda.gov/Cder/Drug/InfoSheets/HCP/hydromorphoneHCP.htm [16 September 2008]

Chapter 6. References ________________________________________________________________________________
105
Food and Drug Administration (FDA), Center for Drug Evaluation and Research (CDER), Office of Generic Drugs, Division of Bioequivalence, 2005b. Dissolution Methods. [Online] Available at: http://www.accessdata.fda.gov/scripts/cder/dissolution/ [6 April 2011]
Food and Drug Administration (FDA), Center for Drug Evaluation and Research (CDER), 2007. Guidance for Industry: Individual Product Bioequivalence Recommendations; 29 May 2007. [Online] Available at: http://www.fda.gov/cder/guidance/bioequivalence [17 September 2008]
Flament, M.P., Dupont, G., Leterme, P., Farah, N. and Gayot, A., 2004. Development of 400 microm pellets by extrusion-spheronization: application with Gelucire 50/02 to produce a "sprinkle" form. Drug Development and Industrial Pharmacy 30(1), p. 43-51.
Galia, E., Nicolaides, E., Horter, D., Lobenberg, R., Reppas, C. and Dressman, J.B., 1998. Evaluation of various dissolution media for predicting in vivo performance of class I and II drugs. Pharmaceutical Research, 15(5), p. 698-705.
Ganesan, M., Pal, T.K. and Jayakumar, M., 2003. Pellet coating by air suspension technique using a mini-model coating unit. Bollettino Chimico Farmaceutico, 142(7), p. 290-294.
Gouda, M.W., Babhair, S.A., Al-Angary, A.A., El-Hofy, S.A. and Mahrous, G.M., 1987. Effect of dosage form, food, and an anticholinergic drug on the bioavailability of sulphide. International Journal of Pharmaceutics, 37(3), p. 227-231.
Grundy, J.S., Anderson, K.E., Rogers, J.A. and Foster, R.T., 1997. Studies on dissolution testing of the nifedipine gastrointestinal therapeutic system. I. Description of a two-phase in vitro dissolution test. Journal of Controlled Release, 48(1), p. 1-8.
Grundy, J.S. and Foster, R.T., 1996. The nifedipine gastrointestinal therapeutic system (GITS). Evaluation of pharmaceutical, pharmacokinetic and pharmacological properties. Clinical Pharmacokinetics, 30(1), p. 28-51.
Gu, C.-H., Gandhi, R.B., Tay, L.K., Zhou, S. and Raghavan, K., 2004. Importance of using physiologically relevant volume of dissolution medium to correlate the oral exposure of formulations of BMS-480188 mesylate. International Journal of Pharmaceutics, 269(1), p. 195-202.
Gupta, S.K., Yih, B.M., Atkinson, L. and Longstreth, J., 1995. The effect of food, time of dosing, and body position on the pharmacokinetics and pharmacodynamics of verapamil and norverapamil. Journal of Clinical Pharmacology, 35(11), p. 1083-1093.
Halsas, M., Hietala, J., Veski, P., Jürjenson, H. and Marvola, M., 1999. Morning versus evening dosing of ibuprofen using conventional and time-controlled release formulations. International Journal of Pharmaceutics, 189(2), p. 179-185.
Hoffman, A., 1998. Pharmacodynamic aspects of sustained release preparations. Advanced Drug Delivery Reviews, 33(3), p. 185-199.
Hörter, D. and Dressman, J.B., 2001. Influence of physicochemical properties on dissolution of drugs in the gastrointestinal tract. Advanced Drug Delivery Reviews, 46(1-3), p. 75-87.
Hosny, E.A., El-Sayed, Y.M., Al-Meshal, M.A. and Al-Angary, A.A., 1994. Effect of food on bioavailability of bioadhesive-containing indomethacin tablets in dogs. International Journal of Pharmaceutics, 112(1), p. 87-91.
Hovi, T., Josefsson, K. and Renkonen, O.V., 1983. Erythromycin absorption in healthy volunteers from single and multiple doses of enteric-coated pellets and tablets. European Journal of Clinical Pharmacology, 25(2), p. 271-273.

Chapter 6. References ________________________________________________________________________________
106
Huang, H.P., Mehta, S.C., Radebaugh, G.W. and Fawzi, M.B., 1994. Mechanism of drug release from an acrylic polymer-wax matrix tablet. Journal of Pharmaceutical Sciences, 83(6), p. 795-797.
Ibekwe, V.C., Fadda, H.M., McConnell, E.L., Khela, M.K., Evans, D.F. and Basit, A.W., 2008. Interplay Between Intestinal pH, Transit Time and Feed Status on the In Vivo Performance of pH Responsive Ileo-Colonic Release Systems. Pharmaceutical Research, 25(8), p. 1828-1835.
Ishibashi, T., Hatano, H., Kobayashi, M., Mizobe, M. and Yoshino, H., 1999. In vivo drug release behavior in dogs from a new colon-targeted delivery system. J Control Release, 57(1), p. 45-53.
Janssen, N., Jantratid, E. and Dressman, J.B., 2008. Influence of biorelevant media composition on the dissolution behavior of glibenclamide tablets. Proceedings of the 6th World Meeting on Pharmaceutics, Biopharmaceutics and Pharmaceutical Technology, Barcelona, Spain, 7-10 April 2008.
Jantratid, E., De Maio, V., Ronda, E., Mattavelli, V., Vertzoni, M. and Dressman, J.B., 2009. Application of biorelevant dissolution tests to the prediction of in vivo performance of diclofenac sodium from an oral modified-release pellet dosage form. European Journal of Pharmaceutical Sciences, 37(3-4), p. 434-441.
Jantratid, E., Janssen, N., Reppas, C. and Dressman, J.B., 2008. Dissolution Media Simulating Conditions in the Proximal Human Gastrointestinal Tract: An Update. Pharmaceutical Research,
Jolliffe, I.T., 2002. Principal component analysis. 2nd ed. New York: Springer. Jong Woo, K., Byung Hun, L., Michael, J.S., Hsin-Lu, C. and Matthew, N., 2001.
Application of decision-tree induction techniques to personalized advertisements on internet storefronts. International Journal of Electronic Commerce, 5(3), p. 45-62.
Jorgensen, E.D. and Bhagwat, D., 1998. Development of dissolution tests for oral extended-release products. Pharmaceutical Science & Technology Today, 1(3), p. 128-135.
Joshi, A., Pund, S., Nivsarkar, M., Vasu, K. and Shishoo, C., 2008. Dissolution test for site-specific release isoniazid pellets in USP apparatus 3 (reciprocating cylinder): Optimization using response surface methodology. European Journal of Pharmaceutics and Biopharmaceutics, 69(2), p. 769-775.
Kachrimanis, K., Nikolakakis, I. and Malamataris, S., 2000. Spherical crystal agglomeration of ibuprofen by the solvent-change technique in presence of methacrylic polymers. Journal of Pharmaceutical Sciences, 89(2), p. 250-259.
Kaiser, H.F., 1958. The varimax criterion for analytic rotation in factor analysis. Psychometrika, 23(3), p. 187-200.
Kalantzi, L., Goumas, K., Kalioras, V., Abrahamsson, B., Dressman, J.B. and Reppas, C., 2006. Characterization of the human upper gastrointestinal contents under conditions simulating bioavailability/bioequivalence studies. Pharmaceutical Research, 23(1), p. 165-176.
Karalis, V., Tsantili-Kakoulidou, A. and Macheras, P., 2002. Multivariate statistics of disposition pharmacokinetic parameters for structurally unrelated drugs used in therapeutics. Pharmaceutical Research, 19(12), p. 1827-1834.
Kasim, N.A., Whitehouse, M., Ramachandran, C., Bermejo, M., Lennernas, H., Hussain, A.S., Junginger, H.E., Stavchansky, S.A., Midha, K.K., Shah, V.P. and Amidon, G.L., 2004. Molecular Properties of WHO Essential Drugs and Provisional Biopharmaceutical Classification. Mol. Pharmaceutics, 1(1), p. 85-96.
Kenyon, C.J., Hooper, G., Tierney, D., Butler, J., Devane, J. and Wilding, I.R., 1995. The effect of food on the gastrointestinal transit and systemic absorption of naproxen

Chapter 6. References ________________________________________________________________________________
107
from a novel sustained release formulation. Journal of Controlled Release, 34(1), p. 31-36.
Khan, M.Z.I., 1996. Dissolution testing for sustained or controlled release oral dosage forms and correlation with in vivo data: Challenges and opportunities. International Journal of Pharmaceutics, 140(2), p. 131-143.
Kim, C.J., 1998. Effects of drug solubility, drug loading, and polymer molecular weight on drug release from Polyox tablets. Drug Development and Industrial Pharmacy 24(7), p. 645-651.
Knoch, A., 1994. Cryopelletization. In I. Ghebre-Sellassie, ed. Multiparticulate oral drug delivery. New York: Informa Health Care. p. 35-50.
Kostewicz, E.S., Brauns, U., Becker, R. and Dressman, J.B., 2002. Forecasting the oral absorption behavior of poorly soluble weak bases using solubility and dissolution studies in biorelevant media. Pharmaceutical Research, 19(3), p. 345-349.
Koziara, J., So, J. and Agarwal, N., 2006. The effect of ethanol on semipermeable cellulose acetate-based membranes. Proceedings of the AAPS Annual Meeting and Exposition, San Antonio, TX, USA, 29 October-2 November 2006.
Krämer, J. and Blume, H., 1994. Biopharmaceutical aspects of multiparticulates. In I. Ghebre-Sellassie, ed. Multiparticulate oral drug delivery. New York: Informa Health Care. p. 307-332.
Krauze, A. and Zalewski, R.I., 1991. Classification of honeys by principal component analysis on the basis of chemical and physical parameters. Zeitschrift für Lebensmitteluntersuchung und -Forschung A, 192(1), p. 19-23.
Kshirsagar, R., Rao, A., Malaviya, N. and Jinturkar, K., An extended release composition of Levetiracetam, which exhibits no adverse food effect. WO 2008/062446 A2, May 29, 2008
Lecaillon, J.B., Massias, P., Schoeller, J.P. and Abadie, F., 1985. Influence of food on the absorption of metoprolol administered as an Oros drug delivery system to man. British Journal of Clinical Pharmacology, 19(Suppl 2), p. 245S–249S.
Lecomte, F., 2004. pH-Sensitive polymer blends used as coating materials in controlled drug delivery systems. PhD. Freie Universität Berlin.
Lecomte, F., Siepmann, J., Walther, M., MacRae, R.J. and Bodmeier, R., 2004. Polymer blends used for the coating of multiparticulates: comparison of aqueous and organic coating techniques. Pharmaceutical Research, 21(5), p. 882-890.
Levina, M., Vuong, H. and Rajabi-Siahboomi, A.R., 2007. The influence of hydro-alcoholic media on hypromellose matrix systems. Drug Development and Industrial Pharmacy 33(10), p. 1125-1134.
Li, S.P., Felt, R.G., Di Paolo, L.C., Huang, M.Y. and Williams, R.O., 3rd, 1995. Development and in vitro-in vivo evaluation of a multiparticulate sustained release formulation of diltiazem. Pharmaceutical Research, 12(9), p. 1338-1342.
Lindahl, A., Ungell, A.L., Knutson, L. and Lennernas, H., 1997. Characterization of fluids from the stomach and proximal jejunum in men and women. Pharmaceutical Research, 14(4), p. 497-502.
Lipper, R.A., 1999. E pluribus product. Modern Drug Discovery, 2(1), p. 55-60. Macheras, P., Koupparis, M. and Antimisiaris, S., 1989. An in vitro model for exploring CR
theophylline-milk fat interactions. International Journal of Pharmaceutics, 54(2), p. 123-130.
Marchais, H., Cayzeele, G., Legendre, J.-Y., Skiba, M. and Arnaud, P., 2003. Cross-linking of hard gelatin carbamazepine capsules: effect of dissolution conditions on in vitro drug release. European Journal of Pharmaceutical Sciences, 19(2-3), p. 129-132.

Chapter 6. References ________________________________________________________________________________
108
Marvola, M., Kannikoski, A., Aito, H. and Nykänen, S., 1989. The effect of food on gastrointestinal transit and drug absorption of a multiparticular sustained-release verapamil formulation. International Journal of Pharmaceutics, 53(2), p. 145-155.
Maturu, P.K., Prasad, V.K., Worsley, W.N., Shiu, G.K. and Skelly, J.P., 1986. Influence of a high fat breakfast on the bioavailability of theophylline controlled-release formulations: an in vitro demonstration of an in vivo observation. Journal of Pharmaceutical Sciences, 75(12), p. 1205-1206.
McGinity, J.W., 1997. Aqueous polymeric coatings for pharmaceutical dosage forms. 2nd ed. New York: Informa Health Care.
Melia, C.D., 1991. Hydrophilic matrix sustained release systems based on polysaccharide carriers. Critical Reviews in Therapeutic Drug Carrier Systems, 8(4), p. 395-421.
Meyer, R.J. and Hussain, A.S., 2005. Awareness Topic: Mitigating the Risks of Ethanol Induced Dose Dumping from Oral Sustained/Controlled Release Dosage Forms. FDA’s ACPS Meeting, October 2005.
Missaghi, S. and Fassihi, R., 2005. Release characterization of dimenhydrinate from an eroding and swelling matrix: selection of appropriate dissolution apparatus. International Journal of Pharmaceutics, 293(1-2), p. 35-42.
Modi, N.B., Wang, B., Hu, W.T. and Gupta, S.K., 2000. Effect of food on the pharmacokinetics of osmotic controlled-release methylphenidate HCl in healthy subjects. Biopharmaceutics and Drug Disposition, 21(1), p. 23-31.
Mohamad, A. and Dashevsky, A., 2007. In vitro and in vivo performance of a multiparticulate pulsatile drug delivery system. Drug Development and Industrial Pharmacy 33(2), p. 113-119.
Moore, J.W. and Flanner, H.H., 1996. Mathematical comparison of dissolution profiles. Pharmaceutical Technology, 20(6), p. 64-74.
Morita, R., Honda, R. and Takahashi, Y., 2003. Development of a new dissolution test method for an oral controlled release preparation, the PVA swelling controlled release system (SCRS). Journal of Controlled Release, 90(1), p. 109-117.
Mu, X., Tobyn, M.J. and Staniforth, J.N., 2003. Development and evaluation of bio-dissolution systems capable of detecting the food effect on a polysaccharide-based matrix system. Journal of Controlled Release, 93(3), p. 309-318.
Muir, D.D., Banks, J.M. and Hunter, E.A., 1996. Sensory properties of cheddar cheese: Effect of starter type and adjunct. International Dairy Journal, 6(4), p. 407-423.
Nastruzzi, C., Cortesi, R., Esposito, E., Genovesi, A., Spadoni, A., Vecchio, C. and Menegatti, E., 2000. Influence of formulation and process parameters on pellet production by powder layering technique. AAPS PharmSciTech, 1(2), p. E9.
National Center for Biotechnology Information, National Library of Medicine, Bethesda, MD (US), 1993. PubChem; 7 October 2008. [Online] Available at: http://pubchem.ncbi.nlm.nih.gov [14 December 2008]
Nicolaides, E., Galia, E., Efthymiopoulos, C., Dressman, J.B. and Reppas, C., 1999. Forecasting the in vivo performance of four low solubility drugs from their in vitro dissolution data. Pharmaceutical Research, 16(12), p. 1876-1882.
National Library of Medicine, Bethesda, MD (US), 1994. ChemIDplus; 10 March 2008. [Online] Available at: http://chem.sis.nlm.nih.gov/chemidplus [17 January 2009]
Oh, D.M., Curl, R.L. and Amidon, G.L., 1993. Estimating the fraction dose absorbed from suspensions of poorly soluble compounds in humans: a mathematical model. Pharmaceutical Research, 10(2), p. 264-270.
OptoIQ, 2007. Pill drill. [Online] Available at: http://www.optoiq.com/index/lasers-for-manufacturing/display/ils-article-display/305167/articles/industrial-laser-solutions/volume-22/issue-9/features/cover-story/pill-drill.html [18 May 2011]

Chapter 6. References ________________________________________________________________________________
109
Ordonez, C., 2006. Comparing association rules and decision trees for disease prediction. HIKM '06, Proceedings of the international workshop on Healthcare information and knowledge management, Arlington, Virginia, USA,
Panchagnula, R., Rungta, S., Sancheti, P., Agrawal, S. and Kaul, C.L., 2003. In vitro evaluation of food effect on the bioavailability of rifampicin from antituberculosis fixed dose combination formulations. Il Farmaco, 58(11), p. 1099-1103.
Paradkar, A.R., Maheshwari, M., Ketkar, A.R. and Chauhan, B., 2003. Preparation and evaluation of ibuprofen beads by melt solidification technique. International Journal of Pharmaceutics, 255(1-2), p. 33-42.
Park, S.-H. and Choi, H.-K., 2006. The effects of surfactants on the dissolution profiles of poorly water-soluble acidic drugs. International Journal of Pharmaceutics, 321(1-2), p. 35-41.
Pearnchob, N. and Bodmeier, R., 2003. Dry polymer powder coating and comparison with conventional liquid-based coatings for Eudragit) RS, ethylcellulose and shellac. European Journal of Pharmaceutics and Biopharmaceutics, 56(3), p. 363-369.
Pedersen, B.L., Mullertz, A., Brondsted, H. and Kristensen, H.G., 2000. A comparison of the solubility of danazol in human and simulated gastrointestinal fluids. Pharmaceutical Research, 17(7), p. 891-894.
Persson, E.M., Gustafsson, A.S., Carlsson, A.S., Nilsson, R.G., Knutson, L., Forsell, P., Hanisch, G., Lennernas, H. and Abrahamsson, B., 2005. The effects of food on the dissolution of poorly soluble drugs in human and in model small intestinal fluids. Pharmaceutical Research, 22(12), p. 2141-2151.
Petroni, A. and Braglia, M., 2000. Vendor selection using principal component analysis. The Journal of Supply Chain Management, 36(2), p. 63-69.
Pillay, V. and Fassihi, R., 1998. Evaluation and comparison of dissolution data derived from different modified release dosage forms: an alternative method. Journal of Controlled Release, 55(1), p. 45-55.
Porter, C.J.H. and Charman, W.N., 2001. In vitro assessment of oral lipid based formulations. Advanced Drug Delivery Reviews, 50(Supplement 1), p. S127-S147.
Price, J.M., Davis, S.S., Sparrow, R.A. and Wilding, I.R., 1993. The effect of meal composition on the gastrocolonic response: implications for drug delivery to the colon. Pharmaceutical Research, 10(5), p. 722-726.
Quinlan, J.R., 1986. Induction of decision trees. Machine Learning, 1(1), p. 81-106. Quinlan, J.R., 1992. C4.5: Programs for machine learning. San Mateo, CA: Morgan
Kaufmann. Qureshi, S.A., 2006. Developing discriminatory drug dissolution tests and profiles: some
thoughts for consideration on the concept and its interpretation. Dissolution Technologies, [Online] 13 (4), 18-23. Available at: http://www.dissolutiontech.com/DTresour/BackIssuefldr/BackIssuesfrmst.html [18 April 2008]
Reza, M.S., Quadir, M.A. and Haider, S.S., 2003. Comparative evaluation of plastic, hydrophobic and hydrophilic polymers as matrices for controlled-release drug delivery. J Pharm Pharm Sci, 6(2), p. 282-291.
Roberts, M., Cespi, M., Ford, J.L., Dyas, A.M., Downing, J., Martini, L.G. and Crowley, P.J., 2007. Influence of ethanol on aspirin release from hypromellose matrices. International Journal of Pharmaceutics, 332(1-2), p. 31-37.
Rohrs, B.R., 2001. Dissolution method development for poorly soluble compounds. Dissolution Technologies, [Online] 8 (3), 6-10. Available at: http://www.dissolutiontech.com/DTresour/BackIssuefldr/BackIssuesfrmst.html [10 April 2011]

Chapter 6. References ________________________________________________________________________________
110
Royce, A., Li, S., Weaver, M. and Shah, U., 2004. In vivo and in vitro evaluation of three controlled release principles of 6-N-cyclohexyl-2'-O-methyladenosine. Journal of Controlled Release, 97(1), p. 79-90.
Schiller, C., Fröhlich, C.P., Giessmann, T., Siegmund, W., Mönnikes, H., Hosten, N. and Weitschies, W., 2005. Intestinal fluid volumes and transit of dosage forms as assessed by magnetic resonance imaging. Alimentary Pharmacology and Therapeutics, 22(10), p. 971-979.
Scholz, A., Abrahamsson, B., Diebold, S.M., Kostewicz, E., Polentarutti, B.I., Ungell, A.L. and Dressman, J.B., 2002. Influence of hydrodynamics and particle size on the absorption of felodipine in labradors. Pharmaceutical Research, 19(1), p. 42-46.
Schug, B.S., Brendel, E., Wolf, D., Wonnemann, M., Wargenau, M. and Blume, H.H., 2002a. Formulation-dependent food effects demonstrated for nifedipine modified-release preparations marketed in the European Union. European Journal of Pharmaceutical Sciences, 15(3), p. 279-285.
Schug, B.S., Brendel, E., Wonnemann, M., Wolf, D., Wargenau, M., Dingler, A. and Blume, H., 2002b. Dosage form-related food interaction observed in a marketed once-daily nifedipine formulation after a high-fat American breakfast. European Journal of Clinical Pharmacology, 58(2), p. 119-125.
Shah, V.P., Konecny, J.J., Everett, R.L., McCullough, B., Noorizadeh, A.C. and Skelly, J.P., 1989. In Vitro Dissolution Profile of Water-Insoluble Drug Dosage Forms in the Presence of Surfactants. Pharmaceutical Research, 6(7), p. 612-618.
Shameem, M., Katori, N., Aoyagi, N. and Kojima, S., 1995. Oral solid controlled release dosage forms: role of GI-mechanical destructive forces and colonic release in drug absorption under fasted and fed conditions in humans. Pharmaceutical Research, 12(7), p. 1049-1054.
Siepmann, J. and Peppas, N.A., 2001. Modeling of drug release from delivery systems based on hydroxypropyl methylcellulose (HPMC). Adv Drug Deliv Rev, 48(2-3), p. 139-157.
Siewert, M., Dressman, J., Brown, C.K. and Shah, V.P., 2003. FIP/AAPS guidelines to dissolution/in vitro release testing of novel/special dosage forms. AAPS PharmSciTech, 4(1), p. E7.
Skinner, G.W., Harcum, W.W. and Dürig, T., 2002. Versatility of NATROSOL® hydroxyethylcellulose in controlled release matrix systems. Hercules Pharmaceutical Technology Report, [Online] Available at: http://www.herc.com/aqualon/product_data/ptr/ptr017.pdf [9 February 2009]
Slonim, D.K., 2002. From patterns to pathways: gene expression data analysis comes of age. Nature Genetics, 32 Suppl p. 502-508.
Soh, S.-C. and Abdullah, M., 2007. Determination of volatile organic compounds pollution sources in malaysian drinking water using multivariate analysis. Environmental Monitoring and Assessment, 124(1), p. 39-50.
Steiner, K. and Bodmeier, R., 2007. Influence of drug and core material on drug release from extended release reservoir pellets. Proceedings of the AAPS Annual Meeting and Exposition, San Diego, CA, USA, 11-15 November 2007.
Stevens, R.E., Limsakun, T., Evans, G. and Mason, D.H., Jr., 1998. Controlled, multidose, pharmacokinetic evaluation of two extended-release carbamazepine formulations (Carbatrol and Tegretol-XR). Journal of Pharmaceutical Sciences, 87(12), p. 1531-1534.
Steward, P.A., 1995. Review of Pharmaceutical Controlled Release Methods and Devices. [Online] Available at: http://www.initium.demon.co.uk/rel_nf.htm [11 November 2008]

Chapter 6. References ________________________________________________________________________________
111
Streubel, A., Siepmann, J., Dashevsky, A. and Bodmeier, R., 2000. pH-independent release of a weakly basic drug from water-insoluble and -soluble matrix tablets. Journal of Controlled Release, 67(1), p. 101-110.
Sunesen, V.H., Pedersen, B.L., Kristensen, H.G. and Mullertz, A., 2005. In vivo in vitro correlations for a poorly soluble drug, danazol, using the flow-through dissolution method with biorelevant dissolution media. European Journal of Pharmaceutical Sciences, 24(4), p. 305-313.
Tahara, K., Yamamoto, K. and Nishihata, T., 1996. Application of model-independent and model analysis for the investigation of effect of drug solubility on its release rate from hydroxypropyl methylcellulose sustained release tablets. International Journal of Pharmaceutics, 133(1-2), p. 17-27.
Tarvainen, M., Sutinen, R., Somppi, M., Paronen, P. and Poso, A., 2001. Predicting plasticization efficiency from three-dimensional molecular structure of a polymer plasticizer. Pharmaceutical Research, 18(12), p. 1760-1766.
TenHoor, C.N., Bakatselou, V. and Dressman, J., 1991. Solubility of mefenamic acid under simulated fed- and fasted-state conditions. Pharmaceutical Research, 8(9), p. 1203-1205.
Tho, I., Anderssen, E., Dyrstad, K., Kleinebudde, P. and Sande, S.A., 2002. Quantum chemical descriptors in the formulation of pectin pellets produced by extrusion/spheronisation. European Journal of Pharmaceutical Sciences, 16(3), p. 143-149.
Thombre, A.G., 2005. Assessment of the feasibility of oral controlled release in an exploratory development setting. Drug Discov Today, 10(17), p. 1159-1166.
Tiwari, S.B. and Rajabi-Siahboomi, A.R., 2008. Extended-Release Oral Drug Delivery Technologies: Monolithic Matrix Systems. In K.K. Jain, ed. Drug Delivery Systems. NJ, USA: Springer. p. 217-243.
Uppoor, V.R.S., 2001. Regulatory perspectives on in vitro (dissolution)/in vivo (bioavailability) correlations. Journal of Controlled Release, 72(1-3), p. 127-132.
The United States Pharmacopeia, USP 29, 2006. United States Pharmacopeial Convention Inc., Rockville, MD.
van den Berg, G., van Steveninck, F., Gubbens-Stibbe, J.M., Schoemaker, H.C., de Boer, A.G. and Cohen, A.F., 1990. Influence of food on the bioavailability of metoprolol from an OROS system; a study in healthy volunteers. European Journal of Clinical Pharmacology, 39(3), p. 315-316.
Velchik, M.G., Reynolds, J.C. and Alavi, A., 1989. The effect of meal energy content on gastric emptying. Journal of Nuclear Medicine, 30(6), p. 1106-1110.
Verma, R.K. and Garg, S., 2001. Current status of drug delivery technologies and future directions. Pharmaceutical Technology On-Line, [Online] 25 (2), 1-14. Available at: http://www.pharmanet.com.br/pdf/drugdelivery.pdf [12 November 2008]
Verma, R.K., Krishna, D.M. and Garg, S., 2002. Formulation aspects in the development of osmotically controlled oral drug delivery systems. J Control Release, 79(1-3), p. 7-27.
Vertzoni, M., Dressman, J., Butler, J., Hempenstall, J. and Reppas, C., 2005. Simulation of fasting gastric conditions and its importance for the in vivo dissolution of lipophilic compounds. European Journal of Pharmaceutics and Biopharmaceutics, 60(3), p. 413-417.
Walden, M., Nicholls, F.A., Smith, K.J. and Tucker, G.T., 2007. The effect of ethanol on the release of opioids from oral prolonged-release preparations. Drug Development and Industrial Pharmacy 33(10), p. 1101-1111.

Chapter 6. References ________________________________________________________________________________
112
Wei, H. and Löbenberg, R., 2006. Biorelevant dissolution media as a predictive tool for glyburide a class II drug. European Journal of Pharmaceutical Sciences, 29(1), p. 45-52.
Welling, P.G., 1996. Effects of food on drug absorption. Annual Review of Nutrition, 16 p. 383-415.
Wen, H. and Park, K., 2010. Oral controlled release formulation design and drug delivery: Theory to practice. New Jersey: John Wiley and Sons, Inc.
Williams, R.O., Sykora, M.A. and Mahaguna, V., 2001. Method to recover a lipophilic drug from hydroxypropyl methylcellulose matrix tablets. AAPS PharmSciTech, 2(2), p. E8.
Wishart, D.S., Knox, C., Guo, A.C., Cheng, D., Shrivastava, S., Tzur, D., Gautam, B. and Hassanali, M., 2008. DrugBank: a knowledgebase for drugs, drug actions and drug targets. Nucleic Acids Research, 36(Database issue), p. D901-906.
Witten, I.H. and Frank, E., 2005. Data mining: Practical machine learning tools and techniques. 2nd ed. San Francisco, CA: Morgan Kaufmann.
Zhao, F., Malayev, V., Rao, V. and Hussain, M., 2004. Effect of sodium lauryl sulfate in dissolution media on dissolution of hard gelatin capsule shells. Pharmaceutical Research, 21(1), p. 144-148.
Zoeller, T. and Klein, S., 2007. Simplified biorelevant media for screening dissolution performance of poorly soluble drugs. Dissolution Technologies, [Online] 14 (4), 8-13. Available at: http://www.dissolutiontech.com/DTresour/BackIssuefldr/BackIssuesfrmst.html [2 September 2008]

7. PUBLICATIONS & PRESENTATIONS RESULTING FROM THIS WORK

Chapter 7. Publications & Presentations Resulting from This Work ________________________________________________________________________________
114
7.1 Publications
Raiwa, A. and Bodmeier, R. In vitro performance and dissolution robustness of
bioequivalent extended release solid oral dosage forms. in preparation.
Raiwa, A. and Bodmeier, R. Effect of sodium dodecyl sulphate on the in vitro dissolution of
extended release solid oral dosage forms. in preparation.
Raiwa, A. and Bodmeier, R. Evaluation of drug properties for the selection of extended
release solid oral dosage form: Application of principal component analysis. in preparation.
Raiwa, A. and Bodmeier, R. Effect of co-administered food on different dosage forms. in
preparation.
7.2 Presentations
Raiwa, A. and Bodmeier, R. Evaluation of molecular descriptors for the selection of
extended release dosage form. Proceedings of the 2006 AAPS Annual Meeting and
Exposition, AAPS, San Antonio, TX, USA, 29 October - 2 November 2006.
Raiwa, A. and Bodmeier, R. Comparison of the in-vitro dissolution profiles of commercially
available verapamil hydrochloride extended release formulations in various release media.
Proceedings of the 2007 AAPS Annual Meeting and Exposition, AAPS, San Diego, CA,
USA, 11 - 15 November 2007.
Raiwa, A. and Bodmeier, R. Multiparticulates or single units: Evaluation of drugs properties
for the selection of extended release dosage forms. Proceedings of the 2007 AAPS Annual
Meeting and Exposition, AAPS, San Diego, CA, USA, 11 - 15 November 2007.
Raiwa, A. and Bodmeier, R. Evaluation of drug properties for the selection of extended
release dosage form: Application of principal component analysis. Proceedings of the 6th
World Meeting on Pharmaceutics, Biopharmaceutics and Pharmaceutical Technology,
Barcelona, Spain, 7-10 April 2008.

8. CURRICULUM VITAE

Chapter 8. Curriculum Vitae ________________________________________________________________________________
116
For reasons of data protection,
the curriculum vitae is not included in the online version