PDCA cycle applied for Sustainable Management of Energy Efficiency Policy
www.sciedu.ca/ijhe International Journal of Higher Education Vol. 1, No. 2; 2012
Published by Sciedu Press 67 ISSN 1927-6044 E-ISSN 1927-6052
Applying the PDCA Cycle to the Complex Task of Teaching and Assessing Public Relations Writing
John E. Knight Ph.D.
Professor of Management and Statistics
University of Tennessee at Martin
229A Business Administration Building
Martin, Tennessee 38238, USA
Tel: 1-791-881-7351 E-mail: [email protected]
Sandra Allen M.A., M.B.A. (Corresponding author)
Associate Professor, Marketing Communication Department, Columbia College Chicago
600 South Michigan Avenue, Chicago, Illinois 60605, USA
Tel: 1-312-369-7600 E-mail: [email protected]
Received: March 20, 2012 Accepted: July 14, 2012 Online Published: July 20, 2012
doi:10.5430/ijhe.v1n2p67 URL: http://dx.doi.org/10.5430/ijhe.v1n2p67
Abstract
Teaching skills, knowledge and abilities appropriate for career-ready graduates and assessing learning are complex issues. Developing a valid and reliable approach is often by trial and error. Instead, the authors employed Deming’s PDCA Cycle of continuous improvement as a systematic procedure to incrementally move closer to their goal. This paper outlines a multiyear project where academics and public relations professionals collaborated to answer 4 questions: What are the basic SKAs for a career-ready graduate?; How to orient the pedagogy?; How to evaluate and assess student learning?; and, How to insure validity of the measurements?. The authors used a variety of qualitative and quantitative procedures to (a) gather knowledge and information from public relations professionals; (b) facilitate consensus on career-specific pedagogy; and (c) develop a repeatable and reliable rubric to measure students’ news release writing skills.
Keywords: Continuous quality improvement, PDCA Cycle, Rubric, Collaboration, Assessment, Six sigma, Public relations, News release writing
1. Introduction
Teaching and assessment of student learning are inherently complex tasks. If one’s goal is to effectively teach skills, knowledge and abilities (SKAs) mandated by a profession and then assess student learning appropriately, no definitive roadmap exists. However, Deming’s PDCA Cycle of Continuous Quality Improvement (CQI) provides a systematic method to incrementally progress toward the goal. This paper outlines a multiyear project based on the CQI approach. The CQI principles emphasize a step-by-step method, founded on regular, methodical evaluation of results and formulation of altered approaches with trial and re-evaluation. Following Deming’s PDCA Cycle, academics and public relations professionals collaborated to answer 4 questions: (1) What to teach? That is, what are the SKAs for a career-ready graduate?; (2) How to orient the pedagogy?; (3) How to evaluate and assess student learning?; and, (4) How to insure validity of the measurements?.
At the outset, the authors acknowledge the varied opinions on applying business-oriented methodologies to improving education (Matulich, Papp & Haytko, 2008; Bhulyan & Baghel, 2005; Stauffer, 2003). But in fact, there are compelling arguments that the application of CQI in industry is consistent with refining standards of teaching and learning in higher education (Chen, Li & Shady, 2010; Hughey, 2000; Weller & Weller, 1997; Stensassen, 1995). Some researchers believe the desired outcome of the CQI process in education is a college graduate suitable for employment (Coates, 2009; Hughes, 1991). Keiser, Lawrenz and Appleton (2004) stress the importance of aligning

www.sciedu.ca/ijhe International Journal of Higher Education Vol. 1, No. 2; 2012
Published by Sciedu Press 68 ISSN 1927-6044 E-ISSN 1927-6052
performance standards in-class with those expected in the given occupation. They write, “. . . the criteria used by instructors should be the industry standards.” (p. 182).
To identify key SKAs and define industry standards, the authors used the Delphi method to (a) gather knowledge and information from experts; (b) facilitate consensus on career-specific pedagogy; and (c) develop a rubric to measure students’ writing skills. The Delphi method was especially useful in facilitating consensus among instructors and between instructors and public relations professionals to identify an artifact – a news release written by the public relations studies student – consistent with industry-specific requirements. Stevens & Levi (2005) have done considerable research on rubrics as a systematic way to structure the pedagogy to meet learning outcomes consistent with particular expectations. In answering questions 2 and 3, the Delphi process enabled faculty and professionals to develop, revise, and refine a rubric aligned with the pedagogy, thus tying students’ success in the academic world to their career readiness. To address question 4, the authors incorporated statistical quality control principles and analysis to systematically reduce variances that contribute to measurement error in evaluating student’s work. Specifically, we employed the six sigma methodology to measure and reduce intra-rater and inter-rater variance of the rubric.
At year-end 2010, the global public relations industry employed about 60,000 people with fee income of at least $8.8 billion (Holmes, 2011). Public relations practitioners and educators agree: writing is fundamental to a student’s access to a public relations career. It is a student’s most marketable skill (Steel, 2008; McCleneghan, 2006). However, an exhaustive review of discipline-specific publications indicates only a handful of articles on the pedagogy (Cole & Corner, 2008; Alber-Morgan, Hessler & Konrad, 2007; Hardin & Pompper, 2004). Based on an extensive literature search, the authors found very little academic research directed at the evaluation of public relations writing (Gower & Cho, 2001; Curtin & Witherspoon, 1999), and none on the validation of rubrics to teach and assess students’ news release writing.
2. Literature review
In their highly regarded research article, Bhulyan and Baghel (2005) provide a comprehensive overview of the history and evolution of the CQI methodology. Initially a business philosophy, Shewhart first proposed the CQI approach in 1931 (Barron, n.d.). It is a process of constantly introducing small incremental changes in order to improve quality and/or efficiency. In the 1950s, one of Shewhart’s colleagues, William Edwards Deming (1986), adapted Shewhart’s four-phase, fact-based approach, subsequently known as Deming’s PDCA Cycle: Plan; Do; Check; Act. The PDCA cycle rests on the collection of facts and the analysis of objective data. Brown and Marshall’s (2008) define the four phases:
Plan = Define purpose, goals and objectives; Collect data.
Do = Identify needs; Propose change; Implement.
Check = Monitor, evaluate and analyze change; Compare old and new data.
Act = Adjust strategies for improvement; Refine and reinstitute.
Sometimes called a team involvement tool, the PDCA Cycle requires a commitment and “continuous conversations with as many stakeholders as possible. . . (it) is a constant process.” (National Council of Teachers of English and Council of Writing Program Administrators, 2008, p. 27). Other authors maintain those stakeholders include professionals and academics (Joshi, 2009; Birnbaum, 1988; Finkelstein,1984).
The Delphi method was first developed by Helmer (1977) for business research and development, and Kerr (2009) notes it has been used extensively in marketing and advertising. It also has been widely used in education (Cornish, 1977). In both business and academe, the Delphi method collects and distills input from a group of knowledgeable people by means of a series of questions interspersed with controlled opinion feedback (Adler & Ziglio, 1996). Conventionally, participants in the Delphi process rely on sequential responses to questions, from which to compile data and develop determinations (Yousuf, 2007; Fischer, 1978). The authors first used the Delphi method in collaboration between professionals and faculty to determine a career-specific artifact to teach professional-level writing skills (Allen & Knight, 2008).
Few academics would argue that teaching writing skills is a critical element of student preparation for professional employment. The National Commission on Writing (College Board, 2004) calls writing a threshold skill for both employment and promotion. Public relations professionals agree. In its seminal report, the Public Relations Society of America (PRSA, 1999) maintains public relations writing is an essential, discrete skill. Noted public relations
www.sciedu.ca/ijhe International Journal of Higher Education Vol. 1, No. 2; 2012
Published by Sciedu Press 69 ISSN 1927-6044 E-ISSN 1927-6052
educator Van Slyke (2006) calls the student’s ability to write a news release reflecting professional expectations the ticket to the dance.
In professional practice, the news release generates news, advances organizational goals and objectives, and capitalizes on formal communication principles (Rios, 2008; Tucker, Derelian & Rouner, 1997). In education, the news release is the time-honored convention combining critical thinking, writing and communication skills. Crafting the news release brings into practice basic news-writing skills which conform to conventional journalistic style. Writing the release involves several major activities, including generating and organizing ideas, translating those ideas into written form, and revising the written product (McMaster & Espin, 2007). Finch and Crunkilton (1999) suggest that curricula must simultaneously be justified by the profession, yet remain pedagogically focused.
Stevens and Levi (2005) agree. Collaborating to develop a rubric, they write, “(offers) an opportunity to discuss shared goals and teaching methodologies, and . . . evaluate and validate. . . grading practices” (p. 68). In many cases, educators in various venues have developed rubrics as a systematic way to specify what skills are needed along with suggested measurement guidelines to assess performance and learning, and give feedback to students (Smith, 2008;Yoshina & Harada, 2007; NCTE-WPA, 2008; Schneider, 2006; Rucker & Thomson, 2003; Nagy, et al. 2000). To be effective, Andrade (2005) cautions, rubrics must be valid, reliable and fair with a grading scale for each dimension so that assessment can be thorough and consistent. For Messick (1989) validity is an evaluative judgment resting on the integration of evidence and theory to support inferences based on test scores.
Finally, rubrics provide an essential framework of measurement and a quantitative baseline upon which suggestions for CQI can be made and then tested. To develop, determine, and test a rubric’s specifications and scoring procedures, McNamara (1996) stressed both the importance of a priori construct validity where the teaching modality focuses on identified skills from professionals and other sources, and a posterior construct validation that relates to empirical and statistical validation of the rubric. More significantly, McNamara suggests collecting information from experts to develop, determine and test the rubric’s specifications and scoring procedures.
The philosophy of CQI requires no less than valid and reliable measurements upon which improvements can be assessed. Validity requires identifying dimensions as targeted skills and their relevant weights as those students will need for future success (Allen & Knight, 2009). Some researchers suggest that the reliability of the rubric is also part of validation; others may disagree. But most researchers agree that the ability to reliably measure performance is critical to the rubric‘s acceptability.
As a method of developing a reliable measuring system, the six sigma philosophy enjoys widespread industrial importance. One of its sequential steps requires developing an “R and R” study -- repeatability (intra-rater reliability) and reproducibility (inter-rater reliability) study. In six sigma, the CQI efforts usually are directed toward reducing the variances in intra-rater reliability and inter-rater reliability.
Traditional statistical methods for assessing inter-rater and intra-rater reliability are discussed in various statistical texts including Neter, Wasserman, and Kutner (1985). An applied example of these procedures using goniometric measurements can be found in Ellaszlw, Young, Woodbury, and Fryday-Field (1994). The statistical analysis is rigorous and complex, and consequently difficult for non-statistical practitioners to follow. However the paper does focus on the differences in inter-rater and intra-rater components of total variance that describes reliability. Williams, Sanford, Statford, and Newman (1991) applied some of the techniques found in Ellaszlw, et. al., when the basic data measurements were more subjective, like those derived from grading written essays. The latter case found a less than desirable level of reliability (28.6% error in the total grade). Stellmack, et.al. (2009) found that that inter-rater and intra-rater agreement were low even with a carefully crafted rubric. Statistically, the model used rank order agreements between raters to develop rater agreements and disagreements, and finally developed Spearman rank-order correlation coefficients to judge reliability.
Thaler, Kazemi, and Huscher (2009) also attempted to validate a rubric that involved student writing using 10 categories with 6-point Likert scales. Inter-rater reliability using Spearman’s correlations ranged from .35 to .92 on the different scales while the intra-rater reliability was not assessed. Thus components of the relative variance from the two measurement errors were not analyzed. Additionally, the ordinal grading scales (Likert scales) assumed linearity along the scale for translation to mathematical evaluation. Shumate, et. al. (2007) examined the relation between the estimation of generalizability coefficients and the number of scale points in the rubric with the least bias occurring once scales reached twelve discrete points.

www.sciedu.ca/ijhe International Journal of Higher Education Vol. 1, No. 2; 2012
Published by Sciedu Press 70 ISSN 1927-6044 E-ISSN 1927-6052
The authors respect the work of earlier researchers, however, we submit that simpler methods can provide similar results. Knight, Allen, and Tracy (2010) outline more practical methods for a wider audience of academics who look to determine rubric reliability.
This paper presents a current picture of what’s possible when academics and professionals collaborate, which Inger (1993) calls a departure from the norm. The authors paraphrase Hughey (2000; p. 41): It is our belief that the quality of student learning in a given course is the function of the commitment of the faculty and professionals to the CQI process.
3. Background
This study took place at a private arts and media College with about 12, 000 students in the Midwestern United States. Its impetus was a full-bore review of the curriculum in the Marketing Communication department. Nearly 800 students major in Marketing Communication with declared concentrations in marketing, advertising or public relations studies. About 300 of these students are Public Relations Studies concentrates, and are required to complete PR Writing in the first or second semester of their matriculation. Depending on enrollment, there are between 10 and 14 sections of PR Writing each semester. Each section has a maximum of 15 students; most sections have 12.
Though numbers vary by semester, 6 adjunct faculty and 3 full-time faculty (N = 9) teach PR Writing and participated in this project, most in each of its 8 loops. All N = 9 faculty have experience as professional practitioners of public relations in agency, corporate or freelance roles.
Twenty-one professionals from 4 international public relations agencies participated in specific loops of the project. They did so with dedication and without compensation. Professional experience ranged from entry level to seasoned practitioners with more than 15 years’ experience.
Five academics in public relations studies at 3 institutions (other than College) provided information based on their knowledge and experience. Professional publications, certification standards, and academic journals also were a rich source of material.
Readers who are interested in the random selection process should know it wasn’t perfect, but it worked. In each loop, students’ names were redacted from all news releases. All news releases evaluated and assessed were randomly selected by a student aide working in the Marketing Communication department. The authors did not control for gender, ethnicity, and race as none of these demographics was considered germane to the study.
Year 1 of this multiyear project began in fall 2005. Though faculty intend their work to be an ongoing CQI process, this paper covers only its first 6 years.
4. Method
Chart 1 presents the development and validation process for career-specific pedagogy, a rubric that incorporates professional and academic input, and feedback and data analysis. It also illustrates the CQI process, the four phases of the PDCA Cycle, the Delphi method for reaching consensus, and the application of the six sigma method to establish the reliability of a teaching and assessment rubric.
Chart 1: 8 Steps in applying PDCA cycle to teaching and assessing a course
4.1 The Delphi method
The Delphi method (Adler & Ziglio, 1996) is useful in collecting and distilling knowledge from a group. Essentially, it is a process where participants systematically in 2 or more rounds express an opinion on a problem or issue. For round 1, the facilitator poses the question, and solicits input from each participant in turn. After each round, the facilitator collects the feedback and reports out to the group without identifying which of the participants voiced a particular opinion. Based on this feedback, the participants are encouraged to revise their responses during the next round. As the rounds continue, the differences become smaller, until there is group consensus. For readers who want more detailed information than what we have provided, the authors recommend those sources cited in this paper.
4.2 Six sigma method
Each step of the six sigma process helps to establish baselines. Improvement in the process examines future performance in comparison to a past reference point that is accurately and precisely measured. Diagram 1 illustrates how the CQI process is interwoven into developing a reliable measurement system (one step of six sigma process) for a teaching assessment rubric
Diagram 1: Generalized flow of development of measurement system for rubric

www.sciedu.ca/ijhe International Journal of Higher Education Vol. 1, No. 2; 2012
Published by Sciedu Press 71 ISSN 1927-6044 E-ISSN 1927-6052
The six sigma method two-trial process focuses on the weakest link in the system. In education, once the rubric and grading scale have been established, 7 to 12 papers are randomly selected from all papers in multiple sections where each section uses the same assessment rubric. In trial one, 2 or 3 instructors grade each paper (papers devoid of names and other identifiers to minimize bias and halo effects). Trial 1 grades then are recorded in a six sigma worksheet. Trial 2 begins after an adequate period of time has elapsed for the graders to forget their exact scoring on the papers. The same papers are graded again by the same set of instructors. Trial 2 grades are recorded to match grades from trial 1. For comparisons, statistical computations are then made. Typical procedures to determine statistical reliability are complicated. The authors’ calculations require only simple arithmetic.
5. Application and Results
5.1 Loop1: Identify SKAs and develop learning objectives requiring students to demonstrate career-related competencies
In fall 2005 N = 9 faculty gathered input from N = 5 academicians at N = 3 institutions and N = 8 practicing professionals; reviewed academic literature; and examined professional certification requirements from the Public Relations Society of America, the organization that accredits public relations professionals.
This material informed subsequent dialogue among faculty, and created disagreement on pedagogical implications. Robust discussions ensued; consensus seemed doubtful. To resolve the impasse, with one of the authors as facilitator the faculty employed the Delphi method to reach consensus regarding professionally-anchored pedagogy, the news release as an artifact, and learning objectives to provide students with the broad-range writing skills they need to be career-ready graduates.
5.2 Loop 2: Develop teaching and assessment rubric based on learning objectives
By fall 2006, students’ speculation on which instructors were easier graders buzzed around the department. Faculty took note, and agreed among themselves that students are entitled to consistent feedback and measurement of their news release writing regardless of the section or instructor who teaches them. Some faculty used rubrics, others did not. The strong voices favoring rubrics were persuasive.
Because of their business and industry experience, the authors were familiar with Deming’s process. They introduced to the faculty the PDCA Cycle, and its inherent CQI principles. To their credit, faculty adopted the process but few realized at the time the practical effect their commitment would have. Initially, the group’s only goal was to develop a common rubric for measuring students’ news release writing. But differences of opinion arose among faculty about what professional information and input should be incorporated into the rubric. For the second time, debates were resolved using the Delphi method.
In its first iteration, the rubric used a simple binomial, yes/no standard for evaluating five broadly defined categories describing acceptable news releases (Appendix A). In fact, the scale was only an acceptable/not acceptable rating of the writing. N = 8 faculty used this rubric as teaching and assessment tool, and discussed impressions and outcomes. As one faculty member said, “The rubric is a tool, just not a good tool.” Faculty agreed to refine the rubric, and added descriptors to its 5 categories. The binomial scale was retained.
5.3 Loop 3: Add accountability to rubric; establish benchmark for measurement
Loop 3 is step 1 of a two-test process to add accountability to the rubric. Test 1 establishes a benchmark as a point of reference to measure and evaluate student learning over time. Professional input is critical in this loop.
One hundred twenty-two students were enrolled in 8 sections of PR Writing in the subsequent semester. Students in each course wrote a news release on the same subject. The news releases were collected, and names of the students were redacted. A student aide then randomly selected 50% (N = 61) of their news releases for evaluation. A panel of 4 senior-level professionals from a prominent international public relations agency used the rubric to assess these N = 61 news releases. Data was collected and retained for subsequent analysis and comparison.
5.4 Loop 4: Measure improvement through longitudinal test against baseline
Loop 4 (step 2 of the two-test process) is a longitudinal test for learning outcomes. The next semester, news releases written by of N = 61 students (different from the N = 61 in Test 1) were randomly selected by another student aide. The same 4 professionals involved in step 1 used the same rubric to evaluate these new samples of student work.
When the results of the step 1 evaluation were compared with step 2 results, there was a 10% increase year-over-year in the number of news releases rated acceptable work for entry-level public relations professionals. However, data also
www.sciedu.ca/ijhe International Journal of Higher Education Vol. 1, No. 2; 2012
Published by Sciedu Press 72 ISSN 1927-6044 E-ISSN 1927-6052
indicated that while 70% (N = 43) of the students wrote acceptable news releases, the remaining 30% (N =18) needed to further strengthen basic writing skills.
The faculty realized the rubric could not identify specific strengths and weaknesses in students’ work. In other words, the students seemed to be learning, but results could not be tied to the pedagogy.
5.5 Loop 5: Improve construct validity of rubric
Informed by results of the longitudinal test, faculty decided to add weights to the dimensions in each of the rubric’s 5 categories. To be a valid measurement of student learning on critical professional skills, both faculty and professionals must agree on those weights.
N = 7 professionals ranging from assistant account executive (an entry-level position) to senior vice president at a highly regarded, international public relations agency were solicited for their judgment on weights. To insure broad-based input from public relations professionals, the individuals involved in this Delphi exercise were not those who evaluated student-written news releases in Loops 3 and 4. With the co-author as facilitator, the professionals met face-to-face. Consensus was reached in 5 rounds.
N = 6 faculty also used the Delphi method to reach consensus on the rubric’s weights. However, the exercise was carried out by email because some of the participants are adjunct faculty and all were not available on the same day at the same time. Though considerably more cumbersome than a face-to-face meeting, the back-and-forth messages built an email thread that provided a rich source for later analysis. The exercise went 5 rounds.
Faculty weights differed markedly from the professionals’ results. Faculty weighting showed less dispersion between categories, perhaps recognizing the students’ need to develop multiple skills in all categories of news release writing. Though final convergence of the two groups was not as close as had been hoped, the differences did shed light on the areas that could be – and were -- resolved with a faculty-only Delphi session. The result was a rubric with weights and more clearly defined categories and definitions (Appendix B). Its accuracy as an assessment device remained in question.
5.6 Loop 6: Determine the ability of the rubric to differentiate between submissions
Construct validity depends on how well the rubric differentiates between students’ work. The assessment of any one paper on the average should be the same when graded by professionals and by academicians, but demonstrate differences between individual student papers. Additionally, by analyzing the variance of grades assigned to any one paper, the precision of the assessment can be gauged by paper or by the group that assesses the paper.
N = 8 faculty from each of 8 sections submitted to the author 5 news releases considered weak, or poorly written, and 5 news releases considered entry-level work (N = 80). Students’ names were redacted. Ten weak news releases and 10 strong releases (News release X and Y, respectively) were randomly selected and placed in 2 separate stacks. One news release was drawn at random from each stack (N = 2).
To develop statistical evidence that the rubric can be accurately and consistently administered by faculty and professionals, in separate sessions N = 6 faculty and N = 5 professionals used the rubric (Appendix B) to assess N = 2 news releases. Individuals in each group assigned points in the 5 categories based on their assessment of how the news release conformed to the rubric’s dimensions. Points were awarded in each category, and totaled for subsequent analysis (Table 1).
Table 1: Average results of assessing and awarding points to news releases X & Y
5.6.1 Two-way ANOVA to determine significant differences
The authors then used a two-way ANOVA (Table 2) to determine if graders using the rubric could detect significant differences between X and Y news releases; and if there were significant differences between how faculty and professionals awarded points to news releases X and Y.
Table 2: Results of two-way ANOVA: Faculty versus professional grades on news releases X and Y
We found statistically significant differences (p = .000) between the assessed quality of news release X and news release Y. However, no significant differences existed between the average actual grading practices of the professionals and the faculty (p =.910). Also, no interaction was found within the model (p =.734). Thus, we were confident by using the rubric we could differentiate the quality of the students’ news release writing. The results also indicated faculty and professionals were similar in their assessment of the quality of different papers.
ANOVA results further indicated that an individual student submitting a news release to an individual grader who uses the rubric would be subject to a precision of ± 14.54 points with 68% confidence, and approximately ± 29.32

www.sciedu.ca/ijhe International Journal of Higher Education Vol. 1, No. 2; 2012
Published by Sciedu Press 73 ISSN 1927-6044 E-ISSN 1927-6052
with 95% confidence given the overall standard deviation from the ANOVA of 14.54 (s = 14.54). While the average grading may be reasonably accurate, the precision in the estimates warranted additional analysis.
5.6.2 ANOVA: faculty-only grades
Because faculty ultimately will grade the students’ news releases, the authors performed an F test for equal variances using only the faculty grades. We found significant differences in the variances of the grades assigned to each paper (p = .044). The sample variance for news release X was 8.42 (s = 14.36) while the sample variance for news release Y was 3.05 (s = 5.20).
The data on the best estimates of the standard deviations of both news releases as graded solely by faculty indicate that the higher quality news release has a smaller standard deviation. News release Y with an average of 78 had a best estimate standard deviation of only 5.2, indicating a strong news release could be reasonable graded within ± 5.2 points (one letter grade) in 68% of the cases. However, news release X, the weaker news release, had a best estimate standard deviation of 14.36. Thus, a relatively weak news release would have a grading range of about 14.36 with 68% confidence (possibly 3 letter grades) depending on the faculty member. Clearly, more research was appropriate.
5.7 Loop 7: Establish inter-rater reliability of the rubric
To address inter-rater reliability, N = 9 faculty subsequently used the rubric to evaluate 1 news release written by 1 student. We used the Delphi method to discuss and defend high and low scores. Round 1 scores were averaged (Ave. = 85.89; S.D. = 6.57). In round 2, the N = 9 faculty again evaluated the same paper to determine greater uniformity. Round 2 scores were averaged (Ave. = 86.89; S.D. = 3.41). Consensus came in round 3.
The authors performed an F test for the differences in variances between rounds 1 and 2, and found a p value of .082, indicating a significant reduction in the variance of grading at the 10% level. The precision of the estimate of differences in reliability of grading was approximately ±6.8 with 95% confidence. The process established a baseline for CQI. N = 9 faculty continued to teach and assess students’ news release writing skills using the rubric even as refinement continued.
5.8 Loop 8: Test for intra-rater and inter-rater reliability
Loop 8 began with trial 1 of a two-test six sigma process. N = 8 faculty from each of 8 sections submitted to the author 5 news releases (N = 40). Students’ names were redacted A student aide randomly selected 8 news releases (N = 8). Three faculty (N = 3) then used the rubric to evaluate students’ writing skills of N = 8 news releases. Data was collected and recorded on the six sigma worksheet. News releases were placed in a file, where they remained undisturbed until trial 2 the following semester. In trial 2, the same N = 3 faculty again used the rubric to evaluate the same N = 8 students’ news releases.
Chart 2: Basic data from trial 1 and trial 2
Chart 2 is a typical standardized data collection worksheet showing basic data from multiple grading by multiple instructors in trials 1 and 2. The authors used this data to calculate an average and range for N = 8 news releases graded by N = 3 faculty. Then the average of the averages and the average of the ranges were calculated for each set of papers. The average of the average ranges (7.667) and the difference between the maximum and minimum score averages (3.9) are the key values for all calculations.
Readers are directed to Chart 2 for an example of how an upper control limit calculation (UCLR) is made by multiplying the overall average range (R) by a statistical constant D4 (values for D4 can be found in any standard quality control text). In this case, the result is an UCLR value of 23.4. As noted, if any of the individual ranges exceed this value, that particular paper by that particular instructor must be re-graded.
The typical six sigma calculation sheet (chart 3) is used to analyze measurement capability. First a tolerance is specified. Tolerance for rubrics is the difference between the highest and lowest scores possible. For example, in the 100 point scale the highest score is 100 while the lowest score is 0, therefore tolerance equals 100 (100 – 0).
Chart 3: Typical six sigma calculation sheet
The remaining six sigma calculations focus on measuring the repeatability (intra-rater reliability) and reproducibility (inter-rater reliability). The calculations are straightforward. The key values of R (7.667) and Xdiff (3.9) are calculated values from the six sigma worksheet (Chart 2: Basic data from trial 1 and trial 2). Values for the statistical constants K1 and K2 can be found in any standard quality control text (similar to D4), but the values generated by others who follow the same system understandably will generate different results. Thus, values must be interpreted

www.sciedu.ca/ijhe International Journal of Higher Education Vol. 1, No. 2; 2012
Published by Sciedu Press 74 ISSN 1927-6044 E-ISSN 1927-6052
considering the CQI feedback loop (Diagram 1: Generalized flow of development of measurement system for rubric).
5.8.1 Interpreting results
EV (which represents the rubric scaling) measures repeatability of the rubric. In this case, the tolerance is 34.96%. Therefore, the ability of the rubric as a measuring device is almost 35% of the range of potential scores to be administered (from 0 to 100). The EV measurement represents a 99% confidence interval for the standard deviation of the intra-rater reliability. If the 99% confidence interval of the intra-rater reliability is less than 10% of the tolerance, then any one paper submitted to a particular instructor twice (blind sampling) will result in scores that are extremely close. This goal is desirable when grading qualitative papers, although given the many subjective judgments that are continually made over time in grading many papers it is seldom achieved.
The AV measures reproducibility (inter-rater reliability) in traditional statistical analysis. Reproducibility is the ability of different operators (or graders) to “on the average” judge a series of diverse papers with the same overall score. The difference in the averages (Maximum minus Minimum) is a fundamental part of the calculation of AV. In this case the AV was 7.88 and was 7.88% of the tolerance. Thus, some of the rubric’s inability to precisely and reliably measure the news releases was due to differences in interpretation of the rubric by separate instructors. For example, in chart 2 the average score for Instructor 1 was 77.8 (the most lenient grader) while Instructor 3 had an average of 73.8 (the strictest grader). Naturally, the goal is “no differences” between the several instructors so the evaluation of a student’s work is fair regardless of which instructor grades the paper.
The %R & R indicates the total amount of intra-rater and inter-rater reliability in reference to the tolerance. Urdhwareshe (2006) discusses these ranges and their implications on measuring systems in his article on measurement systems analysis. The article explains that, in industry, %R & R should be less than 10% to be an acceptable measurement system while a value between 10 and 30% is marginally acceptable.
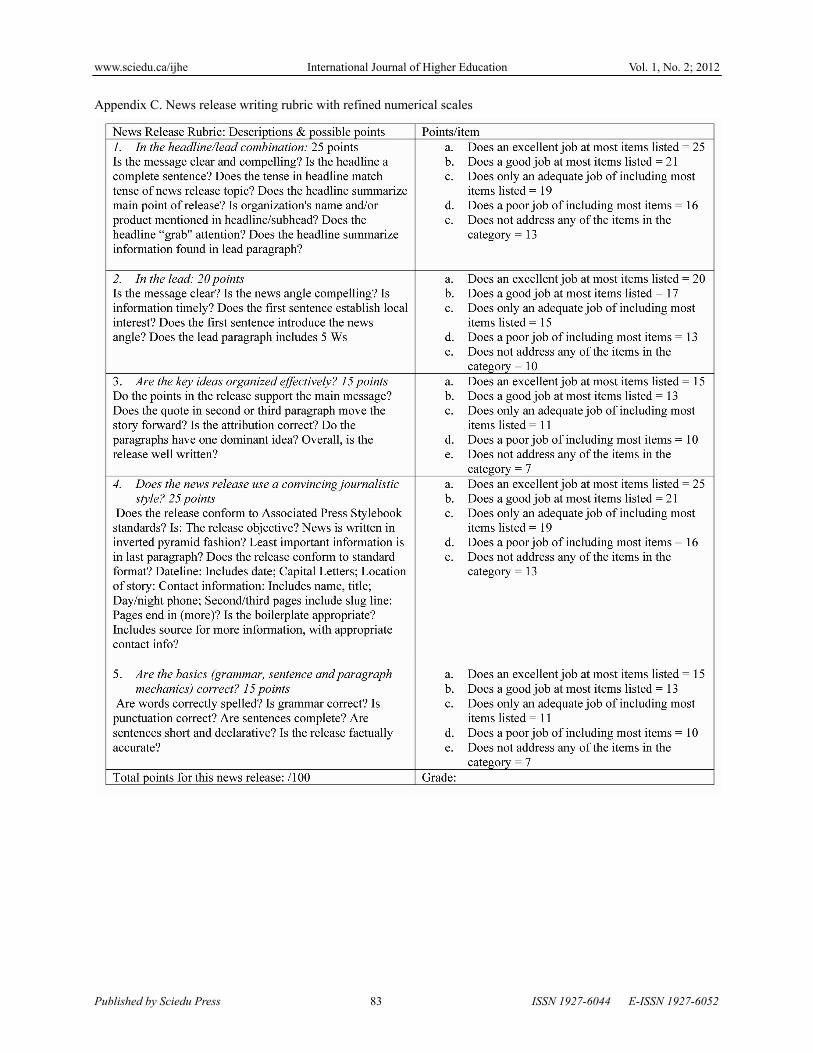
Faculty recently met to further refine the rubric, further refining the numerical scales in each category. (Appendix C). This rubric has yet to be validated.
6. Discussion
The PDCA Cycles outlined in this paper required 6 years and 9 faculty dedicated to students’ learning public relations writing skills, the basic SKAs of a career-ready graduate. Readers should know that without the determination of the faculty, this project would have died after Loop 1. It is to their credit that it didn’t.
6.1 What shall we teach?
Writing is fundamental. That we knew. Professionals consistently told us it is their top priority. Entry-level candidates with substandard writing skills rarely are offered a job. What we didn’t know for sure was pedagogical focus. But with research and study, academic and professional input, and collaboration with public relations professionals, we learned the answer: news release writing. With this wealth of information, the Delphi method enabled faculty to determine the pedagogy and learning objectives, including assignments for writing the news release.
6.2 How shall we teach news release writing?
Academic literature is replete with discussions about the efficacy of rubrics as a guideline for teaching students essential knowledge and skills. Fundamentally, faculty were of the opinion that students are entitled to fair, consistent measurements from any teacher in the multi-section PR Writing course. Using the Delphi method, faculty arrived at consensus regarding a rubric based on learning objectives to evaluate students’ news release writing skills and assess the consistency of the pedagogy. Experience is a great teacher. Over time, we realized if we could make the rubric more accountable for measuring students’ progress, we also would gain more reliable feedback on their learning. Not incidentally, we also would learn about the pedagogy, and how well it accomplished the objectives for learning.
6.3 How will we measure and assess student learning?
Answering this question required months of collaboration between faculty and professionals, all of whom were willing to participate, possibly because as one seasoned professional told us, “It’s your job to teach them (students). It’s our job to hire them.” The professionals were fearless in using the rubric to evaluate the news releases. They participated fully in the Delphi sessions, giving us their impressions and invaluable suggestions on areas of strength and weakness in the students’ news release writing, and the dimensions of the rubric.

www.sciedu.ca/ijhe International Journal of Higher Education Vol. 1, No. 2; 2012
Published by Sciedu Press 75 ISSN 1927-6044 E-ISSN 1927-6052
With data from separate evaluations of the news release by faculty and professional who used the rubric, the authors’ ANOVA determined the rubric could differentiate between submissions, and be accurately and consistently administered by both faculty and professionals. However, we learned the precision of the rubric could be improved.
Even so, researchers have recognized the subjectivity inherent in grading students’ writing assignments. It’s possible that higher and lower quality is simply easier to discern and evaluate, and there are many points in between. Faculty who evaluate weak news releases also may be reluctant to discourage (rather than encourage) student learning. From a student perspective, their grade would be highly teacher dependent. Additionally, the analysis indicated the possibility that the scale for grading each element of the rubric is subject to too much interpretation, especially when poor papers are evaluated. Continuous improvement meant adding a more defined numerical and descriptive scale to each dimension of the rubric.
As an additional result of our analysis, at College we decided to let students rewrite weak news releases, and submit for re-evaluation. We believe rewriting to improve quality may facilitate student learning and precise assessment. Not incidentally, as the news release improves, the variances in results measured by the rubric may diminish and provide students with a more valid and precise assessment of their work.
6.4 How can we be sure the measurements are valid?
Two considerations bear examination. Given the small sample size (N = 9), the results of the tests on inter-rarer reliability indicate that reliability improves when faculty examine the data, and then discuss and resolve differences in interpreting terms and applying standards. Readers should note, however, in actual practice and across many papers whose quality varies from strong to weak, the precision likely will not be as marked.
The results indicate that intra-rater reliability is a far greater problem than inter-rater reliability (34.96% to 7.88%). In the feedback loop for CQI, the key is to develop a better grading scale for each dimension of the rubric for more consistent scoring. For example, a CQI project might be to more precisely allocate the points assigned each scale on the rubric to more finely assess students’ work. Once revised, faculty can use the rubric to grade a new set of papers and analyze results.
The authors offer their perspective on %R&R ranges advanced by Urdhwareshe (2006). We believe goals for industry using precision measurement instruments such as calipers to measure physical quantities can be somewhat relaxed given the judgment required to assess student work. Regardless, in CQI each loop provides an updated baseline measurement upon which to assess the rubric.
7. Conclusion
Several conclusions are obvious: public relations writing is a fundamental skill for students’ success. Nearly all practitioners and every academic involved in our project endorse pedagogy that teaches students to write news releases. As evidence, each group dedicated countless hours to developing, refining and validating the teaching and assessment rubric for news release writing. The teamwork continues. In fact, faculty now are deep in a process to share their best practices in the pedagogy, using a Dropbox and storage on the Cloud for easier, faster, paperless collaboration.
When the authors launched the initial research project, our goals were straightforward. As Stensassen writes, “the Deming theory may. . .(put) the stress on the learning processes.” (p. 580). We wanted a collaborative, CQI approach that promised sound pedagogy to equip students with the SKAs they needed for career success. While some educators may question applying to academe business principles like the PDCA Cycle and the six sigma method, the authors’ experience substantiates their value as a solid framework for organizing and orchestrating research projects, and analyzing the results for CQI.
Collaboration between academics and professionals was essential. As Stevens and Levi (2005) state, the process of collaborating is neither complicated nor unduly time consuming, and the benefits are available to all participants. As the CQI loops unfolded, we were empowered to develop tighter standards, and a means of reliably evaluating student learning and measuring their progress.
Our approach rests on the basic assumptions that decisions should be based on facts made evident through the collection and analysis of data. These facts determine what to change, how, and whether or not the solution is effective. The methodology we used also easily differentiates between the sources of measurement error so that continuous improvement is focused on the weakest link identified in the measurement system.
One of the weak links may well be validity and reliability and their interrelationship to grading practices. Measurement error is a composite of both intra-grader repeatability and inter-grader reproducibility, a method for measuring differing contributions to variance. These aspects of intra-rater and inter-rater reliability point to future
www.sciedu.ca/ijhe International Journal of Higher Education Vol. 1, No. 2; 2012
Published by Sciedu Press 76 ISSN 1927-6044 E-ISSN 1927-6052
CQI loops to establish final validity of the rubric (Appendix C) using a simple quality control methodology to measure grade consistency.
The students’ voices have yet to be included in the author’s research. We leave outstanding for the future how faculty can approach students and assess their writing to avoid discouraging their learning. Not only is news release writing the so-called ticket to the dance, but students who don’t do well, or who become discouraged and drop out of writing courses, also abandon a career in public relations. Smith (2008) is among those educators who have researched best practices in approaches students find most helpful in assessing their written work. The authors intend to investigate these practices.
8. Afterword
As we prepared this manuscript for publication, Joseph “Joe” Marconi, one of the 9 faculty who participated in this project, died after a brief, fierce illness. We dedicate this paper to his memory.
References
Adler, M. & Ziglio, E. (1996). Gazing into the oracle. Bristol, PA: Jessica Kingsley Publishers. Retrieved Nov. 14, 2006 from http://www.iyte.edu.tr/~muratgunaydin/delphi.htm.
Alber-Morgan, S., Hessler, T., & Konrad, M. (2007). Teaching writing for keeps. Education and Treatment of Children, 30, 107 – 128. http://dx.doi.org/10.1353/etc.2007.0012.
Allen, S. & Knight, J.E. (2008). Development and validation processes for a Public Relations new release writing rubric. The Journal of Learning in Higher Education, 4 (2), 10 – 18. http://www.jwpress.com/JLHE/Issues/JLHE-Fall2008.pdf.
Allen, S. & Knight, J. (2009). A method for collaboratively developing and validating a rubric. International Journal for the Scholarship of Teaching and Learning, 3, (2). 2 – 16. http://academics.georgiasouthern.edu/ijsotl/v3n2/articles/PDFs/Article_AllenKnight.pdf.
Andrade, L. (2005). Teaching with rubrics: the good, the bad, and the ugly. College Teaching, 53, 27-30. Retrieved Nov. 28, 2006 http://dx.doi.org/10.3200/CTCH.53.1.27-31.
Barron, P. (n.d.). Deming Cycle-PDCA Cycle-Shewhart Cycle proven for continuous improvement.. Retrieved Feb. 15, 2007 from http://www.change-management-consultant.com/deming-cycle.html.
Bhulyan, N. & Baghel, A. (2005). An overview of continuous improvement: from the past to the present. Management Decision, 43 (5), 761 – 771. http://dx.doi.org/10.1108/0025174051059776.
Birnbaum, R. (1988). How colleges work: The cybernetics of academic organization and leadership. San Francisco: Jossey-Bass.
Brown, J.F. & Marshall, B.L. (2008). Continuous quality improvement: An effective strategy for improvement of program outcomes in a higher education setting. Nursing Education Perspective, (29), 4, 205 – 212. http://www.healthcare.gov/prevention/nphpphc/strategy/report.pdf.
Chen, J.C.; Li, Y., & Shady, B.D. (2010, February). From value stream mapping toward a lean/sigma continuous improvement process: an industrial case study. International Journal of Production Research, 48 (4), 1069-1086. Retrieved Feb. 2, 2008 http://dx.doi.org/10.1080/00207540802484911.
Coates, H. (2009). Development of the Australasian survey of student engagement (AUSSE). Higher Education, 60: 1-17. http://dx.doi.org/10.1007/s10734-009-9281-2.
Cole, R. & Corner, E. (2008). How are we doing? Time for research on teaching writing for public relations. TACTICS, 18-20.
College Board (2004). Writing? A ticket to work. . . or a ticket out?: A survey of business leaders. Retrieved Jan. 27, 2007 from www.writingcommission.org/prod_downloads/writingcom/writing-ticket-to-work.pdf.
Commission on Public Relations Education. (1999) A port of entry: Public relations education for the 21st century. Public Relations Society of America. Retrieved n.d. 2005 from http://www.prsa.org/SearchResults/view/6I1999/0/A_Port_of_Entry_Public_Relations_Education.
Cornish, E. (1977). The study of the future. Washington, D.C.: World Future Society. http://www.humansfuture.org/future_studies_methodologies.php.htm.
www.sciedu.ca/ijhe International Journal of Higher Education Vol. 1, No. 2; 2012
Published by Sciedu Press 77 ISSN 1927-6044 E-ISSN 1927-6052
Deming, W.E. (1986). Out of the crisis. Cambridge, MA: Massachusetts Institute of Technology, Center for Advanced Engineering Study.
Ellaszlw M., Young, L., Woodbury, G., & Fryday-Field, K. (1994, August). Statistical Methodology for the Concurrent Assessment of Interrater and Intrarater Reliability: Using Goniometric Measurements as an Example. Physical Therapy. 74, 8.
Finkelstein, M. J. (1984). The American academic profession: A synthesis of social scientific inquiry since World War II. Columbus, OH: Ohio State University Press.
Fischer, R.G. (1978). The Delphi Method: A description, review and criticism. Journal of Academic Librarianship, 4, (2), 64-70. Retrieved Jan. 14, 2006 from http://www.jasomerville.com/wp-content/uploads/2011/08/DelphiProcess080617b.pdf.
Hardin, M. & Pompper, D. (2004). Writing in the public relations curriculum; practitioner perceptions versus pedagogy. Public Relations Review, 30, 357-364. http://dx.doi.org/10.1016/j.pubrev.2004.05.007.
Helmer, O. (1977). Problems in futures research: Delphi and causal cross-impact analysis. Futures, 17-31. Retrieved Dec. 2, 2005 from http://www.sciencedirect.com/science/article/pii/0016328777900490.
Holmes, P. (2011). Global rankings 2011: Industry up 8 percent to around $8.8 billion. The Holmes Report. Retrieved Jan. 9, 2012 from http://www.holmesrport.com/news-info/10894/showdetailspaige.aspx?type_news-info.
Hughes, D. (1991). Point five: Improve the system of production and service in applying the Deming method to higher education. R. I. Miller, ed. The College and Personnel Association. Washington, D.C. p. 53.
Hughey, A. W. (2000). Application of the Deming philosophy to higher education. Counseling & Student Affairs Faculty Publications. Paper 2. Retrieved on Oct. 18, 2010 from http://www.digitalcommons.wku.edu/csa/fac/pub/2.
Inger, M. (1993). Teacher collaboration in secondary schools. Center Focus, (2). Retrieved Nov. 12, 2011 from http://vocserve.berkeley.edu/centerfocus/cf2.html.
Joshi, A. W. (2009). Continuous supplier performance improvement: Effects of collaborative communication and control. Journal of Marketing, 73 (1), 133 – 150. Retrieved May 27, 2011 from http://dx.doi.org/10.1509/jmkg.73.1.133.
Keiser, J., Lawrenz, F., & Appleton, J. (2004). Technical education curriculum assessment. Journal of Vocational Education Research, 29, (3), 181 – 194. Retrieved Dec. 6, 2011 from http://dx.doi.org/10.5328/JVER29.3.181.
Kerr, G. (2009). Apples, oranges and fruit salad: A Delphi study of the IMC educational mix. Journal of Marketing Communication, 15 (2-3), 119-137. Retrieved n.d. from http://dx.doi.org/10.1080/13527260902757522.
Knight, J. E., Allen, S. & Tracy, D.L. (2010). Using six sigma methods to evaluate the reliability of a teaching assessment rubric, The Journal for American Academy of Research Cambridge, 15 (1), 1-6.
Matulich, E., Papp, R., & Haytko, D. L. (2008). Continuous improvement through teaching innovations: A requirement for today’s learners. Marketing Education Review, 18, (1), 1- 7.
McCleneghan, S. (2006). PR executives rank 11 communication skills. Public Relations Quarterly, 51, 43-45.
McMaster, K. & Espin, C. (2007). Technical features of curriculum-based measurement in writing. The Journal of Special Education, 41, 68-84. Retrieved Jan. 17, 2007 from http://dx.doi.org/10.1177/00224669070410020301.
McNamara, F. (1996). Measuring second language performance. London: Longman.
Messick, S. (1989). Validity. In R. L. Linn (Ed.), Educational measurement (pp. 13 – 103) New York: Macmillan.
Nagy, P. (2000). The three roles of assessment: gatekeeping, accountability, and instructional diagnosis. Canadian Journal of Education, 25(2), 262-279. Retrieved April 23, 2008 from http://dx.doi.org/10.2307/1585850.
National Council of Teachers of English and Council of Writing Program Administrators (2008). NCTE-WPA White paper on writing assessment in colleges and universities in Assessment of Writing, M.C.
Neter J., Wasserman, W, & Kutnerm, M.H. (1985). Applied Linear Statistical Models: Regression, Analysis of Variance and Experimental Design. 2nd ed. (pp. 782 – 785). Homewood, Ill: Richard D. Irwin Inc.
Rios, M. (2008). Following communication rules: A communication-centered theory for public relations. In T. Hansen-Horn & B. Neff (eds.), Public Relations: From theory to practice (pp. 181 – 192). Upper Saddle River, N.J.: Pearson Education, Inc.

www.sciedu.ca/ijhe International Journal of Higher Education Vol. 1, No. 2; 2012
Published by Sciedu Press 78 ISSN 1927-6044 E-ISSN 1927-6052
Rucker, B.B., & Thompson, S. (2003). Assessing student learning outcomes: An investigation of the relationship among feedback measures. College Student Journal, 37 (3), 400- 405.
Schneider, F. (2006). Rubrics for teacher education in community college. Community College Enterprise, 12, 39-55.
Shewhart, W. A. (1931). Economic control of quality of manufactured products. Princeton, NJ: D. Van Nostrand Company, Inc.
Shumate, S., Surles, J., Johnson, R.L., & Penny, J. (2007, September). The Effects of the Number of Scale Points and Non-Normality on the Generalizability Coefficient: A Monte Carlo Study. Applied Measurement in Education. 20, 357 – 376. http://dx.doi.org/10.1080/08957340701429645.
Smith, L.J. (2008). Grading written projects: What approaches do students find most helpful. Journal of Education for Business, 83(6), 325-330. Retrieved Feb. 21, 2011 from http://dx.doi.org/10.3200/JOEB.83.6.325-330.
Stauffer, J. (2003). SQC Before Deming: The Works Of Walter Shewhart. Journal of Applied Management and Entrepreneurship. Retrieved on Oct. 18, 2009 from http://www.findarticles.com/p/articles/mi_qa5383/is_200310/ai_n21324603/pg_7/?tag=content;col1.
Steel, A. (2008, Feb. 4). Careers: Expert advice. PR Week, 19.
Stellmack, M., Konheim-Kalkstein, Y., and Manor, J.E., Massey, A.R., & Schmitz, J.A.P. (2009, April). An Assessment of Reliability and Validity of a Rubric for Grading APA-Style Introductions. Teaching of Psychology. 36, 102-107. http://dx.doi.org/10.1080/00986280902739776.
Stensassen, S. (1995). The application of Deming’s theory of total quality management to achieve continuous improvements in education. Total Quality Management, 6; 5. 579 -592. Retrieved Nov. 23, 2009 from http://www.pu.edu.pk/images/.../Paper-9-Volume_VI_Issue-1-June-2010.pdf.
Stevens, D.D. & Levi, A. (2005). Introduction to rubrics: an assessment tool to save grading time, convey effective feedback, and promote student learning. Sterling, VA: Stylus Publishing.
Thaler, N., Kazerni, E., & Huscher, C. (2009, November). Developing a Rubric to Assess Student Learning Outcomes Using a Class Assignment. Teaching of Psychology. 36, 113-116. http://dx.doi.org/10.1080/00986280902739305.
Tucker, T., Derelian, D., and Rouner, D. (1997). Public relations writing: An issue-driven behavioral approach. Prentice Hall, Saddleback, New Jersey, 90-134.
Urdhwareshe, H. (2006). Validating measurement system using measurement system analysis (MSA). Quality World. Retreived Nov. 17, 2009 from http://www.third.com/files/MSA%20QW%20Dec06%20article.pdf.
Van Slyke, J. (Ed.). (2006). Public Relations Society of America: The report on the commission on public relations education. Public relations education for the 21st century: the professional bond. New York City: Public Relations Foundation.
Williams, R., Sanford, J., Stratford, P., and Newman, A. (1991). Grading Written Essays: A Reliability Study. Physical Therapy. 71, 9.
Weller, L.D. & Weller, S.J. (1997) Using Deming’s continuous improvement model to improve reading. NASSP Bulletin 1997 81:78. Retrieved Sept. 13, 2010 from http://dx.doi.org/10.1177/019263659708158911.
Yoshina, J.M., & Harada, V. H. (2007). Involving students in learning through rubrics. Library Media Coordinator, 25(5), 10 -14.
Yousuf, M. I. (2007). Using experts’ opinions through Delphi technique. Practical assessment, research & evaluation, 12 (4) 2 - 7. Retrieved Aug. 5, 2005 from http://www.pareonline.net/pdf/v12n4.pdf.
Table 1. Average results of assessing and awarding points to news releases X & Y
Points awarded news
release X
Points awarded news
release Y
Averages
Professionals (N=5) 45.4 77.3 61.35 N = 5
Faculty (N = 6) 42.6 78.74 60.67 N = 6
Averages 43.9 78.05 60.97

www.sciedu.ca/ijhe International Journal of Higher Education Vol. 1, No. 2; 2012
Published by Sciedu Press 79 ISSN 1927-6044 E-ISSN 1927-6052
Table 2. Results of two-way ANOVA: Faculty versus professional grades on news releases X and Y
Source DF SS MS Faculty Professional
Fac vs. prof 1 2.8 2.80 0.01 0.910
X or Y 1 6915.6 6915.61 32.69 0.000
Interaction 1 25.2 25.22 0.12 0.734
Error 20 4230.7 211.53
Total 23 11174.3
S = 14.54 R-Sq =62.14% R-Sq(adj) = 56.46%
Chart 1. 8 steps in applying PDCA cycle to teaching & assessing a course
Plan Do Check Act
Loop 1 Identify SKAs & develop learning objectives requiring students to demonstrate career-related competencies
Review academic and professional sources, including accreditation standards. Solicit input from practicing professionals; confirm faculty decision
Use Delphi method with faculty to determine pedagogy & learning objectives
Develop an assignment/artifact for evaluation that requires students to demonstrate SKAs
Loop 2 Develop teaching & assessment rubric based on learning objectives & SKAs
Use Delphi method with faculty to reach consensus on categories within rubric
Compare rubric to professional standards
Faculty use rubric as teaching & evaluation tool; discuss outcomes
Loop 3 Add accountability to rubric; establish benchmark for measuring students’ progress
Faculty & professionals evaluate sample of students’ artifact
Evaluate data; assess uniformity of faculty in applying rubric
Adjust pedagogy as appropriate
Loop 4 Measure improvement; do longitudinal test against baseline
Professionals evaluate random sample of students’ work
Compare results to baseline; share results with faculty
Determine if rubric is anchored to pedagogy; faculty make adjustments
Loop 5 Improve construct validity of rubric
Use Delphi method with professionals to reach consensus on values and weights
Use Delphi method with faculty to reach consensus on values & weights
Use Delphi method with faculty to converge variances between two groups
Loop 6 Determine ability of rubric to differentiate between submissions
Develop statistical evidence that rubric can be accurately & consistently administered
Faculty & professionals separately use rubric to grade & assess artifact
Use two-way ANOVA to determine if significant differences exist
Loop 7 Establish inter-rater reliability
Determine baseline; test for rater repeatability & reproducibility
All faculty grade one artifact; use Delphi method to reach consensus on grade
Use F test for equal variances
Loop 8 Test for intra-rater & inter-rater reliability to assess rubric’s appropriateness
Use two-trial six sigma method to reduce measurement variance
Randomly select artifact to grade; assign instructors to grade each; record scores from trial 1/ trial 2
Compare & interpret results to determine if rubric’s reliability is acceptable. If no, determine improvement objective; if yes, implement CQI project

www.sciedu.ca/ijhe International Journal of Higher Education Vol. 1, No. 2; 2012
Published by Sciedu Press 80 ISSN 1927-6044 E-ISSN 1927-6052
Chart 2. Basic data from trial 1 and trial 2
Chart 3. Typical six sigma calculation sheet

www.sciedu.ca/ijhe International Journal of Higher Education Vol. 1, No. 2; 2012
Published by Sciedu Press 81 ISSN 1927-6044 E-ISSN 1927-6052
Diagram 1. Generalized flow of development of measurement system for rubric
Appendix A. Simple binomial rubric for evaluating news release writing
News Release Rubric
I. Are the key ideas organized effectively? Y/N
2. In the headline/lead combination, is the message clear and compelling? Y/N
3. In headline/lead combination, is the news angle compelling? Y/N
4. Does the news release use a convincing journalistic style? Y/N
5. Are the basics in place - grammar, sentence and paragraph mechanics Y/N

www.sciedu.ca/ijhe International Journal of Higher Education Vol. 1, No. 2; 2012
Published by Sciedu Press 82 ISSN 1927-6044 E-ISSN 1927-6052
Appendix B. News release writing rubric with category descriptors and weights
www.sciedu.ca/ijhe International Journal of Higher Education Vol. 1, No. 2; 2012
Published by Sciedu Press 83 ISSN 1927-6044 E-ISSN 1927-6052
Appendix C. News release writing rubric with refined numerical scales