Applying the Analytic Hierarchy Process to Oil Sands ...
300
Walden University ScholarWorks Walden Dissertations and Doctoral Studies Walden Dissertations and Doctoral Studies Collection 2015 Applying the Analytic Hierarchy Process to Oil Sands Environmental Compliance Risk Management Izak Johannes Roux Walden University Follow this and additional works at: hps://scholarworks.waldenu.edu/dissertations Part of the Business Administration, Management, and Operations Commons , Engineering Commons , Management Sciences and Quantitative Methods Commons , and the Oil, Gas, and Energy Commons is Dissertation is brought to you for free and open access by the Walden Dissertations and Doctoral Studies Collection at ScholarWorks. It has been accepted for inclusion in Walden Dissertations and Doctoral Studies by an authorized administrator of ScholarWorks. For more information, please contact [email protected].
Transcript of Applying the Analytic Hierarchy Process to Oil Sands ...
Walden UniversityScholarWorks
Walden Dissertations and Doctoral Studies Walden Dissertations and Doctoral StudiesCollection
2015
Applying the Analytic Hierarchy Process to OilSands Environmental Compliance RiskManagementIzak Johannes RouxWalden University
Follow this and additional works at: https://scholarworks.waldenu.edu/dissertations
Part of the Business Administration, Management, and Operations Commons, EngineeringCommons, Management Sciences and Quantitative Methods Commons, and the Oil, Gas, andEnergy Commons
This Dissertation is brought to you for free and open access by the Walden Dissertations and Doctoral Studies Collection at ScholarWorks. It has beenaccepted for inclusion in Walden Dissertations and Doctoral Studies by an authorized administrator of ScholarWorks. For more information, pleasecontact [email protected].

Walden University
College of Management and Technology
This is to certify that the doctoral study by
Izak Johannes Roux
has been found to be complete and satisfactory in all respects,
and that any and all revisions required by
the review committee have been made.
Review Committee
Dr. Christos Makrigeorgis, Committee Chairperson, Doctor of Business Administration Faculty
Dr. Michael Ewald, Committee Member, Doctor of Business Administration Faculty
Dr. Frederick Nwosu, University Reviewer, Doctor of Business Administration Faculty
Chief Academic Officer
Eric Riedel, Ph.D.
Walden University
2014

Abstract
Applying the Analytic Hierarchy Process to
Oil Sands Environmental Compliance Risk Management
by
Izak Johannes Roux III
MEng, University of Pretoria, 1991
BEng, University of Pretoria, 1976
Doctoral Study Submitted in Partial Fulfillment
of the Requirements for the Degree of
Doctor of Business Administration
Walden University
December 2014

Abstract
Oil companies in Alberta, Canada, invested $32 billion on new oil sands projects in 2013.
Despite the size of this investment, there is a demonstrable deficiency in the uniformity and
understanding of environmental legislation requirements that manifest into increased project
compliance risks. This descriptive study developed 2 prioritized lists of environmental regulatory
compliance risks and mitigation strategies and used multi-criteria decision theory for its
theoretical framework. Information from compiled lists of environmental compliance risks and
mitigation strategies was used to generate a specialized pairwise survey, which was piloted by 5
subject matter experts (SMEs). The survey was validated by a sample of 16 SMEs, after which
the Analytic Hierarchy Process (AHP) was used to rank a total of 33 compliance risks and 12
mitigation strategy criteria. A key finding was that the AHP is a suitable tool for ranking of
compliance risks and mitigation strategies. Several working hypotheses were also tested
regarding how SMEs prioritized 1 compliance risk or mitigation strategy compared to another.
The AHP showed that regulatory compliance, company reputation, environmental compliance,
and economics ranked the highest and that a multicriteria mitigation strategy for environmental
compliance ranked the highest. The study results will inform Alberta oil sands industry leaders
about the ranking and utility of specific compliance risks and mitigations strategies, enabling
them to focus on actions that will generate legislative and public trust. Oil sands leaders
implementing a risk management program using the risks and mitigation strategies identified in
this study will contribute to environmental conservation, economic growth, and positive social
change.

Applying the Analytic Hierarchy Process to
Oil Sands Environmental Compliance Risk Management
by
Izak Johannes Roux III
MEng, University of Pretoria, 1991
BEng, University of Pretoria, 1976
Doctoral Study Submitted in Partial Fulfillment
of the Requirements for the Degree of
Doctor of Business Administration
Walden University
December 2014

Dedication
I dedicate this doctoral study to my wife Elzabe and to my children Izanne, Elandri, and
Matt. Above all, this study is in memory of my father, Mr. Pieter Eduard Roux, and my mother,
Mrs. Joey Roux, for the foundation and encouragement they gave me.

Acknowledgments
I am very grateful to Dr. Freda Turner for her guidance and my committee members, Dr.
Michael Ewald and Dr. Christos Makrigeorgis (chair), for their advice and support. I would also
like to thank Dr. Frederick Nwosu for providing important perspective as the URR for this study.
Finally, yet mostly importantly, I thank my wife, Elzabe Roux, for her support, understanding,
and encouragement; without her, it would not have been possible for me to make it through.
i
Table of Contents
List of Tables .......................................................................................................................v
List of Figures .................................................................................................................. viii
Section 1: Foundation of the Study ......................................................................................1
Background of the Problem ...........................................................................................5
Problem Statement .........................................................................................................8
Purpose Statement ..........................................................................................................9
Nature of the Study ......................................................................................................11
Research Questions ......................................................................................................13
Hypotheses ...................................................................................................................15
Theoretical Framework ................................................................................................17
Definition of Terms......................................................................................................23
Assumptions, Limitations, and Delimitations ..............................................................25
Assumptions .......................................................................................................... 25
Limitations ............................................................................................................ 27
Delimitations ......................................................................................................... 28
Significance of the Study .............................................................................................28
Reduction of Gaps................................................................................................. 28
Implications for Social Change ............................................................................. 31
A Review of the Professional and Academic Literature ..............................................33
Literature Review, Search Methods, and Search Instruments .............................. 34
Oil Sands as an Energy Resource and Its Extraction Process ............................... 36

ii
Risk Management ................................................................................................. 51
An Overview of MCDM Processes ...................................................................... 61
A Review of the Literature on AHP ..................................................................... 72
Theory of AHP ...................................................................................................... 84
Transition and Summary ..............................................................................................89
Section 2: The Project ........................................................................................................91
Purpose Statement ........................................................................................................91
Role of the Researcher .................................................................................................94
Participants ...................................................................................................................94
Research Method and Design ......................................................................................95
Method .................................................................................................................. 97
Research Design.................................................................................................. 104
Population and Sampling ...........................................................................................106
Ethical Research.........................................................................................................108
Data Collection ..........................................................................................................109
Instruments .......................................................................................................... 109
Data Collection Technique ................................................................................. 111
Data Organization Techniques ............................................................................ 113
Data Analysis Technique ...........................................................................................113
Reliability and Validity ..............................................................................................129
Reliability ............................................................................................................ 129
Validity ............................................................................................................... 130

iii
Transition and Summary ............................................................................................132
Section 3: Application to Professional Practice and Implications for Change ................133
Overview of Study .....................................................................................................133
Presentation of the Findings.......................................................................................134
The Pilot Survey ................................................................................................. 135
The Pairwise Comparison Specialized Survey ................................................... 141
Risk Ranking ....................................................................................................... 145
Findings Related to Secondary Research Questions ........................................... 148
The second research question ............................................................................. 149
The third research question ................................................................................. 152
The fourth research question ............................................................................... 153
Findings on Hypotheses ...................................................................................... 154
Applications to Professional Practice ........................................................................165
Implications for Social Change ..................................................................................166
Recommendations for Action ....................................................................................167
Recommendations for Further Study .........................................................................168
Reflections .................................................................................................................171
Summary and Study Conclusions ..............................................................................172
References ........................................................................................................................174
Appendix A: Consent Form .............................................................................................221
Appendix B: Invitation Email and Letter of Cooperation ...............................................225
Appendix C: Pairwise Decision Specialized Survey .......................................................229
iv
Appendix D: Mitigation Strategy Questionnaire .............................................................247
Appendix E: Risks Specialized Survey Results ...............................................................250
Appendix F: Risks Survey Results (Normalized) ............................................................262
Appendix G: Mitigation Strategies Survey Results .........................................................271
Appendix H: Permission for Reprint ...............................................................................280
Curriculum Vitae .............................................................................................................281

v
List of Tables
Table 1. Summary of References ...................................................................................... 34
Table 2. AHP Pairwise Scale ............................................................................................ 88
Table 3. List of SMEs for the Pilot ................................................................................. 107
Table 4. Definition of Dummy Risk Management ......................................................... 116
Table 5. The Fundamental Scale for Making Judgments ................................................ 117
Table 6. Random Index (RI) ........................................................................................... 123
Table 7. Demographics of Participants ........................................................................... 136
Table 8. Demographics of Pairwise Comparison Specialized Survey Participants ........ 142
Table 9. Aggregated Risk Ranking per Level Using Geometric Mean .......................... 146
Table 10. Overall Ranking of Risks, Highest to Lowest ................................................ 147
Table 11. Environmental Compliance Risk Ranking ..................................................... 149
Table 12. Aggregated Ranking of Top Five Mitigation Strategies ................................. 150
Table 13. Aggregated Weight of Top 4 Environmental Regulatory Compliance Strategies
................................................................................................................................. 150
Table 14. Level 2 Normalized Weights for Level 1 Criteria, Environmental Regulatory
Compliance Strategies ............................................................................................ 151
Table 15. Ranking of Level 3 Subcriteria for Level 2 Criterion Natural Environmental
Compliance Risks, Normalized Weights ................................................................ 153
Table 16. Highest Ranked Risks ..................................................................................... 156
Table 17. Ranking of Mitigation Strategies .................................................................... 158

vi
Table 18. Ranking of Level 2 Subcriteria for Level 1 Regulatory Compliance Criterion
................................................................................................................................. 159
Table 19. Level 2 Subcriteria Related to Cost and Integrity Management ..................... 161
Table 20. Ranking of Level 1 Alternative Mitigation Strategies Criteria ....................... 163
Table 21. Alternative Risk Reduction Strategies ............................................................ 164
Table 22. Summary Outcome of Working Hypotheses .................................................. 165
Table E1. Specialized Survey Results for Risks Level 1 Criteria ................................... 250
Table E2. Level 2 Subcriteria for Level 1 Criterion Economics and Financial Risk ..... 252
Table E3. Level 2 Subcriteria for Level 1 Criterion Environmental Risk ...................... 253
Table E4. Level 3 Subcriteria for Level 2 Criterion Natural Environmental Risk ......... 254
Table E5. Level 3 Subcriteria for Level 2 Criterion Human Environmental Risk ......... 255
Table E6. Level 2 Subcriteria for Level 1 Criterion Political Risk................................. 256
Table E7. Level 2 Subcriteria for Level 1 Criterion Regulatory Compliance Risk ........ 257
Table E8. Level 2 Subcriteria for Level 1 Criterion Social Compliance Risk................ 258
Table E9. Aggregated Risk Ranking per Level and Criteria Using Geometric Mean .... 259
Table E10. Overall Ranking of Risks, Highest to Lowest .............................................. 261
Table F1. Normalized Risks per Surveys, Aggregated Ranking N=16 (Part 1) ............. 262
Table F2. Normalized Risks per Surveys, Aggregated Ranking N=16 (Part 2) ............. 265
Table F3. Normalized Risks per Surveys, Aggregated Ranking N=16 (Part 3) ............. 267
Table F4. Normalized Risks per Surveys, Aggregated Ranking N=16 (Part 4) ............. 269
Table G1. Specialized Survey Results, Consistency Check for N = 16 .......................... 271
Table G2. Specialized Survey Results, Consistency Check for N = 16 (Continued) ..... 272

vii
Table G3. Specialized Survey Results, Consistency Check for N = 16 (Continued) ..... 273
Table G4. Mitigation Strategies: Aggregated Weights for N = 16, Statistical Information
................................................................................................................................. 274
Table G5. Level 1 Alternative Mitigation Strategies, Results from AHP Analysis per
Survey, Normalized, N = 16 ................................................................................... 275
Table G6. Specialized Survey Results for Mitigation Strategies, Limiting Weights for
Surveys 1 to 6.......................................................................................................... 276
Table G7. Specialized Survey Results for Mitigation Strategies, Limiting Weights for
Surveys 7 to 11........................................................................................................ 277
Table G8. Specialized Survey Results for Mitigation Strategies, Limiting Weights for
Surveys 12 to 16...................................................................................................... 278
Table G9. Specialized Survey Results for Level 2 criterion Risk Reduction Strategies –
Normalized, N = 16 ................................................................................................. 279

viii
List of Figures
Figure 1. Schematic of the research process. .................................................................... 92
Figure 2. Flow chart for the research design..................................................................... 97
Figure 3. The AHP hierarchy. ......................................................................................... 103
Figure 4. Execution steps for specialized survey. ........................................................... 111
Figure 5. AHP execution steps........................................................................................ 114
Figure 6. Risk management hierarchy as shown in SuperDecisions. ............................. 115
Figure 7. Level 1 pairwise comparisons input by the SME. ........................................... 118
Figure 8. Pairwise comparisons for Level 1, risk management. ..................................... 119
Figure 9. Subcriteria comparisons for Level 2, natural environmental risks. ................. 119
Figure 10. Matrix of Level 1 criteria with respect to the goal. ....................................... 120
Figure 11. Matrix of Level 2 subcriteria with respect to the Level 1 criteria. ................ 120
Figure 12. Eigenvector matrix for the criteria (risk). ...................................................... 121
Figure 13. Results subcriteria ranking and inconsistency ratio. ..................................... 122
Figure 14. The results of risk ranking and inconsistency ratio. ...................................... 123
Figure 15. Inconsistency report for the criteria, with suggested improvements. ............ 125
Figure 16. Inconsistency report for the subcriteria, with consistency improvements. ... 125
Figure 17. Inconsistency ratio for risk criteria showing normalized ranking. ................ 126
Figure 18. Inconsistency ratio for subcriteria showing normalized ranking. ................. 126
Figure 19. Aggregation of all the criteria in the hierarchy. ............................................ 128
Figure 20. Risk hierarchy prior to the pilot survey. ........................................................ 137
Figure 21. Risk hierarchy validated in the pilot survey .................................................. 138
ix
Figure 22. Mitigation Strategies hierarchy prior to the pilot survey ............................... 139
Figure 23. Mitigation Strategies validated in the pilot survey ........................................ 140
Figure 24. Pilot survey flowchart showing the process followed ................................... 141
Figure 25. AHP application steps followed for each survey received. ........................... 144
1
Section 1: Foundation of the Study
The oil sands in Canada are the largest region in the world. This region covers an
area of 140,000 sq. km, an area larger than England (George, 2012). In the last decade,
investment in in situ oil sands extraction in Alberta, Canada increased significantly
(Government of Alberta, 2010). In situ oil sands extraction is technically complex and
developed using highly specialized engineers and scientists with expensive equipment
resources. The managers of oil companies working in oil sand extraction are charged with
ensures environmental regulatory compliance by taking actions to eliminate the impacts
of the organization’s activities on the environment.
In Alberta, project engineers and executives have to achieve compliance and
sustainability throughout a project’s life cycle because the success of new projects
depends heavily on regulatory compliance and risk management (Rasmussen, 2009).
Changes in regulations and compliance requirements force companies to adapt new
strategies to manage the imposed risk and policy changes (Aberdeen Group, 2013).
Managers should adopt multicriteria decision-making methods for environmental risk
management and policy change (Huang, Keisler, & Linkov, 2011). The public demands
environmental oversight for oil sands developments in Alberta, unlike in many other oil-
producing countries. The environmental compliance risk for oil companies may be higher
in Alberta than in the Gulf of Mexico according to a Ceres report, a nonprofit
environmental organization in the United States (Nicholls, 2010). Briggs (2010) and
Briggs, Tolliver, and Szmerekovsky (2012) reviewed the supply chain risks in the

2
upstream crude oil industry while Enyinda, Briggs, Obuah, and Mbah (2012) studied the
Nigerian oil industry. These authors identified environmental and regulatory compliance
as one of the six high-risks. During the project life cycle, the environmental requirements
may change significantly. In addition, any new regulatory requirement after project
definition poses a potential risk to the sustainability of the project. The in situ oil plant
may not be able to meet new regulatory compliance within the economic framework. The
risk management of in situ oil sands projects needs a focused, justified, and rigorous
approach.
In most cases, risk management focuses on historical data. To stay ahead of
federal and international requirements, the government of Alberta reviews environmental
regulations on a regular basis. Environmental laws and regulations are more a reflection
of public perceptions than of a scientific definition (Schlosberg, 2012). Considerable
local and international groups demand that the oil sands developments are not exploiting
the environment and increasingly creating more greenhouse gasses (GHG). The Canadian
federal government requires new oil sands projects starting production beyond 2011 to
implement technologies like carbon capture to reduce GHG emissions (Ordorica-Garcia,
Wong, & Faltinson, 2011; Walden, 2011).
Some U.S. states address emissions. The objective of regulations such as the
Californian Low Carbon Fuel Standard (LCFS) are to reduce the GHG emission of fuel
sold in California (Englander, Bharadwaj & Brandt, 2013). For this reason, oil company
leaders and project engineers should not only focus on the present regulations, but also on

3
the concern that these regulations are dynamic and would most likely change before
project completion. New oil sands plants have to comply with the regulations of the day.
Most in situ oil sands projects are a first for a national oil company, which may not have
the systems to support risk management frameworks or incorporate lessons learned from
previous projects. This lack of systems results in an inconsistent approach to risk
identification and inability to prioritize mitigation strategies to meet future regulatory
requirements.
The leaders of corporations should consider the current trend in environmental
policy changes to predict compliance requirements. The trend in policy changes in
Alberta started after the year 2000 with increasing public awareness of environmental
issues. In a study on public environmental awareness, Druckman and Bolsen (2011)
found the evaluation of available facts as having no basis for initial public opinions;
citizens rather base their opinions on less deliberate fact finding. Public environmental
awareness in Canada forced the federal and Alberta governments to announce on
December 21, 2010 that they would overhaul the environmental policies to ensure
sustainable development of the oil sands (McCarthy, 2010). The pace of environmental
policy change would have an effect on current and future oil sands projects.
Oil sands projects come with significant environmental risks. Despite the high
risks, current body of literature does not sufficiently indicate how executives and project
engineers should manage the potential change and influence of environmental regulatory
requirements on oil sands projects. Prpich, Dagonneau, Rocks, Lickorish, & Pollard

4
(2013) analyzed environmental risk management. These researchers concluded that
management should pay attention to the change in environmental regulations, and
managers should have a sound understanding of environmental risk. This research study
would show where difficulties exist for executives and project engineers of in situ oil
sands projects in understanding the relative importance of environmental risks.
Understanding these risks should increase the focus and efforts of project decision
makers when they implement environmental and regulatory compliance risk management
programs.
Arimura, Darnall, and Katayama (2011) found in their study that an
environmental risk management system (e.g., ISO 14000) helped resolve environmental
impact in areas such as natural resources and solid waste generation. Edwards and
Darnall (2010) identified that the implementation of an environmental risk management
plan improves the possibility of an organization complying with environmental
regulations. Resolving environmental problems and reducing risks as well as liability are
all positive reasons for implementing a risk management system, even before the start of
construction (Jafari, Khorasani, & Danehkar, 2010). Integrated risk management is a
continuous process of risk assessment on all levels, project and corporate level, and it
forms part of the company strategy and culture (Reddy, Govardhan, & Prakash, 2013).
In this quantitative study, I identified the core environmental compliance criteria
and the environmental risk mitigation strategies essential to environmental risk
management of in situ oil sands projects. This study is significant from three points of

5
view. First, the use of a systematic approach is helpful for identifying the importance of
compliance risks. Project engineers consider the compliance risks as essential aspects to
managing uncertainty due to the changing environmental and regulatory requirements on
in situ oil sands projects. Public pressure plays a crucial role in the Alberta government’s
response to environmental regulatory changes. Governments should implement
regulatory policy that would create less uncertainty in the industry (Farahani, R. Z.,
Baygi, M. B., Mousavi, S. M., 2014). Second, the identification of these key compliance
risks (with the actual weight placed on each) provides a consistent approach to
environmental risk management of oil sands projects. Last, with the ranking of mitigation
strategies, project engineers would be able to implement a successful risk management
strategy.
Background of the Problem
Increased demand for oil in the United States and the developing world caused the
start of an extensive exploration of the oil sands in northeastern Alberta, Canada (Jergeas
& Ruwanpura, 2010). In 2012, Canada exported to the United States 2.3 million barrels
of oil per day (Angevine & Green, 2013, National Energy Board, 2011). The provincial
government of Alberta can no longer ignore the environmental concerns created by the
demand for oil and the large areas needing reclamation because of oil sands mining
(Foote, 2012). A growing public perception is that the oil sands exploration and
development in Alberta is creating immense environmental damage and perceived health
concerns (Kurek et al., 2013).

6
From 1973 to 1990, puplic awareness of environmental and social issues in the oil
sands were barely visible. However, around 1995, public awareness of climate change
started to increase, and this caused organizations and corporations to be aware of social
and environmental requirements (Carroll & Shabana, 2010; Estévez, Walshe, &
Burgman, 2013; Jones & Dunlap, 2010; Orlitzky, Siegel, & Waldman, 2011). Estévez et
al. (2013) reviewed 119 papers and confirmed the importance of social impact and human
participation in environmental decision-making. Estévez et al. concluded that including
environmental stakeholders is neither a homogeneous process nor an easy process.
Stakeholders included in environmental decision-making do not necessarily have the
technical expertise to understand the risks and consequences (Hendriksen, Tukahirwa,
Oosterveer, & Mol, 2012).
Martin (2010) also identified the increasing impact of regulatory compliance in
the energy industry. Regulatory compliance is not only about compliance but also about
doing business transparently to gain the acceptance of local stakeholders. Martin stated
regulatory compliance is about incorporating compliance in corporate decision-making.
The Alberta government is focusing on environmental regulatory compliance. In 2007,
Alberta became the first region in North America to legislate limits for GHG emissions
(Hopper, 2008). The Alberta government prescribed these environmental regulatory
requirements on the oil sands industry. The continuous changes in requirements are
causing uncertainty as well as financial and technical risks in the industry.
7
In 2008, Neil Camarta, senior vice-president at Petro-Canada, highlighted that
new environmental approval processes are creating bariers to entry for new oil sands
projects (Chazan, 2008). Greg Stringham, a vice-president of the Canadian Oil Producers
Association (CAPP), identified environmental and regulatory policy changes as the
biggest challenges the oil sands industry’s leaders must confront (Chazan, 2008). The
regulatory policy uncertainty in Alberta has continued to increase the environmental
compliance risks for new oil sands projects. Stringham stated that the continual
enhancement of environmental performance in the oil sands is an essential part of doing
business (Nicholls, 2010).
The extent of in situ oil sands projects is enormous: $15 billion in 2012 (CAPP,
2010) and a record $32.7 billion in 2013 (Government of Alberta, 2014). These mega
projects have the potential to change the environment due to the size of their
environmental footprint. The financial investment in in situ projects make it essential for
oil sands managers to achieve regulatory compliance.
At the beginning of a project, minimal environmental and process data are
available, and future environmental and regulatory requirements have uncertainty. The
success of the project and the future sustainability depends on (a) the environmental risk
management strategy that decision makers follow and (b) the work with all stakeholders
(Álvarez, Moreno, & Mataix, 2013). During the evaluation, design, and execution phases,
project engineers and executives of in situ oil sands projects have to make decisions that
will influence the final environmental impact and compliance with regulations.
8
Developing a consistent risk management system is thus vital for the duration of the
project under the uncertainty of future compliance requirements. Better risk management
should improve business sustainability and corporate environmental responsibility.
Epstein and Yuthas (2012) stated that increasing financial sustainability was
possible due to financial decisions and investments that allow for future cost of
environmental compliance. Epstein and Yuthas proposed that decision makers use
decision-making tools for ad hoc decisions and long-term strategic decisions (Eweje,
Turner, & Müller, 2012). Zavadskas, Vainiuna, Turskis, and Tamosaitiene (2012)
highlighted the required technical skills of project managers and their need to understand
the environment and the stakeholders. Engineers and project managers who understood
the potential regulatory compliance risks will have a better chance to complete the project
successfully.
Problem Statement
According to CAPP (2010), the oil production from the Alberta oil sands will
increase from 1.5 million barrels a day in 2010 to 3.5 million barrels a day by 2025. This
expansion of oil sands developments is predicted to significantly produce more
greenhouse gas emissions and impacts on land and water resources (Jordaan, 2012). This
increase will impose environmental risks that will threaten the natural environment and
pose a socioeconomic threat to the communities in the province of Alberta, which in turn
is a risk to continuous oil production (Foote 2012). Hill and Ferguson-Martin (2010)
argued that regulatory policy changes impedes the progress in the energy industry.
9
Project managers with a better understanding of the criteria influencing future regulatory
compliance will be better able to reduce project compliance risks (Kortenkamp & Moore,
2010). The identification and, more importantly, the ranking of risks with associated risk
avoidance strategies are challenging to management.
The general business problem investigated by this study is the rate of change of
environmental regulations and the ineffective risk management of regulatory compliance
among new in situ projects that have created environmental damage. The specific
business problem investgated by this study is the lack of information available to oil
company executives and project engineers on the key environmental regulatory
compliance risks and mitigation strategies related to oil sands projects in Alberta,
Canada. Such essential information can influence future regulatory compliance of in situ
oil sands projects.
Purpose Statement
Ayyub, Prassinos, and Etherton (2010) identified three principal risks associated
with a project: technical, economic, and financial risks. These principal risks certainly
apply to projects such as IT or health services projects. A new principal risk—compliance
with environmental regulations—is a risk with large construction projects, including in
situ oil sands projects. These mega projects have potential effects on the environment.
The purpose of the quantitative descriptive study was twofold:

10
1. To identify the set of environmental compliance risks and associated
mitigation strategies using the Alberta Energy Regulator (AER) database and
then validate these risks and mitigation strategies through a pilot survey; and
2. To administer a larger survey to at least 15 SMEs from Alberta oil sands
companies, apply the AHP technique to rank the identified environmental
compliance risks, and associate mitigation strategies in order of importance.
As Saaty (2006) noted about calculating priorities, using AHP is possible if the
comparison matrices are consistent.
The ultimate goal of this research study was to rank the regulatory compliance
risks and mitigation strategies facing oil sands companies operating in Alberta and
thereby improve their environmental regulatory risk management process. Oil company
executives and engineers applying better risk management of in situ oil sands projects
will be empowered to promote positive social change through the resultant increase in
their understanding of regulatory compliance. Such knowledge would improve the
management of the environmental impact of in situ oil sands projects and demonstrate the
company leaders’ commitment to social responsibility, the environment, and the people.
Oil sands leaders’ increased understanding of environmental risk would enhance their
ability to manage sustainable oil sands projects more efficiently. Moreover, their
understanding would help protect local communities against potential environmental
hazards of oil sands developments and lessen the risk of financial penalties to the oil
sands projects’ developers.
11
Nature of the Study
In the quantitative descriptive study, I identified environmental risks that could
cause regulatory noncompliance of in situ oil sands projects. I used AER archival data
and inputs from SMEs. The quantitative research methodology supports the quantifiable
ranking of risk mitigation strategies. Obtaining qualitative opinions regarding risk
mitigations from SMEs and their perceptions of environmental risks was also possible.
The purpose of the environmental risk management study was not to discover a
new risk theory. The goal for the study was to examine and demonstrate a process for
identifying and ranking risks and risk mitigation strategies. Therefore, the quantitative
ranking of environmental risks and mitigation strategies ruled out the potential lack of
trustworthiness and rigor of a qualitative design (Schwandt, Lincoln, & Guba, 2007).
AHP was especially appropriate for the research design because it is often used in
the study of risk management and decision-making processes (Briggs, 2010; Deason &
Jefferson 2010; Varma, Wadhwa, & Deshmukh, 2008). For example, environmentalists
use AHP for environmental sustainability assessments and environmental decision-
making (Kara & Köne, 2013; Steele, Carmel, Cross, & Wilcox, 2009; Tegou, Polatidis, &
Haralambopoulos, 2010). Researchers in forest management, hazardous waste site
selection, water resource management, oilfield selection, and renewable energy have also
used AHP as a multicriteria decision-making (MCDM) methodology (Amiri, 2010;
Karimi, Mehrdadi, Hashemian, Nabi-Bidhendi, & Tavakkoli-Moghaddam, 2011;
Khadka, & Vacik, 2012; Korosuo, Wikstrom, Ohman, & Eriksson, 2011; Yousefpour et

12
al., 2012). AHP has furthermore been used to help make critical long-term decisions such
as the selection of hazardous waste sites, long-term irreversible decisions, and long-term
investments by the European Union (Křupka, Provazníková, & Švejcar, 2011).
Decision theories constitute aspects through which the decision maker may
analyze multiple risks and rank risk mitigation strategies for regulatory compliance.
Multiattribute utility theory, an MCDM process, is useful for focusing on the assignment
of utility functions to attributes (Gomes, Rangel, & Junior, 2011; Terlikowski, 2008).
Assignment of utility functions is only one aspect, howver, in the analysis of alternatives
multiattribute utility theory (MAUT) construct interval scales that do not represent the
intensity of preference. Intensity of preference is an important aspect, for example, factor
A is twice as important as factor B, something MAUT is not addressing (Saaty & Sagir,
2009).
AHP is useful for providing for the intensity of preference and framework the
researcher needs to analyze multicriteria problems. With AHP, the user can gather
intuitive quantitative and qualitative data (Saaty, 2006; Varma et al., 2008). Saaty (2006)
proposed a quantitative survey (using SMEs) to determine the factor weights (using
pairwise comparison) and rank the alternatives. The availability of SMEs in a competitive
environment such as the oil industry was a problem for me, and it limited the
participation of SMEs in the study.
An alternative research methodology to quantitative research is qualitative
phenomenological design that includes open-ended SME interviews, which posed a threat

13
to business confidentiality. The second reason was that a qualitative methodology was a
disadvantage to the risk management study; it was advantageous to quantify the risks and
providing a ranking of the risks and mitigation strategies. The project engineers could use
the weights of environmental compliance criteria for risk management to comply with
future environmental and regulatory requirements. In the future oil company, executives
might use the ranking of risk mitigation strategies to improve project risk management
(see Section 2).
Research Questions
The government of Alberta Canada’s environmental strategy (Government of
Alberta, 2009) defined some environmental compliance criteria that the government
considered essential for future environmental conservation. These criteria included
natural environment criteria (e.g., land use, water quality, water usage, and air quality),
human environmental risks such as community disturbance (socioeconomic), and
environmental monitoring system. Oil executives and project engineers do not know the
future environmental regulatory requirements at the beginning of a new oil sands project.
The regulatory uncertainty at the start of construction sometimes leads to an oil sands
plant, which may not be compliant with the latest regulations at the time of production
four to five years later. However, the owner would not be able to start operating the plant
without complying with environmental regulations. The overarching research question in
this study was about the risk management process that project executives and project

14
engineers follow to ensure environmental regulatory compliance under the uncertainty of
future regulatory requirements.
The researcher who would define the central research question best defines the
goal of the business research study (Cooper & Schindler, 2013). Project executives and
project engineers could focus on the existing regulatory compliance requirements and not
prepare for the impact of future regulatory change. The broad research questions focused
on key environmental compliance risks and mitigation strategies for future oil sands
projects in Alberta that would have the greatest impact on future regulatory compliance.
The secondary research questions that helped identify risks and mitigation strategies are
as follows:
Research Question 1: How do the natural environmental compliance risks relate
to human environmental risks in the assessment of future environmental regulatory
compliance?
Research Question 2: Which mitigation strategy emerges to be the best strategy to
ensure future environmental regulatory compliance?
Research Question 3: Which one of the natural environmental compliance risks
(land use, water quality, and water usage or air quality) is the most beneficial for
addressing future environmental regulatory compliance?
Research Question 4: How valuable is R&D technology for the mitigation of
environmental regulatory compliance risks?

15
Hypotheses
This risk management study of environmental compliance incorporated the AHP
decision-making methodology. Since the study design is quantitative descriptive, I did
not define formal statistical hypotheses using statistical analysis, which requires null
hypotheses. Therefore, with the AHP, the working hypothesis was the best guide for the
study. In Dewey's view (as cited in McGee, 2010), the researcher would generate the
working hypothesis, not directly as a testable statement of expectation but as increased
understanding that would disclose new information for the original concept.
The AHP is a mathematical decision modeling technique and not a
statistical/inferential technique. The purely statistical techniques have adherence to the
classical hypothesis definition. Instead, I adopted for the AHP the hypothesis framework
that Chamberlain (as cited in Elliott & Brook, 2007) and Railsback (1990) discussed.
According to these authors, researchers use a working hypothesis as a proxy to a
statistical hypothesis to frame the research study. The working hypothesis is helpful for
identifying some facts about the study, but not necessarily in proving the hypothesis.
Chamberlain further noted that more than one working hypothesis may describe the
research situation. In this study, I focused on the identification of the key risks and the
essential mitigation strategies in environmental regulatory compliance risk management.
Null Working Hypothesis 1 (WH1o): In this study, I identified the key risks. The
SMEs might consider all risks equally important in the management of environmental
risks.
16
Alternative Working Hypothesis 1 (WH1a): In this study, I identified the key
risks. The SMEs might consider certain risks distinctly more relevant than other risks in
the management of environmental compliance might.
Null Working Hypothesis 2 (WH2o): Using the AHP, SMEs would be able to
identify that all mitigation strategies were equally important to future regulatory
compliance of oil sands facilities.
Alternative Working Hypothesis 2 (WH2a): Using the AHP, SMEs would be able
to identify that some mitigation strategies were distinctly more relevant to future
regulatory compliance of oil sands facilities.
Null Working Hypothesis 3 (WH3o): All the Regulatory Compliance subcriteria
for oil sands projects were equally important.
Alternative Working Hypothesis 3 (WH3a): Some of the Regulatory Compliance
subcriteria for oil sands projects were more important than other subcriteria.
Null Working Hypothesis 4 (WH4o): Implementing an integrity management
program at the start of an oil sands project would be less important than the financial
savings for not implementing an integrity management program.
Alternative Working Hypothesis 4 (WH4a): Implementing an integrity
management program at the start of an oil sands project would be more important than
the financial savings for not implementing an integrity management program.
Null Working Hypothesis 5 (WH5o): A multicriteria risk management approach
for an oil sands project used multiple mitigation strategies to ensure future environmental

17
regulatory compliance.
Alternative Working Hypothesis 5 (WH5a): A multicriteria risk management
approach for an oil sands project used the most significant mitigation strategy to ensure
future environmental regulatory compliance.
Theoretical Framework
In this research study, I focused on environmental risk management and the
identification of risks and risk mitigation strategies. Managers and engineers who
understand risks and mitigation strategies would be better prepared to ensure future
regulatory compliance. The theoretical framework for the study includes the multicriteria
decision-making (MCDM) process. MCDM provides a means to make a strong decision
in situations where the selection may be extremely complicated, especially if decision
makers have to consider many alternatives (Aruldoss, Lakshmi & Venkatesan, 2013).
The potential risk to stakeholders due to inconsistent environmental decision-making and
the uncertainty of future regulatory requirements were the drivers for the development of
the principal research question.
Hey, Lotito, and Maffioletti (2010) evaluated the performance of decision-making
models and recommended that decision makers want a simple decision-making model
rather than a sophisticated one. Decision makers used the MCDM process to determine
the effect of a possible change in the future result based on known information.
Terlikowski (2008) created a general definition for the multiple decision-making
problems. Terlikowski defined it as a two-stage problem: (a) solving the control problem

18
with the information related to the problem and (b) defining a decision rule for adhering
to at all stages. It is the decision maker’s responsibility to find a solution to the problem
and to select appropriate decisions.
If the decision was time dependent, then the decision maker had to understand
what influence the decision would have on the future. Decisions made during the project
design phase would affect the final plant layout and potential compliance to future
environmental regulations. In a qualitative study, the focus would be on the project
definition at the start, the known environmental constraints, possible external influences
on the project and the relations or influences among these project criteria. What is
missing in this approach is the human factor, the role of the project engineer or an
executive in the decision-making process.
Isendahl, Pahl-Wostl, and Dewulf (2010) reviewed the quantified decision-
making process in water management and concluded the human factor is important, and
the qualitative input from the decision maker is critical in the decision-making process.
Isendahl et al. (2010) also identified a relationship between a decision maker, the object,
the subject, and the project in a decision-making process. The actions of the decision
maker may have an outcome contrary to the decision-making process, as the background,
education, and worldview of the decision maker would be influential factors in making
decisions (Isendahl et al. 2010). Because of differences among decision makers, they
would not consider aspects of the problem or assess the situation the same way.
19
The incorporation of the human influence in the decision-making process made
the AHP a suitable MCDM process for this study. AHP is a decision-making process that
combines quantitative data with qualitative judgments (Kaur, Verma & Mahanti, 2010).
The AHP allows for integrating the human factor with quantitative data to identify a
better decision.
In the literature on qualitative decision-making research, theories such as the
fuzzy set theory (Tseng, 2010), decision theory (Dubois & Prade, 2011), or linguistic
decision-making (Martinez, Ruan, & Herrera, 2010) are identified as suitable MCDM
models. These decision-making theories affect the thinking process of the decision
maker. In qualitative decision-making theories, the role of decision makers is as
important as their influence on the thinking process. According to Terlikowski (2008),
the decision maker has to draw on information realized by measurement or prediction of
the elements of the system. Terlikowski further described the decision-making process as
a control system. The decision maker would understand the interaction of the elements if
defined as part of the system. The interaction of system elements would change the
behavior of the system. The system thinking process involves the entire system and the
interaction of system elements to generate actions (Skarzauskiene, 2010). Decision
makers following a systems thinking process would help identify interactions among
environmental, social, and commercial aspects and ways these components fit together in
the larger, defined system (Lyons, Long, Goraya, Lu, & Tomlinson, 2012).

20
Yang and Yeh (2013) proposed project managers recognize the influence of
external stakeholders on projects with environmental risks and consider a systems
approach, which Fürst, Volk, and Makeschin (2010) supported. I suggested that oil sands
project engineers and project executives follow a systems thinking approach to identify
the relationships between environmental compliance and certain criteria (e.g., technical,
social, and economic risks). A system thinking process is facilitative in providing a
definition for the project and the project’s environment, as well as in defining the
interactions of the elements in the system (Skarzauskiene, 2010).
The methods that researchers use in qualitative decision-making studies follow
one of the two approaches. The first approach is to define and test a theory (Tseng, 2010).
This approach would include a literature review and exploratory interviews. The second
approach is to collect data during the survey and then apply a possible decision-making
model or theory based on mental or reasoning process (Martinez et al., 2010) to the data.
Dubois and Prade (2011) conducted a qualitative study of the decision-making model.
They demonstrated that a decision-making model based on a qualitative decision
procedure could be a beneficial approach to decision-making.
Benke, Steel, and Weiss (2011) studied decision-making as it relates to risk
assessment for environmental situations. In their study, Benke et al. used qualitative and
quantitative methods to research the decision-making problem. Their approach showed
that surveys, literature reviews, and inputs from SMEs are part of an appropriate risk
assessment process of environmental issues. The goal should be to identify robust

21
qualitative and quantitative risk characteristics.
Li, Wang, Duan, and Hu (2013) applied the same approach to risk assessment of
electric transformers. They concluded that the results have practical and theoretical
significance. The understanding of openness and endless approach in qualitative research
may be helpful for gaining a better understanding of risk management. Shadish (2010)
likewise stated that qualitative research methods are useful for attaining in-depth
understanding of the research problem. Shadish also promoted the inclusion of qualitative
methods in field experiments; qualitative methods are helpful for validating site-specific
threats. Environmental compliance on an oil sands site may be specific. The
understanding and openness in research would be helpful for accessing the ranking of
mitigation strategies with SMEs. Shadish concluded that a qualitative research is less
likely than a quantitative research to be useful for providing optimum result or in
eliminating subjectivity.
Phenomenological research was another design strategy I considered for this
study. The scope of the phenomenological design could include one project team and the
manner by which the team approaches risk management. The same possibility could
apply to a case study, where reviewing the risk management process in a project team is
probable. These designs have the potential to reflect only a single process that one team
implemented; therefore, generalization in Alberta and North America would likely be
limited. The implementation of phenomenological and case study designs could have
caused problems with confidentiality and proprietary information as they encompass the
22
detail of one team and one project only. Confidentiality could have limited openness and
not promoted successful research.
Dubois and Prade (2011) considered the potential issues with a qualitative
methodology. With the outcome of their studies, Dubois and Prade indicated that a
quantitative methodology and quantitative, descriptive design would be most appropriate
for the research problem and questions. The purpose is to understand the risk
management process and the definition of a risk mitigation strategy. Since the AHP
model is a combination of quantitative data and qualitative human input, the model is
supportive of the goal’s attainment.
The AHP model reflects a decision-making process utilizing quantitative and
qualitative data, according to Saaty (2006). Saaty defined AHP as (a) a multicriteria
decision-making method using pairwise comparisons, (b) the definition of an eigenvalue
matrix to determine relative weights of decision criteria, and (c) the deduction of the final
ratings for decision alternatives. I used the AHP to weigh the multiple regulatory risks,
using survey data from project engineers and executives.
Siddiqui, Beg, and Fatima (2013) concluded that the AHP may become elaborate,
and it takes a long time to complete. I noted and addressed these caveats in designing and
implementing this study. The outcome of this study would help project engineers and
executives to gain a better understanding of the key environmental compliance risks for
an oil sands project. They would be able to identify the risks of future regulatory changes
early in the project life cycle.

23
Definition of Terms
Analytic hierarchy process (AHP). The AHP has a number of definitions:
1. AHP is a decision model that utilizes pairwise comparisons of qualitative and
quantitative data to develop ratio scale measurements (Saaty, 2006).
2. AHP is a process, decomposing a complex multicriteria decision problem into
a number of irreducible factors (criteria) or subfactors (criteria) and weighing
the alternative solutions. Its main contribution is quantifying qualitative
criteria and alternatives (Saaty, 2006).
3. AHP is a decision model methodology that decomposes a complex
multicriteria decision problem into a number of irreducible factors (criteria),
subfactors (subcriteria), and alternative solutions. It utilizes pairwise
comparisons to develop ratio scale measurements. Its main contribution is
quantifying qualitative factors and alternatives (Saaty & Shang, 2011).
AHP criterion. A factor related to the primary objective of the analyzed decision.
Each factor or criterion receives a weight describing its importance with respect to the
objective of the decision. When normalized, the weights for all factors or criteria add to 1
(Saaty, 2006). In this study, I used the terms criteria and subcriteria rather than factor and
subfactor.
AHP pairwise comparison matrix. A table that includes entries describing the
decision analyst opinion (judgment) to which criterion is more (less) important than
24
another in terms of importance to achieving the goal of the decision under review (Saaty,
2006).
AHP scale. This scale ranges from 1 to 9 and 1/9 to 1, representing a numerical
presentation of linguistic judgments in the pairwise comparison matrices for the relative
importance of factor/criterion or alternative. The interval [1, 9] is for the category more
important, and the interval [1/9, 1] is for the category least important (Saaty, 2008).
AHP weighting. Each criterion has a numerical number indicating its importance
to the decision (Saaty, 2006).
Decision matrix. A decision matrix A is an (m x n) matrix in which factor aij
indicates the preference of alternative Ai, when evaluated in terms of decision criteria Cj
(for i = 1, 2, 3, …, m and j = 1, 2, 3, …, n). The entries aij in the m x n matrix represent
the relative value of alternative Ai, when considered in terms of criterion Cj. In AHP, the
sum of aij i=1 to n is equal to 1 (Saaty, 2006).
Decision-making. The approach the decision maker uses to make decisions. The
approach may include linear programming, analytic hierarchical process, or risk
assessments (McCready, 2010).
Decision weight. In most multicriteria decision methods, the decision maker
assigns criteria weights of importance relative to achieving the primary objective.
Usually, decision makers would normalize the weights to add up to 1; they can use,
however, other normalization scales (Saaty, 2006).

25
Fuzzy sets. Extensions of classical set theory used in fuzzy logic. Contrary to
classical set theory, which permits membership in binary form, fuzzy sets allow for
gradual membership. The degree of belonging to the fuzzy set ranges within the interval
[0, 1] (Labib, 2011).
In situ. In the context of this study, this term refers to the method for oil sands
recovery with more than 500 feet of overburden. The steam-assisted gravity drainage
(SAGD) process is the most successful recovery process used in the oil sands (Mohebati,
Maini, & Harding, 2010).
Intuition. The state of being aware of or knowing something without having to
discover or perceive it or the ability to do this. It is something known or believed
instinctively, without actual evidence for it (Kusá, 2011).
Oil sands. Oily soil that contains sticky deposits of bitumen mixed with sand and
clay that needs industrial processing to extract the oil (NEB, 2006). The oil sands of
Alberta cover an area of about 10.8 million acres in the northeastern part of the province.
This region’s estimated reserves of recoverable oil in place are about 173.2 billion barrels
(Giesy, Anderson & Wiseman, 2010; Perry & Saloff, 2011).
Risk. A future event or condition, which can occur and result in positive or
negative impacts or consequences (Project Management Institute, Inc., 2013).
Assumptions, Limitations, and Delimitations
Assumptions

26
For this study, the SMEs providing the survey data were involved in actual in situ
oil sands projects in Alberta. I did not verify the actual environmental risk management
process that project engineers and executives implemented; I only identified the
implemented risks and mitigation strategies. For this study, I made the following direct
assumptions:
The project engineers and executives who participated had in-depth
knowledge of oil sands. The participants were rational and professional people
with integrity, and they made decisions to benefit the project, within the legal,
operating parameters, in accordance with the employer and the regulations of
the province of Alberta.
The reports contained in the AER database and filed by oil companies relating
to environmental compliance were truthful and accurate.
The SMEs participating in the survey acted independently. Increasing the
number of SMEs participating in the survey would not violate the principle of
the independence of alternatives. Luce and Raiffa (as cited in Maskin, 2011)
stated that optimizing a decision problem is not possible under uncertainty by
adding new acts to the problem.
The survey was adequate for identifying key risks and mitigation strategies in
the risk management of environmental compliance of in situ oil sands
projects.

27
In the allocation of weights (priorities) to alternative criteria, I used the AHP
as a closed system (Saaty, 2006). In a closed system the sum of the weights
(=1) allocated to the alternative criteria on one level in the hierarchy would
not increase or decrease when the same level with an additional new
alternative. This assumption may cause a reversal in the ranking, which is
acceptable if the decision maker adds a new dominant alternative factor.
Limitations
I used archival data from the AER database to identify environmental regulatory
noncompliance reported for oil sands projects. I only used information in the public
domain for this study. I surveyed an SME group of 15 project engineers and executives
from Alberta companies. Using only Alberta SMEs may limit the generalization of the
risk management process for projects outside Alberta (Ellis & Levy, 2010).
Environmental regulations differ from province to province because it is not a federal
matter in Canada. The environmental policies I considered related to Alberta and not
necessarily to other provinces or states; this concern may further limit the generalization
of the study.
The AHP is the MCDM process I adopted for this study; I reviewed the result of
ranking mitigation strategies with a small group of SMEs. The identified mitigation
strategies may not be all the possible mitigation strategies. New technologies may help
with new mitigation strategies. The unidentified mitigation strategies may limit the
outcome of the study, and this limitation may be an opportunity for future research.
28
Delimitations
The choice of geography (i.e., Alberta, Canada) and the decision to include only
oil sands in situ projects limited the scope of the study. For the purpose of this study, I
considered the Alberta environmental regulations as a guideline for compliance and did
not consider international treaties such as the Kyoto protocol. In this study, only SMEs
involved in Alberta oil sands projects participated.
I further narrowed the scope of the study by excluding the oil sands mining
projects in Alberta, the oil sands in Venezuela, the shale gas in the United States, and the
deep-sea exploration in the Gulf of Mexico. Executives and engineers of multinational oil
companies not involved with in situ projects within the province of Alberta did not
participated in this study. I focused on the identification of risks and mitigation strategies
known to the SMEs. I did not try to identify those risks and mitigation strategies that may
be the result of new technologies implemented in the oil sands and not yet fully accepted
in general practice.
Significance of the Study
Reduction of Gaps
The business environment has changed in the last decade. Shareholders expect
better financial performance from companies with an environmental management plan
(Fisher-Vanden & Thorburn, 2011; Flammer, 2012). Executives of oil sands companies
need to understand the shareholders expect them to integrate the goals for environmental
compliance within the organizations’ business plans. As global environmental

29
requirements for oil sands increase and as technology for extracting oil changes, project
engineers and company executives need to understand and support the environmental
functions. Such understanding help ensure Alberta oil sands projects would be compliant
with the provincial government regulations.
According to the AER’s predecessor, Energy Resources Conservation Board
(ERCB), the Alberta oil sands industry produced 1.61 million barrels per day (Mb/d) of
crude bitumen in 2010 (ERCB, 2011). The oil sands crude production represented 0.86
Mb/d from surface mining and 0.76 Mb/d from in situ projects (ERCB, 2011). The crude
bitumen production from the Alberta oil sands would more than double by 2020, an
increase from 1.6 Mb/d in 2010 to about 3.3 Mb/d (ERCB, 2011). The production from in
situ projects would exceed production from mining projects within the next few years.
Doubling the production of the oil sands would increase the need for better
environmental risk mitigation planning to avoid the unfavorable environmental impact.
In 2005, oil sands production (52% or 572,000 b/d) came from open pit mines and
from in situ with one third using the cold production process and the balance using
SAGD (CAPP, 2010). Project engineers of in situ oil sands projects have to manage
economic, financial, technical, and environmental risks to ensure the successful
completion of the project. Risk management strategies for ensuring future environmental
compliance of oil sands projects in Alberta are neither widely available nor widely
applied. In my literature search, I did not find an SME study on the weighting of risks
and the ranking of mitigation strategies. With this study, I hoped to bridge the knowledge

30
gap by (a) identifying the key environmental compliance risks, (b) defining the weights
for these risks, (c) recognizing potential mitigation strategies, and (d) ranking the
mitigation strategies for in situ oil sands projects in Alberta, Canada.
Ranking of mitigation strategies would support Alberta project engineers and
company executives in considering the best risk mitigation for their in situ oil sands
projects, knowing this study considered inputs from a group of SMEs. A risk
management process for defining and ranking mitigation strategies could guide
executives and engineers to achieve full environmental compliance for new oil sands
facilities. An oil sands project can end in financial disaster if the local jurisdiction
deemed the project noncompliant with the local regulations; a noncompliant plant would
not receive a license to start production. The management of an oil company may spend
$500 million on a pilot in situ project before the start of production and up to $1.5 billion
on a commercial project (Government of Alberta, 2010). The risk management process
should help with risk decision-making and result in a consistent risk strategy for the life
cycle of in situ projects. Providing objective rankings of individual risks and mitigation
strategies would be helpful for improving the risk management process.
The French oil company, Total SA (Total), announced on December 8, 2011 that
they have received approval for the Joslyn North Mine, a new 9 billion Canadian dollars
(8.9 billion U.S. dollars) oil sands mining project (Welsch & Vieira, 2011). This approval
process took six years from the date they started the application and approval process,
and may take up to five years to get to production (Welsch & Vieira, 2011). In 11 years,

31
the environmental scene may change significantly. Total’s project executives and project
engineers would be responsible for ensuring that their approved project would be
compliant with environmental regulatory requirements throughout the design,
construction, commissioning, and production phases.
Implications for Social Change
The increase in production in the oil sands regions affects not only regulations
and accountability on the part of the producers and the government, but also requires
action by the community. The communities have to consider their environmental
footprint and adapt to change. The growth in the oil sands brought economic benefits to
local communities, but the boom also had a negative impact on housing, public
infrastructure, and services (Kurek et al., 2013). The impact on public infrastructure and
services includes increased regional traffic, increased pressures on health care and
education systems. These boom communities go through increases in drug and alcohol
abuse as well as increased dependence on social service providers (NEB, 2006).
The new prosperity of the oil sands region also brought a change to the traditional
way of life and impacts on aboriginal lands. The municipal infrastructure in Fort
McMurray area (Wood Buffalo District) lagged behind population growth. The shortage
of skilled workers caused an influx of foreign workers, whose presence create social
problems in the oil sands communities (NEB, 2006) and change in the communities.
Hanan, Burnley, and Cooke (2012) facilitated the involvement of citizens and leaders in
the decision-making of their community and environment using MCDM processes not

32
requiring expert inputs. The MCDM process may help community leaders identify
solutions to potential problems due to oil sands developments.
The results of this study can contribute to progressive socioeconomic change
during the execution of an in situ oil sands project. The study would also help executives
and project engineers to understand the risk management of environmental compliance in
the province of Alberta. Oil company executives and project engineers understanding the
risk management process towards regulatory compliance would have a higher chance of
success in managing the environmental footprints of their projects. Project engineers
accepting the relative weights of the criteria contributing towards regulatory compliance
and knowing the ranking of mitigation strategies would be able to have a better plan for
environmental regulatory compliance during the execution of their projects.
Huang et al. (2011) concluded sound and consistent decision-making could be
helpful for gaining environmental compliance within the financial, technical, and
economic framework as well as with local stakeholders. Improving the environmental
compliance of in situ oil sands projects would facilitate socioeconomic acceptance and
demonstration of corporate responsibility. Gil, Beckman, and Tommelein (2008)
concluded that knowledgeable managers would improve project decision-making.
Improved risk management would reduce the environmental risk, and the probability of
environmental disasters would be lower. An environmental responsible oil industry
would lead to a better socioeconomic environment in the province of Alberta.

33
In this study, I identified key risk mitigation strategies applicable in new oil sands
projects in Alberta. These risk mitigation strategies would improve the cost effectiveness
and sustainability of oil sands projects. Understanding the environmental risks imposed
by an in situ oil sands project would be supportive of oil companies to (a) reduce their
ecology footprint, (b) reduce water usage, (c) improve air quality, (d) improve water
quality, (e) reduce stress on local infrastructure, and (f) improve support to and
communications with local communities. The focus and domain of the study were about
regulatory compliance in Alberta. The identified risks and the mitigation strategies could
be helpful to oil company executives and engineers elsewhere as they prepare to manage
project environmental compliance.
A Review of the Professional and Academic Literature
I have focused the review of the professional and academic literature on four main
themes supportive of this research study. The themes are: (a) oil sands as an energy
resource and its extraction process, (b) risk management of oil sands extraction, (c) an
overview of MCDM processes, and (d) a review of the literature on AHP. Reviewing the
spectrum of MCDM processes was necessary because I used an MCDM process to rank
the environmental risks associated with oil sands extraction projects. I used AHP as the
MCDM process for this study for a number of reasons. I reviewed the last two themes to
explain specific reasons.

34
Literature Review, Search Methods, and Search Instruments
In the literature review, I used resources from the academe, the industry, and the
government. I retrieved most of the academic resources through the Walden University
library. The databases and other resources used included ABI/INFORM, Academic
Search Premier, Business Source Alumni Edition, EBSCOhost, Emerald Management
Journals, Google Scholar, OnePetro, ProQuest Central, ProQuest Dissertations & Theses,
SAGE Journals Online, Science Direct, and Alberta government publications on the oil
sands. Keywords or subject terms used (including a combination of words) in the
literature search were Alberta, analytical hierarchy analysis (AHP), Delphi,
environmental regulations, environmental risks, in situ process, multicriteria decision-
making (MCDM), oil sands, ranking, regulatory compliance, risk, risk management, risk
process, Saaty, and SAGD process. The listed subject terms are common descriptors of
the four themes I described in this literature review. In Table 1, I recorded a summary of
the number of references I used in the study.
Table 1
Summary of References
Scope No. %
All references 302 -
Recent references (since 2010) 270 89
Peer-reviewed references 262 87
Recent and peer-reviewed references 244 81

35
For oil sands in situ oil extraction literature, I used sources from Alberta research
institutes (the University of Alberta and Alberta Research Institute) and industry
associations (CAPP and Pembina Institute). The intention was to provide an
understanding of the oil sands as a natural resource requiring a technically advanced
extraction process. The provincial government, local research institutions, and industry
supported the development of the in situ oil extraction processes. Moreover, exploring the
government of Alberta’s regulatory publications, environmental strategy publications,
and energy strategy publications provided the background information to realize the
potential risk in regulatory compliance. The focus of this study was the identification of
those risks and mitigation strategies that would assist project managers in their attempt to
comply with environmental regulations. I collected this information in four themes and
presented them in the literature review.
Specifically, in the first theme of the literature review, I addressed (a) the
complexity of oil extraction from oil sands, (b) the extraction methods used, and (c) the
potential impact of in situ oil sands projects to change the environment in the boreal
forest. The second theme includes a focus on the environmental regulatory processes
dictated by the Alberta government and the risks associated with such regulatory process
as imposed on the oil sands industry. The third theme is a description of MCDM
processes and their limitations that may be useful for ranking multiple criteria. AHP is
just one of the MCDM processes. The study covers a perspective on the MCDM process
as an analytic framework for assessing the importance of environmental risk and

36
mitigation strategies. The fourth and final literature review theme points to the AHP
technique. As I explained in the theoretical framework subsection of this study, AHP is a
robust MCDM process similar to the Delphi method. However, the Delphi method is
more rigorous in quantifying the votes of the participants, and AHP is supportive of
consensus decision-making better than the Delphi method.
Oil Sands as an Energy Resource and Its Extraction Process
The oil sands in Alberta are an energy resource in environmental sensitive part of
the province. In 2008, ducks (1,600) drowned in the Syncrude Aurora tailings pond
(Stewart, Archer, & Trynacity, 2010). Syncrude is a leading Alberta oil sands producing
company. Syncrude paid $3M in penalties and much more in loss of image, which gave
the company a reputation for producing dirty oil (Stewart et al., 2010). The incident of
the dead ducks should be a reminder to all oil sands executives. The preservation of the
environment is a serious issue, and managers of future oil sands projects must consider
the environment during project execution.
History of the oil sands in Alberta. The First Nations in Northern Alberta used
outcrops of oil sands (bitumen) to seal their boats. The trappers of the Hudson Bay
Company found bitumen near the Athabasca River in Alberta (NEB, 2006) in the early
part of the 19th century. The first hot water extraction of bitumen from oil sands was at
Carpentaria, California in 1895 (NEB, 2006). Sydney Ellis, an engineer with the
Department of Mines, was the first to suggest commercial use of the oil sands, using hot
water to separate the bitumen (Humphries, 2010). In 1925, Karl Clark of the Alberta

37
Research Council perfected a process using hot water and caustic soda, which is still the
basis of processes currently used in the oil sands (Humphries, 2010). In 1927, R.C.
Fitzsimmons started the first open pit mine at Bitumont, 80 km north of Fort McMurray.
Fitzsimmons founded the International Bitumen Company in 1927 and built a small plant
to produce bitumen for roofing and road surfacing (NEB, 2006).
Later, with research support from the provincial government of Alberta, the
University of Alberta developed an extraction process to remove the bitumen from the oil
sands. The University of Alberta research led to the first pilot plant in the 1950s. In 1967,
the Great Canadian Oil Sands Company (GCOS) started the first commercial operation
north of the town of Fort McMurray in Alberta (Humphries, 2010). Since 1970, five oil
companies have established commercial open pit extraction operations in northeastern
Alberta. These operations have a daily production of one million barrels of oil equivalent
(Welsch & Vieira, 2011).
Oil has innumerable forms. Oil produced in the Middle East is light crude,
medium crude produced in Texas and Brent crude produced in the North Sea. The
bitumen or heavy crude is from the oil sands (Perry & Saloff, 2011). Venezuela and
Western Canada have oil sands a well as California and Russia. The biggest deposits are
in Canada: the equivalent of 950 to 1,600 billion barrels of oil, about 175 billion barrels
of which are recoverable (Owen, Inderwildi, & King, 2010). Great Canadian Oil Sands
Ltd (later Suncor) began production of the oil sands north of Fort McMurray, Alberta,
Canada in 1967 (George, 2012). The Alberta oil sands are the largest deposit of oil

38
available in a democratic country, second to the oil reserves in Saudi Arabia (George,
2012; Owen et al., 2010). The oil sands (80%) in northeastern Alberta are at depths of
more than 150 m, too deep for open pit mining and suitable for in situ extraction (George,
2012).
Oil sands processing methods. In situ oil sands, extraction is technically
complex and involves highly specialized individuals, expensive equipment resources, and
registered patents (CAPP, 2011). The extraction of oil sands bitumen deposits involves
the application of underground steam in large quantities. The steam increases the
viscosity of the bitumen and pumps extract the oil to a processing plant on the surface
(Mohebati et al., 2010). In situ projects are in an environmentally sensitive area, the
boreal forest with vast areas of open water; therefore, project engineers need to
implement project planning and risk management carefully.
The SAGD process is an in situ method most companies use. Butler was the first
to introduce steam as a means to move bitumen to a production well (Mohebati et al.,
2010). Butler’s steam process developed into the modern SAGD process (Mohebati et al.,
2010). The SAGD process has some distinctive characteristics that are advantageous,
compared to other in situ processes (Mohebati et al., 2010). The main advantages are the
use of gravity to drain the oil, lower energy consumption, and relative high recovery
efficiency (between 70–75%; CAPP, 2011). The in situ process requires 0.6 to 0.9 barrels
of water per barrel of bitumen produced compared to two to four barrels of water to
upgrade bitumen from open pit mining (Bedair, 2013; Nicholls, 2010). The in situ
39
process and open pit mining depend on water and therefore there is a strain on local water
resources if not managed well.
In situ plants have a small land footprint similar to the footprint of conventional
oil well operations, and in situ plants have no need for tailings ponds. For in situ projects,
the steam-to-oil ratio (SOR) is a measure of the energy efficiency of bitumen recovery.
Most owners of new in situ plants specify an SOR of 2.5 (NEB, 2006).
Environmental impact. The government of Alberta measures the
environmental impact of the oil sands in terms of several factors or indicators
(Government of Alberta, 2009):
1. Land use or footprint – The area of boreal forest cleared for operations, all
affected land reclaimed and biodiversity maintained (regulated by Alberta
Environment). The government would certify reclaimed land before oil
companies return the land for public use (Perry & Saloff, 2011). Only 3% (4,
800 km²) of the oil sands surface area used for open pit mining. The other
97% (138, 000 km²) of the oil sands area covers the reserves that are too deep
for mining, but are suitable for in situ recovery (Alberta Environment, 2010).
For comparison, the oil sands surface mining area (4,300 km²) is as large as
the metropolitan area of Los Angeles, California.
2. Air pollution – GHG emissions from the oil sands totaled 45 million tons in
2009 (McCarthy, 2010), and these GHG emissions represented 6% of
Canada’s GHG emissions and 0.1% of global emissions. The Alberta
40
provincial government introduced in 2007 a 12% mandatory reduction in
GHG emissions. These mandatory reductions are for all large industrial
facilities, including oil sands (Alberta Environment, 2008; Charpentier,
Kofoworola, Bergerson, & MacLean, 2011). The Wood Buffalo
Environmental Association (WBEA) continuously monitors air quality
throughout the oil sands area around Fort McMurray. The Alberta Clean Air
Strategic Alliance (CASA) also benchmarks the air quality in the oil sands
region.
3. Water use – The Alberta government regulates all fresh water resources in the
province. Project managers of oil sands projects must apply for a permit and
submit hydrogeological measurements to demonstrate the sustainability of the
proposed project water resource (Miall, 2013). In 2009, irrigation and
agriculture represented 44% of the provincial water usage allocations; the
provincial regulator allocated 7% of the water usage to oil sands industry. In
situ projects require about 0.5 barrels of fresh water per barrel of oil, and
SAGD facilities use 80–90% recycled water (CAPP 2010; Miall, 2013). Most
oil sands projects drill for water and use salt water unsuitable for agriculture
or human consumption. The oil sands production, mining and in situ, used 1.1
billion barrels of fresh water in 2009 (CAPP, 2010). This high consumption of
water put a strain on local water resources and may have a considerable
impact on the environment.

41
4. Water quality – The Alberta Environment (Alberta government agency)
regulates the release and the quality of all water. All water must conform to
the water quality standards of Alberta environment (Hurley, Sadiq, &
Mazumder, 2012). Water, in the form of steam, is vital to oil sands
development and oil recovery. During the extraction, steam is helpful for
reducing viscosity of bitumen during upgrading and extraction, and the well
drilling and completion operations need water (CAPP, 2010).
5. People – The oil sands developments have an effect on the communities. New
developments disturb the community, change the lifestyle, and the new labor
force has an impact on local community services and infrastructure (Lopez,
2013). Consulting with local stakeholders and communities is a regulatory
requirement (Government of Alberta, 2009).
6. Cumulative environmental impact – Future research should study the effect of
accumulated environmental changes to air, land, and water. Jordaan (2012)
examined the land disturbance due to in situ oil sands projects and considered
the effect of not only the land disturbance but also the effect of fragmentation
and peripheral use. This unknown effect would increase the environmental
compliance to risk pending the result of scientific studies and their impact on
compliance requirements the provincial government of Alberta imposed
(Government of Alberta, 2009).

42
Project engineers should consider these six environmental criteria. The oil sands
company executives should carefully factor all the environmental indicators to create an
oil sands project culture. Such a culture should be environmentally and economically
conscious, responsible, and viable. The Alberta government monitors these
environmental indicators for oil sands projects ensuring proof of compliance by the
project owner throughout the project construction and production phases. In the
upcoming years, oil companies would spend billions of dollars on oil sands projects, and
all these projects would require an environmental risk management program.
The government of Alberta set an energy strategy. The focus was on sustainable
development and growth of the oil sands as well as the enhancement of the quality of life
of all Albertans with full consideration of the environment (Government of Alberta,
2009). The Alberta government worked on an integrated approach between the energy
strategy and land use framework to improve the environmental protection (Alberta
Environment, 2010). The Alberta Provincial Energy Strategy described the following
elements as essential to the protection of the environment and the development of the oil
sands: (a)environmental footprint, (b) adding value to Alberta’s energy industry, (c)
change how energy is consumed, (d) innovation related to energy technology, (e)
development of people, (f) development of electrical supply, (g) awareness of energy
issues, and (h) alignment of Provincial Energy Strategy with other initiatives
(Government of Alberta, 2009).
43
The Alberta government defined the vision for the oil sands and the environment
as follows (Government of Alberta, 2009):
Alberta is a global leader in the innovative, responsible, and collaborative
development of oil sands. The benefits of development continue to support clean,
healthy, and vibrant communities for Albertans and future generations.
Communities and development reside together in a manner that balances progress
with environmental stewardship. This vision will guide implementation of the
strategies, as well as ongoing decision-making for oil sands development today
and in the future. (p. 2)
The vision of the Alberta government focuses on four principles: (a) healthy
environment and communities, (b) balanced growth, (c) collaboration, and (d) public
interest and accountability. All of these principles connect the stakeholders, the public,
and communities to the sustainable management of the environment. It is also important
to understand the community and who represents the community; this would avoid future
problems when engaging the community (Spoel & Den Hoed, 2014). This link between
environmental responsibility and people opens the door for continuous focus on
environmental compliance and the impact of public pressure. The public in Alberta is
becoming aware of the importance of the environment. The Alberta government stated in
the Provincial Energy Strategy that the outcome should be a smaller environmental
footprint and enhanced accountability by all involved in the energy industry (Government
of Alberta, 2009). The Provincial Energy Strategy provides clear indicators that future

44
environmental requirements would continue to change and would only become more
stringent. Oil company executives and project engineers should be aware of this direction
assumed by the Alberta government. The Alberta government’s vision recognized the
global awareness on the environment. The vision statement is a strong indication to the
oil industry to ensure environmental compliance of oil sands projects is a requirement for
future oil extraction.
The Alberta Government published the Provincial Energy Strategy (Government
of Alberta, 2009a), a Climate Change Strategy (Alberta Environment, 2010) in
conjuction with the Federal government’s Turn the Corner plan (Alberta Environment,
2010; Ordorica-Garcia et al., 2011). These strategies and the federal plan provide
guidance to the oil sands companies as for the future environmental expectations and
requirements of the Alberta Government (Government of Alberta, 2009b). The regulating
agency, AER, monitors the environmental compliance of the oil companies in the oil
sands.
The AER is the decision-making authority on the approval of all new oil sands
projects based on environmental and public interest issues, and the Oil Sands
Conservation Act with defined technical requirements, directives issued by the AER.
Compliance to these technical requirements is the key responsibility of the project
engineers throughout the project life cycle. Approvals in accordance with the Water Act,
Alberta Environment Environmental Protection and Enhancement Act and Public Lands
Act follow the approval by the AER. These approvals are helpful for ensuring oil sands

45
project managers adhere to the protection of the environment and manage the
environmental risks.
The environmental criteria are of prime importance to oil sands projects,
optimizing these environmental criteria would minimize the effect on the environment,
and the plant would be compliant with the environmental regulations. Metaxas and
Tsavdaridou (2013) examined the importance of environmental issues and corporate
responsibility. They concluded that environmental criteria have an impact on
management decision-making. Metaxas and Tsavdaridou also recognized the impact of
communities and other stakeholders and stated that communities and stakeholders would
make management recognize their influences as part of the future decision-making
process. Management would have to develop better working relationships with
communities. Management also needs to engage in participative decision-making with
their stakeholders; stakeholder involvement would reduce the oil company’s
environmental risk (Metaxas & Tsavdaridou, 2013). Environmental compliance is an
integral part of future management actions.
According to Huque and Watton (2010), the federal constitution of Canada, the
British North America Act of 1867, gave the provincial governments the responsibility
for and management of public land. Section 109 gives the provinces ownership of all
lands, mines, minerals, and royalties. The Canadian federal government owns about 55%
of all land, and this includes the boreal forest in northeastern Alberta, the oil sands.
Huque and Watton emphasized that the government of Alberta has the responsibility to

46
regulate environmental issues, and the federal government is responsible for the
governance of waterways (rivers). The Canadian federal government does not have
responsibility for environmental policy, but they have some jurisdiction over water.
Huque and Watton clarified that the federal government sets standards such as the
Canadian Environmental Assessment Act and applies political pressure to change
provincial environmental policies because of international pressure.
Environmental policy trends. Environmental policy based on economic theory
may not always be a popular choice with the public (Schlosberg, 2012). According to
Gattig and Hendrickx (as cited by Arbuthnott 2010), policies and regulations are in most
instances the product of public awareness of environmental risk. When environmental
risk is at stake, most people take into account future considerations of how commercial
development would affect the environment. Therefore, society’s long-term approach to
human impact on the environment would be an influencing factor on environmental
policy (Arbuthnott 2010). The principles of self-regulation, corporatization, and
marketization have been a prominent environmental policy change in the US and Canada
since the Reagan administration (Arimura, Darnall, & Katayama, 2011; Hsueh, &
Prakash, 2012). Arimura et al. (2011) stated that governments in the implementation of
environmental policies could use command-and-control and voluntary approaches
concurrently. The trend reported by Gattig and Hendrickx (as cited by Arbuthnott, 2010)
has changed policies from a command-and-control approach towards the control of the
effects of pollution on the environment (Huque & Watton, 2010). A disadvantage of

47
command-and–control policy is the negative influence on innovation and the
development of new technology towards the environment (Rennings, & Rexhauser,
2011). This trend in policy is a change that oil company executives should be aware off
as it increases the company’s risk in managing oil sands facilities.
National and multinational companies should be aware of the change in
environmental policies, and the influences these policies have on business strategy and
future profits. If there is a high demand for energy, then there would be a high potential
for conflict with environmental protection (Foote, 2012; Wagner & Armstrong, 2010). In
the 1970s, there developed an awareness for damage to the ozone layer. This awareness
started to change the emphasis of environmental policies to prevention rather than cure.
Multinational companies have to deal with diverse environmental policies that cause
inconsistency. Changing policies may cause conflict with energy, social, and economic
goals of governments and corporations, the periods between economic, political, and
ecological actions are not always aligned (Foote, 2012).
The major trends in environmental policy identified by Wagner and Armstrong
(2010) were integration of environmental, energy, social, and resource policies. Wohl,
Gerlak, Poff, and Chin (2013) described in their study the importance of core issues of
environmental policy and regulations. Core regulatory topics include decision-making,
people in the environment, accountability, and feedback systems. The trend in
environmental policies is to implement a holistic approach to policymaking. This trend
recognizes the complexity of the environment and that changes to the environment may
48
have influences on people and other systems. It is a matter of everything influencing
everything else. The holistic approach in environmental policy would affect the life cycle
of an oil sands project.
Holzinger, Knill, and Sommerer (2008) further recognized that pressures to
change environmental policies are coordinated through not only local organizations but
also international organizations. There is little social tolerance on local and international
levels (Foote, 2012). Environmental policies and regulations have been through a period
of change. Some researchers think those internal organizational factors such as risk
management policy and not legislative or regulatory design would ensure regulatory
compliance (Huising & Silbey, 2011). Janicke and Lindemann (2010) stated that the
globalization, the leadership role a country has in the international community, and the
influence of international trade and labor agreements influenced the trend of
environmental policies. Janicke and Lindemann identified that the economic competition
requires markets, and political competition among countries applies pressure on
environmental policies. The province of Alberta needs new markets for its oil, and the
American environmental policies, environmentalists, and governments in other parts of
Asia and Europe are applying pressure to political and environmental policy. These
pressures restrict Alberta oil exports, and the Keystone XL pipeline is an example of
environmental and political pressure on the approval process.
The economic and political pressures are applying constant pressure on the
Alberta government to be a trendsetter in environmental policy. For example, Alberta
49
was the first government that adopted CO2 regulations in 2007; however, change would
remain constant. In 2011, Alberta government also changed the reclamation regulations.
The new regulations focus on the performance of reclamation by the oil sands companies
(Perry & Saloff, 2011). Environmental policies would have to keep up with the
international trends to ensure acceptance of the product in the international market. Open
economies would see strong environmental policies to which they would need to adapt to
and correspond with international trends (Janicke & Lindemann, 2010).
In contrast to what Huque and Watton (2012) reported, Schlosberg (2012) found
the international shift in policymaking. Schlosberg identified three policy approaches: (a)
the polluter pays, (b) fair share and equal allocations, and (c) right-based approach. These
strategies focused on a framework of prevention and mitigation. Schlosberg recognized
the new approach as close to the relationship between human beings and the
environment. The involvement of the public is becoming essential. Lopez (2013)
supported this in his study of American policies based on Canadian oil sands lessons
learned.
Schlosberg also observed that policies changed rapidly since the energy crisis of
1973 and created conflict with the energy, social, cultural, and economic goals of
communities, governments, and corporations in industrial countries. Research on
environmental policies in Europe found that there is a high degree of international
environmental policy convergence among 24 industrial nations (Holzinger et al., 2008).
The impact of globalization is creating changes and is influencing international trade and

50
labor agreements. For example, Alberta was the first government to adopted CO2
regulations in 2007 (Hopper, 2008). The environmental policies of Alberta are changing
to stay ahead of the global trend in environmental policy.
Janicke and Lindemann (2010) identified environmental policy change as a
stimulus to technology innovation, and this caused a new mega trend in environmental
technology. The Pew Research Center published a report in 2007, on their Global
Attitudes Project, focusing on the public environmental opinion in different countries
(Cetron & Davies, 2010). There is a high awareness among the public for environmental
issues in the surveyed countries (Cetron & Davies, 2010). This public awareness would
also influence the environmental policies and regulations adopted by the jurisdiction in
those countries. There are also unstable circumstantial factors such as change in
government (Reagan vs. George W. Bush) or economics (recession or prosperity) that
could cause a sudden change in environmental policy (Huque & Watton, 2010).
Circumstantial factors may also include environmental damage in the oil industry such as
a major oil spill (e.g., the March 24, 1989 Exxon Valdez spillage in Alaska; the April 10,
2010 BP Deepwater Horizon oil spill in the Gulf of Mexico; or the July 26, 2010
Enbridge pipeline rupture, spilling oil into the Kalamazoo River near Marshall,
Michigan). Environmental policy is more likely to change in developed countries because
of global leadership and perceived capacity to change than in developing countries. The
factors are present in Alberta, and they make the likelihood of continuous environmental
change possible in Canada (Huque & Watton, 2010). The new policies and public

51
awareness would create a responsibility with industry leaders to manage the potential
environmental risk and regulatory compliance.
Risk Management
The International Environmental Risk Management system (ISO 14000) is a
standard that defines a systems approach to environmental risk management. This ISO
system focuses on a general framework applicable to all industries (Arimura et al. 2011).
At the beginning of a project, minimal environmental and process data may be available,
and there is uncertainty about future environmental and regulatory requirements (Hill &
Ferguson-Martin, 2010). The success of engineering project depends on the risk
management strategy and the anticipation of future risks due to potential changes in the
project environment (Bali & Apte, 2014). Oil sands projects include trends of uncertainty
such as changing regulatory requirements and oil economics. These uncertainties create
risks and a risk management strategy (Elahi, 2013). Therefore, the success of the project
and the future sustainability of the oil sands facility would depend on the environmental
risk management strategy followed by decision makers. Sato (2012) supported the
strategy on risk management. Sato used the AHP to define a risk management strategy,
and she identified priorities to support sustainability in a manufacturing plant under
budget constraints.
Risk management of in situ oil sands projects. The BP Deepwater Horizon oil
spill in the Gulf of Mexico that happened in April 2010 demonstrated how a company
with a long-term environmental strategy could still have an environmental incident. This
52
incident was also catastrophic to the CEO and the company’s image (Cherry & Sneirson,
2011). The BP Deepwater Horizon drilling rig was an ultra-deep-water, dynamically
positioned, semi-submersible offshore oil drilling rig. The rig cost $365 million to build
and the BP Deepwater Horizon oil spill caused $36.9 billion in damages to the Gulf of
Mexico coast environment (Smith, Smith, & Ashcroft, 2010). The oil company
executives need to ensure an environmental risk management process is in place, and that
the company complies with the environmental, health and safety regulations. Risk
management is the process of selecting risk mitigation actions based on the information
gathered in the risk assessment process (Gregory et al., 2012). Regulatory compliance
risk management is the process of establishing mitigation measures that would help to (a)
protect the company image, (b) protect the company wealth, (c) execute successful oil
sands projects, (d) provide a safe workplace, (e) protect the environment, and (f) maintain
close relationships with local communities.
Risk management is a structured approach towards the management of risk and
uncertainty and is essential in any business decision-making environment. Risk
management is a fundamental part of any project in the oil industry. Investors are at risk
and project managers have to manage risk finding the best feasible alternative within the
project definition. Risk management is important throughout the life cycle of the project.
Project executives and project engineers must consider the attributes of the project
(parameters, factors, criteria) to be able to reduce the risk (Zavadskas, Turskis,
Ustinovichius, & Schevchenco, 2010). The risk attributes can be qualitative and

53
quantitative. Environmental risk management should be a framework for continuous
improvement and mitigation of risks. Project managers could group risks in three source
groups those are internal environment, external environment, both with predictable
sources of risk and external environment with unknown uncertainties (Bali & Apte,
2014). This approach would help management to reduce the environmental impact and to
go beyond compliance. In the case of new oil sands projects, engineers would have to
work towards regulatory compliance.
Regulatory compliance is possible, if project engineers manage the identified
risks. These risks include (a) operational risk, (b) compliance and legal risk, (c)
reputation risk, (d) social risk, (e) environment, health, and safety or EHS risk, (f)
geologic risk, (g) political risk, (h) financial risk, and (i) economic risk (Andersen &
Mostue, 2012; Wagner & Armstrong, 2010). Enyinda et al. (2012) and Briggs et al.
(2012) recognized social risk, economic risk, financial risk, technological risk, and
environmental and regulatory compliance risk as high-level risks in the oil industry’s
supply chain.. Gas supply networks, similar to the oil industry, experience risks related to
political issues, environmental, technology, and regulatory uncertainty (Farahani, Baygi,
Mousavi, 2014). In a Nigerian oil industry study by Enyinda et al. (2012) the primary
risks identified were geological and production risk, environmental and regulatory risk,
transportation risk, oil availability risk, geopolitical risk, and reputation risk. Most of
these risks (i.e., social risk, economic risk, financial risk, technological risk,
environmental risk, and regulatory compliance) the researchers identified in the oil

54
industry may also apply to oil sands projects (Ayyub et al., 2010; Briggs, 2010; Enyinda
et al., 2012; Government of Alberta, 2009). Project managers and engineers in the oil
sands sector should understand these risks. These engineers should have a constant risk
assessment and decision-making process in place; they should ensure regulatory
compliance, smooth operations, and avoid damaging the company’s reputation or the
environment.
Risks and mitigation strategies for environmental regulatory compliance. On
April 20, 2010, the BP Deepwater Horizon disaster occurred; 11 people died, and 17
workers injured while 13,000 gallons of crude oil per hour leaked into the sea (Grant,
2011). In 2008, the Syncrude Aurora tailings pond killed 1,600 ducks (Stewart et al.,
2010). Saturday morning, May 5, 2007, a steam pipeline burst on the in situ plant site of
MEG Energy Corporation at Christina Lake, Alberta, destroying 1.4 km of steam pipeline
and causing localized spillage of bitumen (ERCB, 2008). If a disaster strikes, it can have
several consequences such as the loss of life, killing of innocent birds, significant
equipment damage, local spillage or an environmental disaster. The BP Deepwater
Horizon spilled oil for 100 days at a rate of about 13,000 gallons of crude oil per hour
into the Gulf of Mexico (Grant, 2011). The mentioned disasters have one common thread
that is the corporations all operated these facilities under government environmental
regulations and in a certain way, they were noncompliant.
All in situ oil sand projects have to be compliant with the environmental
regulatory requirements from day one to the last day. When the oil company returns the
55
in situ site to the government and the local community at the end of the project, they shall
reclaim and restore all land. An environmental compliance mitigation strategy is unique
for every project; therefore, a systems approach or holistic approach to regulatory
compliance would help an oil sands company to comply. The potential risks define the
mitigation strategies. Gregory et al. (2012) investigated environmental decision-making
and risk management. Gregory et al. concluded that the risk assessment of resource
development (i.e., oil sands) is not only about the probability of environmental events but
also about the risk mitigation strategies. Gregory et al. (2012) stated risk management
should combine the probability of events that may affect the environment with
socioeconomic and political factors. Hanewinkel and Oehler (2012), as well as
Yousefpour et al. (2012), found in their study that in complex environmental studies (i.e.,
forest management), scientific (geological) and economic (financial) factors should be
considered with uncertainty and the views of different stakeholders. Estévez et al. (2013),
as well as Gregory et al. (2012), confirmed the importance of stakeholder participation.
Wagner and Armstrong (2010) alluded to the importance of social and
environmental risks alongside political and economic risks. The mitigation of the high-
level risks is part of the risk assessment process (Ayyub et al., 2010; Briggs et al., 2012).
In risk management, the manager should consider four generic mitigation strategies; risk
acceptance, risk avoidance, risk reduction, and risk transfer (Reddy, Govardhan, &
Prakash, 2013). The risk management strategy is the first step in risk mitigation.
In the European study on risk management strategies, Cortes, Figerio, Schenato,

56
Pasuto, and Sterlacchini (2013) identified four mitigation strategies: (a) prevent damages
to people, properties and infrastructure, (b) ensure people are prepared and trained to
manage risks, (c) improve technology to respond to risk, (d) enhance public awareness.
The second step in the risk management strategy is to develop mitigation strategies,
similar to the proposal of Cortes et al., for the risks identified on the lower hierarchy, the
physical, quantifiable risks. The environmental regulations define most of the physical
environmental requirements.
The U.S. Federal Clean Air Act amendments of 1990 were the first to address
environmental risk assessment. Risk management is a process that depends on the risk
manager understanding the steps of risk management. These steps are (a) the
vulnerability and risk; (b) analyzing internal and external factors; (c) identifying the
timing for risk assessment; (d) identifying the real and potential impacts; (e) identifying
threat and opportunity, (f) and identifying the probability of the risk (Măzăreanu, 2011).
Gregory et al. (2012) described risk management as the combination of risk mitigation
and risk assessment. Gregory et al. then described the risk assessment process in four
steps:
1. Define the problem.
2. Identify the hazards and boundaries.
3. Assess the exposure paths and potential effects.
4. Characterize the risks and their probabilities of occurrence.

57
Jaskowski and Biruk (2011) considered risk assessment for construction projects
and defined a four-step process similar to Gregory et al. (2012) but with a different focus.
Jaskowski and Biruk’s four-step process focuses on the identification of the risk
activities, estimates the effect on project duration, reviews mitigations, and defines a final
project duration distribution. Decisions for managing the risks need clear communication,
not only from engineers and managers, but also with the community. Managers and
engineers practicing risk management would have a high rate of successful
environmental compliance if they make decisions in a collaborative manner. Practicing
environmental risk management is the action that could close the regulating compliance
gap for in situ projects. It is the responsibility of engineers to address these compliance
issues. It is up to the management and project engineers to develop policies as part of
their mitigation strategies to ensure the oil sands projects would be compliant. Hopkins
(2011) studied risk management in the oil industry and recommended that a technical
rule-based compliance mitigation strategy be essential to ensure minimum regulatory
compliance. Gibbs (2011) stated that risk analysis and adopting a risk assessment tool are
the fundamental approach to environmental management, and Hopkins (2011) added
value of rule compliance to the risk management process. The risk management process
also requires consideration for local and cumulative impact of projects on the
environment, the need for technology transfer, and adaptive risk mitigation (Gibbs,
2011).

58
To ensure compliance to the environmental regulations, the AER requires oil
sands companies to develop an environmental management plan (EMP). The EMP should
allow for reporting and assessment of the project’s current compliance, as well as
projecting the future environmental compliance of the plant in operation. A project EMP
should include compliance monitoring as a mitigation strategy; compliance monitoring
would allow an adaptive approach to risk management (Gibbs, 2011).
The AER and Alberta government focus also on the physical environmental risks
described in the Alberta government oil sands strategy (Government of Alberta, 2009).
The physical risks include natural environmental risks (i.e., land use, water quality, water
usage, and air quality), human environmental risks (i.e., community disturbance,
socioeconomic changes), and implementation of a local environmental monitoring
system. Air quality is a key focus of the environmentalist. Thus, the Alberta government
implemented a GHG level objective in 2007 to limit GHG emissions with the goal to
reduce GHG by 12% (Hopper, 2008). In situ oil sands projects have an advantage with
lower GHG emissions compared to open pit mining (Bergerson, Kofoworola,
Charpentier, Sleep & MacLean, 2012; Brandt, 2012; Yeh et al., 2010). The engineers
need to implement a plan to improve in situ plant designs and to eliminate the GHG
emitted into the air. The second mitigation strategy is to reduce the carbon dioxide (CO2)
emissions by participating in a carbon capture and storage program or reduce emissions
using steam solvent processes (Charpentier et al., 2011).
A third risk mitigation strategy should focus on water quality and quantity. In situ

59
projects require less water usage compared to the open pit mine. The mines have a water
usage of two to four barrels of water per barrel of oil (Bedair, 2013; Nicholls, 2010)
compared to in situ projects that currently use about 0.6 to 0.9 barrel of water per barrel
of oil (Kim, Hipel, & Bowman, 2013; Mannix, Dridi, & Adamowicz, 2010). The
strategy, according to Mannix et al., is to recycle more water; up to 90% to 95% for new
projects. The second strategy is to use no fresh water or water from local rivers and
creeks and to use only treated underground saline water in the SAGD process. Water
quality suffers due to an increase in polycyclic aromatic hydrocarbons (PAH) levels. The
increase in PAH levels is a risk for surface water, ground water, and aquatic ecosystems
(Giesy et al., 2010). A further aspect to consider for new in situ projects is water security:
no water pollution (Kim et al., 2013). Kim et al. (2013) proposed project managers
should balance water security with environmental, economic and social impacts. The
AER fined Suncor Energy Ltd, an oil sands producer, for water pollution by kitchen staff,
a subcontractor at an in situ oil sands workers campsite (Bertels, Cody, & Pek, 2014).
The ISO 14000 environmental risk management system focuses on risk mitigation with
the implementation of a systems approach. A robust mitigation strategy implemented by
ISO 14000 is documentation management as a method to reduce or control risk.
In summary, the mitigation strategies should focus on the avoidance of the
potential cause of the environmental risk (e.g., no emissions). The second option is to
reduce the risk to an acceptable and safe level, and the third option is to share the risk
with others (e.g., buy insurance or get a project partner). Documentation control,

60
enhanced technology, and R&D would further improve the mitigation strategies. The
implementation of ISO 14000 as a formal environmental risk management system may
also contribute to regulatory compliance.
Influence of Alberta environmental policies on risk management. The
influence that regulations and government actions have on the risk level of new projects
may determine the final compliance of the project. In Alberta, the provincial government
has changed the policies regulating the royalty payable by oil and gas companies a few
times since 2007 (Perry & Saloff, 2011; Plourde, 2012). The royalty changes cause
uncertainty and increase the project compliance and sustainability risk. Ayyub et al.
(2010) defined the risk decision-making process for new projects.
Compliance requirements and their impact on projects may have a significant
influence on how executives see the future compliance issues and corporate social
responsibility as measures of project success (Wagner & Armstrong, 2010). Monitoring
and enforcement of regulations by the regulator have a significant impact on how
operations conduct themselves. Gray and Shimshack (2011) emphasized the importance
of enforcement and the effect it has on the reduction of emissions and regulatory
enforcement has a direct influence on over compliance by plant managers. The
importance of enforcement is an indication that management respond positive to
regulatory enforcement (Gray and Shimshack, 2011). Most Canadian plant managers
(70%) stated that regulatory enforcement has the biggest impact on their environmental
compliance, more than community organizations and environmental pressure groups

61
(Gray & Shimshack, 2011). Gray and Shimshack did not report the influence of political
decision-making in the study, and it is outside the power sphere of the project engineer or
manager. For instance, McLinden et al. (2012) reported on the trend of air quality
measurements in the oil sands and compared with the air quality in Alberta cities.
However, it is the regulator and politicians that need to take action based on this scientific
evidence. Project decision makers should consider a multicriteria decision-making model
for environmental risk management.
An Overview of MCDM Processes
MCDM has developed into an accepted method to support the decision maker
(Mota, Campos, Neves-Silva, 2013).Researchers and practitioners may use MCDM
processes to rank the environmental risks associated with oil sands extraction projects.
For this environmental regulatory compliance study, I focused on a quantitative approach
towards decision-making. Therefore, I examined various quantitative decision-making
theories and techniques to show why the AHP is appropriate for this study. Deciding
which MCDM method to use is important because different methods may give different
rankings (Stanujkic, Djordjevic, Djordjevic, 2013). In their study, Huang et al. studied
more than three hundred environmental project papers and concluded that there is an
increase in the application of MCDA. Huang et al. identified the methods used the most
in environmental analysis; analytic hierarchy process (Saaty, 2006), MAUT (Beccacece
& Borgonovo, 2011; Brito, de Almeida, & Mota, 2010; Gomes et al., 2011; Liu, Walshe,
Long, & Cook, 2012), and outranking (Jajimoggala & Karri 2013). Geng and Wardlaw

62
(2013) identified the MCDMs most used in environmental management are compromise
programming (Zarghami & Szidarovszky 2010), goal programming (Liao & Kao, 2010),
and AHP (Saaty, 2006).
A weak problem structure or definition in an MCDM process is a problem in
determining the optimum decision (Zavadskas et al., 2010). In construction projects
similar to oil projects, environmental risk assessment and decision-making have become
more complex. The quality of data and SME inputs become essential criteria in the
decision-making strategy (Zavadskas et al., 2010). Decision-making is possible
depending on two aspects of data: the availability of data (qualitative or quantitative data)
and the certainty of data. In this study, I used data available from a government agency
database and a survey. Most MCDM approaches include three primary elements: (a)
definition of alternatives that SMEs will rank, (b) rules to enable the measurement of the
alternatives, and (c) performance measures for each alternative with respect to each
criterion (Geng & Wardlaw, 2013).
The decision-making theory under uncertainty used in most studies is the
probability theory as defined by Savage (cited in Pothos & Busemeyer, 2013). Probability
theory uses a Bayesian measurement of the possible occurrence of a future event (Karni,
2011). Quantitative decision-making under uncertainty uses a judgmental approach or an
intuitive approach, also called a heuristic approach (Kusá, 2011). A heuristic approach
may be a safe effort, as for many decisions not all the information may be available
(Gigerenzer & Gaissmaier, 2011). A heuristic approach is to estimate the possibility that

63
something may happen or the likelihood of occurrence. Lee and Newell (2011)
considered the heuristics approach to MCDM and included a hierarchical Bayesian
method in decision-making, which may lead to improvement in heuristic decision-
making. Golmohammadi, Afshari, Hasanzadeh, and Rahimi (2010) suggested applying
heuristic decision-making models to business applications such as supply design and
optimization. An MCDM process facilitative of considering or managing the human
aspect of decision-making was beneficial in this study on environmental compliance and
risk management. Understanding the openness and endless approach in qualitative
research helped to get a better understanding of decision-making.
Janssen et al. (2009) developed a quantitative method to evaluate
multidisciplinary projects and combined different models to define new decision–making
criteria for use in future agriculture and environmental project assessment. Janssen et al.
used the integrated assessment and modeling (IAM) method to study the decision-making
options in defining agricultural and environmental policy in Europe. The policies had to
consider multiple stakeholders, agriculture, the environment, and the criteria in assessing
contributions to sustainable development. Janssen et al. obtained help from more than
100 participants to define and evaluate their IAM models. The IAM approach has the
potential of an MCDM process to work in a quantitative manner with members from the
oil sands industry. The said approach could have helped to define an environmental
regulatory compliance strategy. However, attracting a large group of SMEs posed a

64
problem. There are not that many SMEs in Alberta, therefore, I did not consider the IAM
method as a viable methodology for the study.
Quantitative decision-making methods require adequate data, and these methods
need inputs from experts. Qualitative methods for decision-making under uncertainty
such as believe function theory (Fan & Nguyen, 2011) or fuzzy set theory are closer to
human decision-making or problem solving (Huang, Zhang, Liu, & Sutherland, 2011;
Wu, Zhang, Wu, & Olson, 2010). Fuzzy set theory is a decision-making method that
represents environmental knowledge, control knowledge, vagueness, and linguistic
imprecision (Karimi et al., 2011; Wu et al., 2010). Decision makers may use a decision-
making model that has characteristics such as fuzzy theory, qualitative probabilistic
reasoning, or scenario-based reasoning. Decision makers use these theories to identify the
influence of future policy or environmental requirements on the risk of the project
(Durbach & Stewart, 2012). These characteristics define the criteria for selecting an
MCDM process for this study.
Business leaders and project engineers should address several criteria related to
decision-making, socio-political influences, economic impact and environmental
compliance (Huang, et al., 2011; Yousefpour et al., 2012). These criteria include
environmental risks, uncertainty in the data, the decision-making models used, as well as
ethics (Pimentel, Kuntz, & Elenkov, 2010). Pimentel et al. (2010) reviewed ethical
decision-making in business and identified four characteristics of ethical decision-
making. Decision makers should consider the stakeholders, the law and regulations, the

65
environment, and the organization’s values and norms. Executives should also consider
self-efficacy and their non-compliance when making decisions (Shacklock, Manning &
Hort, 2013). Ethical decision-making imposes on the culture, strategy and goals of the
organization (Pimentel et al., 2010). A final important aspect of ethical decision-making
in risk management is the impact of current decisions on the future and the opinion of the
public on the future (Pimentel et al., 2010).
If managers observe a trend in environmental regulations, then it would be
beneficial to consider the potential changes in their risk management strategy. Pimentel et
al. (2010) proposed decision-making should include ethical aspects of decision-making in
business. Lotila (2010) identified corporate response to social pressure as a factor in
ethical decision-making. Lotila further stated that social pressures related to
environmental matters create a functional and a moral relationship with the community.
Lotila’s views are similar to the views of Pimentel et al. that focus on management
responsibilities, and their impact on the community. Therefore, for environmental
regulatory compliance the impact of the oil sands on the community is part of the risk
management plan.
Decision-making depends on the decision maker who may be individuals or a
group of people. Group decision-making in project management is quite common
(Jaskowski, Biruk, & Bucon, 2010). Kimbrough, Kunreuther, Baron, Gong, and Xiao
(2010) studied decision-making in economics and psychology. Kimbrough et al.
identified three factors of importance when considering a decision-making framework:

66
uncertainty, cooperation, and group decisions. The integration of these elements allows
decision makers to make better decisions and to cooperate with stakeholders. The
understanding of group decision-making is an influencing factor on the selection of an
appropriate decision-making method; some methods may be too conservative or over-
optimistic (Tavares, 2012). Group decision-making techniques often used by researchers
and management are the Delphi technique and multicriteria methods such as AHP (Saaty
& Vargas, 2012). AHP is an MCDM that is well suited for group decision-making, and it
translates human judgments into quantitative values (Basak, 2011; Grošelj, Pezdevšek
Malovrh, & Zadnik Stirn, 2011; Ramanathan & Ramanathan, 2010; Wu, Kou, Peng, &
Ergu, 2012).
The Delphi method may be attractive for defining project goals in a group as it
allows for inputs and balancing of opinions from all members (Cole, Donohoe, &
Stellefson, 2013). Dalkey and Helmer (as cited in Hsu & Stanford, 2007) developed the
Delphi method in the1950s. Decision makers use the Delphi technique as a method for
consensus decision-making with a group of experts. Decision makers use most group
decision-making techniques for goal setting or predicting the occurrence of future events,
asking the question, “What” (Hsu & Stanford, 2007). The Delphi technique has a
different approach, using questionnaires and tries to find answers from SMEs to what
could/should be (Hsu & Stanford, 2007). The Delphi method focuses on the knowledge
and opinions drawn from a group of SME with validity based on an iterative process with
a group of SMEs (Cole, Donohoe, & Stellefson, 2013). The SMEs will respond

67
independently to a question within a designated period (Dalkey and Helmer as cited in
Hsu & Stanford, 2007). The Delphi method focuses on consensus; it uses multiple
iterations and encourages participants to reassess their original judgments.
The Delphi method makes conclusions based on statistical analysis of the data and
may still indicate different opinions by showing the spread in the participant’s opinions
(Hsu & Stanford, 2007). The statistical analysis provides for an objective and impartial
analysis. A Delphi study can be time consuming in comparison with other group
decision-making and MCDM processes. Yeung, Chan, Chan, Chiang, & Yang, 2012) did
four rounds of Delphi surveys to select ten key performance indicators (KPIs) for
construction projects. For my study, there were more than eight risks related to
environmental compliance, and that would require large blocks of time for SMEs to
complete the questionnaires. The process might require three or four rounds of Delphi
surveys (Yeung et al., 2012). Repeated rounds of questionnaires make the Delphi
technique impractical. SMEs are full-time industry executives and practitioners with
limited time in their busy schedules to participate in various surveys. The multiple rounds
of questions discourage participation and limit the sample size. A small sample size will
not be representative (Hsu & Sandford, 2007). Therefore, multi rounds of questions with
a large sample size of SMEs caused difficulty in obtaining data for this study because
there are a limited number of SME in Alberta involved in oil sands projects. Some
researchers overcome this problem by combining the Delphi method with AHP (Cho &
Lee, 2013).

68
Executives responsible for risk management have to deal with the uncertainty or
probability of a possible future scenario, therefore making decisions under uncertainty
depend on their experience and training. They may also request the opinions of SMEs.
Cooke published the TU Delft database, an expert judgment database in 2005 for the
validation of decisions made by experts with the classic model (Cooke, 2014; Lin &
Huang, 2012). Various researchers used the TU Delft database to explore new validation
models, for example; Clemen proposed the Remove-One-At-a-Time (ROAT) method
(Cooke, 2014; Lin & Huang, 2012). However, these validation models using expert
judgment require further development when applied to probabilistic scenarios (Cooke,
2014). Eggstaff, Mazzuchi and Sarkani (2014) questioned the validity of the Cooke’s
classic model for expert judgment aggregation based on critic reported by researchers.
Risk management in the oil industry had to deal with probabilistic scenarios, possibilities
of equipment failure or incidents that might happen; therefore, the Cooke classic model
and a ROAT validation might not be a suitable decision-making model. Technology
would influence decisions made under uncertainty (Bobtcheff & Villeneuve, 2010).
Bobtcheff and Villeneuve showed that if the choice is between two options under
uncertainty, the best outcome is not easy to identify, and there may be a need for more
SMEs to provide opinion on the subject. The known decision-making criteria determined
the choice of the decision-making framework for environmental regulatory compliance in
Alberta. The multiple criteria influencing the choice of MCDM process selected include
the following: group decisions, risk (uncertainty), data available, probabilities, and inputs

69
from SMEs.
The environmental policy uncertainty in the oil and gas industry in Alberta
influences the decision-making in this industry and the framework most suitable for
decision-making. Huang et al. (2011) studied decision-making in environmental studies
and found that there is a trend towards the use of MCDM methods for environmental
policy management. Similarly, in studies in decision-making, in the civil engineering and
construction industries researchers found that vague and incomplete information cause
uncertainty and plagued decision-making (Abdelgawad & Fayek, 2010). In Alberta oil
sands, project managers also experience vague and uncertain data (Zavadskas et al.,
2010; Zou, Liu, Liu, & Guo, 2010). Zou et al. (2010) proposed the use of a modified
interval linear programming (ILP) decision-making model, defined as a risk explicit ILP
(REILP). Conversely, Nieto-Morote and Ruz-Vila, (2011) reviewed the decision-making
process in power plants using the fuzzy AHP with subjective weighting criteria. Nieto-
Morote and Ruz-Vila also presented an evaluation of several plant systems to show the
effectiveness of the AHP process.
Decision-making is a broad subject that influences the project, executives, project
engineers, and the organization (Akdere, 2011), It is therefore essential to identify typical
decision-making models used for multicriteria decisions-making (MCDM), as required
for environmental decision-making. The applicability of different decision-making
models may require further review to identify any relevance to making project decisions
under uncertainty. Reviewing the literature regarding the decision-making process used
70
in other industries where most of these criteria occur, I found that researchers and
decision makers often used the AHP as an MCDM (see section under AHP).
Multicriteria decision-making (MCDM). Decision-making is a process of
making a decision between two or more possibilities. Multiple possibilities introduce the
possible choice of one solution to another, and there is an uncertainty of which decision
may be a better decision. The multicriteria decision-making process applies to
engineering, management, marketing, human relations, IT, and any other part of the
organization. Decisions become intricate if the interface is with internal criteria and
external criteria. For example, regulatory compliance or jurisdictional policy changes
may require a review of several policy factors in pursuit of making the best decision
(Tjader, Shang, & Vargas, 2010). MCDM applications are expanding with the growing of
the internet, computing power, and availability of web-based software. Decision makers
are applying MCDM further in disciplines like engineering, e-Commerce, and finance
(Bragge, Korhonen, Wallenius & Wallenius, 2012). The reviews of other decision makers
and researchers are influencing the growth in MCDM applications (Sipahi & Timor,
2011). Researchers identified and described several MCDM theories in the literature
(Aruldoss, Lakshmi & Venkatesan, 2013); these theories include for example heuristics,
goal programming, MAUT, and AHP. The AHP has the widest application for
construction, engineering, finance, internet, politics, and project management (Saaty,
2006, 2012).

71
Decision-making, where multiple criteria and multiple objectives exist, requires a
structured approach or framework to obtain a decision. The decision maker has to learn
how to deal with a variety of factors and the different dimensions of these factors (Saaty
& Vargas, 2013a). Multiattribute theory, an MCDM theory, is focusing on the
decomposition of complex problems into irreducible criteria and sets of actionable
solutions (Gomes et al., 2011). Multiattribute decision models focus on single decision-
maker models and group decision-maker models such as AHP and step matrix method.
MCDM requires human input. However, the human mind finds it difficult to
consider or weight across multiple criteria. The human mind works in a systematic way,
and hierarchy structures are a systematic form for the definition of complex decisions
(Saaty & Sagir, 2009). The hierarchy structure forms the backbone of the AHP. Decision-
making, where multiple criteria and multiple objectives exist, requires a structured
approach or framework to obtain a decision by a single decision maker or a group of
decision makers.
Researchers described a number of MCDM models in the literature, such as (a)
outranking methods, (b) linear weighted point, (c) judgmental modeling, (d) interpretive
structural modeling, (e) categorical method, (f) fuzzy sets, and (g) AHP (Beck, &
Hofmann, 2012; Turskis, & Zavadskas, 2011; Zavadskas, Turskis, & Kildienė, 2014).
Greco, Matarazzo, and Sowiski (2010) described a time-based decision-making model;
they examined the decision-making models under uncertainty for those situations where
the outcome was time sensitive. Greco et al. (2010) based their decision-making model

72
on a combination of time dominance and stochastic dominance; their model is also
suitable for qualitative ordinal distributions. Additive models and weighting models for
multiattribute decision-making based on AHP were reviewed and found acceptable
(Shang, Zaiyue, & Cungen, 2010; Sarabando & Dias, 2010). Labib (2011) used a fuzzy
AHP model for a supply chain selection with the ability to check consistency in decision-
making. Ordoobadi’s (cited by Labib, 2011) motivation for using an AHP model with
fuzzy sets is the accommodation of subjectivity and imprecision associated with
perceptions and not forcing decision makers to use numerical scales. Ishizaka and
Nguyen (2013) applied fuzzy AHP for the same reasons, uncertainty and imprecision, in
a bank account selection study. In this study, I determined the rankings without the
inclusion of subjective impressions or perceptions of decision makers.
A Review of the Literature on AHP
The world is a complex environment, a system influenced by many interacting
factors from the environment and people and industry. The interactive environment or
system requires decision-making methodologies capable of system decision-making
following a holistic and analytical approach. AHP is an MCDM methodology suitable for
complex systems that allow for the interpretation of qualitative and quantitative aspects
of decisions (Saaty & Sagir, 2009). Saaty and Shang (2011) stated that the AHP is
suitable for comparisons where the magnitudes are either very small or very large. The
pairwise comparison techniques used in AHP is better suited for these small and large
magnitudes than a rating system that considers one alternative at a time. AHP reduces a

73
complex decision or problem to a hierarchy and to a series of pairwise comparisons
(Saaty, 2006). Saaty (2006) stated that the AHP is an MCDM process that allows the use
of quantitative data, experience, intuition, and insight. AHP is easy to understand by
decision makers, as well as non-experts, who can participate in the decision-making
process. Therefore, AHP is a preferred MCDM framework by many practitioners (Aydin
& Arslan; 2010; Podvezko, Mitkus, & Trinkūnienė, 2010). Another advantage of the
AHP is its ability to resolve multi-objective decision situations (Saaty, 2006). At the end
of the process AHP not only allows the researcher to manage different types of data it is
also possible with AHP to evaluate the consistency of the inputs from decision makers
(Dong, Zhang, Hong, & Xu, 2010; Machiwal, Jha, & Mal, 2011; Stoklasa, Jandová, &
Talasová, 2013). Dong et al. (2010) and Stoklasa et al. (2013) emphasized the importance
to measure consistency in consensus and group decision-making. Stoklasa et al. proposed
to do a preliminary ranking of priorities before doing a pairwise comparison, a way to
improve consistency with a group of SMEs. Kravchenko and Seredenko (2011) evaluated
the AHP and concluded the importance to establish alternatives to the problem that lead
to an increase in the decision-making efficiency. The AHP is a methodology suitable for
the modeling of uncertainty and risk as it is capable of quantifying subjective and
intuitive data.
Background to AHP. Thomas L. Saaty (2006) developed the AHP, which proved
a valuable technique for multicriteria decision-making. Saaty developed the AHP as an
MCDM process that can change subjective probabilities from uncertainty to a framework

74
of measurable criteria and ratio measures that culminate to a single measure. The
reviewed literature identified several applications of AHP in social science, management,
and engineering. AHP is suitable for MCDM where many SMEs may be involved
reviewing several variables or criteria influencing the decision (Amponsah, 2011; Dong
et al., 2010; Wu et al., 2012). The variables may be quantitative or qualitative (Saaty,
2006), tangible or intangible (Saaty, 2011), subjective or unquantifiable variables
(Ramanathan & Ramanathan, 2010). Saaty (2006) worked to define the supporting
axioms after early criticism against the validity of the AHP (Dyer as cited in Steele et al.,
2009). Saaty did not only work on improving the theoretical basis of the AHP, but also on
the group decision-making advantages of AHP, and said it works well for a group of
SMEs to evaluate qualitative criteria. In a group decision-making study by Grošelj et al.
(2011), they showed the importance of not violating the reciprocal property that is a
requirement of the AHP for consistent group decision-making. Other group decision-
making models causing inconsistent group decision-making violate the reciprocal
property (Grošelj et al., 2011). Saaty (2006) and Grošelj et al. (2011) demonstrated that
AHP has advantages as a group decision-making framework, but with caution by the
decision maker.
Saaty (2006) identified and summarized the advantages in the application of AHP
as an MCDM framework for group decision-making as follows:
1. AHP constitutes a one-stop solution for unstructured problems.
2. It processes the ability to resolve complex problems.

75
3. It can connect the dots between interdependent elements in a complex mode.
4. It is capable of breaking down complex problems into simple elements
distributed over multiple levels of the hierarchy.
5. It allows pairwise comparisons for items on the same hierarchical level to
derive priorities.
6. It converts intangible judgments into measurable scales.
7. It allows the verification of consistency in data.
8. AHP provides an overall/decomposed priority of alternatives in relation to the
problem.
9. AHP derives a conclusion from diverse opinions.
10. AHP allows modifications, and repetition to improve results.
These advantages make it possible for researchers and practitioners to use AHP in many
applications.
Applications of AHP. Saaty (2006, 2012) has used AHP since its introduction in
1980 for a large number of MCDM projects, industries, and applications. Saaty used the
AHP for applications such as setting priorities, risk management, quality management,
project management, and strategic decision-making. The AHP is suitable for hardware
and software related decisions, as well as using inputs from literature reviews, databases
and experts (Talib, Rahman, & Qureshi, 2011). Badizadeh and Khanmohammadi (2011),
as well as Pun, Chin, and Yiu (2010), used the AHP in assessing the risk in new product
development. Practitioners used AHP to identify the priorities for product development

76
strategies and the associated risk of the chosen strategy. The use of pairwise comparison
shortens the time to identify and prioritize risks, and it helps participants to avoid
confusion in answering survey questions (Ishizaka, 2012; Ishizaka & Labib, 2011a). For
these reasons, researchers used AHP in economic modeling, environmental management,
forest management, water resource management, energy, and renewable energy planning
(Aragonés-Beltrán, Chaparro-González, Pastor-Ferrando, & Pla-Rubio, 2014; Grošelj et
al., 2011; Imam & Tesfamichael, 2013; Giri & Nejadhashemi, 2013; Kara & Köne, 2013;
Khadka, & Vacik, 2012; Kravchenko & Seredenko, 2011; Rodríguez-Bárcenas & López-
Huertas, 2013; Steele et al., 2009; Tegou, Polatidis, & Haralambopoulos, 2010;
Yousefpour et al., 2012). The application of AHP in environmental studies is widespread
and applied to climate change (Promentilla, De la Cruz, Angeles, & Tan, 2013) and
bioenergy sustainability (Kurka, 2013). These broad applications of AHP provide
confidence to practitioners and researchers when they consider AHP as an MCDM
process.
Yousefpour et al. (2012) selected the AHP as the decision-making process to
integrate public preferences in complex forestry decisions and Piran, Maleknia, Akbari,
Soosani, and Karami, (2013) used AHP for urban forest site selection. Grošelj et al.
(2011) found that using AHP improved transparency, group decision-making with
multiple objectives, and forest management credibility. Although Huang, et al. (2011)
found MCDM, including AHP, extremely valuable for environmental applications. Steele
et al. (2009) cautioned in their study that using the AHP in environmental decision-

77
making might have severe consequences if not used with discretion. Steele et al.
criticized the use of relative normalization rather than using absolute normalization. They
argued that rescaling the criteria could lead to rank reversal and criteria weights should
change accordingly. Steele et al. proposed the use of absolute scoring scales, scales with
minimum and maximum endpoints.
Maleki and Zahir (2012) did more work on prioritizing scales and normalizing,
and they found that, in most AHP case studies, decision makers used relative
normalizing, and they checked for possible rank reversal. The application of AHP in
environmental studies is widespread. It would be useful to examine the prioritizing scales
and evaluate the potential rank reversal in-group decision-making applications.
The AHP application in supply chain management. Many practitioners and
researchers used AHP in supply chain management and in managing supply chain risks
(Tao, 2012 Tavana, Fazlollahtabar, & Hajmohammadi, 2012). Various researchers used
AHP for the evaluation of suppliers (Alireza, Meysam, & Seyyed, 2013; Antil, Singh, &
Kumar, 2013; Ong & Salim, 2014; Varma et al., 2008). Ong and Salim replaced a
previous selection method using a Likert scale with the AHP. Researchers combined the
AHP with the balanced scorecard (BSC) to build decision models for the evaluation of
supply chain management (Tjader, May, Shang, Vargas, & Gao, 2013; Varma et al.,
2008). With the help of SMEs, using pairwise comparisons, Varma et al. determined the
relative weights of the criteria influencing the supply chain performance. Alireza et al.
and Varma et al. applied AHP successfully in the evaluation of supplier’s risks, and De

78
Felicea, and Petrillo (2012) used the AHP to rank the logistic factors of an international
supply chain. Cho, Lee, Ahn, and Hwang (2012) and Cooper, Tadikamalla, and Shang
(2012) used AHP to assess the performance of service providers. Varma et al.
summarized the advantages of AHP. The AHP allowed for the quantification of the
qualitative data, and the AHP was a useful methodology.
The AHP method is stable and flexible; it allows for small changes and the
addition to the hierarchy (Varma et al., 2008). The second reason for using the AHP was
the ease of use by the SMEs (Saaty, 2006; Varma et al., 2008). A third reason Varma et
al. (2008) stated for using AHP was its ability to determine the relative importance of
criteria, which was significant in this regulatory compliance risk management study.
Varma et al. noted that the accuracy and the handling of dynamic situations with AHP
might improve by defining more levels in the hierarchy; however, this would be at the
cost of simplicity. The management of a large number of criteria and alternatives for
complex systems can become cumbersome. The use of available AHP software packages
makes this cumbersome process less labor intensive (Jayant, Gupta, & Garg, 2011).
These relative complex decision-making models using the AHP still provided a decision
framework with flexibility and systematic design.
The selection of the best suppliers involves tangible and intangible criteria. These
criteria make the AHP a suitable framework for the selection or the ranking of vendors
(Bindu & Ahuja, 2010; Kaur et al., 2010; Yücenur, Vayvay, & Demirel, 2011). Kaur et
al. (2010) stated the primary reason for selecting the AHP in ranking of suppliers was its
79
capability to measure the consistency of the pairwise decisions of SMEs. Pochampally
and Gupta (2008) used the AHP for a supply chain study. Pochampally and Gupta
identified seven criteria for selecting the AHP for their study: (a) ability to provide a
realistic description of the problem, (b) possibility to do group decision-making, (c)
ability to structure the decision-making process, (d) ability to define relative weights of
criteria, (e) ability to analyze alternatives, (f) easy to understand, and (g) applicability of
the decision-making process.
For the management of supply chain risks in the pharmaceutical industry,
Asamoah, Annan, and Nyarko (2012) used the AHP to identify superior risk mitigation
strategies. The study by Asamoah et al. is helpful to pharmaceutical executives in
selecting the appropriate measures for the management of supply chain risks. The
application of the AHP was successful to aspects of supply chain management (Asamoah
et al., 2012; Bindu & Ahuja, 2010; Kaur et al., 2010; Varma et al., 2008; Yücenur et al.,
2011). Project managers can use the AHP with confidence in supply chain management.
The AHP application in construction. Construction project managers tend to
base their risk assessments on experience or qualitative assessments, and that can lead to
project failure. The literature clearly indicate that the AHP is an acceptable model for
managing risk in new construction projects (Abdelgawad & Fayek, 2010; Aminbakhsh,
Gunduz, & Sonmez, 2013; Cebi, 2011; Nandi, Paul, & Phadtare, 2011; Podvezko et al.,
2010). Project managers in construction management used AHP where personal
judgment is subjective and nonlinear (Nandi et al., 2011). Nandi et al. (2011) used the
80
AHP to identify and select the best construction project. Aydin and Kahraman (2010),
Cheng, Ma, and Sun (2012), Kargi and Ozturk (2012), and Podvezko et al. used the AHP
to select and manage the risk in selecting contractors. For supplier selection, Ho, Xu, and
Dey (2010) identified metrics of 101 criteria and used the AHP to help with the
multicriteria decision-making process. Cebi (2011) used AHP in a housing construction
project to identify the risk likelihood and severity of project risk. Aydin and Arslan
(2010) also used AHP to determine the best site for a new hospital. Betrie, Sadiq, Morin,
and Tesfamariam (2013), as well as Deepa and Krishnaveni (2012), selected remedial
alternatives for industrial and mining sites. Aydin and Arslan (2010) selected the AHP for
its simplicity and flexibility. Aydin and Arslan found that if the researcher improves on
the criteria selection and increases the number of alternatives, then the accuracy of the
AHP outcome would improve.
Ramanathan and Ramanathan (2010) used the AHP to prioritize qualitative
criteria in the equipment selection process of a construction project. The AHP was
helpful for structuring the decision-making process, providing a systematic framework,
and applying the method to quantify soft intuitive criteria. Ramanathan and Ramanathan
applied the soft intuitive principles with quantitative criteria in the decision-making
process. In a complex situation like the oil sands, decision makers do not depend on
intuition or pure logic but rather on systematic MCDM (Saaty & Zoffer, 2012; Tavana &
Hatami-Marbini, 2011; Vidal, Marle & Bocquet, 2013).

81
Nandi et al. (2011), as well as Zou and Li (2010), promoted the use of the AHP in
construction projects to provide a logical and rational project assessment method. Nandi
et al. suggested that avoiding rank reversal, which a potential problem found in AHP
applications (Maleki & Zahir, 2012), is possible by including all criteria, even those that
have a very low weight factor. The method of measurement and the assumption of
independence are the two main causes of rank reversal (Zhu, Cooper, & Yang, 2012).
Decision makers can avoid the rank reversal by adhering to consistent judgments and
ensuring independence of all elements. Shin and Lee (2013) avoided rank reversal with
the use of the least squares method to drive the priority vectors of alternatives. However,
Zhu et al. (2012) proposed to use the weighted geometric mean aggregation rule as the
primary aggregation rule to avoid rank reversal. Despite the potential issue of rank
reversal, Aydin and Arslan (2010), as well as Podvezko et al. (2010) concluded that a
decision-making methodology such as AHP is useful for avoiding subjective decision-
making and is easy to interpret.
The AHP application in project management. Risks, such as, technical,
financial, environmental, and commercial influence engineering and construction
projects. Some of these risks are uncertain and difficult to control (Jaskowski & Biruk,
2011). Jaskowski and Biruk (2011) developed a risk model and used AHP to evaluate and
rank risks. Using the AHP was helpful to project managers to improve the project
scheduling and evaluation of risk mitigation strategies.

82
Again, the AHP allowed the decision maker to combine quantitative risk data
with subjective risks such as human error and environmental issues. Labib (2011)
compared the results from AHP with those of fuzzy logic using linguistic expression to
determine the ranking of suppliers. Labib showed that AHP has similar outcomes and that
it is possible to express opinions in the form of linguistics terms. Labib also demonstrated
that with the AHP, performing a sensitivity analysis is possible for better understanding
of the relationships in the assessment terms. Risks and uncertainty in construction
projects are high contributors to failure (Abdelgawad & Fayek, 2010; Zou & Li, 2010).
Abdelgawad and Fayek (2010) combined AHP with the failure mode and effect analysis
(FMEA) to solve the multicriteria decision-making problem in construction risk
management. FMEA is just another technique to help identify risks for a project
compared to data analysis or brainstorming or SWOT analysis. Amiri (2010) used AHP
in oil field project selection. Amiri (2010) identified technical and financial criteria for oil
field project selection. Amiri then used the AHP to calculate the criteria weights and
applied the fuzzy TOPSIS method to determine the final ranking. When using the
TOPSIS method, rank reversal may occur. The decision maker should be aware of the
possibility of rank reversal when combining AHP with fuzzy TOPSIS. Amiri concluded
that project managers could use the AHP with linguistic and technical preferences to
make decisions in uncertain situations.
The AHP application in transportation. In the transportation industry, the AHP
is widely useful for assessing the feasibility and investment of transportation projects.

83
The projects include airports, public road works, vulnerability of highway systems, and
shipping selection. Some of these applications considered risk and uncertainty with
incomplete data (Arabameri, 2014; Kaya, Öztayşi, & Kahraman, 2012; Qin & Yan, 2013;
Zietsman, & Vanderschuren, 2014). Yang and Regan (2013) used AHP for determining
optimum transportation system operations strategies. Kaya et al. (2012), as well as Qin
and Yan (2013) used AHP to rank a transportation system’s project risk under uncertainty
of the technical, operating, and financial environment. These researchers concluded that
the AHP was helpful for ranking multiple transportation and project feasibility criteria.
AHP provided a practical solution to a relative complex problem.
The AHP application in maintenance. Maintenance practitioners use the AHP
to prioritize maintenance systems (Abu Dabous & Alkass, 2008; Fouladgar, Yazdani-
Chamzini, Lashgari, Zavadskas, & Turskis, 2012; Shafiq, 2010). Van Horenbeek and
Pintelon (2013) used the analytical hierarchy network for prioritizing the maintenance
performance indicators, a significant assistance to maintenance managers responsible for
setting priorities. Abu Dabous and Alkass (2008) used the AHP as a MCDM process in
bridge maintenance management. AHP is facilitative in (a) enabling engineers to use
their experience in the pairwise judgment, (b) allowing for refinement and additions of
constraints, (c) providing for the measurement of consistency in judgments, and (d) it is
not a black box decision support tool. Abu Dabous and Alkass applied the AHP for
maintenance, safety, and integrity management. Shafiq (2010) successfully used AHP
and inputs from SMEs to identify the highest risks of pipeline maintenance.

84
Future AHP development. The AHP is still developing, and decision makers use
it for diverse types of applications. Saaty (2006) identified 15 areas of development. The
four areas of interest to this study are (a) investigating the size of the hierarchy, (b)
applying continuous judgments, (c) developing group participation guidelines, (d) and
defining an explicit theory of using scenarios in risk analysis.
Theory of AHP
Like any other theories, AHP stems from several axioms (Forman & Gass, 2001).
The first axiom is the reciprocal axiom, meaning that if criterion A is four times larger
than criterion B, then criterion B is equal to a quarter of criterion A. The second axiom is
the homogeneity axiom, meaning that the criteria or subcriteria compared should be less
than one order apart to avoid large errors in judgments. The last axiom is the concept of
hierarchy composition, indicating that the criteria or subcriteria do not depend on the
lower level criteria. This axiom promotes a bottom-up approach for determining weights
through pairwise comparisons.
The AHP might give incorrect answers if the decision maker did not adhere to the
two overriding criteria of the AHP: (a) definition of the hierarchical structure and (b)
definition of the priorities in the structure (Saaty, 2006). To prove a scientific theory,
demonstrating that the theory would give the correct answers to a known problem with a
known answer should be possible. Saaty (2006) examined the compatibility index to
measure the closeness of priority vectors to demonstrate the validity of the AHP.
However, Garuti and Salomon (2011) stated that with MCDM, getting different priority

85
vectors that may be close is possible. How close is measurable with Saaty’s compatibility
index S. The different priority vectors result from participants in the AHP providing
different judgments (Bana e Costa & Vansnick, 2008; Garuti & Salomon, 2011). These
differences in judgments are measurable with a second index, the consistency index, CI
(Saaty, 2006). To avoid these potential issues, the decision maker has to monitor these
two indexes to ensure a valid solution to the problem.
Prioritization method. The AHP has its analytical foundation in the
mathematical structure of consistent matrices and the determination of weights using the
matrices associated right eigenvector (Lipovetsky, 2010; Saaty, 2010). The eigenvector
(relative weight) of the matrix indicates the priority order, and the eigenvalue is an
indication of the consistency of decisions by decision makers (Lipovetsky, 2010; Saaty,
2010). Alternatives to the eigenvector method Saaty used are the logarithmic least square
method, the geometric mean method, the weighted least square (WLS) method, and the
logarithmic goal programming method (Zakaria, Dahlan, & Hussin, 2012).
Wang and Chin (2011) also addressed some of the concerns with the eigenvector
by defining an alternative approach called the linear programming approximation.
Lipovetsky (2011) showed that a solution for the eigenvector is possible using the least
squares method. Barfod and Leleur (2011) proposed the replacement of the eigenvector
with the geometric mean method to avoid potential rank reversal. Researchers used all
these derivatives in their quest to get better optimization. Mattioli and Lamonica (2011)
reviewed multiple prioritizing methods, including eigenvalue method, modified dominant

86
eigenvalue method, direct least squares method, weighted least squares method, and
logarithmic least squares method. Mattioli and Lamonica (2011) found close concordance
among these methods using real data in their comparisons. For this study, I followed the
Saaty eigenvector approach with caution and awareness of possible inconsistencies as
Kazibudzki (2013) highlighted in the study.
Consistency. The AHP is a process to obtain information from SMEs or decision
makers in a structured manner (Saaty & Vargas, 2013a). The process may include precise
measurements or measurements according to perceptions. The judgments made using a
ratio scale provide a judgment matrix that is consistent (Saaty, 2008). According to
Stoklasa et al. (2013), achieving consistency is not possible for a large number of
decision-making criteria. Decision makers can minimize these criteria with the use of a
hierarchy, which allows a two- or three-step judgment process. Wang, Luo, and Xu
(2013) avoided inconsistency with the use of a cross-weight technique.
The AHP is also useful for the testing of consistency of the judgment matrix.
With consistency, the inconsistency in the response of the SMEs is measurable. Decision
makers can calculate the consistency ratio (CR) as the ratio of the consistency index (CI)
to the random index (Chen, Chen, & Chen, 2010). A consistency ratio of less than 0.1 is
acceptable according to Saaty (2006). If the CR is greater than 0.1, decision makers need
a refinement of the judgment metric (pairwise metric; see section on research
methodology). The CR is only acceptable with aggregated weights of criteria to
determine the final priorities of the alternative strategies or solutions to the goal.

87
The AHP pairwise scale. The AHP has three stages: decomposition,
measurement of preferences, and synthesis or fusion. It is a form of structured
complexity. To keep it uncomplicated, decision makers need to break the problem into a
hierarchal structure with levels of homogeneous criteria. The highest level of the
hierarchy defines the goal or the problem (e.g., in choosing the best house to buy). Each
of the following level shows a definition of a cluster or unique criterion of the higher
level. The natural, lowest level is the level of explicit measurement (the attributes). The
attributes may be the third or fourth level used to rank the alternative options (alternative
houses available to buy); a pairwise comparison with the scale of 1 to 9 is the scale Saaty
(2006) preferred to use. Saaty provided the rationale for using a discrete scale of 1 to 9
based on the work of psychologist George Miller in the 1950s. Miller determined that
individuals could not simultaneously distinguish between too many alternatives, about
seven alternatives, to maintain consistency (Saaty, 2006). Most AHP practitioners use the
fundamental scale Saaty proposed, where 1 represents equal importance and 9 represents
an extreme level of importance (see Table 2).
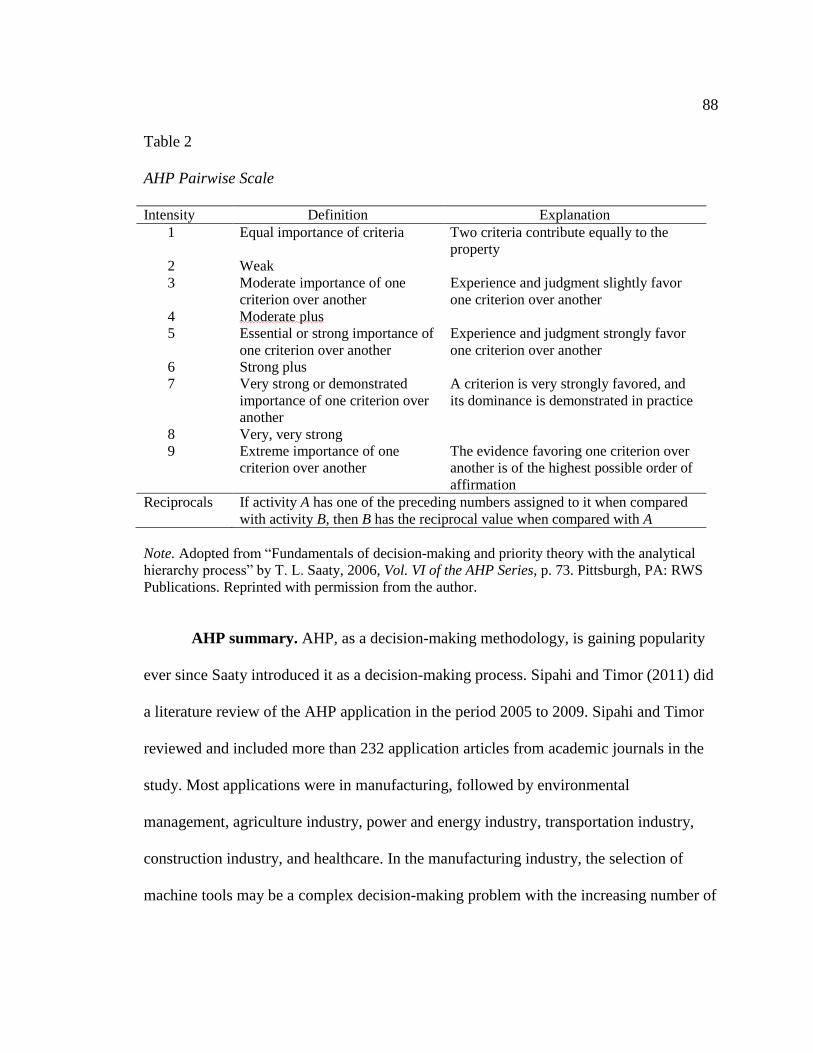
88
Table 2
AHP Pairwise Scale
Intensity Definition Explanation
1 Equal importance of criteria Two criteria contribute equally to the
property
2 Weak
3 Moderate importance of one
criterion over another
Experience and judgment slightly favor
one criterion over another
4 Moderate plus
5 Essential or strong importance of
one criterion over another
Experience and judgment strongly favor
one criterion over another
6 Strong plus
7 Very strong or demonstrated
importance of one criterion over
another
A criterion is very strongly favored, and
its dominance is demonstrated in practice
8 Very, very strong
9 Extreme importance of one
criterion over another
The evidence favoring one criterion over
another is of the highest possible order of
affirmation
Reciprocals If activity A has one of the preceding numbers assigned to it when compared
with activity B, then B has the reciprocal value when compared with A
Note. Adopted from “Fundamentals of decision-making and priority theory with the analytical
hierarchy process” by T. L. Saaty, 2006, Vol. VI of the AHP Series, p. 73. Pittsburgh, PA: RWS
Publications. Reprinted with permission from the author.
AHP summary. AHP, as a decision-making methodology, is gaining popularity
ever since Saaty introduced it as a decision-making process. Sipahi and Timor (2011) did
a literature review of the AHP application in the period 2005 to 2009. Sipahi and Timor
reviewed and included more than 232 application articles from academic journals in the
study. Most applications were in manufacturing, followed by environmental
management, agriculture industry, power and energy industry, transportation industry,
construction industry, and healthcare. In the manufacturing industry, the selection of
machine tools may be a complex decision-making problem with the increasing number of
89
alternatives available.
In summary, the AHP is facilitative of defining a complex problem in terms of
criteria and subcriteria, using a top-down analysis for a bottom-up generation of the
relative importance using a pairwise comparison. Zakaria, Dahlan, & Hussin (2010)
reviewed the possible inconsistency in results using AHP as one of the primary critiques
against AHP. Others have expressed concerns with non-evolutionary computing approach
and the prioritization method (Mattioli & Lamonica, 2011). However, researchers found
they could address these inconsistency problems with the definition of an inconsistency
index. Dong and Saaty calculated the inconsistency index to confirm the reliability of
comparisons (Dong et al., 2010; Saaty, 2006).
The outcome of the AHP is a measurement model that decision makers can use
for the evaluation of possible solutions or alternatives. Forman and Gass (2001)
summarized the AHP and defined three basic functions: (a) structuring complexity, (b)
measuring on a ratio scale, and (c) synthesizing to allow the identification of a preferred
solution. Tsyganok (2011) identified the need for future development in the definition of
measurement stability, with a focus on ranking stability and estimating stability.
Transition and Summary
In Section 1, I identified the need for risk management of environmental
regulatory compliance of oil sands projects in Alberta and defined the research problem.
In this quantitative, descriptive study, I proposed to do an archival database search and

90
literature research to identify potential environmental compliance risks and mitigation
strategies. I used two instruments to obtain input from SMEs.
In this study, I used the AHP to analyze the pairwise comparison data from the
specialized survey and determine the ranking of risks and mitigation strategies. The
literature review provided background on the oil sands in Alberta and identified the
continuous regulatory change and the possible adverse impact of oil sands developments
to the environment. The literature review provided an overview of the history, theory, and
application of AHP in the research.
The primary objective for this study in risk management was the ranking of the
key environmental regulatory compliance criteria and the ranking of mitigation strategies.
The hierarchy of environmental compliance risks and the ranking of mitigation strategies
would help engineers and oil company executives to ensure future environmental
regulatory compliance of oil sands projects.
91
Section 2: The Project
This section presents the research design and the role of the researcher. I also
discuss the analytical hierararchy process (AHP) decision model used for ranking the
environmental regulatory compliance risks and mitigation strategies of in situ oil sands
projects in Alberta. This section includes the process for validating the assumptions
required for the AHP. It also contains the initial survey instrument and data collection
process, as well as the mathematical analysis of the data using the AHP software.
My project was conducted in several steps. I used a group of five SMEs in a pilot
survey to assess the risk ranking and mitigation strategy ranking as part of instrument
validation. I administered the final survey instrument to the larger sample of 15 SMEs.
The results of the study would be helpful to project engineers and executives to have a
better understanding of the ranking of each risk and mitigation strategy. The risk and
mitigation ranking would enable project managers to improve the management of the
regulatory compliance of oil sands projects in Alberta. I chose oil company executives
who managed the key environmental regulatory risks of their businesses because they
contribute to compliance and sustainability of oil sands projects (Ayyub et al., 2010).
More informed managers and engineers of sustainable oil sands projects help to protect
the environment and communities living in the oil sands region.
Purpose Statement
The purpose of this quantitative, descriptive study was to identify the
environmental compliance risks and associated mitigation strategies for oil sands projects
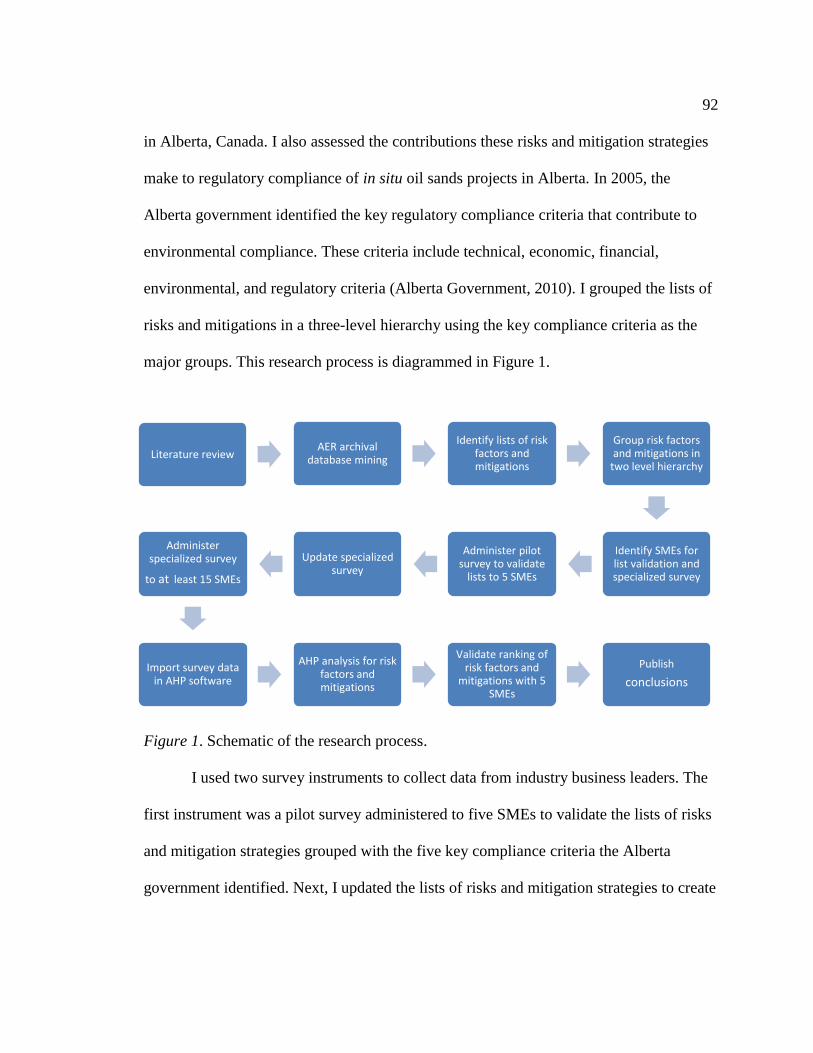
92
in Alberta, Canada. I also assessed the contributions these risks and mitigation strategies
make to regulatory compliance of in situ oil sands projects in Alberta. In 2005, the
Alberta government identified the key regulatory compliance criteria that contribute to
environmental compliance. These criteria include technical, economic, financial,
environmental, and regulatory criteria (Alberta Government, 2010). I grouped the lists of
risks and mitigations in a three-level hierarchy using the key compliance criteria as the
major groups. This research process is diagrammed in Figure 1.
Figure 1. Schematic of the research process.
I used two survey instruments to collect data from industry business leaders. The
first instrument was a pilot survey administered to five SMEs to validate the lists of risks
and mitigation strategies grouped with the five key compliance criteria the Alberta
government identified. Next, I updated the lists of risks and mitigation strategies to create
Literature reviewAER archival
database mining
Identify lists of risk factors and mitigations
Group risk factors and mitigations in
two level hierarchy
Identify SMEs for list validation and specialized survey
Administer pilot survey to validate
lists to 5 SMEs
Update specialized survey
Administer specialized survey
to at least 15 SMEs
Import survey data in AHP software
AHP analysis for risk factors and mitigations
Validate ranking of risk factors and
mitigations with 5 SMEs
Publish
conclusions

93
a pairwise comparison-specialized survey divided into three parts. Part 1 collected
participants’ demographic information. Part 2 consisted of a pairwise comparison of risks
and mitigation strategies based on the adjusted list of risks. Part 3 consisted of a pairwise
comparison of risks and mitigation strategies created using the pilot survey. I
administered the pairwise comparison-specialized survey to at least 15 senior executives
and project engineers of in situ oil sands companies active in Alberta, Canada. I then
imported the pairwise comparison matrices for Parts 2 and 3 into the AHP software.
The research design methodology selected for this study follows some of the
principles Cooper and Schindler (2013) identified in business research. I used a
commercial AHP software package, SuperDecisions, that was suitable for applying the
AHP method (Saaty, 2003). I used SuperDecisions to determine the ranking of risks and
mitigations. Finally, I reviewed the outcome of ranking risks and mitigation strategies
with a small group of oil executives and project engineers, who indicated their acceptance
of the final rankings.
The principles I considered for this study are as follows: (a) method of data
collection, (b) the purpose of the research, (c) the scope of research, and (d) the
researcher’s perception of the research problem (Cooper & Schindler, 2013). The
application of these principles resulted in the research process (see Figure 1). My desire
was to identify those environmental compliance criteria and mitigation strategies that
could contribute to the success of Alberta in situ oil sands projects without detrimental
effects on the environment. I was not directly involved with or responsible for the

94
environmental compliance of an in situ oil sands company and did stand to benefit
directly from the findings; however, this study could have significant influence on the
future risk strategy of oil sands projects in Alberta, Canada.
Role of the Researcher
As the researcher in this study, I first identified risks and mitigation strategies
usingAlberta Energy Regulator (AER) archival data and literature. I personally
administered both the pilot and the specialized survey and analyzed the data following
the AHP, and identified and invited SMEs from oil companies in Alberta to participate. I
also verified the validation and reliability of the survey and the interpretation of the
outcome of the AHP. I had a particular interest in decision-making theory and
environmental risk management, but was not employed by an oil sands company.
However, my research was informed by my working as an engineering consultant in the
oil and gas industry in Alberta since 2003.
Participants
For the AHP list validation phase, I invited five Alberta SMEs from either the Oil
Sands Developers Group (OSDG) or the Canadian Oil Producers Association (CAPP) to
validate the list of risks and mitigation strategies identified in the AER database mining.
In the subsequent pairwise comparison-specialized survey, I used a purposive sample
method and invited 52 Alberta SMEs from the OSDG and CAPP to participate in the
pairwise comparison survey. I also invited a second group of five Alberta SMEs from the
frame to participate in the triangulation of the ranks for risks and mitigations.

95
These participants were all drawn from locally registered oil sands companies.
Alberta has about 40 registered oil sands companies. I invited at least one representative
(an SME) from each oil sands company to participate in the pairwise comparison-
specialized survey. I also invited SMEs that I had access to through personal and
professional relationships. Only executives and senior project engineers working for oil
companies with in situ oil sands projects in Alberta participated in the study. Inviting
participants working on international projects would have had no benefit because these
projects outside Canada were not subject to the Alberta environmental and regulatory
requirements.
I deliberately invited executives, managers, and engineers with an influence on
their respective oil company’s environmental policies, compliance strategy, and risk
management to participate in the study. Compliance with regulatory requirements in
Canada is the responsibility of a company’s board of directors, executives, senior
managers, project engineers, and environmental officers. Under Canadian Federal law,
company executives are personally accountable and liable in case of an environmental
disaster (Torys, 2009). I ensured the confidentiality of participants as follows; I did not
link individual names, company names, and email addresses to the survey and data.
Research Method and Design
I used an analytic MCDM decision model that employs the AHP technique to
conduct this quantitative descriptive study. I first identified the environmental
compliance risks and mitigation strategies documented in the literature and the AER

96
archival database. The AER keeps a database of all reports filed for regulatory
compliance of oil sands projects (ERCB, 2008). The reports were self-disclosure; project
engineers and project managers identified all regulatory compliance issues and reported
to the AER. The database also included regulatory compliance reports (from the AER) of
investigations of compliance problems the AER inspectors identified on in situ oil sands
projects (ERCB, 2010). Figure Error! No text of specified style in document.2 shows the
research design.
I used five SMEs for the pilot survey selected from members of CAPP or OSDG,
at least 15 SMEs in the specialized survey, and a second group of five SMEs for
triangulation of the final rankings. I collected one specialized survey per oil sands
company, with the exception of two companies from which two SMEs participated to
check for inter rater reliability. The purposive sample of project engineers and company
executives provided the best possible data since these engineers and executives were
directly responsible for the risk management process during project planning and
implementation.

97
Figure Error! No text of specified style in document.2. Flow chart for the research
design.
Method
Once the pairwise comparison data became available, I prioritized risks and
mitigation strategies related to environmental regulatory compliance of in situ oil sands
projects. I used the AHP, in accordance with the technical details Saaty (2006) defined,
Step M1
•Start
•Do a literature search for environmental compliance risk factors and mitigations applicable to in situ oil sands projects.
Step M2
•Search AER database to create initial comprehensive lists of risk factors and mitigations
Step M3
•Group risk factors and mitagations from steps M1 and M2 in a hierarchy using five key risk factors
StepM4
•Administer list validation pilot
•Select five SMEs to validate and create the final lists of risk factors and mitigations
Step M5
•Create specilized survey
•Part 1 Demographic information
•Part 2 Risk factor pairwise matices
•Part 3 Mitagation pairwise matix
StepM6
•Administer pairwise comparison specialized survey
•The specialized survey was administered to 15 or more SMEs.
Step
M7
•AHP analyses
•Import data and analyze data using AHP software SuperDecisions
Step M8
•Triangulation
•Triangulate the rankings for risk factors and mitigations created by AHP using second group of five SMEs

98
and implemented in the software SuperDecisions. The use of a quantitative method such
as the Delphi technique may also be helpful to the researcher to identify and provide a
spectrum of the key risks and mitigation strategies. However, the Delphi technique is
tedious. If I identified multiple risks, then the Delphi technique would require multiple
surveys (Yeung et al., 2012). Multiple surveys could be too time-consuming and could
have discouraged executives to participate. Contrary to the effects of the Delphi
technique, the AHP indicates the avoidance of injecting researcher subjectivity that may
skew the outcome and final rankings of environmental compliance risks and mitigation
strategies. The use of exploratory factor analysis (EFA) as a qualitative research method
was also possible. However, this method required a large number of participants to
prepare for a statistical valid analysis of a set of observed variables, and this study had a
relative small sample of SMEs available.
The AHP was an appropriate method, as its practitioners could implement a
systems approach to the problem and for a quantitative ranking of qualitative
information. The AHP was a framework that was helpful for explaining the problem or
goal as a system with a hierarchy (Saaty, 2006). The AHP was also facilitative of a
systematic organization of the problem into smaller parts, to the point of pairwise
comparison at the level of basic reasoning. The AHP practitioner could explicitly define
the problem while working with smaller parts of a bigger problem. With the AHP, the
practitioner could control the smaller parts of the problem better and be more thorough in
the definition of the problem. The decision maker could use pairwise comparisons in the

99
AHP to define ratio scales at each level of the hierarchy. The pairwise comparisons could
allow for comparisons based on intuition. Pairwise comparison could also provide a
methodology to convert qualitative and quantitative data to comparable mathematic
values (Saaty, 2006).
With my decision to use a pairwise comparison, specialized survey to obtain data
for an analytical MCDM process (e.g., AHP), I was able to analyze and rank the
environmental compliance risks and mitigation strategies. I derived a conclusion on the
ranking of risks and mitigation strategies using a quantitative process. The AHP
technique depends on inputs from a group of SMEs. Group decision-making supported
Cooper and Schindler’s principle of reliable data and the involvement of participants in
the research activity (Cooper & Schindler, 2013). With the involvement of SMEs in the
process, reviewing the interrater reliability was possible by recruiting more than one
SME from two oil sands companies.
Relative measurement. Saaty (2006) demonstrated in his work the potential of
the AHP, which is useful to practitioners to quantify emotional criteria in a decision-
making problem. Saaty (2006) used a ratio scale (RC) to measure the criteria that
comprise the hierarchy. Scale of attributes may be measurable in physical dimensions or
relative scales based on the importance of one objective to another (Saaty, 2011). With a
normalized scale, practitioners could convert qualitative information to quantitative
values. Saaty (2006) and Saaty and Vargas (2013b) proposed a 9-point scale. Yetim
(2013) stated the 9-point scale works best if the number of criteria is less than seven. The

100
AHP includes the use of various scales (Kusherbaeva, Sushkov, & Tamazian, 2011b),
and the most acceptable are the Saaty scale. The transformation process from verbal to
the numerical scale still depends on the subjectivity of the individual decision maker
(Ishizaka, Balkenborg, & Kaplan, 2011a; 2011b.)—another reason why a group of SME
decision makers will stabilize this possibility. The transformation process is helpful for
transforming a qualitative criterion into a quantitative criterion comparable to other
quantitative criteria. I used the proposed 9-point scale in this study.
AHP is easy to use. The AHP originated in mathematical axioms (Forman &
Gass, 2001), but a relatively easy methodology to use (Saaty, 2006). Cooper and
Schindler (2013) identified the AHP as a research design concept. Academia, strategists,
scientists, engineers, governments, health service professionals, and corporate decision
makers, without the necessity of lengthy training, use the AHP (Saaty, 2006). Decision
makers find it easy to use. The defined measurement scales are relative to the problem
and are suitable for addressing and providing a solution to the problem (Saaty, 2006).
AHP and uncertainty. The literature indicated a debate regarding the difficulty
of handling uncertainty in the decision process and the ability of the AHP to manage
uncertainty (Tseng, 2010). Tseng stated that the scale of 1 to 9 Saaty proposed is an
ineffective way of defining or capturing uncertainty. Practitioners revert to fuzzy-AHP to
compensate for uncertainty in criteria associated with the decision-making process
(Cozannet, Garcin, Bulteau, Mirgon, Yates, Méndez, ... & Oliveros, 2013; Toth,

101
Wolfslehner, & Vacik, 2014; Wang, Chan, Yee, & Diaz-Rainey, 2012; Wang, Wu, &
Lin, 2012)
Uncertainty is a function of the data used, and in this study, I retrieved the data
from the AER database and used a survey to acquire inputs from SMEs. The risk with the
highest possible uncertainty in this study is the possible change in environmental
regulations during the project life cycle that decision makers did not anticipate. Those
environmental risks that relate to qualitative data may cause an uncertainty as some
researchers reported (Cozannet, et al. 2013). With the pairwise comparison for subjective
and qualitative criteria, the decision maker finds it difficult to determine the exact value
(Cozannet, et al. 2013). Researchers and decision makers can overcome this uncertainty
with inputs from a large group of SMEs and review the consistency of the decision. One
of the advantages of the AHP is the possibility to change qualitative data to quantitative
values on a scale of 1 to 9. If a practitioner needs to prioritize a large group of criteria or
criteria using pairwise comparison, the task may become complex along with a cognitive
problem for the decision maker that creates consistency problems (Saaty, 2006). For this
reason, reviewing the criteria and identifying subcriteria or an intermediate level
supporting the criteria, and the goal are essential. As recommended by Yetim (2013),
defining subcriteria would also ensure the level has not more than seven criteria.
Rationality in AHP. Saaty (2006) described the decision-making process as a
method within the context of a system with interacting elements (also called factors or
criteria). Each element has causes and effects influential to the system’s behavior, which

102
is difficult for the decision maker to comprehend. Saaty defined five principles for a
decision-making process:
simple in design,
suitable for individual or group decision-making,
natural to the decision makers’ intuition and conventional thinking,
able to promote consensus and compromise, and
easy to learn and understand.
Meeting the criteria is possible for an MCDM process or framework that Saaty (2006)
envisaged if the decision maker defines a problem or goal in a systematic way. A
hierarchy is complete if the decision maker evaluates elements at one level in terms of all
the elements at the next higher level. In a hierarchy, developing some elements or criteria
to the next lower level is possible in the process to provide more attention or gain a level
with measurable attributes (Saaty, 2006). The AHP is facilitative of defining a complex
problem in terms of criteria and subcriteria. The decision maker follows a top-down
analysis when all the alternatives are unknown and a bottom-up process when the
alternatives are identifiable. The objective is to choose the best alternative.
Hierarchies and hierarchy synthesis. A fundamental problem will have at least
three levels: the problem or goal (level 0), the objectives or criteria (Level 1), and the
alternatives (alt.). Decision makers may add subfactors or subcriteria (Level 2; Saaty,
2006), as shown in Figure 3. With these levels, the problem will have alternative
solutions at the bottom of the hierarchy. The relationships among criteria of the same

103
order and magnitude are essential in creating a hierarchy and in defining the levels. Saaty
(2006) stated that an attribute in a lower level must have an association with one or more
attributes of the next higher level.
Figure 3. The AHP hierarchy.
Hierarchy description and types of hierarchies. The two types of hierarchies
are structural and functional. Structural hierarchies apply to the system in terms of
criteria of structural or physical properties, such as material, form, size, color, weight, or
shape. Functional hierarchies refer to the system in terms of its functions rather than
physical properties. The functional relationships of a complex system or problem are
Goal
(Level 0)
Criteria A
(Level 1)
Sub-Criteria A1
(Level 2)
Alt.
Alt.
Alt.
Alt.
Sub-CriteriaA2
Alt.
Alt.
Alt.
Alt.
Criteria B
Sub-CriteriaB1
Alt.
Alt.
Alt.
Alt.
Sub-CriteriaB2
Alt.
Alt.
Alt.
Alt.
Sub-CriteriaB3
Alt.
Alt.
Alt.
Alt.
Sub-CriteriaB4
Alt.
Alt.
Alt.
Alt.
Criteria C
Sub-CriteriaC1
Alt.
Alt.
Alt.
Alt.
Sub-CriteriaC2
Alt.
Alt.
Alt.
Alt.
Sub-CriteriaC3
Alt.
Alt.
Alt.
Alt.

104
helpful for steering the system to a common goal or solution to the problem (Saaty,
2006). Functional hierarchies are the backbone of the AHP.
The AHP has two modes: the distributive mode and the ideal mode (Dolan, 2010).
The distributive mode has a focus on determining the ranking of a set of options. The
ideal mode has a focus on identifying the best set of opinions. For this study, I used the
distributive mode to determine the ranking of risks and mitigation strategies.
The AHP synthesis. The final step in the AHP is fusion or synthesis, which is a
way to calculate the final composite weight for each alternative or to integrate the
multiple criteria of a problem to reach a conclusion or decision.
Rank preservation and reversal. The relationships between criteria A, B, and C
have consistent transitivity when A is preferred to B, and B is preferred to C. Then A is
preferred to C. The AHP allows for inconsistent transitivity relationships. For example, if
A is preferred to B, and B is preferred to C, then A may be preferred to C or C may be
preferred to A. Researchers have reported inconsistent transitivity relationships
(Kusherbaeva, Sushkov, & Tamazian, 2011a; Pecchia, Bath, Pendleton, & Bracale, 2011;
Zhang, Zhu, Wu, & Wang, 2010). Ishizaka (2012) stated that the Saaty scale is a non-
transitivity scale; therefore, the need to test for transitivity to show the pairwise matrix is
consistent.
Research Design
For the study, I did an archival database search and then used two instruments to
obtain information from SMEs: a pilot survey and a pairwise comparison survey. The

105
ranking risks and mitigations required input from SMEs. Using a specialized survey and
the AHP allowed the SMEs to provide inputs anonymously and a methodology to access
the working hypotheses described in Section 1. Hence, I used a decision analytic design
as applied to MAUT (Estévez et al., 2013; Posavac & Carey, 2007). For a decision
analytic design, Posavac and Carey (2007) identified five elements:
1. Identify the decision maker.
2. Identify the issue or issues the decision maker has to address; identify the
choices or options the decision maker has to evaluate; identify the relevant
dimensions of value, and rank the dimensions in order of importance.
3. Identify the choices or options the decision maker has to evaluate.
4. Identify the relevant dimensions of value.
5. Rank the dimensions in order of importance.
The decision makers play a pivotal role in the decision analytic design; they use
their training or experience and guidelines from their organization to make decisions. In
this study, the decision makers are the SMEs. The issues they addressed in this research
were environmental regulatory compliance of in situ oil sands projects in Alberta. The
options I evaluated were the compliance criteria defined in the environmental regulations
and the dimensions of value that would minimize the environmental impact of in situ oil
sands exploration. The third option was to comply with the minimum values for the
specified environmental criteria.
Therefore, the first step in this AHP research design was to identify risks and

106
mitigation strategies reported to the AER and captured in the AER oil sands database. I
provided a hierarchy of risks for pairwise comparisons by the SMEs. The first level of the
hierarchy consisted of key compliance criteria identified in the Alberta Government
Environmental Strategy: (a) technological risks, (b) social risks, (c) financial risks, (d)
economic risks, and (e) regulatory compliance risks (Government of Alberta, 2009).
Regulatory compliance consisted of two subgroups: human environmental risks
and natural environmental risks (e.g., land use, water quality, water usage, and air
quality). I listed the mitigation strategies in the second list for pairwise comparisons by
SMEs.
Population and Sampling
In this study, I focused on the application of AHP on a sample of responses
obtained from a population of risk management SMEs involved in Alberta in situ oil
sands projects. I elected to do this study on the oil sands in Alberta because of the high
concentration of in situ oil sands projects in the province. More than 87 oil sands projects
in different the stages of execution are in Alberta (Government of Alberta, 2010).
The second reason for selecting Alberta was that I could form the sample frame
via direct business contacts. I solicited executives and engineers from the sample frame;
they were members of either CAPP or the OSDG. I also examined the purposeful sample
frame to ensure the participants (a) took an active involvement in the decision-making
and (b) were involved in risk management or environment, health, and safety (EH&S)
management. Eligibility depended on the participant’s organizational function and
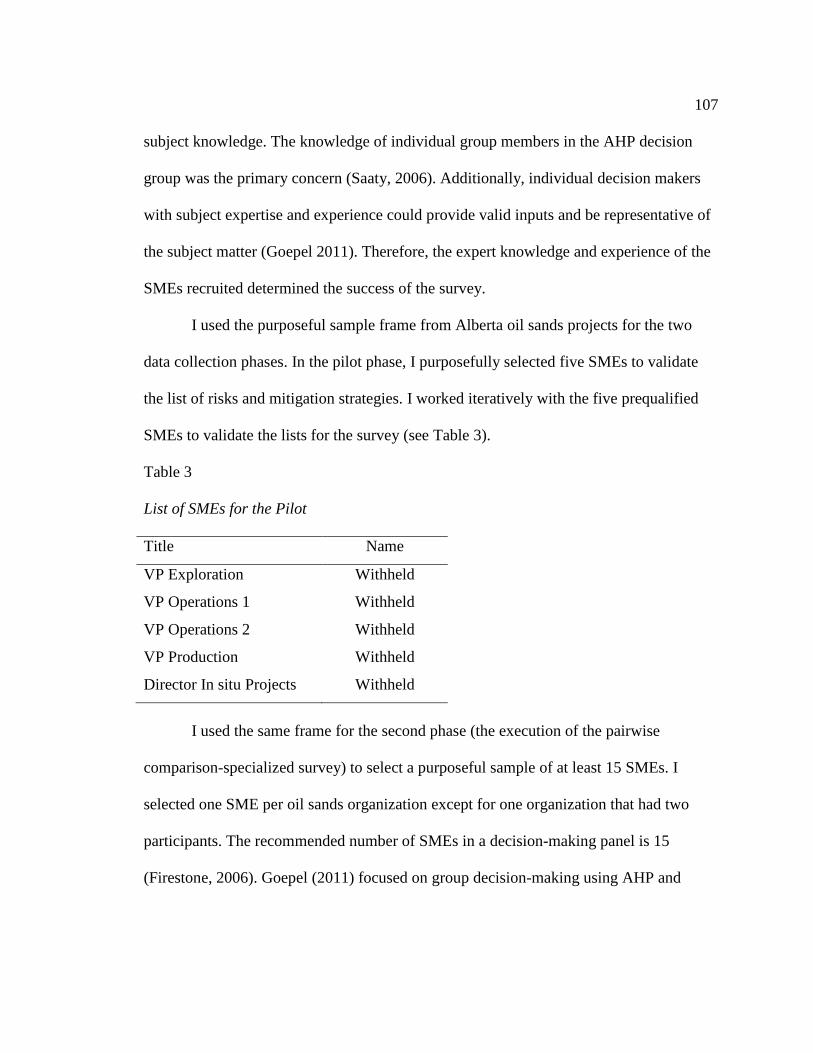
107
subject knowledge. The knowledge of individual group members in the AHP decision
group was the primary concern (Saaty, 2006). Additionally, individual decision makers
with subject expertise and experience could provide valid inputs and be representative of
the subject matter (Goepel 2011). Therefore, the expert knowledge and experience of the
SMEs recruited determined the success of the survey.
I used the purposeful sample frame from Alberta oil sands projects for the two
data collection phases. In the pilot phase, I purposefully selected five SMEs to validate
the list of risks and mitigation strategies. I worked iteratively with the five prequalified
SMEs to validate the lists for the survey (see Table 3).
Table 3
List of SMEs for the Pilot
Title Name
VP Exploration Withheld
VP Operations 1 Withheld
VP Operations 2 Withheld
VP Production Withheld
Director In situ Projects Withheld
I used the same frame for the second phase (the execution of the pairwise
comparison-specialized survey) to select a purposeful sample of at least 15 SMEs. I
selected one SME per oil sands organization except for one organization that had two
participants. The recommended number of SMEs in a decision-making panel is 15
(Firestone, 2006). Goepel (2011) focused on group decision-making using AHP and
108
suggested using a group of at least five SMEs for AHP. Goepel (2011) and Saaty (2006)
concluded the background and experience of the SMEs are more valuable to the success
of AHP than the number of SMEs in the decision-making panel.
In this study, I followed the guidelines from Firestone and Goepel. My objective
was to recruit a purposeful sample of 15 or more SMEs from the frame. I planned to send
an invitation via email to at least 40 participants with a copy of the survey. The pairwise
comparison-specialized survey included two sections. The first section gave a brief
description of the purpose of the research and an explanation of the research problem.
The second section was an Excel spreadsheet, which contained the lists of environmental
compliance risks and mitigation strategies and two pairwise matrixes the participant had
to complete.
Ethical Research
An objective for my research was to adhere to the highest ethical standards set
by Walden University. Therefore, the voluntary participants (SMEs) provided data in
accordance with the National Institutes of Health (NIH) Office of Extramural Research
and Walden University’s Institutional Review Board (IRB) guidelines. Appendices A and
B contain the consent form and a letter of cooperation, respectively. After receiving
permission from the SMEs, participation in the study was voluntary, and all SMEs had
the choice to withdraw at any time without any consequences. Participating in this study
had no risk. I asked five SMEs to participate also in a pilot survey and to validate the
specialized survey. The benefit to SMEs participation in the study was that of helping to
109
rank environmental compliance risks and mitigation strategies for oil sands projects.
Participating in the study entailed no compensation. I will provide an executive summary
of the results to all participants after approval of my dissertation and after I have formally
graduated.
I collected the data anonymously from the voluntary participants and companies
and will keep the data secured by storing them on a CD disk for five years in my home
office, as Walden University requires. Subsequently, I shall destroy the data in
compliance with Walden University IRB guidelines. I did not collect or analyzed data
until I received the formal IRB approval.
Data Collection
Instruments
For the study, I used two instruments. The first instrument was two lists of project
risks and mitigation strategies compiled from the literature and AER oil sands database. I
validated this list in the pilot phase with five SMEs. I used the validated list to update the
specialized survey. The second instrument was a pairwise comparison-specialized survey
to obtain data from the SMEs. The specialized survey consisted of three parts.
Part 1 was about general/demographic information for each participant to fill.
Part 2 was the pairwise comparison of risks based on the validated list of
risks.
Part 3 was the pairwise comparison of mitigations based on the validated list
of mitigations.

110
Appendix C has the preliminary pairwise comparison-specialized survey. I
captured the pairwise comparison for risks and mitigation strategies in pairwise matrices,
using an Excel spreadsheet. The participants completed the matrices, which I used to
import the data to the AHP software, SuperDecisions. W. J. Adams of Embry Riddle
Aeronautic University, Florida and Rozann W. Saaty of Creative Decisions Foundation,
Pittsburgh, Pennsylvania developed the SuperDecisions software for the AHP (Saaty,
2003). Alternative software available includes Criterion DecisionPlus, Decision Lens,
Expert Choice, JavaAHP, Make-it-Rational, and Select Pro (Kusherbaeva, Sushkov, &
Tamazyan, 2011c). Developing an Excel model is also possible for analyzing data.
However, I did not consider the Excel option, as the time to develop and validate the
Excel model would have been too long. I executed the specialized survey in five steps
(see Figure 4).
I received the pairwise comparison survey’s results and conducted the AHP
analysis using SuperDecisions. After sending the specialized survey, I sent two follow-up
emails. I sent the first email one week after the specialized survey. To those who have not
responded, I did send a second email at the end of the second week. The follow-up emails
contained the same information as the original invitation. I hoped the personal connection
obtained before sending the survey would have helped to increase the response rate from
20–50%. Fifteen or more participants would provide sufficient data to perform the AHP
for risk and mitigation strategy rankings (Firestone, 2006; Goepel, 2011).

111
Figure 4. Execution steps for specialized survey.
Data Collection Technique
The data collection consisted of three phases. In Phase 1, I conducted a literature
review and data mining to identify the list of risks and mitigation strategies (see
Appendix C for a preliminary list). In Phase 2, a pilot phase, I administered the list to a
Step S1
• Obtain a list of 40 oil sands projects from CAPP and OSDG and identify one SME per company.
Step S2
• Email request to 40 potential participants in the study with a consent form and ask for acknowledgement.
• Email the survey to those who acknowledged and returned the consent form.
Step S3
• Get a response from participants.
• If more than 15 persons respond, then all will receive the survey.
• If fewer than 15 persons respond, then additional potential participants will be called to ensure at least 15 SMEs will participate in the study.
Step S4
• Email surveys to n (greater than or equal to) > 15 participants who have signed the consent form.
Step S5
• Send the specialized survey in Excel file format to participants (see Appendix D).

112
group of five SMEs for validation and calibration. Phase 3 involved establishing the
pairwise decision specialized survey that I administered to 15 SMEs (see following for
details).
The first phase of my data collection included a literature review and data mining
using the AER environmental compliance database. This database contained in situ oil
sands environmental compliance reports the oil companies submitted to the AER since
2000. I used this data along with information from the literature review to define a list of
environmental compliance risks and a list of mitigation strategies. I used lists of risks and
mitigation strategies to define two risk management hierarchies. The pairwise
comparison-specialized survey in Appendix C includes risks and mitigation strategies.
In Phase 2, I administered the lists to a group of five SMEs. The objective of this
pilot survey was to review the lists of risks and mitigation strategies to ensure their
validity and clarity. The pilot survey included a comment field for each risk and the
definition of mitigation strategy in the lists. The participants used the comment field to
provide recommendations and rewording of risks and mitigation definitions. I analyzed
the responses from the validation group and used the updated lists to improve the
pairwise decision specialized survey.
In Phase 3, the specialized survey, I administered the use of an Excel spreadsheet
to more than 15 SMEs. I followed up to ensure they responded as early as possible. I
imported the data received to the AHP software (SuperDecisions) and performed the
analysis (see data analysis section for details). The second group of five SMEs validated

113
the rankings of risks and mitigations obtained from the AHP analysis. I used the
responses from the five SMEs as input to determine the conclusions of the rankings.
Data Organization Techniques
I maintained a comprehensive research log defining every step of the research,
data collection, and schedule of interviews (telephonic recruitment of SMEs). Carcary
(2009) recommended a research log, which is facilitative of making a research trail
transparent and of improving the data organization. I saved the data from the survey and
analysis on a CD-ROM for reference. I will store it for five years and then destroy it
afterwards as Walden University IRB guidelines recommended.
Data Analysis Technique
I analyzed the data from the pilot survey and pairwise decision survey using the
SuperDecisions AHP software mentioned previously. In the study, I used the AHP for
risk management. The following example shows the application of the AHP in defining
the rankings of risks for oil sands compliance. The application of AHP consisted of eight
steps (see Figure 5). Following is a detailed explanation of each step.

114
Figure 5. AHP execution steps.
Step A1: Setup the matrix of criteria. The hierarchical structure used by AHP
permits users to better focus on specific criteria when doing a pairwise comparison
Step A1
• Set up the matrix of factors (and subfactors for lower level analysis) and pairwise comparison scores in an Excel spreadsheet.
Step A2
• Import data from the survey (Excel spreadsheet) into the SuperDecisions.
Step A3
• Check for outliers in the data and ensure all judgments are within the 1 to 9 range. Note those outside this range for correction after computations are done, and inconsistency index is calculated by SuperDecisions.
Step A4
• Calculate priorities, calculate the eigenvalues, and normalize the rankings.
Step A5
• Perform computations for the factors and subfactors using the survey data.
Step A6
• Check the consistency, and determine inconsistency index and inconsistency ratio
Step A7
• Normalize the ranking data.
Step A8
• Aggregate and interpret the rankings.
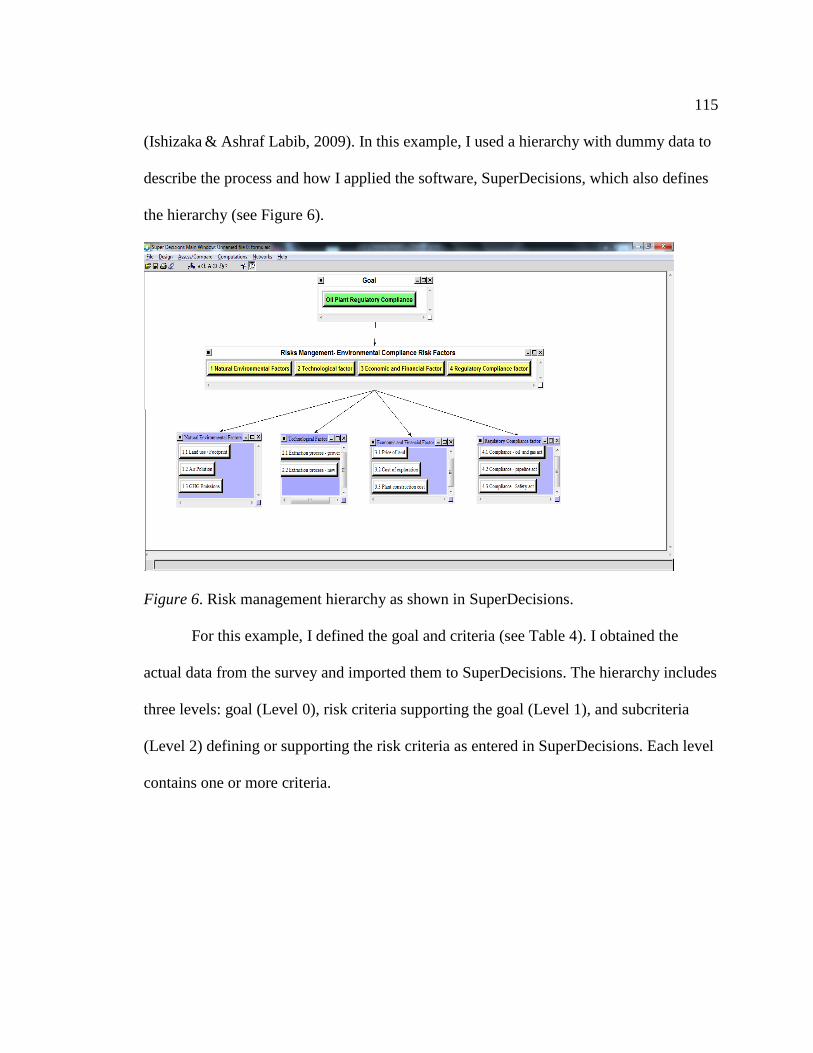
115
(Ishizaka & Ashraf Labib, 2009). In this example, I used a hierarchy with dummy data to
describe the process and how I applied the software, SuperDecisions, which also defines
the hierarchy (see Figure 6).
Figure 6. Risk management hierarchy as shown in SuperDecisions.
For this example, I defined the goal and criteria (see Table 4). I obtained the
actual data from the survey and imported them to SuperDecisions. The hierarchy includes
three levels: goal (Level 0), risk criteria supporting the goal (Level 1), and subcriteria
(Level 2) defining or supporting the risk criteria as entered in SuperDecisions. Each level
contains one or more criteria.

116
Table 4
Definition of Dummy Risk Management
Hierarchy Definition Definition of criteria
Level 0
Goal
Oil sands regulatory
compliance
Identify risks important to managing
the regulatory compliance and rank
their importance to compliance
Level 1
Risk criteria
Identify risk management
compliance risks
1. Economic and financial risk
2. Natural Environmental risk
3. Regulatory compliance risk
4. Technological risk
Level 2
Subcriteria
1. Economic and
financial risk
1.1 Cost of exploration
1.2 Plant construction cost
1.3 Price of land
2. Natural Environmental
factor
2.1 Air Pollution
2.2 GHG Emissions
2.3 Land use/Footprint
2.4 Water use
3. Regulatory compliance
risk
3.1 Compliance with pipeline act
3.2 Compliance with oil sand act
3.3 Compliance with Safety Codes Act
4. Technological risk
4.1 Ongoing Research
4.2 Process, new
4.3 Process, proven
Step A2: Import data from the survey into the software. I imported data from
the survey via an Excel spreadsheet in SuperDecisions using the screen (see Figure 7).
The SMEs did the pairwise comparisons specialized survey using the Saaty scale to
compare the importance of criteria A to criteria B with respect to the goal. The survey
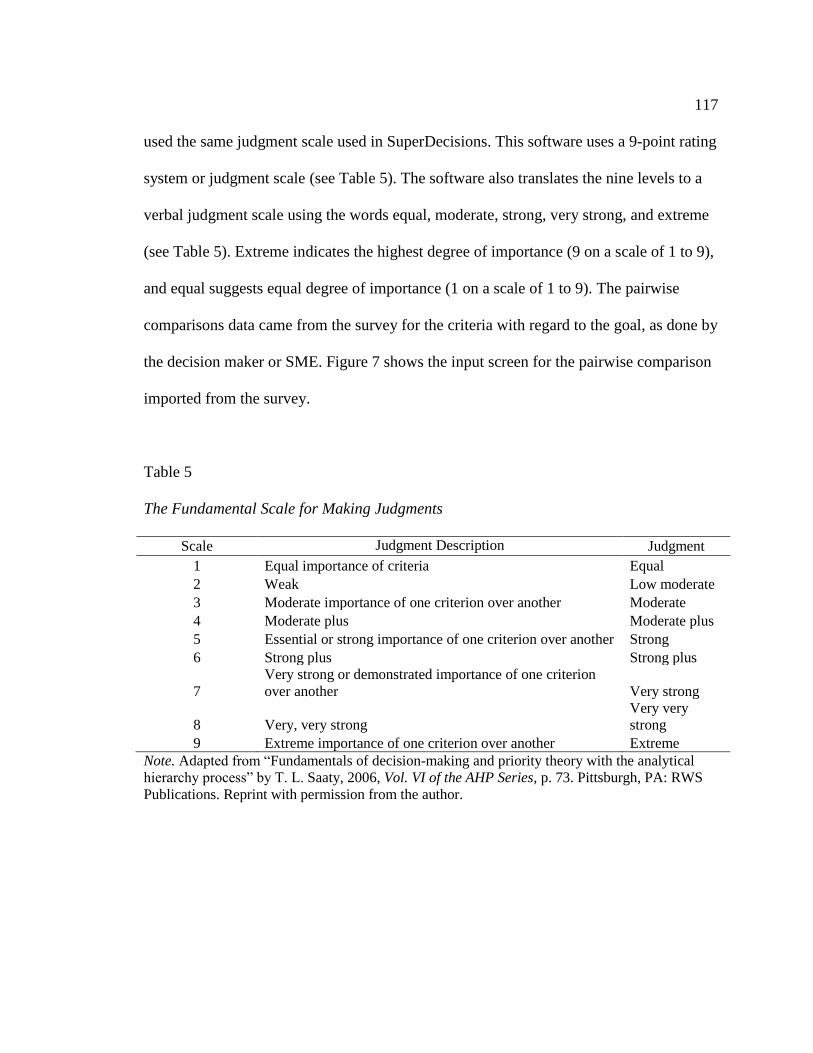
117
used the same judgment scale used in SuperDecisions. This software uses a 9-point rating
system or judgment scale (see Table 5). The software also translates the nine levels to a
verbal judgment scale using the words equal, moderate, strong, very strong, and extreme
(see Table 5). Extreme indicates the highest degree of importance (9 on a scale of 1 to 9),
and equal suggests equal degree of importance (1 on a scale of 1 to 9). The pairwise
comparisons data came from the survey for the criteria with regard to the goal, as done by
the decision maker or SME. Figure 7 shows the input screen for the pairwise comparison
imported from the survey.
Table 5
The Fundamental Scale for Making Judgments
Scale Judgment Description Judgment
1 Equal importance of criteria Equal
2 Weak Low moderate
3 Moderate importance of one criterion over another Moderate
4 Moderate plus Moderate plus
5 Essential or strong importance of one criterion over another Strong
6 Strong plus Strong plus
7
Very strong or demonstrated importance of one criterion
over another Very strong
8 Very, very strong
Very very
strong
9 Extreme importance of one criterion over another Extreme
Note. Adapted from “Fundamentals of decision-making and priority theory with the analytical
hierarchy process” by T. L. Saaty, 2006, Vol. VI of the AHP Series, p. 73. Pittsburgh, PA: RWS
Publications. Reprint with permission from the author.

118
Figure 7. Level 1 pairwise comparisons input by the SME.
Step A3: Check for outliers in the data and consistency. I checked the data
from the survey by reviewing the pairwise comparison screens in SuperDecisions for
each level (see a typical screen in Figure 8 and Figure 9). Figure 10 shows the pairwise
comparison for risks with respect to the goal, and Figure 11 shows the pairwise
comparison for the subcriteria with respect to one of the Level 1 risks.
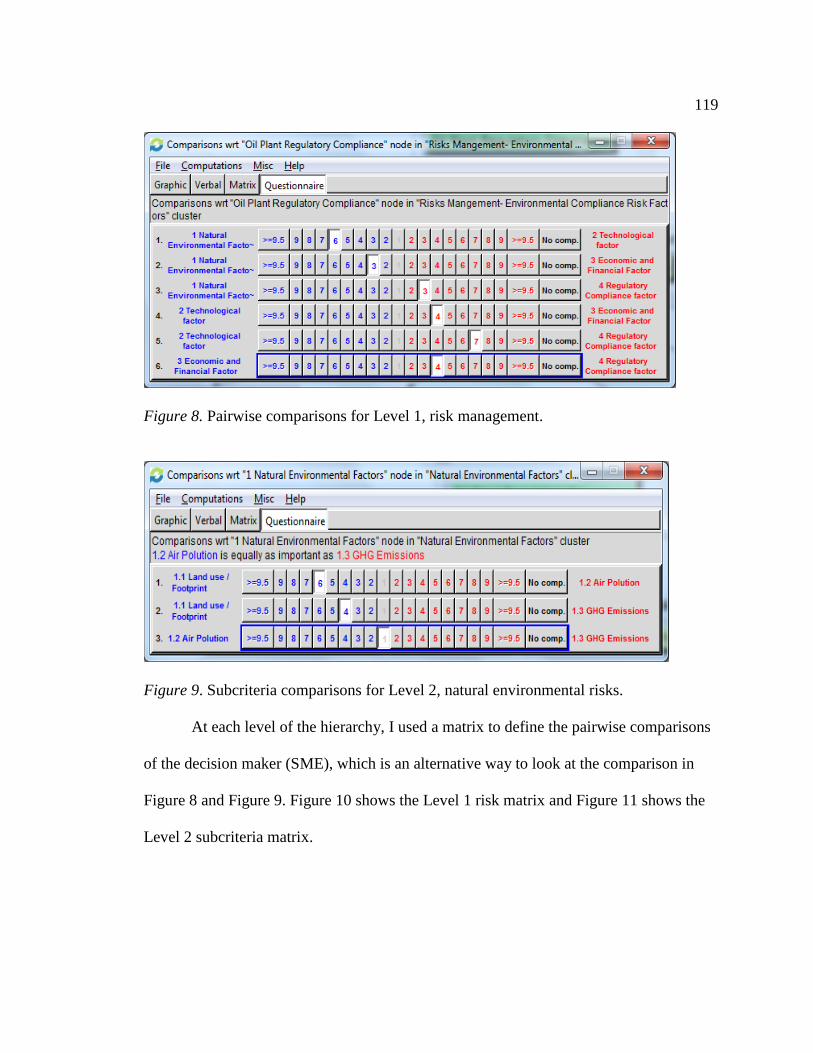
119
Figure 8. Pairwise comparisons for Level 1, risk management.
Figure 9. Subcriteria comparisons for Level 2, natural environmental risks.
At each level of the hierarchy, I used a matrix to define the pairwise comparisons
of the decision maker (SME), which is an alternative way to look at the comparison in
Figure 8 and Figure 9. Figure 10 shows the Level 1 risk matrix and Figure 11 shows the
Level 2 subcriteria matrix.
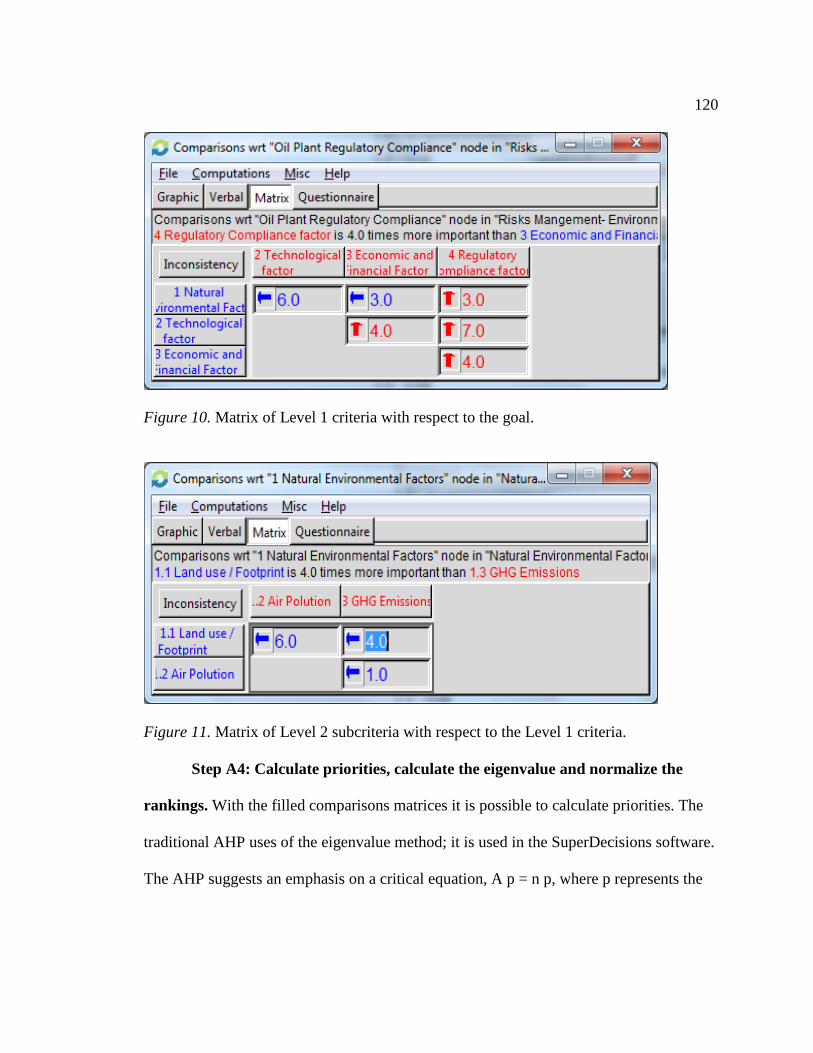
120
Figure 10. Matrix of Level 1 criteria with respect to the goal.
Figure 11. Matrix of Level 2 subcriteria with respect to the Level 1 criteria.
Step A4: Calculate priorities, calculate the eigenvalue and normalize the
rankings. With the filled comparisons matrices it is possible to calculate priorities. The
traditional AHP uses of the eigenvalue method; it is used in the SuperDecisions software.
The AHP suggests an emphasis on a critical equation, A p = n p, where p represents the
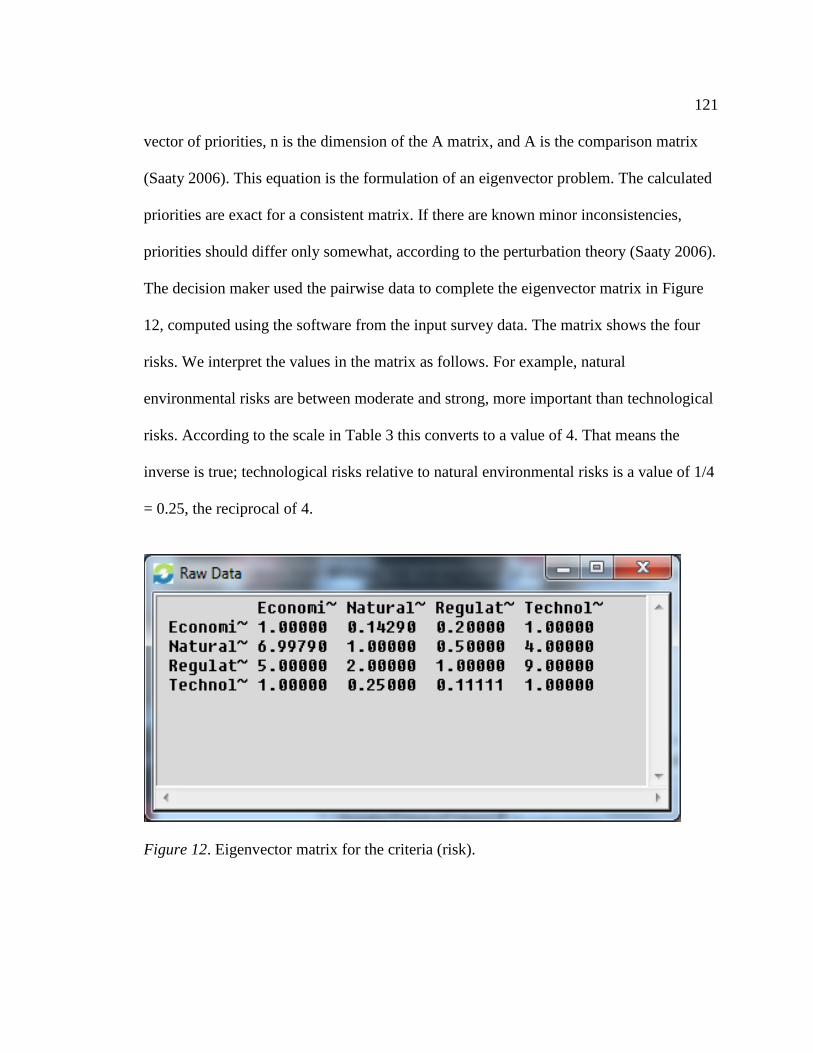
121
vector of priorities, n is the dimension of the A matrix, and A is the comparison matrix
(Saaty 2006). This equation is the formulation of an eigenvector problem. The calculated
priorities are exact for a consistent matrix. If there are known minor inconsistencies,
priorities should differ only somewhat, according to the perturbation theory (Saaty 2006).
The decision maker used the pairwise data to complete the eigenvector matrix in Figure
12, computed using the software from the input survey data. The matrix shows the four
risks. We interpret the values in the matrix as follows. For example, natural
environmental risks are between moderate and strong, more important than technological
risks. According to the scale in Table 3 this converts to a value of 4. That means the
inverse is true; technological risks relative to natural environmental risks is a value of 1/4
= 0.25, the reciprocal of 4.
Figure 12. Eigenvector matrix for the criteria (risk).

122
Step A5: Perform computations for the criteria and subcriteria using the
survey data. The software performs the computations and calculates the consistency
ratio (CR; SuperDecisions has the term consistency index) every time it runs AHP. The
software runs AHP for each hierarchy level: first for each criterion (SuperDecisions –
node) on the subcriteria level (see Figure 13) and then for the Level 1 criteria. Figure 14
shows the result of the Level 1 criteria pairwise comparison. The results indicate that
regulatory compliance has the highest risk ranking, and technological risk has the lowest
risk ranking.
Figure 13. Results subcriteria ranking and inconsistency ratio.

123
.
Figure 14. The results of risk ranking and inconsistency ratio.
Step A6: Check the consistency and determine inconsistency index and
inconsistency ratio. The pairwise decisions of SMEs make sense only if we obtain the
resulting rankings from consistent or near consistent matrices. A researcher must apply a
consistency check as Saaty (2006) proposed. Saaty introduced a consistency index (CI)
and a random index (RI) for n x n matrices (see
Table 6). The inconsistency index of more than 500 randomly generated pairwise
comparison matrices Saaty calculated is the basis of the RI. CR = CI/RI gives the
consistency ratio (CR), the ratio of CI and RI.
Table 6
Random Index (RI)
N 2 3 4 5 6 7 8

124
RI 0.00 0.58 0.90 1.12 1.24 1.34 1.41
Saaty (2006) made some improvements on his inconsistency ratio in 1990 and
later introduced a threshold of 5% for 3 x 3, and 8% for 4 x 4 matrices. Ergu, Kou, Peng,
and Shi (2011) proposed AHP practitioners should keep the original comparison
information as far as possible when increasing the consistency ratio of metrics. I followed
the same approach in this study. Figure 13 and Figure 14 show the priorities (ranking)
derived from the pairwise matrix for criteria and subcriteria with acceptable CRs of
0.29% and 4.12%, respectively. SuperDecisions indicates that the CR should be less than
10% = 0.01. The software, SuperDecisions, shows an inconsistency report for the
hierarchy, as well as changes to improve the consistency of the matrix (see Figure 15 and
Figure 16). The changes should transpire in the pairwise comparison (see Figure 8 and
Figure 9 for the applicable criteria).
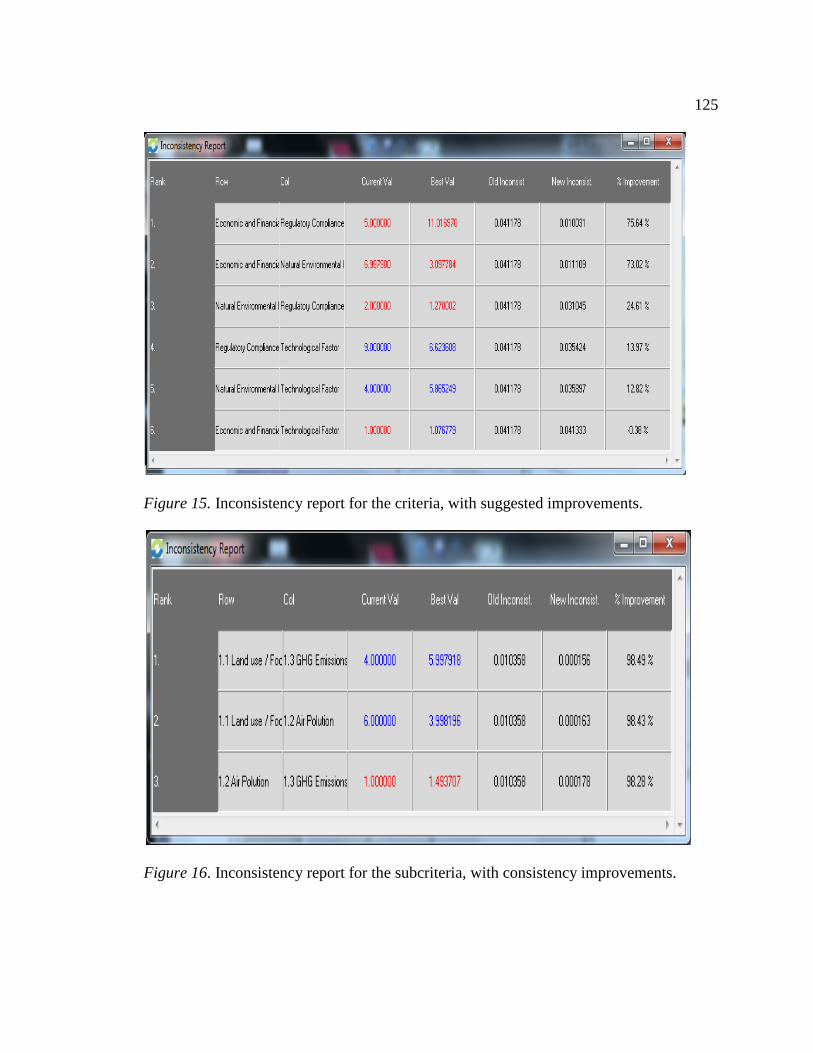
125
Figure 15. Inconsistency report for the criteria, with suggested improvements.
Figure 16. Inconsistency report for the subcriteria, with consistency improvements.
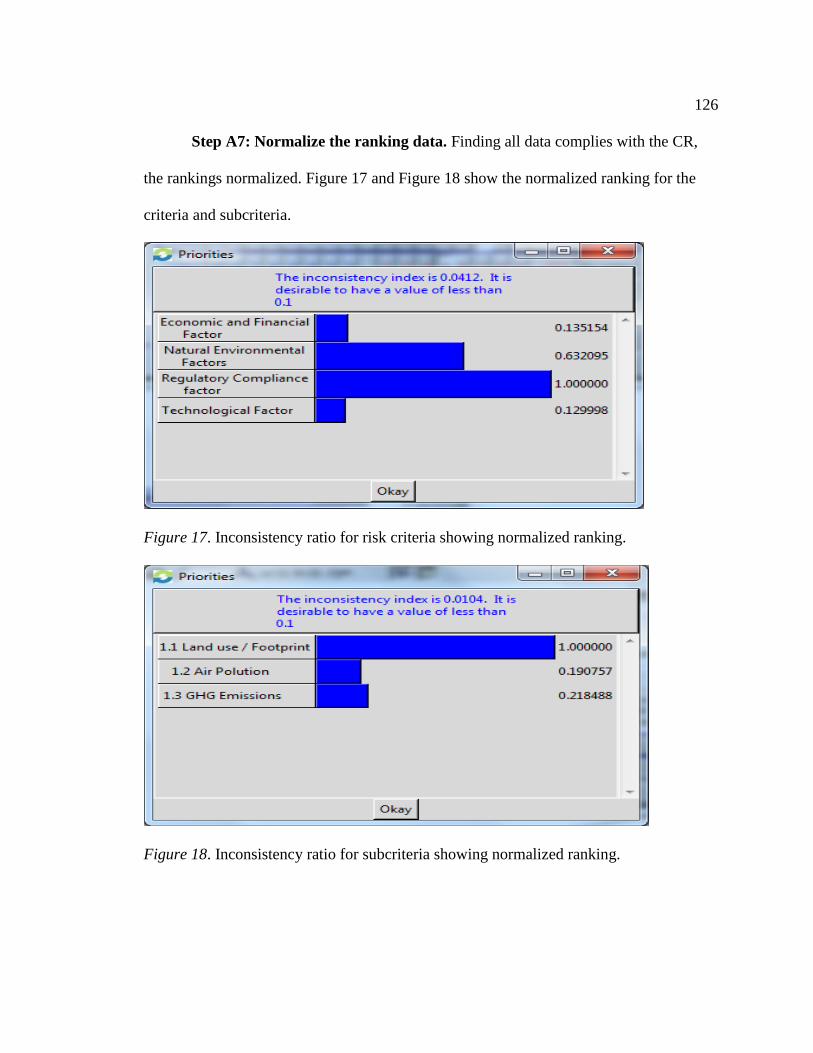
126
Step A7: Normalize the ranking data. Finding all data complies with the CR,
the rankings normalized. Figure 17 and Figure 18 show the normalized ranking for the
criteria and subcriteria.
Figure 17. Inconsistency ratio for risk criteria showing normalized ranking.
Figure 18. Inconsistency ratio for subcriteria showing normalized ranking.

127
Step A8: Aggregate. The next step in the AHP is to combine all the weights
across all criteria to determine the final ranking of criteria and subcriteria.
SuperDecisions calculates the ranking using the classic AHP approach or distributive
mode, it accepts an additive aggregation with normalization of the sum of the priorities to
unity (see Figure 19). Figure 19 shows example results, with Extraction Process Proven
(0.8333) as the highest priorities in achieving Technical compliance and overall ranking
shown in the Limiting column.

128
Figure 19. Aggregation of all the criteria in the hierarchy.

129
Reliability and Validity
Reliability
The repeatability of the measurements of an instrument (e.g., a survey) determines
its reliability. Frankfort-Nachmias and Nachmias (2008) referred to the reliability of the
instrument as the function of the consistent variable errors produced by an instrument
every time it measures a variable. Decision makers can use three well-applied methods to
check for reliability of the instrument (survey) and responses: the test-retest method, the
parallel forms technique, and the split-half method. In the test-retest method, the decision
maker administers the survey twice to the same people. Senior executives (SMEs) have
limited time to participate in research studies or surveys. Therefore, creating a test-retest
method was not feasible in this research due to time constraints. The parallel forms
method develops and applies to different instruments, but with the same intent; the
decision maker can administer the instruments to the same group. Again, this was not
feasible because of the time it would have taken and the fact that I used only one
instrument. The split-half method produces one survey but splits the questions in two
parts (even and odd numbered questions).
For the split-half method, I could have correlated the results of the two
questionnaires to determine the reliability of the overall instrument. Although the split-
half method could have applied to my research, it was unnecessary. AHP computes the
eigenvector for each SME (Saaty, 2010), and from this eigenvector, the decision maker
can calculate a consistency factor across the SMEs (Kusherbaeva et al., 2011b). In this

130
study, I checked the eigenvector for each data set for consistency of the pairwise
comparisons with the calculation of the consistency ratio (Chen et al., 2010). If the
consistency ratio (CR) is less than 0.1 then, the consistency is acceptable (Saaty, 2006)
and the instrument (survey) reliable. However, if the CR is more than 0.1 then the
consistency will improve by identifying the most inconsistent judgment and changing its
value (see Step A6 and Figure 15), thus changing the eigenvector to improve the
consistency (Saaty, 2006).
Validity
Demonstrating that the research method chosen for the study of the problem
statement is the most appropriate inquiry strategy helps ensure the validity of the
research. Reliability of quantitative data and qualitative data has the same prerequisites:
accuracy of data recording and consistent measurement and interpretation of data.
Lincoln and Guba proposed their criteria for judging the validity of studies (Schwandt, et
al., 2007). They suggested a trustworthiness criterion along with the scientific
understanding of validity credibility (internal validity), transferability (external validity),
dependability (or reliability), and conformability (or objectivity). Schwandt et al. (2007)
discussed the validity as Lincoln and Guba described. Schwandt et al. further concluded
the validity of quantitative research is complex—difficult to understand and difficult to
solve.
Van Solms (2011) argued a different approach to prove the validity of the AHP
was necessary. Van Solms also stated that for decision makers the focus should not be on

131
the prediction of outcomes but rather on the ability of the research method (i.e., AHP) to
support valid decisions. However, success depends on trustworthiness and authenticity
(Schwandt et al., 2007). I needed to identify potential internal and external threats to
ensure the quality of data. The first step was the assurance of logical validity, which I
performed during the first phase of identifying environmental compliance risk and
mitigation strategies. Reviewing these factors and mitigation strategies to ensure they are
technically feasible and able to conform to engineering logic. The next step was an
analysis of the outcome of the risk identification and mitigation strategies in a pilot study
to get confirmation from SMEs (Ellis & Levy, 2010). The final step was a review of the
AHP ranking and if it answers the research questions and the working hypotheses. Van
Solms (2011) emphasized that the decision maker could prove the validity if the AHP is
providing decisions based on human interest.
I checked the transferability of data by comparing the rankings of the pilot survey
with the final survey rankings. The rankings showed repeatability of results if measured
at a different time. To ensure credibility, the final ranking of environmental compliance
risks and mitigation strategies had to be acceptable from the viewpoint of the SMEs. The
feedback provided by participants towards the end of the AHP was helpful for solidifying
and validated the results of the AHP (Ellis & Levy, 2010). The application of
triangulation indicated the validity of the AHP.
Internal threats to validity. The first internal threat is obtaining too small a
sample of SMEs in the study; the mitigating strategy would be to meet the minimum
132
sample size to obtain saturation of data. The second internal threat was the time to do the
data mining, the survey, AHP evaluation, and possible follow-up interviews. A high
percentage of project engineers worked on contract and moved to the next project. If the
time between the initial survey and possible follow-up communication became too long,
the contact with the project engineers might be lost. A third threat to internal validity was
not identifying the actual risks and mitigation strategies to environmental compliance.
External threats to validity. An external threat would be erroneous inferences
drawn from data gathered from a small sample relative to the population. Moreover, the
project engineers might not have sufficient experience to provide consistent pairwise
comparison of risks and mitigation strategies. The external validity might be possible if I
could extend the environmental risk ranking and mitigation strategy ranking to the oil
industry outside of Alberta. I reviewed the outcome of the AHP for risks and mitigation
strategies with five or more SMEs to get confirmation of the logic of the ranking defined
by the AHP.
Transition and Summary
The quantitative study in risk management of regulatory compliance of oil sands
projects is an AHP study. The purpose of the quantitative study was to identify and rank
environmental compliance risks and mitigation strategies for in situ oil sands projects
(SAGD projects) in Alberta, Canada. In Section 2, I defined the purpose, research design,
methodology, sampling plan, and the role of the researcher from which I presented the
results of implementing the research plan in Section 3.

133
Section 3: Application to Professional Practice and Implications for Change
Any project has a defined timeline and project managers work to achieve a
defined objective by a predetermined end date (Bower & Walker, 2007). Oil executives’
objectives for oil sands projects are to execute a successful in situ project because that
will contribute not only to the long-term financial sustainability of the company but also
to the long-term environmental sustainability. I sought to identify and rank the key
environmental compliance risks and mitigation strategies of in situ oil sands projects. If
company executives comprehend the ranking of environmental compliance risks and
mitigations, then they will improve environmental and regulatory compliance, as well as
the long-term financial and environmental sustainability of their companies.
Overview of Study
This quantitative research study focused on risk management regarding in situ oil
sands projects and the ranking of environmental compliance risks and mitigations by
project engineers and executives in the oil sands industry. I conducted this study using a
pilot survey, a pairwise comparison-specialized survey, and the application of analytical
hierarchy process (AHP), a multicriteria decision-making (MCDM) method for the final
ranking of the risks and mitigation strategies. By applying a well-defined risk
management process to the set of ranked criteria derived from this study, I created a list
that enables oil sands project engineers to improve their consistency in decision-making.
The study conclusions are useful to oil sands risk managers and serve to inform them of
environmental requirements related to their work.

134
For this study, I defined one principal, four secondary RQs and five working
hypotheses for test examination and testing against the outcome of the risk and mitigation
strategy rankings. I collected the data via a pilot survey and a pairwise specialized
comparison survey; all participants were subject matter experts (SME) involved in
Alberta in situ oil sands projects. A detailed presentation of the data and findings follows.
Presentation of the Findings
In this quantitative study, I identified and ranked the environmental compliance
risks and mitigation strategies using two instruments: a pilot study and a pairwise
comparison-specialized survey of oil company executives and project engineers. I used
the pilot survey to validate the lists of risks and mitigation strategies compiled from the
literature and Alberta Energy Regulator (AER) oil sands database. I used the pairwise
comparison-specialized survey to obtain data from the SMEs. The participants completed
the survey matrices, which I import into the AHP software used to analyze the data,
SuperDecisions.
I analyzed the pairwise comparison data using AHP. In the findings, I confirmed
the one principal, four secondary RQs and five working hypotheses about risk
management to ensure environmental regulatory compliance under the uncertainty of
future regulatory requirements. The secondary research questions about project risks and
mitigation strategies were as follows:

135
Research Question 1: How do the natural environmental compliance risks rank
against human environmental risks in the assessment of future environmental regulatory
compliance?
Research Question 2: Which mitigation strategy emerged as the best to ensure
future environmental regulatory compliance?
Research Question 3: Which of the natural environmental compliance risks (land
use, water quality, and water usage or air quality) is most beneficial for addressing future
environmental regulatory compliance?
Research Question 4: Is R&D technology beneficial to the mitigation of
environmental regulatory compliance risks?
Pilot Survey
I used a pilot survey to validate the lists of environmental compliance risks and
mitigation strategies identified in the literature survey and AER database mining. I
distributed the lists of risks and mitigation strategies to six SMEs I knew. After two
weeks, I contacted the SMEs to remind them and check if they may have questions. I
received five responses after four weeks, with one SME declining participation. Table 7
shows the demographics of the SMEs invited to participate in the pilot survey.

136
Table 7
Demographics of Participants
Participant
(Survey No.)
Senior Project
Engineer
Oil Company
Executive
Pilot Survey
Participant
Declined Participation
in Pilot Survey
B1 X X
C1 X X
C3 X X
S2 X X
T1 X X
T2 X X
Total 3 3 5 1
Based on the comments and completion of the pilot survey by the SMEs, I made
changes to the initial lists of risks and mitigation strategies. I refined the hierarchies and
questionnaires for the specialized pairwise comparison survey. The SMEs also
recommended changes in the pilot survey related to the layout of the pairwise questions
in the Excel spreadsheet. The subsequent changes also led to changes in the risk
hierarchy and mitigation hierarchy.
The most significant change in response to the pilot survey results was a change in the
first level of the risk hierarchy. I added a new criterion on Level 1, Environmental
Compliance risk with two subcriteria, Natural Environmental Compliance risk and
Human Environmental Compliance risk. The second change because of the pilot survey
was the addition of two subcriteria to level 2 subcriteria for Level 1 criterion Regulatory
Compliance. The subcriteria added were: (a) Implement a Pressure Equipment Integrity
Program and (b) Implement a Pipeline Integrity Program. Figure 20 shows the initial
hierarchy of risks and Figure 21 shows the validated hierarchy. Figure 22 and Figure 23
respectively shows the hierarchies for the mitigation strategies before and after the pilot

137
survey.
Figure 20. Risk hierarchy prior to the pilot survey.
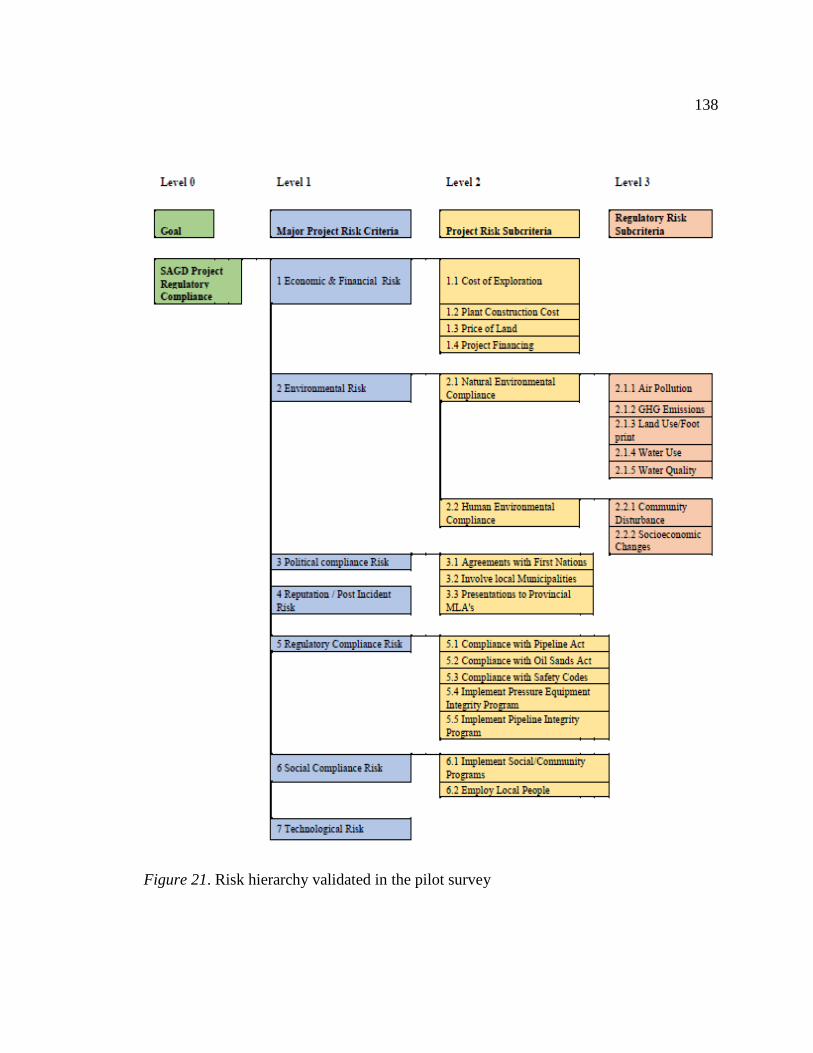
138
Figure 21. Risk hierarchy validated in the pilot survey
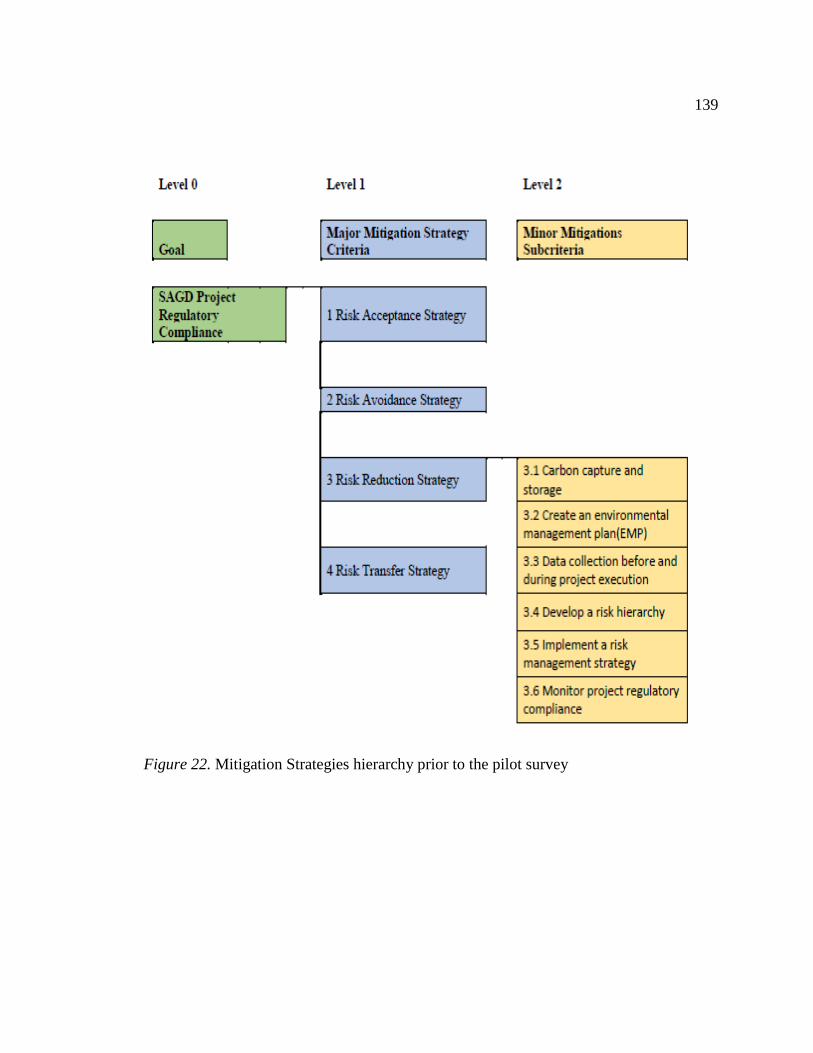
139
Figure 22. Mitigation Strategies hierarchy prior to the pilot survey

140
Figure 23. Mitigation Strategies validated in the pilot survey
I used the risk hierarchy shown in Figure 20, the mitigation hierarchy shown in
Figure 22, and a questionnaire (Appendix C) in the pilot survey. I administered the pilot
survey following the pilot flowchart (Figure 24). Appendix D shows the final risks and
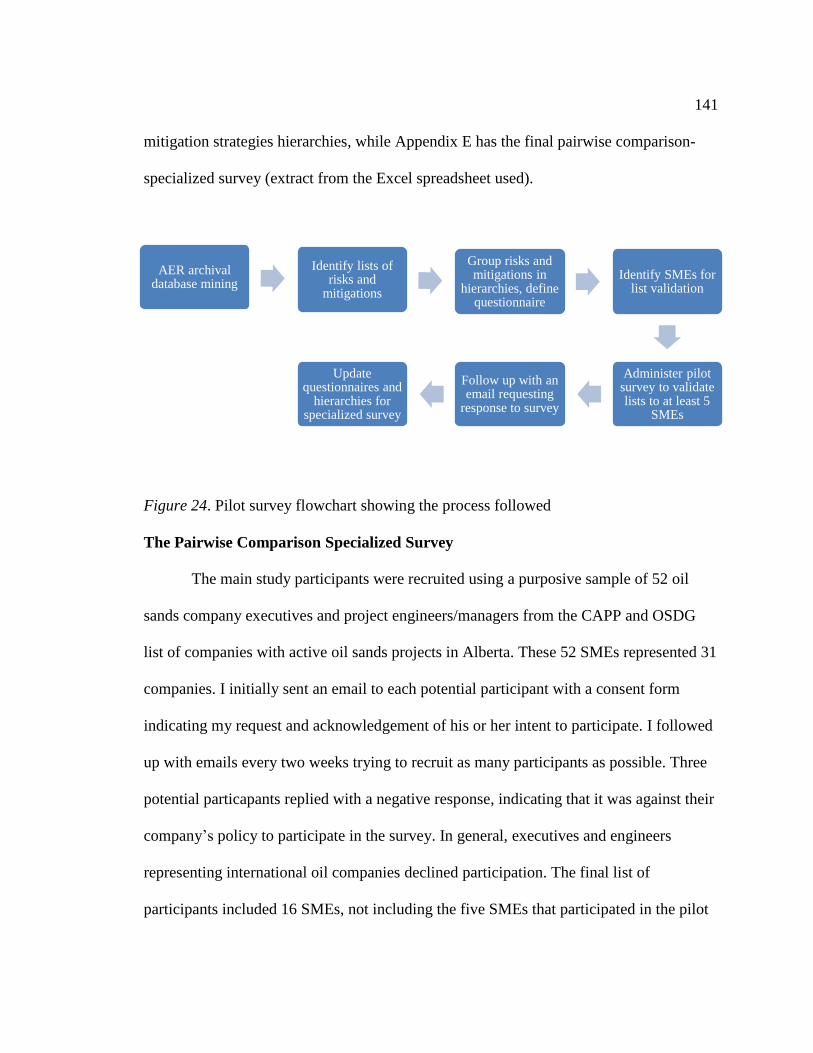
141
mitigation strategies hierarchies, while Appendix E has the final pairwise comparison-
specialized survey (extract from the Excel spreadsheet used).
Figure 24. Pilot survey flowchart showing the process followed
The Pairwise Comparison Specialized Survey
The main study participants were recruited using a purposive sample of 52 oil
sands company executives and project engineers/managers from the CAPP and OSDG
list of companies with active oil sands projects in Alberta. These 52 SMEs represented 31
companies. I initially sent an email to each potential participant with a consent form
indicating my request and acknowledgement of his or her intent to participate. I followed
up with emails every two weeks trying to recruit as many participants as possible. Three
potential particapants replied with a negative response, indicating that it was against their
company’s policy to participate in the survey. In general, executives and engineers
representing international oil companies declined participation. The final list of
participants included 16 SMEs, not including the five SMEs that participated in the pilot
AER archival database mining
Identify lists of risks and
mitigations
Group risks and mitigations in
hierarchies, define questionnaire
Identify SMEs for list validation
Administer pilot survey to validate lists to at least 5
SMEs
Follow up with an email requesting
response to survey
Update questionnaires and
hierarchies for specialized survey

142
study. Seventeen SMEs responded but one’s response was incomplete and disqualified.
The sample represented N > 15 surveys received from 52 SMEs with a response rate of
34%. Table 8 displays the demographics of the participants with no personal or company
information. I sent the pairwise comparison-specialized survey to 18 senior project
engineers, 26 oil company executives and 8 regulatory managers. The final 16
respondents included six project engineers, seven company executives and four
regulatory managers. All participants were members of SAGD projects in Alberta, either
as a company executive or as a senior project manager, project engineer or regulatory
manager.
Table 8
Demographics of Pairwise Comparison Specialized Survey Participants
Participant
(Survey No.)
Senior Project
Engineer
Oil Company
Executive
Regulatory
Manager
Pairwise Comparison
Specialized Survey
A1 X X
C2 X X
C3 X X
E1 X X
H1 X X
L1 X X
L2 X X
O1 X X
O2 X X
O3 X X
O4 X X
P1 X X
P2 X X
P3 X X
P4 X X
R1 X X
S1 X X
Total 6 7 4 16
143
I received from the participants the pairwise comparison surveys in Excel or PDF
format files. I entered each survey into the AHP software, SuperDecisions, to calculate
the ranking of risks and mitigation strategies following the AHP application steps shown
in Figure 5. I followed these steps for each survey received to obtain N=16 data sets
similar to that shown in Figure 19. Each data set included two lists of rankings, one for
the risks and one for the mitigation strategies.

144
Figure 25. AHP application steps followed for each survey received.
Following the AHP analysis, I aggregated the rankings for N=16 surveys to obtain
the final rankings for risks and mitigation strategies. For the aggregation of AHP
Step A1
• Reviewed survey received from SME, checked for completness of data.
Step A2
• Import data from the survey (Excel spreadsheet) into the SuperDecisions.
Step A3
• Check each level of the matrix for outliers and ensure all judgments are within the 1 to 9 range.
Step A4
• Calculate priorities, calculate the eigenvalues, and normalize the rankings.
Step A5
• Perform computations for the criteria and subcriteria using the survey data.
Step A6
• Check the consistency, and review the inconsistency report in SuperDecisions.
Step A7
• Normalize the ranking data in SuperDecisions.
Step A8
• Synthesize all the rankings across all criteria and subcriteria. Aggregate the rankings and interpret the rankings.

145
rankings, the AHP practitioner may use either the arithmetic mean or the geometric
mean. Saaty (2006) proposed the geometric mean rather than the arithmetic mean as the
proper way to aggregate judgments by more than one judge. Aczel and Saaty (as cited by
Saaty, 2006) proved Saaty’s theorem using the geometric mean if all participants have
equal importance in the aggregated result. For my study, all SMEs had equal importance.
Other researchers (Dong, Zhang, Hong, & Xu, 2010; Ishizaka & Labib, 2011b) also
supported using the geometric mean. Xu (as sited by Groselj, & Stirn, 2012) stated that if
the individual SME pairwise comparison matrices were of acceptable consistency then
the aggregated resultant matrix would have an acceptable consistency. In my study, I
checked the different matrices for consistency and compliance to the CR < 0.1 rule as
described in step A6 (see Figure 25). See Appendix F and G for the consistency of each
survey used in the analysis. I aggregated the rankings obtained from the individual
pairwise comparison matrices using the geometric mean method. The improvement in
consistency of the final aggregated ranking satisfied the Pareto principle of social choice
theory (Dong, et al., 2010).
Risk Ranking
Table 9 shows the ranking of all risks based on the surveys of 16 SMEs and
aggregated using the geometric mean. Table 10 shows the overall ranking of all risks.

146
Table 9
Aggregated Risk Ranking per Level Using Geometric Mean
Ranking Criteria / subcriteria
Geometric
Mean Weight
(%)
Weight
Normalized
(%)
1 5 Regulatory compliance 19.28 22.78
2 4 Reputation/Post incident 15.15 17.90
3 2 Environmental Compliance 14.35 16.95
4 1 Economics and financial 13.01 15.37
5 7 Technological 11.92 14.08
6 6 Social compliance 6.66 7.87
7 3 Political 4.27 5.04
Level 1 Project Risks Total 84.64 100.00
1 12 Plant construction cost 28.07 36.10
2 14 Project financing 24.47 31.47
3 11 Cost of exploration 16.76 21.56
4 13 Price of land 8.45 10.87
Level 2 Economics & Financial total 77.75 100.00
1 22 Human Environmental Compliance 48.11 55.64
2 21 Natural Environmental Compliance 38.35 44.36
Level 2 Environmental Compliance Total 86.46 100.00
1 31Agreements with First Nations 55.87 57.75
2 33 Involve local municipality 26.84 27.74
3 32 Presentations to provincial MLAs 14.04 14.51
Level 2 Political Total 96.75 100.00
1 53 Comply with the Safety Codes Act 23.07 26.71
2
54 Implement a Pressure Equipment Integrity
Program 20.63 23.89
3 52 Comply with the Oil Sands Act 15.93 18.44
4
55 Implement a Pipeline Integrity Management
Program 13.40 15.51
5 51 Comply with the Pipeline Act 13.34 15.45
Level 2 Regulatory Compliance Total 86.37 100.00
1 62 Employ local people 71.71 74.43

147
Ranking Criteria / subcriteria
Geometric
Mean Weight
(%)
Weight
Normalized
(%)
2 61 Implement social/community programs 24.64 25.57
Level 2 Social Compliance Total 96.35 100.00
1 215 Water quality 27.85 32.37
2 214 Water use 23.51 27.32
3 211 Air pollution 15.02 17.46
4 212 GHG emissions 10.16 11.81
5 213 Land use/Footprint 9.50 11.04
Level 3 Natural Environmental Compliance Total 86.04 100.00
1 221 Community disturbance 59.05 65.34
2 222 Socioeconomic changes 31.33 34.66
Level 3 Human Environmental Compliance Total 90.38 100.00
Table 10
Overall Ranking of Risks, Highest to Lowest
Ranking Criteria/Subcriteria
Geometric
Mean Weight
(%)
Weight
Normalized
(%)
1 5 Regulatory compliance 9.17 12.37
2 2 Environmental risks 7.78 10.50
3 1 Economics & financial 7.25 9.78
4 4 Reputation/Post incident 6.84 9.23
5 7 Technological 5.52 7.45
6 22 Human environmental compliance 3.45 4.66
7 21 Natural environmental compliance 3.23 4.36
8 6 Social compliance 3.11 4.20
9 3 Political 2.51 3.39
10 53 Comply to the Safety Codes Act 2.46 3.32
11 62 Employ local people 2.28 3.08
12 12 Plant construction cost 2.08 2.81
13 14 Project financing 1.86 2.51
14
54 Implement a Pressure Equipment Integrity
Program 1.81
2.44
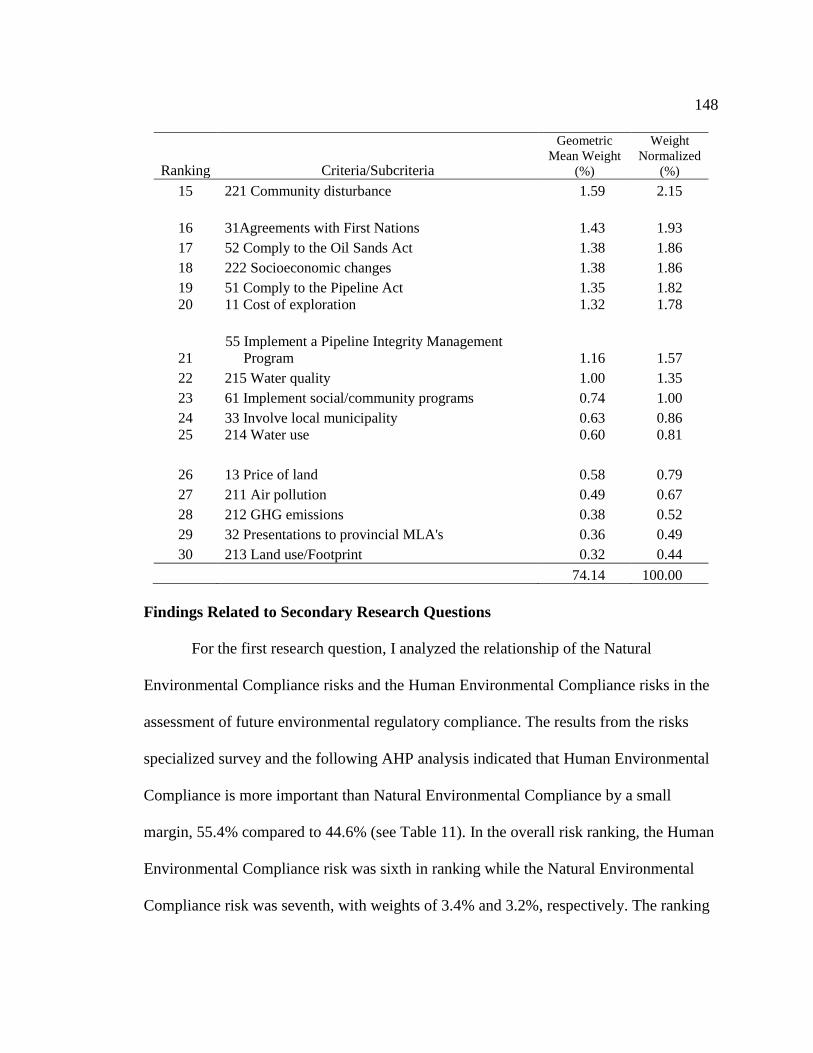
148
Ranking Criteria/Subcriteria
Geometric
Mean Weight
(%)
Weight
Normalized
(%)
15 221 Community disturbance 1.59 2.15
16 31Agreements with First Nations 1.43 1.93
17 52 Comply to the Oil Sands Act 1.38 1.86
18 222 Socioeconomic changes 1.38 1.86
19 51 Comply to the Pipeline Act 1.35 1.82
20 11 Cost of exploration 1.32 1.78
21
55 Implement a Pipeline Integrity Management
Program 1.16
1.57
22 215 Water quality 1.00 1.35
23 61 Implement social/community programs 0.74 1.00
24 33 Involve local municipality 0.63 0.86
25 214 Water use 0.60 0.81
26 13 Price of land 0.58 0.79
27 211 Air pollution 0.49 0.67
28 212 GHG emissions 0.38 0.52
29 32 Presentations to provincial MLA's 0.36 0.49
30 213 Land use/Footprint 0.32 0.44
74.14 100.00
Findings Related to Secondary Research Questions
For the first research question, I analyzed the relationship of the Natural
Environmental Compliance risks and the Human Environmental Compliance risks in the
assessment of future environmental regulatory compliance. The results from the risks
specialized survey and the following AHP analysis indicated that Human Environmental
Compliance is more important than Natural Environmental Compliance by a small
margin, 55.4% compared to 44.6% (see Table 11). In the overall risk ranking, the Human
Environmental Compliance risk was sixth in ranking while the Natural Environmental
Compliance risk was seventh, with weights of 3.4% and 3.2%, respectively. The ranking

149
of these risk criteria showed the answer for the research question. The Human
Environmental Compliance risk was marginally more important than the Natural
Environmental Compliance. In the overall ranking, Human Environmental Compliance
and Natural Environmental Compliance ranked in the top 10 of the overall risk criteria
ranking. In practice, SMEs would consider these two environmental compliance risks of
equal importance.
Table 11
Environmental Compliance Risk Ranking
Environmental Compliance Risk Geometric Mean
Weight (%)
Normalized
Weight (%)
22 Human environmental compliance 48.11 55.6
21 Natural environmental compliance 38.35 44.4
The Second Research Question
I investigated to see if there is a best mitigation strategy to implement to ensure
future environmental regulatory compliance. The four highest ranked mitigation
strategies have a weight range between 10% and 27% and the highest environmental
regulatory compliance strategy (i.e. recycle water/closed water system), has a weight of
5% (see Table 12). The four top environmental regulatory compliance strategies have a
weight of 15.8%, higher than any of the alternative risk mitigation strategies such as risk
avoidance, risk transfer, and risk acceptance (see Table 13).

150
Table 12
Aggregated Ranking of Top Five Mitigation Strategies
Alternative Mitigation Strategy Ranking Aggregated Weight (%)
3 Risk reduction 1 27.08
2 Risk avoidance 2 12.75
4 Risk transfer 3 10.55
1 Risk acceptance 4 10.14
3.7 Recycle water/closed water system 5 4.947
Table 13
Aggregated Weight of Top 4 Environmental Regulatory Compliance Strategies
Environmental Regulatory Compliance
Strategies Ranking Aggregated Weight (%)
3.7 Recycle water/closed water system 5 4.94
3.8 Water security 6 4.34
3.6 Monitor project regulatory
compliance 7 3.97
3.2 Create an EMP 8 2.60
Total
15.84
The different mitigation strategies for environmental compliance have an even
weight spread, and I divided them into three groups, see normalized weights in Table 14.
The average weight of the top three mitigation strategies of Group 1 is 16.3% (σ = 1.8%)
with a standard deviation of 1.8%. Group 2 has an average weight of 8.9% (σ = 0.6%)

151
and Group 3 has an average weight of 4.2% (σ = 0.9%). Therefore, I can conclude that
project engineers and executives should not implement a single mitigation strategy for
environmental regulatory compliance but rather a multicriteria strategy, as Groups 1 and
2 show, for environmental regulatory compliance (see Table 14).
Table 14
Level 2 Normalized Weights for Level 1 Criteria, Environmental Regulatory Compliance
Strategies
Environmental Regulatory Compliance
Strategies
Normalized
Weight (%) Ranking
Average
Weight
σ.
(%)
Group 1 16.3 1.8
3.7 Recycle water/closed water system 18.23 1
3.8 Water security 16.00 2
3.6 Monitor project regulatory compliance 14.64 3
Group 2 8.9 0.6
3.2 Create an EMP 9.61 4
3.5 Implement risk management strategy 8.62 5
3.3 Data collection 8.55 6
Group 3 4.2 0.9
3.4 Develop a risk hierarchy 4.89 7
3.1 Carbon capture and storage 3.56 8
In summary, the eight environmental regulatory compliance strategies (risk
reduction strategies) have a uniform distribution of normalized weights, with the highest

152
ranked strategy, recycle water/closed water system (18.23%) and the lowest ranked
strategy, carbon capture and storage (3.56%). A clear preferred mitigation strategy is not
apparent; the narrow weighing of the alternative risk reduction strategies is indicative of a
preferred multicriteria approach to regulatory compliance risk management rather than a
single significant risk mitigation strategy.
The Third Research Question
This research question is about the Natural Environmental Compliance risk
criteria (land use, water quality, and water usage or air quality), which are among the
most beneficial for addressing future environmental regulatory compliance. In Table 8, I
listed the two highest ranked Natural Environmental Compliance risks such as water
quality and water use. These risks correspond with the research trend observed in the
industry (Research and Innovation, 2014). Table 15 shows the ranking of Level 2
criterion Natural Environmental Compliance Risk. The ranking divides the Natural
Environmental Compliance Risks in two distinct groups: one group with a weight more
than 29% and a second group with a weight less than 19%. The two highest ranked level
3 environmental risks—Water Quality and Water Use—have a combined ranking of
58.4%. Water is therefore the highest Natural Environmental Compliance risk, much
higher than Air Quality (Air Pollution and GHG Emissions with combined weight =
30.60%) and Land Use (Forest Clearing, with a weight of less than 11%).
Researchers in Alberta emphasized the use of water in SAGD facilities and
focused on methods to optimize the SOR (Research and Innovation, 2014). The

153
improvement of SOR has a direct influence on water quality and water quantity. In
January 2013, the oil sands industry formed the Oil Sands Water Management Initiative
with the objective of providing water quality and water usage optimization to the
industry. This effort led to the first in situ oil sands SOR reduction initiative in October
2013 and the second In Situ Oil Sands SOR Reduction conference is in October 2014 in
Calgary (In situ oil sands SOR reduction initiative, 2013).
Table 15
Ranking of Level 3 Subcriteria for Level 2 Criterion Natural Environmental Compliance
Risks, Normalized Weights
Risks Ranking
Geometric
Mean
Aggregated
Weight (%)
Normalized
Aggregated
Weight (%)
215 Water quality 1 28.13 32.75
214 Water use 2 22.03 25.64
211 Air pollution 3 15.69 18.26
212 GHG emissions 4 10.60 12.33
213 Land use/Footprint 5 9.46 11.01
Total 85.90 100.00
The Fourth Research Question
This research question was about the contribution of technology to the reduction
of risk and support to the mitigation of environmental regulatory compliance risks. As I
have discussed in Research Question 3, the highest ranked Level 3 subcriteria for the
Level 2 subcriterion, Natural Environmental Compliance, were the subcriteria Water

154
Quality and Air Quality (see Table 15). To reduce these environmental risks, the Alberta
Government required oil companies’ leaders to develop new technologies to reduce the
environmental impact of new oil sands projects (Government of Alberta, 2009). The two
top ranked Regulatory Compliance mitigation strategies were the Level 2 subcriteria (a)
Recycle Water/Closed Water system and (b) Water Security (see Table 13).
The SAGD process plant mitigations strategies with the highest water utilization
impact were (a) the quantity of water required per barrel of oil (SOR) and (b) the design
of a closed water system. These two plant futures were functions of the water
management design of the SAGD facility. Current research has an emphasis on water
management and the improvement of SOR (In situ oil sands SOR reduction initiative,
2013). Technology as a risk has the fifth highest ranking out of 30 risks (see Table 10);
therefore, mitigating potential technology risks requires large investments in R&D. The
Alberta government, as well as oil companies’ scientists/researchers involved in the oil
sands, addressed R&D. According to Research and Innovation (2014), local universities
received more than $250 million government grants for research related to environmental
issues. Research and Innovation further noted that the in situ oil producers in Alberta
formed the Canadian Oil Sands Innovation Alliance (COSIA) to accelerate the pace of
environmental research in Canada’s oil sands.
Findings on Hypotheses
Working Hypothesis 1. In Section 2 I defined five working hypotheses for
review. Following are the definitions of WH1:
155
Null Working Hypothesis 1 (WH1o): In this study, I identified the key risks.
The SMEs might consider all risks equally important in the management of
environmental risks.
Alternative Working Hypothesis 1 (WH1a): In this study, I identified the key
risks. The SMEs might consider certain risks distinctly more relevant than
other risks in the management of environmental compliance might.
Table 16 shows the five highest ranked risks from a list of 30. The highest ranked
risk, Regulatory Compliance, was 20% higher than the second highest ranked risk,
Reputation/Post Incident. The fifth highest ranked risk, Technology, was nearly 1.7 times
(5.82% vs. 3.39%) as high as the sixth highest ranked risk, Human Environmental
Compliance risk. Therefore, the null Working Hypothesis 1 (WH1o) was unacceptable.
The results from the survey and AHP (see Table 16) supported the alternative Working
Hypothesis 1 (WH1a), indicating the top five risks were distinctly more relevant than the
other 25 risks in the risk management of in situ oil sands projects.

156
Table 16
Highest Ranked Risks
Risk Criteria Ranking
Aggregated
Weight
(%)
5 Regulatory compliance 1 9.36
4 Reputation/Post incident 2 7.81
2 Environmental risks 3 7.35
1 Economics & financial 4 6.49
7 Technological 5 5.82
Total 36.83
Working Hypothesis 2. I defined Working Hypothesis 2 (WH2) as follows:
Null Working Hypothesis 2 (WH2o): Using the AHP, SMEs would be able to
identify that all mitigation strategies were equally important to future
regulatory compliance of oil sands facilities.
Alternative Working Hypothesis 2 (WH2a): Using the AHP, SMEs would be
able to identify that some mitigation strategies were distinctly more relevant
to future regulatory compliance of oil sands facilities.
The Level 1 criterion Risk Reduction was the preferred mitigation strategy
(normalized weight = 44.75%), and the other three Level 1 criteria had weights between
16.75% and 21.06% (see Table 17). I rejected the null Working Hypothesis 2 (WH2o).
The results from the survey and AHP (see Table 17) supported the alternative Working

157
Hypothesis 2 (WH2a). Compared with other mitigation strategies, one mitigation strategy
(i.e., Risk Reduction) was distinctly more important to future regulatory compliance of
oil sands facilities. In a Nigerian environmental risk management study, Nwite identified
Risk Transfer as the preferred mitigation strategy (Nwite, 2014). Nwite’s results is an
indication of a different approach to risk management in Alberta and Nigeria.

158
Table 17
Ranking of Mitigation Strategies
Criteria Ranking
Limiting
Weight (%)
Normalized
Weight (%)
Level 1 criteria - Alternative strategies
1 Risk acceptance 4 14.07 16.75
2 Risk avoidance 2 17.69 21.06
3 Risk reduction 1 37.58 44.75
4 Risk transfer 3 14.64 17.43
Total 83.98 100.00
Level 2 subcriteria - Mitigation strategies
3.1 Carbon capture and storage 8 3.56 4.23
3.2 Create an EMP 4 9.61 11.43
3.3 Data collection 6 8.55 10.17
3.4 Develop a risk hierarchy 7 4.89 5.81
3.5 Implement risk management strategy 5 8.62 10.25
3.6 Monitor project regulatory compliance 3 14.64 17.41
3.7 Recycle water/closed water system 1 18.23 21.67
3.8 Water security 2 16.01 19.03
Total 84.11 100
Working Hypothesis 3. I defined Working Hypothesis 3 (WH3) as follows:
Null Working Hypothesis 3 (WH3o): All the Regulatory Compliance
subcriteria for oil sands projects were equally important.
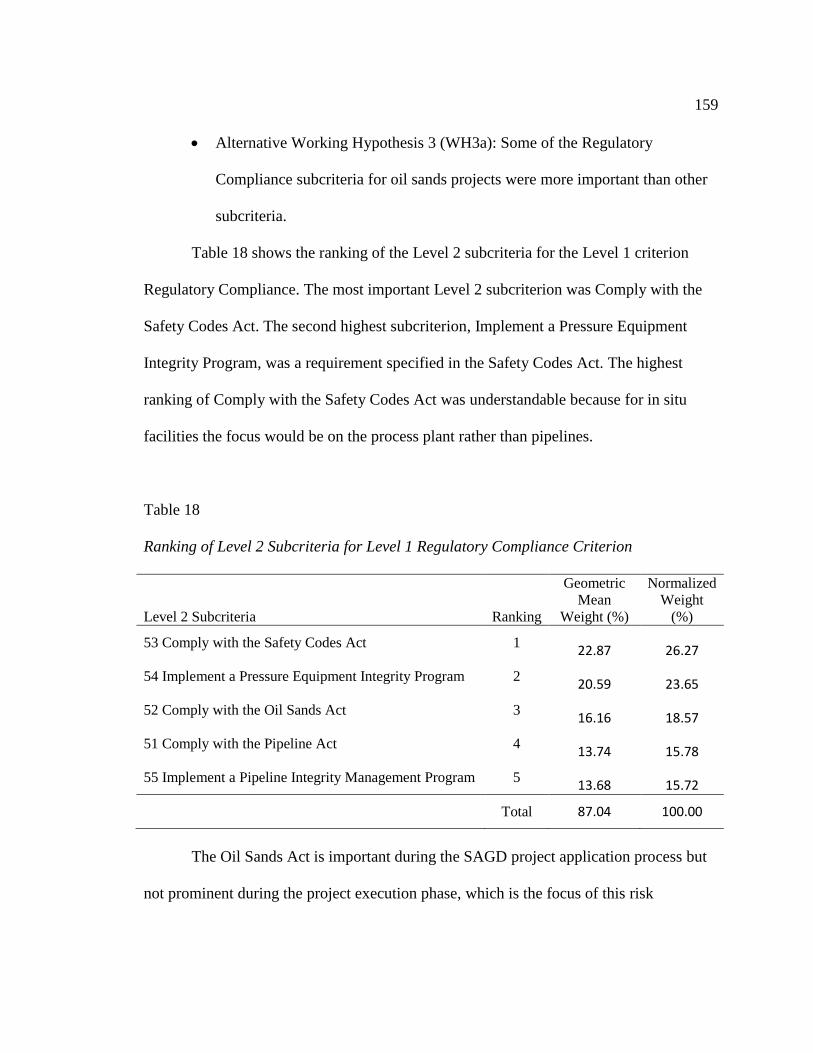
159
Alternative Working Hypothesis 3 (WH3a): Some of the Regulatory
Compliance subcriteria for oil sands projects were more important than other
subcriteria.
Table 18 shows the ranking of the Level 2 subcriteria for the Level 1 criterion
Regulatory Compliance. The most important Level 2 subcriterion was Comply with the
Safety Codes Act. The second highest subcriterion, Implement a Pressure Equipment
Integrity Program, was a requirement specified in the Safety Codes Act. The highest
ranking of Comply with the Safety Codes Act was understandable because for in situ
facilities the focus would be on the process plant rather than pipelines.
Table 18
Ranking of Level 2 Subcriteria for Level 1 Regulatory Compliance Criterion
Level 2 Subcriteria Ranking
Geometric
Mean
Weight (%)
Normalized
Weight
(%)
53 Comply with the Safety Codes Act 1 22.87 26.27
54 Implement a Pressure Equipment Integrity Program 2 20.59 23.65
52 Comply with the Oil Sands Act 3 16.16 18.57
51 Comply with the Pipeline Act 4 13.74 15.78
55 Implement a Pipeline Integrity Management Program 5 13.68 15.72
Total 87.04 100.00
The Oil Sands Act is important during the SAGD project application process but
not prominent during the project execution phase, which is the focus of this risk

160
management study. In the pilot survey, four of the five SMEs ranked these three
regulatory compliance acts as equally important if these acts were the only Level 2
subcriteria for Level 1 criterion Regulatory Compliance, thus excluding the two
subcriteria related to integrity management programs (i.e., Implement a Pressure
Equipment Integrity Program and Implement a Pipeline Integrity Management Program).
This result does not support the null Working Hypothesis 4 (WH4o) and therefore the
null working hypothesis is probably not true. However, the results support the alternative
Working Hypothesis 3 (WH3a) that Compliance with the Safety Codes Act is more
important than other regulatory compliance criteria.
Working Hypothesis 4. I defined Working Hypothesis 4 (WH4) as follows:
Null Working Hypothesis 4 (WH4o): Implementing an integrity management
program at the start of an oil sands project would be less important than the
financial savings for not implementing an integrity management program.
Alternative Working Hypothesis 4 (WH4a): Implementing an integrity
management program at the start of an oil sands project would be more
important than the financial savings for not implementing an integrity
management program.
In my research, I did not identify the Cost of Integrity Management Programs as a
risk nor the possible savings for not implementing integrity management programs for
pressure equipment and pipelines. Four risk criteria were supporting the null Working
Hypothesis 4 (WH4; see Table 19). The Level 2 subcriteria Plant Construction Cost,

161
Project Financing, and Implement a Pressure Equipment Integrity Program were grouped
together in the overall ranking with aggregated weights between 1.16% and 2.08% (see
Table 19), and overall rankings of 12, 13, and 14 respectively. I therefore concluded that
the implementation of an integrity management program is equally as important as the
cost of construction and the project financing. This result does not support the null nor
the alternative Working Hypothesis 4 and therefore the neither the null (WH4o) nor the
alternative (WH4a) working hypothesis is probably not true. Working Hypothesis 4 is a
potential area for future research.
Table 19
Level 2 Subcriteria Related to Cost and Integrity Management
Level 2 Subcriteria Ranking
Aggregated
Weight (%)
12 Plant construction cost 12 2.08
14 Project financing 13 1.86
54 Implement a Pressure Equipment Integrity Program 14 1.81
55 Implement a Pipeline Integrity Management Program 21 1.16
Working Hypothesis 5. I defined Working Hypothesis 5 (WH5) as follows:
Null Working Hypothesis 5 (WH5o): A multicriteria risk management
approach for an oil sands project used multiple mitigation strategies to ensure
future environmental regulatory compliance.
Alternative Working Hypothesis 5 (WH5a): A multicriteria risk management

162
approach for an oil sands project used the most significant mitigation strategy
to ensure future environmental regulatory compliance.
The Level 1 criterion Risk Reduction was the mitigation strategy with the highest
ranking. Risk Reduction had a normalized weight of 44.05%, which was double any of
the other Level 1 mitigation criteria (see Table 20). The eight Level 2 subcriteria
supporting the Level 1 criterion Risk Reduction had a σ² = 0.24% and σ = 4.94% of
normalized weights, with the highest ranked Level 2 subcriterion, Recycle Water/Closed
Water system (18%), and the lowest ranked subcriterion, Carbon Capture & Storage
(3.5%). The low ranking of the Level 2 mitigation strategy Carbon Capture & Storage
was significant, as the Alberta Government had committed $2 billion in carbon capture
and storage initiatives (Bedair, 2013). Current technology made carbon capture programs
more suitable to large processing facilities and refineries (Englander et al., 2013) than
smaller SAGD facilities. SAGD Project engineers could consider carbon capture
technology a high risk and therefore the low ranking as a mitigation strategy.
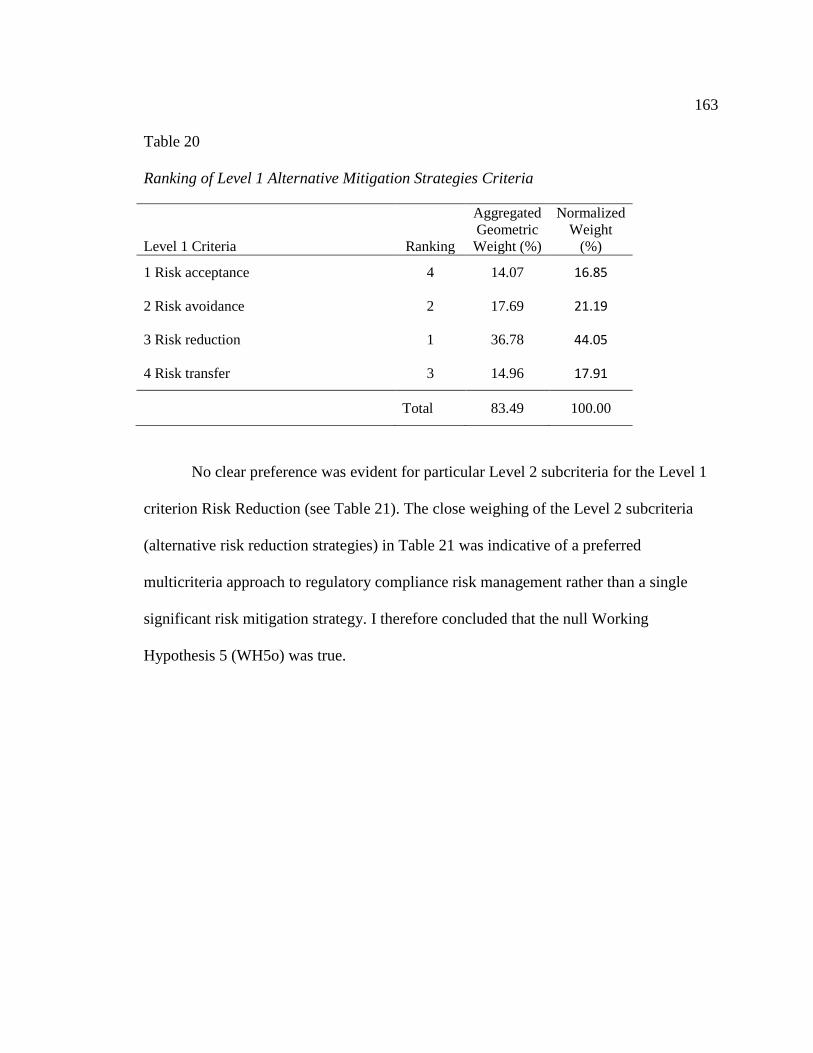
163
Table 20
Ranking of Level 1 Alternative Mitigation Strategies Criteria
No clear preference was evident for particular Level 2 subcriteria for the Level 1
criterion Risk Reduction (see Table 21). The close weighing of the Level 2 subcriteria
(alternative risk reduction strategies) in Table 21 was indicative of a preferred
multicriteria approach to regulatory compliance risk management rather than a single
significant risk mitigation strategy. I therefore concluded that the null Working
Hypothesis 5 (WH5o) was true.
Level 1 Criteria Ranking
Aggregated
Geometric
Weight (%)
Normalized
Weight
(%)
1 Risk acceptance 4 14.07 16.85
2 Risk avoidance 2 17.69 21.19
3 Risk reduction 1 36.78 44.05
4 Risk transfer 3 14.96 17.91
Total 83.49 100.00
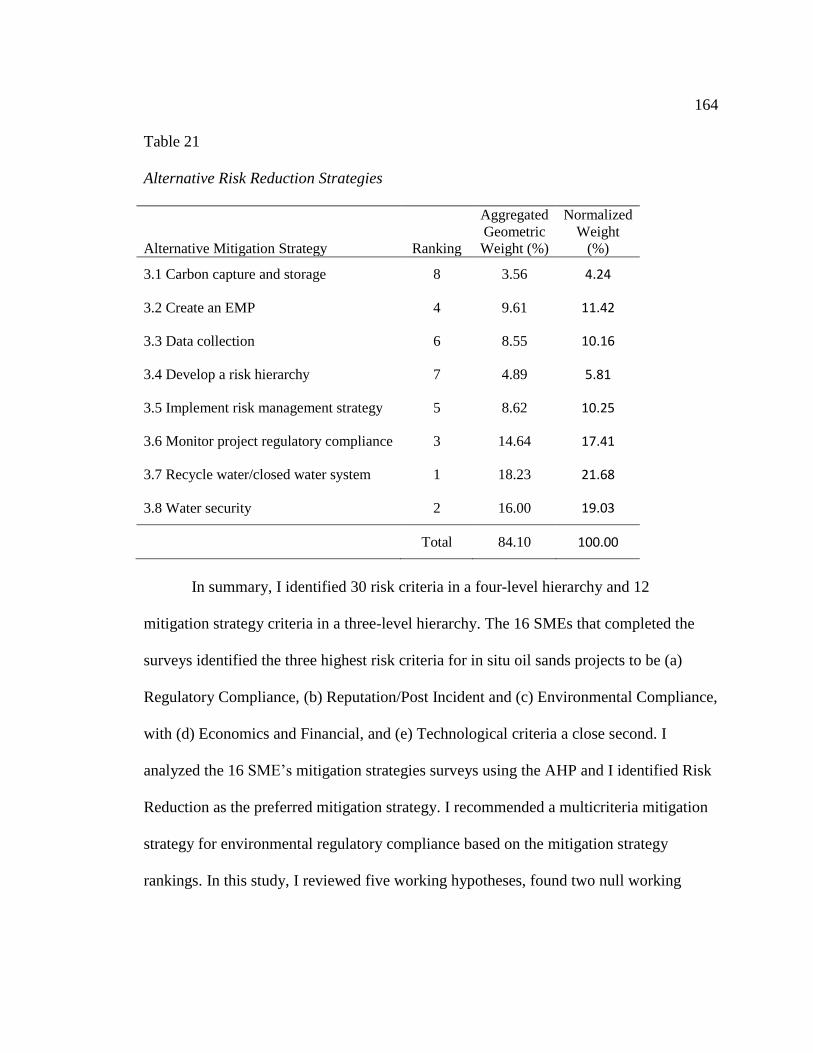
164
Table 21
Alternative Risk Reduction Strategies
Alternative Mitigation Strategy Ranking
Aggregated
Geometric
Weight (%)
Normalized
Weight
(%)
3.1 Carbon capture and storage 8 3.56 4.24
3.2 Create an EMP 4 9.61 11.42
3.3 Data collection 6 8.55 10.16
3.4 Develop a risk hierarchy 7 4.89 5.81
3.5 Implement risk management strategy 5 8.62 10.25
3.6 Monitor project regulatory compliance 3 14.64 17.41
3.7 Recycle water/closed water system 1 18.23 21.68
3.8 Water security 2 16.00 19.03
Total 84.10 100.00
In summary, I identified 30 risk criteria in a four-level hierarchy and 12
mitigation strategy criteria in a three-level hierarchy. The 16 SMEs that completed the
surveys identified the three highest risk criteria for in situ oil sands projects to be (a)
Regulatory Compliance, (b) Reputation/Post Incident and (c) Environmental Compliance,
with (d) Economics and Financial, and (e) Technological criteria a close second. I
analyzed the 16 SME’s mitigation strategies surveys using the AHP and I identified Risk
Reduction as the preferred mitigation strategy. I recommended a multicriteria mitigation
strategy for environmental regulatory compliance based on the mitigation strategy
rankings. In this study, I reviewed five working hypotheses, found two null working

165
hypotheses to be true, and rejected both WH4o and WH4a. I recommended WH4 for
future research (see Table 21).
Table 22
Summary Outcome of Working Hypotheses
Working
Hypothesis True False Comment
WH1o Yes
WH1a Yes
WH2o Yes
WH2a Yes
WH3o Yes
WH3a Yes
WH4o Yes Need further
research WH4a Yes
WH5o Yes
WH5a Yes
Applications to Professional Practice
The quality of decision-making is a major part of the success of executives,
engineers, and corporations’ leaders. Findings from this study can broaden the awareness
for a consistent approach to risk management decision-making in oil sands projects. The
ranking of risks and mitigation strategies might help junior and inexperienced leaders to

166
follow a consistent framework for decision-making during the execution of an in situ oil
sands project. The potential to improve sustainability with the use of a consistent risk
management approach should support the business process of oil sands companies’
leaders. A consistent risk management approach could also lead to higher profit margins
and long-term sustainable business. Leaders in other industries like mining and forestry
could apply the AHP risks and mitigations ranking process to the risk management of
projects that interface with the environment and need to comply with new regulatory
requirements and legislation.
Implications for Social Change
This study in environmental compliance risk management could help the oil sands
industry’s leaders to attain greater compliance with the latest environmental and
regulatory requirements from start to phase-out of their in situ oil sands projects. I did
meet the objective of demonstrating the feasibility of the AHP process for identifying key
compliance risks and mitigation strategies for oil sands projects. Company executives and
project engineers implementing these risk management strategies may be consistent in
their decision-making related to environmental issues and able to identify potential issues
for new projects. Being proactive with environmental management may help companies’
leaders to create a better impression with the public and local communities of their
commitment to the environment and compliance with regulations. Successful risk
management may improve the economic sustainability in other industries where public
involvement is important to holistic sustainability (Boggia & Cortina, 2010). Further

167
research may help with the development of a predictability model for future
environmental regulatory compliance requirements. Such a model may support company
executives and project engineers with managing the risk and developing mitigation
strategies to ensure environmental regulatory compliance during the life cycle of in situ
oil sands projects. Managers and engineers who understand the ranking of regulatory and
environmental compliance risks and mitigation strategies would be better prepared to
ensure future sustainability of their projects within the local community and natural
environment.
Recommendations for Action
Oil sands company executives and project engineers should implement a risk
management plan early in their in situ oil sands project to mitigate all risks related to
environmental regulatory compliance. Moreover, following this recommendation would
help ensure a sustainable project, while being compliant with provincial jurisdictions and
observing responsible social strategy with the local community. I am a member of the
Canadian Heavy Oil Association and my objective will be to publish or present the
results of the study at the next annual conference to create better awareness of the
outcome of the study. The research methodology, AHP, is an appropriate method for new
projects with participation of project members, for ranking the risks and assuring
identifying and catalyzing the implementation of mitigation strategies of specific
projects. The pairwise comparison-specialized survey is applicable to in situ oil sands
projects in Alberta and, with caution, outside Alberta. Project managers should
168
implement the specialized survey early in their project to establish each project’s specific
ranking of risks, identifying and deploying counterbalancing mitigation strategies.
Recommendations for Further Study
Findings from this study might be one of the first discourses on the risk
management of oil sands projects with a focus on identifying potential risks and preferred
mitigation strategies, to ensure future regulatory and environmental compliance. The
results indicated that the highest risks for in situ oil sands projects may be regulatory
compliance and risks related to the environment. Future researchers might address the
need for prediction of future trends in regulations and environmental requirements.
Having the capacity to predict these trends would be helpful to project executives and
engineers to implement mitigation strategies to ensure compliance at the end of the
construction phase and start of the production phase. Researchers might address the
change in the importance of risks with the life cycle change of the in situ facility.
The SMEs ranked the Level 2 subcriterion Implementation of Pressure Equipment
Integrity Programs second for the Regulatory Compliance subcriteria. However, there
remains a need to know if project managers might not implement these programs as a
cost saving exercise. In that case, the production managers would have to implement the
integrity program during the SAGD production phase and they could discover non-
compliance issues. Researchers should consider further study of working hypothesis
WH4 to determine if WH4o is true. Researchers could redefine WH4 to investigate the

169
total benefit of implementing an early integrity management program rather than focus on
cost benefit only.
In my study, I only addressed in situ oil sands projects in Alberta. Future
researchers might expand the study coverage to other oil and gas projects. Future study
coverage could include other projects interacting with the natural environment and the
need to comply with local regulations and requirements such as forestry, paper and pulp,
utility plants and mining. Further generalizations should include Canada-wide
applicability and potential applications of the identified risks and mitigation strategies.
To improve the research methodology researchers could combine the AHP with
other group decision-making techniques such as social choice theory (SCT) or the Delphi
technique to allow for multiple iterations and agreement of the SMEs. The application of
SCT with the AHP could help with group consensus in the final verification phase
(Srdjevic, Pipan, Srdjevic, Blagojevic, & Zoranovic, 2013). Vidal, Marle and Bocquet
(2011) proposed to use the Delphi technique to determine the complexity of the problem
before using the AHP technique while Poompipatpong and Kengpol (2013) proposed to
first use the AHP with SMEs followed with the Delphi method to improve consensus.
The Delphi technique might be useful to determine the essential parameters of a complex
management problem and then decision makers could use AHP to make the final decision
(Etebarian, Shirvani, Soltani & Moradi, 2014).
An alternative research methodology would be to do the pairwise comparison-
specialized survey in a group session with five to ten SMEs. An interactive focus group

170
and AHP analysis with participants would allow immediate feedback to the group on
inconsistency and aggregated results, an iterative process to improve consensus similar to
the Delphi technique. The group of SMEs could review and discuss to obtain group
consensus and possibly a better ranking of risks and mitigation actions. This approach
could allow for addressing working hypothesis WH4 and further investigation.
I used the AHP technique to identify and rank complex criteria related to risk
management in this study. I used the geometric mean aggregation method proposed by
Saaty. I recommended for future research the use of Fuzzy AHP to study risk rankings
with uncertainty being a factor and to avoid subjectivity. Ishizaka and Nguyen (2013) and
Kharola (2014) recommended fuzzy analysis to limit subjectivity and for intuitive
decisions. Radu and Stefanie (2013) supported the use of fuzzy theory to improve risk
ranking of complex systems. Kubler, Voisin, Derigent, Rondeau, and Thomas (2012)
proposed a fuzzy aggregate model as an improvement on the geometric mean aggregate
model proposed by Saaty. Further research related to AHP could focus on inconsistency
matrix correction. Programs such as SuperDecisions provide the AHP analysis with
suggested corrections to the pairwise comparison matrix to improve the consistency.
Making changes to the matrix to improve consistency could alter the SMEs original
judgments (Wanderer, Karanik & Carpintero, 2013). Researchers could develop an
algorithm to improve the consistency or to define a protocol for matrix correction without
altering the intent of the SME’s judgment.

171
In this study, I addressed the ranking of risks and mitigation strategies. Further
researchers could for example link the five highest ranked risk criteria to the alternative
mitigation strategies. Linking risks and mitigation strategies would provide a
comprehensive risk management plan to project managers; providing a much-needed
improvement in oil sands project risk management (Bloomer, Jagoda, & Landry, 2010;
Chanmeka, Thomas, Caldas, & Mulva, 2012).
Reflections
As an engineering manager involved in oil sands projects and as a responsible
citizen, this study was of great interest to me. The Canadian engineering oath reminds all
engineers of their responsibility not only towards their employers or clients, but also
equally important, their responsibility to the public and the environment. Engineers’
actions should contribute to a sustainable long-term society and environment. Conducting
this study helped me to identify those risks and mitigation strategies that could help other
engineers and senior company executives to act responsibly towards the public and the
environment while executing in situ oil sands projects within the Alberta regulatory
framework. The implementation of a risk management program would ensure the project
is sustainable and compliant with regulations even if start-up happens 3 to 5 years after
conceptual approval. My biggest disappointment during the execution of this study was
the inability to reach senior executives of international companies and solicit their
participation as SMEs in the survey. Executives of oil corporations changed company
policies, after the BP Horizon oil spill, regarding the release of risk management,

172
environmental policy, and jurisdictional compliance information. SMEs from these
international companies declined to participate in the specialized survey.
Summary and Study Conclusions
The ranking of risk criteria applicable to in situ oil sands projects was, in order,
(a) Regulatory Compliance, (b) Company Reputations/Post Incident, (c) Environmental
Compliance, and (e) Economics and Financials. There was a clear indication of a long-
term sustainable approach to in situ oil sands projects with an understanding of the
relationship among regulatory compliance, environment, economics, and the public
(company reputation/post incident). The mitigation strategies of in situ company
executives and project engineers should focus on a Risk Reduction strategy rather than
Risk Transfer, Risk Acceptance or Risk Avoidance mitigation strategies. Furthermore,
executives should follow a multicriteria mitigation strategy for environmental and
regulatory compliance. The identified environmental compliance risks and mitigation
strategies in the oil sands industry in Alberta could be applicable to other provinces in
Canada. However, applying the environmental compliance risk and mitigation strategy
rankings to other provinces might need further research that review unique provincial
regulatory requirements and include the participation of SMEs from these provinces.
A summary of my conclusions of this study is as follows:
Risk management of environmental regulatory compliance of oil sands projects
should be a primary strategy.
AHP was an ideal MCDM method applied to the ranking of risks in the oil sands

173
industry.
Understanding and ranking risks and mitigation strategies should improve
environmental compliance.
Regulatory compliance would lead to improved socioeconomic environment.
A sustainable environment in the oil sands should increase public confidence.
Environmental compliance of oil sands projects should be a global business
requirement.
With future research based on the outcome of this study, my hope is for project
engineers and executives to manage their oil sands projects successfully. To be truly
successful, oil sands projects should not only be economically successful but should also
be successful in the management of environmental compliance risks. Project engineers
should implement mitigation strategies that would inspire public confidence in the
sustainable future of oil sands extraction.

174
References
Abdelgawad, M., & Fayek, A. (2010). Risk management in the construction industry
using combined fuzzy FMEA and fuzzy AHP. Journal of Construction
Engineering & Management, 136, 1028–1036. doi:10.1061/(ASCE)CO.1943-
7862.0000210
Abu Dabous, S., & Alkass, S. (2008). Decision support method for multi-criteria
selection of bridge rehabilitation strategy. Construction Management &
Economics, 26, 881–891. doi:10.1080/01446190802071190
Akdere, M. (2011). An analysis of decision-making process in organizations:
Implications for quality management and systematic practice. Total Quality
Management & Business Excellence, 22, 1317–1330.
doi:10.1080/14783363.2011.625180
Alberta Environment. (2008). Specified gas-reporting regulation: Alberta environment
report on 2007 greenhouse gas emission. Retrieved from
http://www.environment.alberta.ca
Alberta Environment. (2010). Land use framework. Retrieved from
http://www.environment.alberta.ca
Alireza, S., Meysam, K. E., & Seyyed, A. B. (2013). Evaluation of suppliers in the
process of buying and supplying using analytic hierarchy process. African Journal
of Business Management, 7, 22–29. doi:10.5897/AJBM11.2589

175
Álvarez, M., Moreno, A., & Mataix, C. (2013). The analytic hierarchy process to support
decision-making processes in infrastructure projects with social impact. Total
Quality Management & Business Excellence, 24, 596–599.
doi:10.1080/14783363.2012.669561
Aminbakhsh, S., Gunduz, M., & Sonmez, R. (2013). Safety risk assessment using
analytic hierarchy process (AHP) during planning and budgeting of construction
projects. Journal of Safety Research, 5. doi:10.1016/j.jsr.2013.05.003
Amiri, N. P. (2010). Project selection for oil-fields development by using the AHP and
fuzzy TOPSIS methods. Expert Systems with Applications, 37, 6218–6224.
doi:10.1016/j.eswa.2010.02.103
Amponsah, C. T. (2011). Application of multi-criteria decision-making process to
determine critical success factors for procurement of capital projects under public-
private partnerships. International Journal of the Analytic Hierarchy Process, 3,
107–129. Retrieved from http://www.ijahp.org/
Angevine, G. & Green, K. P. (2013). The Canadian oil transport conundrum. Studies in
Energy Transportation. Retrieved from
http://www.fraserinstitute.org/uploadedFiles/fraser-ca/Content/research-
news/research/publications/canadian-oil-transport-conundrum.pdf
Andersen, S., & Mostue, B. A. (2012). Risk analysis and risk management approaches
applied to the petroleum industry and their applicability to IO concepts. Safety
Science, 50, 2010–2019. doi:10.1016/j.ssci.2011.07.016

176
Antil, P., Singh, M., & Kumar, A. (2013). Selection of merchant for manufacturing
industries through application of analytic hierarchy process. International Journal
for Research in Applied Science and Engineering Technology, 1(3), 16-21.
Retrieved from www.ijraset.com
Arabameri, A. (2014). Application of the Analytic Hierarchy Process (AHP) for locating
fire stations: Case Study Maku City. Journal of Art, Social Science and
Humanities, 2, 1-10. Retrieved
fromhttp://meritresearchjournals.org/assh/Content/2014/January/Alireza.pdf
Aragonés-Beltrán, P., Chaparro-González, F., Pastor-Ferrando, J. P., & Pla-Rubio, A.
(2014). An AHP (Analytic Hierarchy Process)/ANP (Analytic Network Process)-
based multi-criteria decision approach for the selection of solar-thermal power
plant investment projects. Energy, 66, 222-238. doi:10.1016/j.energy.2013.12.016
Arbuthnott, K. D. (2010). Taking the long view: Environmental sustainability and delay
of gratification. Analyses of Social Issues and Public Policy, 10, 4–22.
doi:10.1111/j.1530-2415.2009.01196.x
Arimura, T. H., Darnall, N., & Katayama, H. (2011). Is ISO 14001 a gateway to more
advanced voluntary action? The case of green supply chain management. Journal
of Environmental Economics and Management, 61(2), 170-182
Aruldoss, M., Lakshmi, T. M., & Venkatesan, V. P. (2013). A survey on multi criteria
decision-making methods and its applications. American Journal of Information
Systems, 1, 31-43. doi:10.12691/ajis-1-1-5

177
Asamoah, D., Annan, J., & Nyarko, S. (2012). AHP approach for supplier evaluation and
selection in a pharmaceutical manufacturing firm in Ghana. International Journal
of Business & Management, 7, 49–62. doi:10.5539/ijbm.v7n10p49
Aydin, O., & Arslan, G. (2010). Optimal hospital location with fuzzy AHP. The Business
Review, Cambridge, 15, 262–268. Retrieved from http://www.jaabc.com/
Aydin, S., & Kahraman, C. (2010). Multiattribute supplier selection using fuzzy analytic
hierarchy process. International Journal of Computational Intelligence Systems,
3, 553–565. doi:10.1080/18756891.2010.9727722
Ayyub, B., Prassinos, P., & Etherton, J. (2010). Risk-informed decision-making.
Mechanical Engineering, 132, 28–33.
Badizadeh, A., & Khanmohammadi, S. (2011). Developing a Fuzzy model for
assessment and selection of the best idea of new product development. Indian
Journal of Science & Technology, 4, 1749–1762. Retrieved from http://ajsih.in/
Bana e Costa, C. A., & Vansnick, J-C. (2008). A critical analysis of the eigenvalue
method used to derive priorities in AHP. European Journal of Operational
Research, 187, 1422–1428. doi:10.1016/j.ejor.2006.09.022
Barfod, M. B., & Leleur, S. (2011). Scaling transformation in the Rembrandt technique:
Examination of the progression factors. International Journal of Information
Technology and Decision-making, 1–16. Retrieved from http://www.orbit.dtu.dk/
Basak, I. (2011). An alternate method of deriving priorities and related inferences for
group decision-making in analytic hierarchy process. Journal of Multi-Criteria

178
Decision Analysis, 18, 279–287. doi:10.1002/mcda.484
Beccacece, F., & Borgonovo, E. (2011). Functional ANOVA, ultramodularity and
monotonicity: Applications in multiattribute utility theory. European Journal of
Operational Research, 210, 326–335. doi:10.1016/j.ejor.2010.08.032
Beck, P., & Hofmann, E. (2012). Multiple criteria decision-making in supply chain
management, currently available methods and possibilities for future research.
Unternehmung, 66(2), 180. Retrieved from https://www.alexandria.unisg.ch
Bedair, O. (2013). Engineering challenges in the design of Alberta’s oil sands projects.
Practice Periodical on Structural Design and Construction, 18, 247-260.
doi:10.1061/(ASCE)SC.1943-5576.0000163
Benke, K. K., Steel, J. L., & Weiss, J. E. (2011). Risk assessment models for invasive
species: uncertainty in rankings from multi-criteria analysis. Biological Invasions,
13, 239–253. doi:10.1007/s10530-010-9804-x
Bergerson, J. A., Kofoworola, O., Charpentier, A. D., Sleep, S., & MacLean, H. L.
(2012). Lifecycle greenhouse gas emissions of current oil sands technologies:
Surface mining and in situ applications. Environmental Science & Technology,
46, 7865–7874. doi:10.1021/es300718h
Bertels, S., Cody, M., & Pek, S. (2014). A responsive approach to organizational
misconduct: Rehabilitation, reintegration, and the reduction of reoffense. Business
Ethics Quarterly, 24(3). Retrieved from http://www.pdcnet.org/

179
Betrie, G. D., Sadiq, R., Morin, K. A., & Tesfamariam, S. (2013). Selection of remedial
alternatives for mine sites: A multicriteria decision analysis approach. Journal of
Environmental Management, 119, 36–46. doi:10.1016/j.jenvman.2013.01.024
Bindu, R. S., & Ahuja, B. B. (2010). Vendor selection in supply chain using relative
reliability risk evaluation. Journal of Theoretical and Applied Information
Technology, 16, 145–152. Retrieved from http://www.jatit.org
Bloomer, A., Jagoda, K., & Landry, J. (2010). Canadian oil sands: How innovation and
advanced technologies can support sustainable development. International
Journal of Technology Management & Sustainable Development, 9, 113-132.
doi:10.1386/tmsd.9.2.113_1
Bobtcheff, C., & Villeneuve, C. (2010). Technology choice under several uncertainty
sources. European Journal of Operational Research, 206, 586–600.
doi:10.1016/j.ejor.2010.03.010
Boggia, A., & Cortina, C. (2010). Measuring sustainable development using a multi-
criteria model: a case study. Journal of Environmental Management, 91(11),
2301-2306. doi:10.1016/j.jenvman.2010.06.009
Bower, D., & Walker, D. (2007). Planning knowledge for phased rollout projects. Project
Management Journal, 38(3), 45-60. doi:10.1002/pmj.20005.
Bragge, J., Korhonen, P., Wallenius, H., & Wallenius, J. (2012). Scholarly communities
of research in multiple criteria decision-making: A bibliometric research profiling
180
study. International Journal of Information Technology & Decision-making, 11,
401–426. doi:10.1142/S0219622012400081
Brandt, A. R. (2012). Variability and uncertainty in lifecycle assessment models for
greenhouse gas emissions from Canadian oil sands production. Environmental
Science & Technology, 46, 1253–1261. doi:10.1021/es202312p
Briggs, C. A. (2010). Risk assessment in the upstream crude oil supply chain: Leveraging
analytic hierarchy process. (Doctoral dissertation). Retrieved from ProQuest
Dissertations and Theses database. (UMI No. 748837971)
Briggs, C. A., Tolliver, D., & Szmerekovsky, J. (2012). Managing and mitigating the
upstream petroleum industry supply chain risks: Leveraging analytic hierarchy
process. International Journal of Business & Economics Perspectives, 7, 1–20.
Retrieved from http://www.iabpad.com/
Brito, A. J., de Almeida, A. T., & Mota, C. M. (2010). A multicriteria model for risk
sorting of natural gas pipelines based on ELECTRE TRI integrating utility theory.
European Journal of Operational Research, 200, 812–821.
doi:10.1016/j.ejor.2009.01.016
Canadian Oil Producers Association. (2010). Responsible Canadian energy oil sands
progress report, for the year ended December 31, 2009. Canadian Association of
Petroleum Producers. Retrieved from http://www.capp.ca
Canadian Oil Producers Association. (2011). The facts on oil sands 2011. Canadian
Association of Petroleum Producers. Retrieved from http://www.capp.ca
181
Carcary, M. (2009). The research audit trial—enhancing trustworthiness in qualitative
inquiry. Electronic Journal of Business Research Methods, 7, 11–23. Retrieved
from http://www.ejbrm.com/volume7/issue1/p11
Carroll, A. B., & Shabana, K. M. (2010). The business case for corporate social
responsibility: A review of concepts, research and practice. International Journal
of Management Reviews, 12, 85–105. doi:10.1111/j.1468-2370.2009.00275.x
Cebi, S. (2011). Developing a fuzzy based decision-making model for risk analysis in
construction project. Journal of Multi-Valued Logic & Soft Computing, 17, 387–
405.
Cetron, M. J. & Davies, O. (2010). Trends shaping tomorrow’s world. Forces in the
natural and institutional environments. The Futurist, 44(4), 38–53. Retrieved from
http://www.wfs.org/content/july-august-2010
Chanmeka, A., Thomas, S. R., Caldas, C. H., & Mulva, S. P. (2012). Assessing key
factors impacting the performance and productivity of oil and gas projects in
Alberta. Canadian Journal of Civil Engineering, 39, 259-271. doi:10.1139/L11-
128
Charpentier, A. D., Kofoworola, O., Bergerson, J. A., & MacLean, H. L. (2011).
Lifecycle greenhouse gas emissions of current oil sands technologies: GHOST
model development and illustrative application. Environmental Science &
Technology, 45, 9393–9404. doi:10.1021/es103912m
Chazan, G. (2008, February 5). Costs, regulation are slowing boom; game for big players.
182
The Wall Street Journal. Retrieved from
http://online.wsj.com/article/SB120218444752843609.html
Chen, Z., Chen, W., & Chen, Q. (2010). Group decision-making based on the LCLR
method. Kybernetes, 39, 881–887. doi:10.1108/03684921011046645
Cheng, M., Ma, G. X., & Sun, J. K. (2012). AHP-based research on the selection of
construction project subcontractor. Advanced Materials Research, 594, 3035–
3039. doi:10.4028/www.scientific.net/AMR.594-597.3035
Cherry, M. A., & Sneirson, J. F. (2011). Beyond profit: Rethinking corporate social
responsibility and green washing after the BP oil disaster. Tulane Law Review, 85,
983–1038. doi:10.2139/ssrn.1670149
Cho, J., & Lee, J. (2013). Development of a new technology product evaluation model
for assessing commercialization opportunities using Delphi method and fuzzy
AHP approach. Expert Systems with Applications, 40, 5315–5330.
doi:10.1016/j.eswa.2013.03.038
Cho, D. W., Lee, Y. H., Ahn, S. H., & Hwang, M. K. (2012). A framework for measuring
the performance of service supply chain management. Computers & Industrial
Engineering, 62, 801–818. doi:10.1016/j.cie.2011.11.014
Cole, Z. D., Donohoe, H. M., & Stellefson, M. L. (2013). Internet-based Delphi research:
Case based discussion. Environmental management, 51, 511-523.
doi:10.1007/s00267-012-0005-5
Cooke, R. M. (2014). Validating expert judgments with the classical model. Experts and

183
Consensus in Social Science-Critical Perspectives from Economics, Sociology,
Politics, and Philosophy. Editors: Carlo Martini and Marcel Boumans, Series
title: Ethical Economy-Studies in Economic Ethics and Philosophy, Springer.
Cooper, D. R., & Schindler, P.S. (2013). Business research methods (12th ed.). New
York, NY: McGraw-Hill Irwin.
Cooper, O., Tadikamalla, P., & Shang, J. (2012). Selection of a third-party logistics
provider: Capturing the interaction and influence of performance metrics with the
analytical network Process. Journal of Multi-Criteria Decision Analysis, 19, 115–
128. doi:10.1002/mcda.489
Cortes, V. J., Figerio, S., Schenato, L., Pasuto, A., & Sterlacchini, S. (2013). Review of
the current risk management strategies in Europe for hydro-meteorological
hazards at protection and emergency level. In Klijn & Schweckendiek (Eds.),
Comprehensive flood risk management (pp. 971–980). London, England: Taylor
& Francis Group.
Cozannet, G. L., Garcin, M., Bulteau, T., Mirgon, C., Yates, M. L., Méndez, M., ... &
Oliveros, C. (2013). An AHP-derived method for mapping the physical
vulnerability of coastal areas at regional scales. Natural Hazards and Earth
System Science, 13, 1209-1227. doi:10.5194/nhess-13-1209-2013
De Felicea, F., & Petrillo, A. (2012). Hierarchical model to optimize performance in
logistics policies: multi attribute analysis. The Eight International Strategic

184
Management Conference, Social and Behavioral Sciences 58, 1555 – 1564.
doi:10.1016/j.sbspro.2012.09.1142
Deason, K. S., & Jefferson, T. (2010). A systems approach to improving fleet policy
compliance within the US Federal Government. Energy Policy, 38, 2865–2874.
doi:10.1016/j.enpol.2010.01.019
Deepa, K., & Krishnaveni, M. (2012). Suitable site selection of decentralized treatment
plants using multicriteria approach in GIS. Journal of Geographic Information
System, 4, 254–260. doi:10.4236/jgis.2012.43030
Dolan, J. G. (2010). Multi-criteria clinical decision support: A primer on the use of
multiple criteria decision-making methods to promote evidence-based, patient-
centered healthcare. The Patient, 3, 229–248. doi:10.2165/11539470-000000000-
00000
Dong, Y., Zhang, G., Hong, W., & Xu, Y. (2010). Consensus models for AHP group
decision-making under row geometric mean prioritization method. Decision
Support Systems, 49, 281–289. doi:10.1016/j.dss.2010.03.003
Druckman, J. N., & Bolsen, T. (2011). Framing, motivated reasoning, and opinions about
emergent technologies. Journal of Communication, 61, 659–688.
doi:10.1111/j.1460-2466.2011.01562.x
Dubois, D., & Prade, H. (2011). Possibility theory and its applications: Where do we
stand? Toulouse, France: IRIT-CNRS, Universite Paul Sabatier.

185
Durbach, I. N., & Stewart, T. J. (2012). Modeling uncertainty in multi-criteria decision
analysis. European Journal of Operational Research. 223, 1–14.
doi:10.1016/j.ejor.2012.04.038
Edwards, D., & Darnall, N. (2010). Averting environmental justice claims? The role of
environmental management systems. Public Administration Review, 70, 422–433.
doi:10.1111/j.1540-6210.2010.02156.x
Eggstaff, J. W., Mazzuchi, T. A., & Sarkani, S. (2014). The effect of the number of seed
variables on the performance of Cooke′ s classical model. Reliability Engineering
& System Safety, 121, 72-82. doi:10.1016/j.ress.2013.07.015
Elahi, E. (2013). Risk management: the next source of competitive advantage. Foresight,
15, 117-131. doi:10.1108/14636681311321121
Elliott, L. P., & Brook, B. W. (2007). Revisiting Chamberlin: Multiple working
hypotheses for the 21st century. Bioscience, 57, 608–614. doi:10.1641/B570708
Ellis, T. J., & Levy, Y. (2010). A guide for novice researchers: Design and development
research methods. Proceedings of Informing Science & IT Education Conference.
Retrieved from http://se.fsksm.utm.my/
Englander, J. G., Bharadwaj, S., & Brandt, A. R. (2013). Historical trends in greenhouse
gas emissions of the Alberta oil sands (1970–2010). Environmental Research
Letters, 8, 1-7. doi:10.1088/1748-9326/8/4/044036
Energy Resources Conservation Board. (2008). ERCB Investigation Report; MEG
Energy Corp. steam pipeline failure, license no. P 46441, line no. 001, May 5,

186
2007. Retrieved from http://www.ercb.ca/docs/products
Energy Resources Conservation Board. (2010). Upstream oil and gas authorizations and
consultation guide. Retrieved from http://authorizationsguide.ercb.ca
Energy Resources Conservation Board. (2011). ERCB report ST98-2011- Alberta’s
energy reserves 2011 and supply/demand outlook—Economics. Retrieved from
http://www.ercb.ca/docs/products/STs/
Enyinda, C. I., Briggs, C., Obuah, E., & Mbah, C. (2012). Petroleum supply chain risk
analysis in a multinational oil firm in Nigeria. Journal of Marketing Development
& Competitiveness, 5(7), 37–44. Retrieved from Business Source Complete
database. (Accession No. 71666007)
Epstein, M. J., & Yuthas, K. (2012). Sustainability impacts. Strategic Finance, 27–33.
Retrieved from Portland State University Digital Repository
http://archives.pdx.edu/ds/psu/9118
Ergu, D., Kou, G., Peng, Y., & Shi, Y. (2011). A simple method to improve the
consistency ratio of the pair-wise comparison matrix in ANP. European Journal
of Operational Research, 213, 246–259. doi:10.1016/j.ejor.2011.03.014
Estévez, R. A., Walshe, T., & Burgman, M. A. (2013). Capturing social impacts for
decision‐making: A multicriteria decision analysis perspective. Diversity and
Distributions, 19, 608–616. doi:10.1111/ddi.12058
Etebarian, A., Shirvani, A., Soltani, I., & Moradi, A. (2014). Applying fuzzy Delphi
method and fuzzy analytic hierarchy process for ranking marine casualties.
187
Proceedings of the 2014 International Conference on Neural Networks -Fuzzy
Systems, 135-146. Retrieved from
http://www.europment.org/library/2014/venice/bypaper/NEUFUZ/NEUFUZ-
19.pdf
Eweje, J., Turner, R., & Müller, R. (2012). Maximizing strategic value from
megaprojects: The influence of information-feed on decision-making by the
project manager. International Journal of Project Management, 30, 639–651.
doi:10.1016/j.ijproman.2012.01.004
Fan, Y., & Nguyen, A. T. (2011). A novel belief function reasoning approach to MCDM
under uncertainty. International Journal of Operational Research, 11, 316–330.
doi:10.1504/IJOR.2011.041346
Farahani, R. Z., Baygi, M. B., Mousavi, S. M. (2014). Risk management in gas networks:
a survey. Retrieved from
http://yalma.fime.uanl.mx/~roger/ftp/SNI2014/01%20Citas/02%20Citas%20a%2
0articulos/2011%20chapter%20LOMCM%20Farahani.pdf
Firestone, J. M. (2006). Risk intelligence metrics: An adaptive metrics center industry
report. Executive Information Systems, Inc.
Fisher-Vanden, K., & Thorburn, K. S. (2011). Voluntary corporate environmental
initiatives and shareholder wealth. Journal of Environmental Economics and
Management, 62, 430–445. doi:10.1016/j.jeem.2011.04.003
Flammer, C. (2012). Corporate social responsibility and shareholder reaction: The

188
environmental awareness of investors. Academy of Management Journal, 55.
doi:10.5465/amj.2011.0744 ACAD MANAGE J July 20, 2012 amj.2011.0744
Foote, L. (2012). Threshold considerations and wetland reclamation in Alberta’s
mineable oil sands. Ecology and Society 17, 35. doi:10.5751/ES-04673-170135
Forman, E. H., & Gass, S. I. (2001). The analytic hierarchy process: An exposition.
Operations Research, 49, 469–486. Retrieved from http://www.jstor.org.
Fouladgar, M., Yazdani-Chamzini, A., Lashgari, A., Zavadskas, E., & Turskis, Z. (2012).
Maintenance strategy selection using AHP and COPRAS under fuzzy
environment. International Journal of Strategic Property Management, 16, 85–
104. doi:10.3846/1648715X.2012.666657
Frankfort-Nachmias, C., & Nachmias, D. (2008). Research methods in the social sciences
(7th ed.). New York, NY: Worth Publishers.
Fürst, C., Volk, M., & Makeschin, F. (2010). Squaring the circle? Combining models,
indicators, experts and end-users in integrated land-use management support
tools. Environmental management, 46, 829–833. doi:10.1007/s00267-010-9574-3
Garuti, C., & Salomon, V. A. (2011). Compatibility indices between priority vectors.
International Journal of the Analytic Hierarchy Process, 4, 152–160. Retrieved
from http://www.ijahp.org
Geng, G., & Wardlaw, R. (2013). Application of multi-criterion decision-making analysis
to integrated water resources management. Water Resources Management, 27,
3191–3207. doi:10.1007/s11269-013-0343-y

189
George, R. (2012). Sun rise, Suncor, the oil sands and the future of energy. Toronto,
Canada: HarperCollins Publishers Ltd.
Gibbs, M. (2011). Ecological risk assessment, prediction, and assessing risk predictions.
Risk Analysis: An Official Publication of the Society for Risk Analysis, 31, 1784–
1788. doi:10.1111/j.1539-6924.2011.01605.x
Giesy, J. P., Anderson, J. C., & Wiseman, S. B. (2010). Alberta oil sands development.
Proceedings of the National Academy of Sciences (PNAS), 107, 951–952.
doi:10.1073/pnas.0912880107
Gigerenzer, G., & Gaissmaier, W. (2011). Heuristic decision-making. Annual Review of
Psychology, 62, 451–482. doi:10.1146/annurev-psych-120709-145346
Gil, N., Beckman, S, Tommelein, I. D. (2008). Upstream problem solving under
uncertainty and ambiguity: Evidence from airport expansion projects. IEEE
Transactions on Engineering Management, 55, 508–522.
doi:10.1109/TEM.2008.922635
Giri, S., & Nejadhashemi, A. P. (2014). Application of analytical hierarchy process for
effective selection of agricultural best management practices. Journal of
Environmental Management, 132, 165-177. doi:10.1016/j.jenvman.2013.10.021
Goepel, K. D. (2011). AHP-ANP practical applications with pros and cons. Retrieved
from http://www.bpmsg.com/ahp-anp-practical-application-slides/
Golmohammadi, V., Afshari, H., Hasanzadeh, A., & Rahimi, M. (2010). A heuristic
approach for designing a distribution network in a supply chain system. African

190
Journal of Business Management, 4, 308–311. Retrieved from
http://www.academicjournals.org/AJBM
Gomes, L. F. A. M., Rangel, L. A. D., & Junior, M. R. L. (2011). Treatment of
uncertainty through the interval smart/swing weighting method: A case study.
Pesquisa Operacional, 3, 467–485. Retrieved from http://www.scielo.br
Government of Alberta, (2009). Energy Strategy. Retrieved from http://www.alberta.ca
Government of Alberta, (2010). Alberta’s oil sands. Retrieved from
http://www.oilsands.alberta.ca
Government of Alberta, (2014). Business in Alberta. Retrieved from
http://www.economicdashboard.albertacanada.com
Grant, J. K. (2011). What can we learn from the 2010 BP oil spill? Five important
corporate law and life lessons. McGeorge Law Review 42, 803–824. Retrieved
from http://www.ssrn.com/abstract=1701892
Gray, W. B., & Shimshack, J. P. (2011). The effectiveness of environmental monitoring
and enforcement: A review of the empirical evidence. Review of Environmental
Economics and Policy, 5, 3-24. doi:10.1093/reep/req017
Greco, S., Matarazzo, B., & Sowiski, R. (2010). Dominance-based rough set approach to
decision under uncertainty and time preference. Annals of Operations
Research, 176, 41–75. doi:10.1007/s10479-009-0566-8
Gregory, R., Failing, L., Harstone, M., Long, G., McDoniels, D., & Ohlson, D. (2012).
Structured decision-making, a practical guide to environmental management
191
choices. West Sussex, UK: Wiley-Blackwell.
Grošelj, P., Malovrh, Š., & Stirn, L. Z. (2011). Methods based on data envelopment
analysis for deriving group priorities in analytic hierarchy process. Central
European Journal of Operations Research, 19, 267–284. doi:10.1007/s10100-
011-0191-X
Groselj, P., & Stirn, L. Z. (2012). Acceptable consistency of aggregated comparison
matrices in analytic hierarchy process. European Journal of Operational
Research, 223, 417–420. doi:10.1016/j.ejor.2012.06.016
Hanan, D., Burnley, S., & Cooke, D. (2012). A multi-criteria decision analysis
assessment of waste paper management options. Waste Management, 33, 566–
573. doi:10.1016/j.wasman.2012.06.007
Hanewinkel, M., & Oehler, K. (2012). A review of decision-making approaches to handle
uncertainty and risk in adaptive forest management under climate change. Annals
of Forest Science, 69, 1-15. doi:10.1007/s13595-011-0153-4
Hendriksen, A., Tukahirwa, J., Oosterveer, P. J. M., & Mol, A. P. J. (2012). Participatory
decision-making for sanitation improvements in unplanned urban settlements in
East Africa. Journal of Environment & Development, 21, 98–119.
doi:10.1177/1070496511426778
Hey, J. D., Lotito, G., & Maffioletti, A. (2010). The descriptive and predictive adequacy
of theories of decision-making under uncertainty/ambiguity. Journal of Risk and
Uncertainty, 41, 81–111. doi:10.1007/s11166-010-9102-0

192
Hill, S., & Ferguson-Martin, C. (2010). Energy’s backyard bugaboo: Convincing
Canadians to save energy and embrace renewables takes more than financial
incentives. Alternatives Journal, 36, 12–15. Retrieved from
http://www.galegroup.com.
Ho, W., Xu, X., & Dey, P. K. (2010). Multi-criteria decision-making approaches for
supplier evaluation and selection: A literature review. European Journal of
Operational Research, 202, 16–24. doi:10.1016/j.ejor.2009.05.009
Holzinger, K., Knill, C., & Sommerer, T. (2008). Environmental policy convergence: The
impact of international harmonization, transnational communication, and
regulatory competition. International Organization, 62, 553–587.
doi:10.1017/S002081830808020X
Hopkins, A. (2011). Risk-management and rule-compliance: Decision-making in
hazardous industries. Safety Science, 49, 110–120. doi:10.1016/j.ssci.2010.07.014
Hopper, A. (2008). A crude reality: Canada's oil sands and pollution. Harvard
International Review, 30(3), 9–10. (Document ID: 1600576571)
Hsu, C.-C., & Stanford, B. A. (2007). The Delphi technique: Making sense of consensus.
Practical Assessment, Research & Evaluation, 12(10), 1–8. Retrieved from
http://www.pareonline.net/getvn.asp?v=12&n=10
Hsueh, L., & Prakash, A. (2012). Incentivizing self‐regulation: Federal vs. state‐level
voluntary programs in US climate change policies. Regulation & Governance, 6,
445-473. doi:10.1111/j.1748-5991.2012.01140.x

193
Huang, I.B., Keisler, J., & Linkov, I. (2011). Multi-criteria decision analysis in
environmental sciences: Ten years of application and trends. Science of the Total
Environment, 409, 3578–3594. doi:10.1016/j.scitotenv.2011.06.022
Huang, H., Zhang, L., Liu, Z., & Sutherland, J. W. (2011). Multi-criteria decision-making
and uncertainty analysis for materials selection in environmentally conscious
design. The International Journal of Advanced Manufacturing Technology, 52,
421–432. doi:10.1007/s00170-010-2745-9
Huising, R., & Silbey, S. S. (2011). Governing the gap: Forging safe science through
relational regulation. Regulation & Governance, 5, 14–42. doi:10.1111/j.1748-
5991.2010.01100.x
Humphries, M. (2010). North American oil sands: History of development, prospects for
the future. Darby, PA: Diane Publishing Co.
Huque, A. S., & Watton, N. (2010). Federalism and the implementation of environmental
policy: changing trends in Canada and the United States. Public Organization
Review 10, 71–88. doi:10.1007/s11115-009-0089-4
Hurley, T., Sadiq, R., & Mazumder, A. (2012). Adaptation and evaluation of the
Canadian council of ministers of the environment water quality index (CCME
WQI) for use as an effective tool to characterize drinking source water quality.
Water Research, 46, 3544–3552. doi:10.1016/j.watres.2012.03.061
Imam, E., & Tesfamichael, G. Y. (2013). Use of remote sensing, GIS and analytical
hierarchy process (AHP) in wildlife habitat suitability analysis. Journal of

194
Materials and Environmental Science, 4, 460–467. Retrieved from
http://www.jmaterenvironsci.com/
In situ oil sands SOR reduction initiative (2013). In Situ Oil Sands SOR Reduction
Initiative 2013 Limited. Retrieved from http://www.oil-sands-sor-reduction-
2013.com
Isendahl, N., Pahl-Wostl, C., & Dewulf, A. (2010). Using framing parameters to improve
handling of uncertainties in water management practice. Environmental Policy &
Governance, 20, 107-122. doi:10.1002/eet.533
Ishizaka, A. (2012). Clusters and pivots for evaluating a large number of alternatives in
AHP. Pesquisa Operacional, 32, 87–102. doi:10.1590/S0101-
74382012005000002
Ishizaka, A., Balkenborg, D., & Kaplan, T. (2011a). Does AHP help us make a choice &
quest; an experimental evaluation. Journal of the Operational Research Society,
62, 1801-1812. doi:10.1057/jors.2010.158
Ishizaka, A., Balkenborg, D., & Kaplan, T. (2011b). Influence of aggregation and
measurement scale on ranking a compromise alternative in AHP. Journal of the
Operational Research Society, 62, 700-710. doi:10.1057/jors.2010.23
Ishizaka, A., & Labib, A. (2009). Analytic hierarchy process and expert choice: Benefits
and limitations. OR Insight, 22, 201-220. doi:10. 1057/ori.2009.10
Ishizaka, A., & Labib, A. (2011a). Review of the main developments in the analytic
hierarchy process. Expert Systems with Applications, 38, 14336–14345.
195
doi:10.1016/j.eswa.2011.04.143
Ishizaka, A., & Labib, A. (2011b). Selection of new production facilities with the group
analytic hierarchy process ordering method. Expert Systems with Applications, 38,
7317-7325. doi:10.1016/j.eswa.2010.12.004
Ishizaka, A., & Nguyen, N. H. (2013). Calibrated fuzzy AHP for current bank account
selection. Expert Systems with Applications, 40, 3775-3783.
doi:10.1016/j.eswa.2012.12.089
Jafari, J., Khorasani, N., & Danehkar, A. (2010). Using environmental sensitivity index
(ESI) to assess and manage environmental risks of pipelines in GIS environment:
A case study of a near coastline and fragile ecosystem located pipeline. World
Academy of Science, Engineering and Technology, 44, 1101–1111. Retrieved
from http://waset.org/journals/waset/
Jajimoggala, S., & Karri, R. R. (2013). Decision-making model for material selection
using a hybrid MCDM technique. International Journal of Applied Decision
Sciences, 6, 144–159. doi:10.1504/IJADS.2013.053273
Janicke, M., & Lindemann, S. (2010). Governing environmental innovations.
Environmental Politics, 19, 127–141. doi:10.1080/09644010903396150
Janssen, S., Ewert, F., Li, H., Athanasiadis, I., Wien, J., Thérond, O., & van Ittersum, M.
K. (2009). Defining assessment projects and scenarios for policy support: Use of
ontology in integrated assessment and modeling. Environmental Modeling &
Software, 24, 1491–1500. doi:10.1016/j.envsoft.2009.04.009
196
Jaskowski, P., & Biruk, S. (2011) Framework for construction project risk assessment.
Reliability: Theory & Applications, 2, 27–35. Retrieved from
http://www.gnedenko-forum.org
Jaskowski, P., Biruk, S., & Bucon, R. (2010). Assessing contractor selection criteria
weights with fuzzy AHP method application in group decision environment.
Automation in Construction, 19, 120–126. doi:10.1016/j.autcon.2009.12.014
Jayant, A., Gupta, P., & Garg, S. K. (2011). An application of the analytic network
process to evaluate supply chain logistics strategies. International Journal of the
Analytic Hierarchy Process, 3, 149–171. Retrieved from http://www.ijahp.org/
Jergeas, G. F., & Ruwanpura, J. (2010). Why cost and schedule overruns on mega oil
sands projects? Practice Periodical on Structural Design & Construction, 15, 40–
43. doi:10.1061/(ASCE)SC.1943-5576.0000024
Jones, R. E., & Dunlap, R. E. (2010). The social bases of environmental concern: Have
they changed over time? Rural Sociology, 57, 28–47. doi:10.1111/j.1549-
0831.1992.tb00455.x
Jordaan, S. M. (2012). Land and water impacts of oil sands production in Alberta.
Environmental Science & Technology, 46, 3611–3617. doi:10.1021/es203682m
Kara, Y., & Köne, A. C. (2013). The analytic hierarchy process (AHP) approach for
assessment of regional environmental sustainability. In proceeding of: 2012
Berlin Conference of the Human Dimensions of Global Environmental Change on
"Evidence for Sustainable Development" Retrieved from

197
http://www.berlinconference.org/2012/
Kargi, V. S. A., & Ozturk, A. (2012). Subcontractor selection using analytic hierarchy
process. Business and Economics Research Journal, 3(3), 121–143.
Karimi, A. R., Mehrdadi, N. N., Hashemian, S. J., Nabi-Bidhendi, G. R., & Tavakkoli-
Moghaddam, R. R. (2011). Using of the fuzzy TOPSIS and fuzzy AHP methods
for wastewater treatment process selection. International Journal of Academic
Research, 3, 737–745. doi:10.7813/2075-4124.2013
Karni, E. (2011). A theory of Bayesian decision-making with action-dependent subjective
probabilities. Economic Theory, 48, 125–146. doi:10.1007/s00199-010-0542-1
Kaur, P., Verma, R., & Mahanti, N. C. (2010). Selection of vendor using analytical
hierarchy process based on fuzzy preference programming. Opsearch, 47, 16–34.
doi:10.1007/s12597-010-0002-5
Kaya, I., Öztayşi, B., & Kahraman, C. (2012). A two-phased fuzzy multicriteria selection
among public transportation investments for policy-making and risk governance.
International Journal of Uncertainty, Fuzziness and Knowledge-Based Systems,
20(supp01), 31–48. doi:10.1142/S021848851240003X
Kazibudzki, P. T. (2013). On some discoveries in the field of scientific methods for
management within the concept of analytic hierarchy process. International
Journal of Business and Management, 8(8), 22–30. doi:10.5539/ijbm.v8n8p22
Khadka, C., & Vacik, H. (2012). Use of multi-criteria analysis (MCA) for supporting
community forest management. Iforest - Biogeosciences & Forestry, 5(2), 60-71.

198
doi:10.3832/ifor0608-009
Kharola, A. (2014). A fuzzy risk assessment model (FRAM) for risk management (RM).
PM World Journal, 3 (2), Retrieved from http://www.pmworldjournal.net
Kim, Y. J., Hipel, K. W., & Bowman, C. W. (2013). Water security problems in
Canada’s oil sands. Canadian Water Resources Journal, 38, 61–72.
doi:10.1080/07011784.2013.773770
Kimbrough, S., Kunreuther, H., Baron, J., Gong, M., & Xiao, E. (2010). Experiments in
interdependent decision-making under uncertainty. Research Project Summaries.
14. Retrieved from http://research.create.usc.edu/project_summaries/14
Korosuo, A., Wikstrom, P., Ohman, K., & Eriksson, L. (2011). An integrated MCDA
software application for forest planning: a case study in southwestern Sweden.
Mathematical & Computational Forestry & Natural Resource Sciences, 3(2), 75-
86. Retrieved from http://www.mcfns.com
Kortenkamp, K. V., & Moore, C. F. (2010). Psychology of risk perception. Wiley
Encyclopedia of Operations Research and Management Science.
doi:10.1002/9780470400531.eorms0689
Kravchenko, T., & Seredenko, N. (2011). Decision-making with modeling of problem
situations using analytical network hierarchy process. International Journal of the
Analytic Hierarchy Process, 3, 28–45. Retrieved from http://www.ijahp.org/
Křupka, J., Provazníková, R., & Švejcar, J. (2011). Multiple criteria decision analysis of
EU project implementation benefits for the impacted micro-region. International

199
Journal of Mathematical Models and Methods in Applied Sciences, 5, 1354–1362.
Retrieved from http://www.naun.org/
Kubler, S., Voisin, A., Derigent, W., Rondeau, E., & Thomas, A. (2012). A fuzzy
analytic hierarchy process for group decision-making: application for embedding
information on communicating materials. In IEEE International Conference on
Communications, Computing and Control Applications (pp. 270-276). Marseille,
France. Retrieved from http://www.hal.archives-
ouvertes.fr/docs/00/76/28/07/PDF/bare_conf.pdf
Kurek, J., Kirk, J. L., Muir, D. C., Wang, X., Evans, M. S., & Smol, J. P. (2013). Legacy
of a half century of Athabasca oil sands development recorded by lake
ecosystems. Proceedings of the National Academy of Sciences, 110, 1761–1766.
doi:10.1073/pnas.1217675110
Kurka, T. (2013). Application of the analytic hierarchy process to evaluate the regional
sustainability of bioenergy developments. Energy, 62, 393-402. Retrieved from
http://www.sciencedirect.com/science/journal/03605442/62/supp/C
Kusá, D. (2011). Intuitive thought and “ordinary” cognitions. Studia Psychollogica, 53,
111–122. Retrieved from http://cejsh.icm.edu
Kusherbaeva, V. T., Sushkov, Y. A., & Tamazyan, G. S. (2011a). Scales and methods for
deriving weights in the analytic hierarchy process. Vestnik St. Petersburg
University: Mathematics, 44, 282–291. doi:10.3103/S106345411104008X
Kusherbaeva, V. T., Sushkov, Y, A., & Tamazyan, G. S. (2011b). Comparative study of
200
scales and consistency measures in the AHP. In Online proceedings of the 11th
International Symposium on the AHP, Sorrento, Italy.
Kusherbaeva, V. T., Sushkov, Y. A., & Tamazyan, G. S. (2011c). AHP Manager—a
decision-making support system based on the AHP. In Online proceedings of the
11th International Symposium on the AHP, Sorrento, Italy.
Labib, A. W. (2011). A supplier selection model: A comparison of fuzzy logic and the
analytic hierarchy process. International Journal of Production Research, 49,
6287–6299. doi:10.1080/00207543.2010.531776
Lee, M. D., & Newell, B. J. (2011). Using hierarchical Bayesian methods to examine the
tools of decision-making. Judgment & Decision-making, 6, 832–842. Retrieved
from http://www.sjdm.org
Li, Y., Wang, X. W., Duan, X. B., & Hu, W. P. (2013). Risk assessment of power
transformer lifecycle cost based on analytical hierarchy process. Applied
Mechanics and Materials, 291, 2334–2339.
doi:10.4028/www.scientific.net/AMM.291-294.2334
Liao, C. N., & Kao, H. P. (2010). Supplier selection model using Taguchi loss function,
analytical hierarchy process and multi-choice goal programming. Computers &
Industrial Engineering, 58, 571–577. doi:10.1016/j.cie.2009.12.004
Lin, S. W., & Huang, S. W. (2012). Effects of overconfidence and dependence on
aggregated probability judgments. Journal of Modelling in Management, 7, 6-22.
doi:10.1108/17465661211208785

201
Lipovetsky, S. (2010). An interpretation of the AHP eigenvector solution for the
layperson. International Journal of the Analytic Hierarchy Process, 2, 158–162.
Retrieved from http://www.ijahp.org/
Lipovetsky, S. (2011). Priority eigenvectors in analytic hierarchy/network processes with
outer dependence between alternatives and criteria. International Journal of the
Analytic Hierarchy Process, 3, 172–179. Retrieved from http://www.ijahp.org/
Liu, S., Walshe, T., Long, G., & Cook, D. (2012). Evaluation of potential responses to
invasive non-native species with structured decision-making. Conservation
Biology, 26, 539–546. doi:10.1111/j.1523-1739.2012.01843.x
Lopez, V. (2013). Oil sands extraction: Lessons from Alberta can, and should, inform
American policies. Pepperdine Policy Review, 6, 7. Retrieved from
http://digitalcommons.pepperdine.edu
Lotila, P. (2010). Corporate responsiveness to social pressure: an interaction-based model
Journal of Business Ethics 94, 395–409. doi:10.1007/s10551-009-0272-0
Lyons, D. E., Long, J., Goraya, R., Lu, J., & Tomlinson, B. (2012). Cultivating
environmental systems thinking with karunatree. Technical Report LUCI 2012–
002. Retrieved from http://www.luci.ics.uci.edu/# techreports
Machiwal, D., Jha, M. K., & Mal, B. C. (2011). Assessment of groundwater potential in a
semi-arid region of India using remote sensing, GIS and MCDM techniques.
Water Resources Management, 25, 1359–1386. doi:10.1007/s11269-010-9749-y
Maleki, H., & Zahir, S. (2012). A comprehensive literature review of the rank reversal

202
phenomenon in the analytic hierarchy process. Journal of Multi‐Criteria Decision
Analysis, 20, 1–2. doi:10.1002/mcda.1479
Mannix, A. E., Dridi, C., & Adamowicz, W. L. (2010). Water availability in the oil sands
under projections of increasing demands and a changing climate: An assessment
of the Lower Athabasca Water Management Framework (Phase 1). Canadian
Water Resources Journal, 35(1), 29-52. doi:10.4296/cwrj3501029
Martin, T. (2010). Special issue on compliance. The Journal of World Energy Law &
Business, 3, 119–120. doi:10.1093/jwelb/jwq006
Martinez, L., Ruan, D., & Herrera, F. (2010). Computing with words in decision support
systems: An overview on models and applications. International Journal of
Computational Intelligence Systems, 3, 382–395.
Maskin, E. (2011). Commentary: Nash equilibrium and mechanism design. Games and
Economic Behavior, 71(1), 9-11.
Mattioli, E., Lamonica, G., G. R. (2011). An evaluation of methods to make transitive the
multiple comparisons matrices, International Journal of the Analytic Hierarchy
Process, 3, 56–69. Retrieved from http://www.ijahp.org/
Măzăreanu, V. (2011). Understanding risk management in small 7 steps. Young
Economists Journal / Revista Tinerilor Economisti, 9(16), 75–80. Retrieved from
http://thegrcbluebook.com/
McCarthy, S. (2010, Dec. 21). Government’s vow to overhaul environmental monitoring
of oil sands development. The Globe and Mail. Retrieved from

203
http://www.theglobeandmail.com
McCready, J. (2010). Improvements to strategic planning and implementation through
enhanced correlation with decision-making frameworks. (Doctoral dissertation).
Retrieved from ProQuest Dissertations and Theses database. (UMI No. 3397590)
McGee, G. E. (2010). Method and social reconstruction. Dewey's logic: The theory of
inquiry. The Southern Journal of Philosophy, 32, 107–120. doi:10.1111/j.2041-
6962.1994.tb00706.x
McLinden, C. A., Fioletov, V., Boersma, K. F., Krotkov, N., Sioris, C. E., Veefkind, J.
P., & Yang, K. (2012). Air quality over the Canadian oil sands: A first assessment
using satellite observations. Geophysical Research Letters, 39(4), 1–8.
doi:10.1029/2011GL05027
Metaxas, T., & Tsavdaridou, M. (2013). CSR in metallurgy sector in Greece: A content
analysis. Resources Policy, 38(3), 295-309. doi:10.1016/j.resourpol.2013.03.010
Miall, A. D. (2013). Hydrogeology of the oil sands, lower Athabasca area, Alberta.
Geoscience Canada, 40, 215-233. doi:10.12789/geocanj.2013.40.016
Mohebati, M. H., Maini, B.B., & Harding, T.G. (2010, October). Optimization of
hydrocarbon additives with steam in SAGD for three major Canadian oil sands
deposits. Paper presented at Unconventional Resources and International
Petroleum Conference, Society of Petroleum Engineers Calgary, Alberta, Canada.
doi:10.2118/138151-MS
Mota, P., Campos, A. R., & Neves-Silva, R. (2013). First Look at MCDM: Choosing a

204
decision method. Advances in Smart Systems Research, 3(2), 25-30. Retrieved
from http://www.nimbusvault.net/publications/koala/assr/
Nandi, S., Paul, S., & Phadtare, M. (2011). An AHP-based construction project selection
method. Decision, 38, 91–118. Retrieved from http://www.iimcal.ac.in/research
National Energy Board (2006). Canada’s oil sands: Opportunities and challenges to
2015. An update, an energy market assessment. Retrieved from http://www.neb-
one.gc.ca
National Energy Board (2013). 2012 Q4 estimated Canadian crude oil exports by type
and destination. Retrieved from http://www.neb-one.gc.ca
Nicholls, T. (2010, August). The oil sands' environmental tests. Petroleum Economist.
Retrieved from http://www.petroleum-economist.com
Nwite (2014) Strategies of environmental risk management in Nigeria Global Advanced
Research Journal of Management and Business Studies 3, 11-15. Retrieved from
http://www.garj.org/garjmbs
Ordorica-Garcia, G., Wong, S., & Faltinson, J. (2011). Characterization of CO2
emissions in Canada’s oil sands industry: Estimating the future CO2 supply and
capture cost curves. Energy Procedia 4, 2637–2644.
doi:10.1016/j.egypro.2011.02.163
Orlitzky, M., Siegel, D. S., & Waldman, D. A. (2011). Strategic corporate social
responsibility and environmental sustainability. Business & Society, 50, 6–27.
doi:10.1177/0007650310394323
205
Owen, N. A., Inderwildi, O. R., & King, D. A. (2010). The status of conventional world
oil reserves—Hype or cause for concern? Energy Policy, 38, 4743–4749.
doi:10.1016/j.enpol.2010.02.026
Pecchia, L., Bath, P. A., Pendleton, N., & Bracale, M. (2011). Analytic hierarchy process
(AHP) for examining healthcare professionals' assessments of risk factors. The
relative importance of risk factors for falls in community-dwelling older people.
Methods of Information in Medicine, 50, 435–459. doi:10.3414/ME10-01-0028
Perry, C., & Saloff, C. (2011). Oil sands mining reclamation in Alberta: A discussion of
the prior regime and the new mine financial security program. Alberta Law
Review, 49, 277–304. Retrieved from http://www.albertalawreview.com/
Pimentel, J. R. C., Kuntz, J. R., & Elenkov, D. S. (2010). Ethical decision-making: An
integrative model for business practice. European Business Review, 22, 359–376.
doi:10.1108/09555341011056159
Piran, H., Maleknia, R., Akbari, H., Soosani, J., & Karami, O. (2013). Site selection for
local forest park using analytic hierarchy process and geographic information
system (case study: Badreh County). International Research Journal of Applied
and Basic Sciences, 6, 930-935. Retrieved from www.irjabs.com.
Plourde, A. (2012). Oil sands royalties and taxes in Alberta: An assessment of key
developments since the mid-1990s. The Energy Journal, 30, 111–140. Retrieved
from http://www.iaee.org
Pochampally, K. K., & Gupta, S. M., (2008). A multi-phase fuzzy logic approach to

206
strategic planning of a reverse supply chain network, IEEE Transactions on
Electronics Packaging Manufacturing, 31, 72–82,
doi:10.1109/TEPM.2007.914229
Podvezko, V., Mitkus, S., & Trinkūnienė, E. (2010). Complex evaluation of contracts for
construction. Journal of Civil Engineering & Management, 16, 287–297.
doi:10.3846/jcem.2010.33
Poompipatpong, C., & Kengpol, A. (2013). A group decision support methodology to
weight diesel engine’s operating parameters by using analytical hierarchy process
and Delphi. International Journal of Industrial Engineering and Technology, 5,
47-61. Retrieved from http://www.irphouse.com
Posavac, E. J., & Carey, R. G. (2007). Program evaluation: Methods and case studies
(7th ed.). Englewood Cliffs, New Jersey: Prentice-Hall.
Pothos, E. M., & Busemeyer, J. R. (2013). Can quantum probability provide a new
direction for cognitive modeling? Behavioral and Brain Sciences, 36, 255-274
doi:10.1017/S0140525X12001525.
Project Management Institute, Inc. (2013). A guide to project management body of
knowledge, PMBoK Guide. (5th ed.). Newtown Square, PA: Project Management
Institute, Inc.
Prpich, G., Dagonneau, J., Rocks, S. A., Lickorish, F., & Pollard, S. J. (2013). Scientific
commentary: Strategic analysis of environmental policy risks—heat maps, risk
futures and the character of environmental harm. Science of the Total
207
Environment, 463, 442-445. doi:10.1016/j.scitotenv.2013.06.037
Promentilla, M. A. B., De la Cruz, C. A. M., Angeles, K. C., & Tan, K. G. (2013).
Evaluating climate change mitigation options in the Philippines with analytic
hierarchy process (AHP). Asean Journal of Chemical Engineering, 13, 61-66.
Retrieved from http://www.aseanjche.ugm.ac.id
Pun, K. F., Chin, K. S., & Yiu, M. Y. (2010). Developing a self-assessment model for
measuring new product development performance: An AHP approach.
International Journal of Advanced Operations Management, 2, 57–79.
doi:10.1504/IJAOM.2010.034586
Qin, Y., & Yan, W. (2013). Research on risk assessment of underground logistics system
project based on Grey analytic hierarchy process. International Journal of
Engineering Research and Applications, 3, 1247–1251. Retrieved from
www.ijera.com
Radu, S. M., & Stefanie, M. (2013). A method for environmental risk factors
management. Recent Advances in Applied and Theoretical Mathematics,
Retrieved from http://www.wseas.us/e-
library/conferences/2013/Budapest/MATH./MATH-21.pdf
Railsback, L. B. (1990). T. C. Chamberlin's method of multiple working hypotheses: An
encapsulation for modern students. Department of Geology, University of
Georgia, Athens, GA, USA.
Ramanathan, R., & Ramanathan, U. (2010). A qualitative perspective to deriving weights

208
from pairwise comparison matrices. Omega, 38, 228–232.
doi:10.1016/j.omega.2009.09.002
Rasmussen, M. (2009). Foundations of GRC: Streamlining compliance. Corporate
Integrity, LLC. Retrieved from http://www.sap.com/sapbusinessobjects/grc
Reddy, K. D., Govardhan, P. & Prakash, A. B. (2013). Risk management in software
engineering. International Journal of Computer Science & Communication, 4, 32-
38. Retrieved from http://www.csjournals.com/IJCSC/
Rennings, K., & Rexhauser, S. (2011). Long-term impacts of environmental policy and
eco-innovative activities of firms. International Journal of Technology, Policy
and Management, 11, 274-290. doi:0.1504/IJTPM.2011.042087
Research and Innovation (2014). Oil Sands Today. Retrieved from
http://www.oilsandstoday.ca/topics/ResearchInnov/Pages/default.aspx
Rodríguez-Bárcenas, G., & López-Huertas, M. J. (2013). Saaty's analytic hierarchies
method for knowledge organization in decision-making. Journal of the American
Society for Information Science and Technology, 64, 1454. doi:10.1002/asi.22823
Saaty, R. W. (2003). Decision-making in complex environments. The analytical hierarchy
process (AHP) for decision-making and the analytical network process (ANP) for
decision-making with dependence and feedback. Pittsburgh, PA: SuperDecisions.
Saaty, T. L. (2006). Fundamentals of decision-making and priority theory with the
analytical hierarchy process, Vol. VI of the AHP Series. Pittsburgh, PA: RWS
Publications.

209
Saaty, T. L. (2008). The analytical hierarchy and analytical network measurement
processes: Applications to decisions under risk. European Journal of Pure and
Applied Mathematics, 1, 122–196. Retrieved from http://www.ejpam.com
Saaty, T. L. (2010). The eigenvector in lay language. International Journal of the
Analytic Hierarchy Process, 2, 163–169. Retrieved from http://www.ijahp.org/
Saaty, T. L. (2011). Aligning the measurement of tangible with intangible ant the
converse. International Journal of the Analytic Hierarchy Process, 3, 79–87.
Retrieved from http://www.ijahp.org/
Saaty, T. L. (2012). New concepts and applications of AHP in the internet era. Journal of
Multi-Criteria Decision Analysis, Special Issue: New Concepts and Applications
of AHP in the Internet Era 19, 1–2, doi:10.1002/mcda.1469
Saaty, T. L., & Sagir, M. (2009). Extending the measurement of tangibles to intangibles.
International Journal of Information Technology & Decision-making, 8, 7–27.
doi:10.1142/S0219622009003247
Saaty, T. L., & Shang, J. S. (2011). An innovative orders-of-magnitude approach to
AHP-based multi-criteria decision-making: Prioritizing divergent intangible
humane acts. European Journal of Operational Research, 214, 703–715.
doi:10.1016/j.ejor.2011.05.019
Saaty, T. L., & Vargas, L. G. (2012). The possibility of group choice: Pairwise
comparisons and merging functions. Social Choice and Welfare 38, 481–496.
doi:10.1007/s00355-011-0541-6

210
Saaty, T. L., & Vargas, L. G. (2013a). Decision-making with the analytical network
process. International Series in Operations Research & Management Science,
195, 295–318. doi:10.1007/978-14614-7279-7_13
Saaty, T. L., & Vargas, L. G. (2013b). An innovative orders-of-magnitude approach to
AHP-based multicriteria decision-making: Prioritizing divergent intangible
humane acts. International Series in Operations Research & Management
Science, 195, 319–343. doi:10.1007/978-1-4614-7279-7_14
Saaty, T. L., & Zoffer, H. J. (2012). Nina’s decision: How to make better decisions and
resolve conflicts. International Journal of the Analytic Hierarchy Process, 4, 78–
86. Retrieved from http://www.ijahp.org/
Sarabando, P., & Dias, L. (2010). Simple procedures of choice in multicriteria problems
without precise information about the alternatives' values. Computers &
Operations Research, 37, 2239. doi:10.1016/j.cor.2010.03.014
Sato, Y. (2012). Decision-making on the optimization of budget allocation for safety.
Intelligent Decision Technologies 15, 447–455. doi:10.1007/978-3-642-29977-
3_45
Schlosberg, D. (2012). Climate justice and capabilities: A framework for adaptation
policy. Ethics and International Affairs, 26, 445–461.
doi:10.101/S0892679412000615
Schwandt, T. A. Lincoln, Y. S., & Guba, E. E. (2007). Judging interpretations: But is it
rigorous? Trustworthiness and authenticity in naturalistic evaluation. New

211
Directions for Evaluation, 114, 11–25. doi:10.1002/ev.223
Shacklock, A., Manning, M., & Hort, L. (2013). Self-efficacy as an intervening variable
between ethical work climate and decision-making. e-Journal of Social &
Behavioural Research in Business, 4(2), 1-13. Retrieved from
http://www.ejsbrb.org
Shadish, W. R. (2010). Introduction: The perils of science in the world of policy and
practice. Health Psychology, 29, 105–106. doi:10.1037/a0019134
Shafiq, N. (2010). Prioritizing the pipeline maintenance approach using analytical
hierarchical process. International Review of Mechanical Engineers, 4, 346–352.
Retrieved from http://eprints.utp.edu.my/2962/
Shang, G., Zaiyue, Z., & Cungen, C. (2010). Calculating weights methods in complete
matrices and incomplete matrices. Journal of Software, 5, 304–311.
doi:10.4304/jsw.5.3.304-311
Shin, Y. B., & Lee, S. (2013). Note on an approach to preventing rank reversals with
addition or deletion of an alternative in an alternative in analytic hierarchy
process. US-China Education Review, 3, 66–72. Retrieved from
http://www.davidpublishing.com/davidpublishing/Upfile/2/25/2013/20130225713
95521.pdf
Siddiqui, S., Beg, M. R., & Fatima, S. (2013). Effectiveness of requirement prioritization
using analytical hierarchy process (AHP) and planning game (PG): A comparative
study. International Journal of Computer Science and Information Technologies,

212
4, 46–49. Retrieved from http://www.ijcsit.com/
Sipahi, S., & Timor, (2011). The analytic hierarchy process and analytic network process:
An overview of applications. Management Decision 48, 775–808.
doi:10.1108/00251741011043920
Skarzauskiene, A. (2010). Managing complexity: Systems thinking as a catalyst of the
organization performance. Measuring business excellence 14(4), 49–64.
doi:10.1108/13683041011093758
Smith, L. C., Smith, M., & Ashcroft, P. (2010). Analysis of environmental and economic
damages from British Petroleum’s Deepwater Horizon oil spill. SSRN Electronic
Journal. doi:10.2139/ssrn.1653078
Spoel, P., & Den Hoed, R. C. (2014). Places and people: rhetorical constructions of
“community” in a Canadian environmental risk assessment. Environmental
Communication, 8, 267-285. doi:10.1080/17524032.2013.850108
Srdjevic, B., Pipan, M., Srdjevic, Z., Blagojevic, B., & Zoranovic, T. (2013). Virtually
combining the analytical hierarchy process and voting methods in order to make
group decisions. Universal Access in the Information Society. doi:0.1007/s10209-
013-0337-9
Stanujkic, D., Djordjevic, B., & Djordjevic, M. (2013). Comparative analysis of some
prominent MCDM methods: A case of ranking Serbian banks. Serbian Journal of
Management, 8, 213-241. doi:10.5937/sjm8-3774
Steele, K., Carmel, Y., Cross, J., & Wilcox, C. (2009). Uses and misuses of multicriteria

213
decision analysis (MCDA) in environmental decision-making. Society for Risk
Analysis, 29, 26–33. doi:10.1111/j.1539-6924.2008.01130.x
Stewart, B., Archer, J., & Trynacity, K. (2010, June 25). Syncrude guilty in Alberta duck
deaths. CBC News. Retrieved from
http://www.cbc.ca/news/canada/edmonton/story/2010/06/25/edmonton-syncrude-
duck-trial.
Stoklasa, J., Jandová, V., & Talasová, J. (2013). Weak consistency in Saaty's AHP -
evaluating creative work outcomes of Czech art colleges. Neural Network World,
23, 61–77. Retrieved from http://www.nnw.cz/
Talib, F., Rahman, Z., & Qureshi, M. N. (2011). Prioritizing the practices of total quality
management: An analytic hierarchy process analysis for the service industries.
Total Quality Management & Business Excellence, 22, 1331–1351.
doi:10.1080/14783363.2011.625192
Tao, L. (2012). Risk assessment in the supply chain management based on fuzzy AHP
model. Progress in Applied Mathematics, 4, 9.
doi:10.3968/j.pam.1925252820120401.Z0073
Tavana, M., Fazlollahtabar, H. and Hajmohammadi, H. (2012). Supplier selection and
order allocation with process performance index in supply chain management,
International Journal Information and Decision Sciences, 4, 329–349.
doi:10.1504/IJIDS.2012.050379
Tavana, M., & Hatami-Marbini, A. (2011). A group AHP-TOPSIS framework for human

214
spaceflight mission planning at NASA. Expert Systems with Applications, 38,
13588–13603. doi:10.1016/j.eswa.2011.04.108
Tavares, L. V. (2012). An acyclic outranking model to support group decision-making
within organizations. Omega, 40, 782–790. doi.org/10.1016/j.omega.2011.12.006
Tegou, L., Polatidis, H., & Haralambopoulos, D. A. (2010). Environmental management
framework for wind farm siting: Methodology and case study. Journal of
Environmental Management, 91, 2134-2148. doi:10.1016/j.jenvman.2010.05.010
Terlikowski, T. (2008). Some issues on inner structure of information. A definition of the
decision-making problem. Fundamenta Informaticae, 86, 191–212. Retrieved
from http://www.nrc-cnrc.gc.ca
Tjader, Y. C., May, J. H., Shang, J., Vargas, L. G., & Gao, N. (2013). Firm-level
outsourcing decision-making: A balanced scorecard-based analytic network
process model. International Journal of Production Economics.
doi:10.1016/j.ijpe.2013.04.017
Tjader, Y. C., Shang, J. S., & Vargas, L. G. (2010). Offshore outsourcing decision-
making: A policymaker’s perspective. European Journal of Operational
Research, 207, 434–444. doi:10.1016/j.ejor.2010.03.042
Torys (2009). Responsibilities of directors in Canada. A business law guide. Toronto,
Canada. Retrieved from http://www.torys.com
Toth, W., Wolfslehner, B., & Vacik, H. (2014). A framework of a comprehensive
uncertainty analysis of the Analytic Hierarchy Process methodology in the context

215
of environmental decision-making. International Symposium of the Analytic
Hierarchy Process 2014, Washington D.C., U.S.A.
Tseng, M. (2010). An assessment of cause and effect decision-making model for firm
environmental knowledge management capacities in uncertainty. Environmental
Monitoring and Assessment, 161, 549–564. doi:10.1007/s10661-009-0767-2
Tsyganok, V. (2011). About one approach to AHP/ANP stability measurement.
International Journal of the Analytic Hierarchy Process, 3, 46–55. Retrieved
from http://www.ijahp.org
Turskis, Z., & Zavadskas, E. K. (2011). Multiple criteria decision-making (MCDM)
methods in economics: an overview. Technological and economic development of
economy, (2), 397-427. doi:10.3846/20294913.2011.593291
Van Horenbeek, A., & Pintelon, L. (2013). Development of a maintenance performance
measurement framework—using the analytic network process (ANP) for
maintenance performance indicator selection. Omega, 42, 33–46.
doi:10.1016/j.omega.2013.02.006
Van Solms, S. (2011). Validity of the AHP/ANP: Comparing apples and oranges.
International Journal of the Analytic Hierarchy Process, 3, 2–27. Retrieved from
http://www.ijahp.org
Varma, S., Wadhwa, S., & Deshmukh, S. G. (2008). Evaluating petroleum supply chain
performance. Application of analytical hierarchy process to balanced scorecard.
Asia Pacific Journal of Marketing and Logistics, 20, 343–356.
216
doi:10.1108/13555850810890093
Vidal, L-A., Marle, F., & Bocquet, J-C. (2011). Using a Delphi process and the analytic
hierarchy process (AHP) to evaluate the complexity of projects, Expert Systems
with Applications, 38, 5388-5405. doi:10.1016/j.eswa.2010.10.016
Wagner, J., & Armstrong, K. (2010). Managing environmental and social risks in
international oil and gas projects: Perspectives on compliance. The Journal of
World Energy Law & Business, 3, 140–165. doi:10.1093/jwelb/jwq002
Walden, Z. (2011). Emission abatement potential for the Alberta oil sands industry and
carbon capture and storage (CCS) applicability to coal-fired electricity generation
and oil sands. Canadian Energy Research Institute Calgary, Alberta, Canada.
Retrieved from http://www.ceri.ca
Wanderer, L.S., Karanik, M., & Carpintero, D. M. (2013). Genetic algorithms applied to
inconsistent matrices correction in the Analytic Hierarchy Process (AHP). 14 th
Argintine Symposium on Artificial Intellegence. Symposium conducted at the
meeting of ASAI, Argintine.
Wang, X., Chan, H. K., Yee, R. W., & Diaz-Rainey, I. (2012). A two-stage fuzzy-AHP
model for risk assessment of implementing green initiatives in the fashion supply
chain. International Journal of Production Economics, 135, 595-606.
doi:10.1016/j.ijpe.2011.03.021
Wang, Y. M., & Chin, K. S. (2011). A linear programming approximation to the
eigenvector method in the analytic hierarchy process. Information Sciences, 181,

217
5240–5248. doi:10.1016/j.ins.2011.07.009
Wang, Y., Luo, Y., & Xu, Y. (2013). Cross-weight evaluation for pairwise comparison
matrices. Group Decision and Negotiation, 22, 483–497. doi:10.1007/s10726-
011-9279-x
Wang, C., Wu, S., & Lin, L. (2012). An Uncertain Decision-making Model: An
Application to AHP. International Journal of Advanced Research in Computer
Science, 3(2).
Welsch, E., & Vieira, P. (2011, December 8). Canada backs Total’s oil sands project.
Wall Street Journal. Retrieved from http://www.online.wsj.com
Wohl, E., Gerlak, A. K., Poff, N. L., & Chin, A. (2013). Common core themes in
geomorphic, ecological, and social systems. Environmental Management, 1–14.
doi:10.1007/s00267-013-0093-x
Wu, W., Kou, G., Peng, Y., & Ergu, D. (2012). Improved AHP-group decision-making
for investment strategy selection. Technological & Economic Development of
Economy, 18, 299–316. doi:10.3846/20294913.2012.680520
Wu, D. D., Zhang, Y., Wu, D., & Olson, D. (2010). Fuzzy multi-objective programming
for supplier selection and risk modeling: A possibility approach. European
Journal of Operational Research, 200, 774–787. doi:10.1016/j.ejor.2009.01.026
Yang, C. H., & Regan, A. C. (2013). A multi-criteria decision support methodology for
implementing truck operation strategies. Transportation, 40, 713–728.
doi:10.1007/s11116-012-9432-7
218
Yang, C.C., & Yeh, C. H. (2013). Application of system dynamics in environmental risk
management of project management for external stakeholders. Systemic Practice
and Action Research, doi:10.1007/s11213-013-9283-y
Yeh, S., Jordaan, S. M., Brandt, A. R., Turetsky, M. R., Spatari, S., & Keith, D. W.
(2010). Land use greenhouse gas emissions from conventional oil production and
oil sands. Environmental Science & Technology, 44, 8766–8772.
doi:10.1021/es1013278
Yetim, S. (2013). Analysis of analytic hierarchy process of some algebra factors affecting
the field concept over a commutative ring with identity element definition. Life
Science Journal, 10. 328-339. Retrieved from http://www.lifesciencesite.com
Yeung, J. F., Chan, A. P., Chan, D. W., Chiang, Y. H., & Yang, H. (2013). Developing a
benchmarking model for construction projects in Hong Kong. Journal of
Construction Engineering and Management, 139, 705-716.
doi:10.1061/(ASCE)CO.1943-7862.0000622
Yousefpour, R., Jacobsen, J. B., Thorsen, B. J., Meilby, H., Hanewinkel, M., & Oehler,
K. (2012). A review of decision-making approaches to handle uncertainty and risk
in adaptive forest management under climate change. Annals of Forest Science,
69, 1-15. doi:10.1007/s13595-011-0153-4
Yücenur, G. G., Vayvay, Ö., & Demirel, N. (2011). Supplier selection problem in global
supply chains by AHP and ANP approaches under fuzzy environment.
International Journal of Advanced Manufacturing Technology, 56, 823–833.

219
doi:10.1007/s00170-011-3220-y
Zakaria, N. F., Dahlan, H. M., & Hussin, A. R. C. (2010). Deriving priority in AHP using
evolutionary computing approach. WSEAS Transactions on Information Science
and Applications, 7, 714–724. Retrieved from http://www.dl.acm.org/
Zakaria, N. F., Dahlan, H. M., & Hussin, A. R. C. (2012). Prioritization method in the
analytic hierarchy process using evolutionary computing. International Journal of
Innovative Computing, 1, 555–560. Retrieved from http://www.comp.utm.my/
Zarghami, M., & Szidarovszky, F. (2010). On the relation between compromise
programming and ordered weighted averaging operator. Information Sciences,
180, 2239–2248. doi:10.1016/j.ins.2010.01.032
Zavadskas, E. K., Turskis, Z. & Kildienė, S. (2014) State of art surveys of overviews on
MCDM/MADM methods. Technological and Economic Development of
Economy, 20, 165-179. doi.org/10.3846/20294913.2014.892037
Zavadskas, E. K., Turskis, Z., Ustinovichius, L., & Schevchenco, G. (2010). Attributes
weights determining peculiarities in multiple attribute decision-making methods.
Inzinerine Ekonomika-Engineering Economics, 21, 32–43. Retrieved from
http://www.ktu.lt/
Zavadskas, E. K., Vainiuna, P., Turskis, Z., & Tamosaitiene, J. (2012). Multiple criteria
decision support system for assessment of projects managers in construction.
International Journal of Information Technology & Decision-making, 11, 501–
520. doi:10.1142/S0219622012400135

220
Zhang, H., Zhu, W., Wu, Y., & Wang, H. (2010, May). A belief comparison matrix and
its integration method for AHP with incomplete information. Computational
Science and Optimization (CSO), 2010 Third International Joint Conference on
Computational Science and Optimization, 1, 166–169. doi:10.1109/CSO.2010.63
Zietsman, D. & Vanderschuren, M. (2014). Analytic hierarchy process assessment for
potential multi-airport systems – The case of Cape Town. Journal of Air
Transport Management, 36, 41–49. doi:10.1016/j.jairtraman.2013.12.004
Zou, P. X. W., & Li, J. (2010). Risk identification and assessment in subway projects:
Case study of Nanjing subway line 2. Construction Management and Economics,
28, 1219–1238. doi:10.1080/01446193.2010.519781
Zou, R., Liu, Y., Liu, L., & Guo, H. (2010). REIPL approach for uncertainty-based
decision-making in civil engineering. Journal of Computing in Civil Engineering,
24, 357–364. doi:10.1061/(ASCE)CP.1943-5487.0000037
221
Appendix A: Consent Form
You are invited to take part in a research study about environmental compliance
risk management of oil sands in situ projects. You were chosen to participate in the study
as a senior management member or senior project manager of an oil sands in situ project
in Alberta. You are perceived to have the knowledge and experience with major projects,
project risk management, and the regulatory compliance of in situ projects in Alberta.
This form is part of a process called “informed consent” to allow you to understand this
study before deciding whether to take part.
This study is being conducted by a researcher named Izak J. Roux P. Eng., who is a
doctoral student at Walden University.
Background Information:
The purpose of this study is to identify and weigh the key environmental
compliance risks and rank the most appropriate mitigation strategies. Experienced
managers and engineers from Alberta oil sands companies will be surveyed. For large
construction projects, including in situ oil sands projects, involving environmental
changes a new primary risk may be added, that is compliance with environmental
regulations. The environmental compliance risks will be identified as well as mitigation

222
strategies to help management with the risk management of future in situ projects in
Alberta.
Procedures:
If you agree to be in this study, you will be asked to:
Participate in a survey to weigh environmental compliance risks and mitigation
strategies (approximately 1 hour).
Participate in a feedback review after the rankings of the risk and mitigations been
determined (approximately 1hour)
Voluntary Nature of the Study:
This study is voluntary. Everyone will respect your decision of whether or not you
choose to be in the study. If you decide to join the study now, you can still change your
mind during or after the study. You may stop at any time.
Risks and Benefits of Being in the Study:
There is no risk associated with participating in this study. The benefit of participating in
the study is that of helping to rank environmental compliance risks and mitigation
strategies. This risk management knowledge may be applied to your current or future in
situ projects.

223
Compensation:
There is no compensation for participating in the study. The researcher will provide an
executive summary of the results to all participants and the researcher offer to make a
presentation of the outcome of the study to your company executives. The presentation
will be offered after the dissertation has been approved, and the researcher has formally
graduated.
Privacy:
Any information you provide will be kept anonymous. The researcher will not use your
personal information or the company name for any purposes outside of this research
project. In addition, the researcher will not include your name or anything else that could
identify you or your company in the study reports; however, the researcher may seek to
publish the results of this study in scholarly journals. I shall keep the data secure by
storing it on a CD disk in my home office for a period of at least 5 years as required by
the university.
Contacts and Questions:
You may ask any questions you have now. Alternatively, if you have questions later, you
may contact the researcher via telephone (780) 885-9883 or email
[email protected]. If you want to talk privately about your rights as a participant,
you can call Dr. Leilani Endicott. She is the Walden University representative who can

224
discuss this with you. Her phone number is 1-800-925-3368, extension 1210. Walden
University’s approval number for this study is 04-16-14-0164187 and it expires on April
15, 2015.
The researcher will give you a copy of this form to keep.
Statement of Consent:
I have read the above information, and I feel I understand the study well enough to make
a decision about my involvement. By returning a completed survey, I understand that I
agree to the terms described above, and I confirm that my organization is supportive of
my participation.
Printed Name of Participant
Date of consent
Participant’s Written or Electronic Signature
Researcher’s Written or Electronic Signature

225
Appendix B: Invitation Email and Letter of Cooperation
Sample Invitation Email
Dear Sir/Miss/Madame
With reference to our telephonic discussion, you are invited to participate in this survey.
This will be an anonymous and voluntary survey, and all participants may quit at any
time. The survey is in support of my doctoral study with the Technology and
Management Faculty, Walden University, Minnesota, USA. The title of my dissertation
is “Applying the Analytic Hierarchy Process to Oil sands Environmental Compliance
Risk Management”.
The objective of this survey will be the determination of the ranking of environmental
compliance risks and mitigation strategies. Your opinion as a senior executive (or senior
project engineer) involved in SAGD projects will be required. Each participant’s inputs
will be used along with other participants’ inputs to weigh the importance of
environmental compliance risks and mitigation strategies. These inputs will determine the
overall ranking of environmental compliance risks and mitigation strategies. The results
of this study will be summarized in an executive summary and made available to all
participants.
I thank you for participating in this survey and contributing to my research. Please
complete a consent form and send it with your acknowledgement to the email address

226
indicated. If you wish to receive a summary of the research results, please indicate so in
an email to [email protected]
Thank you
Izak J. Roux, P, Eng.
Doctoral Student

227
Sample Letter of Cooperation from a Community Research Partner
Community Research Partner Name
Calgary
Alberta, Canada
Date
Dear Izak Roux,
Based on my review of your research proposal, I give permission for you to conduct the
study entitled Applying the Analytic Hierarchy Process to Oil sands Environmental
Compliance Risk Management within the Insert Name of Community Partner. As part of
this study, I authorize you to recruit oil sands project experts who may participate in the
specialized survey. Individuals’ participation will be voluntary and at their discretion.
We understand that our organization’s responsibilities include the following: Identify
subject matter experts, introduce them to you and that no site intervention will be
required. We reserve the right to withdraw from the study at any time if our
circumstances change.

228
I confirm that I am authorized to approve research in this setting.
I understand that the data collected will remain entirely confidential and may not be
provided to anyone outside of the research team without permission from the Walden
University IRB.
Sincerely,
Authorization Official
Contact Information

229
Appendix C: Pairwise Decision Specialized Survey
Oil Sand In Situ Projects Environmental Compliance Risk and Mitigation Strategy
Survey
The survey is divided into two parts. The first part focuses on risks contributing to
environmental regulatory compliance. The second part of the survey focuses on the
ranking of the mitigation strategies. The survey will be completed using the Excel
spreadsheet attached to the email.
In the survey, you will be requested to compare two factors or two mitigation
strategies at a time. It is important not to consider any other risk or mitigation strategy
when doing the pairwise comparison. To compare two criteria A and B; they are either
equal important, or A is more important than B or B is more important than A. The
difference in importance is defined on a scale of 1 to 9.
Definition of Pairwise Comparison Scale
1 Equal
2 Low moderate
3 Moderate
4 Moderate plus
5 Strong
6 Strong plus
7 Very strong
8 Very very strong
9 Extreme
For example, the natural environmental risk has four subcriteria that need to be
weighed using pairwise comparison. The subcriteria are
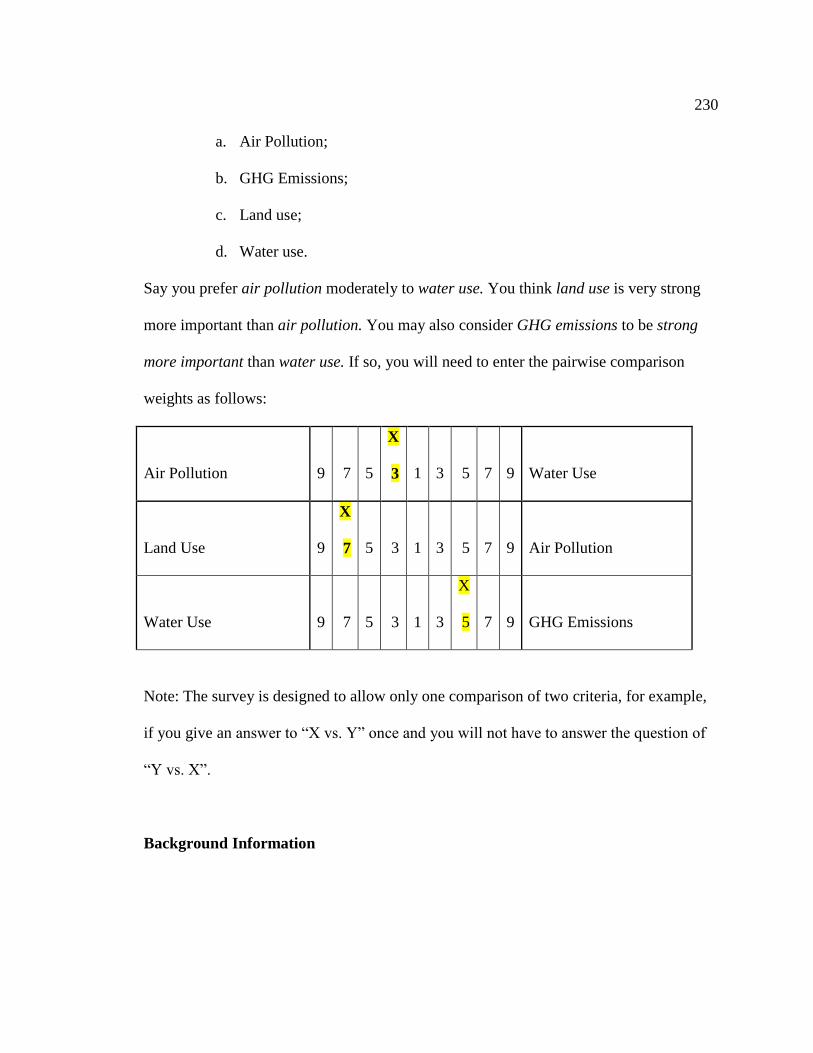
230
a. Air Pollution;
b. GHG Emissions;
c. Land use;
d. Water use.
Say you prefer air pollution moderately to water use. You think land use is very strong
more important than air pollution. You may also consider GHG emissions to be strong
more important than water use. If so, you will need to enter the pairwise comparison
weights as follows:
Air Pollution 9 7 5
X
3 1 3 5 7 9 Water Use
Land Use 9
X
7 5 3 1 3 5 7 9 Air Pollution
Water Use 9 7 5 3 1 3
X
5 7 9 GHG Emissions
Note: The survey is designed to allow only one comparison of two criteria, for example,
if you give an answer to “X vs. Y” once and you will not have to answer the question of
“Y vs. X”.
Background Information

231
During the evaluation, design, and execution phases, project engineers and
executives of in situ oil sands projects have to make decisions that affect the plant design.
Their decisions will affect the plant’s potential to comply with the future environmental
legislation and regulations. It is important to develop a consistent risk management
system for the project. At the beginning of a project, minimal environmental and process
data may be available, and there is uncertainty about future environmental and regulatory
requirements. The success of the project and the future sustainability depends on the
environmental risk management strategy followed by decision makers and working with
all stakeholders (Álvarez et al., 2013). The outcome of this study will provide a ranking
of compliance issues relative to other characteristics of the in situ oil sands facility. The
final ranking will help executives and project engineers to better management the risk
under the uncertainty of future environmental compliance requirements. Better risk
management should improve business sustainability and corporate environmental
responsibility. Engineers and project managers who understand the potential regulatory
compliance risk may have a better chance to complete the project successfully
Environmental risk imposes a threat to the natural environment and a social and
economic threat to the communities in the province of Alberta. A better understanding of
the criteria influencing future regulatory compliance might reduce project compliance
risks. The identification and ranking of the environmental compliance risks and
mitigation strategies will allow project managers to focus on the relevant risks and
strategies early in the project life cycle.

232
Example:
Natural Environmental risks are equally important to Human environmental risks.
Natural Environmental risks are strongly more important than Political risks
Economic risks are absolute more important than Natural Environmental risks.
Natural Environmental risks 9 7 5 3
1
X 3 5 7 9
Human
environmental
risks
Natural Environmental risks 9 7
5
X 3 1 3 5 7 9 Political
Natural Environmental risks 9 7 5 3 1 3 5 7
X
9 Economic
Note: Do not be concerned if you create inconsistencies by accident, the technique will
take care of that. An example of inconsistency is if A is more important than B, and B is
more important than C then A will be more important than C.
Definition of risks
1. Economic compliance risk;
2. Financial compliance risk;
3. Human environmental risks;
4. Political compliance risk;
233
5. Post Failure risk;
6. Regulatory compliance risk;
7. Reputational compliance risk;
8. Social compliance risk;
9. Technological compliance risk.

234
Rank the following compliance factors, using pairwise comparison (This list could
change following the pilot survey)
1Economic compliance
risk
9 7 5 3 1 3 5 7 9 2Financial compliance
risk
1Economic compliance
risk
9 7 5 3 1 3 5 7 9 3Human environmental
risks
1Economic compliance
risk
9 7 5 3 1 3 5 7 9 4Political compliance
risk
1Economic compliance
risk
9 7 5 3 1 3 5 7 9 5Post Failure risk
1Economic compliance
risk
9 7 5 3 1 3 5 7 9 6Regulatory
compliance risk
1Economic compliance
risk
9 7 5 3 1 3 5 7 9 7Reputational
compliance risk
1Economic compliance
risk
9 7 5 3 1 3 5 7 9 8Social compliance risk
1Economic compliance
risk
9 7 5 3 1 3 5 7 9 9Technological
compliance risk
2Financial compliance
risk 9 7 5 3 1 3 5 7 9
3Human environmental
risks
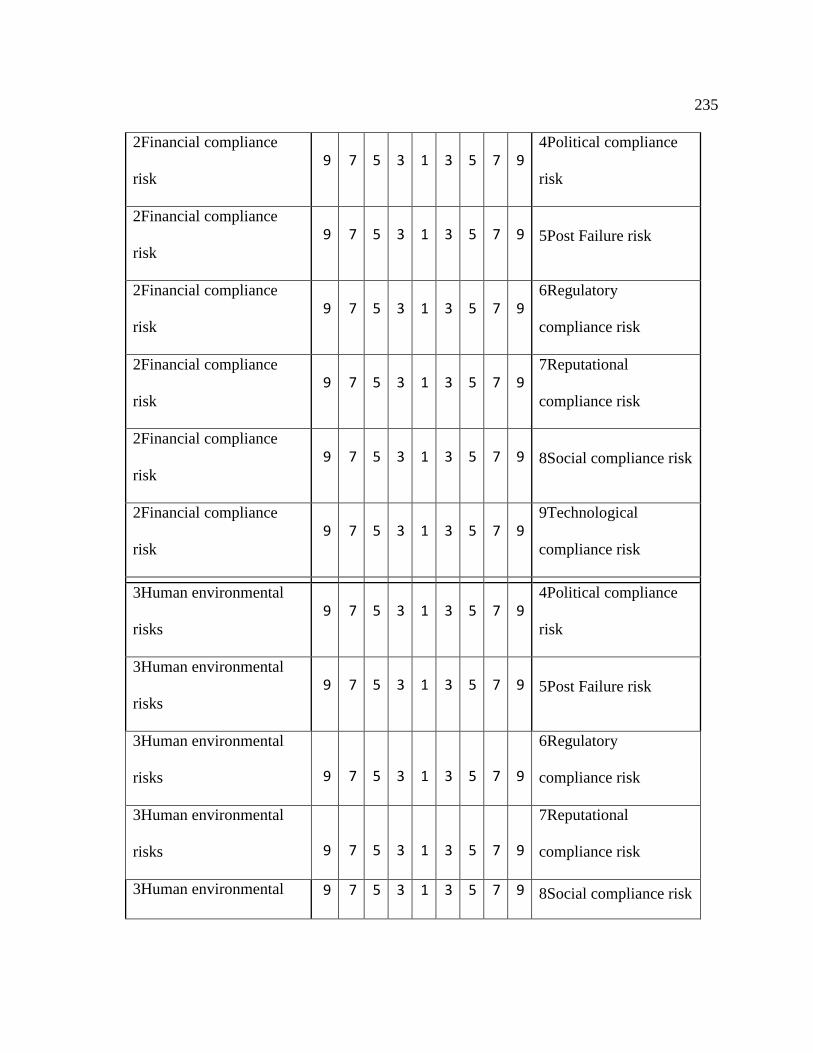
235
2Financial compliance
risk
9 7 5 3 1 3 5 7 9 4Political compliance
risk
2Financial compliance
risk
9 7 5 3 1 3 5 7 9 5Post Failure risk
2Financial compliance
risk
9 7 5 3 1 3 5 7 9 6Regulatory
compliance risk
2Financial compliance
risk
9 7 5 3 1 3 5 7 9 7Reputational
compliance risk
2Financial compliance
risk
9 7 5 3 1 3 5 7 9 8Social compliance risk
2Financial compliance
risk
9 7 5 3 1 3 5 7 9 9Technological
compliance risk
3Human environmental
risks 9 7 5 3 1 3 5 7 9
4Political compliance
risk
3Human environmental
risks
9 7 5 3 1 3 5 7 9 5Post Failure risk
3Human environmental
risks 9 7 5 3 1 3 5 7 9
6Regulatory
compliance risk
3Human environmental
risks 9 7 5 3 1 3 5 7 9
7Reputational
compliance risk
3Human environmental 9 7 5 3 1 3 5 7 9 8Social compliance risk

236
risks
3Human environmental
risks 9 7 5 3 1 3 5 7 9
9Technological
compliance risk
4Political compliance risk 9 7 5 3 1 3 5 7 9 5Post Failure risk
4Political compliance risk
9 7 5 3 1 3 5 7 9
6Regulatory
compliance risk
4Political compliance risk
9 7 5 3 1 3 5 7 9
7Reputational
compliance risk
4Political compliance risk 9 7 5 3 1 3 5 7 9 8Social compliance risk
4Political compliance risk
9 7 5 3 1 3 5 7 9
9Technological
compliance risk
5Post Failure risk 9 7 5 3 1 3 5 7 9
6Regulatory
compliance risk
5Post Failure risk
9 7 5 3 1 3 5 7 9
7Reputational
compliance risk
5Post Failure risk 9 7 5 3 1 3 5 7 9 8Social compliance risk
5Post Failure risk
9 7 5 3 1 3 5 7 9
9Technological
compliance risk
6Regulatory compliance
risk 9 7 5 3 1 3 5 7 9
7Reputational
compliance risk
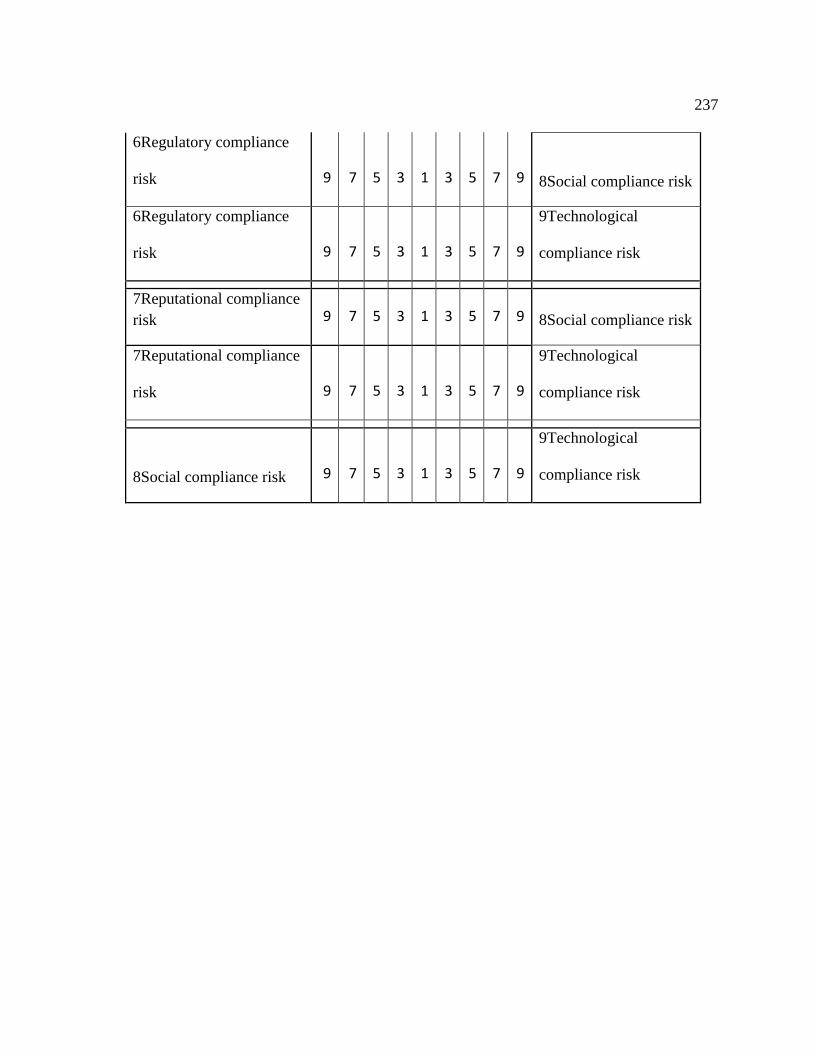
237
6Regulatory compliance
risk 9 7 5 3 1 3 5 7 9 8Social compliance risk
6Regulatory compliance
risk 9 7 5 3 1 3 5 7 9
9Technological
compliance risk
7Reputational compliance
risk 9 7 5 3 1 3 5 7 9 8Social compliance risk
7Reputational compliance
risk 9 7 5 3 1 3 5 7 9
9Technological
compliance risk
8Social compliance risk 9 7 5 3 1 3 5 7 9
9Technological
compliance risk

238
Rank the following environmental risks, using pairwise comparison
Air Pollution 9 7 5 3 1 3 5 7 9 GHG Emissions
Air Pollution 9 7 5 3 1 3 5 7 9 Land Use/Footprint
Air Pollution 9 7 5 3 1 3 5 7 9 Water use
Air Pollution 9 7 5 3 1 3 5 7 9 Water Quality
GHG Emissions
9 7 5 3 1 3 5 7 9 Land Use/Footprint
GHG Emissions 9 7 5 3 1 3 5 7 9 Water use
GHG Emissions 9 7 5 3 1 3 5 7 9 Water Quality
Land Use/Footprint 9 7 5 3 1 3 5 7 9 Water use
Land Use/Footprint 9 7 5 3 1 3 5 7 9 Water Quality
Water use 9 7 5 3 1 3 5 7 9 Water Quality
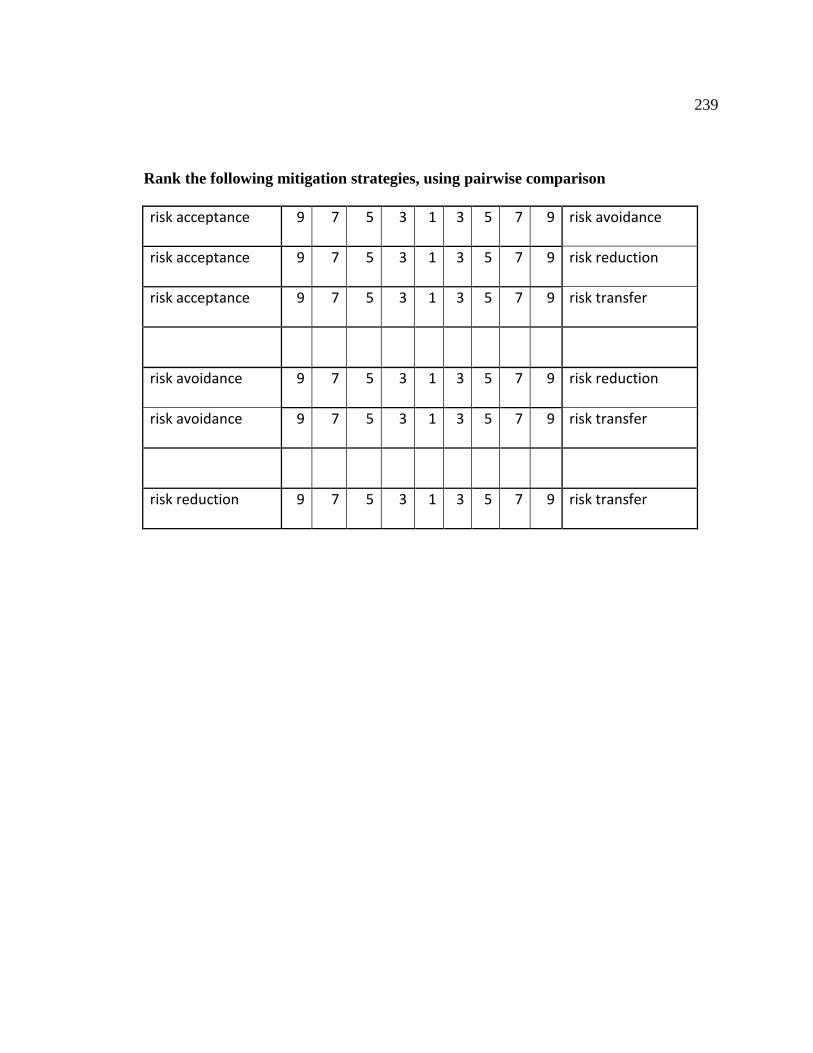
239
Rank the following mitigation strategies, using pairwise comparison
risk acceptance 9 7 5 3 1 3 5 7 9 risk avoidance
risk acceptance 9 7 5 3 1 3 5 7 9 risk reduction
risk acceptance 9 7 5 3 1 3 5 7 9 risk transfer
risk avoidance 9 7 5 3 1 3 5 7 9 risk reduction
risk avoidance 9 7 5 3 1 3 5 7 9 risk transfer
risk reduction 9 7 5 3 1 3 5 7 9 risk transfer
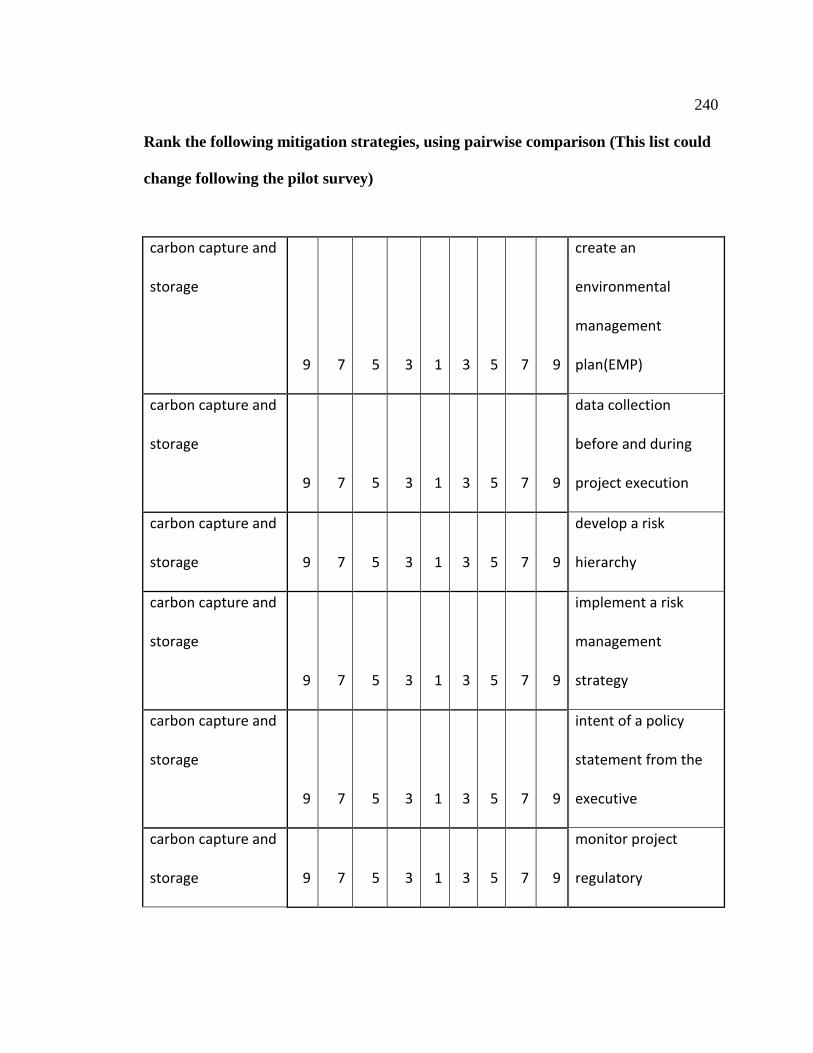
240
Rank the following mitigation strategies, using pairwise comparison (This list could
change following the pilot survey)
carbon capture and
storage
9 7 5 3 1 3 5 7 9
create an
environmental
management
plan(EMP)
carbon capture and
storage
9 7 5 3 1 3 5 7 9
data collection
before and during
project execution
carbon capture and
storage 9 7 5 3 1 3 5 7 9
develop a risk
hierarchy
carbon capture and
storage
9 7 5 3 1 3 5 7 9
implement a risk
management
strategy
carbon capture and
storage
9 7 5 3 1 3 5 7 9
intent of a policy
statement from the
executive
carbon capture and
storage 9 7 5 3 1 3 5 7 9
monitor project
regulatory
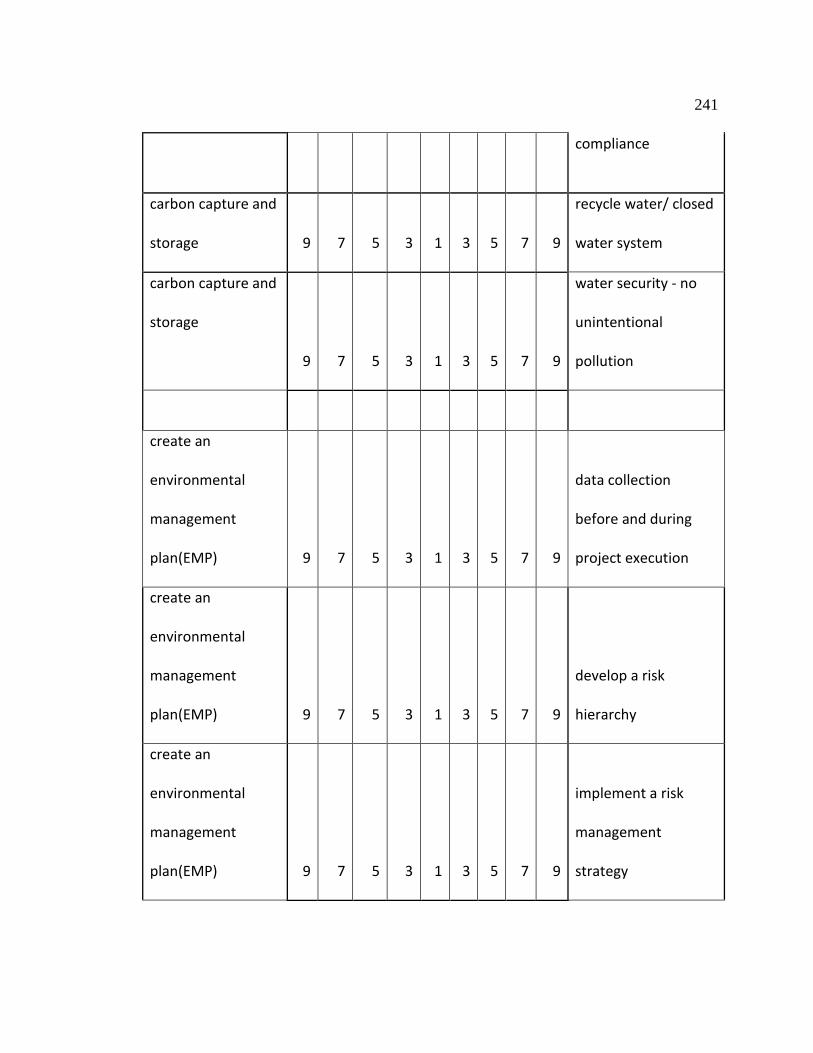
241
compliance
carbon capture and
storage 9 7 5 3 1 3 5 7 9
recycle water/ closed
water system
carbon capture and
storage
9 7 5 3 1 3 5 7 9
water security - no
unintentional
pollution
create an
environmental
management
plan(EMP) 9 7 5 3 1 3 5 7 9
data collection
before and during
project execution
create an
environmental
management
plan(EMP) 9 7 5 3 1 3 5 7 9
develop a risk
hierarchy
create an
environmental
management
plan(EMP) 9 7 5 3 1 3 5 7 9
implement a risk
management
strategy

242
create an
environmental
management
plan(EMP) 9 7 5 3 1 3 5 7 9
intent of a policy
statement from the
executive
create an
environmental
management
plan(EMP) 9 7 5 3 1 3 5 7 9
monitor project
regulatory
compliance
create an
environmental
management
plan(EMP) 9 7 5 3 1 3 5 7 9
recycle water/ closed
water system
create an
environmental
management
plan(EMP) 9 7 5 3 1 3 5 7 9
water security - no
unintentional
pollution
Data collection
before and during
project execution 9 7 5 3 1 3 5 7 9
develop a risk
hierarchy

243
Data collection
before and during
project execution 9 7 5 3 1 3 5 7 9
implement a risk
management
strategy
Data collection
before and during
project execution 9 7 5 3 1 3 5 7 9
intent of a policy
statement from the
executive
Data collection
before and during
project execution 9 7 5 3 1 3 5 7 9
monitor project
regulatory
compliance
Data collection
before and during
project execution 9 7 5 3 1 3 5 7 9
recycle water/ closed
water system
Data collection
before and during
project execution 9 7 5 3 1 3 5 7 9
water security - no
unintentional
pollution
develop a risk
hierarchy
9 7 5 3 1 3 5 7 9
implement a risk
management
strategy

244
develop a risk
hierarchy
9 7 5 3 1 3 5 7 9
intent of a policy
statement from the
executive
develop a risk
hierarchy
9 7 5 3 1 3 5 7 9
monitor project
regulatory
compliance
develop a risk
hierarchy 9 7 5 3 1 3 5 7 9
recycle water/ closed
water system
develop a risk
hierarchy
9 7 5 3 1 3 5 7 9
water security - no
unintentional
pollution
implement a risk
management
strategy 9 7 5 3 1 3 5 7 9
intent of a policy
statement from the
executive
implement a risk
management
strategy 9 7 5 3 1 3 5 7 9
monitor project
regulatory
compliance
implement a risk 9 7 5 3 1 3 5 7 9 recycle water/ closed

245
management
strategy
water system
implement a risk
management
strategy 9 7 5 3 1 3 5 7 9
water security - no
unintentional
pollution
intent of a policy
statement from the
executive 9 7 5 3 1 3 5 7 9
monitor project
regulatory
compliance
intent of a policy
statement from the
executive 9 7 5 3 1 3 5 7 9
recycle water/ closed
water system
intent of a policy
statement from the
executive 9 7 5 3 1 3 5 7 9
water security - no
unintentional
pollution
monitor project
regulatory
compliance leading 9 7 5 3 1 3 5 7 9
recycle water/ closed
water system

246
edge technology
monitor project
regulatory
compliance leading
edge technology 9 7 5 3 1 3 5 7 9
water security - no
unintentional
pollution
recycle water/
closed water
system 9 7 5 3 1 3 5 7 9
water security - no
unintentional
pollution

247
Appendix D: Mitigation Strategy Questionnaire
Ranking of mitigation strategies
Definition of pairwise comparison scale
1 Equal important
2 Between equal and moderate important
3 Moderate more important
4 Between moderate and strong more important
5 Strong more important
6 Between strong and very strong more important
7 Very strong more important
8 Between very strong and extreme more important
9 Extreme more important
Rank the following mitigation strategies, using pairwise comparison
1 RIsk acceptance
9 8 7 6 5 4 3 2 1 2 3 4 5 6 7 8 9 2 Risk avoidance
1 RIsk acceptance
9 8 7 6 5 4 3 2 1 2 3 4 5 6 7 8 9 3 Risk reduction
1 RIsk acceptance
9 8 7 6 5 4 3 2 1 2 3 4 5 6 7 8 9 4 Risk transfer
2 Risk avoidance
9 8 7 6 5 4 3 2 1 2 3 4 5 6 7 8 9 3 Risk reduction
2 Risk avoidance
9 8 7 6 5 4 3 2 1 2 3 4 5 6 7 8 9 4 Risk transfer
3 Risk reduction
9 8 7 6 5 4 3 2 1 2 3 4 5 6 7 8 9 4 Risk transfer
Figure D1. Mitigation strategies specialized survey questionnaire for Level 1 criteria.

248
Figure D2. Mitigations specialized survey questionnaire for Level 2 criteria (Part 1).
Rank the following mitigation strategies, using pairwise comparison
3.1 Carbon capture and
storage 9 8 7 6 5 4 3 2 1 2 3 4 5 6 7 8 9
3.2 Create an
environmental
management plan(EMP)
3.1 Carbon capture and
storage 9 8 7 6 5 4 3 2 1 2 3 4 5 6 7 8 9
3.3 Data collection before
and during project
execution
3.1 Carbon capture and
storage 9 8 7 6 5 4 3 2 1 2 3 4 5 6 7 8 9
3.4 Develop a risk
hierarchy
3.1 Carbon capture and
storage 9 8 7 6 5 4 3 2 1 2 3 4 5 6 7 8 9
3.5 Implement a risk
management strategy
3.1 Carbon capture and
storage 9 8 7 6 5 4 3 2 1 2 3 4 5 6 7 8 9
3.6 Monitor project
regulatory compliance
3.1 Carbon capture and
storage 9 8 7 6 5 4 3 2 1 2 3 4 5 6 7 8 9
3.7 Recycle water/ closed
water system
3.1 Carbon capture and
storage 9 8 7 6 5 4 3 2 1 2 3 4 5 6 7 8 9
3.8 Water security - no
unintentional pollution
3.2 Create an environmental
management plan(EMP)9 8 7 6 5 4 3 2 1 2 3 4 5 6 7 8 9
3.3 Data collection before
and during project
execution
3.2 Create an environmental
management plan(EMP)9 8 7 6 5 4 3 2 1 2 3 4 5 6 7 8 9
3.4 Develop a risk
hierarchy
3.2 Create an environmental
management plan(EMP)9 8 7 6 5 4 3 2 1 2 3 4 5 6 7 8 9
3.5 Implement a risk
management strategy
3.2 Create an environmental
management plan(EMP)9 8 7 6 5 4 3 2 1 2 3 4 5 6 7 8 9
3.6 Monitor project
regulatory compliance
3.2 Create an environmental
management plan(EMP)9 8 7 6 5 4 3 2 1 2 3 4 5 6 7 8 9
3.7 Recycle water/ closed
water system
3.2 Create an environmental
management plan(EMP)9 8 7 6 5 4 3 2 1 2 3 4 5 6 7 8 9
3.8 Water security - no
unintentional pollution
3.3 Data collection before
and during project execution9 8 7 6 5 4 3 2 1 2 3 4 5 6 7 8 9
3.4 Develop a risk
hierarchy
3.3 Data collection before
and during project execution9 8 7 6 5 4 3 2 1 2 3 4 5 6 7 8 9
3.5 Implement a risk
management strategy
3.3 Data collection before
and during project execution9 8 7 6 5 4 3 2 1 2 3 4 5 6 7 8 9
3.6 Monitor project
regulatory compliance
3.3 Data collection before
and during project execution9 8 7 6 5 4 3 2 1 2 3 4 5 6 7 8 9
3.7 Recycle water/ closed
water system
3.3 Data collection before
and during project execution9 8 7 6 5 4 3 2 1 2 3 4 5 6 7 8 9
3.8 Water security - no
unintentional pollution
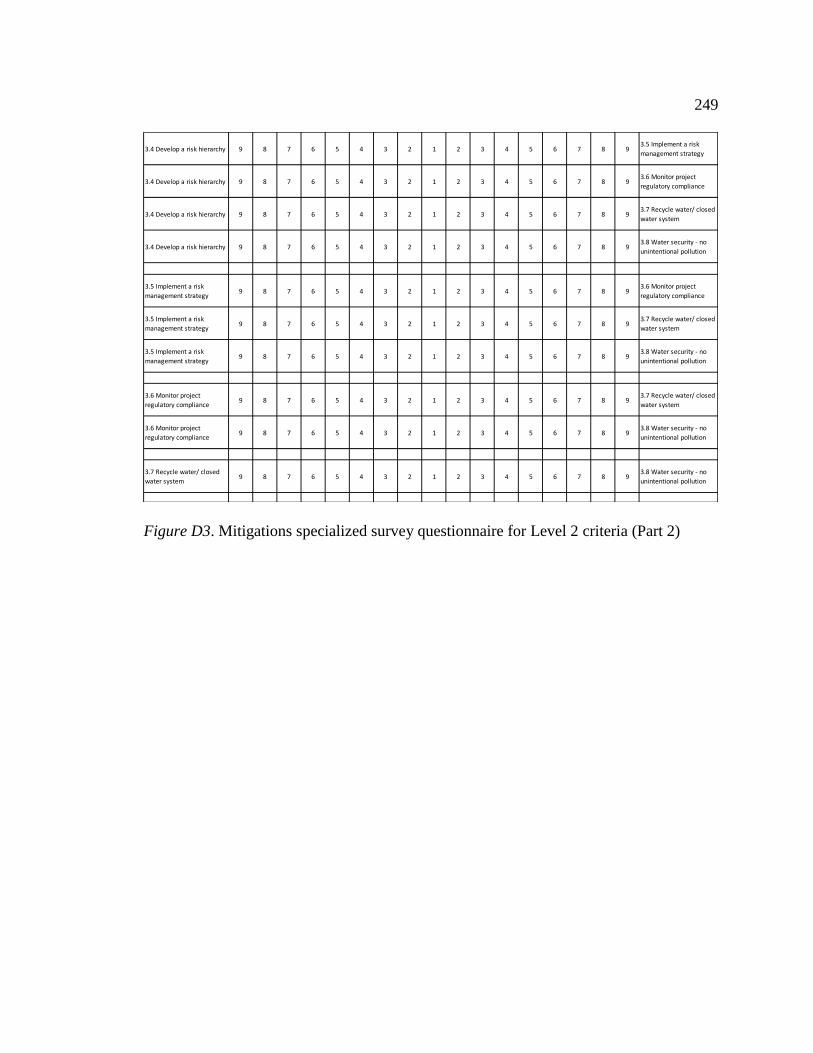
249
Figure D3. Mitigations specialized survey questionnaire for Level 2 criteria (Part 2)
3.4 Develop a risk hierarchy 9 8 7 6 5 4 3 2 1 2 3 4 5 6 7 8 93.5 Implement a risk
management strategy
3.4 Develop a risk hierarchy 9 8 7 6 5 4 3 2 1 2 3 4 5 6 7 8 93.6 Monitor project
regulatory compliance
3.4 Develop a risk hierarchy 9 8 7 6 5 4 3 2 1 2 3 4 5 6 7 8 93.7 Recycle water/ closed
water system
3.4 Develop a risk hierarchy 9 8 7 6 5 4 3 2 1 2 3 4 5 6 7 8 93.8 Water security - no
unintentional pollution
3.5 Implement a risk
management strategy9 8 7 6 5 4 3 2 1 2 3 4 5 6 7 8 9
3.6 Monitor project
regulatory compliance
3.5 Implement a risk
management strategy9 8 7 6 5 4 3 2 1 2 3 4 5 6 7 8 9
3.7 Recycle water/ closed
water system
3.5 Implement a risk
management strategy9 8 7 6 5 4 3 2 1 2 3 4 5 6 7 8 9
3.8 Water security - no
unintentional pollution
3.6 Monitor project
regulatory compliance9 8 7 6 5 4 3 2 1 2 3 4 5 6 7 8 9
3.7 Recycle water/ closed
water system
3.6 Monitor project
regulatory compliance9 8 7 6 5 4 3 2 1 2 3 4 5 6 7 8 9
3.8 Water security - no
unintentional pollution
3.7 Recycle water/ closed
water system9 8 7 6 5 4 3 2 1 2 3 4 5 6 7 8 9
3.8 Water security - no
unintentional pollution

250
Appendix E: Risks Specialized Survey Results
Table E1
Specialized Survey Results for Risks Level 1 Criteria
SAGD Project Regulatory Compliance
Survey
No.
Co
nsi
sten
cy
1 E
cono
mic
s an
d
Fin
anci
al
2 E
nv
iro
nm
enta
l
Ris
ks
3 P
oli
tica
l
4 R
epu
tati
on
/Po
st
Inci
den
t
5 R
egu
lato
ry
Co
mp
lian
ce
6 S
oci
al
Co
mp
lian
ce
7 T
ech
no
log
ical
%
A1 9.87 5.48 13.40 2.45 13.08 19.42 30.34 15.82
C2 9.62 21.18 13.69 6.45 15.99 12.24 3.94 26.52
C3 7.49 10.72 16.41 3.53 7.93 25.06 17.76 18.60
E1 8.03 8.95 5.46 3.57 15.71 51.28 6.59 8.45
H1 8.89 23.14 21.52 4.68 10.08 22.20 5.22 13.16
L1 8.76 15.19 4.93 3.05 40.66 13.17 5.78 17.22
L2 9.98 3.24 16.91 8.67 19.13 43.01 5.12 3.92
O1 6.73 11.91 14.33 3.78 27.41 13.33 4.68 24.56
O2 6.95 22.61 12.24 7.49 6.27 6.27 5.40 39.71
O3 9.23 18.31 20.26 4.11 25.43 12.83 7.15 11.91
P1 8.69 12.99 30.80 5.37 6.23 35.32 6.99 2.29
P2 9.73 9.33 36.24 2.14 17.73 24.53 4.07 5.96
P3 8.40 53.15 13.88 5.68 8.16 9.96 6.19 2.98

251
SAGD Project Regulatory Compliance
Survey
No.
Co
nsi
sten
cy
1 E
cono
mic
s an
d
Fin
anci
al
2 E
nv
iro
nm
enta
l
Ris
ks
3 P
oli
tica
l
4 R
epu
tati
on
/Po
st
Inci
den
t
5 R
egu
lato
ry
Co
mp
lian
ce
6 S
oci
al
Co
mp
lian
ce
7 T
ech
no
log
ical
%
P4 8.33 22.37 5.08 11.80 16.77 10.28 6.16 27.54
R1 8.91 8.59 14.03 6.05 11.95 21.72 8.95 28.72
S1 7.51 22.36 20.53 4.38 14.37 23.44 8.37 6.56
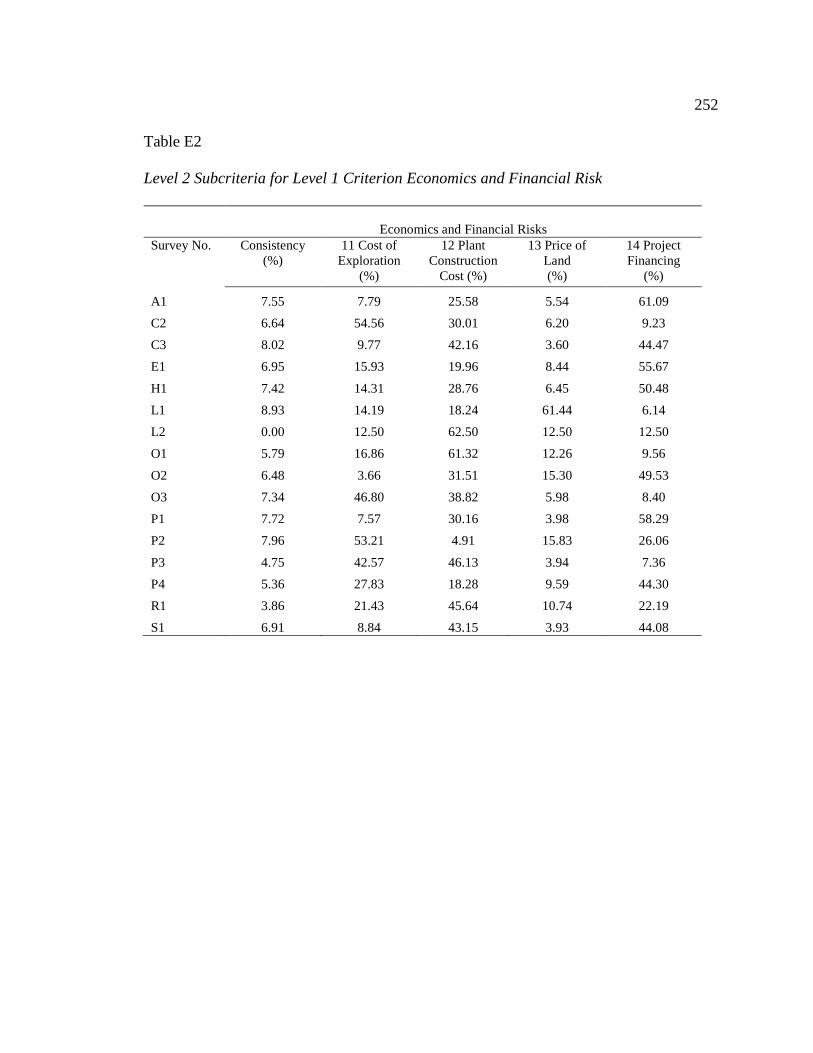
252
Table E2
Level 2 Subcriteria for Level 1 Criterion Economics and Financial Risk
Economics and Financial Risks
Survey No. Consistency
(%)
11 Cost of
Exploration
(%)
12 Plant
Construction
Cost (%)
13 Price of
Land
(%)
14 Project
Financing
(%)
A1 7.55 7.79 25.58 5.54 61.09
C2 6.64 54.56 30.01 6.20 9.23
C3 8.02 9.77 42.16 3.60 44.47
E1 6.95 15.93 19.96 8.44 55.67
H1 7.42 14.31 28.76 6.45 50.48
L1 8.93 14.19 18.24 61.44 6.14
L2 0.00 12.50 62.50 12.50 12.50
O1 5.79 16.86 61.32 12.26 9.56
O2 6.48 3.66 31.51 15.30 49.53
O3 7.34 46.80 38.82 5.98 8.40
P1 7.72 7.57 30.16 3.98 58.29
P2 7.96 53.21 4.91 15.83 26.06
P3 4.75 42.57 46.13 3.94 7.36
P4 5.36 27.83 18.28 9.59 44.30
R1 3.86 21.43 45.64 10.74 22.19
S1 6.91 8.84 43.15 3.93 44.08

253
Table E3
Level 2 Subcriteria for Level 1 Criterion Environmental Risk
Environmental Risks
Survey
No.
Consistency
(%) 21 Natural Environmental
Compliance
(%)
22 Human Environmental
Compliance
(%)
A1 0.0 17 83
C2 0.0 80 20
C3 0.0 20 80
E1 0.0 20 80
H1 0.0 50 50
L1 0.0 80 20
L2 0.0 50 50
O1 0.0 50 50
O2 0.0 80 20
O3 0.0 75 25
P1 0.0 15 86
P2 0.0 20 80
P3 0.0 86 14
P4 0.0 33 67
R1 0.0 50 50
S1 0.0 25 75
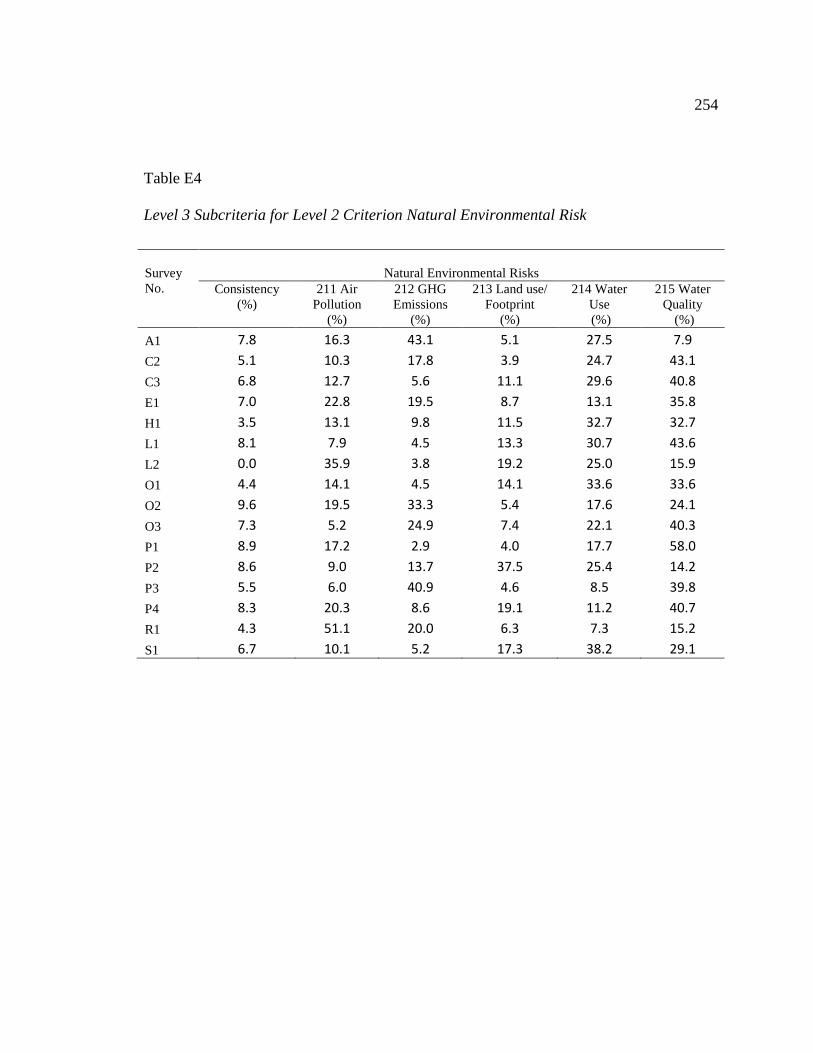
254
Table E4
Level 3 Subcriteria for Level 2 Criterion Natural Environmental Risk
Survey
No.
Natural Environmental Risks
Consistency
(%)
211 Air
Pollution
(%)
212 GHG
Emissions
(%)
213 Land use/
Footprint
(%)
214 Water
Use
(%)
215 Water
Quality
(%)
A1 7.8 16.3 43.1 5.1 27.5 7.9
C2 5.1 10.3 17.8 3.9 24.7 43.1
C3 6.8 12.7 5.6 11.1 29.6 40.8
E1 7.0 22.8 19.5 8.7 13.1 35.8
H1 3.5 13.1 9.8 11.5 32.7 32.7
L1 8.1 7.9 4.5 13.3 30.7 43.6
L2 0.0 35.9 3.8 19.2 25.0 15.9
O1 4.4 14.1 4.5 14.1 33.6 33.6
O2 9.6 19.5 33.3 5.4 17.6 24.1
O3 7.3 5.2 24.9 7.4 22.1 40.3
P1 8.9 17.2 2.9 4.0 17.7 58.0
P2 8.6 9.0 13.7 37.5 25.4 14.2
P3 5.5 6.0 40.9 4.6 8.5 39.8
P4 8.3 20.3 8.6 19.1 11.2 40.7
R1 4.3 51.1 20.0 6.3 7.3 15.2
S1 6.7 10.1 5.2 17.3 38.2 29.1

255
Table E5
Level 3 Subcriteria for Level 2 Criterion Human Environmental Risk
Survey
No.
Human Environmental Risks
Consistency
(%)
221 Community
Disturbance (%)
222 Socioeconomic
Changes (%)
A1 0.0 87.0 13.0
C2 0.0 80.0 20.0
C3 0.0 50.0 50.0
E1 0.0 33.0 67.0
H1 0.0 75.0 25.0
L1 0.0 80.0 20.0
L2 0.0 50.0 50.0
O1 0.0 50.0 50.0
O2 0.0 80.0 20.0
O3 0.0 25.0 76.0
P1 0.0 85.0 14.0
P2 0.0 33.0 67.0
P3 0.0 14.0 86.0
P4 0.0 25.0 75.0
R1 0.0 67.0 33.0
S1 0.0 67.0 33.0

256
Table E6
Level 2 Subcriteria for Level 1 Criterion Political Risk
Political Risk
Survey
No.
Consistency
(%)
31Agreements
with First
Nations
(%)
32 Presentations
to Provincial
MLAs
(%)
33 Involve
Local
Municipality
(%)
A1 0.89 58.76 8.90 32.34
C2 2.37 56.96 9.74 33.31
C3 0.00 50.00 25.00 25.00
E1 5.16 52.78 13.96 33.25
H1 5.16 52.79 13.96 33.25
L1 3.70 63.70 10.47 25.83
L2 5.16 41.26 25.99 32.75
O1 2.37 68.33 19.98 11.69
O2 0.36 64.83 22.97 12.20
O3 1.76 55.84 12.20 31.96
P1 5.16 57.36 6.50 36.14
P2 1.76 62.50 13.65 23.85
P3 3.11 65.86 7.86 26.28
P4 0.89 53.96 29.70 16.34
R1 5.16 59.36 15.71 24.93
S1 3.11 65.86 7.86 26.28

257
Table E7
Level 2 Subcriteria for Level 1 Criterion Regulatory Compliance Risk
Regulatory Compliance Risks
Survey
No.
Consistency
(%)
51 Comply
with the
Pipeline
Act
(%)
52 Comply
with the
Oil Sands
Act
(%)
53 Comply
with the
Safety Codes
Act
(%)
54 Implement
a Pressure
Equipment
Integrity
Program
(%)
55 Implement
a Pipeline
Integrity
Management
Program
(%)
A1 8.2 5.0 9.3 16.2 34.9 34.7
C2 8.3 20.5 10.7 6.6 58.3 3.9
C3 1.7 17.1 17.1 26.4 19.7 19.7
E1 8.8 5.7 5.7 50.8 30.0 7.8
H1 0.0 27.3 27.3 27.3 9.1 9.1
L1 5.1 5.1 10.9 10.4 51.8 21.8
L2 6.3 27.4 4.5 22.3 26.9 18.9
O1 2.0 27.0 29.2 24.9 10.9 7.9
O2 7.8 33.8 24.1 13.2 9.9 19.0
O3 4.4 9.4 13.9 41.7 17.5 17.5
P1 2.8 7.3 12.5 48.0 16.1 16.1
P2 5.5 18.2 14.6 35.2 22.7 9.4
P3 4.5 6.2 5.4 28.9 36.8 22.7
P4 2.4 11.5 14.5 39.0 22.7 12.3
R1 3.4 23.4 19.4 23.4 23.4 10.3
S1 9.7 28.6 15.2 21.1 20.4 14.7

258
Table E8
Level 2 Subcriteria for Level 1 Criterion Social Compliance Risk
Social Compliance Risk
Survey No. Consistency
(%)
61 Implement Social/
Community Programs
(%)
62 Employ Local
People
(%)
A1 0.0 16.7 83.3
C2 0.0 25.0 75.0
C3 0.0 50.0 50.0
E1 0.0 16.7 83.3
H1 0.0 16.7 83.3
L1 0.0 16.7 83.3
L2 0.0 50.0 50.0
O1 0.0 50.0 50.0
O2 0.0 33.3 66.7
O3 0.0 16.7 83.3
P1 0.0 14.3 85.7
P2 0.0 25.0 75.0
P3 0.0 14.3 85.7
P4 0.0 25.0 75.0
R1 0.0 25.0 75.0
S1 0.0 25.0 75.0
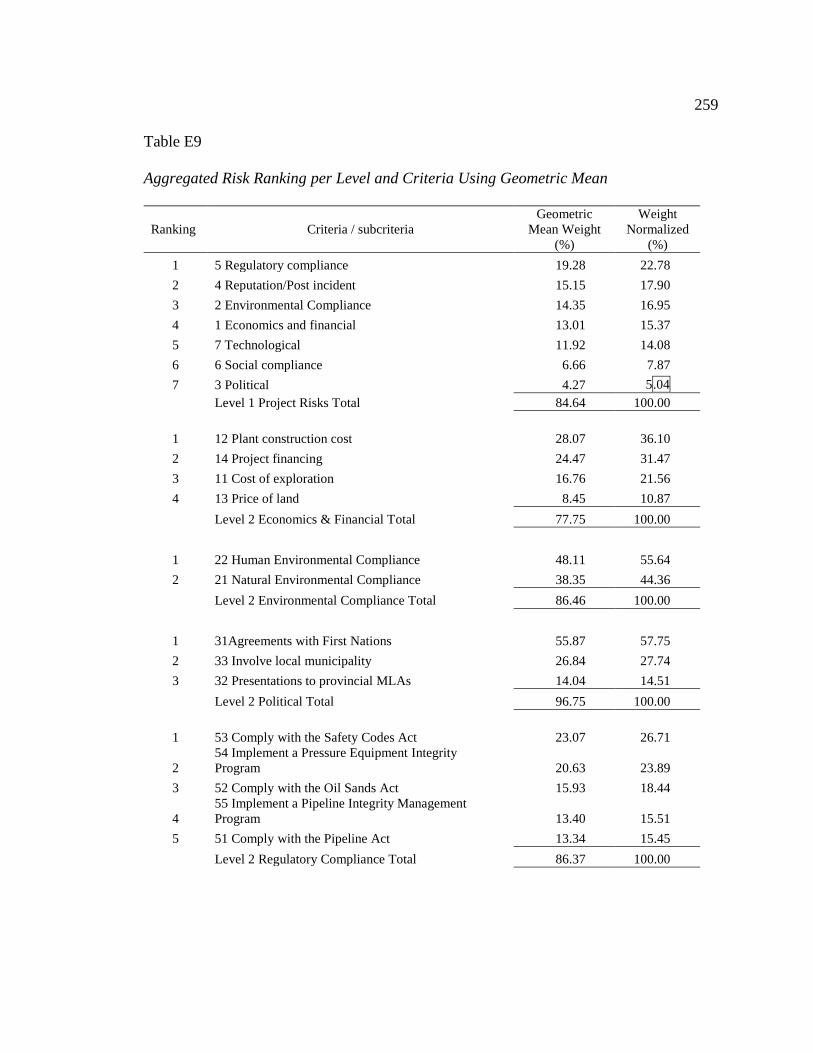
259
Table E9
Aggregated Risk Ranking per Level and Criteria Using Geometric Mean
Ranking Criteria / subcriteria
Geometric
Mean Weight
(%)
Weight
Normalized
(%)
1 5 Regulatory compliance 19.28 22.78
2 4 Reputation/Post incident 15.15 17.90
3 2 Environmental Compliance 14.35 16.95
4 1 Economics and financial 13.01 15.37
5 7 Technological 11.92 14.08
6 6 Social compliance 6.66 7.87
7 3 Political 4.27 5.04
Level 1 Project Risks Total 84.64 100.00
1 12 Plant construction cost 28.07 36.10
2 14 Project financing 24.47 31.47
3 11 Cost of exploration 16.76 21.56
4 13 Price of land 8.45 10.87
Level 2 Economics & Financial Total 77.75 100.00
1 22 Human Environmental Compliance 48.11 55.64
2 21 Natural Environmental Compliance 38.35 44.36
Level 2 Environmental Compliance Total 86.46 100.00
1 31Agreements with First Nations 55.87 57.75
2 33 Involve local municipality 26.84 27.74
3 32 Presentations to provincial MLAs 14.04 14.51
Level 2 Political Total 96.75 100.00
1 53 Comply with the Safety Codes Act 23.07 26.71
2
54 Implement a Pressure Equipment Integrity
Program 20.63 23.89
3 52 Comply with the Oil Sands Act 15.93 18.44
4
55 Implement a Pipeline Integrity Management
Program 13.40 15.51
5 51 Comply with the Pipeline Act 13.34 15.45
Level 2 Regulatory Compliance Total 86.37 100.00

260
Ranking Criteria / subcriteria
Geometric
Mean Weight
(%)
Weight
Normalized
(%)
1 62 Employ local people 71.71 74.43
2 61 Implement social/community programs 24.64 25.57
Level 2 Social Compliance Total 96.35 100.00
1 215 Water quality 27.85 32.37
2 214 Water use 23.51 27.32
3 211 Air pollution 15.02 17.46
4 212 GHG emissions 10.16 11.81
5 213 Land use/Footprint 9.50 11.04
Level 3 Natural Environmental Compliance Total 86.04 100.00
1 221 Community disturbance 59.05 65.34
2 222 Socioeconomic changes 31.33 34.66
Level 3 Human Environmental Compliance Total 90.38 100.00

261
Table E10
Overall Ranking of Risks, Highest to Lowest
Ranking Criteria / subcriteria
Geometric
Mean Weight
(%)
Weight
Normalized
(%)
1 5 Regulatory compliance 9.17 12.38
2 2 Environmental risks 7.78 10.50
3 1 Economics and financial 7.25 9.79
4 4 Reputation/Post incident 6.84 9.23
5 7 Technological 5.52 7.45
6 22 Human environmental compliance 3.45 4.66
7 21 Natural environmental compliance 3.23 4.36
8 6 Social compliance 3.11 4.20
9 3 Political 2.51 3.39
10 53 Comply to the Safety Codes Act 2.46 3.32
11 62 Employ local people 2.28 3.08
12 12 Plant construction cost 2.08 2.81
13 14 Project financing 1.86 2.51
14 54 Implement a Pressure Equipment Integrity Program 1.81 2.44
15 221 Community disturbance 1.59 2.15
16 31Agreements with First Nations 1.43 1.93
17 52 Comply to the Oil Sands Act 1.38 1.86
18 222 Socioeconomic changes 1.38 1.86
19 51 Comply to the Pipeline Act 1.35 1.82
20 11 Cost of Exploration 1.32 1.78
21 55 Implement a Pipeline Integrity Management Program 1.16 1.57
22 215 Water quality 1.00 1.35
23 61 Implement social/community programs 0.74 1.00
24 33 Involve local municipality 0.63 0.85
25 214 Water use 0.63 0.85
26 13 Price of land 0.58 0.78
27 211 Air pollution 0.49 0.66
28 212 GHG emissions 0.38 0.51
29 32 Presentations to provincial MLA's 0.36 0.49
30 213 Land use/Footprint 0.32 0.43
Total 74.09 100.00
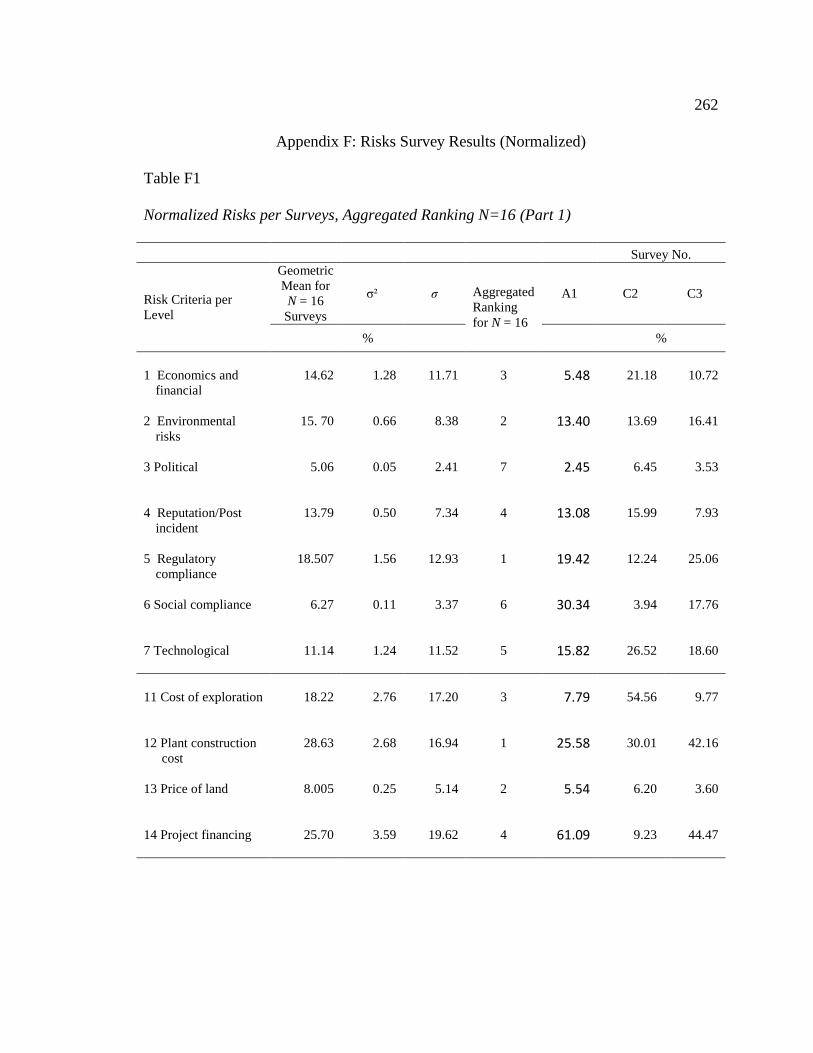
262
Appendix F: Risks Survey Results (Normalized)
Table F1
Normalized Risks per Surveys, Aggregated Ranking N=16 (Part 1)
Survey No.
Risk Criteria per
Level
Geometric
Mean for
N = 16
Surveys
σ² σ Aggregated
Ranking
for N = 16
A1 C2 C3
% %
1 Economics and
financial
14.62 1.28 11.71 3 5.48 21.18 10.72
2 Environmental
risks
15. 70 0.66 8.38 2 13.40 13.69 16.41
3 Political 5.06 0.05 2.41 7 2.45 6.45 3.53
4 Reputation/Post
incident
13.79 0.50 7.34 4 13.08 15.99 7.93
5 Regulatory
compliance
18.507 1.56 12.93 1 19.42 12.24 25.06
6 Social compliance 6.27 0.11 3.37 6 30.34 3.94 17.76
7 Technological 11.14 1.24 11.52 5 15.82 26.52 18.60
11 Cost of exploration 18.22 2.76 17.20 3 7.79 54.56 9.77
12 Plant construction
cost
28.63 2.68 16.94 1 25.58 30.01 42.16
13 Price of land 8.005 0.25 5.14 2 5.54 6.20 3.60
14 Project financing 25.70 3.59 19.62 4 61.09 9.23 44.47

263
Survey No.
Risk Criteria per
Level
Geometric
Mean for
N = 16
Surveys
σ² σ Aggregated
Ranking
for N = 16
A1 C2 C3
% %
21 Natural
environmental
compliance
41.46 6.12 25.60 2 16.67 80.00 20.00
22 Human
environmental
compliance
44.26 6.12 25.60 1 83.33 20.00 80.00
31 Agreements with
First Nations 57.09 0.47 7.06 1 52.78 56.96 50.00
32 Presentations to
provincial MLA's 14.34 0.50 7.29 3 13.96 9.74 25.00
33 Involve local
municipality 25.24 0.57 7.80 2 33.26 33.31 25.00
51 Comply to the
Pipeline Act 14.71 0.83 9.41 3 4.95 20.51 16.45
52 Comply to the Oil
Sands Act 15.06 0.46 7.03 4 9.29 10.68 22.08
53 Comply to the
Safety Codes Act 26.81 1.41 12.305 1 16.17 6.59 32.91
54 Implement a
Pressure
Equipment
Integrity Program
19.69 1.44 12.43 2 34.90 58.30 14.28
55 Implement a
Pipeline Integrity
Management
Program
12.60 0.32 5.88 5 34.68 3.92 14.28
61 Implement
social/community
programs
23.92 1.17 11.17 2 16.67 25.00 50.00
62 Employ local
people 73.29 1.17 11.17 1 83.33 75.00 50.00
211 Air pollution 15.05 1.29 11.77 3 16.31 10.31 12.75

264
Survey No.
Risk Criteria per
Level
Geometric
Mean for
N = 16
Surveys
σ² σ Aggregated
Ranking
for N = 16
A1 C2 C3
% %
212 GHG emissions 11.66 1.20 11.34 4 43.15 17.88 5.69
213 Land
use/Footprint 9.79 0.76 9.03 5 5.09 3.97 11.11
214 Water use 18.61 0.95 10.08 2 27.49 24.71 29.62
215 Water quality 31.11 1.28 11.71 1 7.96 43.13 40.83
221 Community
disturbance 46.24 5.97 25.28 1 87.50 80.00 50.00
222 Socioeconomic
changes 39.97 5.97 25.28 2 12.50 20.00 50.00
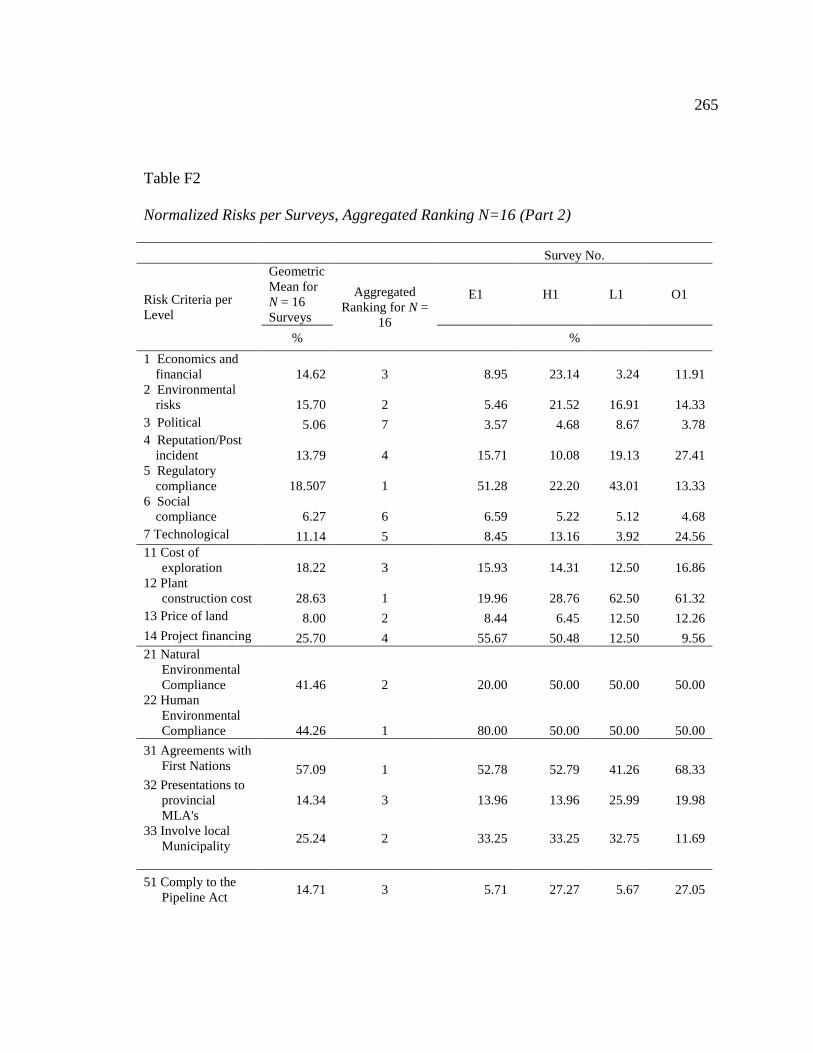
265
Table F2
Normalized Risks per Surveys, Aggregated Ranking N=16 (Part 2)
Survey No.
Risk Criteria per
Level
Geometric
Mean for
N = 16
Surveys
Aggregated
Ranking for N =
16
E1 H1 L1 O1
% %
1 Economics and
financial 14.62 3 8.95 23.14 3.24 11.91
2 Environmental
risks 15.70 2 5.46 21.52 16.91 14.33
3 Political 5.06 7 3.57 4.68 8.67 3.78
4 Reputation/Post
incident 13.79 4 15.71 10.08 19.13 27.41
5 Regulatory
compliance 18.507 1 51.28 22.20 43.01 13.33
6 Social
compliance 6.27 6 6.59 5.22 5.12 4.68
7 Technological 11.14 5 8.45 13.16 3.92 24.56
11 Cost of
exploration 18.22 3 15.93 14.31 12.50 16.86
12 Plant
construction cost 28.63 1 19.96 28.76 62.50 61.32
13 Price of land 8.00 2 8.44 6.45 12.50 12.26
14 Project financing 25.70 4 55.67 50.48 12.50 9.56
21 Natural
Environmental
Compliance 41.46 2 20.00 50.00 50.00 50.00
22 Human
Environmental
Compliance 44.26 1 80.00 50.00 50.00 50.00
31 Agreements with
First Nations 57.09 1 52.78 52.79 41.26 68.33
32 Presentations to
provincial
MLA's
14.34 3 13.96 13.96 25.99 19.98
33 Involve local
Municipality 25.24 2 33.25 33.25 32.75 11.69
51 Comply to the
Pipeline Act 14.71 3 5.71 27.27 5.67 27.05

266
Survey No.
Risk Criteria per
Level
Geometric
Mean for
N = 16
Surveys
Aggregated
Ranking for N =
16
E1 H1 L1 O1
% %
52 Comply to the
Oil sands act 15.06 4 5.71 27.27 15.53 29.19
53 Comply to the
Safety Codes
Act
26.81 1 50.81 27.27 34.43 24.90
54 Implement a
Pressure
Equipment
Integrity
Program
19.69 2 29.97 9.09 20.74 10.91
55 Implement a
Pipeline Integrity
Management
Program
12.60 5 7.82 9.09 23.63 7.94
61 Implement
social/
community
programs
23.92 2 16.67 16.67 25.00 50.00
62 Employ local
people 73.29 1 83.33 83.33 75.00 50.00
211 Air pollution 15.05 3 22.84 13.15 27.41 14.12
212 GHG emissions 11.66 4 19.54 9.80 4.46 4.55
213 Land use/
Footprint 9.79 5 8.75 11.54 22.32 14.12
214 Water use 18.61 2 13.06 32.75 26.89 33.61
215 Water quality 31.114 1 35.80 32.75 18.92 33.61
221 Community
disturbance 46.24 1 33.34 75.00 83.33 50.00
222 Socioeconomic
changes 39.97 2 66.67 25.00 16.67 50.00

267
Table F3
Normalized Risks per Surveys, Aggregated Ranking N=16 (Part 3)
Survey No.
Risk Criteria per Level
Geometric
Mean for
N = 16
Surveys
Aggregated
Ranking for
N = 16
O2 O3 O4 P1
% %
1 Economics & Financial 14.618 3 14.33 22.61 18.31 22.37
2 Environmental Risks 15.697 2 24.10 12.24 20.26 5.08
3 Political 5.056 7 4.59 7.49 4.11 11.80
4 Reputation/Post Incident 13.788 4 28.43 6.27 25.43 16.77
5 Regulatory Compliance 18.497 1 13.98 6.27 12.83 10.28
6 Social Compliance 6.272 6 5.05 5.40 7.15 6.16
7 Technological 11.137 5 9.53 39.71 11.91 27.54
11 Cost of exploration 18.219 3 20.38 3.66 46.80 27.83
12 Plant construction cost 28.632 1 8.52 31.51 38.82 18.28
13 Price of land 7.995 2 20.38 15.30 5.98 9.59
14 Project Financing 25.701 4 50.72 49.53 8.40 44.31
21 Natural Environmental
Compliance 41.457 2 75.00 80.00 75.00 33.33
22 Human Environmental
Compliance 44.259 1 25.00 20.00 25.00 66.67
31 Agreements with First
Nations 57.087 1 58.16 64.83 55.84 53.96
32 Presentations to
provincial MLA's 14.338 3 10.95 22.97 12.20 29.70
33 Involve local
Municipality 25.242 2 30.90 12.20 31.96 16.34
51 Comply to the Pipeline
Act 14.706 3 20.00 33.82 9.40 11.53
52 Comply to the Oil
sands act 15.061 4 20.00 24.10 13.89 14.49
53 Comply to the Safety
Codes Act 26.811 1 20.00 13.16 41.68 39.03
54 Implement a Pressure
Equipment Integrity
Program
19.694 2 20.00 9.92 17.51 22.68

268
Survey No.
Risk Criteria per Level
Geometric
Mean for
N = 16
Surveys
Aggregated
Ranking for
N = 16
O2 O3 O4 P1
% %
55 Implement a Pipeline
Integrity Management
Program
12.597 5 20.00 19.00 17.51 12.27
61 Implement
social/community
programs
23.922% 2 25.00 33.33 16.67 25.00
62 Employ local people 73.292% 1 75.00 66.67 83.33 75.00
211 Air Pollution 15.053% 3 30.10 19.50 5.18 20.35
212 GHG Emissions 11.655% 4 19.92 33.31 24.91 8.68
213 Land use/Footprint 9.792% 5 8.85 5.38 7.44 19.07
214 Water use 18.613% 2 8.32 17.66 22.16 11.20
215 Water quality 31.114% 1 32.81 24.15 40.31 40.70
221 Community
Disturbance 46.240% 1 25.00 80.00 25.00 25.00
222 Socioeconomic
changes 39.973% 2 75.00 20.00 75.00 75.00
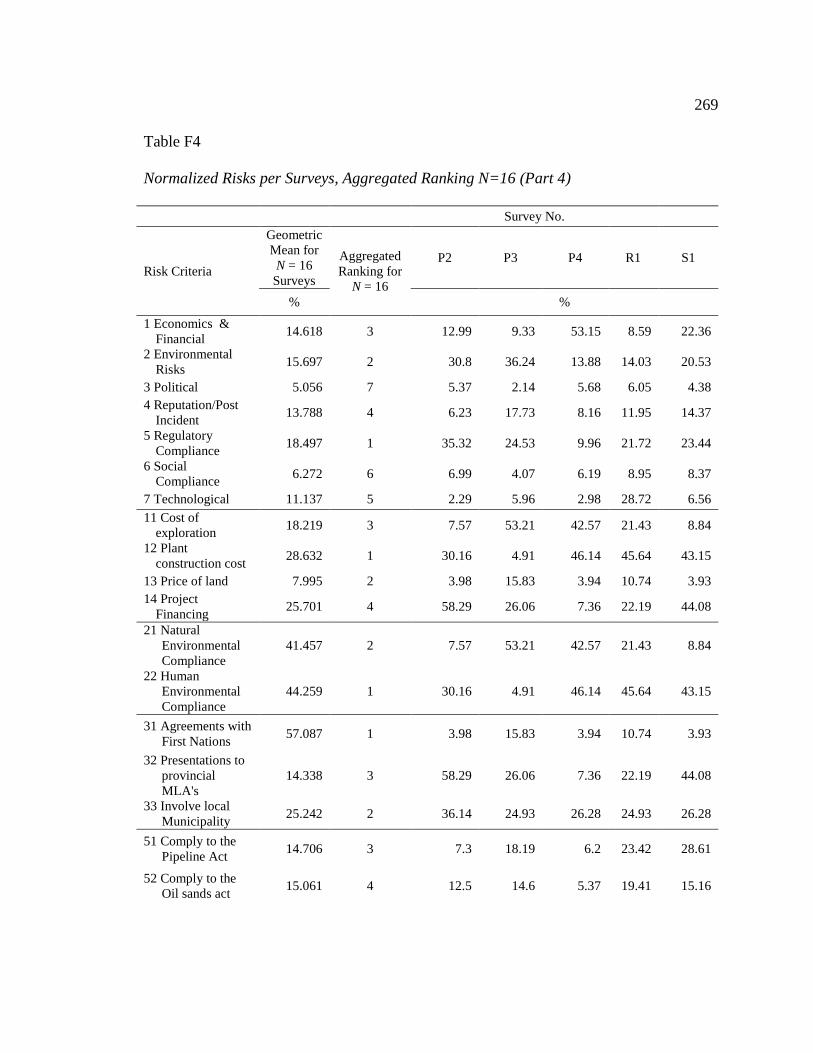
269
Table F4
Normalized Risks per Surveys, Aggregated Ranking N=16 (Part 4)
Survey No.
Risk Criteria
Geometric
Mean for
N = 16
Surveys
Aggregated
Ranking for
N = 16
P2 P3 P4 R1 S1
% %
1 Economics &
Financial 14.618 3 12.99 9.33 53.15 8.59 22.36
2 Environmental
Risks 15.697 2 30.8 36.24 13.88 14.03 20.53
3 Political 5.056 7 5.37 2.14 5.68 6.05 4.38
4 Reputation/Post
Incident 13.788 4 6.23 17.73 8.16 11.95 14.37
5 Regulatory
Compliance 18.497 1 35.32 24.53 9.96 21.72 23.44
6 Social
Compliance 6.272 6 6.99 4.07 6.19 8.95 8.37
7 Technological 11.137 5 2.29 5.96 2.98 28.72 6.56
11 Cost of
exploration 18.219 3 7.57 53.21 42.57 21.43 8.84
12 Plant
construction cost 28.632 1 30.16 4.91 46.14 45.64 43.15
13 Price of land 7.995 2 3.98 15.83 3.94 10.74 3.93
14 Project
Financing 25.701 4 58.29 26.06 7.36 22.19 44.08
21 Natural
Environmental
Compliance
41.457 2 7.57 53.21 42.57 21.43 8.84
22 Human
Environmental
Compliance
44.259 1 30.16 4.91 46.14 45.64 43.15
31 Agreements with
First Nations 57.087 1 3.98 15.83 3.94 10.74 3.93
32 Presentations to
provincial
MLA's
14.338 3 58.29 26.06 7.36 22.19 44.08
33 Involve local
Municipality 25.242 2 36.14 24.93 26.28 24.93 26.28
51 Comply to the
Pipeline Act 14.706 3 7.3 18.19 6.2 23.42 28.61
52 Comply to the
Oil sands act 15.061 4 12.5 14.6 5.37 19.41 15.16

270
Survey No.
Risk Criteria
Geometric
Mean for
N = 16
Surveys
Aggregated
Ranking for
N = 16
P2 P3 P4 R1 S1
% %
53 Comply to the
Safety Codes
Act
26.811 1 47.96 35.16 28.93 23.42 21.11
54 Implement a
Pressure
Equipment
Integrity
Program
19.694 2 16.12 22.65 36.84 23.42 20.39
55 Implement a
Pipeline
Integrity
Management
Program
12.597 5 16.12 9.41 22.67 10.32 14.74
61 Implement
social/communit
y programs
23.922% 2 14.29 25 14.29 25 25
62 Employ local
people 73.292% 1 85.72 75 85.71 75 75
211 Air Pollution 15.053% 3 17.19 9.1 6.04 51.12 10.1
212 GHG
Emissions 11.655% 4 2.99 13.72 40.99 20.05 5.21
213 Land
use/Footprint 9.792% 5 4.05 37.52 4.64 6.29 17.3
214 Water use 18.613% 2 17.75 25.47 8.51 7.35 38.25
215 Water quality 31.114% 1 58.02 14.19 39.83 15.19 29.14
221 Community
Disturbance 46.240% 1 85.71 33.33 14.28 66.67 66.67
222 Socioeconomic
changes 39.973% 2 14.29 66.67 85.72 33.33 33.33

271
Appendix G: Mitigation Strategies Survey Results
Table G1
Specialized Survey Results, Consistency Check for N = 16
Level 2 - Risk Reduction Mitigation Strategies, Normalized Weights
Survey No. A1 C2 C3 E1 H1
Consistency (%) 8.19 8.86 8.80 8.25 5.60
3 Risk Reduction Strategy Normalized Weight (%)
3.1 Carbon capture and storage 21.09 2.34 7.33 2.35 2.18
3.2 Create an EMP 34.22 21.75 3.52 21.83 13.95
3.3 Data collection 6.18 4.09 5.74 4.23 20.24
3.4 Develop a risk hierarchy 3.68 5.71 3.60 5.28 5.76
3.5 Implement risk management
strategy 15.93 6.81 9.88 6.82 11.54
3.6 Monitor project regulatory
compliance 6.07 31.83 13.40 31.92 17.27
3.7 Recycle water/closed water
system 10.60 16.73 24.29 16.80 22.15
3.8 Water security 2.23 10.75 32.25 10.76 6.91
Survey No. A1 C1 C2 E1 H1
3 Risk Reduction Strategy Idealized Weight (%)
3.1 Carbon capture and storage 61.63 7.34 22.74 7.37 9.82
3.2 Create an EMP 100.00 68.34 10.91 68.38 62.98
3.3 Data collection 18.06 12.85 17.79 13.26 91.35
3.4 Develop a risk hierarchy 10.77 17.94 11.15 16.55 26.00
3.5 Implement risk management
strategy 46.54 21.39 30.63 21.37 52.08
3.6 Monitor project regulatory
compliance 17.74 100.00 41.56 100.00 77.96
3.7 Recycle water/closed water
system 30.99 52.56 75.34 52.64 100.00
3.8 Water security 6.51 33.76 100.00 33.72 31.21

272
Table G2
Specialized Survey Results, Consistency Check for N = 16 (Continued)
Level 2 - Risk Reduction Mitigation Strategies, Normalized Weights
Survey No. L1 O1 O2 O3 O4
Consistency (%) 8.08 5.51 8.58 7.64 8.85
3 Risk Reduction Strategy Normalized Weight (%)
3.1 Carbon capture and storage 5.09 2.03 3.32 5.53 1.60
3.2 Create an EMP 3.45 16.75 12.44 6.14 7.18
3.3 Data collection 34.07 11.39 14.88 11.37 3.33
3.4 Develop a risk hierarchy 2.90 8.11 13.50 2.89 2.12
3.5 Implement risk management
strategy 6.29 12.16 8.13 11.07 7.48
3.6 Monitor project regulatory
compliance 23.35 11.78 12.59 10.27 38.46
3.7 Recycle water/closed water
system 16.02 19.56 20.88 21.09 13.76
3.8 Water security 8.84 18.22 14.26 31.64 26.06
Survey No. L1 O1 O2 O3 O4
3 Risk Reduction Strategy Idealized Weight (%)
3.1 Carbon capture and storage 14.93 10.39 15.89 17.47 4.17
3.2 Create an EMP 10.13 85.67 59.58 19.40 18.67
3.3 Data collection 100.00 58.25 71.30 35.95 8.65
3.4 Develop a risk hierarchy 8.51 41.45 64.68 9.15 5.50
3.5 Implement risk management
strategy 18.47 62.16 38.92 34.98 19.46
3.6 Monitor project regulatory
compliance 68.54 60.25 60.32 32.45 100.00
3.7 Recycle water/closed water
system 47.02 100.00 100.00 66.66 35.78
3.8 Water security 25.96 93.18 68.33 100.00 67.77

273
Table G3
Specialized Survey Results, Consistency Check for N = 16 (Continued)
Level 2 - Risk Reduction Mitigation Strategies, Normalized Weights
Survey No. P1 P2 P3 P4 R1 S1
Consistency (%) 9.29 8.98 9.61 8.84 7.58 7.60
3 Risk Reduction Strategy Normalized Weights (%)
3.1 Carbon capture and storage 6.67 1.70 4.76 2.07 3.42 3.13
3.2 Create an EMP 6.52 6.45 10.12 3.15 14.85 10.44
3.3 Data collection 11.12 2.95 14.36 4.09 16.42 9.41
3.4 Develop a risk hierarchy 6.68 2.22 3.17 6.97 10.06 7.19
3.5 Implement risk management
strategy 7.62 6.24 8.18 10.17 6.33 8.50
3.6 Monitor project regulatory
compliance 10.37 34.10 3.03 3.35 31.74 20.09
3.7 Recycle water/closed water
system 24.55 18.07 28.03 22.07 10.09 17.70
3.8 Water security 26.47 28.27 28.36 48.13 7.08 23.54
3 Risk Reduction Strategy Idealized Weights (%)
3.1 Carbon capture and storage 25.20 4.97 16.80 4.31 10.79 13.29
3.2 Create an EMP 24.65 18.91 35.68 6.55 46.78 44.36
3.3 Data collection 42.01 8.65 50.65 8.49 51.72 40.00
3.4 Develop a risk hierarchy 25.24 6.51 11.17 14.48 31.70 30.56
3.5 Implement risk management
strategy 28.78 18.31 28.84 21.14 19.94 36.12
3.6 Monitor project regulatory
compliance 39.17 100.00 10.69 6.95 100.00 85.38
3.7 Recycle water/closed water
system 92.78 52.99 98.84 45.86 31.79 75.18
3.8 Water security 100.00 82.90 100.00 100.00 22.30 100.00
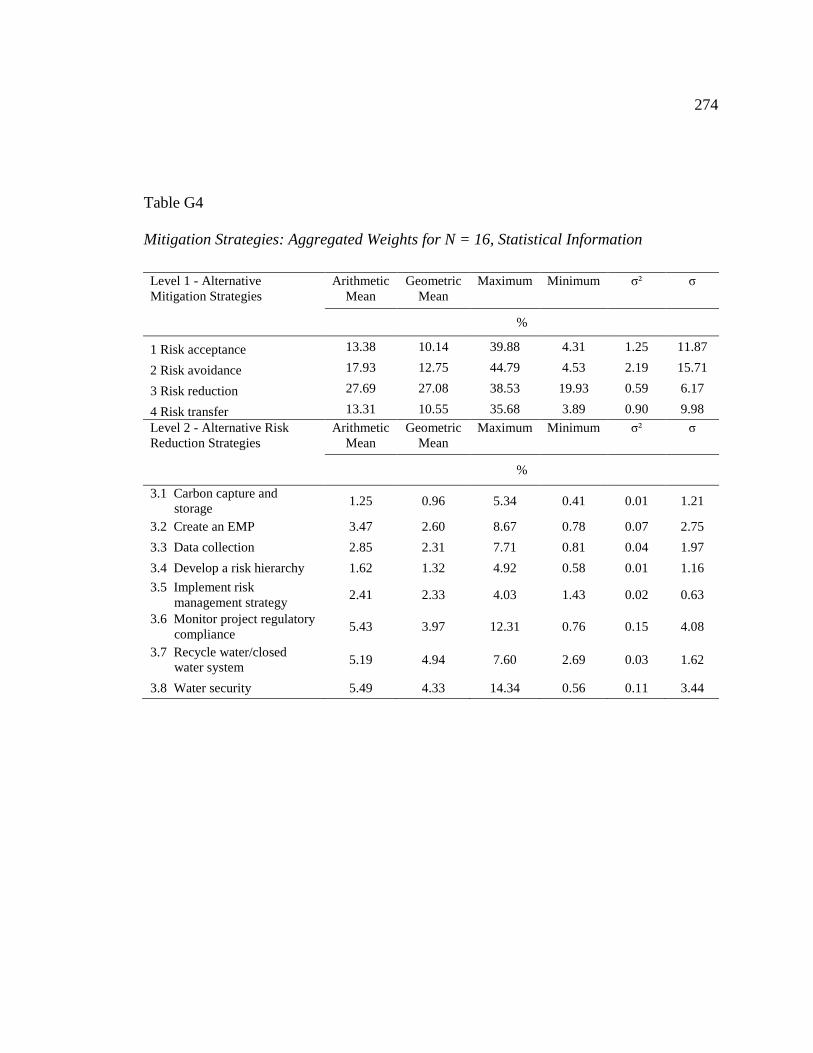
274
Table G4
Mitigation Strategies: Aggregated Weights for N = 16, Statistical Information
Level 1 - Alternative
Mitigation Strategies
Arithmetic
Mean
Geometric
Mean
Maximum Minimum σ² σ
%
1 Risk acceptance 13.38 10.14 39.88 4.31 1.25 11.87
2 Risk avoidance 17.93 12.75 44.79 4.53 2.19 15.71
3 Risk reduction 27.69 27.08 38.53 19.93 0.59 6.17
4 Risk transfer 13.31 10.55 35.68 3.89 0.90 9.98
Level 2 - Alternative Risk
Reduction Strategies
Arithmetic
Mean
Geometric
Mean
Maximum Minimum σ² σ
%
3.1 Carbon capture and
storage 1.25 0.96 5.34 0.41 0.01 1.21
3.2 Create an EMP 3.47 2.60 8.67 0.78 0.07 2.75
3.3 Data collection 2.85 2.31 7.71 0.81 0.04 1.97
3.4 Develop a risk hierarchy 1.62 1.32 4.92 0.58 0.01 1.16
3.5 Implement risk
management strategy 2.41 2.33 4.03 1.43 0.02 0.63
3.6 Monitor project regulatory
compliance 5.43 3.97 12.31 0.76 0.15 4.08
3.7 Recycle water/closed
water system 5.19 4.94 7.60 2.69 0.03 1.62
3.8 Water security 5.49 4.33 14.34 0.56 0.11 3.44

275
Table G5
Level 1 Alternative Mitigation Strategies, Results from AHP Analysis per Survey,
Normalized, N = 16
Survey no.
Level 1 - Alternative Mitigation Strategies
Consistency 1 Risk
Acceptance
2 Risk
Avoidance
3 Risk
Reduction 4 Risk Transfer
(%)
A1 6.27 8.07 10.25 33.91 47.78
C1 3.86 15.24 7.37 62.68 14.71
C2 0.39 11.42 12.25 39.59 36.74
E1 3.86 15.24 7.37 62.68 14.71
H1 4.07 5.53 55.24 28.31 10.91
L1 7.19 51.55 14.16 29.26 5.03
O1 1.63 9.55 55.96 24.96 9.55
O2 4.95 9.77 25.60 57.29 7.33
O3 9.57 8.81 56.21 27.16 7.83
O4 0.00 12.50 12.50 37.50 37.50
P1 5.79 12.50 12.50 37.50 37.50
P2 0.01 52.71 6.24 33.38 7.67
P3 2.22 37.36 10.22 42.44 9.98
P4 0.93 30.31 12.97 38.90 17.83
R1 3.31 7.63 32.57 48.32 11.49
S1 5.92 6.59 50.86 24.90 17.66
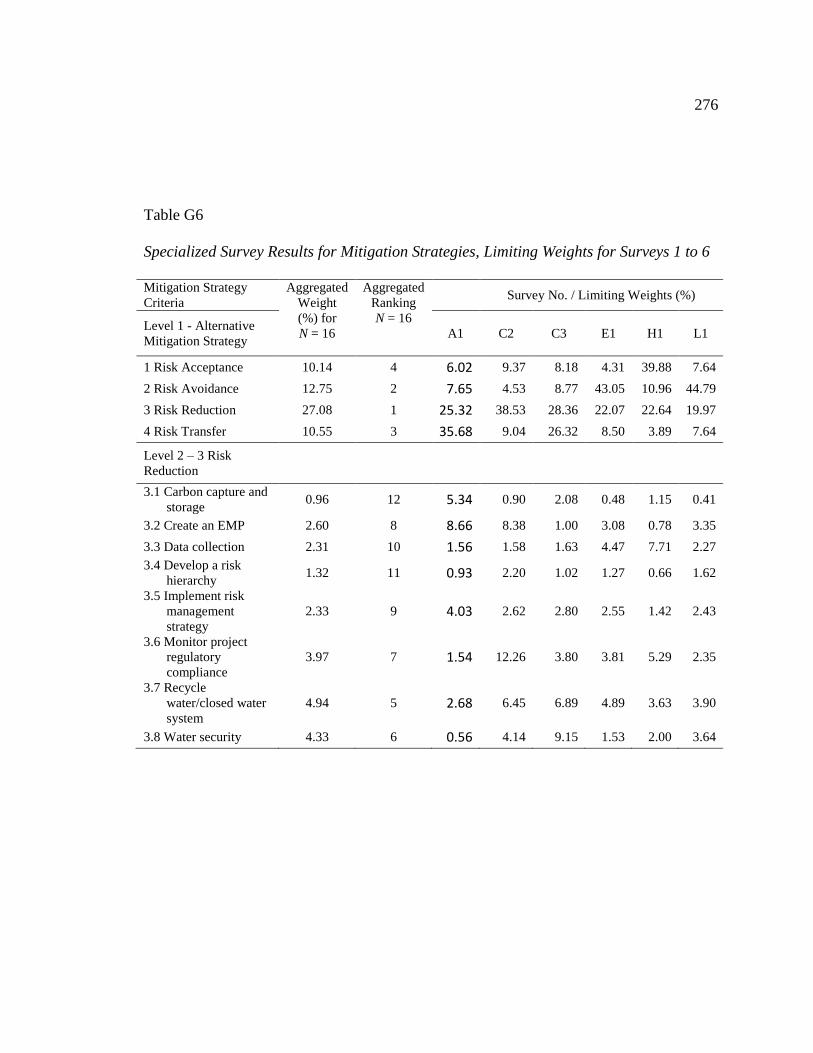
276
Table G6
Specialized Survey Results for Mitigation Strategies, Limiting Weights for Surveys 1 to 6
Mitigation Strategy
Criteria
Aggregated
Weight
(%) for
N = 16
Aggregated
Ranking
N = 16
Survey No. / Limiting Weights (%)
Level 1 - Alternative
Mitigation Strategy A1 C2 C3 E1 H1 L1
1 Risk Acceptance 10.14 4 6.02 9.37 8.18 4.31 39.88 7.64
2 Risk Avoidance 12.75 2 7.65 4.53 8.77 43.05 10.96 44.79
3 Risk Reduction 27.08 1 25.32 38.53 28.36 22.07 22.64 19.97
4 Risk Transfer 10.55 3 35.68 9.04 26.32 8.50 3.89 7.64
Level 2 – 3 Risk
Reduction
3.1 Carbon capture and
storage 0.96 12 5.34 0.90 2.08 0.48 1.15 0.41
3.2 Create an EMP 2.60 8 8.66 8.38 1.00 3.08 0.78 3.35
3.3 Data collection 2.31 10 1.56 1.58 1.63 4.47 7.71 2.27
3.4 Develop a risk
hierarchy 1.32 11 0.93 2.20 1.02 1.27 0.66 1.62
3.5 Implement risk
management
strategy
2.33 9 4.03 2.62 2.80 2.55 1.42 2.43
3.6 Monitor project
regulatory
compliance
3.97 7 1.54 12.26 3.80 3.81 5.29 2.35
3.7 Recycle
water/closed water
system
4.94 5 2.68 6.45 6.89 4.89 3.63 3.90
3.8 Water security 4.33 6 0.56 4.14 9.15 1.53 2.00 3.64

277
Table G7
Specialized Survey Results for Mitigation Strategies, Limiting Weights for Surveys 7 to 11
Mitigation Strategy
Criteria
Aggregated
Weight (%)
for
N = 16
Aggregated
Ranking
N = 16
Survey no. / Limiting Weights (%)
Level 1 - Alternative
Mitigation Strategy O1 O2 O3 O4 P1
1 Risk Acceptance 10.14 4 6.21 6.93 9.09 9.09 39.52
2 Risk Avoidance 12.75 2 16.28 44.20 9.09 9.09 4.68
3 Risk Reduction 27.08 1 36.42 21.36 27.27 27.27 25.03
4 Risk Transfer 10.55 3 4.66 6.16 27.27 27.27 5.75
Level 2 – 3 Risk
Reduction
3.1 Carbon capture
and storage 0.96 12 1.21 1.18 0.44 0.46 1.19
3.2 Create an EMP 2.60 8 4.53 1.31 1.96 1.76 2.53
3.3 Data collection 2.31 10 5.42 2.43 0.91 0.80 3.59
3.4 Develop a risk
hierarchy 1.32 11 4.92 0.62 0.58 0.61 0.79
3.5 Implement risk
management
strategy
2.33 9 2.96 2.36 2.04 1.70 2.05
3.6 Monitor project
regulatory
compliance
3.97 7 4.59 2.19 10.49 9.30 0.76
3.7 Recycle
water/closed
water system
4.94 5 7.60 4.50 3.75 4.93 7.01
3.8 Water security 4.33 6 5.20 6.76 7.11 7.71 7.10

278
Table G8
Specialized Survey Results for Mitigation Strategies, Limiting Weights for Surveys 12 to
16
Mitigation Strategy
Criteria
Aggregated
Weight (%)
for
N = 16
Aggregated
Ranking
N = 16
Survey no. / Limiting Weights (%)
Level 1 - Alternative
Mitigation Strategy P2 P3 P4 R1 S1
1 Risk Acceptance 10.14 4 26.23 21.82 5.14 5.28 9.37
2 Risk Avoidance 12.75 2 7.18 9.33 21.96 40.72 4.53
3 Risk Reduction 27.08 1 29.80 28.00 32.58 19.93 38.53
4 Risk Transfer 10.55 3 7.00 12.84 7.74 14.14 9.04
Level 2 – 3 Risk
Reduction
3.1 Carbon capture and
storage 0.96 12 0.62 1.87 1.12 0.62 0.91
3.2 Create an EMP 2.60 8 0.94 1.83 4.84 2.08 8.41
3.3 Data collection 2.31 10 1.22 3.11 5.35 1.88 1.63
3.4 Develop a risk
hierarchy 1.32 11 2.08 1.87 3.28 1.43 2.04
3.5 Implement risk
management strategy 2.33 9 3.03 2.13 2.06 1.69 2.63
3.6 Monitor project
regulatory
compliance
3.97 7 1.00 2.90 10.34 4.01 12.30
3.7 Recycle water/closed
water system 4.94 5 6.58 6.88 3.29 3.53 6.47
3.8 Water security 4.33 6 14.34 7.41 2.31 4.69 4.15

279
Table G9
Specialized Survey Results for Level 2 criterion Risk Reduction Strategies – Normalized,
N = 16
Survey
no.
3.1
Carbon
capture
and
storage
3.2
Create
an
EMP
3.3
Data
collection
3.4
Develop
a risk
hierarchy
3.5
Implement
risk
management
strategy
3.6
Monitor
project
regulatory
compliance
3.7
Recycle
water/
closed
water
system
3.8
Water
security
%
A1 21.09 34.22 6.18 3.68 15.93 6.07 10.60 2.23
C2 2.34 21.75 4.09 5.71 6.81 31.83 16.73 10.75
C3 7.33 3.52 5.74 3.60 9.88 13.40 24.29 32.25
E1 2.35 21.83 4.23 5.28 6.82 31.92 16.80 10.76
H1 2.18 13.95 20.24 5.76 11.54 17.27 22.15 6.91
L1 5.09 3.45 34.07 3.00 6.29 23.35 16.02 8.84
O1 2.03 16.75 11.39 8.11 12.16 11.78 19.56 18.22
O2 3.32 12.44 14.88 13.50 8.13 12.59 20.88 14.26
O3 5.53 6.14 11.37 2.89 11.07 10.27 21.09 31.64
O4 1.60 7.18 3.33 2.12 7.48 38.46 13.76 26.06
P1 1.705 6.45 2.95 2.22 6.24 34.10 18.07 28.27
P2 4.77 10.12 14.36 3.17 8.18 3.03 28.03 28.36
P3 2.07 3.15 4.09 6.97 10.17 3.35 22.07 48.13
P4 6.67 6.52 11.12 6.68 7.62 10.37 24.55 26.47
R1 3.42 14.85 16.42 10.06 6.33 31.74 10.09 7.079
S1 3.13 10.44 9.41 7.19 8.50 20.10 17.70 23.54

280
Appendix H: Permission for Reprint

281
Curriculum Vitae
Roux Izak Johannes
EDUCATION
Doctorate in Business Administration (in progress) - Walden University
Dissertation: “Applying the Analytic Hierarchy Process to Oil Sands Environmental
Compliance Risk Management”
M. Engineering (Mechanical) - University of Pretoria, South Africa
Thesis: System Engineering applied to early Prototyping and Testing.
B. Engineering (Mechanical) Honours - University of Pretoria, South Africa
B. Engineering (Mechanical) - University of Pretoria, South Africa
Advanced Executive Programme, University of South Africa (equivalent to Executive
MBA)
Dissertation: Product Development.
Production Management Diploma - Damelin College, Johannesburg, South Africa
PROFESSIONAL AFFILIATIONS
Registered Professional Engineer, Alberta, Saskatchewan, Manitoba and NWT
Member, American Society of Mechanical Engineers
Committee Member, ASME code PCC3 (RBI) and subgroup Welding repairs for PCC2
(Repair and Testing)

282
Sub-Committee Member, APEIA 2014 & 2015 conference
Boiler and Pressure Vessel Technical Council Member, Safety Codes Council, Vice
Chair, July 2010 – present
Committee Member, Canadian Standards Association B51 Boiler, Pressure Vessel and
Pressure Piping Standard, 2010 – present
Senior Member, Aerospace and Aeronautical Institute of America (until 2012)
Member, Edmonton Transportation Board, 2012 – present
Member, South African Institute of Mechanical Engineers 1976 – 2004
Member, South African Council of Engineers, 1976 – 2004
PAPERS AND PRESENTATIONS
“Applying the Analytic Hierarchy Process to Oil Sands Environmental Compliance
Risk Management” International Symposium Analytic Hierarchy Process 2014,
Washington DC
“Total Asset Integrity for a new SAGD Project" NACE Conference 2013, Victoria, BC
“Risk Assessment Doing Phased Array UT vs. Radiography – Based on Field Results”,
Oil and Gas Expo & Conference, North America 2011, Calgary, Alberta.
“Risk Assessment Doing Phased Array UT vs. Radiography – Based on Field Results”,
IPEIA Conference, Banff, 2011
“Total Integrity Programs in Alberta, Canada”, API Inspection Summit, Galveston,
Texas, 2011
283
“There’s a Crack in My Vessel! A first order assessment criterion of crack-like flaws to
be used by field inspectors”, IPEA Conference Banff, 2007
“Unusual Inspections of Pressure Equipment”, API Inspection Summit, Galveston,
Texas, 2007
“Total Asset Integrity Management”, IPEA Conference, Banff, 2004
“Total Asset Integrity implementation”, Power Conference, Toronto, 2004
“Evaluation and Testing of Complex Logistics Systems”, SOLE International
Conference, 1996
“Fatigue Analysis of Helicopters”, South African International Aeronautical Conference,
1986
PROFESSIONAL EXPERIENCE (PARTIAL LIST)
Roux Consulting Edmonton, Alberta, CA
2013- present
Focus on Engineering, Operational and Risk management. Implementation and
development of business, engineering, risk and quality management systems.
RAE Engineering & Inspection Ltd. Edmonton, Alberta, CA
President 2008-2013
Technical Manager 2003-2013
Denel Aviation South Africa
Engineering Manager (Chief Designer Rooivalk Helicopter Project) 2000-2002

284
RSAT South Africa
Manager and Chief Engineer 1988-2000
Lautus Developments Ltd South Africa
Owner/Director 1989-1995
Atlas Aircraft Corp. South Africa
Structural Analysis Manager and Project Engineer 1984-1987
Projects Expedited Ltd South Africa
Mechanical Engineer. NDE Manager 1980-1984
Atlas Aircraft Corp. South Africa
Mechanical Engineer 1979-1980
South African Air Force South Africa
Engineering Officer 1977-1978