Application of Analytic Hierarchy Process to Prioritize ... · Application of Analytic Hierarchy...
23
WP-2007-011 Application of Analytic Hierarchy Process to Prioritize Urban Transport Options – Comparative Analysis of Group Aggregation Methods Sudhakar Yedla and Ram M. Shrestha Indira Gandhi Institute of Development Research, Mumbai September 2007
Transcript of Application of Analytic Hierarchy Process to Prioritize ... · Application of Analytic Hierarchy...
WP-2007-011
Application of Analytic Hierarchy Process to Prioritize Urban Transport Options –
Comparative Analysis of Group Aggregation Methods
Sudhakar Yedla and Ram M. Shrestha
Indira Gandhi Institute of Development Research, Mumbai September 2007

Application of Analytic Hierarchy Process to Prioritize Urban Transport Options –
Comparative Analysis of Group Aggregation Methods 1
Sudhakar Yedla
Associate Professor
Indira Gandhi Institute of Development Research (IGIDR) General Arun Kumar Vaidya Marg
Goregaon (E), Mumbai- 400065, INDIA Email (corresponding author): [email protected]
Ram M. Shrestha
Professor, Energy Program, SERD
Asian Institute of Technology PO Box 4, Klong Luang, 12120, Pathumthani, Thailand
The present study presents a comparative analysis of different group aggregation methods adopted in AHP by testing them against social choice axioms with a case study of Delhi transport system. The group aggregation (GA) methods and their correctness were tested while prioritizing the alternative options to achieve energy efficient and less polluting transport system in Delhi It was observed that among all group aggregation methods, geometric mean method (GMM) - the most widely adopted GA method of AHP - showed poor performance and failed to satisfy the most popular “pareto optimality and non-dictatorship axiom” raising questions on its validity as GA method adopted in AHP. All other group aggregation methods viz. weighted arithmetic mean method with varying weights and equal weights (WAMM, WeAMM) and arithmetic mean of individual priorities (AMM) resulted in concurring results with the individual member priorities.
This study demonstrates that WeAMM resulted in better aggregation of individual priorities compared to WAMM. Comparative analysis between individual and group priorities demonstrates that the arithmetic mean (AMM) of priorities by individual members of the group showed minimum deviation from the group consensus making it the most suitable and simple method to aggregate individual preferences to arrive at a group consensus. Key words: AHP, decision making, GMM, group aggregation, transportation, WAMM
1 Authors are grateful to Swedish International Development Cooperation Agency (Sida) for supporting this research study which is undertaken at Asian Institute of Technology (AIT), Thailand.
2

Application of Analytic Hierarchy Process to Prioritize Urban Transport Options –
Comparative Analysis of Group Aggregation Methods
Sudhakar Yedla and Ram M. Shrestha
1. Introduction
Priority theory is a well established subject with wide range of applications to different
sectors. Most of the priority theory based methodologies follow either quantitative or
qualitative criteria to attribute priorities. Thomas L. Saaty’s Analytic Hierarchy Process (AHP)
developed in late 80’s, prioritizes alternatives based on qualitative and quantitative criteria.
AHP combines deductive approach and systems approach of solving problems into one
integrated logical framework and this makes it that much more effective in priority setting.
AHP is known for its potential in group aggregation. In spite of being used predominantly,
geometric mean and arithmetic mean methods are under consistent debate for their validity in
group aggregation (Aczel and saaty, 1983; Basak and Saaty, 1993; Richelson, 1981). In
particular, geometric mean method (GMM) was found causing rank reversal in group
aggregation (Kirkwood, 1979) and failing to satisfy few obvious social choice axioms. It was
evident from the literature on group aggregation and decision making that any group
aggregation methodology needs to be checked against certain social choice axioms. In spite of
the fact that GA methods posing problems, there exist no comprehensive comparative analysis
of GA methods adopted in AHP to identify which one proves better. Such comparative analysis
and empirical evidences are grossly missing in the literature.
In the present study, the group aggregation methods commonly employed in AHP are tested
against the standard social choice axioms and a comparative analysis has been carried out.
Delhi urban transport system was selected as a case in which AHP has been applied to
prioritize the selected alternative options for energy efficient and less polluting transport system
in Delhi. Prioritization has been carried out by using four different group aggregation methods
viz. geometric mean method (GMM), weighted arithmetic mean method with equal weights
(WeAMM), weighted arithmetic mean method with varying weights (WAMM) and arithmetic
mean of individual priorities (AMM) to make a comparison among them and check them
against social choice axioms. Subjective comparisons provided by a group of individuals
encompassing different key departments and actors of transport sector adds to the strength of
3
this exercise of prioritizing the transportation options and comparison of GA methods adopted
in AHP.
2. Objective
Objective of the present study is to make comparative analysis of GA methodologies
adopted in AHP and assess their potential for effective group aggregation by checking them
against social choice axioms with a case study of prioritizing alternative transportation options
for Delhi transport system.
3. Group aggregation and AHP
This section presents a brief outline of developments on group aggregation and analytic
hierarchy process. Most of the early works on aggregation of individual priorities are based on
utility theory. Aggregation of individual preferences to obtain a group consensus has started as
early as in 1951 with the “Impossibility Theorem” of Arrow. Keeney in 1976 had specified a
set of sufficient conditions for a cordinal social welfare function to have the weighted additive
form. In further development, Mirkin (1979) has developed an eigen vector based method to
determine group evaluation using constant coefficients which measure the change in evaluation
of a member due to interactions with other members of the group. Korhonen and Wallenius
(1990) have demonstrated a computer aided interactive mathematical programming technique
for solving group decision problems.
In the year 1980, Saaty had developed analytic hierarchy process (AHP) for group decision
making. AHP, unlike other decision-making processes, has the capability of handling both
qualitative and quantitative parameters. The three principles of guidance in AHP are
decomposition, comparative judgement and synthesis of priorities (Saaty, 1980, Saaty, 1990).
AHP model is an effective tool for priority setting because AHP combines deductive approach
and systems approach of solving problems into one, integrated logical framework. It integrates
qualitative and quantitative criteria and arrives at priorities of alternatives. The fundamental
principle of AHP is the “pair-wise comparison of different variables which are given numerical
values for their subjective judgements on relative importance of each of the variable following
a hierarchy and coming out with assigning relative weights to those variables”. This process
breaks down a complex and unstructured situation into components forming a hierarchy. This
4

technique has been used by many researchers for wide range of applications (Hannan, 1983).
Saaty had presented a thorough discussion (Saaty, 1986; Saaty, 1994) on several theoretical and
practical aspects of group decision-making using AHP.
Many methodologies viz. consensus voting, combined individual judgements (Harker and
Vargas, 1987), geometric mean method (Aczel and Saaty, 1983), weighted arithmetic mean
method are tried for group aggregation. Most common group aggregation methods adopted in
AHP are geometric mean method (GMM) and weighted arithmetic mean method (WAMM).
All the above GA methods have their limitations in group aggregation. Exponential function in
GMM magnifies even the slightest deviation in individual preferences resulting in poor
sensitivity. According to Zahir (1999), larger groups are more likely to get affected by this. In
weighted arithmetic mean methods deriving weights ‘w’ poses a potential problem. There is
another method of aggregating individual preferences in AHP, which includes the actors as one
of the levels of AHP hierarchy (Aczel and Saaty, 1983). In such cases the large scale hierarchy
interferes with the rank preservation. In spite of having problems with all the above GA
methods, a comprehensive comparative analysis to assess and compare their potential in
aggregating individual priorities to get group consensus is grossly missing in the literature.
3.1 Social choice axioms
Any decision derived from a group of individuals has to satisfy a set of social choice
axioms. Early works of Arrow (1951), “the impossibility theorem”, has been a major influence
in this area. Works of Richelson (1981), Plott (1976), Benjamin et al., (1992) etc., are few
examples of further efforts in line with Arrow’s work. Richelson has evaluated many social
choice functions such as ‘Simple Plurality’ and the ‘Borda Counts’ using 20 different social
choice axioms. Plott (1976) tried to present the overview of axiomatic social choice theory. The
importance of social choice axioms in group aggregation is well accepted and among the 20
social choice axioms discussed by Richelson, universal domain axiom, pareto optimality
axiom, independence of irrelevant alternative axiom, non-dictatorship axiom and recognition
axioms are the most popular and commonly used axioms (Keeney 1976; Mirkin 1979).
Among the axioms listed above, pareto and non-dictatorship and recognition axioms are
widely accepted axioms and any group aggregation process is expected to satisfy them.
Although the axiom “Universal domain” seems reasonable, it has been claimed that extreme
divergence of opinions among group members should be avoided. Independence of irrelevant
alternative axiom has been under discussion and criticism by many researchers (Hanssan,
5

1969). Hence, pareto and non-dictatorship axioms are considered for the comparative analysis
of GA methods in the present study.
4. Methodology
4.1 Urban transport system in Delhi
Delhi, the capital city of India has been facing tremendous growth in travel demand and
vehicular population resulting out of increased urbanization, population, economic growth and
improved road network. Delhi roads are dominated by personalized modes of transport viz. 2-
wheelers and cars (IGIDR, 2000). This may be due to the absence of an efficient public
transport system. Uncontrolled vehicular growth resulted in increase in air pollution making the
Indian capital city, the fourth most polluted city in the world. This is an alarming situation
requiring immediate action to minimize the energy demands from urban transport sector and
also to control the pollution. No single option would result in improving the situation
considerably. And also various actors involved may show different priorities over the available
alternative options. Hence, it is essential to apply multi-criteria decision making processes to
arrive at group priorities for the question of which alternative option should be given more
weight in implementation to achieve improved transport system, which is energy efficient and
less polluting.
4.2 Development of framework for AHP
As the roads of Delhi are more dominated by 2-Wheelers and cars, the following options
have been selected to achieve sustainable transportation.
Option - I: Replacing 2-stroke 2-wheelers by 4-stroke 2-wheelers (AI)
Option - II: Converting conventional fuel cars by CNG cars (AII)
Option - III: Converting conventional fuel buses by CNG buses (AIII)
As different actors involved may have different priorities for options, ranking needs to be
done by a group of actors. This should include all those categories of people who have
influence over it either directly or indirectly as shown below:
a. Environmental experts e. Automobile association
b. Energy experts f. Automobile research institute
c. Users g. Local level implementing agency
d. Federal department/Policy maker
6

To achieve better ranking, it is important to select the list of criteria based on which the
comparative judgements are made. The following criteria have been selected based on the
options that are selected and also the goal of the hierarchy “selection of alternative options for
sustainable urban transport in Delhi”.
1. Energy efficiency (Energy) (C1)
2. Emission reduction potential (Environment) (C2)
3. Economic feasibility (Cost) (C3)
4. Technological preparedness (Technology) (C4)
5. Implementability/Adaptability (C5)
6. Barriers to the implementation of these options (Barriers) (C5)
4.2.1 Construction of AHP tree
This section describes the construction of the hierarchical tree for current problem under
consideration.
Goal: Goal of the process is to prioritize a set of alternatives for the improvement of transport
system in Delhi.
Criteria: Criteria constitute the first level of the hierarchy and the elements at this level include
Energy, Environment, Cost, Technology, Adaptability and Barriers.
Alternatives: Alternatives viz. replacing 2-stroke 2-wheelers by 4-stroke 2-wheelers,
conversion of conventional fuel cars to CNG cars, conversion of conventional fuel buses to
CNG buses represent the second level in the current hierarchy. Figure 1 gives the graphical
view of the hierarchy tree.
Prioritization of Alternative
Transportation Options
Fig. 1. AHP hierarchy tree for the prioritization of alternative transportation options
Energy
4S - 2W
Environment Cost Technology Adaptability Barriers
CNG car
CNG bus
4S - 2W 4S - 2W 4S - 2W 4S - 2W 4S - 2W
CNG car CNG car CNG car CNG car CNG car
CNG bus CNG bus CNG bus CNG bus CNG bus
7
This tree is made of three quantitative criteria and three qualitative criteria. Among the
list of criteria Cost, Energy and Environment fall under the category of quantitative parameter
and the other three namely Technology, Adaptability and Barriers are qualitative. Each one
needs essentially a separate methodology for their quantification and subsequent prioritization.
4.3 Quantitative criteria
4.3.1 Energy
Prioritization of various options was done by finding out their energy saving potential.
Total energy demand of a particular travel mode of any particular option (for instance, total
energy demand of cars in the case AII) was considered to calculate the energy saving potential
by using the following equation:
8
old
alt
itPitP
−1
old
alt
jtEjt
−1 ESP = (i)
E
where,
ESP Energy saving potential
Ejt-alt Energy requirement of the travel mode ‘j’ in alternative technology in
the year ‘t’
Ejt-old Energy requirement of the travel mode ‘j’ in existing technology in the
year ‘t’
Energy requirement of each option was determined by considering the total PKM catered
by the respective mode of transport of the option under consideration and the respective energy
intensity factor. Normalization technique is used to arrive at priorities of alternative options
under each quantitative criteria namely energy, environment and cost.
4.3.2 Environment
Prioritization of alternative options with reference to the environmental criteria was done by
calculating emission reduction potential (ERP) of each alternative.
ERP = (ii)
where,

ERP Emission reduction potential
Pit-alt Emission of pollutant type ‘i’ in the alternative technology in the
year ‘t’
Pit-old Emission of pollutant type ‘i’ in the existing technology in the
year ‘t’
4.3.3 Cost
For each option cost is represented by the life cycle operating cost (LCC). LCC of each
alternative option was determined by using the following formula:
jPKMtLevelised cos
LCC = (iii)
where,
LCC Life cycle operating cost
LC Levelised cost of the option (includes capital cost, operation costs, O&M
costs, taxes and subsidies etc.)
PKMjt PKM covered by travel mode ‘j’ in the alternative option for the year ‘t’
4.4 Qualitative criteria
Subjective judgements from the group members are collected in terms of pairwise
judgements. A specially designed questionnaire was used to get the pairwise comparison
matrices. AHP based decision software named “Expert Choice” is used in certain cases to get
priorities.
4.4.1 Questionnaire design
Questionnaire survey was adopted to complete the pairwise matrices. A specially
designed questionnaire was given to all the respondents in the group and were given
sufficient time to send back their responses. Questionnaire survey has been used to get
priority matrices for criteria, actors and alternatives under qualitative criteria.
Priorities of alternative options based on qualitative criteria are calculated in four methods
by adopting GMM, WeAMM, WAMM and AMM. Final priorities of alternative options are
determined as four cases by forming the final matrices with quantitative criteria and qualitative
criteria by each GA method.
9

5. Results and Analysis
Analysis has been carried out using four group aggregation methods. In the present case of
hierarchy, alternative options provide the lowest level with criteria as an intermediate level and
goal at the top level. As in AHP the priorities attributed to the lower level of hierarchy adds to
the prioritization of upper levels, prioritization of lower level is carried out first to attribute
priorities to the alternative options with respect to each criteria.
5.1 Quantitative criteria
5.1.1 Energy
LEAP model (Long Range Energy Alternative Planning) was used to estimate the energy
demand of the vehicles of different modes for the year 1998. Table 1 provides the energy
demand of all options under consideration.
Table 1 Energy demands of various alternative technologies calculated by using LEAP model Travel mode Total PKM catered by the
mode under consideration (million)
Total energy demand of mode ‘J’ (Million GJ)
2-wheelers –2-stroke 11.32 6.11
2-wheelers –4-stroke 11.32 4.19 (31.42%) ↓
Cars –petrol 18.17 19.60
Cars – diesel 18.17 --
Cars – CNG 18.17 11.23 (42.70%) ↓
Taxi – petrol 0.62 1.606
Taxi – diesel 0.62 --
Taxi-CNG 0.62 1.025 (36.18%) ↓
Bus – diesel 39.02 12.17
Bus- CNG 39.02 11.78 (3.20%) ↓
In the above table, figures in parenthesis indicate the percentage change in energy demand
for alternative option with respect to the base case. The downward arrows indicate percentage
fall in energy demand. Energy saving potential (ESP) was calculated and the priorities of the
three alternative options under consideration with respect to the energy criteria are determined
10

by adopting normalization technique. Table 2 presents the energy saving potential (ESP) and
priorities of the three alternatives with respect to the energy criteria.
Table 2 Priorities of all alternatives under the criteria “Energy” Alternative Option Energy saving potential
(ESP) Priority
4-S 2-wheelers 0.314 0.4089
CNG Cars 0.422* 0.5494*
CNG Buses 0.032 0.0416
* Car and Taxi have been added together
5.1.2 Environment
Emission of all pollutants under consideration (CO2, CO, SOx, NOx, HC, TSP, Pb) was
calculated both for base case and alternative options. Table 3 presents the reduction in total
emission levels of each pollutant in the alternative options.
Table 3 Reduction in overall emission levels of Delhi for different alternative options
Total annual emission of pollutants (‘000 t) Option
CO2 CO SOx NOx HC TSP Pb
2-wheelers
2-stroke (base case)
4-stroke (alternative case)
3.48
3.35
173.12
173.16
6.77
6.67
50.02
52.00
59.02
31.50
10.04
7.45
0.077
0.071
Cars
Gasoline (base case)
CNG (alternative case)
3.48
3.57
173.12
101.25
6.77
4.39
50.02
41.44
59.02
52.06
10.04
7.92
0.077
0.039
Buses
Diesel (base case)
CNG (alternative case)
3.48
3.99
173.12
161.27
6.77
4.42
50.02
31.69
59.02
57.05
10.04
8.16
0.077
0.077
All three options showed significant influence on different pollutants and their levels in
overall pollution levels in Delhi. However, unit improvement of pollution level in the
respective mode of the option needs to be calculated to get emission reduction potential (ERP)
of each option. For instance, pollution reduced by using CNG cars instead of gasoline and
11

diesel cars per PKM traveled demonstrates the ERP better. Table 4 presents the unit emission
reduction of each pollutant in the respective mode of transport under base case as well as
alternative options.
ERP of all alternative options for different kind of pollutants was calculated using the
formula given in the methodology. ERP approaching unity indicates better potential of the
alternative option.
Table 4 Emission reduction of each mode of transport in respective option per unit output
Emission (g)/PKM Option Fuel type
CO2 CO SOx NOx HC TSP Pb
2-wheelers 2-stroke 37.70 4.53 0.0257 0.0545 2.8251 0.2726 0.002
4-stroke 25.83 4.53 0.0177 0.2128 0.3939 00437 0.001
Cars Gasoline 73.19 3.95 0.1306 0.5495 0.3833 0.1164 0.002
CNG 78.01 0.0042 0 0.0669 0 0 0
Buses Diesel 22.89 0.3055 6E-05 0.5054 5E-5 4.8E-5 0
CNG 35.84 0.0019 0 0.0307 0 0 0
Table 5 Emission reduction potential (ERP) of different alternatives in Delhi
Emission reduction potential (base year) Option
CO2 CO SOx NOx HC TSP Pb
4-stroke 2-wheelers
CNG cars
CNG buses
0.3148
-0.066
-0.565
-0.0008
0.998
0.994
0.315
1.000
1.000
-2.904
0.878
0.939
0.861
1.000
1.000
0.839
1.000
1.000
0.313
1.000
0.000
Different options show potential in controlling different pollutants. Adding up all the
pollutants would represent the overall emission reduction potential. However, domination of
pollutants is location specific. For instance, TSP, HC and SOx concentrations typically
dominate Delhi air pollution. Therefore, potential of alternative options in controlling these
pollutants should be given more weight. Hence, the following weights are assigned to each of
the pollutants under consideration. This weight assigning process was done by adopting single
actor approach.
12

Pollutant TSP CO Nox SOx HC Pb
Weight 0.300 0.100 0.100 0.200 0.200 0.100
Overall ERP of each alternative option has been calculated and is presented in Table 6.
Priorities of each alternative with respect to the environment criterion are presented in the table
below.
Table 6 Priorities of different alternatives under the criteria “Environment” Option Weighted ERP Priority
4-stroke 2-wheelers 0.2277 0.1079
CNG cars 0.9876 0.4684
CNG buses 0.8933 0.4236
5.1.3 Cost
Cost effectiveness of each option was assessed in terms of life cycle operation cost (LCC) per
unit of pollution reduced. Total pollution load of all local pollutants together was considered
to find out the cost effectiveness. Priorities of each alternative under the cost criterion are
calculated by normalizing the unit abatement costs. An increase in the cost due to pollution
reduction was given a positive sign where as decrease in cost due to adaptation of less energy
intensive system resulting reduction in cost was given a negative sign. Table 7 presents the
LCC of each alternative, unit abatement cost and priorities of all three alternatives under the
cost criterion.
Table 7 Priorities of three alternatives under the criteria “Cost” Option LCC (Rs/pkm)* Abatement cost
(Rs/Kg) Priority
4-stroke 2-wheeler 1.2468 -33.5 0.244
CNG car 1.9218 -104.4 0.743
CNG bus 0.0747 0.45 0.003
* 1 USD ≈ 49 Indian rupees
13

Following is the matrix form of priorities of all alternatives under quantitative criteria
energy, environment and cost:
Energy Environment Cost
4-stroke 2-wheelers 0.409 0.108 0.244
CNG car 0.549 0.468 0.743
CNG bus 0.042 0.424 0.003
5.2 Qualitative criteria
This section presents the prioritization of alternatives based on qualitative criteria viz.
availability of technology, adaptability and barriers. Pairwise judgements of different actors for
alternatives under different criteria are aggregated to get the pairwise comparison matrix of the
group. Weights for alternative so derived are added to the weightage matrix derived from
quantitative criteria and final weights were derived. The group aggregation of the individual
priorities under quantitative criteria was carried out in four different methods.
5.2.1 GMM
The individual pairwise matrices provided by the group members for the alternatives in
each qualitative criteria are used to get the aggregated pairwise matrix. Geometric mean was
calculated by using the formula:
nkij
n
ka
1
1 ⎟⎟⎠
⎞⎜⎜⎝
⎛
=∏ (iv)
where, n is the number of members and aij is the preference of a member for element ‘i’
over ‘j’.
Pairwise matrices of the group for all three alternatives under three criteria namely
technology, adaptability and barriers calculated by GMM and are presented below. Pairwise
matrix of the group for the prioritization of criteria was also calculated using GMM and
presented here.
⎥⎥⎥
⎦
⎤
⎢⎢⎢
⎣
⎡
129.196.176.0142.259.041.01
⎥⎥⎥
⎦
⎤
⎢⎢⎢
⎣
⎡
157.168.162.01259.059.01
⎥⎥⎥
⎦
⎤
⎢⎢⎢
⎣
⎡
1046.387.3327.01122.1257.0891.01
14

Pairwise matrix of the Pairwise matrix of the Pairwise matrix of the group w.r.t. ‘Technology’ group w.r.t. ‘Adaptability’ group w.r.t. ‘Barriers’
⎥⎥⎥⎥⎥⎥⎥
⎦
⎤
⎢⎢⎢⎢⎢⎢⎢
⎣
⎡
158.074.029.137.1169.1112.157.167.114.132.188.0117.193.155.177.063.084.0180.009.172.059.051.024.1196.099.086.064.091.002.11
Pairwise matrix of the group for criteria
Eigen vectors are calculated for all the above matrices and also the respective weightage
matrices, which are shown below. wc is the weightage matrix for the criteria and wc4, wc5 and
wc6 are the weightage matrices of the three qualitative criteria technology, adaptability and
barriers, respectively.
⎥⎥⎥⎥⎥⎥⎥⎥
⎦
⎤
⎢⎢⎢⎢⎢⎢⎢⎢
⎣
⎡
157.0219.0207.0139.0132.0147.0
15
⎢
⎣
⎡
385.0186.0429.0
⎢
⎣
⎡
198
632.0
⎥⎥⎥
⎦
⎤
⎢⎢⎢
⎣
⎡
326.0227.0446.0
⎥⎥⎥
⎦
⎤
⎢⎢
⎢⎢
.0170.0
w⎥⎥⎥
⎦
⎤
c4 = , wc5 = , wc6 = , wc =
Consistency ratio was found to be in a valid range as per Saaty’s analytic hierarchy process
(Saaty, 1990).
With the weights of the alternatives under the three qualitative criteria, weightage matrix
for the criteria (shown above) and weights of alternatives under three quantitative criteria
(shown in 5.1), hierarchy tree takes the form as shown in Figure 1. Following are the
weightage matrices of the alternatives (3x6) and criteria (1x6) for the final priority derivation.
⎥⎥⎥
⎦
⎤
⎢⎢⎢
⎣
⎡
326.0385.0198.0423.0041.0003.0227.0186.0170.0468.0549.0743.0446.0429.0632.0107.0409..0244.0
⎥⎥⎥⎥⎥⎥⎥⎥
⎦
⎤
⎢⎢⎢⎢⎢⎢⎢⎢
⎣
⎡
157.0219.0207.0139.0132.0147.0
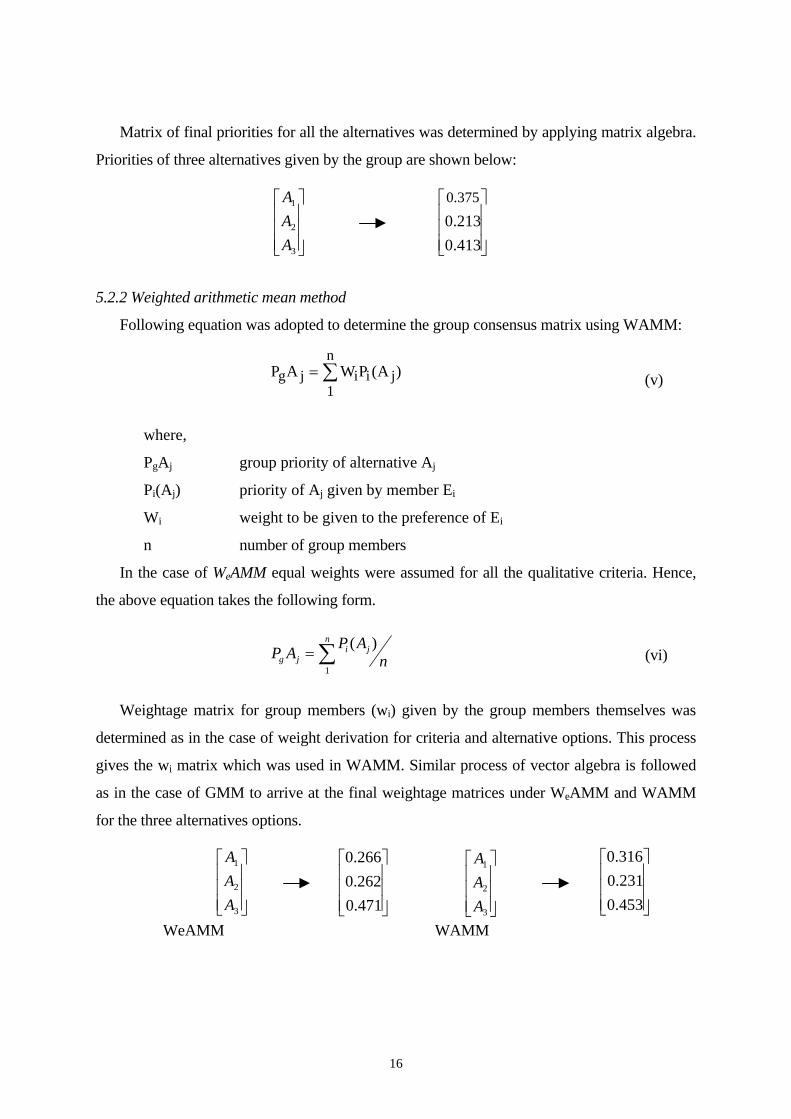
Matrix of final priorities for all the alternatives was determined by applying matrix algebra.
Priorities of three alternatives given by the group are shown below:
16
⎣
⎡
3A
A
⎥⎥⎥
⎦
⎤
⎢⎢⎢
⎣
⎡
413.0213.0375.0
⎥⎥⎥
⎦
⎤
⎢⎢⎢
2
1
A
5.2.2 Weighted arithmetic mean method
Following equation was adopted to determine the group consensus matrix using WAMM:
∑=n
1jiijg )A(PWAP (v)
where,
PgAj group priority of alternative Aj
Pi(Aj) priority of Aj given by member Ei
Wi weight to be given to the preference of Ei
n number of group members
In the case of WeAMM equal weights were assumed for all the qualitative criteria. Hence,
the above equation takes the following form.
∑=n
jijg n
APAP1
)( (vi)
Weightage matrix for group members (wi) given by the group members themselves was
determined as in the case of weight derivation for criteria and alternative options. This process
gives the wi matrix which was used in WAMM. Similar process of vector algebra is followed
as in the case of GMM to arrive at the final weightage matrices under WeAMM and WAMM
for the three alternatives options.
⎥⎦⎢⎣ 3A ⎥⎦⎢⎣ 471.0 ⎥⎦⎢⎣ 453.0⎥⎥⎦⎢
⎢⎣ 3A
WeAMM WAMM
⎥⎥⎤
⎢⎢⎡
2
1
AA ⎤
⎢⎢⎡
262.0266.0 ⎤
⎢⎢⎡
231.0316.0⎤
⎢⎡
2
1
AA
⎥⎥
⎥⎥ ⎥

5.2.3 AMM
Priorities of alternatives given by the individual members of the group were determined
using the Expert Choice software. Priorities for the three alternative options given by individual
members of the group are presented in Table 8. Final priorities of alternatives given by the
individual members are aggregated by arithmetic mean method to arrive at the group
consensus. Priorities of alternatives given by the group are as shown below:
⎥⎥⎥
⎦
⎤
⎢⎢⎢
⎣
⎡
3
2
1
AAA
⎥⎥⎥
⎦
⎤
⎢⎢⎢
⎣
⎡
421.0208.0372.0
Table 8 Priorities for the three different alternatives provided by individual members of the group
Priorities given by individual members of the group Option
M1 M2 M3 M4 M5 M6*
4-s 2-wheelers 0.349 (II) 0.366 (II) 0.423 (II) 0.228 (III) 0.492 (I) -
CNG cars 0.232 (III) 0.176 (III) 0.148 (III) 0.329 (II) 0.155 (III) -
CNG buses 0.420 (I) 0.458 (I) 0.429 (I) 0.443 (I) 0.353 (II) - * M6 - inconsistency is beyond the allowable limit of 0.1 ** figures in parenthesis indicate the ranking
5.3 Comparative analysis of GA methods
Priorities of alternative options determined using different GA methods was found
following different patterns. Table 9 presents the comparative analysis of different group
aggregation methodology adopted in AHP.
Table 9 Priorities for the three different alternatives derived from four different group aggregation methods
Priorities Option
GMM WeAMM WAMM AMM
4-stroke bikes 0.213 (III) 0.266 (II) 0.316 (II) 0.372 (II)
CNG cars 0.375 (II) 0.262 (III) 0.231 (III) 0.208 (III)
CNG buses 0.413 (I) 0.471 (I) 0.453 (I) 0.421 (I)
17
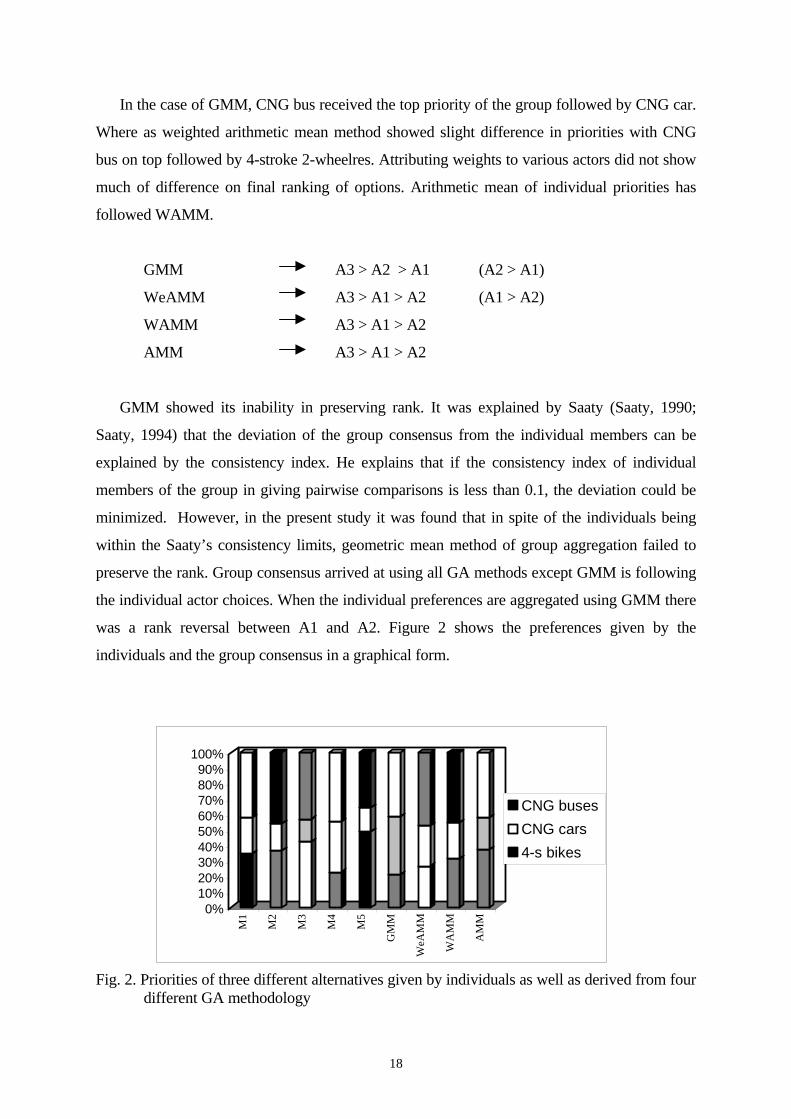
In the case of GMM, CNG bus received the top priority of the group followed by CNG car.
Where as weighted arithmetic mean method showed slight difference in priorities with CNG
bus on top followed by 4-stroke 2-wheelres. Attributing weights to various actors did not show
much of difference on final ranking of options. Arithmetic mean of individual priorities has
followed WAMM.
GMM A3 > A2 > A1 (A2 > A1)
WeAMM A3 > A1 > A2 (A1 > A2)
WAMM A3 > A1 > A2
AMM A3 > A1 > A2
GMM showed its inability in preserving rank. It was explained by Saaty (Saaty, 1990;
Saaty, 1994) that the deviation of the group consensus from the individual members can be
explained by the consistency index. He explains that if the consistency index of individual
members of the group in giving pairwise comparisons is less than 0.1, the deviation could be
minimized. However, in the present study it was found that in spite of the individuals being
within the Saaty’s consistency limits, geometric mean method of group aggregation failed to
preserve the rank. Group consensus arrived at using all GA methods except GMM is following
the individual actor choices. When the individual preferences are aggregated using GMM there
was a rank reversal between A1 and A2. Figure 2 shows the preferences given by the
individuals and the group consensus in a graphical form.
0%10%20%30%40%50%60%70%80%90%
100%
M1
M2
M3
M4
M5
GM
M
WeA
MM
WA
MM
AM
M
CNG busesCNG cars4-s bikes
Fig. 2. Priorities of three different alternatives given by individuals as well as derived from four different GA methodology
18

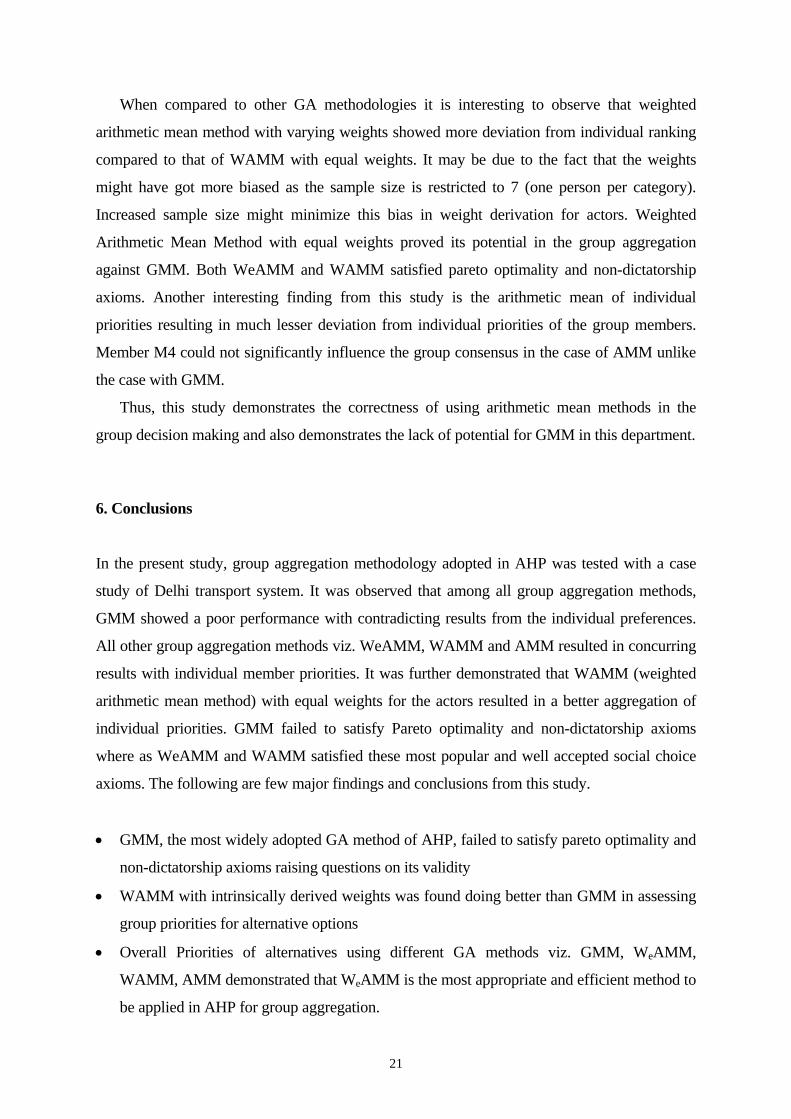
From the above results it is apparent that GMM failed to satisfy the pareto optimality
axiom, which is a well accepted axiom for group aggregation. Figure 3 to 6 demonstrates the
deviation of individual member priorities from group consensus arrived using different GA
methodology.
0
0.1
0.2
0.3
0.4
0.5
0.6
4-s bikes CNG cars CNG buses
M1M2M3M4M5GMM
Fig. 3. Deviation of individual member priorities from group consensus (GMM)
0
0.1
0.2
0.3
0.4
0.5
0.6
4-s bikes CNG cars CNG buses
M1
M2
M3
M4
M5
WAMM
Fig. 4. Deviation of individual member priorities from group consensus (WAMM)
19

0
0.1
0.2
0.3
0.4
0.5
0.6
4-s bikes CNG cars CNG buses
M1M2M3M4M5WeAMM
Fig. 5. Deviation of individual member priorities from group consensus (WeAMM)
0
0.1
0.2
0.3
0.4
0.5
0.6
4-s bikes CNG cars CNG buses
M1M2M3M4M5AMM
Fig. 6. Deviation of individual member priorities from group consensus based on AMM
All individual members of the groups followed similar trend in their priorities for the
alternatives except the policy maker. The contradictory result from GMM could be due to the
fact that member 4 (policy maker) rated A2 much higher and also with a considerable
difference from the competing alternatives. This considerable difference lead to a rank reversal
in GMM. Understandably policy makers have a stronger understanding and influence on
transport sector. However, while aggregating individual priorities to get a group consensus,
GMM failed to follow non-dictatorship axiom due to the overriding influence of the opinion of
M4. This clearly demonstrates the failure of GMM to satisfy the non-dictatorship axiom as
well.
20
When compared to other GA methodologies it is interesting to observe that weighted
arithmetic mean method with varying weights showed more deviation from individual ranking
compared to that of WAMM with equal weights. It may be due to the fact that the weights
might have got more biased as the sample size is restricted to 7 (one person per category).
Increased sample size might minimize this bias in weight derivation for actors. Weighted
Arithmetic Mean Method with equal weights proved its potential in the group aggregation
against GMM. Both WeAMM and WAMM satisfied pareto optimality and non-dictatorship
axioms. Another interesting finding from this study is the arithmetic mean of individual
priorities resulting in much lesser deviation from individual priorities of the group members.
Member M4 could not significantly influence the group consensus in the case of AMM unlike
the case with GMM.
Thus, this study demonstrates the correctness of using arithmetic mean methods in the
group decision making and also demonstrates the lack of potential for GMM in this department.
6. Conclusions
In the present study, group aggregation methodology adopted in AHP was tested with a case
study of Delhi transport system. It was observed that among all group aggregation methods,
GMM showed a poor performance with contradicting results from the individual preferences.
All other group aggregation methods viz. WeAMM, WAMM and AMM resulted in concurring
results with individual member priorities. It was further demonstrated that WAMM (weighted
arithmetic mean method) with equal weights for the actors resulted in a better aggregation of
individual priorities. GMM failed to satisfy Pareto optimality and non-dictatorship axioms
where as WeAMM and WAMM satisfied these most popular and well accepted social choice
axioms. The following are few major findings and conclusions from this study.
• GMM, the most widely adopted GA method of AHP, failed to satisfy pareto optimality and
non-dictatorship axioms raising questions on its validity
• WAMM with intrinsically derived weights was found doing better than GMM in assessing
group priorities for alternative options
• Overall Priorities of alternatives using different GA methods viz. GMM, WeAMM,
WAMM, AMM demonstrated that WeAMM is the most appropriate and efficient method to
be applied in AHP for group aggregation.
21
• Comparative analysis between individual and group priorities demonstrated the deviations
and arithmetic mean (AMM) of priorities by individual members of the group showed
minimum deviation from the group consensus making it the most suitable and simple
method to aggregate individual preferences to arrive at a group preference.
• To achieve energy efficiency and emission mitigation in Delhi transport system CNG bus
got the top rank followed by 4-stroke 2-wheelers and CNG cars.
References Aczel, J., Saaty, T.L., 1983. Procedures for synthesising ratio judgements, Journal of Mathematical Psychology 27, 93-102. Basak, I., Saaty, T.L., 1993. Group decision making using the analytic hierarchy process, Mathematical and Computer Modeling 17, 101-109. IGIDR, 2000. Analysis of technological options for mitigating environmental emissions from the urban transport system in selected Asian cities, AIT, Bangkok, first annual report. Arrow, K.J., 1951. Social Choice and Individual Values, New York. Benjamin, Colin O., Ehie, Ike C., 1992. Omurtag, Yildirim, Planning Facilities at the University of Missouri-Rolla, Interfaces 22 (4) 95-105. Hannan, E.L., (1983). An Eigen Value Method for Evaluating Constraints, Computers & Operations Research 10 (1) 41-46. Hansson, B., 1969. Group preferences, Econometrica 37 (1) 50-54. Harker, P.T., Vargas, J.S., 1990. Reply to “Remarks on the Analytic Hierarchy Process”, Management Science 36 (3) 269-273. Keeney, R.L., 1976. A group preference axiomatization with cordinal utility, Management Science 23 (2) 140-145. Kirkwood, C.W., 1979. Pareto optimality and equity in social decision analysis, IEEE Transactions on systems, Man and Cybernetics 9 (2) 89-91. Korhonen, P., Wallenius, J., 1990. Supporting individuals in group decision making, Theory and Decision 28 (3) 313-329. Mirkin, B.G., 1979. Group Choice, Halsted Press, New York. Plott, C.R., 1976. Axiomatic social choice theory: An overview and interpretation, American Journal of Political Science XX 511-596. Richelson, J. T., 1981. A Comparative Analysis of Social Choice Functions, IV, Behavioral Science 26, 346-353.
22

Saaty, T.L., 1980. The Analytic Hierarchy Process, Wiley, New York. Saaty, T.L., 1986. Axiomatic foundations of analytic hierarchy process, Management Science 32 (7) 841-855. Saaty, T.L., 1990. The analytic hierarchy process – planning, priority setting, resources allocation, RWS Publishers, USA. Saaty, T.L., 1990. An Explanation of the AHP in Reply to the Paper “Remarks on the Analytic Hierarchy Process”, Management Science 36 (3) 259-268. Saaty, T.L., 1994. Highlights and Critical Points in the Theory and Application of the Analytic Hierarchy Process, European Journal of Operations Research 72, 426-447. Saaty, T.L., 1994. Homogeneity and Clustering in AHP Ensures the Validity of the Scale, European Journal of Operations Research 72, 598-601. Saaty, T.L., 1994. Highlights and critical points in the theory and application of the analytic hierarchy process, European Journal of Operations Research 74, 426-447. Zahir, S., 1999. Clusters in a group: Decision making in the vector space formulation of the analytic hierarchy process, European Journal of Operations Research 112, 620-634.
23