Application of analytic hierarchy process and geographic ...
10
JOURNAL OF DEGRADED AND MINING LANDS MANAGEMENT ISSN: 2339-076X (p); 2502-2458 (e), Volume 5, Number 4 (July 2018): 1363-1372 DOI:10.15243/jdmlm.2018.054.1363 www.jdmlm.ub.ac.id 1363 Research Article Application of analytic hierarchy process and geographic information system techniques in flood risk assessment: a case of Ofu river catchment in Nigeria M.I. Alfa 1* , M.A. Ajibike 2 , R.E. Daffi 1 1 Department of Civil Engineering, University of Jos, Nigeria 2 Department of Water Resources and Environmental Engineering, Ahmadu Bello University, Zaria, Nigeria * corresponding author: [email protected] Received 27 April 2018, Accepted 25 May 2018 Abstract: Flood risk assessment of Ofu River Catchment in Nigeria was carried out by integration of thematic maps in ArcGIS 10.2.2. Analytic Hierarchy Process (AHP) was applied in the decision making and ranking of flood causative factors before their integration for development of hazard map in ArcGIS. The social and physical vulnerability of the catchment were considered in the development of the vulnerability map. The flood risk map was developed as a product of the hazard and vulnerability map. The results showed that the land areas within the Very High and High Risk zones were respectively 163.07 km 2 and 392.63 km 2 with Igalamela/Odolu Local Government Area (LGA) accounting for about 62% and 31% respectively. A total of 19, 034 and 47,652 persons are respectively at very high and high risk of flood within the catchment. Oforachi community in Igalamela/Odolu LGA and Ejule Ojebe Community in Ibaji LGA both in Kogi State are respectively at Very High and High Risk of Ofu River flood. High Impacts were recorded by about 35% and 52% of Oforachi Community during the 1995 and 2000 historical flood events. A watershed management plan is therefore required to prevent the serious damage experienced in previous flood events. Keywords: analytic hierarchy process, flood, hazard, multi-criteria evaluation, risk, vulnerability To cite this article: Alfa, M.I., Ajibike, M.A. and Daffi, R.E. 2018. Application of analytic hierarchy process and geographic information system techniques in flood risk assessment: a case of Ofu river catchment in Nigeria. J. Degrade. Min. Land Manage. 5(4): 1363-1372, DOI: 10.15243/jdmlm. 2018.054.1363. Introduction There is a consensus of opinions among researchers that flood is one of the most devastating, frequently occurring and costliest natural hazards in the world, responsible for more than 30% of all geophysical related hazards, accounting for about 31 % of economic losses globally and adversely affecting more people than any other natural hazard (Nwafor, 2006; Ajin et al., 2013; Adebayo and Oruonye, 2013; Obeta, 2014, Komolafe et al., 2015). Flood generally referes to the inundation of areas of land which are normally dry. Among many other causes, the inability of a river channel to carry discharge volumes beyond its carrying capacity often results in the flooding of nearby lands which in most cases have catastrophic effect (Jeb and Aggarwal, 2008; Olajuyigbe et al., 2012). This has been the case of Ofu River catchment in Nigeria where the inability of the river to contain the volume of discharges in the peak of the rainy season has consistently resulted in the flooding of surrounding communities for over two decades now (Alfa et al., 2018). Notwithstanding this long disaster within the catchment of Ofu River, this study appears to be the first time the Flood Risk assessment will be carried out in this sub-basin. While flood risk assessment and flood risk mapping are not new, the methods adopted over time seem to be constantly evolving. Among the methods that have found very wide application in flood risk studies is the application of Multi criteria Evaluation (MCE) and Geographic
Transcript of Application of analytic hierarchy process and geographic ...

JOURNAL OF DEGRADED AND MINING LANDS MANAGEMENTISSN: 2339-076X (p); 2502-2458 (e), Volume 5, Number 4 (July 2018): 1363-1372
DOI:10.15243/jdmlm.2018.054.1363
www.jdmlm.ub.ac.id 1363
Research Article
Application of analytic hierarchy process and geographic informationsystem techniques in flood risk assessment: a case of Ofu rivercatchment in Nigeria
M.I. Alfa1*, M.A. Ajibike2, R.E. Daffi1
1 Department of Civil Engineering, University of Jos, Nigeria2 Department of Water Resources and Environmental Engineering, Ahmadu Bello University, Zaria, Nigeria
*corresponding author: [email protected]
Received 27 April 2018, Accepted 25 May 2018
Abstract: Flood risk assessment of Ofu River Catchment in Nigeria was carried out by integration ofthematic maps in ArcGIS 10.2.2. Analytic Hierarchy Process (AHP) was applied in the decision makingand ranking of flood causative factors before their integration for development of hazard map in ArcGIS.The social and physical vulnerability of the catchment were considered in the development of thevulnerability map. The flood risk map was developed as a product of the hazard and vulnerability map.The results showed that the land areas within the Very High and High Risk zones were respectively163.07 km2 and 392.63 km2 with Igalamela/Odolu Local Government Area (LGA) accounting for about62% and 31% respectively. A total of 19, 034 and 47,652 persons are respectively at very high and highrisk of flood within the catchment. Oforachi community in Igalamela/Odolu LGA and Ejule OjebeCommunity in Ibaji LGA both in Kogi State are respectively at Very High and High Risk of Ofu Riverflood. High Impacts were recorded by about 35% and 52% of Oforachi Community during the 1995 and2000 historical flood events. A watershed management plan is therefore required to prevent the seriousdamage experienced in previous flood events.
Keywords: analytic hierarchy process, flood, hazard, multi-criteria evaluation, risk, vulnerability
To cite this article: Alfa, M.I., Ajibike, M.A. and Daffi, R.E. 2018. Application of analytic hierarchy process andgeographic information system techniques in flood risk assessment: a case of Ofu river catchment in Nigeria. J.Degrade. Min. Land Manage. 5(4): 1363-1372, DOI: 10.15243/jdmlm. 2018.054.1363.
Introduction
There is a consensus of opinions amongresearchers that flood is one of the mostdevastating, frequently occurring and costliestnatural hazards in the world, responsible for morethan 30% of all geophysical related hazards,accounting for about 31 % of economic lossesglobally and adversely affecting more people thanany other natural hazard (Nwafor, 2006; Ajin etal., 2013; Adebayo and Oruonye, 2013; Obeta,2014, Komolafe et al., 2015). Flood generallyreferes to the inundation of areas of land whichare normally dry. Among many other causes, theinability of a river channel to carry dischargevolumes beyond its carrying capacity often resultsin the flooding of nearby lands which in most
cases have catastrophic effect (Jeb and Aggarwal,2008; Olajuyigbe et al., 2012). This has been thecase of Ofu River catchment in Nigeria where theinability of the river to contain the volume ofdischarges in the peak of the rainy season hasconsistently resulted in the flooding ofsurrounding communities for over two decadesnow (Alfa et al., 2018). Notwithstanding this longdisaster within the catchment of Ofu River, thisstudy appears to be the first time the Flood Riskassessment will be carried out in this sub-basin.
While flood risk assessment and flood riskmapping are not new, the methods adopted overtime seem to be constantly evolving. Among themethods that have found very wide application inflood risk studies is the application of Multicriteria Evaluation (MCE) and Geographic

Application of analytic hierarchy process and geographic information system techniques in flood risk assessment
Journal of Degraded and Mining Lands Management 1364
Information System techniques. According to deBrito et al. (2016), application of MCE in floodrisk management accounted for over 82% of allpublished peer-reviewed papers between 2009 and2015. Amongst these techniques, they reportedthat Analytic Hierarchy Process (AHP) dominatedthe studies. This points to the fact that thesetechniques have been proven over this period tobe effective tools in flood risk studies. Similarly,the application of Remote Sensing (RS) andGeographic Information System (GIS) techniqueshave also found wide application in flood riskmapping as opposed to the traditional manualmethods (Komolafe et al., 2015). For instance,Daffi et al. (2014) carried out the flood inundationmapping of the Dep River Basin in North centralNigeria using ArcGIS 9.3 in combination withHEC-RAS and HEC-GeoRAS. They obtained thedepth and velocity of inundation which were usedto classify the hazard level of the flood. Similarly,Jeb and Aggarwal (2008) applied RS and GIStechniques to map the flood inundation extent ofRiver Kaduna within Kaduna metropolis. Theycombined the Digital Elevation Model (DEM)with flood stage data results obtained fromGumbel’s Extreme value distribution model toestimate the extent of flood inundations indifferent flood return periods. Ojigi et al. (2013)also delineated and mapped the historic 2012flood in some parts of North-Central Nigeria. A
combination of imageries obtained fromRADARSAT, Infoterra SAR, SPOT-5 as well asShuttle Radar Topography Mission (SRTM)Digital Terrain Model (DTM) were used to mapthe flood extent of the event. These all attest to thefact that GIS and RS techniques have been provento be better alternatives for flood risk mapping.
The aim of this study therefore was to applyAHP and GIS techniques to carry out flood riskassessment of Ofu River catchment in Nigeria.
Materials and Methods
Study area
Ofu River catchment lies between latitudes 6o 46ˈN to 7o 39ˈ N and longitudes 6o 42ˈ E to 7o 21ˈ E(Fig. 1). It falls within the Lower Benue RiverBasin Development Authority covering parts ofDekina, Ofu, Igalamela/Odolu, Idah and IbajiLocal Government Areas (LGAs) in Kogi Stateand Uzo-Uwani Local Government Area in EnuguState, within the humid tropical rain forest ofNigeria (Alfa et al., 2018). It falls within theNigerian Hydrological Zone IVa with meanannual rainfall ranging between 1224 mm and1800 mm (FMW, 2013) concentrated in oneseason lasting from April/May toSeptember/October (AR-AR, 2004).
Figure 1. Map Nigeria showing Ofu River catchment
Application of analytic hierarchy process and geographic information system techniques in flood risk assessment
Journal of Degraded and Mining Lands Management 1365
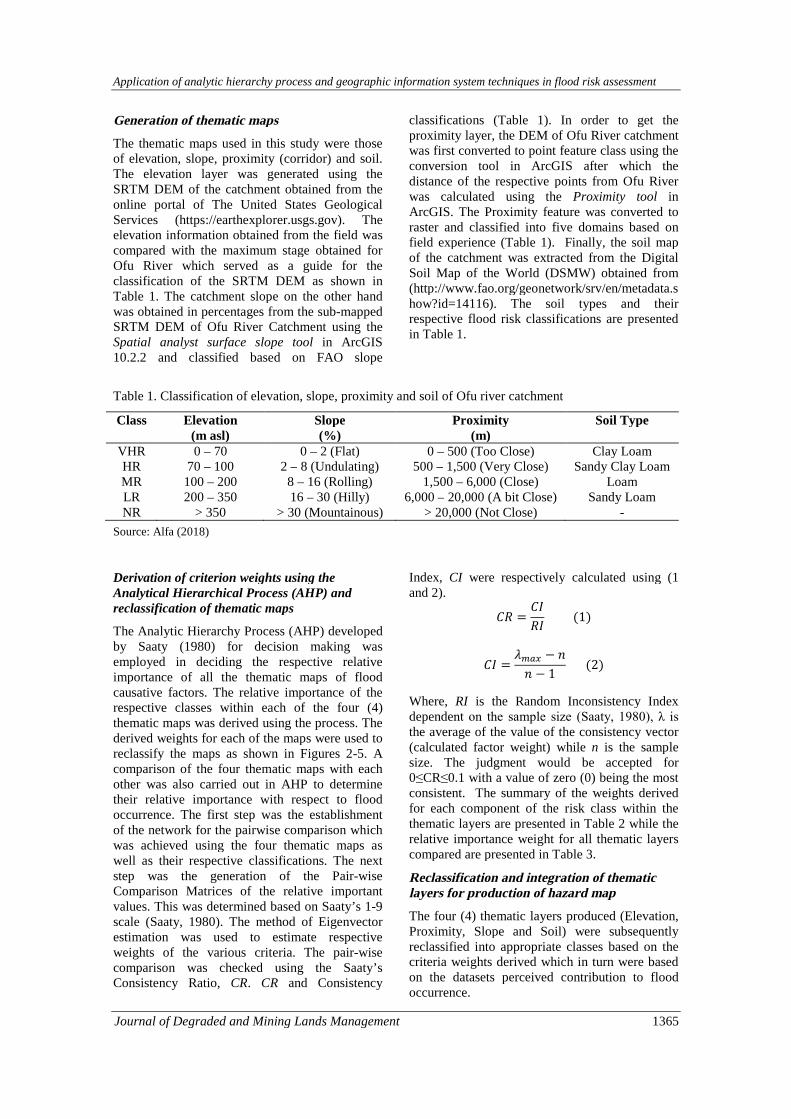
Generation of thematic maps
The thematic maps used in this study were thoseof elevation, slope, proximity (corridor) and soil.The elevation layer was generated using theSRTM DEM of the catchment obtained from theonline portal of The United States GeologicalServices (https://earthexplorer.usgs.gov). Theelevation information obtained from the field wascompared with the maximum stage obtained forOfu River which served as a guide for theclassification of the SRTM DEM as shown inTable 1. The catchment slope on the other handwas obtained in percentages from the sub-mappedSRTM DEM of Ofu River Catchment using theSpatial analyst surface slope tool in ArcGIS10.2.2 and classified based on FAO slope
classifications (Table 1). In order to get theproximity layer, the DEM of Ofu River catchmentwas first converted to point feature class using theconversion tool in ArcGIS after which thedistance of the respective points from Ofu Riverwas calculated using the Proximity tool inArcGIS. The Proximity feature was converted toraster and classified into five domains based onfield experience (Table 1). Finally, the soil mapof the catchment was extracted from the DigitalSoil Map of the World (DSMW) obtained from(http://www.fao.org/geonetwork/srv/en/metadata.show?id=14116). The soil types and theirrespective flood risk classifications are presentedin Table 1.
Table 1. Classification of elevation, slope, proximity and soil of Ofu river catchment
Class Elevation(m asl)
Slope(%)
Proximity(m)
Soil Type
VHR 0 – 70 0 – 2 (Flat) 0 – 500 (Too Close) Clay LoamHR 70 – 100 2 – 8 (Undulating) 500 – 1,500 (Very Close) Sandy Clay LoamMR 100 – 200 8 – 16 (Rolling) 1,500 – 6,000 (Close) LoamLR 200 – 350 16 – 30 (Hilly) 6,000 – 20,000 (A bit Close) Sandy LoamNR > 350 > 30 (Mountainous) > 20,000 (Not Close) -
Source: Alfa (2018)
Derivation of criterion weights using theAnalytical Hierarchical Process (AHP) andreclassification of thematic maps
The Analytic Hierarchy Process (AHP) developedby Saaty (1980) for decision making wasemployed in deciding the respective relativeimportance of all the thematic maps of floodcausative factors. The relative importance of therespective classes within each of the four (4)thematic maps was derived using the process. Thederived weights for each of the maps were used toreclassify the maps as shown in Figures 2-5. Acomparison of the four thematic maps with eachother was also carried out in AHP to determinetheir relative importance with respect to floodoccurrence. The first step was the establishmentof the network for the pairwise comparison whichwas achieved using the four thematic maps aswell as their respective classifications. The nextstep was the generation of the Pair-wiseComparison Matrices of the relative importantvalues. This was determined based on Saaty’s 1-9scale (Saaty, 1980). The method of Eigenvectorestimation was used to estimate respectiveweights of the various criteria. The pair-wisecomparison was checked using the Saaty’sConsistency Ratio, CR. CR and Consistency
Index, CI were respectively calculated using (1and 2).
ܥ =ܫܥ
ܫ(1)
=ܫܥߣ ௫ −
− 1(2)
Where, RI is the Random Inconsistency Indexdependent on the sample size (Saaty, 1980), λ is the average of the value of the consistency vector(calculated factor weight) while n is the samplesize. The judgment would be accepted for0≤CR≤0.1 with a value of zero (0) being the mostconsistent. The summary of the weights derivedfor each component of the risk class within thethematic layers are presented in Table 2 while therelative importance weight for all thematic layerscompared are presented in Table 3.
Reclassification and integration of thematiclayers for production of hazard map
The four (4) thematic layers produced (Elevation,Proximity, Slope and Soil) were subsequentlyreclassified into appropriate classes based on thecriteria weights derived which in turn were basedon the datasets perceived contribution to floodoccurrence.

Application of analytic hierarchy process and geographic information system techniques in flood risk assessment
Journal of Degraded and Mining Lands Management 1366
Table 2. Weights for each risk class within the thematic layers
Elevation Slope Proximity Soil TypeClass Weight Class Weight Class Weight Class WeightVHR 35 Flat 36 Too Close 39 Clay Loam 38HR 31 Undulating 28 Very Close 30 Sandy Clay Loam 29MR 19 Rolling 20 Close 17 Loam 21LR 12 Hilly 12 A bit Close 9 Sandy Loam 13NR 4 Mountainous 4 Not Close 4 - -
Total 100 Total 100 Total 100 Total 100CR 0.00 CR 0.00 CR 0.00 CR 0.00
Table 3. Weights for each risk class within thethematic layers
Thematic Layer WeightElevation 29Proximity 29
Slope 26Soil 16
Total 100CR 0.00
This perception was based on field experience andthe assessment of their respective measures ofassociation with flood occurrence. Thereclassified thematic layers are shown in Figures2-5. The reclassified thematic layers wereintegrated in ArcGIS 10.2.2 to produce the floodHazard map by weighted overlay where eachindividual’s weight was multiplied by the mapscores and the results added.
Figure 2. Reclassified Elevation Layer
Figure 3. Reclassified Proximity Layer
The flood hazard map produced via the previousoperation was then reclassified into five Hazardclasses: ‘Very High Hazard,’ ‘High Hazard,’‘Moderate Hazard,’ ‘Low Hazard’ and ‘NoHazard.
Estimation of vulnerability index andproduction of vulnerability map
Physical and social vulnerability were combinedto derive the Vulnerability Index and vulnerabilitymap for the study area. The Physical vulnerabilitywas derived based on the location of each pointwithin the catchment in respective hazard zones.The area within the ‘Very High Hazard’ zonewere given a score of 5 while those within the‘High Hazard,’ ‘Moderate Hazard,’ ‘Low Hazard’and ‘No Hazard’ zones were respectively givenscores of 4, 3, 2, and 1. The social vulnerabilityon the other hand was derived based on Age,

Application of analytic hierarchy process and geographic information system techniques in flood risk assessment
Journal of Degraded and Mining Lands Management 1367
disability, gender and economic status. Theprocedure for determining social vulnerabilitydeveloped by Cutter et al. (1997) for the SouthCarolina Emergency Preparedness Division wasadopted in this study. The method was developedfor vulnerability assessment at County levelwhich is equivalent to the LGA system in Nigeria,
thus making it appropriate for the present study.Using this method, vulnerability weights for ten(10) social classes were derived (Table 4) afterwhich Saaty’s Analytical Hierarchical Process(Saaty, 1980) was used to rank all thevulnerability categories (Table 5).
Figure 4. Reclassified Slope Layer Figure 5. Reclassified Soil Layer
Table 4. Social vulnerability weights for Ofu River catchment
State LGA Vulnerability Weight*100Under
15 YearsAbove
65 Years15 – 65Years
Poverty Gender
WD ND WD ND WD ND In Pov Ab Pov Male FemaleKogi Dekina 100 100 100 100 100 100 100 100 100 100
Ofu 55 64 55 64 55 64 64 64 64 64Idah 12 10 12 10 12 10 10 10 10 10
Igalamela/Odolu 30 29 30 29 30 29 29 29 30 29Ibaji 24 25 24 25 24 25 25 25 25 25
Enugu Uzo-Uwani 1 1 3 2 2 2 1 1 1 1
The vulnerability classes are WD15 (under 15years with disabilities), ND15 (under 15 yearswith no disabilities, WD65 (above 65 years withdisabilities), ND65 (above 65 years with nodisabilities), WD15_65 (between 15 - 65 yearswith disabilities), ND15_65 (between 15 – 65years with no disabilities), InPov (In pov), AbPov(Above Poverty level), Male and Female. The
Table of vulnerability weights for all socialclasses saved in Comma delimited format (CSV)in Microsoft Excel 2007 was joined to theCatchment shape file divided by LGAs. Therespective weights of the social classes were usedto derive the vulnerability raster surfaces using theconversion (from polygon to raster) tool inArcGIS.

Application of analytic hierarchy process and geographic information system techniques in flood risk assessment
Journal of Degraded and Mining Lands Management 1368
The physical vulnerability and the ten (10) socialvulnerability maps were integrated to produce thefinal flood vulnerability Map. This was doneusing the weighted Sum tool in the SpatialAnalyst Tools in ArcGIS 10.2.2. The weightsderived for each category was used at this pointfor the integration. The final Vulnerability Mapwas first converted to float by dividing by themaximum value using the Raster Calculator inSpatial Analyst (Map Algebra) tool. Thus the finalFlood Vulnerability Map was produced with 1 asthe maximum value. Similar to the hazard map, itwas reclassified into five (5) vulnerability classes:‘Very High Vulnerability’, ‘High Vulnerability’,‘Moderate Vulnerability,’ ‘Low Vulnerability’and ‘No Vulnerability’.
Table 5. Overall weights for all vulnerabilitymaps derived by AHP
Social Class Weight*100WD15 13ND15 12WD65 13ND65 11
WD15_65 10ND15_65 7
Inpov 10Abpov 7Male 7
Female 10Total 100CR 0.00
Production of flood risk map and flood riskassessment
The flood Risk map, Rm was produced as aproduct of the Hazard map, Hm and theVulnerability map Vm (Baas et al., 2008; Eleuterio,2012). The multiplication was done using Rastercalculator in Map Algebra Spatial Analyst tool inArcGIS 10.2.2. The Flood Risk map for 2018 wasthen produced and reclassified into five risk zones(‘Very High Risk’ ‘High Risk,’ ‘Moderate Risk’,‘Low Risk’ and ‘No Risk’) based on naturalbreaks (Cutter et al., 1997). The flood risk rastermap was converted to vector (polygon). The totalland area enclosed by different risk zones wascalculated using the Calculate Geometry tool inthe attribute table of the risk polygon. The floodrisk polygon was also overlaid on the Catchmentshapefile to identify the distribution of therespective risk zones by LGAs. It was alsooverlaid on the Land use/ land cover raster for thecatchment (Alfa et al., 2018) in other to extract
the respective land uses affected by differentdegree of risks.
Assessment of extent of damage of the 1995 and2000 flood events
In order to assess the damage extent (Impact) ofthe 1995 and 2000 flood events which are themost severe in recent history within the studyarea, a cross-sectional study was conductedamong 325 household heads in OforachiCommunity between September and October,2016 using quantitative methods of datacollection. The choice of Oforachi was informedby the fact that it is the only community withinthe ‘Very High Risk’ zone in this study. Allhousehold heads or representatives who havelived in the community for a minimum of 16 yearsand consented to participate in the study wereincluded in the study population, otherwise, theywere excluded. The sample size estimator, aprogram developed by The Research Advisors(2006) for different Population sizes and differentlevels of confidence based on the method (3) ofKrejcie and Morgan (1970) was used to determinethe sample size of 320 which was rounded up to325 for ease of proportionate distribution withinthe respective settlements in the Community.
=ଶ(1 − )
ଶ( − 1) + ଶ(1 − )(3)
Where, n = Sample Size,X2 = the table value of chi-square
for 1 degree of freedom at thedesired confidence level.
N = the population size,P = the population proportion andd = the degree of accuracy
expressed as a proportion.A two part semi structured intervieweradministered questionnaire was used to assess theimpacts of the 1995 and 2000 flood events. Thefirst part contained socio-demographicinformation of the respondents while the secondpart contained questions designed to assess theimpacts of the respective historical flood events.A total of 22 responses (11 positive and elevennegative) were used. The positive responses weregiven a score of 1 while the negative ones weregiven a score of 0. A total score of 0 was regardedas no impact, scores greater than 0 but less than orequal to 2.75 (25%) as low impact, scores greaterthan 2.75 (25%) but less than 5.5 (50%) asmoderate impact, scores greater than 5.5 (50%)but less than or equal to 8.25 (75%) as highimpact while scores greater than 8.25 (75%) wasregarded as very high impact.

Application of analytic hierarchy process and geographic information system techniques in flood risk assessment
Journal of Degraded and Mining Lands Management 1369
Results and Discussion
Flood hazard, vulnerability and risk assessment
The output flood hazard and vulnerability mapsare shown in Figure 6. The hazard map in Figure6 shows that a total of 259.81 km2 was within theVery High Hazard zone, while 269.52 km2,214.10 km2, 552.94 km2 and 298.75 km2 wererespectively in the High, Moderate, Low and NoHazard zones of the catchment. This implies thatthe area with the Very High Hazard zone have avery high potential of being affected by a flooddisaster (Ajin et al., 2013, Daffi et al., 2014). Thevulnerability map in Figure 6 on the other handshows that only 0.78 km2 were at a Very HighVulnerability, while 60.49 km2 was at HighVulnerability. Meanwhile, the Moderate, Low andNo Vulnerability zones cover 208.18 km2, 613.22km2 and 698.05 km2. The vulnerability is often areflection of the exposure, susceptibility andresilience (Balica et al., 2009). The flood riskmap obtained as a product of flood hazard andvulnerability is presented in Figure 7. The detailsof the land area within each risk zone, therespective land cover types within the respectiverisk zones as well as the distribution of the riskzones by LGAs are presented in Tables 6 and 7.
The results presented in Table 6 reveal that 163.07km2 are at a Very High Risk of flood, 392.63 km2
are at a high risk of flood while 116.82 km2,255.27 km2 and 653.70 km2 are at moderate, lowand no risk of flood respectively. The resultfurther shows that built-up area accounts for 36.68% of the Very High Risk zone and 52.35% of theHigh Risk Zone putting 19,034 and 47,652persons at Very High and High Risksrespectively. This calls for serious concern for anemergency mitigative measures as wellestablishment of awareness systems to prevent thecatastrophic effect of this flood disaster.Similarly, Igalamele/Odolu LGA is the most atrisk of flooding within Ofu River catchment. Thisis revealed by the fact that 62.86% and 31.33% ofthe Very High and High Risk zones respectivelyfall within the LGA. It can be seen that Oforachiin Igalamela/Odolu LGA is the only notablecommunity within the Very High Risk zone whileEjule-Ojebe in Ibaji LGA is the only notablecommunity within the High Risk zone. As aresult, an assessment of the impact of the 1995and 2000 flood events which are the most severein recent history was carried out at Oforachi andthe results are presented in Table 8.
Figure 6. Flood hazard and vulnerability maps of Ofu River catchment, Nigeria

Application of analytic hierarchy process and geographic information system techniques in flood risk assessment
Journal of Degraded and Mining Lands Management 1370
Table 6. Land cover and population at varying degree of risk
Risk Class Total Land Land Area by Cover Types (km2) Population Notable CommunitiesArea (km2) Vegetation % Bare Ground % Built-up % at Risk
VHR 163.07 97.54 59.81 5.39 3.31 59.81 36.68 19,034 Oforachi & scattered settlementsHR 392.63 165.98 42.27 19.62 5.00 205.56 52.35 47,652 Ejule-Ojebe & scattered settlementsMR 116.82 65.14 55.76 9.06 7.76 42.19 36.12 13933 Scattered settlementsLR 255.27 157.11 61.55 13.14 5.15 83.24 32.61 44245 Scattered settlementsNR 653.70 367.93 56.28 73.74 11.28 208.11 31.84 91996 Ajaka, Araba, Adiele, Ajieru, Ajiyolo &
scattered settlements
Table 7. Distribution of respective risk zones by LGAs
Risk Class Total Land Land Area by LGAs (km2)Area (km2 Dekina % Ofu % Igalamela/Odolu % Idah % Ibaji % Uzo-Uwani %
VHR 163.07 0.54 0.33 59.60 36.62 102.31 62.86 0.17 0.11 0.13 0.08 0.00 0.00HR 392.63 18.94 4.84 107.03 27.35 122.56 31.33 0.33 0.09 142.40 36.40 0.00 0.00MR 116.82 53.26 45.75 0.29 0.25 56.78 48.77 0.00 0.00 0.55 0.47 5.55 4.77LR 255.27 1.27 0.50 184.46 72.74 0.79 0.31 2.83 1.12 64.01 25.24 0.24 0.10NR 653.70 586.73 90.25 34.04 5.24 29.31 4.51 0.00 0.00 0.00 0.00 0.00 0.00

Application of analytic hierarchy process and geographic information system techniques in flood risk assessment
Journal of Degraded and Mining Lands Management 1371
Figure 7. Flood risk map of Ofu River catchment,Nigeria
Table 8. Impacts of the 1995 and 2000 floodevent in Oforachi community in KogiState
Characteristics Frequency PercentageHave everexperienced floodYes 197 60.62No 128 39.38Total 325 100.00Affected by 1995flood eventYes 126 63.96No 71 36.04Total 197 100.00Impact of 1995flood eventModerate Impact 13 10.32High Impact 113 89.68Total 126 100.00Affected by 2000flood eventYes 189 95.94No 8 04.06Total 197 100.00Impact of 2000flood eventModerate Impact 21 11.11High Impact 168 88.89Total 189 100.00
In agreement with the risk analysis donepreviously, the results in Table 8 show that 113persons representing 89.68% of those affected bythe 1995 flood, 57.36% of all those ever affectedby flood in the community and 34.76% of thetotal households surveyed had high impact of the1995 flood event. The situation is even moreserious with the 2000 flood events. 168 personsrepresenting 88.89% of those affected by the 2000flood event, 85.28% of all those ever affected byflood and 51.69% of the households surveyed. Inboth cases, no loss of lives or physical injury tohumans was recorded. But various degrees oflosses such as building collapse, loss of livestock,loss of crops amongst others were top among thedamages experienced.
Conclusion
This study concludes that about 163 km2 of theentire catchment of Ofu River is at a very highrisk of flood disaster while about 392 km2 is athigh risk of flood disaster. Oforachi inIgalamela/Odolu LGA in Kogi State is the maincommunity at a very high risk of flood within thecatchment of Ofu River. While the very high andhigh risk zones span across the four LGAs thatmake up the catchment, Igalamela/Odolu LGA isthe most at risk of flood disaster accounting forover 62% and 31% of the very high and high riskzones respectively. An appropriate watershedmanagement plan that will include optimummanagement of the flood plains, emergencypreparedness and early warning systems isurgently needed. This is believed will reduce thecurrent high flood impact within the communities.
Acknowledgements
Authors hereby acknowledge the contributions of everystaff of the Department of Civil Engineering, Universityof Jos, Nigeria and the Department of Water Resourcesand Environmental Engineering, Ahmadu BelloUniversity, Zaria, Nigeria for their immensecontribution to the success of this study.
References
Adebayo, A.A. and Oruonye, E.D. 2013. AnAssessment of the effects of the 2012 Floods inTaraba State, Nigeria”, Annual NationalConference, organized by the AssociationHydrological Science University of Agriculture,Abeokuta, Ogun, state, Nigeria, 2013.
Ajin, R., Krishnamurthy, R., Jayaprakash, M. andVinod, P. 2013. Flood hazard assessment ofVamanapuram River Basin, Kerala, India: Anapproach using Remote Sensing & GIS techniques,

Application of analytic hierarchy process and geographic information system techniques in flood risk assessment
Journal of Degraded and Mining Lands Management 1372
Advances in Applied Science Research 4(3): 263-274.
Alfa, M.I. 2018. Flood Risk Assessment of Ofu RiverCatchment in Nigeria. Unpublished PhD research inthe Department of Water Resources andEnvironmental Engineering, Ahmadu BelloUniversity, Zaria, Nigeria.
Alfa, M.I., Ajibike, M.A., Adie, D.B. and Mudiare, O.J.2018. Assessment of the effect of land use/landcover changes on total runoff from Ofu Rivercatchment in Nigeria. Journal of Degraded andMining Lands Management 5(3): 1161-1169.
AR-AR Partnership. 2004. Oforachi Irrigation ProjectContract Documents Volume III: Main ReportPrepared for Lower Benue River BasinDevelopment Authority, Federal Republic ofNigeria (Unpublished).
Balica, S. F., Douben, N. and Wright, N.G. 2009. Floodvulnerability indices at varying spatial scales. Waterscience and Technology 60(10): 2571-2580.
Baas, S., Ramasamy, S., DePryck, J.D. and Battista, F.2008. Disaster risk management systems analysis:A guide book (Vol. 3). Food and AgricultureOrganization of the United Nations.
Cutter, S.L., Mitchell, T.T. and Scott, M.S. 1997.Handbook for Conducting a GIS-Based HazardAssessment at the County Level. Prepared for SouthCarolina Emergency Preparedness Division, Officeof the Adjutant General. Accessed 25/01/2016 fromhttps://www.researchgate.net/publication/257343365_Handbook_for_conducting_a_GIS-based_hazards_assessment_at_a_county_level
Daffi, R.E., Otun, J.A. and Ismail, A. 2014. Floodhazard assessment of river DEP floodplains inNorth-Central Nigeria. International Journal ofWater Resources and Environmental Engineering,6(2), 67-72.
de Brito, M.M. and Evers, M. 2016. Multi-criteriadecision-making for flood risk management: asurvey of the current state of the art. NaturalHazards and Earth System Sciences 16(4): 1019-1033.
Eleuterio, J. 2012. Flood Risk Analysis: Impact ofuncertainty in hazard modelling and vulnerabilityassessments on damage estimations. PhD thesis atthe Augustin Cournot Doctoral School, WaterScience & Environmental Economics, Departmentof Civil Engineering, the University of Strasbourg.
Federal Ministry of Works. 2013. Highway ManualPart I-Design Volume IV: Drainage Design. Abuja.Author
Jeb, D.N. and Aggarwal, S.P. 2008. Flood inundationhazard modeling of the River Kaduna using RemoteSensing and Geographic Information Systems,Journal of Applied Sciences Research 4(12): 1822-1833.
Komolafe, A.A., Adegboyega, S.A.A. and Akinluyi,F.O. 2015. A Review of Flood Risk Analysis inNigeria, American Journal of EnvironmentalSciences 11(3): 157-166.
Krejcie, R.V. and Morgan, D.W. 1970. DeterminingSample Size for Research Activities. Educationaland Psychological Measurement, #30, pp. 607-610
Nwafor, J.C. 2006. Environmental impact assessmentfor sustainable development: the Nigerianperspective. Environment and Development PolicyCentre for Africa (EDPCA).
Obeta, M.C. 2014. Institutional Approach to FloodDisaster Management in Nigeria: Need for aPreparedness Plan, British Journal of AppliedScience & Technology 4(33): 4575-4590.
Ojigi, M.L., Abdulkadir, F.I. and Aderoju, M.O. 2013.Geospatial mapping and analysis of the 2012 flooddisaster in central parts of Nigeria. In 8th NationalGIS Symposium. Dammam. Saudi Arabia (pp.1067-1077).
Olajuyigbe, A.E., Rotowa, O.O. and Durojaye, E. 2012.An assessment of flood hazard in Nigeria: The caseof mile 12, Lagos, Mediterranean Journal of SocialScience 3(2): 367-375.
Saaty, T. 1980. The Analytical Hierachy Process. NewYork. McGraw Hill.
The Research Advisors. 2006. Sample Size Table.http://research-advisors.com