Apple Orchard Road Intersection · PDF file6 Conclusion ... use of current traffic volume...
55
Apple Orchard Road Intersection Assessment Final Report Northumberland County August 2015
Transcript of Apple Orchard Road Intersection · PDF file6 Conclusion ... use of current traffic volume...

Apple Orchard Road Intersection Assessment
Final Report
Northumberland County August 2015

Apple Orchard Road Intersection Assessment
Final Report
August 2015 | 1
Contents
1 Introduction .......................................................................................................................................... 2
1.1 Study Purpose ........................................................................................................................... 2
1.2 Study Methodology .................................................................................................................... 2
1.3 Site Context ............................................................................................................................... 3
1.4 Potential Solutions ..................................................................................................................... 3
2 Existing Conditions .............................................................................................................................. 4
2.1 Traffic Volumes .......................................................................................................................... 4
2.2 Site Visit Observations ............................................................................................................... 5
3 Traffic Operations ................................................................................................................................ 6
3.1 Signal Warrants ......................................................................................................................... 6
3.2 Level of Service and Delay Assessment ................................................................................... 7
4 Safety ................................................................................................................................................... 9
4.1 Collision History ......................................................................................................................... 9
4.2 Site Visit Observations ............................................................................................................... 9
4.3 Potential Impacts of Installing Signals ..................................................................................... 11
4.4 Safety Conclusions .................................................................................................................. 12
5 Recommendations ............................................................................................................................. 13
6 Conclusion ......................................................................................................................................... 15
Tables
Table 3-1: Level of Service Criteria for Two-way Stop Control and All-Way Stop Control ............................ 7
Table 3-2: Synchro Assessment at the Burnham Market Driveway and Apple Orchard Road ..................... 8
Table 3-3: Delay for Vehicles Exiting Burnham Market (seconds) ................................................................ 8
Table 4-1: Site Visit Observations ................................................................................................................. 9
Exhibits
Exhibit 1-1: Burnham Family Farm Market .................................................................................................... 2
Exhibit 1-2: Site Context ................................................................................................................................ 3
Exhibit 2-1: Traffic Volumes – Saturday July 18th, 2015 ................................................................................ 4
Exhibit 2-2: Traffic Volumes – Wednesday, July 22nd
, 2015 ......................................................................... 5
Exhibit 3-1: Traffic Signal Warrants – Data from Saturday, July 18th ............................................................ 6
Exhibit 3-2: Traffic Signal Warrants – Data from Wednesday, July 22nd
....................................................... 6
Exhibit 5-1: Proposed Upgrades at Burnham Market .................................................................................. 14
Appendices Appendix A: Traffic Counts Appendix C: Synchro Reports Appendix B: OTM Traffic Signal Warrants

Apple Orchard Road Intersection Assessment Final Report
2 | August 2015
1 Introduction
1.1 Study Purpose
The purpose of this study is to assess whether the existing intersection of County Road 2 and
Apple Orchard Road / Bob Carr Road should be upgraded (with features such as traffic signals or
a roundabout) to improve access to the minor street and the Burnham Family Farm Market.
One of the key advantages of upgrading the intersection controls would be to improve access to the
Burnham Family Farm Market (see Exhibit 1-1); this, however, would also require that the Burnham
Family Farm Market driveway on County Road 2 be closed, with all site traffic diverted to Apple
Orchard Road as recommended in the Draft Environmental Study Report for County Road 2. The
Burnham Family Farm Market is located at the northeast corner of County Road 2 and Apple Orchard
Road / Bob Carr Road. The Market is generally open from May to December, from 9 AM to 6 PM from
Monday to Saturday, and from 10 AM to 5 PM on Sundays.
Exhibit 1-1: Burnham Family Farm Market
1.2 Study Methodology
Installation of traffic signals or roundabouts does not always result in improved operations or safer conditions. Therefore this assessment considers the opportunity to improve the intersection based on both the operational considerations as well as safety. The assessment has been completed with the use of current traffic volume data, historical collision data, and site observations.
Apple Orchard Road Intersection Assessment
Final Report
August 2015 | 3
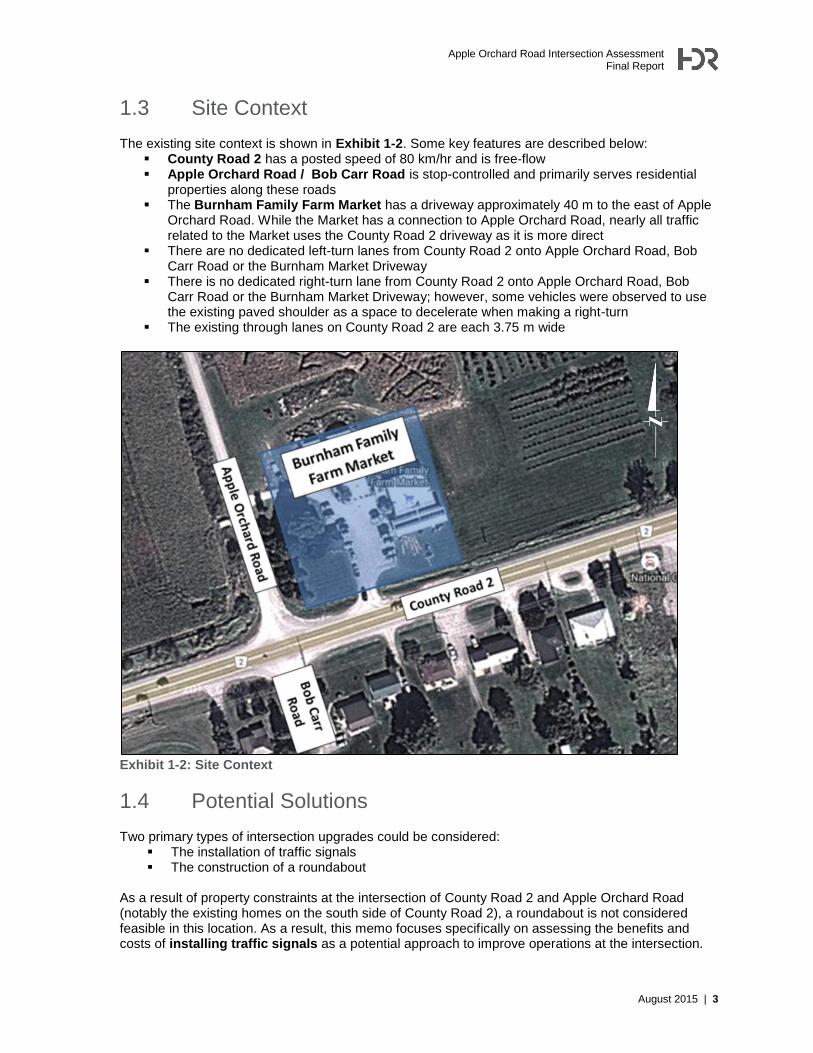
1.3 Site Context
The existing site context is shown in Exhibit 1-2. Some key features are described below: County Road 2 has a posted speed of 80 km/hr and is free-flow Apple Orchard Road / Bob Carr Road is stop-controlled and primarily serves residential
properties along these roads The Burnham Family Farm Market has a driveway approximately 40 m to the east of Apple
Orchard Road. While the Market has a connection to Apple Orchard Road, nearly all traffic related to the Market uses the County Road 2 driveway as it is more direct
There are no dedicated left-turn lanes from County Road 2 onto Apple Orchard Road, Bob Carr Road or the Burnham Market Driveway
There is no dedicated right-turn lane from County Road 2 onto Apple Orchard Road, Bob Carr Road or the Burnham Market Driveway; however, some vehicles were observed to use the existing paved shoulder as a space to decelerate when making a right-turn
The existing through lanes on County Road 2 are each 3.75 m wide
Exhibit 1-2: Site Context
1.4 Potential Solutions
Two primary types of intersection upgrades could be considered: The installation of traffic signals The construction of a roundabout
As a result of property constraints at the intersection of County Road 2 and Apple Orchard Road (notably the existing homes on the south side of County Road 2), a roundabout is not considered feasible in this location. As a result, this memo focuses specifically on assessing the benefits and costs of installing traffic signals as a potential approach to improve operations at the intersection.

Apple Orchard Road Intersection Assessment Final Report
4 | August 2015
2 Existing Conditions
2.1 Traffic Volumes
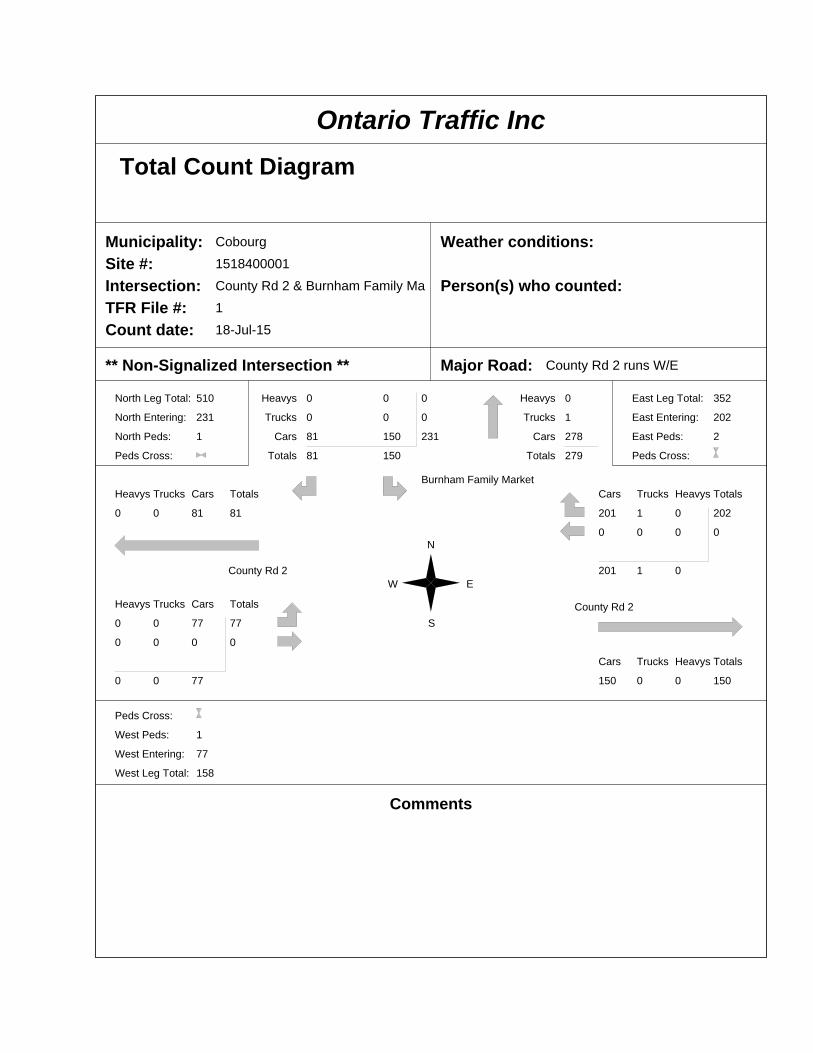
HDR commissioned traffic counts on two separate days in July 2015, which is a peak month for
activity at the Burnham Family Farm Market. The traffic counts were conducted on the following
dates:
Saturday, July 18th, 2015 from 10 AM to 6 PM (total of 6 hours of data collected during this
timeframe)
Wednesday, July 22nd
, 2015 from 10 AM to 6 PM (total of 7 hours of data collected during this
timeframe)
These traffic count volumes were validated by spot counts completed by HDR during a site visit on
Saturday, July 25th between 11 AM and 1 PM. The traffic count data is provided in Appendix A.
A summary of the traffic volumes are illustrated in Exhibit 2-1 and Exhibit 2-2.
Exhibit 2-1: Traffic Volumes – Saturday July 18th
, 2015

Apple Orchard Road Intersection Assessment
Final Report
August 2015 | 5
Exhibit 2-2: Traffic Volumes – Wednesday, July 22nd
, 2015
2.2 Site Visit Observations
Traffic operations were observed at the intersections of Apple Orchard Road / County Road 2 and the
Burnham Market Driveway / County Road 2 during a site visit on Saturday, July 25th, 2015:
Free flow traffic operations were observed along County Road 2
Very low traffic volumes were observed at the intersection of Apple Orchard Road / County
Road 2
Exiting vehicle queues within the Burnham Market driveway did not exceed 2 vehicles at any
point during the observation period
The maximum queue behind a vehicle making a left-turn into Burnham Market from County
Road 2 did not exceed 4 vehicles; because there is no existing dedicated left-turn lane on
County Road 2, through vehicles must wait behind vehicles waiting to turn left
The intersections were generally observed to operate well
Quantitative measurements of delay were collected and are provided in Section 3.2
Additional observations are provided in Section 4.2

Apple Orchard Road Intersection Assessment Final Report
6 | August 2015
3 Traffic Operations
3.1 Signal Warrants
Traffic signal warrants from the Ontario Traffic Manual (OTM) were applied using the data from the
July 2015 traffic counts. A complete 8 hour traffic volume profile is required for the warrants. This was
developed by interpolating the traffic volumes for some hours of the day based on the data provided
in these counts. Traffic volumes at the Burnham Market driveway were reassigned to Apple Orchard
Road to simulate how a signal would operate at a consolidated access (i.e. if the Burnham Market
driveway was re-located to Apple Orchard Road). The results of the warrant for the Saturday and
Wednesday data are shown in Exhibit 3-1 and Exhibit 3-2, respectively.
Exhibit 3-1: Traffic Signal Warrants – Data from Saturday, July 18th
Exhibit 3-2: Traffic Signal Warrants – Data from Wednesday, July 22nd

Apple Orchard Road Intersection Assessment
Final Report
August 2015 | 7
As shown, the signal warrants are not justified based on this data. It is the minor road traffic volume
and delay (i.e. the volumes and delay on Apple Orchard Road) which do not meet the criteria for
justification. Sensitivity testing was undertaken to assess how the volumes would need to change in
order to warrant signals:
If all of the Saturday volumes were increased by a factor of 1.75, the 4-hour volume warrant
would be 98% satisfied
If all of the weekday volumes were increased by a factor of 2.0, the 4-hour volume warrant
would be 98% satisfied
The traffic volumes would need to be substantially higher to satisfy the signal warrants; therefore, even accounting for potential fluctuations in traffic volumes between different days of the week or months of the year, it is unlikely that signals would be warranted at this time.
3.2 Level of Service and Delay Assessment
The peak hour volumes from the traffic counts were used to model delays and Level of Service in Synchro based on the existing lane configuration and traffic control. Level of service (LOS) is a term used to qualitatively describe the driver experience, primarily based on delay. The LOS of a facility is designated with a letter, A to F, with A representing the best operating conditions and F the worst. Level of service criteria differs for unsignalized and signalized intersections since driver perception differs depending on the mode of control.
Table 3-1 show the levels of service for Two-way Stop Control and All-Way Stop Control intersections as per the Highway Capacity Manual (HCM 2000).
Table 3-1: Level of Service Criteria for Two-way Stop Control and All-Way Stop Control
Level of Service
Description Delay (s)
A Free-flow conditions with unimpeded maneuverability. ≤ 10
B Reasonably unimpeded operations with slightly restricted maneuverability. Stopped delays are not bothersome.
> 10 and ≤ 15
C Stable operations > 15 and ≤ 25
D Approaching unstable operations > 25 and ≤ 35
E Operations with significant intersection approach delays > 35 and ≤ 50
F Operations with extremely low speeds caused by intersection congestion, and high delay
> 50
The delay and Level of Service results for Apple Orchard Road and the Burnham Market driveway
are presented in Table 3-2.

Apple Orchard Road Intersection Assessment Final Report
8 | August 2015
Table 3-2: Synchro Assessment at the Burnham Market Driveway and Apple Orchard Road
Burnham Market Driveway Apple Orchard Road
Saturday Peak Hour
Wednesday Peak Hour
Saturday Peak Hour
Wednesday Peak Hour
Southbound Approach Delay (seconds)
17.9 18.9 16.1 21.6
Southbound Approach Level of Service
C C C C
Intersection Average Delay (seconds)
1.3 0.9 0.3 0.3
Intersection Level of Service
A A A A
The Synchro results indicate that the intersection is operating well; therefore, signalization would not
be required to address any operational concerns.
Delay data for vehicles exiting Burnham Market was also measured during the site visit on Saturday,
July 25th. The time that each vehicle had to wait before making either a left-turn or a right-turn out of
the driveway was measured over the course of one hour; the results are summarized in Table 3-3.
These results are generally consistent with the results modeled in Synchro.
Table 3-3: Delay for Vehicles Exiting Burnham Market (seconds)
Delays in Seconds Right Turn Out Left Turn Out
Minimum 0 0
Median 1 9
Average 3 18
85th Percentile 11 29
Max 14 100
Count 18 41
Key findings include:
Vehicles are generally able to make a right-turn out of Burnham Market with minimal delay
(average delay of 3 seconds)
There is more variability in delays for left-turns out of Burnham Market: while some vehicles
exit immediately with no delay, one vehicle had to wait 100 seconds before completing the
turn due to a lack of available gaps in through-traffic along County Road 2
The average delay for left-turns out of Burnham Market was 18 seconds (level of service C),
which is an acceptable level of delay and is consistent with the Synchro results. The 85th
percentile delay was 29 seconds, which translates to level of service D. Level of service D
indicates that operations can be monitored but that improvements are not currently
necessary.
In conclusion, the existing delays at the Burnham Market driveway and at Apple Orchard Road are
and will continue to be acceptable and do not justify the installation of a new signal.
Apple Orchard Road Intersection Assessment
Final Report
August 2015 | 9
4 Safety This section includes a review of the collision history, site visit observations, and theoretical findings about the impacts of installing signals.
4.1 Collision History
Safety records at the intersection of County Road 2 and Apple Orchard Road and Burnham Market have been reviewed. The following key trends were identified:
A total of 8 collisions between 2002 and 2014 were recorded at the following 3 locations: o County Road 2 and Apple Orchard Road (6 collisions) o County Road 2 and Bob Carr Road (1 collision) o County Road 2 and Burnham Market (1 collision)
Due to the close proximity of Apple Orchard Road to the Burnham Market driveway, it is possible that some collisions related to the Burnham Market were recorded as occurring at Apple Orchard Road
Four of the eight collisions occurred either outside of the Market’s operating hours, or in a month when the Market is not open (January to April)
All 8 collisions were classified as “Property Damage Only”; no “Injury” or “Fatal” collisions were recorded
The collision types are summarized below:
Collision Type Total Number of
Collisions Collisions that may be
Related to Burnham Market*
Angle 2 0
Rear-End 4 3
Sideswipe 1 0
Single Motor Vehicle 1 1
Total 8 4
*Collision occurred between 9 AM and 6 PM, from May to December
The one collision that was specifically listed as occurring at “Burnham Market” was classified as a rear-end collision, resulting from a vehicle following too close
Based on this assessment, there is not a clear pattern of collisions either at the intersection of Apple Orchard Road, or related to traffic entering or exiting Burnham Market.
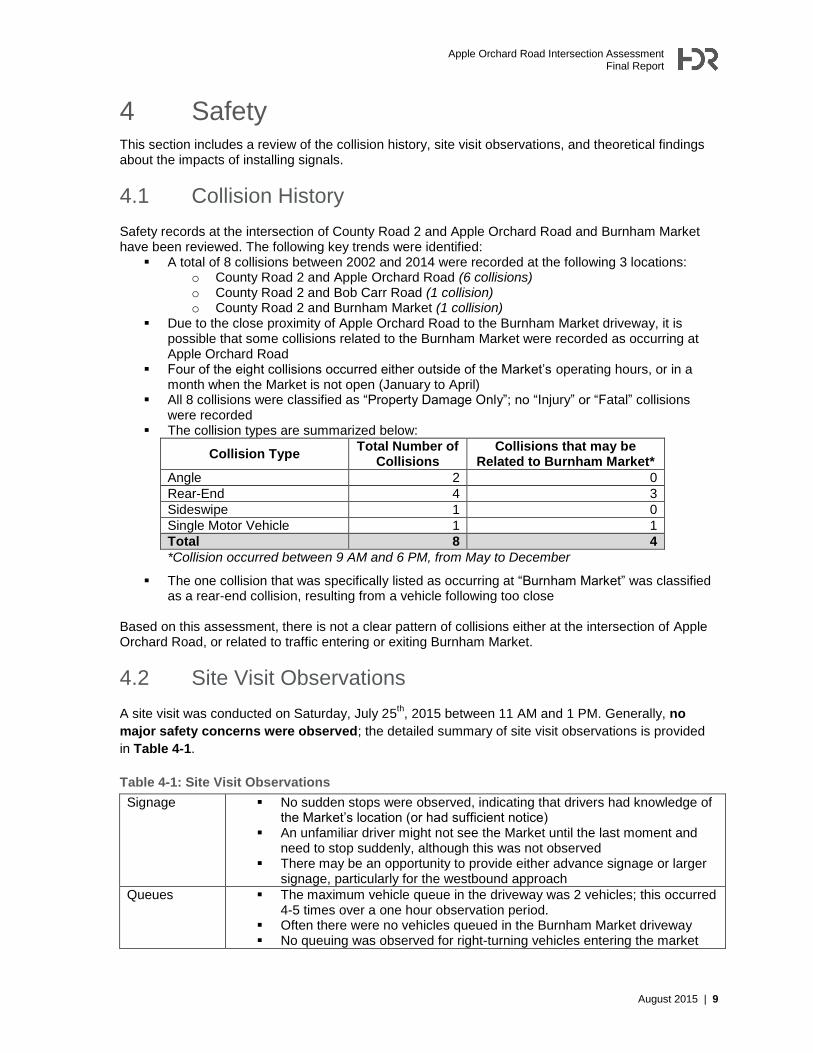
4.2 Site Visit Observations
A site visit was conducted on Saturday, July 25th, 2015 between 11 AM and 1 PM. Generally, no
major safety concerns were observed; the detailed summary of site visit observations is provided
in Table 4-1.
Table 4-1: Site Visit Observations
Signage No sudden stops were observed, indicating that drivers had knowledge of the Market’s location (or had sufficient notice)
An unfamiliar driver might not see the Market until the last moment and need to stop suddenly, although this was not observed
There may be an opportunity to provide either advance signage or larger signage, particularly for the westbound approach
Queues
The maximum vehicle queue in the driveway was 2 vehicles; this occurred 4-5 times over a one hour observation period.
Often there were no vehicles queued in the Burnham Market driveway No queuing was observed for right-turning vehicles entering the market

Apple Orchard Road Intersection Assessment Final Report
10 | August 2015
The maximum queue of vehicles turning left into Burnham Market was 4; this occurred once (only the first vehicle was turning left into the market). As vehicles must stop in the live lane of traffic, this is a potential safety concern.
Vehicles would sometimes use the shoulder to pass a vehicle waiting to turn left into the Market
Pavement Markings
No deficiencies observed – all pavement markings are clear and in good condition
Presence of Gaps
Gaps were observed, providing vehicles with opportunities to turn into and out of the driveway
Results of delay analysis are shown in Section 3.2
Risky Driving Behaviour
Two risky driving maneuvers were observed, neither of which was related specifically to market traffic:
o One vehicle passed another on the left in the WB direction, across a solid line
o One vehicle made a U-Turn EB to WB in the intersection of CR2 and Apple Orchard.
Driver Frustration
Driver frustration was not generally observed; County Road 2 flowed well, so drivers may feel more patient when making turns onto County Road 2.
One driver was observed to make a right-turn after waiting 48 seconds to make a left-turn
Reaction Time Drivers were observed to turn with safe gaps
Sight Lines Sightlines are clear in both directions (refer to Exhibit 4-1 and Exhibit 4-2)
Acceleration / Deceleration
Drivers would generally decelerate in advance of the turn into the market, and accelerate gradually when exiting the market.
Conflicts between Apple Orchard Road and Burnham Market Driveway
No issues observed. Low vehicle volumes were observed on Bob Carr Road / Apple Orchard
Road, so there is very low potential for conflicts
Pedestrians and Cyclists
No pedestrian activity was observed Cyclist volumes were low (2 cyclists per hour)
Vehicle Types Most vehicles were sedans, SUV’s or pick-up trucks No tractor trailers were observed during the observations.

Apple Orchard Road Intersection Assessment
Final Report
August 2015 | 11
Exhibit 4-1: Sight Lines to the West of Burnham Market
Exhibit 4-2: Sight Lines to the East of Burnham Market

Apple Orchard Road Intersection Assessment Final Report
12 | August 2015
4.3 Potential Impacts of Installing Signals
Installing traffic signals does not necessarily improve safety conditions at intersections. Rather, the safety benefit of installing signals depends upon multiple context-specific factors such as existing geometric conditions at the intersection, traffic patterns, vehicle speeds, presence of pedestrians and vehicle volumes. The primary safety benefit provided by the installation of signals is the reduction in the number of angle collisions (which can be the most severe type of collision). At this location, angle collisions could occur if a vehicle making a left-turn out of Burnham Market is struck by an oncoming vehicle on County Road 2. Signals may also, however, increase the number of rear-end collisions at an intersection. As mentioned, there is no observable pattern in the collision history and it does not appear that installation of a traffic signal would have prevented the historic collisions from occurring. Unwarranted signals may increase overall congestion which can encourage drivers to behave more aggressively (i.e. running through a red light because there is no oncoming traffic). A publication by the Ohio Department of Transportation
1 states that “Intersections with signals that have very low
traffic volumes tend to tempt drivers and pedestrians to violate that red light.” A publication by the United States Federal Highways Administration (FHWA)
2 adds that “adding traffic signals would not
necessarily increase safety at an intersection … in some cases, especially when the traffic signals do not seem to be needed, some drivers may begin to ignore them or run yellow lights in an attempt to avoid delays”. A separate FHWA publication
3 regarding the removal of unwarranted signals notes that a 2005 study
reported that “removing unwarranted signals may result in a 24% decrease in all crashes, a 53% decrease in injury crashes, a 24% decrease in right-angle crashes and a 29% decrease in rear-end crashes.” In conclusion, signals do not necessarily increase the safety of an intersection and unwarranted signals can ultimately decrease the safety of the intersection.
4.4 Safety Conclusions
In conclusion, neither the site visit observations nor the review of collision data indicated any
particular safety concerns at this intersection. Additionally, unwarranted signals can decrease safety
conditions, particularly at intersections where there is not a history of angle collisions. Therefore, the
installation of signals is not expected to be beneficial from a safety perspective at the intersection of
County Road 2 and Apple Orchard Road.
1 https://www.dot.state.oh.us/districts/D01/PlanningPrograms/trafficstudies/Documents/Intersection-Safety-myth-versus-reality.pdf
2 http://safety.fhwa.dot.gov/intersection/resources/fhwasa09027/resources/Iowa%20Traffic%20and %20Safety%20FS-%20Unsignalized%20Intersections.pdf
3 http://safety.fhwa.dot.gov/intersection/resources/intsafestratbro/sa7_remove_unwarranted_signal.pdf

Apple Orchard Road Intersection Assessment
Final Report
August 2015 | 13
5 Recommendations Based on the assessment, intersection upgrades (i.e. signalization or a roundabout) are not
recommended at the intersection of County Road 2 and Apple Orchard Road for the following
reasons:
Traffic volumes at the Burnham Market driveway and on Apple Orchard Road are generally
low, and the signal warrants are not satisfied.
There is not a history of high numbers of collisions at the intersection; additionally, the
addition of signals would not have necessarily prevented many of the collisions that occurred
Major safety or congestion issues were not observed during a site visit which took place
during a higher volume period (between 11 AM and 1 PM on Saturday, July 27th, 2015).
The signals would primarily serve one business (the Burnham Family Farm Market) which is
generally open from May to December each year; therefore, the signals would not be needed
about one third of the year (January to April)
At present, Northumberland County is not aware of any planned developments along Bob
Carr Road or Apple Orchard Road that would increase background traffic beyond existing
conditions
Installing unwarranted signals is not recommended for the following reasons:
Safety at the intersection may decrease: there may be an increase in rear-end collisions, or
vehicles may drive more aggressively (i.e. running yellow or red lights)
Increased delay and reduction in traffic flow for vehicles traveling along County Road 2: when
the signal turns red on County Road 2, all vehicles must wait.
Additional cost to Northumberland County, representing sub-optimal allocation of resources;
allocating resources to a sub-optimal initiative results in fewer available resources for more
critical County investments
Reduction in air quality, as a result of forcing more vehicles to stop and idle at the signals
Potential vehicle diversion / traffic infiltration to other roads, where there are fewer signals
and less delay
While new signals are not recommended, the County Road 2 Environmental Assessment does
propose the following upgrades that will improve access to the Burnham Market:
Re-location of Burnham Market access onto Apple Orchard Road, to consolidate access onto
County Road 2. This will improve safety by reducing conflicting turning movements between
Apple Orchard Road and the Burnham Market driveway
Provision of a dedicated southbound right turn lane on Apple Orchard Road will improve
operations by reducing queuing: vehicles will be able to make a southbound right-turn even
while vehicles are queuing to make a southbound left-turn. Additionally, there will not be
queuing within the Burnham Market driveway.
Introduction of continuous central left-turn lane which will facilitate left-turns to and from Apple
Orchard Road. Vehicles making a left-turn onto Apple Orchard Road en route to Burnham
Market will be able to wait in the dedicated lane, with less risk of rear-end collisions from
following through traffic.

Apple Orchard Road Intersection Assessment Final Report
14 | August 2015
These improvements are illustrated in Exhibit 5-1.
Exhibit 5-1: Proposed Upgrades at Burnham Market

Apple Orchard Road Intersection Assessment
Final Report
August 2015 | 15
6 Conclusion In conclusion, upgrades to the traffic control at the intersection of County Road 2 and Apple Orchard Road (such as signalization) are not recommended at this time based on the traffic volumes and delays. Burnham Family Farm Market may wish to consider larger signage, which can provide advance notice for new visitors and also increase driver awareness of the potential for vehicles turning in and out of the parking lot. It is also recommended that Northumberland County continue to monitor operations at the intersection and consult with Burnham Market on operations and safety. For example, any expansion to the size of the Burnham Market and/or parking lot could warrant additional analysis. In the future, upgrades to the intersection such as signalization can be completed by the County outside of a Class Environmental Assessment.

Appendix A
Traffic Counts

Ontario Traffic IncMorning Peak Diagram Specified Period
From:To:
10:00:0018:00:00
One Hour PeakFrom:To:
11:00:0012:00:00
Municipality:Site #:Intersection:TFR File #:Count date:
Cobourg1518400001County Rd 2 & AppleOrchard Rd918-Jul-15
Weather conditions:
Person(s) who counted:
** Non-Signalized Intersection ** Major Road: County Rd 2 runs W/E
North Leg Total:
North Entering:
North Peds:
Peds Cross:
17
11
0
Heavys
Trucks
Cars
Totals
0
0
5
5
0
0
0
0
0
0
6
6
0
0
11
Heavys
Trucks
Cars
Totals
0
0
6
6
Heavys Trucks Cars Totals
0 7 409 416
Heavys Trucks Cars Totals
0 0 3 3
0 4 434 438
0 0 0 0
0 4 437
Peds Cross:
West Peds:
West Entering:
West Leg Total:
0
441
857
AppleOrchard Rd
County Rd 2W
N
E
SCounty Rd 2
Bob Carr Rd
East Leg Total:
East Entering:
East Peds:
Peds Cross:
862
415
0
Cars Trucks Heavys Totals
3 0 0 3
403 7 0 410
2 0 0 2
408 7 0
Cars Trucks Heavys Totals
443 4 0 447
Cars
Trucks
Heavys
Totals
2
0
0
2
Cars
Trucks
Heavys
Totals
1
0
0
1
0
0
0
0
3
0
0
3
4
0
0
Peds Cross:
South Peds:
South Entering:
South Leg Total:
0
4
6
Comments

Ontario Traffic IncTotal Count Diagram
Municipality:Site #:Intersection:TFR File #:Count date:
Cobourg1518400001County Rd 2 & AppleOrchard Rd918-Jul-15
Weather conditions:
Person(s) who counted:
** Non-Signalized Intersection ** Major Road: County Rd 2 runs W/E
North Leg Total:
North Entering:
North Peds:
Peds Cross:
87
52
2
Heavys
Trucks
Cars
Totals
0
1
18
19
0
0
1
1
0
0
32
32
0
1
51
Heavys
Trucks
Cars
Totals
0
0
35
35
Heavys Trucks Cars Totals
0 27 2334 2361
Heavys Trucks Cars Totals
0 0 15 15
0 29 2238 2267
0 0 8 8
0 29 2261
Peds Cross:
West Peds:
West Entering:
West Leg Total:
3
2290
4651
AppleOrchard Rd
County Rd 2W
N
E
SCounty Rd 2
Bob Carr Rd
East Leg Total:
East Entering:
East Peds:
Peds Cross:
4673
2368
1
Cars Trucks Heavys Totals
20 0 0 20
2314 26 0 2340
8 0 0 8
2342 26 0
Cars Trucks Heavys Totals
2276 29 0 2305
Cars
Trucks
Heavys
Totals
17
0
0
17
Cars
Trucks
Heavys
Totals
2
0
0
2
0
0
0
0
6
0
0
6
8
0
0
Peds Cross:
South Peds:
South Entering:
South Leg Total:
1
8
25
Comments

Ontario Traffic IncTraffic Count Summary
Intersection: County Rd 2 & AppleOrchard Rd Count Date: 18-Jul-15 Municipality: CobourgNorth Approach Totals South Approach Totals
East Approach Totals West Approach Totals
Includes Cars, Trucks, & Heavys Includes Cars, Trucks, & Heavys
Includes Cars, Trucks, & Heavys Includes Cars, Trucks, & Heavys
Hour Hour
Hour Hour
Ending Ending
Ending Ending
Left Left
Left Left
Thru Thru
Thru Thru
Right Right
Right Right
Grand Grand
Grand Grand
Total Total
Total Total
Total Total
Total Total
Peds Peds
Peds Peds
North/South
East/West
Total
Total
Approaches
Approaches
Calculated Values for Traffic Crossing Major StreetHours Ending:Crossing Values:
Totals:
Totals:
10:00:00 0 0 0 0 0 0 10:00:00 0 0 0 0 011:00:00 12 0 5 17 0 17 11:00:00 0 0 0 0 012:00:00 6 0 5 11 0 15 12:00:00 1 0 3 4 013:00:00 0 0 0 0 0 0 13:00:00 0 0 0 0 014:00:00 3 0 4 7 1 7 14:00:00 0 0 0 0 115:00:00 5 1 1 7 0 9 15:00:00 1 0 1 2 016:00:00 0 0 0 0 0 0 16:00:00 0 0 0 0 017:00:00 3 0 2 5 1 6 17:00:00 0 0 1 1 018:00:00 3 0 2 5 0 6 18:00:00 0 0 1 1 0
10:00:00 0 0 0 0 0 0 10:00:00 0 0 0 0 011:00:00 1 388 6 395 0 784 11:00:00 1 386 2 389 112:00:00 2 410 3 415 0 856 12:00:00 3 438 0 441 013:00:00 0 0 0 0 0 0 13:00:00 0 0 0 0 014:00:00 1 416 3 420 0 808 14:00:00 4 381 3 388 015:00:00 2 397 1 400 0 837 15:00:00 2 435 0 437 216:00:00 0 0 0 0 0 0 16:00:00 0 0 0 0 017:00:00 2 406 4 412 1 756 17:00:00 3 340 1 344 018:00:00 0 321 3 324 0 613 18:00:00 2 287 0 289 0
11:00 12:00 13:00 14:00 15:00 16:00 17:00 18:0013 7 0 3 9 0 4 3
32 1 19 52 2 60 2 0 6 8 1
8 2338 20 2366 1 4654 15 2267 6 2288 3

Ontario Traffic IncCount Date: 18-Jul-15 Site #: 1518400001
IntervalTime
Passenger Cars - North Approach Trucks - North Approach Heavys - North Approach Pedestrians
Left Left LeftThru Thru ThruRight Right Right North Cross
Cum Cum Cum Cum Cum Cum Cum Cum Cum CumIncr Incr Incr Incr Incr Incr Incr Incr Incr Incr10:00:00 0 0 0 0 0 0 0 0 0 0 0 0 0 0 0 0 0 0 0 010:15:00 3 3 0 0 1 1 0 0 0 0 0 0 0 0 0 0 0 0 0 010:30:00 3 0 0 0 1 0 0 0 0 0 0 0 0 0 0 0 0 0 0 010:45:00 8 5 0 0 3 2 0 0 0 0 0 0 0 0 0 0 0 0 0 011:00:00 12 4 0 0 5 2 0 0 0 0 0 0 0 0 0 0 0 0 0 011:15:00 13 1 0 0 8 3 0 0 0 0 0 0 0 0 0 0 0 0 0 011:30:00 15 2 0 0 8 0 0 0 0 0 0 0 0 0 0 0 0 0 0 011:45:00 16 1 0 0 10 2 0 0 0 0 0 0 0 0 0 0 0 0 0 012:00:00 18 2 0 0 10 0 0 0 0 0 0 0 0 0 0 0 0 0 0 012:15:00 18 0 0 0 10 0 0 0 0 0 0 0 0 0 0 0 0 0 0 012:30:00 18 0 0 0 10 0 0 0 0 0 0 0 0 0 0 0 0 0 0 012:45:00 18 0 0 0 10 0 0 0 0 0 0 0 0 0 0 0 0 0 0 013:00:00 18 0 0 0 10 0 0 0 0 0 0 0 0 0 0 0 0 0 0 013:15:00 19 1 0 0 12 2 0 0 0 0 0 0 0 0 0 0 0 0 0 013:30:00 19 0 0 0 12 0 0 0 0 0 0 0 0 0 0 0 0 0 0 013:45:00 20 1 0 0 13 1 0 0 0 0 0 0 0 0 0 0 0 0 0 014:00:00 21 1 0 0 14 1 0 0 0 0 0 0 0 0 0 0 0 0 1 114:15:00 23 2 0 0 14 0 0 0 0 0 0 0 0 0 0 0 0 0 1 014:30:00 24 1 1 1 14 0 0 0 0 0 1 1 0 0 0 0 0 0 1 014:45:00 26 2 1 0 14 0 0 0 0 0 1 0 0 0 0 0 0 0 1 015:00:00 26 0 1 0 14 0 0 0 0 0 1 0 0 0 0 0 0 0 1 015:15:00 26 0 1 0 14 0 0 0 0 0 1 0 0 0 0 0 0 0 1 015:30:00 26 0 1 0 14 0 0 0 0 0 1 0 0 0 0 0 0 0 1 015:45:00 26 0 1 0 14 0 0 0 0 0 1 0 0 0 0 0 0 0 1 016:00:00 26 0 1 0 14 0 0 0 0 0 1 0 0 0 0 0 0 0 1 016:15:00 26 0 1 0 15 1 0 0 0 0 1 0 0 0 0 0 0 0 2 116:30:00 28 2 1 0 15 0 0 0 0 0 1 0 0 0 0 0 0 0 2 016:45:00 29 1 1 0 16 1 0 0 0 0 1 0 0 0 0 0 0 0 2 017:00:00 29 0 1 0 16 0 0 0 0 0 1 0 0 0 0 0 0 0 2 017:15:00 30 1 1 0 16 0 0 0 0 0 1 0 0 0 0 0 0 0 2 017:30:00 30 0 1 0 17 1 0 0 0 0 1 0 0 0 0 0 0 0 2 017:45:00 31 1 1 0 17 0 0 0 0 0 1 0 0 0 0 0 0 0 2 018:00:00 32 1 1 0 18 1 0 0 0 0 1 0 0 0 0 0 0 0 2 018:15:00 32 0 1 0 18 0 0 0 0 0 1 0 0 0 0 0 0 0 2 018:15:34 32 0 1 0 18 0 0 0 0 0 1 0 0 0 0 0 0 0 2 0

Ontario Traffic IncCount Date: 18-Jul-15 Site #: 1518400001
IntervalTime
Passenger Cars - East Approach Trucks - East Approach Heavys - East Approach Pedestrians
Left Left LeftThru Thru ThruRight Right Right East Cross
Cum Cum Cum Cum Cum Cum Cum Cum Cum CumIncr Incr Incr Incr Incr Incr Incr Incr Incr Incr10:00:00 0 0 0 0 0 0 0 0 0 0 0 0 0 0 0 0 0 0 0 010:15:00 0 0 72 72 3 3 0 0 2 2 0 0 0 0 0 0 0 0 0 010:30:00 0 0 162 90 3 0 0 0 3 1 0 0 0 0 0 0 0 0 0 010:45:00 1 1 272 110 4 1 0 0 6 3 0 0 0 0 0 0 0 0 0 011:00:00 1 0 381 109 6 2 0 0 7 1 0 0 0 0 0 0 0 0 0 011:15:00 1 0 469 88 6 0 0 0 8 1 0 0 0 0 0 0 0 0 0 011:30:00 2 1 577 108 6 0 0 0 9 1 0 0 0 0 0 0 0 0 0 011:45:00 2 0 684 107 8 2 0 0 11 2 0 0 0 0 0 0 0 0 0 012:00:00 3 1 784 100 9 1 0 0 14 3 0 0 0 0 0 0 0 0 0 012:15:00 3 0 784 0 9 0 0 0 14 0 0 0 0 0 0 0 0 0 0 012:30:00 3 0 784 0 9 0 0 0 14 0 0 0 0 0 0 0 0 0 0 012:45:00 3 0 784 0 9 0 0 0 14 0 0 0 0 0 0 0 0 0 0 013:00:00 3 0 784 0 9 0 0 0 14 0 0 0 0 0 0 0 0 0 0 013:15:00 3 0 879 95 9 0 0 0 14 0 0 0 0 0 0 0 0 0 0 013:30:00 3 0 980 101 9 0 0 0 16 2 0 0 0 0 0 0 0 0 0 013:45:00 3 0 1089 109 10 1 0 0 17 1 0 0 0 0 0 0 0 0 0 014:00:00 4 1 1197 108 12 2 0 0 17 0 0 0 0 0 0 0 0 0 0 014:15:00 4 0 1301 104 13 1 0 0 17 0 0 0 0 0 0 0 0 0 0 014:30:00 5 1 1405 104 13 0 0 0 20 3 0 0 0 0 0 0 0 0 0 014:45:00 6 1 1493 88 13 0 0 0 21 1 0 0 0 0 0 0 0 0 0 015:00:00 6 0 1589 96 13 0 0 0 22 1 0 0 0 0 0 0 0 0 0 015:15:00 6 0 1589 0 13 0 0 0 22 0 0 0 0 0 0 0 0 0 0 015:30:00 6 0 1589 0 13 0 0 0 22 0 0 0 0 0 0 0 0 0 0 015:45:00 6 0 1589 0 13 0 0 0 22 0 0 0 0 0 0 0 0 0 0 016:00:00 6 0 1589 0 13 0 0 0 22 0 0 0 0 0 0 0 0 0 0 016:15:00 7 1 1691 102 13 0 0 0 22 0 0 0 0 0 0 0 0 0 0 016:30:00 7 0 1786 95 14 1 0 0 23 1 0 0 0 0 0 0 0 0 0 016:45:00 7 0 1870 84 16 2 0 0 25 2 0 0 0 0 0 0 0 0 1 117:00:00 8 1 1992 122 17 1 0 0 25 0 0 0 0 0 0 0 0 0 1 017:15:00 8 0 2075 83 17 0 0 0 25 0 0 0 0 0 0 0 0 0 1 017:30:00 8 0 2167 92 17 0 0 0 26 1 0 0 0 0 0 0 0 0 1 017:45:00 8 0 2242 75 18 1 0 0 26 0 0 0 0 0 0 0 0 0 1 018:00:00 8 0 2312 70 20 2 0 0 26 0 0 0 0 0 0 0 0 0 1 018:15:00 8 0 2313 1 20 0 0 0 26 0 0 0 0 0 0 0 0 0 1 018:15:34 8 0 2314 1 20 0 0 0 26 0 0 0 0 0 0 0 0 0 1 0

Ontario Traffic IncCount Date: 18-Jul-15 Site #: 1518400001
IntervalTime
Passenger Cars - South Approach Trucks - South Approach Heavys - South Approach Pedestrians
Left Left LeftThru Thru ThruRight Right Right South Cross
Cum Cum Cum Cum Cum Cum Cum Cum Cum CumIncr Incr Incr Incr Incr Incr Incr Incr Incr Incr10:00:00 0 0 0 0 0 0 0 0 0 0 0 0 0 0 0 0 0 0 0 010:15:00 0 0 0 0 0 0 0 0 0 0 0 0 0 0 0 0 0 0 0 010:30:00 0 0 0 0 0 0 0 0 0 0 0 0 0 0 0 0 0 0 0 010:45:00 0 0 0 0 0 0 0 0 0 0 0 0 0 0 0 0 0 0 0 011:00:00 0 0 0 0 0 0 0 0 0 0 0 0 0 0 0 0 0 0 0 011:15:00 0 0 0 0 1 1 0 0 0 0 0 0 0 0 0 0 0 0 0 011:30:00 0 0 0 0 1 0 0 0 0 0 0 0 0 0 0 0 0 0 0 011:45:00 1 1 0 0 3 2 0 0 0 0 0 0 0 0 0 0 0 0 0 012:00:00 1 0 0 0 3 0 0 0 0 0 0 0 0 0 0 0 0 0 0 012:15:00 1 0 0 0 3 0 0 0 0 0 0 0 0 0 0 0 0 0 0 012:30:00 1 0 0 0 3 0 0 0 0 0 0 0 0 0 0 0 0 0 0 012:45:00 1 0 0 0 3 0 0 0 0 0 0 0 0 0 0 0 0 0 0 013:00:00 1 0 0 0 3 0 0 0 0 0 0 0 0 0 0 0 0 0 0 013:15:00 1 0 0 0 3 0 0 0 0 0 0 0 0 0 0 0 0 0 1 113:30:00 1 0 0 0 3 0 0 0 0 0 0 0 0 0 0 0 0 0 1 013:45:00 1 0 0 0 3 0 0 0 0 0 0 0 0 0 0 0 0 0 1 014:00:00 1 0 0 0 3 0 0 0 0 0 0 0 0 0 0 0 0 0 1 014:15:00 1 0 0 0 4 1 0 0 0 0 0 0 0 0 0 0 0 0 1 014:30:00 2 1 0 0 4 0 0 0 0 0 0 0 0 0 0 0 0 0 1 014:45:00 2 0 0 0 4 0 0 0 0 0 0 0 0 0 0 0 0 0 1 015:00:00 2 0 0 0 4 0 0 0 0 0 0 0 0 0 0 0 0 0 1 015:15:00 2 0 0 0 4 0 0 0 0 0 0 0 0 0 0 0 0 0 1 015:30:00 2 0 0 0 4 0 0 0 0 0 0 0 0 0 0 0 0 0 1 015:45:00 2 0 0 0 4 0 0 0 0 0 0 0 0 0 0 0 0 0 1 016:00:00 2 0 0 0 4 0 0 0 0 0 0 0 0 0 0 0 0 0 1 016:15:00 2 0 0 0 4 0 0 0 0 0 0 0 0 0 0 0 0 0 1 016:30:00 2 0 0 0 5 1 0 0 0 0 0 0 0 0 0 0 0 0 1 016:45:00 2 0 0 0 5 0 0 0 0 0 0 0 0 0 0 0 0 0 1 017:00:00 2 0 0 0 5 0 0 0 0 0 0 0 0 0 0 0 0 0 1 017:15:00 2 0 0 0 5 0 0 0 0 0 0 0 0 0 0 0 0 0 1 017:30:00 2 0 0 0 5 0 0 0 0 0 0 0 0 0 0 0 0 0 1 017:45:00 2 0 0 0 6 1 0 0 0 0 0 0 0 0 0 0 0 0 1 018:00:00 2 0 0 0 6 0 0 0 0 0 0 0 0 0 0 0 0 0 1 018:15:00 2 0 0 0 6 0 0 0 0 0 0 0 0 0 0 0 0 0 1 018:15:34 2 0 0 0 6 0 0 0 0 0 0 0 0 0 0 0 0 0 1 0

Ontario Traffic IncCount Date: 18-Jul-15 Site #: 1518400001
IntervalTime
Passenger Cars - West Approach Trucks - West Approach Heavys - West Approach Pedestrians
Left Left LeftThru Thru ThruRight Right Right West Cross
Cum Cum Cum Cum Cum Cum Cum Cum Cum CumIncr Incr Incr Incr Incr Incr Incr Incr Incr Incr10:00:00 0 0 0 0 0 0 0 0 0 0 0 0 0 0 0 0 0 0 0 010:15:00 1 1 96 96 0 0 0 0 3 3 0 0 0 0 0 0 0 0 0 010:30:00 1 0 190 94 1 1 0 0 5 2 0 0 0 0 0 0 0 0 1 110:45:00 1 0 284 94 1 0 0 0 7 2 0 0 0 0 0 0 0 0 1 011:00:00 1 0 376 92 2 1 0 0 10 3 0 0 0 0 0 0 0 0 1 011:15:00 3 2 471 95 2 0 0 0 11 1 0 0 0 0 0 0 0 0 1 011:30:00 4 1 574 103 2 0 0 0 14 3 0 0 0 0 0 0 0 0 1 011:45:00 4 0 692 118 2 0 0 0 14 0 0 0 0 0 0 0 0 0 1 012:00:00 4 0 810 118 2 0 0 0 14 0 0 0 0 0 0 0 0 0 1 012:15:00 4 0 810 0 2 0 0 0 14 0 0 0 0 0 0 0 0 0 1 012:30:00 4 0 810 0 2 0 0 0 14 0 0 0 0 0 0 0 0 0 1 012:45:00 4 0 810 0 2 0 0 0 14 0 0 0 0 0 0 0 0 0 1 013:00:00 4 0 810 0 2 0 0 0 14 0 0 0 0 0 0 0 0 0 1 013:15:00 6 2 892 82 4 2 0 0 16 2 0 0 0 0 0 0 0 0 1 013:30:00 7 1 994 102 4 0 0 0 18 2 0 0 0 0 0 0 0 0 1 013:45:00 7 0 1089 95 5 1 0 0 18 0 0 0 0 0 0 0 0 0 1 014:00:00 8 1 1185 96 5 0 0 0 20 2 0 0 0 0 0 0 0 0 1 014:15:00 9 1 1288 103 5 0 0 0 22 2 0 0 0 0 0 0 0 0 1 014:30:00 9 0 1407 119 5 0 0 0 22 0 0 0 0 0 0 0 0 0 1 014:45:00 9 0 1513 106 5 0 0 0 24 2 0 0 0 0 0 0 0 0 3 215:00:00 10 1 1616 103 5 0 0 0 24 0 0 0 0 0 0 0 0 0 3 015:15:00 10 0 1616 0 5 0 0 0 24 0 0 0 0 0 0 0 0 0 3 015:30:00 10 0 1616 0 5 0 0 0 24 0 0 0 0 0 0 0 0 0 3 015:45:00 10 0 1616 0 5 0 0 0 24 0 0 0 0 0 0 0 0 0 3 016:00:00 10 0 1616 0 5 0 0 0 24 0 0 0 0 0 0 0 0 0 3 016:15:00 10 0 1716 100 5 0 0 0 26 2 0 0 0 0 0 0 0 0 3 016:30:00 11 1 1806 90 6 1 0 0 27 1 0 0 0 0 0 0 0 0 3 016:45:00 12 1 1880 74 6 0 0 0 28 1 0 0 0 0 0 0 0 0 3 017:00:00 13 1 1952 72 6 0 0 0 28 0 0 0 0 0 0 0 0 0 3 017:15:00 13 0 2027 75 6 0 0 0 28 0 0 0 0 0 0 0 0 0 3 017:30:00 15 2 2101 74 6 0 0 0 28 0 0 0 0 0 0 0 0 0 3 017:45:00 15 0 2163 62 6 0 0 0 28 0 0 0 0 0 0 0 0 0 3 018:00:00 15 0 2238 75 6 0 0 0 29 1 0 0 0 0 0 0 0 0 3 018:15:00 15 0 2238 0 7 1 0 0 29 0 0 0 0 0 0 0 0 0 3 018:15:34 15 0 2238 0 8 1 0 0 29 0 0 0 0 0 0 0 0 0 3 0

Ontario Traffic IncMorning Peak Diagram Specified Period
From:To:
10:00:0018:00:00
One Hour PeakFrom:To:
10:45:0011:45:00
Municipality:Site #:Intersection:TFR File #:Count date:
Cobourg1518400001County Rd 2 & Burnham Family Mar118-Jul-15
Weather conditions:
Person(s) who counted:
** Non-Signalized Intersection ** Major Road: County Rd 2 runs W/E
North Leg Total:
North Entering:
North Peds:
Peds Cross:
119
54
0
Heavys
Trucks
Cars
Totals
0
0
17
17
0
0
37
37
0
0
54
Heavys
Trucks
Cars
Totals
0
0
65
65
Heavys Trucks Cars Totals
0 0 17 17
Heavys Trucks Cars Totals
0 0 17 17
0 0 0 0
0 0 17
Peds Cross:
West Peds:
West Entering:
West Leg Total:
0
17
34
Burnham Family Market
County Rd 2W
N
E
SCounty Rd 2
East Leg Total:
East Entering:
East Peds:
Peds Cross:
85
48
0
Cars Trucks Heavys Totals
48 0 0 48
0 0 0 0
48 0 0
Cars Trucks Heavys Totals
37 0 0 37
Comments
Ontario Traffic IncTotal Count Diagram
Municipality:Site #:Intersection:TFR File #:Count date:
Cobourg1518400001County Rd 2 & Burnham Family Mar118-Jul-15
Weather conditions:
Person(s) who counted:
** Non-Signalized Intersection ** Major Road: County Rd 2 runs W/E
North Leg Total:
North Entering:
North Peds:
Peds Cross:
510
231
1
Heavys
Trucks
Cars
Totals
0
0
81
81
0
0
150
150
0
0
231
Heavys
Trucks
Cars
Totals
0
1
278
279
Heavys Trucks Cars Totals
0 0 81 81
Heavys Trucks Cars Totals
0 0 77 77
0 0 0 0
0 0 77
Peds Cross:
West Peds:
West Entering:
West Leg Total:
1
77
158
Burnham Family Market
County Rd 2W
N
E
SCounty Rd 2
East Leg Total:
East Entering:
East Peds:
Peds Cross:
352
202
2
Cars Trucks Heavys Totals
201 1 0 202
0 0 0 0
201 1 0
Cars Trucks Heavys Totals
150 0 0 150
Comments

Ontario Traffic IncTraffic Count Summary
Intersection: County Rd 2 & Burnham Family MaCount Date: 18-Jul-15 Municipality: CobourgNorth Approach Totals South Approach Totals
East Approach Totals West Approach Totals
Includes Cars, Trucks, & Heavys Includes Cars, Trucks, & Heavys
Includes Cars, Trucks, & Heavys Includes Cars, Trucks, & Heavys
Hour Hour
Hour Hour
Ending Ending
Ending Ending
Left Left
Left Left
Thru Thru
Thru Thru
Right Right
Right Right
Grand Grand
Grand Grand
Total Total
Total Total
Total Total
Total Total
Peds Peds
Peds Peds
North/South
East/West
Total
Total
Approaches
Approaches
Calculated Values for Traffic Crossing Major StreetHours Ending:Crossing Values:
Totals:
Totals:
10:00:00 0 0 0 0 0 0 10:00:00 0 0 0 0 011:00:00 34 0 14 48 0 48 11:00:00 0 0 0 0 012:00:00 36 0 15 51 0 51 12:00:00 0 0 0 0 013:00:00 0 0 0 0 0 0 13:00:00 0 0 0 0 014:00:00 21 0 15 36 0 36 14:00:00 0 0 0 0 015:00:00 33 0 14 47 0 47 15:00:00 0 0 0 0 016:00:00 0 0 0 0 0 0 16:00:00 0 0 0 0 017:00:00 17 0 20 37 1 37 17:00:00 0 0 0 0 018:00:00 9 0 3 12 0 12 18:00:00 0 0 0 0 0
10:00:00 0 0 0 0 0 0 10:00:00 0 0 0 0 011:00:00 0 0 43 43 0 59 11:00:00 16 0 0 16 012:00:00 0 0 50 50 0 65 12:00:00 15 0 0 15 013:00:00 0 0 0 0 0 0 13:00:00 0 0 0 0 014:00:00 0 0 42 42 0 53 14:00:00 11 0 0 11 015:00:00 0 0 33 33 0 53 15:00:00 20 0 0 20 016:00:00 0 0 0 0 0 0 16:00:00 0 0 0 0 017:00:00 0 0 26 26 2 37 17:00:00 11 0 0 11 018:00:00 0 0 8 8 0 12 18:00:00 4 0 0 4 1
11:00 12:00 13:00 14:00 15:00 16:00 17:00 18:0034 36 0 21 33 0 19 10
150 0 81 231 1 231 0 0 0 0 0
0 0 202 202 2 279 77 0 0 77 1

Ontario Traffic IncCount Date: 18-Jul-15 Site #: 1518400001
IntervalTime
Passenger Cars - North Approach Trucks - North Approach Heavys - North Approach Pedestrians
Left Left LeftThru Thru ThruRight Right Right North Cross
Cum Cum Cum Cum Cum Cum Cum Cum Cum CumIncr Incr Incr Incr Incr Incr Incr Incr Incr Incr10:00:00 0 0 0 0 0 0 0 0 0 0 0 0 0 0 0 0 0 0 0 010:15:00 10 10 0 0 1 1 0 0 0 0 0 0 0 0 0 0 0 0 0 010:30:00 16 6 0 0 4 3 0 0 0 0 0 0 0 0 0 0 0 0 0 010:45:00 25 9 0 0 8 4 0 0 0 0 0 0 0 0 0 0 0 0 0 011:00:00 34 9 0 0 14 6 0 0 0 0 0 0 0 0 0 0 0 0 0 011:15:00 42 8 0 0 15 1 0 0 0 0 0 0 0 0 0 0 0 0 0 011:30:00 56 14 0 0 20 5 0 0 0 0 0 0 0 0 0 0 0 0 0 011:45:00 62 6 0 0 25 5 0 0 0 0 0 0 0 0 0 0 0 0 0 012:00:00 70 8 0 0 29 4 0 0 0 0 0 0 0 0 0 0 0 0 0 012:15:00 70 0 0 0 29 0 0 0 0 0 0 0 0 0 0 0 0 0 0 012:30:00 70 0 0 0 29 0 0 0 0 0 0 0 0 0 0 0 0 0 0 012:45:00 70 0 0 0 29 0 0 0 0 0 0 0 0 0 0 0 0 0 0 013:00:00 70 0 0 0 29 0 0 0 0 0 0 0 0 0 0 0 0 0 0 013:15:00 73 3 0 0 31 2 0 0 0 0 0 0 0 0 0 0 0 0 0 013:30:00 76 3 0 0 33 2 0 0 0 0 0 0 0 0 0 0 0 0 0 013:45:00 84 8 0 0 40 7 0 0 0 0 0 0 0 0 0 0 0 0 0 014:00:00 91 7 0 0 44 4 0 0 0 0 0 0 0 0 0 0 0 0 0 014:15:00 98 7 0 0 50 6 0 0 0 0 0 0 0 0 0 0 0 0 0 014:30:00 105 7 0 0 53 3 0 0 0 0 0 0 0 0 0 0 0 0 0 014:45:00 114 9 0 0 54 1 0 0 0 0 0 0 0 0 0 0 0 0 0 015:00:00 124 10 0 0 58 4 0 0 0 0 0 0 0 0 0 0 0 0 0 015:15:00 124 0 0 0 58 0 0 0 0 0 0 0 0 0 0 0 0 0 0 015:30:00 124 0 0 0 58 0 0 0 0 0 0 0 0 0 0 0 0 0 0 015:45:00 124 0 0 0 58 0 0 0 0 0 0 0 0 0 0 0 0 0 0 016:00:00 124 0 0 0 58 0 0 0 0 0 0 0 0 0 0 0 0 0 0 016:15:00 130 6 0 0 65 7 0 0 0 0 0 0 0 0 0 0 0 0 1 116:30:00 137 7 0 0 70 5 0 0 0 0 0 0 0 0 0 0 0 0 1 016:45:00 139 2 0 0 73 3 0 0 0 0 0 0 0 0 0 0 0 0 1 017:00:00 141 2 0 0 78 5 0 0 0 0 0 0 0 0 0 0 0 0 1 017:15:00 143 2 0 0 79 1 0 0 0 0 0 0 0 0 0 0 0 0 1 017:30:00 145 2 0 0 80 1 0 0 0 0 0 0 0 0 0 0 0 0 1 017:45:00 147 2 0 0 80 0 0 0 0 0 0 0 0 0 0 0 0 0 1 018:00:00 150 3 0 0 81 1 0 0 0 0 0 0 0 0 0 0 0 0 1 018:15:00 150 0 0 0 81 0 0 0 0 0 0 0 0 0 0 0 0 0 1 018:15:29 150 0 0 0 81 0 0 0 0 0 0 0 0 0 0 0 0 0 1 0

Ontario Traffic IncCount Date: 18-Jul-15 Site #: 1518400001
IntervalTime
Passenger Cars - East Approach Trucks - East Approach Heavys - East Approach Pedestrians
Left Left LeftThru Thru ThruRight Right Right East Cross
Cum Cum Cum Cum Cum Cum Cum Cum Cum CumIncr Incr Incr Incr Incr Incr Incr Incr Incr Incr10:00:00 0 0 0 0 0 0 0 0 0 0 0 0 0 0 0 0 0 0 0 010:15:00 0 0 0 0 7 7 0 0 0 0 0 0 0 0 0 0 0 0 0 010:30:00 0 0 0 0 19 12 0 0 0 0 0 0 0 0 0 0 0 0 0 010:45:00 0 0 0 0 36 17 0 0 0 0 0 0 0 0 0 0 0 0 0 011:00:00 0 0 0 0 43 7 0 0 0 0 0 0 0 0 0 0 0 0 0 011:15:00 0 0 0 0 53 10 0 0 0 0 0 0 0 0 0 0 0 0 0 011:30:00 0 0 0 0 68 15 0 0 0 0 0 0 0 0 0 0 0 0 0 011:45:00 0 0 0 0 84 16 0 0 0 0 0 0 0 0 0 0 0 0 0 012:00:00 0 0 0 0 93 9 0 0 0 0 0 0 0 0 0 0 0 0 0 012:15:00 0 0 0 0 93 0 0 0 0 0 0 0 0 0 0 0 0 0 0 012:30:00 0 0 0 0 93 0 0 0 0 0 0 0 0 0 0 0 0 0 0 012:45:00 0 0 0 0 93 0 0 0 0 0 0 0 0 0 0 0 0 0 0 013:00:00 0 0 0 0 93 0 0 0 0 0 0 0 0 0 0 0 0 0 0 013:15:00 0 0 0 0 103 10 0 0 0 0 0 0 0 0 0 0 0 0 0 013:30:00 0 0 0 0 114 11 0 0 0 0 0 0 0 0 0 0 0 0 0 013:45:00 0 0 0 0 124 10 0 0 0 0 0 0 0 0 0 0 0 0 0 014:00:00 0 0 0 0 135 11 0 0 0 0 0 0 0 0 0 0 0 0 0 014:15:00 0 0 0 0 145 10 0 0 0 0 0 0 0 0 0 0 0 0 0 014:30:00 0 0 0 0 153 8 0 0 0 0 0 0 0 0 0 0 0 0 0 014:45:00 0 0 0 0 158 5 0 0 0 0 0 0 0 0 0 0 0 0 0 015:00:00 0 0 0 0 168 10 0 0 0 0 0 0 0 0 0 0 0 0 0 015:15:00 0 0 0 0 168 0 0 0 0 0 0 0 0 0 0 0 0 0 0 015:30:00 0 0 0 0 168 0 0 0 0 0 0 0 0 0 0 0 0 0 0 015:45:00 0 0 0 0 168 0 0 0 0 0 0 0 0 0 0 0 0 0 0 016:00:00 0 0 0 0 168 0 0 0 0 0 0 0 0 0 0 0 0 0 0 016:15:00 0 0 0 0 174 6 0 0 0 0 0 0 0 0 0 0 0 0 1 116:30:00 0 0 0 0 185 11 0 0 0 0 0 0 0 0 0 0 0 0 1 016:45:00 0 0 0 0 189 4 0 0 0 0 0 0 0 0 0 0 0 0 1 017:00:00 0 0 0 0 193 4 0 0 0 0 1 1 0 0 0 0 0 0 2 117:15:00 0 0 0 0 194 1 0 0 0 0 1 0 0 0 0 0 0 0 2 017:30:00 0 0 0 0 196 2 0 0 0 0 1 0 0 0 0 0 0 0 2 017:45:00 0 0 0 0 198 2 0 0 0 0 1 0 0 0 0 0 0 0 2 018:00:00 0 0 0 0 201 3 0 0 0 0 1 0 0 0 0 0 0 0 2 018:15:00 0 0 0 0 201 0 0 0 0 0 1 0 0 0 0 0 0 0 2 018:15:29 0 0 0 0 201 0 0 0 0 0 1 0 0 0 0 0 0 0 2 0

Ontario Traffic IncCount Date: 18-Jul-15 Site #: 1518400001
IntervalTime
Passenger Cars - South Approach Trucks - South Approach Heavys - South Approach Pedestrians
Left Left LeftThru Thru ThruRight Right Right South Cross
Cum Cum Cum Cum Cum Cum Cum Cum Cum CumIncr Incr Incr Incr Incr Incr Incr Incr Incr Incr10:00:00 0 0 0 0 0 0 0 0 0 0 0 0 0 0 0 0 0 0 0 010:15:00 0 0 0 0 0 0 0 0 0 0 0 0 0 0 0 0 0 0 0 010:30:00 0 0 0 0 0 0 0 0 0 0 0 0 0 0 0 0 0 0 0 010:45:00 0 0 0 0 0 0 0 0 0 0 0 0 0 0 0 0 0 0 0 011:00:00 0 0 0 0 0 0 0 0 0 0 0 0 0 0 0 0 0 0 0 011:15:00 0 0 0 0 0 0 0 0 0 0 0 0 0 0 0 0 0 0 0 011:30:00 0 0 0 0 0 0 0 0 0 0 0 0 0 0 0 0 0 0 0 011:45:00 0 0 0 0 0 0 0 0 0 0 0 0 0 0 0 0 0 0 0 012:00:00 0 0 0 0 0 0 0 0 0 0 0 0 0 0 0 0 0 0 0 012:15:00 0 0 0 0 0 0 0 0 0 0 0 0 0 0 0 0 0 0 0 012:30:00 0 0 0 0 0 0 0 0 0 0 0 0 0 0 0 0 0 0 0 012:45:00 0 0 0 0 0 0 0 0 0 0 0 0 0 0 0 0 0 0 0 013:00:00 0 0 0 0 0 0 0 0 0 0 0 0 0 0 0 0 0 0 0 013:15:00 0 0 0 0 0 0 0 0 0 0 0 0 0 0 0 0 0 0 0 013:30:00 0 0 0 0 0 0 0 0 0 0 0 0 0 0 0 0 0 0 0 013:45:00 0 0 0 0 0 0 0 0 0 0 0 0 0 0 0 0 0 0 0 014:00:00 0 0 0 0 0 0 0 0 0 0 0 0 0 0 0 0 0 0 0 014:15:00 0 0 0 0 0 0 0 0 0 0 0 0 0 0 0 0 0 0 0 014:30:00 0 0 0 0 0 0 0 0 0 0 0 0 0 0 0 0 0 0 0 014:45:00 0 0 0 0 0 0 0 0 0 0 0 0 0 0 0 0 0 0 0 015:00:00 0 0 0 0 0 0 0 0 0 0 0 0 0 0 0 0 0 0 0 015:15:00 0 0 0 0 0 0 0 0 0 0 0 0 0 0 0 0 0 0 0 015:30:00 0 0 0 0 0 0 0 0 0 0 0 0 0 0 0 0 0 0 0 015:45:00 0 0 0 0 0 0 0 0 0 0 0 0 0 0 0 0 0 0 0 016:00:00 0 0 0 0 0 0 0 0 0 0 0 0 0 0 0 0 0 0 0 016:15:00 0 0 0 0 0 0 0 0 0 0 0 0 0 0 0 0 0 0 0 016:30:00 0 0 0 0 0 0 0 0 0 0 0 0 0 0 0 0 0 0 0 016:45:00 0 0 0 0 0 0 0 0 0 0 0 0 0 0 0 0 0 0 0 017:00:00 0 0 0 0 0 0 0 0 0 0 0 0 0 0 0 0 0 0 0 017:15:00 0 0 0 0 0 0 0 0 0 0 0 0 0 0 0 0 0 0 0 017:30:00 0 0 0 0 0 0 0 0 0 0 0 0 0 0 0 0 0 0 0 017:45:00 0 0 0 0 0 0 0 0 0 0 0 0 0 0 0 0 0 0 0 018:00:00 0 0 0 0 0 0 0 0 0 0 0 0 0 0 0 0 0 0 0 018:15:00 0 0 0 0 0 0 0 0 0 0 0 0 0 0 0 0 0 0 0 018:15:29 0 0 0 0 0 0 0 0 0 0 0 0 0 0 0 0 0 0 0 0

Ontario Traffic IncCount Date: 18-Jul-15 Site #: 1518400001
IntervalTime
Passenger Cars - West Approach Trucks - West Approach Heavys - West Approach Pedestrians
Left Left LeftThru Thru ThruRight Right Right West Cross
Cum Cum Cum Cum Cum Cum Cum Cum Cum CumIncr Incr Incr Incr Incr Incr Incr Incr Incr Incr10:00:00 0 0 0 0 0 0 0 0 0 0 0 0 0 0 0 0 0 0 0 010:15:00 2 2 0 0 0 0 0 0 0 0 0 0 0 0 0 0 0 0 0 010:30:00 8 6 0 0 0 0 0 0 0 0 0 0 0 0 0 0 0 0 0 010:45:00 11 3 0 0 0 0 0 0 0 0 0 0 0 0 0 0 0 0 0 011:00:00 16 5 0 0 0 0 0 0 0 0 0 0 0 0 0 0 0 0 0 011:15:00 17 1 0 0 0 0 0 0 0 0 0 0 0 0 0 0 0 0 0 011:30:00 21 4 0 0 0 0 0 0 0 0 0 0 0 0 0 0 0 0 0 011:45:00 28 7 0 0 0 0 0 0 0 0 0 0 0 0 0 0 0 0 0 012:00:00 31 3 0 0 0 0 0 0 0 0 0 0 0 0 0 0 0 0 0 012:15:00 31 0 0 0 0 0 0 0 0 0 0 0 0 0 0 0 0 0 0 012:30:00 31 0 0 0 0 0 0 0 0 0 0 0 0 0 0 0 0 0 0 012:45:00 31 0 0 0 0 0 0 0 0 0 0 0 0 0 0 0 0 0 0 013:00:00 31 0 0 0 0 0 0 0 0 0 0 0 0 0 0 0 0 0 0 013:15:00 33 2 0 0 0 0 0 0 0 0 0 0 0 0 0 0 0 0 0 013:30:00 37 4 0 0 0 0 0 0 0 0 0 0 0 0 0 0 0 0 0 013:45:00 40 3 0 0 0 0 0 0 0 0 0 0 0 0 0 0 0 0 0 014:00:00 42 2 0 0 0 0 0 0 0 0 0 0 0 0 0 0 0 0 0 014:15:00 45 3 0 0 0 0 0 0 0 0 0 0 0 0 0 0 0 0 0 014:30:00 51 6 0 0 0 0 0 0 0 0 0 0 0 0 0 0 0 0 0 014:45:00 58 7 0 0 0 0 0 0 0 0 0 0 0 0 0 0 0 0 0 015:00:00 62 4 0 0 0 0 0 0 0 0 0 0 0 0 0 0 0 0 0 015:15:00 62 0 0 0 0 0 0 0 0 0 0 0 0 0 0 0 0 0 0 015:30:00 62 0 0 0 0 0 0 0 0 0 0 0 0 0 0 0 0 0 0 015:45:00 62 0 0 0 0 0 0 0 0 0 0 0 0 0 0 0 0 0 0 016:00:00 62 0 0 0 0 0 0 0 0 0 0 0 0 0 0 0 0 0 0 016:15:00 68 6 0 0 0 0 0 0 0 0 0 0 0 0 0 0 0 0 0 016:30:00 71 3 0 0 0 0 0 0 0 0 0 0 0 0 0 0 0 0 0 016:45:00 72 1 0 0 0 0 0 0 0 0 0 0 0 0 0 0 0 0 0 017:00:00 73 1 0 0 0 0 0 0 0 0 0 0 0 0 0 0 0 0 0 017:15:00 75 2 0 0 0 0 0 0 0 0 0 0 0 0 0 0 0 0 0 017:30:00 76 1 0 0 0 0 0 0 0 0 0 0 0 0 0 0 0 0 0 017:45:00 76 0 0 0 0 0 0 0 0 0 0 0 0 0 0 0 0 0 1 118:00:00 77 1 0 0 0 0 0 0 0 0 0 0 0 0 0 0 0 0 1 018:15:00 77 0 0 0 0 0 0 0 0 0 0 0 0 0 0 0 0 0 1 018:15:29 77 0 0 0 0 0 0 0 0 0 0 0 0 0 0 0 0 0 1 0

Ontario Traffic IncMorning Peak Diagram Specified Period
From:To:
10:00:0018:00:00
One Hour PeakFrom:To:
14:15:0015:15:00
Municipality:Site #:Intersection:TFR File #:Count date:
Cobourg1518400003County Rd 2 & Apple Orchard Rd1022-Jul-15
Weather conditions:
Person(s) who counted:
** Non-Signalized Intersection ** Major Road: County Rd 2 runs W/E
North Leg Total:
North Entering:
North Peds:
Peds Cross:
19
12
0
Heavys
Trucks
Cars
Totals
0
0
3
3
0
0
0
0
0
0
9
9
0
0
12
Heavys
Trucks
Cars
Totals
0
0
7
7
Heavys Trucks Cars Totals
0 9 462 471
Heavys Trucks Cars Totals
0 0 3 3
0 11 514 525
0 0 2 2
0 11 519
Peds Cross:
West Peds:
West Entering:
West Leg Total:
0
530
1001
Apple Orchard Rd
County Rd 2W
N
E
SCounty Rd 2
Bob Carr Rd
East Leg Total:
East Entering:
East Peds:
Peds Cross:
1009
473
0
Cars Trucks Heavys Totals
4 0 0 4
459 9 0 468
0 1 0 1
463 10 0
Cars Trucks Heavys Totals
524 12 0 536
Cars
Trucks
Heavys
Totals
2
1
0
3
Cars
Trucks
Heavys
Totals
0
0
0
0
0
0
0
0
1
1
0
2
1
1
0
Peds Cross:
South Peds:
South Entering:
South Leg Total:
0
2
5
Comments

Ontario Traffic IncTotal Count Diagram
Municipality:Site #:Intersection:TFR File #:Count date:
Cobourg1518400003County Rd 2 & Apple Orchard Rd1022-Jul-15
Weather conditions:
Person(s) who counted:
** Non-Signalized Intersection ** Major Road: County Rd 2 runs W/E
North Leg Total:
North Entering:
North Peds:
Peds Cross:
99
47
0
Heavys
Trucks
Cars
Totals
0
1
20
21
0
0
1
1
0
0
25
25
0
1
46
Heavys
Trucks
Cars
Totals
0
3
49
52
Heavys Trucks Cars Totals
0 82 2962 3044
Heavys Trucks Cars Totals
0 0 13 13
0 69 3030 3099
0 0 8 8
0 69 3051
Peds Cross:
West Peds:
West Entering:
West Leg Total:
3
3120
6164
Apple Orchard Rd
County Rd 2W
N
E
SCounty Rd 2
Bob Carr Rd
East Leg Total:
East Entering:
East Peds:
Peds Cross:
6194
3059
0
Cars Trucks Heavys Totals
35 1 0 36
2936 78 0 3014
8 1 0 9
2979 80 0
Cars Trucks Heavys Totals
3062 73 0 3135
Cars
Trucks
Heavys
Totals
17
1
0
18
Cars
Trucks
Heavys
Totals
6
3
0
9
1
2
0
3
7
4
0
11
14
9
0
Peds Cross:
South Peds:
South Entering:
South Leg Total:
0
23
41
Comments

Ontario Traffic IncTraffic Count Summary
Intersection: County Rd 2 & Apple Orchard Rd Count Date: 22-Jul-15 Municipality: CobourgNorth Approach Totals South Approach Totals
East Approach Totals West Approach Totals
Includes Cars, Trucks, & Heavys Includes Cars, Trucks, & Heavys
Includes Cars, Trucks, & Heavys Includes Cars, Trucks, & Heavys
Hour Hour
Hour Hour
Ending Ending
Ending Ending
Left Left
Left Left
Thru Thru
Thru Thru
Right Right
Right Right
Grand Grand
Grand Grand
Total Total
Total Total
Total Total
Total Total
Peds Peds
Peds Peds
North/South
East/West
Total
Total
Approaches
Approaches
Calculated Values for Traffic Crossing Major StreetHours Ending:Crossing Values:
Totals:
Totals:
10:00:00 0 0 0 0 0 0 10:00:00 0 0 0 0 011:00:00 1 0 3 4 0 6 11:00:00 1 0 1 2 012:00:00 1 0 2 3 0 5 12:00:00 2 0 0 2 013:00:00 1 0 1 2 0 7 13:00:00 3 1 1 5 014:00:00 1 1 7 9 0 11 14:00:00 1 1 0 2 015:00:00 9 0 3 12 0 15 15:00:00 1 0 2 3 016:00:00 3 0 0 3 0 7 16:00:00 0 1 3 4 017:00:00 5 0 3 8 0 12 17:00:00 1 0 3 4 018:00:00 4 0 2 6 0 7 18:00:00 0 0 1 1 0
10:00:00 0 0 0 0 0 0 10:00:00 0 0 0 0 011:00:00 1 379 10 390 0 775 11:00:00 0 385 0 385 012:00:00 1 420 5 426 0 876 12:00:00 2 447 1 450 013:00:00 2 217 4 223 0 429 13:00:00 2 203 1 206 014:00:00 1 436 6 443 0 843 14:00:00 2 398 0 400 015:00:00 3 436 3 442 0 905 15:00:00 2 459 2 463 016:00:00 0 276 1 277 0 568 16:00:00 1 290 0 291 017:00:00 1 446 3 450 0 955 17:00:00 4 498 3 505 318:00:00 0 404 4 408 0 826 18:00:00 0 417 1 418 0
11:00 12:00 13:00 14:00 15:00 16:00 17:00 18:002 3 5 3 10 4 9 4
25 1 21 47 0 70 9 3 11 23 0
9 3014 36 3059 0 6177 13 3097 8 3118 3

Ontario Traffic IncCount Date: 22-Jul-15 Site #: 1518400003
IntervalTime
Passenger Cars - North Approach Trucks - North Approach Heavys - North Approach Pedestrians
Left Left LeftThru Thru ThruRight Right Right North Cross
Cum Cum Cum Cum Cum Cum Cum Cum Cum CumIncr Incr Incr Incr Incr Incr Incr Incr Incr Incr10:00:00 0 0 0 0 0 0 0 0 0 0 0 0 0 0 0 0 0 0 0 010:15:00 0 0 0 0 0 0 0 0 0 0 0 0 0 0 0 0 0 0 0 010:30:00 0 0 0 0 1 1 0 0 0 0 0 0 0 0 0 0 0 0 0 010:45:00 1 1 0 0 1 0 0 0 0 0 0 0 0 0 0 0 0 0 0 011:00:00 1 0 0 0 3 2 0 0 0 0 0 0 0 0 0 0 0 0 0 011:15:00 1 0 0 0 4 1 0 0 0 0 0 0 0 0 0 0 0 0 0 011:30:00 1 0 0 0 4 0 0 0 0 0 0 0 0 0 0 0 0 0 0 011:45:00 1 0 0 0 4 0 0 0 0 0 0 0 0 0 0 0 0 0 0 012:00:00 2 1 0 0 5 1 0 0 0 0 0 0 0 0 0 0 0 0 0 012:15:00 3 1 0 0 6 1 0 0 0 0 0 0 0 0 0 0 0 0 0 012:30:00 3 0 0 0 6 0 0 0 0 0 0 0 0 0 0 0 0 0 0 012:45:00 3 0 0 0 6 0 0 0 0 0 0 0 0 0 0 0 0 0 0 013:00:00 3 0 0 0 6 0 0 0 0 0 0 0 0 0 0 0 0 0 0 013:15:00 3 0 0 0 10 4 0 0 0 0 0 0 0 0 0 0 0 0 0 013:30:00 3 0 1 1 11 1 0 0 0 0 0 0 0 0 0 0 0 0 0 013:45:00 4 1 1 0 12 1 0 0 0 0 1 1 0 0 0 0 0 0 0 014:00:00 4 0 1 0 12 0 0 0 0 0 1 0 0 0 0 0 0 0 0 014:15:00 7 3 1 0 12 0 0 0 0 0 1 0 0 0 0 0 0 0 0 014:30:00 10 3 1 0 13 1 0 0 0 0 1 0 0 0 0 0 0 0 0 014:45:00 12 2 1 0 14 1 0 0 0 0 1 0 0 0 0 0 0 0 0 015:00:00 13 1 1 0 15 1 0 0 0 0 1 0 0 0 0 0 0 0 0 015:15:00 16 3 1 0 15 0 0 0 0 0 1 0 0 0 0 0 0 0 0 015:30:00 16 0 1 0 15 0 0 0 0 0 1 0 0 0 0 0 0 0 0 015:45:00 16 0 1 0 15 0 0 0 0 0 1 0 0 0 0 0 0 0 0 016:00:00 16 0 1 0 15 0 0 0 0 0 1 0 0 0 0 0 0 0 0 016:15:00 17 1 1 0 15 0 0 0 0 0 1 0 0 0 0 0 0 0 0 016:30:00 18 1 1 0 17 2 0 0 0 0 1 0 0 0 0 0 0 0 0 016:45:00 20 2 1 0 18 1 0 0 0 0 1 0 0 0 0 0 0 0 0 017:00:00 21 1 1 0 18 0 0 0 0 0 1 0 0 0 0 0 0 0 0 017:15:00 21 0 1 0 18 0 0 0 0 0 1 0 0 0 0 0 0 0 0 017:30:00 21 0 1 0 18 0 0 0 0 0 1 0 0 0 0 0 0 0 0 017:45:00 23 2 1 0 20 2 0 0 0 0 1 0 0 0 0 0 0 0 0 018:00:00 25 2 1 0 20 0 0 0 0 0 1 0 0 0 0 0 0 0 0 018:15:00 25 0 1 0 20 0 0 0 0 0 1 0 0 0 0 0 0 0 0 018:15:09 25 0 1 0 20 0 0 0 0 0 1 0 0 0 0 0 0 0 0 0

Ontario Traffic IncCount Date: 22-Jul-15 Site #: 1518400003
IntervalTime
Passenger Cars - East Approach Trucks - East Approach Heavys - East Approach Pedestrians
Left Left LeftThru Thru ThruRight Right Right East Cross
Cum Cum Cum Cum Cum Cum Cum Cum Cum CumIncr Incr Incr Incr Incr Incr Incr Incr Incr Incr10:00:00 0 0 0 0 0 0 0 0 0 0 0 0 0 0 0 0 0 0 0 010:15:00 0 0 91 91 1 1 0 0 4 4 0 0 0 0 0 0 0 0 0 010:30:00 1 1 167 76 3 2 0 0 7 3 0 0 0 0 0 0 0 0 0 010:45:00 1 0 254 87 7 4 0 0 11 4 1 1 0 0 0 0 0 0 0 011:00:00 1 0 367 113 9 2 0 0 12 1 1 0 0 0 0 0 0 0 0 011:15:00 1 0 483 116 10 1 0 0 16 4 1 0 0 0 0 0 0 0 0 011:30:00 2 1 584 101 10 0 0 0 19 3 1 0 0 0 0 0 0 0 0 011:45:00 2 0 673 89 10 0 0 0 22 3 1 0 0 0 0 0 0 0 0 012:00:00 2 0 775 102 14 4 0 0 24 2 1 0 0 0 0 0 0 0 0 012:15:00 4 2 876 101 17 3 0 0 27 3 1 0 0 0 0 0 0 0 0 012:30:00 4 0 984 108 18 1 0 0 32 5 1 0 0 0 0 0 0 0 0 012:45:00 4 0 984 0 18 0 0 0 32 0 1 0 0 0 0 0 0 0 0 013:00:00 4 0 984 0 18 0 0 0 32 0 1 0 0 0 0 0 0 0 0 013:15:00 4 0 1085 101 21 3 0 0 37 5 1 0 0 0 0 0 0 0 0 013:30:00 5 1 1180 95 22 1 0 0 39 2 1 0 0 0 0 0 0 0 0 013:45:00 5 0 1294 114 23 1 0 0 42 3 1 0 0 0 0 0 0 0 0 014:00:00 5 0 1407 113 24 1 0 0 45 3 1 0 0 0 0 0 0 0 0 014:15:00 7 2 1504 97 24 0 0 0 48 3 1 0 0 0 0 0 0 0 0 014:30:00 7 0 1618 114 26 2 1 1 52 4 1 0 0 0 0 0 0 0 0 014:45:00 7 0 1734 116 26 0 1 0 53 1 1 0 0 0 0 0 0 0 0 015:00:00 7 0 1832 98 27 1 1 0 56 3 1 0 0 0 0 0 0 0 0 015:15:00 7 0 1963 131 28 1 1 0 57 1 1 0 0 0 0 0 0 0 0 015:30:00 7 0 2085 122 28 0 1 0 63 6 1 0 0 0 0 0 0 0 0 015:45:00 7 0 2098 13 28 0 1 0 66 3 1 0 0 0 0 0 0 0 0 016:00:00 7 0 2098 0 28 0 1 0 66 0 1 0 0 0 0 0 0 0 0 016:15:00 7 0 2208 110 28 0 1 0 67 1 1 0 0 0 0 0 0 0 0 016:30:00 7 0 2314 106 29 1 1 0 70 3 1 0 0 0 0 0 0 0 0 016:45:00 8 1 2433 119 29 0 1 0 71 1 1 0 0 0 0 0 0 0 0 017:00:00 8 0 2537 104 31 2 1 0 73 2 1 0 0 0 0 0 0 0 0 017:15:00 8 0 2642 105 31 0 1 0 74 1 1 0 0 0 0 0 0 0 0 017:30:00 8 0 2752 110 33 2 1 0 78 4 1 0 0 0 0 0 0 0 0 017:45:00 8 0 2852 100 34 1 1 0 78 0 1 0 0 0 0 0 0 0 0 018:00:00 8 0 2936 84 35 1 1 0 78 0 1 0 0 0 0 0 0 0 0 018:15:00 8 0 2936 0 35 0 1 0 78 0 1 0 0 0 0 0 0 0 0 018:15:09 8 0 2936 0 35 0 1 0 78 0 1 0 0 0 0 0 0 0 0 0

Ontario Traffic IncCount Date: 22-Jul-15 Site #: 1518400003
IntervalTime
Passenger Cars - South Approach Trucks - South Approach Heavys - South Approach Pedestrians
Left Left LeftThru Thru ThruRight Right Right South Cross
Cum Cum Cum Cum Cum Cum Cum Cum Cum CumIncr Incr Incr Incr Incr Incr Incr Incr Incr Incr10:00:00 0 0 0 0 0 0 0 0 0 0 0 0 0 0 0 0 0 0 0 010:15:00 0 0 0 0 0 0 1 1 0 0 0 0 0 0 0 0 0 0 0 010:30:00 0 0 0 0 0 0 1 0 0 0 0 0 0 0 0 0 0 0 0 010:45:00 0 0 0 0 1 1 1 0 0 0 0 0 0 0 0 0 0 0 0 011:00:00 0 0 0 0 1 0 1 0 0 0 0 0 0 0 0 0 0 0 0 011:15:00 0 0 0 0 1 0 1 0 0 0 0 0 0 0 0 0 0 0 0 011:30:00 0 0 0 0 1 0 1 0 0 0 0 0 0 0 0 0 0 0 0 011:45:00 1 1 0 0 1 0 2 1 0 0 0 0 0 0 0 0 0 0 0 012:00:00 1 0 0 0 1 0 2 0 0 0 0 0 0 0 0 0 0 0 0 012:15:00 2 1 0 0 1 0 2 0 0 0 0 0 0 0 0 0 0 0 0 012:30:00 3 1 0 0 1 0 2 0 0 0 0 0 0 0 0 0 0 0 0 012:45:00 3 0 0 0 1 0 2 0 0 0 0 0 0 0 0 0 0 0 0 013:00:00 3 0 0 0 1 0 3 1 1 1 1 1 0 0 0 0 0 0 0 013:15:00 3 0 0 0 1 0 3 0 1 0 1 0 0 0 0 0 0 0 0 013:30:00 3 0 0 0 1 0 3 0 1 0 1 0 0 0 0 0 0 0 0 013:45:00 4 1 0 0 1 0 3 0 1 0 1 0 0 0 0 0 0 0 0 014:00:00 4 0 1 1 1 0 3 0 1 0 1 0 0 0 0 0 0 0 0 014:15:00 5 1 1 0 1 0 3 0 1 0 1 0 0 0 0 0 0 0 0 014:30:00 5 0 1 0 1 0 3 0 1 0 2 1 0 0 0 0 0 0 0 014:45:00 5 0 1 0 2 1 3 0 1 0 2 0 0 0 0 0 0 0 0 015:00:00 5 0 1 0 2 0 3 0 1 0 2 0 0 0 0 0 0 0 0 015:15:00 5 0 1 0 2 0 3 0 1 0 2 0 0 0 0 0 0 0 0 015:30:00 5 0 1 0 2 0 3 0 1 0 2 0 0 0 0 0 0 0 0 015:45:00 5 0 1 0 3 1 3 0 2 1 4 2 0 0 0 0 0 0 0 016:00:00 5 0 1 0 3 0 3 0 2 0 4 0 0 0 0 0 0 0 0 016:15:00 5 0 1 0 3 0 3 0 2 0 4 0 0 0 0 0 0 0 0 016:30:00 5 0 1 0 4 1 3 0 2 0 4 0 0 0 0 0 0 0 0 016:45:00 5 0 1 0 6 2 3 0 2 0 4 0 0 0 0 0 0 0 0 017:00:00 6 1 1 0 6 0 3 0 2 0 4 0 0 0 0 0 0 0 0 017:15:00 6 0 1 0 6 0 3 0 2 0 4 0 0 0 0 0 0 0 0 017:30:00 6 0 1 0 6 0 3 0 2 0 4 0 0 0 0 0 0 0 0 017:45:00 6 0 1 0 6 0 3 0 2 0 4 0 0 0 0 0 0 0 0 018:00:00 6 0 1 0 7 1 3 0 2 0 4 0 0 0 0 0 0 0 0 018:15:00 6 0 1 0 7 0 3 0 2 0 4 0 0 0 0 0 0 0 0 018:15:09 6 0 1 0 7 0 3 0 2 0 4 0 0 0 0 0 0 0 0 0

Ontario Traffic IncCount Date: 22-Jul-15 Site #: 1518400003
IntervalTime
Passenger Cars - West Approach Trucks - West Approach Heavys - West Approach Pedestrians
Left Left LeftThru Thru ThruRight Right Right West Cross
Cum Cum Cum Cum Cum Cum Cum Cum Cum CumIncr Incr Incr Incr Incr Incr Incr Incr Incr Incr10:00:00 0 0 0 0 0 0 0 0 0 0 0 0 0 0 0 0 0 0 0 010:15:00 0 0 83 83 0 0 0 0 5 5 0 0 0 0 0 0 0 0 0 010:30:00 0 0 186 103 0 0 0 0 7 2 0 0 0 0 0 0 0 0 0 010:45:00 0 0 268 82 0 0 0 0 10 3 0 0 0 0 0 0 0 0 0 011:00:00 0 0 372 104 0 0 0 0 13 3 0 0 0 0 0 0 0 0 0 011:15:00 0 0 495 123 0 0 0 0 15 2 0 0 0 0 0 0 0 0 0 011:30:00 1 1 589 94 0 0 0 0 17 2 0 0 0 0 0 0 0 0 0 011:45:00 1 0 712 123 1 1 0 0 18 1 0 0 0 0 0 0 0 0 0 012:00:00 2 1 813 101 1 0 0 0 19 1 0 0 0 0 0 0 0 0 0 012:15:00 3 1 909 96 1 0 0 0 21 2 0 0 0 0 0 0 0 0 0 012:30:00 4 1 1009 100 2 1 0 0 24 3 0 0 0 0 0 0 0 0 0 012:45:00 4 0 1011 2 2 0 0 0 24 0 0 0 0 0 0 0 0 0 0 013:00:00 4 0 1011 0 2 0 0 0 24 0 0 0 0 0 0 0 0 0 0 013:15:00 4 0 1103 92 2 0 0 0 32 8 0 0 0 0 0 0 0 0 0 013:30:00 5 1 1195 92 2 0 0 0 36 4 0 0 0 0 0 0 0 0 0 013:45:00 6 1 1292 97 2 0 0 0 39 3 0 0 0 0 0 0 0 0 0 014:00:00 6 0 1391 99 2 0 0 0 42 3 0 0 0 0 0 0 0 0 0 014:15:00 6 0 1493 102 2 0 0 0 45 3 0 0 0 0 0 0 0 0 0 014:30:00 8 2 1606 113 2 0 0 0 49 4 0 0 0 0 0 0 0 0 0 014:45:00 8 0 1724 118 2 0 0 0 51 2 0 0 0 0 0 0 0 0 0 015:00:00 8 0 1837 113 4 2 0 0 55 4 0 0 0 0 0 0 0 0 0 015:15:00 9 1 2007 170 4 0 0 0 56 1 0 0 0 0 0 0 0 0 0 015:30:00 9 0 2103 96 4 0 0 0 60 4 0 0 0 0 0 0 0 0 0 015:45:00 9 0 2121 18 4 0 0 0 61 1 0 0 0 0 0 0 0 0 0 016:00:00 9 0 2121 0 4 0 0 0 61 0 0 0 0 0 0 0 0 0 0 016:15:00 10 1 2269 148 5 1 0 0 63 2 0 0 0 0 0 0 0 0 0 016:30:00 12 2 2374 105 6 1 0 0 64 1 0 0 0 0 0 0 0 0 0 016:45:00 13 1 2499 125 7 1 0 0 66 2 0 0 0 0 0 0 0 0 1 117:00:00 13 0 2613 114 7 0 0 0 67 1 0 0 0 0 0 0 0 0 3 217:15:00 13 0 2741 128 8 1 0 0 69 2 0 0 0 0 0 0 0 0 3 017:30:00 13 0 2858 117 8 0 0 0 69 0 0 0 0 0 0 0 0 0 3 017:45:00 13 0 2944 86 8 0 0 0 69 0 0 0 0 0 0 0 0 0 3 018:00:00 13 0 3028 84 8 0 0 0 69 0 0 0 0 0 0 0 0 0 3 018:15:00 13 0 3029 1 8 0 0 0 69 0 0 0 0 0 0 0 0 0 3 018:15:09 13 0 3030 1 8 0 0 0 69 0 0 0 0 0 0 0 0 0 3 0

Ontario Traffic IncMorning Peak Diagram Specified Period
From:To:
10:00:0018:00:00
One Hour PeakFrom:To:
14:30:0015:30:00
Municipality:Site #:Intersection:TFR File #:Count date:
Cobourg1518400004County Rd 2 & Burnham Family Mar222-Jul-15
Weather conditions:
Person(s) who counted:
** Non-Signalized Intersection ** Major Road: County Rd 2 runs W/E
North Leg Total:
North Entering:
North Peds:
Peds Cross:
90
44
0
Heavys
Trucks
Cars
Totals
0
0
18
18
0
0
26
26
0
0
44
Heavys
Trucks
Cars
Totals
0
0
46
46
Heavys Trucks Cars Totals
0 0 18 18
Heavys Trucks Cars Totals
0 0 8 8
0 0 0 0
0 0 8
Peds Cross:
West Peds:
West Entering:
West Leg Total:
0
8
26
Burnham Family Market Driveway
County Rd 2W
N
E
SCounty Rd 2
East Leg Total:
East Entering:
East Peds:
Peds Cross:
64
38
0
Cars Trucks Heavys Totals
38 0 0 38
0 0 0 0
38 0 0
Cars Trucks Heavys Totals
26 0 0 26
Comments

Ontario Traffic IncTotal Count Diagram
Municipality:Site #:Intersection:TFR File #:Count date:
Cobourg1518400004County Rd 2 & Burnham Family Mar222-Jul-15
Weather conditions:
Person(s) who counted:
** Non-Signalized Intersection ** Major Road: County Rd 2 runs W/E
North Leg Total:
North Entering:
North Peds:
Peds Cross:
454
215
1
Heavys
Trucks
Cars
Totals
0
0
81
81
0
1
133
134
0
1
214
Heavys
Trucks
Cars
Totals
0
1
238
239
Heavys Trucks Cars Totals
0 0 81 81
Heavys Trucks Cars Totals
0 0 76 76
0 0 0 0
0 0 76
Peds Cross:
West Peds:
West Entering:
West Leg Total:
0
76
157
Burnham Family Market Driveway
County Rd 2W
N
E
SCounty Rd 2
East Leg Total:
East Entering:
East Peds:
Peds Cross:
297
163
0
Cars Trucks Heavys Totals
162 1 0 163
0 0 0 0
162 1 0
Cars Trucks Heavys Totals
133 1 0 134
Comments

Ontario Traffic IncTraffic Count Summary
Intersection: County Rd 2 & Burnham Family MaCount Date: 22-Jul-15 Municipality: CobourgNorth Approach Totals South Approach Totals
East Approach Totals West Approach Totals
Includes Cars, Trucks, & Heavys Includes Cars, Trucks, & Heavys
Includes Cars, Trucks, & Heavys Includes Cars, Trucks, & Heavys
Hour Hour
Hour Hour
Ending Ending
Ending Ending
Left Left
Left Left
Thru Thru
Thru Thru
Right Right
Right Right
Grand Grand
Grand Grand
Total Total
Total Total
Total Total
Total Total
Peds Peds
Peds Peds
North/South
East/West
Total
Total
Approaches
Approaches
Calculated Values for Traffic Crossing Major StreetHours Ending:Crossing Values:
Totals:
Totals:
10:00:00 0 0 0 0 0 0 10:00:00 0 0 0 0 011:00:00 17 0 18 35 0 35 11:00:00 0 0 0 0 012:00:00 29 0 7 36 0 36 12:00:00 0 0 0 0 013:00:00 12 0 9 21 0 21 13:00:00 0 0 0 0 014:00:00 14 0 8 22 0 22 14:00:00 0 0 0 0 015:00:00 16 0 10 26 0 26 15:00:00 0 0 0 0 116:00:00 18 0 11 29 0 29 16:00:00 0 0 0 0 017:00:00 23 0 12 35 1 35 17:00:00 0 0 0 0 018:00:00 5 0 6 11 0 11 18:00:00 0 0 0 0 0
10:00:00 0 0 0 0 0 0 10:00:00 0 0 0 0 011:00:00 0 0 27 27 0 39 11:00:00 12 0 0 12 012:00:00 0 0 32 32 0 42 12:00:00 10 0 0 10 013:00:00 0 0 13 13 0 20 13:00:00 7 0 0 7 014:00:00 0 0 12 12 0 21 14:00:00 9 0 0 9 015:00:00 0 0 34 34 0 43 15:00:00 9 0 0 9 016:00:00 0 0 19 19 0 26 16:00:00 7 0 0 7 017:00:00 0 0 19 19 0 36 17:00:00 17 0 0 17 018:00:00 0 0 7 7 0 12 18:00:00 5 0 0 5 0
11:00 12:00 13:00 14:00 15:00 16:00 17:00 18:0017 29 12 14 16 18 23 5
134 0 81 215 1 215 0 0 0 0 1
0 0 163 163 0 239 76 0 0 76 0

Ontario Traffic IncCount Date: 22-Jul-15 Site #: 1518400004
IntervalTime
Passenger Cars - North Approach Trucks - North Approach Heavys - North Approach Pedestrians
Left Left LeftThru Thru ThruRight Right Right North Cross
Cum Cum Cum Cum Cum Cum Cum Cum Cum CumIncr Incr Incr Incr Incr Incr Incr Incr Incr Incr10:00:00 0 0 0 0 0 0 0 0 0 0 0 0 0 0 0 0 0 0 0 010:15:00 3 3 0 0 3 3 0 0 0 0 0 0 0 0 0 0 0 0 0 010:30:00 7 4 0 0 8 5 0 0 0 0 0 0 0 0 0 0 0 0 0 010:45:00 14 7 0 0 11 3 0 0 0 0 0 0 0 0 0 0 0 0 0 011:00:00 17 3 0 0 18 7 0 0 0 0 0 0 0 0 0 0 0 0 0 011:15:00 21 4 0 0 21 3 0 0 0 0 0 0 0 0 0 0 0 0 0 011:30:00 31 10 0 0 23 2 1 1 0 0 0 0 0 0 0 0 0 0 0 011:45:00 39 8 0 0 24 1 1 0 0 0 0 0 0 0 0 0 0 0 0 012:00:00 45 6 0 0 25 1 1 0 0 0 0 0 0 0 0 0 0 0 0 012:15:00 54 9 0 0 31 6 1 0 0 0 0 0 0 0 0 0 0 0 0 012:30:00 57 3 0 0 34 3 1 0 0 0 0 0 0 0 0 0 0 0 0 012:45:00 57 0 0 0 34 0 1 0 0 0 0 0 0 0 0 0 0 0 0 013:00:00 57 0 0 0 34 0 1 0 0 0 0 0 0 0 0 0 0 0 0 013:15:00 62 5 0 0 35 1 1 0 0 0 0 0 0 0 0 0 0 0 0 013:30:00 63 1 0 0 35 0 1 0 0 0 0 0 0 0 0 0 0 0 0 013:45:00 67 4 0 0 38 3 1 0 0 0 0 0 0 0 0 0 0 0 0 014:00:00 71 4 0 0 42 4 1 0 0 0 0 0 0 0 0 0 0 0 0 014:15:00 73 2 0 0 42 0 1 0 0 0 0 0 0 0 0 0 0 0 0 014:30:00 79 6 0 0 44 2 1 0 0 0 0 0 0 0 0 0 0 0 0 014:45:00 85 6 0 0 50 6 1 0 0 0 0 0 0 0 0 0 0 0 0 015:00:00 87 2 0 0 52 2 1 0 0 0 0 0 0 0 0 0 0 0 0 015:15:00 97 10 0 0 57 5 1 0 0 0 0 0 0 0 0 0 0 0 0 015:30:00 105 8 0 0 62 5 1 0 0 0 0 0 0 0 0 0 0 0 0 015:45:00 105 0 0 0 63 1 1 0 0 0 0 0 0 0 0 0 0 0 0 016:00:00 105 0 0 0 63 0 1 0 0 0 0 0 0 0 0 0 0 0 0 016:15:00 112 7 0 0 66 3 1 0 0 0 0 0 0 0 0 0 0 0 1 116:30:00 118 6 0 0 69 3 1 0 0 0 0 0 0 0 0 0 0 0 1 016:45:00 126 8 0 0 71 2 1 0 0 0 0 0 0 0 0 0 0 0 1 017:00:00 128 2 0 0 75 4 1 0 0 0 0 0 0 0 0 0 0 0 1 017:15:00 129 1 0 0 76 1 1 0 0 0 0 0 0 0 0 0 0 0 1 017:30:00 130 1 0 0 77 1 1 0 0 0 0 0 0 0 0 0 0 0 1 017:45:00 132 2 0 0 80 3 1 0 0 0 0 0 0 0 0 0 0 0 1 018:00:00 133 1 0 0 81 1 1 0 0 0 0 0 0 0 0 0 0 0 1 018:15:00 133 0 0 0 81 0 1 0 0 0 0 0 0 0 0 0 0 0 1 018:15:02 133 0 0 0 81 0 1 0 0 0 0 0 0 0 0 0 0 0 1 0

Ontario Traffic IncCount Date: 22-Jul-15 Site #: 1518400004
IntervalTime
Passenger Cars - East Approach Trucks - East Approach Heavys - East Approach Pedestrians
Left Left LeftThru Thru ThruRight Right Right East Cross
Cum Cum Cum Cum Cum Cum Cum Cum Cum CumIncr Incr Incr Incr Incr Incr Incr Incr Incr Incr10:00:00 0 0 0 0 0 0 0 0 0 0 0 0 0 0 0 0 0 0 0 010:15:00 0 0 0 0 6 6 0 0 0 0 0 0 0 0 0 0 0 0 0 010:30:00 0 0 0 0 15 9 0 0 0 0 0 0 0 0 0 0 0 0 0 010:45:00 0 0 0 0 18 3 0 0 0 0 0 0 0 0 0 0 0 0 0 011:00:00 0 0 0 0 27 9 0 0 0 0 0 0 0 0 0 0 0 0 0 011:15:00 0 0 0 0 33 6 0 0 0 0 0 0 0 0 0 0 0 0 0 011:30:00 0 0 0 0 42 9 0 0 0 0 0 0 0 0 0 0 0 0 0 011:45:00 0 0 0 0 48 6 0 0 0 0 0 0 0 0 0 0 0 0 0 012:00:00 0 0 0 0 59 11 0 0 0 0 0 0 0 0 0 0 0 0 0 012:15:00 0 0 0 0 63 4 0 0 0 0 0 0 0 0 0 0 0 0 0 012:30:00 0 0 0 0 72 9 0 0 0 0 0 0 0 0 0 0 0 0 0 012:45:00 0 0 0 0 72 0 0 0 0 0 0 0 0 0 0 0 0 0 0 013:00:00 0 0 0 0 72 0 0 0 0 0 0 0 0 0 0 0 0 0 0 013:15:00 0 0 0 0 73 1 0 0 0 0 0 0 0 0 0 0 0 0 0 013:30:00 0 0 0 0 76 3 0 0 0 0 1 1 0 0 0 0 0 0 0 013:45:00 0 0 0 0 79 3 0 0 0 0 1 0 0 0 0 0 0 0 0 014:00:00 0 0 0 0 83 4 0 0 0 0 1 0 0 0 0 0 0 0 0 014:15:00 0 0 0 0 89 6 0 0 0 0 1 0 0 0 0 0 0 0 0 014:30:00 0 0 0 0 96 7 0 0 0 0 1 0 0 0 0 0 0 0 0 014:45:00 0 0 0 0 106 10 0 0 0 0 1 0 0 0 0 0 0 0 0 015:00:00 0 0 0 0 117 11 0 0 0 0 1 0 0 0 0 0 0 0 0 015:15:00 0 0 0 0 124 7 0 0 0 0 1 0 0 0 0 0 0 0 0 015:30:00 0 0 0 0 134 10 0 0 0 0 1 0 0 0 0 0 0 0 0 015:45:00 0 0 0 0 136 2 0 0 0 0 1 0 0 0 0 0 0 0 0 016:00:00 0 0 0 0 136 0 0 0 0 0 1 0 0 0 0 0 0 0 0 016:15:00 0 0 0 0 142 6 0 0 0 0 1 0 0 0 0 0 0 0 0 016:30:00 0 0 0 0 148 6 0 0 0 0 1 0 0 0 0 0 0 0 0 016:45:00 0 0 0 0 154 6 0 0 0 0 1 0 0 0 0 0 0 0 0 017:00:00 0 0 0 0 155 1 0 0 0 0 1 0 0 0 0 0 0 0 0 017:15:00 0 0 0 0 156 1 0 0 0 0 1 0 0 0 0 0 0 0 0 017:30:00 0 0 0 0 160 4 0 0 0 0 1 0 0 0 0 0 0 0 0 017:45:00 0 0 0 0 161 1 0 0 0 0 1 0 0 0 0 0 0 0 0 018:00:00 0 0 0 0 162 1 0 0 0 0 1 0 0 0 0 0 0 0 0 018:15:00 0 0 0 0 162 0 0 0 0 0 1 0 0 0 0 0 0 0 0 018:15:02 0 0 0 0 162 0 0 0 0 0 1 0 0 0 0 0 0 0 0 0

Ontario Traffic IncCount Date: 22-Jul-15 Site #: 1518400004
IntervalTime
Passenger Cars - South Approach Trucks - South Approach Heavys - South Approach Pedestrians
Left Left LeftThru Thru ThruRight Right Right South Cross
Cum Cum Cum Cum Cum Cum Cum Cum Cum CumIncr Incr Incr Incr Incr Incr Incr Incr Incr Incr10:00:00 0 0 0 0 0 0 0 0 0 0 0 0 0 0 0 0 0 0 0 010:15:00 0 0 0 0 0 0 0 0 0 0 0 0 0 0 0 0 0 0 0 010:30:00 0 0 0 0 0 0 0 0 0 0 0 0 0 0 0 0 0 0 0 010:45:00 0 0 0 0 0 0 0 0 0 0 0 0 0 0 0 0 0 0 0 011:00:00 0 0 0 0 0 0 0 0 0 0 0 0 0 0 0 0 0 0 0 011:15:00 0 0 0 0 0 0 0 0 0 0 0 0 0 0 0 0 0 0 0 011:30:00 0 0 0 0 0 0 0 0 0 0 0 0 0 0 0 0 0 0 0 011:45:00 0 0 0 0 0 0 0 0 0 0 0 0 0 0 0 0 0 0 0 012:00:00 0 0 0 0 0 0 0 0 0 0 0 0 0 0 0 0 0 0 0 012:15:00 0 0 0 0 0 0 0 0 0 0 0 0 0 0 0 0 0 0 0 012:30:00 0 0 0 0 0 0 0 0 0 0 0 0 0 0 0 0 0 0 0 012:45:00 0 0 0 0 0 0 0 0 0 0 0 0 0 0 0 0 0 0 0 013:00:00 0 0 0 0 0 0 0 0 0 0 0 0 0 0 0 0 0 0 0 013:15:00 0 0 0 0 0 0 0 0 0 0 0 0 0 0 0 0 0 0 0 013:30:00 0 0 0 0 0 0 0 0 0 0 0 0 0 0 0 0 0 0 0 013:45:00 0 0 0 0 0 0 0 0 0 0 0 0 0 0 0 0 0 0 0 014:00:00 0 0 0 0 0 0 0 0 0 0 0 0 0 0 0 0 0 0 0 014:15:00 0 0 0 0 0 0 0 0 0 0 0 0 0 0 0 0 0 0 1 114:30:00 0 0 0 0 0 0 0 0 0 0 0 0 0 0 0 0 0 0 1 014:45:00 0 0 0 0 0 0 0 0 0 0 0 0 0 0 0 0 0 0 1 015:00:00 0 0 0 0 0 0 0 0 0 0 0 0 0 0 0 0 0 0 1 015:15:00 0 0 0 0 0 0 0 0 0 0 0 0 0 0 0 0 0 0 1 015:30:00 0 0 0 0 0 0 0 0 0 0 0 0 0 0 0 0 0 0 1 015:45:00 0 0 0 0 0 0 0 0 0 0 0 0 0 0 0 0 0 0 1 016:00:00 0 0 0 0 0 0 0 0 0 0 0 0 0 0 0 0 0 0 1 016:15:00 0 0 0 0 0 0 0 0 0 0 0 0 0 0 0 0 0 0 1 016:30:00 0 0 0 0 0 0 0 0 0 0 0 0 0 0 0 0 0 0 1 016:45:00 0 0 0 0 0 0 0 0 0 0 0 0 0 0 0 0 0 0 1 017:00:00 0 0 0 0 0 0 0 0 0 0 0 0 0 0 0 0 0 0 1 017:15:00 0 0 0 0 0 0 0 0 0 0 0 0 0 0 0 0 0 0 1 017:30:00 0 0 0 0 0 0 0 0 0 0 0 0 0 0 0 0 0 0 1 017:45:00 0 0 0 0 0 0 0 0 0 0 0 0 0 0 0 0 0 0 1 018:00:00 0 0 0 0 0 0 0 0 0 0 0 0 0 0 0 0 0 0 1 018:15:00 0 0 0 0 0 0 0 0 0 0 0 0 0 0 0 0 0 0 1 018:15:02 0 0 0 0 0 0 0 0 0 0 0 0 0 0 0 0 0 0 1 0

Ontario Traffic IncCount Date: 22-Jul-15 Site #: 1518400004
IntervalTime
Passenger Cars - West Approach Trucks - West Approach Heavys - West Approach Pedestrians
Left Left LeftThru Thru ThruRight Right Right West Cross
Cum Cum Cum Cum Cum Cum Cum Cum Cum CumIncr Incr Incr Incr Incr Incr Incr Incr Incr Incr10:00:00 0 0 0 0 0 0 0 0 0 0 0 0 0 0 0 0 0 0 0 010:15:00 3 3 0 0 0 0 0 0 0 0 0 0 0 0 0 0 0 0 0 010:30:00 7 4 0 0 0 0 0 0 0 0 0 0 0 0 0 0 0 0 0 010:45:00 9 2 0 0 0 0 0 0 0 0 0 0 0 0 0 0 0 0 0 011:00:00 12 3 0 0 0 0 0 0 0 0 0 0 0 0 0 0 0 0 0 011:15:00 12 0 0 0 0 0 0 0 0 0 0 0 0 0 0 0 0 0 0 011:30:00 15 3 0 0 0 0 0 0 0 0 0 0 0 0 0 0 0 0 0 011:45:00 20 5 0 0 0 0 0 0 0 0 0 0 0 0 0 0 0 0 0 012:00:00 22 2 0 0 0 0 0 0 0 0 0 0 0 0 0 0 0 0 0 012:15:00 24 2 0 0 0 0 0 0 0 0 0 0 0 0 0 0 0 0 0 012:30:00 29 5 0 0 0 0 0 0 0 0 0 0 0 0 0 0 0 0 0 012:45:00 29 0 0 0 0 0 0 0 0 0 0 0 0 0 0 0 0 0 0 013:00:00 29 0 0 0 0 0 0 0 0 0 0 0 0 0 0 0 0 0 0 013:15:00 29 0 0 0 0 0 0 0 0 0 0 0 0 0 0 0 0 0 0 013:30:00 30 1 0 0 0 0 0 0 0 0 0 0 0 0 0 0 0 0 0 013:45:00 33 3 0 0 0 0 0 0 0 0 0 0 0 0 0 0 0 0 0 014:00:00 38 5 0 0 0 0 0 0 0 0 0 0 0 0 0 0 0 0 0 014:15:00 38 0 0 0 0 0 0 0 0 0 0 0 0 0 0 0 0 0 0 014:30:00 45 7 0 0 0 0 0 0 0 0 0 0 0 0 0 0 0 0 0 014:45:00 45 0 0 0 0 0 0 0 0 0 0 0 0 0 0 0 0 0 0 015:00:00 47 2 0 0 0 0 0 0 0 0 0 0 0 0 0 0 0 0 0 015:15:00 53 6 0 0 0 0 0 0 0 0 0 0 0 0 0 0 0 0 0 015:30:00 53 0 0 0 0 0 0 0 0 0 0 0 0 0 0 0 0 0 0 015:45:00 54 1 0 0 0 0 0 0 0 0 0 0 0 0 0 0 0 0 0 016:00:00 54 0 0 0 0 0 0 0 0 0 0 0 0 0 0 0 0 0 0 016:15:00 63 9 0 0 0 0 0 0 0 0 0 0 0 0 0 0 0 0 0 016:30:00 68 5 0 0 0 0 0 0 0 0 0 0 0 0 0 0 0 0 0 016:45:00 71 3 0 0 0 0 0 0 0 0 0 0 0 0 0 0 0 0 0 017:00:00 71 0 0 0 0 0 0 0 0 0 0 0 0 0 0 0 0 0 0 017:15:00 73 2 0 0 0 0 0 0 0 0 0 0 0 0 0 0 0 0 0 017:30:00 74 1 0 0 0 0 0 0 0 0 0 0 0 0 0 0 0 0 0 017:45:00 76 2 0 0 0 0 0 0 0 0 0 0 0 0 0 0 0 0 0 018:00:00 76 0 0 0 0 0 0 0 0 0 0 0 0 0 0 0 0 0 0 018:15:00 76 0 0 0 0 0 0 0 0 0 0 0 0 0 0 0 0 0 0 018:15:02 76 0 0 0 0 0 0 0 0 0 0 0 0 0 0 0 0 0 0 0

Appendix B
OTM Traffic Signal Warrants

Input Data Sheet
What are the intersecting roadways? Apple Orchard Road / County Road 2
What is the direction of the Main Road street? When was the data collected? 2015-07-18
Justification 1 - 4: Volume Warrants
a.- Number of lanes on the Main Road?
b.- Number of lanes on the Minor Road?
c.- How many approaches?
d.- What is the operating environment? AND Speed >= 70 km/hr
e.- What is the eight hour vehicle volume at the intersection? (Please fill in table below)
LT TH RT LT TH RT LT TH RT LT TH RT
17 370 2 0 0 0 1 374 49 46 0 19 1
18 423 0 1 0 3 2 395 53 42 0 20 0
17 397 2 1 0 2 2 398 49 33 0 20 0
15 370 3 0 0 0 1 401 45 24 0 19 0
22 415 0 1 0 1 2 383 34 38 1 15 2
18 372 1 1 0 1 2 385 32 29 1 19 3
14 329 1 0 0 1 2 386 30 20 0 22 3
6 283 0 0 0 1 0 318 11 12 0 5 1
127 2,959 9 4 0 9 12 3,040 303 244 2 139 10
Population < 10,000
12:00
Minor Southbound Approach Pedestrians
Crossing Main
Road
Hour Ending
11:00
Main Eastbound Approach Main Westbound ApproachMinor Northbound Approach
18:00
Total
13:00
14:00
15:00
17:00
16:00
Apple Orchard Road / County Road 2
East-West
1
4
Rural
GO TO Justification:Analysis Sheet Results Sheet
1
Proposed Collision
2015-07-18
Input Data OTM Saturday Warrant.xls 7/27/2015

Results Sheet
Intersection: Apple Orchard Road / County Road 2 Count Date: 2015-07-18
YES NO
A Total Volume 100 %
B Crossing Volume 41 %
A Main Road 100 %
B Crossing Road 65 %
A Justificaton 1 41 %
B Justification 2 65 %
4. 4-Hr Volume35 % FALSE TRUE
Signal Justified?
3. Combination
2. Delay to
Cross
Traffic
FALSE TRUE
FALSE TRUE
FALSE TRUE
Summary Results
1. Minimum
Vehicular
Volume
ComplianceJustification
GO TO Justification:Input Sheet Analysis Sheet Proposed Collision
Results Sheet OTM Saturday Warrant.xls 7/27/2015

Input Data Sheet
What are the intersecting roadways? Apple Orchard Road / County Road 2
What is the direction of the Main Road street? When was the data collected? 2015-07-22
Justification 1 - 4: Volume Warrants
a.- Number of lanes on the Main Road?
b.- Number of lanes on the Minor Road?
c.- How many approaches?
d.- What is the operating environment? AND Speed >= 70 km/hr
e.- What is the eight hour vehicle volume at the intersection? (Please fill in table below)
LT TH RT LT TH RT LT TH RT LT TH RT
12 373 0 1 0 1 1 361 37 18 0 21 0
12 437 1 2 0 0 1 413 37 30 0 9 0
12 413 1 2 1 0 1 421 28 23 1 12 0
11 389 0 1 1 0 1 428 18 15 1 15 0
11 450 2 1 0 2 3 426 37 25 0 13 0
16 466 3 1 0 3 2 430 30 27 0 14 2
21 481 3 1 0 3 1 434 22 28 0 15 3
5 412 1 0 0 1 0 398 11 9 0 8 0
100 3,421 11 9 2 10 10 3,311 220 175 2 107 5Total
13:00
14:00
15:00
17:00
16:00
12:00
Minor Southbound Approach Pedestrians
Crossing Main
Road
Hour Ending
11:00
Main Eastbound Approach Main Westbound ApproachMinor Northbound Approach
18:00
Population < 10,000
Apple Orchard Road / County Road 2
East-West
1
4
Rural
GO TO Justification:Analysis Sheet Results Sheet
1
Proposed Collision
2015-07-22
Input Data OTM Weekday Warrant.xls 7/27/2015

Results Sheet
Intersection: Apple Orchard Road / County Road 2 Count Date: 2015-07-22
YES NO
A Total Volume 100 %
B Crossing Volume 32 %
A Main Road 100 %
B Crossing Road 48 %
A Justificaton 1 32 %
B Justification 2 48 %
4. 4-Hr Volume30 % FALSE TRUE
Summary Results
1. Minimum
Vehicular
Volume
ComplianceJustificationSignal Justified?
3. Combination
2. Delay to
Cross
Traffic
FALSE TRUE
FALSE TRUE
FALSE TRUE
GO TO Justification:Input Sheet Analysis Sheet Proposed Collision
Results Sheet OTM Weekday Warrant.xls 7/27/2015

Appendix C
Synchro Results

HCM Unsignalized Intersection Capacity Analysis CR2 / Apple Orchard Rd Signal Warrant
3: Bob Carr Road/Apple Orchard Road & County Road 2 Existing Conditions Saturday Pk Hr
7/27/2015 Synchro 7 - Report
HDR Corporation Page 1
Movement EBL EBT EBR WBL WBT WBR NBL NBT NBR SBL SBT SBR
Lane Configurations
Volume (veh/h) 3 438 0 2 410 3 1 0 3 6 0 5
Sign Control Free Free Stop Stop
Grade 0% 0% 0% 0%
Peak Hour Factor 0.92 0.92 0.92 0.92 0.92 0.92 0.92 0.92 0.92 0.92 0.92 0.92
Hourly flow rate (vph) 3 476 0 2 446 3 1 0 3 7 0 5
Pedestrians
Lane Width (m)
Walking Speed (m/s)
Percent Blockage
Right turn flare (veh)
Median type None None
Median storage veh)
Upstream signal (m)
pX, platoon unblocked
vC, conflicting volume 449 476 940 936 476 938 934 447
vC1, stage 1 conf vol
vC2, stage 2 conf vol
vCu, unblocked vol 449 476 940 936 476 938 934 447
tC, single (s) 4.1 4.1 7.1 6.5 6.2 7.1 6.5 6.2
tC, 2 stage (s)
tF (s) 2.2 2.2 3.5 4.0 3.3 3.5 4.0 3.3
p0 queue free % 100 100 100 100 99 97 100 99
cM capacity (veh/h) 1122 1097 243 266 593 244 266 616
Direction, Lane # EB 1 WB 1 NB 1 SB 1
Volume Total 479 451 4 12
Volume Left 3 2 1 7
Volume Right 0 3 3 5
cSH 1122 1097 436 337
Volume to Capacity 0.00 0.00 0.01 0.04
Queue Length 95th (m) 0.1 0.0 0.2 0.8
Control Delay (s) 0.1 0.1 13.3 16.1
Lane LOS A A B C
Approach Delay (s) 0.1 0.1 13.3 16.1
Approach LOS B C
Intersection Summary
Average Delay 0.3
Intersection Capacity Utilization 35.1% ICU Level of Service A
Analysis Period (min) 15

HCM Unsignalized Intersection Capacity Analysis CR2 / Apple Orchard Rd Signal Warrant
6: County Road 2 & Burnham Driveway Existing Conditions Saturday Pk Hr
7/27/2015 Synchro 7 - Report
HDR Corporation Page 2
Movement EBL EBT WBT WBR SBL SBR
Lane Configurations
Volume (veh/h) 17 430 398 48 37 17
Sign Control Free Free Stop
Grade 0% 0% 0%
Peak Hour Factor 0.92 0.92 0.92 0.92 0.92 0.92
Hourly flow rate (vph) 18 467 433 52 40 18
Pedestrians
Lane Width (m)
Walking Speed (m/s)
Percent Blockage
Right turn flare (veh)
Median type None None
Median storage veh)
Upstream signal (m)
pX, platoon unblocked
vC, conflicting volume 485 963 459
vC1, stage 1 conf vol
vC2, stage 2 conf vol
vCu, unblocked vol 485 963 459
tC, single (s) 4.1 6.4 6.2
tC, 2 stage (s)
tF (s) 2.2 3.5 3.3
p0 queue free % 98 86 97
cM capacity (veh/h) 1089 281 606
Direction, Lane # EB 1 WB 1 SB 1
Volume Total 486 485 59
Volume Left 18 0 40
Volume Right 0 52 18
cSH 1089 1700 338
Volume to Capacity 0.02 0.29 0.17
Queue Length 95th (m) 0.4 0.0 4.7
Control Delay (s) 0.5 0.0 17.9
Lane LOS A C
Approach Delay (s) 0.5 0.0 17.9
Approach LOS C
Intersection Summary
Average Delay 1.3
Intersection Capacity Utilization 46.4% ICU Level of Service A
Analysis Period (min) 15

HCM Unsignalized Intersection Capacity Analysis CR2 / Apple Orchard Rd Signal Warrant
3: Bob Carr Road/Apple Orchard Road & County Road 2 Existing Conditions Weekday Pk Hr
7/27/2015 Synchro 7 - Report
HDR Corporation Page 1
Movement EBL EBT EBR WBL WBT WBR NBL NBT NBR SBL SBT SBR
Lane Configurations
Volume (veh/h) 3 525 2 1 468 4 0 0 2 9 0 3
Sign Control Free Free Stop Stop
Grade 0% 0% 0% 0%
Peak Hour Factor 0.92 0.92 0.92 0.92 0.92 0.92 0.92 0.92 0.92 0.92 0.92 0.92
Hourly flow rate (vph) 3 571 2 1 509 4 0 0 2 10 0 3
Pedestrians
Lane Width (m)
Walking Speed (m/s)
Percent Blockage
Right turn flare (veh)
Median type None None
Median storage veh)
Upstream signal (m)
pX, platoon unblocked
vC, conflicting volume 513 573 1095 1093 572 1093 1092 511
vC1, stage 1 conf vol
vC2, stage 2 conf vol
vCu, unblocked vol 513 573 1095 1093 572 1093 1092 511
tC, single (s) 4.1 5.1 7.1 6.5 6.7 7.1 6.5 6.2
tC, 2 stage (s)
tF (s) 2.2 3.1 3.5 4.0 3.8 3.5 4.0 3.3
p0 queue free % 100 100 100 100 100 95 100 99
cM capacity (veh/h) 1063 653 191 215 440 192 215 567
Direction, Lane # EB 1 WB 1 NB 1 SB 1
Volume Total 576 514 2 13
Volume Left 3 1 0 10
Volume Right 2 4 2 3
cSH 1063 653 440 230
Volume to Capacity 0.00 0.00 0.00 0.06
Queue Length 95th (m) 0.1 0.0 0.1 1.4
Control Delay (s) 0.1 0.0 13.2 21.6
Lane LOS A A B C
Approach Delay (s) 0.1 0.0 13.2 21.6
Approach LOS B C
Intersection Summary
Average Delay 0.3
Intersection Capacity Utilization 44.0% ICU Level of Service A
Analysis Period (min) 15

HCM Unsignalized Intersection Capacity Analysis CR2 / Apple Orchard Rd Signal Warrant
6: County Road 2 & Burnham Driveway Existing Conditions Weekday Pk Hr
7/27/2015 Synchro 7 - Report
HDR Corporation Page 2
Movement EBL EBT WBT WBR SBL SBR
Lane Configurations
Volume (veh/h) 8 528 455 38 26 18
Sign Control Free Free Stop
Grade 0% 0% 0%
Peak Hour Factor 0.92 0.92 0.92 0.92 0.92 0.92
Hourly flow rate (vph) 9 574 495 41 28 20
Pedestrians
Lane Width (m)
Walking Speed (m/s)
Percent Blockage
Right turn flare (veh)
Median type None None
Median storage veh)
Upstream signal (m)
pX, platoon unblocked
vC, conflicting volume 536 1107 515
vC1, stage 1 conf vol
vC2, stage 2 conf vol
vCu, unblocked vol 536 1107 515
tC, single (s) 4.1 6.4 6.2
tC, 2 stage (s)
tF (s) 2.2 3.5 3.3
p0 queue free % 99 88 97
cM capacity (veh/h) 1042 233 564
Direction, Lane # EB 1 WB 1 SB 1
Volume Total 583 536 48
Volume Left 9 0 28
Volume Right 0 41 20
cSH 1042 1700 306
Volume to Capacity 0.01 0.32 0.16
Queue Length 95th (m) 0.2 0.0 4.1
Control Delay (s) 0.2 0.0 18.9
Lane LOS A C
Approach Delay (s) 0.2 0.0 18.9
Approach LOS C
Intersection Summary
Average Delay 0.9
Intersection Capacity Utilization 44.2% ICU Level of Service A
Analysis Period (min) 15