APPENDIX H NOISE - Arkansas Department of Transportation · 2005-10-24 · 2024 40,900 12 4499 54...
12
FINAL ENVIRONMENTAL IMPACT STATEMENT SPRINGDALE NORTHERN BYPASS APPENDIX H NOISE
Transcript of APPENDIX H NOISE - Arkansas Department of Transportation · 2005-10-24 · 2024 40,900 12 4499 54...

FINAL ENVIRONMENTAL IMPACT STATEMENT SPRINGDALE NORTHERN BYPASS
APPENDIX H
NOISE


FINAL ENVIRONMENTAL IMPACT STATEMENT SPRINGDALE NORTHERN BYPASS
Traffic Noise Model (TNM) 2.0 Input Data
Job Number : 001966 Job Name: Springdale Northern Bypass Roadway Reference: Highway 412 Counties: Benton & Washington Design Year: 2024 Year(s) To Be Modeled: 2004 & 2024 Roadway Cross-Sections: 2004: 12' - 12' - 60' - 12' - 12' Y-coordinates: 100, 184 2024: 12' - 12' - 60' - 12' - 12' Y-coordinates: 100, 184 Operating Speed: 70 mph
Table H-1 Noise Analysis Segments
Noise Segment Name
Endpoints Used in Noise Analysis
Corresponding FEIS Segments
East Highway 265 to Highway 412 Eastern portion of Segment D-E and Segment E-F
East Central Highway 71B to Highway 265 Western portion of Segment D-E
Central East I-540 to Highway 71B Segment C-D
Central West Highway 112 to I-540 Segment B-C
West Highway 412 to Highway 112 Segment A-B
Table H-2 Noise Reduction Coefficient for Noise Segments
Noise Segment Noise Reduction Coefficient/Corresponding Ground Type
East 0.5 / Field Grass (Rural location)
East Central 0.3 / Lawn (Between a Rural & an Urban location)
Central East 0.3 / Lawn (Between a Rural & an Urban location)
Central West 0.5 / Field Grass (Rural location)
West 0.5 / Field Grass (Rural location)
NOISE H-1

FINAL ENVIRONMENTAL IMPACT STATEMENT SPRINGDALE NORTHERN BYPASS
Table H-3 Non-toll Roadway Noise Segments Traffic Input Values
Noise Segment Year Traffic Information for Segment TNM 2.0 Input Values
ADT %Truck DHV MT10% HT90% Cars Cars/2 MT/2 HT/2
2004 10,800 12 1188 14 128 1045 523 7 64 East
2024 19,600 12 2156 26 233 1897 949 13 116
2004 15,900 12 1749 21 189 1539 770 10 94 East Central
2024 28,600 12 3146 38 340 2768 1384 19 170
2004 19,700 12 2167 26 234 1907 953 13 117 Central East
2024 35,500 12 3905 47 422 3436 1718 23 211
2004 19,400 12 2134 26 230 1878 939 13 115 Central West (includes Airport Access
Road traffic) 2024 37,600 12 4136 50 447 3640 1820 25 223
2004 17,600 12 1936 23 209 1704 852 12 105
Line 2
West (includes Airport Access
Road traffic) 2024 34,200 12 3762 45 406 3311 1655 23 203
2004 9,800 12 1078 13 116 949 474 6 58 East
2024 17,700 12 1947 23 210 1713 857 12 105
2004 18,000 12 1980 24 214 1742 871 12 107 East Central
2024 32,500 12 3575 43 386 3146 1573 21 193
2004 22,900 12 2519 30 272 2217 1108 15 136 Central East
2024 40,900 12 4499 54 486 3959 1980 27 243
2004 20,300 12 2233 27 241 1965 983 13 121 Central West (includes Airport Access
Road traffic) 2024 39,000 12 4290 51 463 3775 1888 26 232
2004 18,300 12 2013 24 217 1771 886 12 109
Line 3
West (includes Airport Access
Road traffic) 2024 35,500 12 3905 47 422 3436 1718 23 211
H-2 NOISE

FINAL ENVIRONMENTAL IMPACT STATEMENT SPRINGDALE NORTHERN BYPASS
Table H-3, Continued Non-toll Roadway Noise Segments Traffic Input Values
Noise Segment Year Traffic Information for Segment TNM 2.0 Input Values
ADT %Truck DHV MT10% HT90% Cars Cars/2 MT/2 HT/2
2004 10,600 12 1166 14 126 1026 513 7 63 East
2024 19,200 12 2112 25 228 1859 929 13 114
2004 18,300 12 2013 24 217 1771 886 12 109 East Central
2024 33,100 12 3641 44 393 3204 1602 22 197
2004 20,400 12 2244 27 242 1975 987 13 121 Central East
2024 36,900 12 4059 49 438 3572 1786 24 219
2004 19,000 12 2090 25 226 1839 920 13 113 Central West (includes Airport Access
Road traffic) 2024 39,900 12 4389 53 474 3862 1931 26 237
2004 16,100 12 1771 21 191 1558 779 11 96
Line 4
West (includes Airport Access
Road traffic)) 2024 31,600 12 3476 42 375 3059 1529 21 188
2004 10,800 12 1188 14 128 1045 523 7 64 East
2024 19,600 12 2156 26 233 1897 949 13 116
2004 16,100 12 1771 21 191 1558 779 11 96 East Central
2024 29,000 12 3190 38 345 2807 1404 19 172
2004 20,800 12 2288 27 247 2013 1007 14 124 Central East
2024 37,600 12 4136 50 447 3640 1820 25 223
2004 18,400 12 2024 24 219 1781 891 12 109 Central West (includes Airport Access
Road traffic) 2024 36,900 12 4059 49 438 3572 1786 24 219
2004 17,300 12 1903 23 206 1675 837 11 103
Line 5
West (includes Airport Access
Road traffic) 2024 33,700 12 3707 44 400 3262 1631 22 200
NOISE H-3

FINAL ENVIRONMENTAL IMPACT STATEMENT SPRINGDALE NORTHERN BYPASS
Table H-4 Toll Roadway Noise Segments Traffic Input Values
Noise Segment Year Traffic Information for Segment TNM 2.0 Input Values
ADT %Truck DHV MT10% HT90% Cars Cars/2 MT/2 HT/2
2004 7,200 12 792 10 86 697 348 5 43 East
2024 13,100 12 1441 17 156 1268 634 9 78
2004 10,600 12 1166 14 126 1026 513 7 63 East Central
2024 19,200 12 2112 25 228 1859 929 13 114
2004 13,200 12 1452 17 157 1278 639 9 78 Central East
2024 23,800 12 2618 31 283 2304 1152 16 141
2004 14,500 12 1595 19 172 1404 702 10 86 Central West (includes Airport Access
Road traffic) 2024 28,800 12 3168 38 342 2788 1394 19 171
2004 13,200 12 1452 17 157 1278 639 9 78
Line 2
West (includes Airport Access
Road traffic) 2024 26,300 12 2893 35 312 2546 1273 17 156
2004 6,600 12 726 9 78 639 319 4 39 East
2024 11,800 12 1298 16 140 1142 571 8 70
2004 12,100 12 1331 16 144 1171 586 8 72 East Central
2024 21,800 12 2398 29 259 2110 1055 14 129
2004 15,300 12 1683 20 182 1481 741 10 91 Central East
2024 27,400 12 3014 36 326 2652 1326 18 163
2004 15,100 12 1661 20 179 1462 731 10 90 Central West (includes Airport Access
Road traffic) 2024 29,900 12 3289 39 355 2894 1447 20 178
2004 13,700 12 1507 18 163 1326 663 9 81
Line 3
West (includes Airport Access
Road traffic) 2024 27,200 12 2992 36 323 2633 1316 18 162
H-4 NOISE

FINAL ENVIRONMENTAL IMPACT STATEMENT SPRINGDALE NORTHERN BYPASS
Table H-4, Continued Toll Roadway Noise Segments Traffic Input Values
Noise Segment Year Traffic Information for Segment TNM 2.0 Input Values
ADT %Truck DHV MT10% HT90% Cars Cars/2 MT/2 HT/2
2004 7,100 12 781 9 84 687 344 5 42 East
2024 12,900 12 1419 17 153 1249 624 9 77
2004 12,300 12 1353 16 146 1191 595 8 73 East Central
2024 22,100 12 2431 29 263 2139 1070 15 131
2004 13,700 12 1507 18 163 1326 663 9 81 Central East
2024 24,700 12 2717 33 293 2391 1195 16 147
2004 14,200 12 1562 19 169 1375 687 9 84 Central West (includes Airport Access
Road traffic) 2024 30,300 12 3333 40 360 2933 1467 20 180
2004 12,300 12 1353 16 146 1191 595 8 73
Line 4
West (includes Airport Access
Road traffic) 2024 24,700 12 2717 33 293 2391 1195 16 147
2004 7,200 12 792 10 86 697 348 5 43 East
2024 13,100 12 1441 17 156 1268 634 9 78
2004 10,800 12 1188 14 128 1045 523 7 64 East Central
2024 19,500 12 2145 26 232 1888 944 13 116
2004 13,900 12 1529 18 165 1346 673 9 83 Central East
2024 25,200 12 2772 33 299 2439 1220 17 150
2004 14,200 12 1562 19 169 1375 687 9 84 Central West (includes Airport Access
Road traffic) 2024 28,300 12 3113 37 336 2739 1370 19 168
2004 13,000 12 1430 17 154 1258 629 9 77
Line 5
West (includes Airport Access
Road traffic) 2024 26,000 12 2860 34 309 2517 1258 17 154
NOISE H-5

FINAL ENVIRONMENTAL IMPACT STATEMENT SPRINGDALE NORTHERN BYPASS
Table H-5 Non-toll Ambient Noise Contour Data
Noise Segment Year
Centerline Reference for the 66 dBA contour
line (feet)
Existing Ambient Noise Level (dBA)
10 dBA or Greater Increase
Value (dBA)
Centerline Reference for the10dBA or Greater
Increase Contour Line (feet)
2004 209 52 62 318 East
2024 273 52 62 423
2004 245 56 66 245 East Central
2024 325 56 66 325
2004 270 56 66 270 Central East
2024 358 56 66 358
2004 273 52 62 423 Central West
2024 369 52 62 564
2004 260 52 62 400
Line 2
West 2024 354 52 62 540
2004 200 52 62 304 East
2024 260 52 62 400
2004 260 56 66 260 East Central
2024 343 56 66 343
2004 292 56 66 292 Central East
2024 383 56 66 383
2004 279 52 62 435 Central West
2024 377 52 62 571
2004 264 52 62 404
Line 3
West 2024 362 52 62 550
H-6 NOISE

FINAL ENVIRONMENTAL IMPACT STATEMENT SPRINGDALE NORTHERN BYPASS
Table H-5, Continued Non-toll Ambient Noise Contour Data
Noise Segment Year
Centerline Reference for the 66 dBA Contour
Line (feet)
Existing Ambient Noise Level (dBA)
10 dBA or Greater Increase
Value (dBA)
Centerline Reference for the10dBA or Greater
Increase Contour Line (feet)
2004 209 52 62 318 East
2024 271 52 62 417
2004 260 56 66 260 East Central
2024 347 56 66 347
2004 276 56 66 276 Central East
2024 366 56 66 366
2004 270 52 62 417 Central West
2024 381 52 62 576
2004 250 52 62 385
Line 4
West 2024 343 52 62 527
2004 209 52 62 318 East
2024 273 52 62 423
2004 247 56 66 247 East Central
2024 325 56 66 325
2004 279 56 66 279 Central East
2024 367 56 66 367
2004 264 52 62 404 Central West
2024 369 52 62 559
2004 257 52 62 396
Line 5
West 2024 354 52 62 539
NOISE H-7
FINAL ENVIRONMENTAL IMPACT STATEMENT SPRINGDALE NORTHERN BYPASS
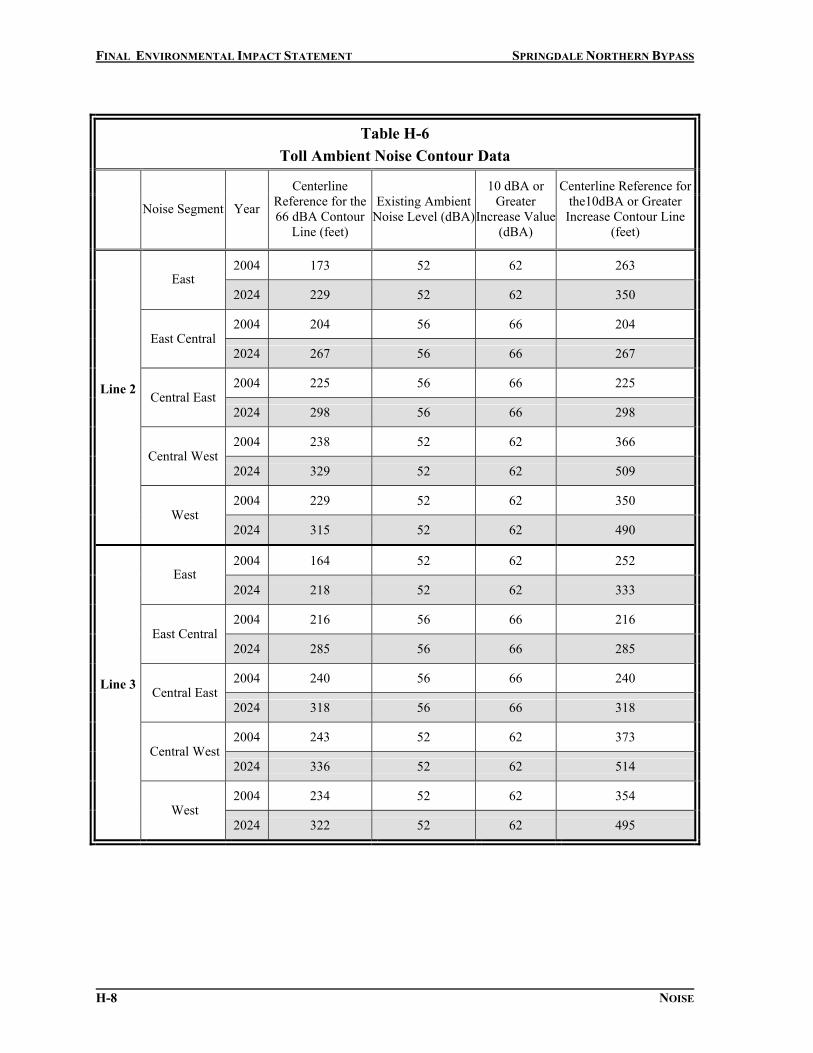
Table H-6 Toll Ambient Noise Contour Data
Noise Segment Year
Centerline Reference for the 66 dBA Contour
Line (feet)
Existing Ambient Noise Level (dBA)
10 dBA or Greater
Increase Value (dBA)
Centerline Reference for the10dBA or Greater
Increase Contour Line (feet)
2004 173 52 62 263 East
2024 229 52 62 350
2004 204 56 66 204 East Central
2024 267 56 66 267
2004 225 56 66 225 Central East
2024 298 56 66 298
2004 238 52 62 366 Central West
2024 329 52 62 509
2004 229 52 62 350
Line 2
West 2024 315 52 62 490
2004 164 52 62 252 East
2024 218 52 62 333
2004 216 56 66 216 East Central
2024 285 56 66 285
2004 240 56 66 240 Central East
2024 318 56 66 318
2004 243 52 62 373 Central West
2024 336 52 62 514
2004 234 52 62 354
Line 3
West 2024 322 52 62 495
H-8 NOISE

FINAL ENVIRONMENTAL IMPACT STATEMENT SPRINGDALE NORTHERN BYPASS
Table H-6, Continued Toll Ambient Noise Contour Data
Noise Segment Year Centerline Reference
for the 66 dBA Contour Line (feet)
Existing Ambient
Noise Level (dBA)
10 dBA or Greater
Increase Value (dBA)
Centerline Reference for the10dBA or Greater Increase Contour Line
(feet)
2004 171 52 62 260 East
2024 227 52 62 347
2004 218 56 66 218 East Central
2024 285 56 66 285
2004 229 56 66 229 Central East
2024 301 56 66 301
2004 236 52 62 362 Central West
2024 336 52 62 518
2004 222 52 62 340
Line 4
West 2024 307 52 62 477
2004 173 52 62 263 East
2024 229 52 62 350
2004 204 56 66 204 East Central
2024 270 56 66 270
2004 230 56 66 230 Central East
2024 304 56 66 304
2004 236 52 62 362 Central West
2024 325 52 62 504
2004 227 52 62 347
Line 5
West 2024 314 52 62 486
NOISE H-9

FINAL ENVIRONMENTAL IMPACT STATEMENT SPRINGDALE NORTHERN BYPASS
Re-analysis of SDEIS Noise Tables Relating to Segment A-B Adjustments for FEIS (Refer to Section 4.1.3.5)
Table H-7 Estimated Noise Receptors
Preferred Segment
A-B
SegmentB-C C-D
Segment D-E
Preferred Segment
E-F Totals
Lin
e
Year Non- toll Toll Non-
toll Toll Non- toll Toll Non-
toll Non- toll Toll Non-
toll Toll
YR 2004 3 1 1 12 7 22 3 0 0 13 2
YR 2024 7 5 3 2 16 30 24 0 0 60 47 YR 2004 3 2 3 3 6 5 0 0 0 12 10 YR 2024 7 4 3 18 9 2 2 0 0 19 YR 2004 3 3 1 1 4 0 0 0 0 13 8
4 YR 2024 7 6 3 2 32 13 2 0 0 44 23 YR 2004 3
5
That Approach the Noise Abatement Criteria (66 dBA)
Segment
Toll
2 38 20
0 3 5 31
9 2
2 1 1 0 0 0 0 0 0 4 3
YR 2024 7 6 6 6 0 0 2 0 0 0 15 12
Table H-8 Estimated Noise Receptors With a 10 dBA or
Greater Increase Above the Estimated Existing Levels Preferred Segment
A-B
Segment B-C
Segment C-D
Segment D-E
Preferred Segment
E-F Totals
Lin
e
Year Non- toll Toll Non-
toll Toll Non-toll Toll Non-
toll Toll Non-toll Toll Non-
toll Toll
YR 2004 9 6 3 3 12 7 22 4 1 0 47 20 2 YR 2024 21 17 5 5 20 16 30 27 3 1 79 66 YR 2004 9 6 4 4 6 5 0 0 0 0 19 15
3 YR 2024 23 18 9 7 18 9 7 3 3 1 60 38 YR 2004 7 7 3 2 9 4 1 0 0 0 20 13
4 YR 2024 20 18 6 4 32 13 7 4 3 1 68 40 YR 2004 8 7 7 6 0 0 1 0 0 0 16 13
5 YR 2024 23 18 12 10 1 0 8 2 3 1 47 31
H-10 NOISE