Appendix E Fatigue of High-Strength Reinforcing...
7
Appendix E Fatigue of High-Strength Reinforcing Steel
Transcript of Appendix E Fatigue of High-Strength Reinforcing...

Appendix E Fatigue of High-Strength Reinforcing Steel

E-1
E.1 Introduction
Fatigue is a process of progressive structural change in a material subjected to transient loads, stresses or strains. Fatigue strength is defined as the maximum transient stress range (S) that may be repeated without causing failure for a specified number of loading cycles (N). The stress range is defined as the algebraic difference between the maximum and the minimum stress in a stress cycle: S = fmax - fmin; that is: the transient stress. Most ferrous materials exhibit an ‘endurance limit’ or ‘fatigue limit’ below which failure does not occur for an unlimited number of cycles, N. In general, the concrete material fatigue performance exceeds that of the steel and is not considered in design (Neville 1975).
S-N Relationships and Fatigue Behavior
In order to predict fatigue behavior (in this case to establish appropriate experimental parameters) it is necessary to establish the S-N relationship for reinforcing bars in concrete tested under repeated flexure. The S-N approach requires numerous fatigue test data points and exhibits considerable scatter and therefore numerous repeated tests are needed to develop the ‘best-fit’ relationship that describes the fatigue behavior of the material with a reasonable confidence level. There has been a significant amount of research studying fatigue of reinforcing steel and multiple empirical equations have been developed to describe its behavior. Most correspond to the same general form of the equation: Sm x N = k (E-1)
Empirical parameters m and k are dependent upon the units used to express S. Values of m and k are given based on bar size and, in some cases, the expected fatigue life, N. Available models are all based on reinforcing steel having nominal yield strength, fy, between 40 and 75 ksi. No significant difference in S-N behavior is observed over this range of yield values (MacGregor et al. 1971, Mallet 1991). Additionally, some models are based on axial tension tests of bars in air, while others are based on bars in concrete beams tested in flexure. Moss (1982) demonstrated that the fatigue life of bars tested in concrete exceeds that of bars tested in air. Most of the relevant studies have been conducted in Europe (Moss 1980 and 1982, Tilly and Moss 1982, Mallet 1991). Best practices based on these studies have been adopted by the CEB FIB Model Code (1990) and these S-N relationships are adopted here. One of the authors (Harries) has conducted over 120 large-scale fatigue tests of reinforced concrete beams; the adoption of Eq. E-2 is supported by the cumulative results of these many studies. The relationships given in Eq. E-2 are for #5 bars embedded in concrete.
S5 x N = 2.621 x 10¹⁷ (ksi) N < 1,000,000 (E-2) S9 x N = 2.115 x 1026 (ksi) 1,000,000 < N < 100,000,000
There are no S-N relationships for reinforcing steel prescribed by AASHTO or ACI
standards, rather these standards prescribe a maximum transient stress range corresponding to the presumed endurance limit (Eq E-2).

E-2
E.2 Fatigue Proof Tests
The limited scope of the fatigue testing program conducted as part of this study served as a ‘proof test’ to examine whether the existing AASHTO specifications for the fatigue limit state (Eq. E-2) are applicable to members with high-strength reinforcement. Thus it is necessary to select a stress range, S, appropriate to the number of cycles to be tested, N.
The AASHTO fatigue limits are derived largely from tests having N = 2,000,000. However, as code-prescribed limits, they must be understood to be appropriate for the ‘life of the structure’. AASHTO LRFD (2007) §6.6.1.2.5 provides some guidance as to a) the definition of a fatigue cycle; and b) the expected number of cycles over the life of a structure. Based on AASHTO-recommended values, a deck slab on an urban interstate may undergo approximately 1 million fatigue cycles per year:
N = 365 x n x ADTTSL = 930,750 cycles (E-3) where ADTTSL = 0.85(ADTT) = 0.85(0.15ADT) with ADT = 20,000 and n = 1. The supporting girders (assuming the bridge exceeds 40 feet) will undergo twice this
number of cycles (n = 2). Clearly, not all bridges see this many cycles: A lightly travelled two-lane rural highway bridge may undergo only about 100,000 cycles per year:
N = 365 x n x ADTTSL = 109,500 cycles (E-4) where ADTTSL = 1.0(ADTT) = 1.0(0.15ADT) with ADT = 1,000 and n = 2. The selection of an appropriate fatigue proof test must consider at least the following:
1. Practical value of N. Two million cycle tests are most common and may be considered
‘standard’. At 1.2Hz, a 2 million cycle test takes three weeks. Generally there is more scatter in results as N is taken less than 1 million cycles. Larger values of N are impractical for large-scale laboratory tests and few such tests are reported in the literature. A 2 million cycle protocol is adopted in the present study.
2. A minimum stress, fmin, must be used that is adequate to represent ‘dead load’ and to permit safe and efficient control of the test protocol. A value fmin = 0.10fy is commonly used and is adopted in the present study.
3. The value of the stress range, S, is selected to ‘match’ the value of N selected using an established S-N relationship. The relationship given by Eq. E-2 is used in the present study.
Considering the previous discussion and assuming nominal values fy = 60 ksi and fmin = 0.10fy, Eq. E-2 yields fr = S ≤ 22 ksi. The same value is found using Eq. E-3 regardless of the value of fy used. Based on the S-N relationships give in Eq. E-2, S = 22 ksi corresponds to N = 20,000,000 which correlates reasonably well with the expected range of fatigue life anticipated by AASHTO. For example, a deck slab on an urban interstate will undergo approximately 20

E-3
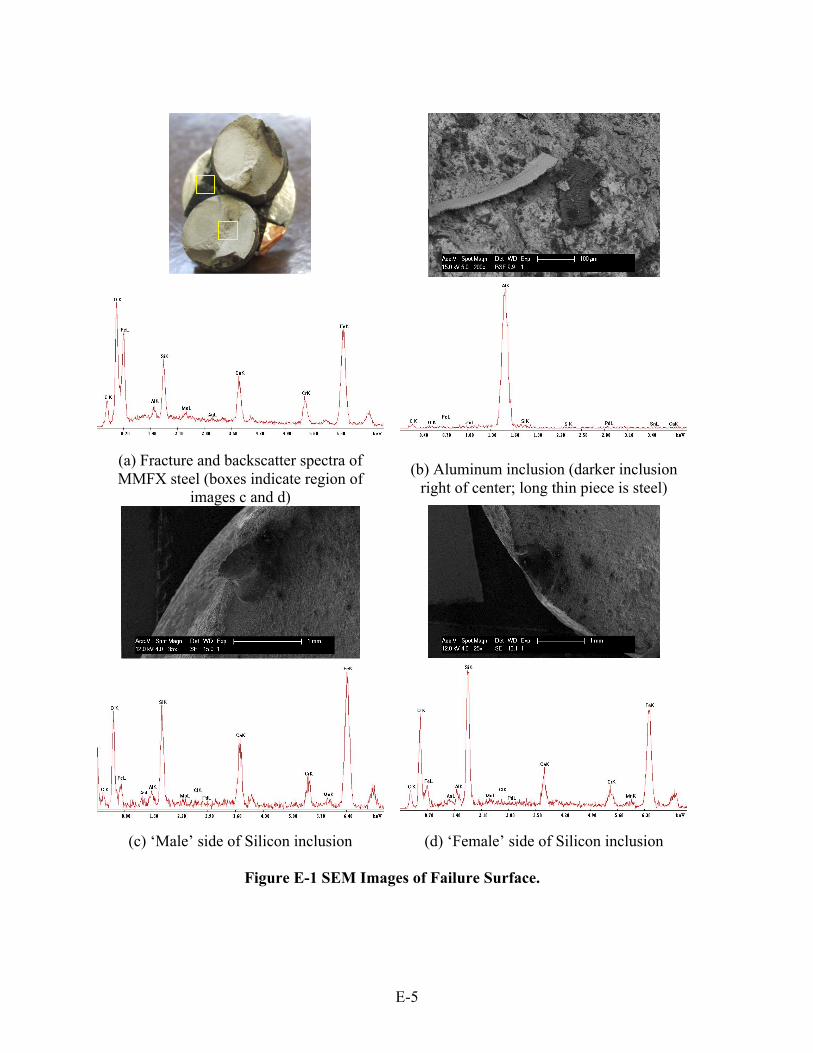
million fatigue cycles over a 20 year life. Using Eq. E-2, setting a test value of S = 28 ksi for a 2 million cycle test is equivalent to a 20 million cycle test having S = 22 ksi. The latter is the AASHTO ‘proof protocol’ but would take upwards of 7 months to complete, while the former may be conducted in a practical time frame (3 weeks). The specimen protocols described below were selected considering these factors. Thus the protocol adopted for Fatigue Test 1 was selected to exceed the S = 28 ksi at N = 2,000,000 criteria; S was selected to be 32 ksi. SEM of Fatigue Test 2 Failure The failure of a bar at N = 155,005 under S of 45.5 ksi is very close to the prediction which is thought to be conservative. Therefore an investigation of the fatigue failure surface using scanning electron microscopy (SEM) was conducted (Figure E-1). The SEM revealed aluminum (Al) inclusions in the fracture surface (E-1b) and a significant silicon (Si) inclusion at the edge of the bar section thought to have served as a crack initiator (E-1c and E-1d). Figure E-1 provides both the SEM image and backscatter spectral analysis for each image. The spectra shown in Figure E-1a are of the A1035 material and agree well with the specified composition of this material (ASTM A1035 2007). The spectra shown in Figure E-1b are taken from the dark inclusion shown in the image. This is clearly pure aluminum. The aluminum cannot be accounted for. A1035 contains no aluminum but the inclusion was apparently embedded in the section and therefore unlikely to be contamination occurring following the fracture. Figures E-1c and E-1d show the same location on opposite faces of the fracture. A 0.3 mm (0.012 in.) diameter inclusion is evident in these images. The spectra indicate that this inclusion is silicon. A1035 steel is specified to have a maximum silicon content of 0.50% (ASTM A1035 2007). Therefore the presence of silicon should not be a surprise. The size of the inclusion, however, and its location at the edge of the bar may have resulted in a stress concentration that initiated the fatigue failure of this bar. E.3 Previous Studies of Reinforcing Bar Fatigue In order to establish the validity of AASHTO-established fatigue limits (Eq. E-2) and to assess the effects of yield strength on fatigue performance, a review of available fatigue data was conducted. Table E-1 summarizes these studies. While few studies report on bars having fy > 75 ksi, the fact that these studies report different steel grades (i.e. 40, 60 and 75 ksi) permit some trends to be established. Figure E-2 shows the reported fatigue endurance limits as a function of yield strength. Although stress range is the critical parameter affecting fatigue, this data has been sorted by the value of fmin which is shown to have little effect on the results. Figure E-2 shows no values of the endurance limit falling below 24 ksi. Thus the present AASHTO recommendations for ff are felt to be conservative for tension-tension fatigue (i.e.: fmin positive). Additionally, a correlation between endurance limit and fy is evident. Thus the penalty paid by using Eq. E-2 with high strength steel is unjustified. While Eq. E-3 does not recognize the correlation between ff and fmin, it does remove this penalty in a justifiable manner.

E-4
Table E-1 Fatigue Stress Ranges (fr) Corresponding to a Fatigue Life of 2 Million
Cycles.
Bar Size No. tests fy (ksi) fmin fr (ksi) reference
40 38 60 34 75
0.10fy 39
40 33 60 31 75
0.30fy 32
40 32 75 0.10fy 35 40 28
#8 157
75 0.30fy 30
Pfister, J.F. and Hognestad, E. 1964
40 27 60 31 #5 19 75
0.25fy 38
Lash, SD. 1969
40 30 60 30 75
0.10fy 30
40 25 60 25
#8 72
75 0.40fy
25 40 32 60 33 #5 not
reported 75 0.10fy
36 40 31 60 29 75
0.10fy 30
MacGregor, J.G., et al. 1971
49 0.17fy 28 53 0.16fy 28 64 0.13fy 28 88 31
Wascheidt, H. 1965
50 30 57 30
#10 not reported
70
0.10fy
31.5
Kokubu, M. and Okamura, H. 1965
#3, #4 & #5 n.r. 120 0 451 DeJong 2005 #5 1 120 0.10fy 32 present study
1 One million cycle fatigue life
E-5
(a) Fracture and backscatter spectra of MMFX steel (boxes indicate region of
images c and d)
(b) Aluminum inclusion (darker inclusion right of center; long thin piece is steel)
(c) ‘Male’ side of Silicon inclusion (d) ‘Female’ side of Silicon inclusion
Figure E-1 SEM Images of Failure Surface.

E-6
Figure E-2 Observed Stress Limits as a Function of Minimum Stress Level, fmin.