Fatigue strength of welds in 800 MPa yield strength steels849239/FULLTEXT01.pdf · Fatigue strength...
75
Licentiate Thesis Production Technology 2015 No.3 Ebrahim Harati Fatigue strength of welds in 800 MPa yield strength steels – Effects of weld toe geometry and residual stress
Transcript of Fatigue strength of welds in 800 MPa yield strength steels849239/FULLTEXT01.pdf · Fatigue strength...

Licentiate ThesisProduction Technology2015 No.3
Ebrahim Harati
Fatigue strength of welds in 800 MPa yield strength steels– Effects of weld toe geometry and residual stress

University West SE-46186 Trollhättan Sweden +46 52022 30 00 www.hv.se © Ebrahim Harati 2015 ISBN 978-91-87531-12-5

Acknowledgements
First I would like to express my special appreciation and thanks to my PhD supervisors Professor Lars-Erik Svensson and Professor Leif Karlsson for their guidance and huge support during my research. It is a privilege to be your student and I wish I would keep learning from you. The financial support of the Swedish Energy Agency in gratefully acknowledged for funding this research. I also would like to thank ESAB AB for providing the filler materials and welding of the samples. Especially I thank Dr Kamellia Dalaei from Esab for her support and contribution. Thanks to Mr Richard Söder, Mr Mikael Nordqvist and Mr Mattias Widmark from Volvo Trucks for their comments in this research and their contribution in the ongoing project. I would also like to thank all of my friends and colleagues in the welding group of University West who supported me in my research. In particular I thank Mr Kjell Hurtig for his help and also my friend, Vahid Hosseini, for his comments and discussions. I am very grateful to all my colleagues in the Production Technology Center (PTC) who have contributed to my research and also by helping me with my Swedish language learning. Finally, I would like to thank my parents, my brother, Ehsan, and my lovely sister, Hosna. They were always supporting me and encouraging me with their best wishes.
Ebrahim Harati Trollhättan, 1st of September 2015
iii


Populärvetenskaplig Sammanfattning
Nyckelord: Utmattningshållfasthet; Restspänningar; Svetsar; Svetsgeometri; Höghållfasta stål; Weld Impression Analysis; Laser Scanning Profiling; Structured Light Projection
Det finns en allmän trend idag inom fordonsindustrin att försöka minska vikten för att möta krav på minskade utsläpp genom mindre bränsleförbrukning. En möjlighet att minska vikten är genom att använda mer höghållfasta stål och att sammanfoga dem med svetsning. Svetsning är den vanligaste fogningsmetoden för tillverkning av en stor del av alla tekniska konstruktioner. Många komponenter är utsatta för utmattningsbelastning under hela eller delar av sin livstid och svetsar är ofta den främsta platsen för utmattningsbrott.
Utmattningsbrott i svetsade konstruktioner initieras ofta vid svetstån som en följd av stora restspänningar och lokal förändring av geometrin som ger en spänningskoncentration. Syftet med denna forskning är att öka förståelsen av de faktorer som styr utmattningslivslängden i svetsade komponenter tillverkade av höghållfasta stål med en sträckgräns över 800 MPa. Framförallt har påverkan av den lokala geometrin vid övergången mellan svets och grundmaterial (svetstån) och restspänning på utmattningslivslängden studerats. Restspänningsnivån varierades genom att använda två olika typer av tillsatsmaterial, en Low Transformation Temperature (LTT) tråd med låg martensitbildningstemperatur och en standard höghållfast tråd. Svetståns geometri har mätts och utvärderats med hjälp av tre icke-förstörande metoder; Weld Impression Analysis (WIA), Laser Scanning Profiling (LSP) och Structured Light Projection (SLP). Resultaten visar att alla tre metoderna ger precisa och korrekta resultat. Användningen av LTT tillsatsmaterial ökade utmattningshållfastheten. En jämförelse visade också att restspänningen hade en större effekt än svetståns geometri på utmattningshållfastheten.
v

Abstract
Title: Fatigue strength of welds in 800 MPa yield strength steels -
Effects of weld toe geometry and residual stress
Keywords: Fatigue strength; Residual stress; Welds; Weld toe geometry; High strength steel; Weld Impression Analysis; Laser Scanning Profiling; Structured Light Projection
ISBN: 978-91-87531-12-5
Nowadays there is a strong demand for lighter vehicles in order to increase the pay load. Through this the specific fuel consumption is decreased, the amount of greenhouse gases is lowered and the transport economy improved. One possibility to optimize the weight is to make the components from high strength steels and join them by welding. Welding is the main joining method for fabrication of a large proportion of all engineering structures. Many components experience fatigue loading during all or part of their life time and welded connections are often the prime location of fatigue failure. Fatigue fracture in welded structures often initiates at the weld toe as a consequence of large residual stresses and changes in geometry acting as stress concentrators. The objective of this research is to increase the understanding of the factors that control fatigue life in welded components made from very high strength steels with a yield strength of more than 800 MPa. In particular the influences of the local weld toe geometry (weld toe radius and angle) and residual stress on fatigue life have been studied. Residual stresses have been varied by welding with conventional as well as Low Transformation Temperature (LTT) filler materials. The three non-destructive techniques Weld Impression Analysis (WIA), Laser Scanning Profiling (LSP) and Structured Light Projection (SLP) have been applied to evaluate the weld toe geometry. Results suggest that all three methods could be used successfully to measure the weld toe radius and angle, but the obtained data are dependent on the evaluation procedure. WIA seems to be a suitable and economical choice when the aim is just finding the radius. However, SLP is a good method to fast obtain a three-dimensional image of the weld profile, which also makes it more suitable for quality control in production. It was also found that the use of LTT consumables increased fatigue life and that residual stress has a relatively larger influence than the weld toe geometry on fatigue strength of welded parts.
VI

Appended Publications
Paper A. Non-destructive measurement of weld toe radius using Weld Impression Analysis, Laser Scanning Profiling and Structured Light Projection methods
Peer-reviewed paper presented in “The First International Conference on Welding and Non Destructive Testing” in Tehran, Iran, February 2014. Authors: Ebrahim Harati1, Mattias Ottosson1, Leif Karlsson1, and Lars-Erik Svensson1. I was the main author. Experiments were carried out wholly by me for the WIA and SLP methods and partly for the LSP method. The data and results were analysed by me. I presented the paper orally at the conference.
Paper B. The measurement of weld toe radius using three non-destructive techniques
Peer-reviewed paper presented in “The Sixth Swedish Production Symposium” in Gothenburg, Sweden, September 2014. Authors: Ebrahim Harati1, Lars-Erik Svensson1 and Leif Karlsson1. I was the main author. Experiments were carried out wholly by me for the WIA and SLP methods and partly for the LSP method. The data and results were analysed by me. I presented the paper orally at the conference.
Paper C. The relative effects of residual stresses and weld toe geometry
on fatigue life of weldments
International journal of fatigue, Volume 77, August 2015, Pages 160–165. Authors: Ebrahim Harati1, Leif Karlsson1, Lars-Erik Svensson1 and Kamellia Dalaei2.
I was the main and corresponding author. Geometrical experiments and analysis were carried out by me. I also evaluated the residual stress and fatigue results. The co-authors contributed to the writing and with basic ideas. 1 Department of Engineering Science, University West, SE-461 86 Trollhättan, Sweden 2 ESAB AB, Lindholmsallen 9, 40227 Gothenburg, Sweden
vii

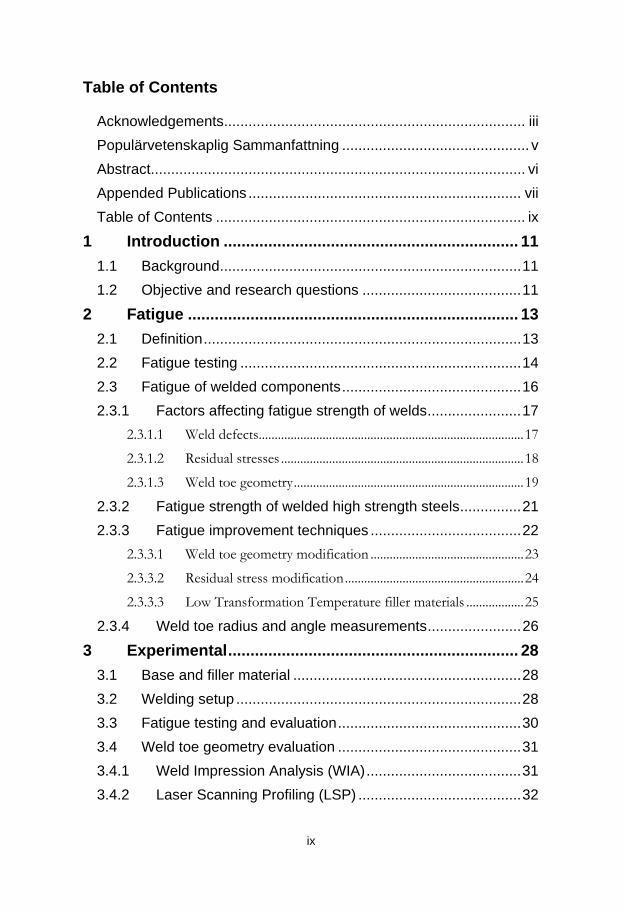
Table of Contents
Acknowledgements .......................................................................... iii Populärvetenskaplig Sammanfattning .............................................. v
Abstract ............................................................................................ vi Appended Publications ................................................................... vii Table of Contents ............................................................................ ix
1 Introduction .................................................................. 11
1.1 Background .......................................................................... 11
1.2 Objective and research questions ....................................... 11
2 Fatigue .......................................................................... 13
2.1 Definition .............................................................................. 13
2.2 Fatigue testing ..................................................................... 14
2.3 Fatigue of welded components ............................................ 16
2.3.1 Factors affecting fatigue strength of welds ....................... 17
2.3.1.1 Weld defects................................................................................... 17
2.3.1.2 Residual stresses ............................................................................ 18
2.3.1.3 Weld toe geometry ........................................................................ 19
2.3.2 Fatigue strength of welded high strength steels ............... 21
2.3.3 Fatigue improvement techniques ..................................... 22
2.3.3.1 Weld toe geometry modification ................................................ 23
2.3.3.2 Residual stress modification ........................................................ 24
2.3.3.3 Low Transformation Temperature filler materials .................. 25
2.3.4 Weld toe radius and angle measurements ....................... 26
3 Experimental ................................................................. 28
3.1 Base and filler material ........................................................ 28
3.2 Welding setup ...................................................................... 28
3.3 Fatigue testing and evaluation ............................................. 30
3.4 Weld toe geometry evaluation ............................................. 31
3.4.1 Weld Impression Analysis (WIA) ...................................... 31
3.4.2 Laser Scanning Profiling (LSP) ........................................ 32
ix

3.4.3 Structured Light Projection (SLP) ..................................... 33
3.4.4 Reference block ............................................................... 34
3.4.5 Applying measurement methods on welds ...................... 36
3.5 Residual stress measurements ........................................... 39
4 Results .......................................................................... 41
4.1 Fatigue testing ..................................................................... 41
4.2 Weld toe geometry measurement ........................................ 44
4.2.1 Reference block ............................................................... 44
4.2.2 Radius measurements on welds ...................................... 46
4.3 Residual stress measurements ........................................... 48
5 Discussion .................................................................... 51
5.1 Weld toe geometry ............................................................... 51
5.2 Comparison of non-destructive methods ............................. 53
5.3 Relative effect of weld toe geometry and residual stress .... 54
6 Conclusions .................................................................. 59
7 Future work ................................................................... 61
8 References .................................................................... 63
9 Summaries of appended papers ................................. 69
9.1 Non-destructive measurement of weld toe radius using Weld Impression Analysis, Laser Scanning Profiling and Structured Light Projection methods ..................................................... 69
9.2 The measurement of weld toe radius using three non-destructive techniques ......................................................... 69
9.3 The relative effects of residual stresses and weld toe geometry on fatigue life of weldments ................................. 70
10 Appended publications ................................................ 71
X

1 Introduction
1.1 Background
Nowadays there is an increasing demand for lighter structures and especially vehicle industries look for solutions to decrease the weight of their products. Weight reduction will result in increasing pay load and through this, fuel consumption and hence greenhouse gas emissions will be decreased. One possibility to optimize the weight is to make the components from high strength steels (HSS) and join them by welding. The main reason to choose HSS is to allow for higher stresses and reduced dimensions, taking benefit of higher strength steels with respect to the yield criterion [1], [2]. Welding is the main joining method for fabrication of a large proportion of all engineering structures. Many of the engineering components experience fatigue loading during all or part of their life time and welded connections are often the prime location of fatigue failure. Weldments present much lower fatigue strength than those of un-welded components. This becomes more critical in structures built of HSS because the fatigue strength of steel in the as-welded condition does not increase when increasing the yield or tensile strength [3]. A lot of research have been done to evaluate the fatigue strength of HSS. However, still the effects of different factors which control the fatigue life of welded HSS components is not well known. For example the influence of residual stresses on the fatigue properties of welded HSS is not fully understood [4]. The effect of stress concentration caused by the weld toe geometry and its contribution to fatigue failure when added to the residual stresses need to be studied more. Thus, an increased understanding of how different factors influence the fatigue strength would be a significant step towards better fatigue design rules and safer constructions of welded parts.
1.2 Objective and research questions
The main objective of this project is:
- To increase understanding of the factors that control fatigue life of welded high strength steels.
11

Two main factors which influence the fatigue properties of welded parts are residual stresses induced by welding and the local weld toe geometry. The research questions in this project are as follows: Q1) How will residual stresses affect the fatigue strength of 800 MPa yield
strength steels? Q2) What is the influence of weld toe geometry on fatigue life? Q3) How can the weld toe geometry be evaluated in a precise and accurate way? Q4) What are the relative effects of weld toe geometry and residual stress on
fatigue life? It should be noted that this study deals with fatigue strength of welds made of a high strength steel (HSS), Weldox 700 with an actual yield strength of more than 800 MPa. Within the text when discussing about HSS steels, it refers to steels with a yield strength in this range and higher.
12

2 Fatigue
2.1 Definition
Engineering components are frequently subjected to repeated loads, and the resulting cyclic stresses can lead to microscopic physical damage to the materials involved. This microscopic damage can develop into cracks with continued cycling. This process of damage and failure due to cyclic loading is called fatigue [5]. Another definition of fatigue according to American Society for Testing and Materials (ASTM), Standard E 1823 [6] is: “Fatigue is the process of progressive localized permanent structural change occurring in a material subjected to conditions that produce fluctuating stresses and strains at some point or points and that may culminate in cracks or complete fracture after a sufficient number of fluctuations”. The fatigue process is usually divided into three stages: 1: crack initiation 2: crack growth and 3: final fracture. Cracks often initiate along slip lines oriented in the planes of maximum shear stress. Cracks can also initiate at or near material discontinuities such as inclusions, grain boundaries, pores and voids. Stage 2 which is crack growth has two stages itself. The two stages of fatigue crack growth are called “stage І” (shear mode) and “stage ІІ” (tensile mode). Fatigue crack growth is shown schematically in Figure 1. As shown in the figure, during the first stage of crack growth, a crack initiated from the surface and grows within a few grains primarily controlled by shear stresses and strains. When the crack reaches over several grains, it will continue to grow in a direction perpendicular to the largest tensile principal stress. The final fracture, stage 3, will take place when the crack becomes so large that the remaining part of the cross section is too small to withstand the load and subsquently complete fracture happens [5], [7]–[10].
13

Figure 1. Schematic illustration of stage І and stage ІІ of fatigue crack growth.
2.2 Fatigue testing
By the mid-1800s, A. Wöhler proposed a method to estimate the life of components due to repeated loads. This method resulted in the stress-life approach [8]. There are mainly three methods to define the fatigue life of a material: the stress-life method, the strain-life method and the fracture mechanics method. Depending on whether it is the stress or strain which control the cycling between maximum and minimum stress/strain levels, one can use stress- or strain-life methods. Since in this project all the fatigue tests have been performed with a stress control approach, the main concepts in the stress-life method will be discussed. Figure 2 illustrates a typical stress cycle in which important concepts are shown. In this figure ∆S, or stress range, is the difference between the maximum and minimum stresses.
∆S = 𝑆𝑆𝑚𝑚𝑚𝑚𝑚𝑚 − 𝑆𝑆𝑚𝑚𝑚𝑚𝑚𝑚 (2.1)
Stress amplitude or 𝑆𝑆𝑚𝑚 is half of the stress range.
𝑆𝑆𝑚𝑚 = ∆S/2 (2.2)
14

Averaging the maximum and minimum values gives the mean stress 𝑆𝑆𝑚𝑚.
𝑆𝑆𝑚𝑚 = (𝑆𝑆𝑚𝑚𝑚𝑚𝑚𝑚 + 𝑆𝑆𝑚𝑚𝑚𝑚𝑚𝑚)/2 (2.3) The stress ratio R is:
𝑅𝑅 = 𝑆𝑆𝑚𝑚𝑚𝑚𝑚𝑚/𝑆𝑆𝑚𝑚𝑚𝑚𝑚𝑚 (2.4) The possible range for the stress ratio is: −1 ≤ 𝑅𝑅 ≤ 1.
Figure 2. Terminology for alternating stress.
The results of tests from a number of different stress levels may be plotted to obtain a stress-life curve, also called 𝑆𝑆 − 𝑁𝑁 curve where N is the number of cycles. The amplitude of stress, 𝑆𝑆𝑚𝑚, or stress range, ∆𝑆𝑆, is commonly plotted versus the number of cycles to failure 𝑁𝑁𝑓𝑓. 𝑆𝑆 − 𝑁𝑁 curves are usually drawn through median lifes and thus represent 50 percent expected failures. The following equation can be fitted to obtain a mathematical representation of the S-N curve:
𝑆𝑆𝑚𝑚 = 𝐶𝐶 + 𝐷𝐷𝐷𝐷𝐷𝐷𝐷𝐷𝑁𝑁𝑓𝑓 (2.5) In this equation, C and D are fitting constants. In some materials, primarily steels, there appears to be a distinct stress level below which the material has an infinite life. Such a limiting stress level is called
15

the fatigue limit or the endurance limit and it is usually reported after 2-5 million cycles.[3], [5], [11]. Figure 3 shows a typical 𝑆𝑆 − 𝑁𝑁 curve.
Figure 3. Typical 𝑆𝑆 − 𝑁𝑁 curve.
2.3 Fatigue of welded components
A large proportion of all engineering structures are manufactured by welding. Welding methods are manufacturing processes which can be used to join materials together. Welding methods can be catagorised into fusion welding and pressure welding. Fusion welding processes involve localized melting and solidification, with or without addition of filler material. Arc welding is the most commonly used method in fusion welding. In contrast to fusion welding, pressure welding does not involve melting of materials [12]. The fatigue strength of welded structures are much lower than those of un-welded components. Figure 4 compares the S-N curves of a smooth plate, a plate with a hole and a fillet welded attachment [4], [13].
16

Figure 4. Fatigue strength comparison for a smooth plate, a plate with a hole and a
fillet welded attachment.
2.3.1 Factors affecting fatigue strength of welds
Fatigue strength of welded structures is complicated by many factors intrinsic to the nature of welded joints and also extrinsic factors related to the environment. Several parameters contribute to the reduction in fatigue strength of welded joints. The main parameters include: a) Presence of weld defects; b) Stress concentration at the weld toe; and c) Tensile residual stresses. Welding defects such as slag inclusions, gas pores, lack of penetration at the weld root or undercut at weld toes may be present in welded joints. Stress concentrations usually arise at the weld toes, due to variations in the geometry. Tensile residual stresses, induced by welding, approaching the yield strength of the base metal may exist in as-welded parts and may be detrimental to the fatigue life of welded structures [4], [14], [15]. In addition, other factors such as joint type may affect the fatigue life of weldments. In the following, the three main factors affecting fatigue life of welds will be discussed.
2.3.1.1 Weld defects For smooth components, the initiation stage is the most important because the majority of the life is spent in the initiation of small cracks. However, in the case
17

of welded structures it is generally accepted that small defects inherently exist at the welds and therefore the initiation phase is relatively insignificant. The majority of the fatigue life in welded components is therefore spent in propagation of the cracks until final failure occurs [10]. The effect of weld defects on fatigue life has been studied extensively [16]–[19]. In recent years, Commission XIII of the International Institute of Welding (IIW) has been promoting research to develop a weld quality guideline which quantitatively relates weld acceptance criteria to the fatigue life of welds [20]. Introduction of the new Volvo weld class system has also been an attempt in this regard [17]. The severity of defects depends on their size, shape, distribution and location in the weld. It will be more critical to fatigue failure if defects are planar, such as cracks which are located in the weld especially in the weld toe. In general, non-planar defects such as solid inclusions and gas pores are less detrimental to fatigue performance of welds than the crack-like defects. For the former, the stress concentration factor is much smaller than the one produced by crack-like defects. A critical crack size exists, depending on the load, below which a crack will not grow and hence fatigue will not happen. Therefore, as long as the existence of cracks will not result in premature failure of the structure, they can remain inactive within the structure [21].
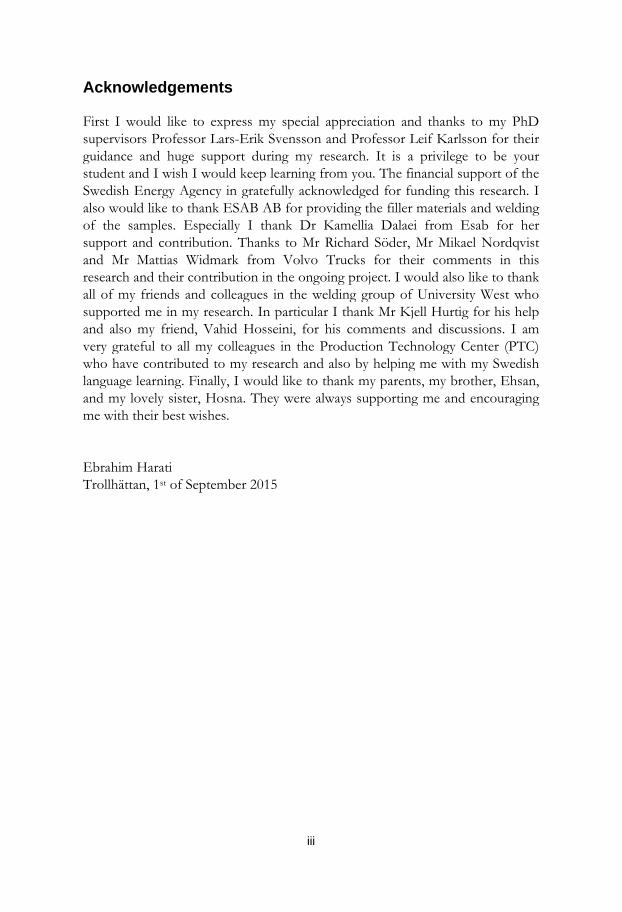
2.3.1.2 Residual stresses Residual stresses are called “self-equilibrium stresses” since they are in equilibrium within the body of the material without any applied external forces. They are called “residual stresses” because they remain in the component from the previous operations. Welding is one of the processes which results in high levels of tensile residual stresses in and around the weld and compressive residual stresses farther away. Figure 5 shows an example of the distribution of residual stresses in a welded joint. The tensile residual stresses approach the yield strength of the base metal and this contributes to a reduction in fatigue strength of welded components and structures. On the other hand, compressive stresses on the surface of weldments can significantly improve the fatigue strength of welds. Thus, for the accurate assessment of fatigue strength a detailed knowledge of the residual stress is required [9].
18
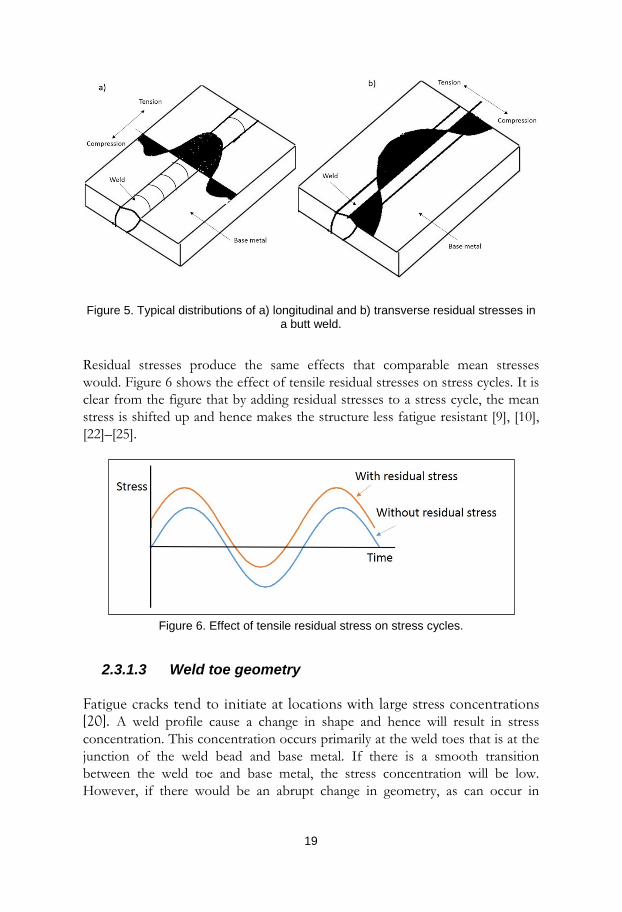
Figure 5. Typical distributions of a) longitudinal and b) transverse residual stresses in a butt weld.
Residual stresses produce the same effects that comparable mean stresses would. Figure 6 shows the effect of tensile residual stresses on stress cycles. It is clear from the figure that by adding residual stresses to a stress cycle, the mean stress is shifted up and hence makes the structure less fatigue resistant [9], [10], [22]–[25].
Figure 6. Effect of tensile residual stress on stress cycles.
2.3.1.3 Weld toe geometry Fatigue cracks tend to initiate at locations with large stress concentrations [20]. A weld profile cause a change in shape and hence will result in stress concentration. This concentration occurs primarily at the weld toes that is at the junction of the weld bead and base metal. If there is a smooth transition between the weld toe and base metal, the stress concentration will be low. However, if there would be an abrupt change in geometry, as can occur in
19
welded joints, then the stress concentration would be high. The weld toe is therefore one of the most probable crack initiation sites. In addition, residual stresses induced by welding and possible presence of crack-like flaws make the weld toe a critical location for cracking [13]. The effect of the weld toe geometry on fatigue strength of welded parts has been studied extensively. It has been found that the weld toe radius and angle, especially the weld toe radius, are the main geometrical features that control the fatigue life. By increasing the weld toe radius, the angle or both of them, the fatigue strength will increase due to a decrease in stress concentration at the weld toe [26]–[34]. Niu and Glinka [27] proposed the following relationship for the stress concentration factor, 𝐾𝐾𝑤𝑤 , at a weld toe based on the weld profile:
𝐾𝐾𝑤𝑤 = 1 + 0.5121(ɸ)0.572(𝑇𝑇𝜌𝜌
)0.469 (2.6)
In this equation, ɸ is the weld flank angle, 𝜌𝜌 is the weld toe radius and 𝑇𝑇 is the plate thickness. Figure 7, schematically represents weld toe geometry including weld toe radius (r) and weld flank angle (ɸ) for a fillet weld with a plate thickness of (T). In the figure the weld toe angle is indicated by (ϴ) and equals to 180-ɸ.
Figure 7. Schematic representation of weld toe radius (r) and angle (𝜃𝜃) for a fillet weld with plate thickness of (T).
20

From the above equation it can be drawn that by increasing the toe radius and decreasing the flank angle, the stress concentration factor decreases. This results in higher fatigue strength of welded parts. In another study, Pang [29] modeled weld toe profiles using Finite Element Analysis (FEA) to determine the elastic stress distribution and stress concentration factor for fillet welded joints. Stress concentration factors were calculated for four different weld toe radii of 0.5, 1.0, 2.5 and 5 mm. It was found that an increase of weld toe radius from 1 to 2.5 will result in about 14% reduction in stress concentration factor. Alam et al. [35] investigated the effect of weld toe geometry and weld surface profile on fatigue life for a fillet joint. By relating the geometrical features to stress concentration, they found that weld surface ripples can produce high stress peaks. It was also shown that weld toe radius is not always the main factor in fatigue crack initiation as local micro geometry effect due to weld ripples can be more significant.
2.3.2 Fatigue strength of welded high strength steels
The main driving force in development of high strength steels (HSS) has been the desire for lighter structures and often cost benefits. For example, Gresnigt and Steenhuist [1] reported a decrease of about 50% in total cost for manufacturing of a welded plate structure when upgrading the steel from S355 to S960. HSS are used in bridges, buildings, storage tanks, cranes, pipelines, offshore structures and transportation vehicles. Important factors in achieving a higher strength of steels are the chemical composition and the microstructure. There are mainly two methods for manufacturing of high strength steels. The first option is increasing the content of alloying elements which results in higher strength at the expense of reduction in weldability and ductility. The second option is heat treatment and control of temperature during rolling which also results in improvement in ductility and weldability of these steels. Thermomechanically rolled steels (TM), quenched and tempered steels (Q&T) and normalized rolled steels are three different heat treatments to obtain high strength levels. It should be noted that Q&T steels typically have higher strength than TM and normalized rolled steels [1]. Common welding methods can be used for welding of HSS but they require more attention than when welding lower strength steels. There have been three main concerns in regard with welding of HSS: The first one is the risk of cold cracking. The second issue is mechanical properties of the weld metal and the third concern is fatigue performance. Preheating of the weld area is the most effective and widely used method to avoid cold cracking. Control of heat input,
21

interpass temperature and use of filler materials with low amount of hydrogen will also decrease the probability of cold cracking. Development of welding consumables which provide both high strength and high impact toughness has been a step toward achieving better mechanical properties in welded high strength steels [36], [2]. The fatigue issue will be treated in more detail in the following sections separately. As mentioned earlier, weldments present much lower fatigue strength than un-welded components. This becomes more critical in structures made from high strength steel because the fatigue strength of the steel in the as-welded condition does not increase in proportion to the yield or tensile strength [1], [2]. Most of a welded component’s fatigue life is usually spent in crack propagation. Since the crack propagation rate is determined by the elastic behaviour of the steel, which is similar for steels of various strength levels, strength will have little effect on fatigue life. As illustrated in Figure 8, fatigue strength of an unwelded component increases with strength but remains more or less constant for a welded component [37].
Figure 8. Effect of tensile strength on fatigue strength of welded and unwelded components.
2.3.3 Fatigue improvement techniques
Fatigue performance of welded components can be improved by employing good detail design practices, for example by upgrading the welded detail class to one having a higher fatigue strength. Good control of the welding process which results in high quality welds with a minimum defects can also improve the fatigue life of welds. As an alternative, post-weld treatments can be employed to
22

improve the fatigue strength of welds. Different improvement methods have been studied and implemented to increase the fatigue life of welded structures [38]–[41]. IIW Commission XIII, Fatigue of Welded Components and Structures, has approved a guideline concerning post-weld treatment methods for steel and aluminium structures [42]. This guideline covers four commonly applied post weld treatment methods: burr-grinding, TIG dressing, hammer peening and needle peening. In general there are two main approaches for improving the fatigue strength of weldments: a) Modification of the weld toe geometry and b) Modification of the residual stress induced by welding.
2.3.3.1 Weld toe geometry modification The weld geometry is one of the primary factors which control the fatigue life of welded components. Accordingly, procedures that improve the weld geometry profile, especially the weld toe geometry, will have a beneficial effect on fatigue life. Weld toe geometry modification methods rely mainly on reducing the local stress concentration due to the weld profile. They may also remove or reduce the weld toe flaws [41]. There are mainly two different types of techniques to improve the fatigue life of welds via weld toe geometry modification. These are listed in Figure 9.
Figure 9. Weld toe geometry modification methods for improving fatigue life of
weldments.
Grinding techniques rely on mechanical means to improve the weld toe profile. Using re-melting methods, the weld toe region is re-melted to a shallow depth
23

which results in improved weld toe shape and removal of probable slag inclusions and toe undercuts in that area.
2.3.3.2 Residual stress modification
Residual stress modification techniques reduce the high tensile residual stress in the weld toe region and may even produce compressive residual stresses at the weld toe. Some of these methods also result in a reduced stress concentration at the weld toe by improving the weld toe geometry. In a review paper, Kirkhope et. al. [38] discussed different weld fatigue improvement methods. Figure 10, which is adapted from their work, shows the main residual stress modification methods for improving the fatigue strength of welds.
Figure 10. Residual stress modification methods for improving fatigue life of weldments.
Peening is a cold working process which plastically deforms the surface by impacting it with a tool or small shots. Shot peening is a peening process which is performed by accelerating metallic or ceramic shots toward the surface of the part. Hammer peening and needle peening are similar techniques to shot peening except that the shots are replaced by a solid tool and a bundle of metallic wires with rounded ends, respectively. High frequency mechanical impact (HFMI) is a generic term to describe technologies for improving the fatigue strength of welded structures by locally modifying the residual stress state using ultrasonic or pneumatic technologies. HFMI makes use of cylindrical
24

indenters which are accelerated against a component with high frequency. This method is known by many names: ultrasonic impact treatment (UIT), ultrasonic peening (UP), ultrasonic peening treatment (UPT), high frequency impact treatment (HiFiT), pneumatic impact treatment (PIT) and ultrasonic needle peening (UNP) [41]. In overloading treatments, compressive residual stresses at the surface will be introduced as a result of local yielding. In stress relief methods the primary effect is the reduction of tensile residual stresses mainly using a heat source [38]. A recent approach in improving the fatigue life of welded components is the use of so called, Low Transformation Temperature (LTT) filler materials. Since in this project, LTT filler materials have been used to study the effect of residual stress modification, this method will be discussed more in detail in the following part.
2.3.3.3 Low Transformation Temperature filler materials Among fatigue strength improvement methods, using Low Transformation Temperature (LTT) filler materials is a recent alternative approach to increase the fatigue strength of welded parts in a single step i.e., without applying any post-weld treatment. A large number of investigations have confirmed the effectiveness of using LTT filler materials in increasing the fatigue life of welds. This effectiveness is due to transformation of the weld at low temperatures. The transformation start temperature is typically around 200°C, which lowers the tensile residual stresses or even produces compressive residual stresses within the weld region and particularly at the weld toe [43]–[47]. During transformation of austenite to martensite an increase in volume happens which could negate or even counter the contraction due to cool down. The phase transformation temperature in LTT alloys is strongly dependent on the content of alloying elements. There are several equations, such as Steven-Heynes equation, which relate Ms temperature to the alloying elements. 𝑀𝑀𝑠𝑠 = 561 − 474𝐶𝐶 − 33𝑀𝑀𝑀𝑀 − 17𝐶𝐶𝐶𝐶 − 17𝑁𝑁𝑁𝑁 − 21𝑀𝑀𝐷𝐷 (°𝐶𝐶) (2.7)
The carbon content should be kept low to improve toughness. The lower transformation temperature combines three effects that are beneficial in reducing the final residual stress level. 1) Since the thermal expansion coefficient of austenite is greater than that of ferrite, the volume expansion due to transformation is larger at lower temperatures, allowing a greater compensation of the accumulated thermal contraction strain. 2) If transformation is completed much before ambient temperature is reached, then it is the ferrite that contracts on cooling. Ferrite has higher yield strength than austenite (at low temperature)
25
and hence there is a lesser compensation of contraction strain by plastic relaxation. 3) When transformation occurs at low temperatures there is a greater accumulation of stress before the low transformation temperature is reached. This leads to a greater bias in the microstructure in constrained specimens, making the shear strain more effective in counteracting thermal contraction [45].
2.3.4 Weld toe radius and angle measurements
The main purpose of this part is to present a brief overview of the most used methods and their application by other researchers for measuring the weld toe radius and angle. More detailed information about three methods which were employed in this project will be discussed later in the experimental part. The toe radius is the most significant geometrical parameter of the weld toe, from the fatigue point of view. Therefore, weld toe measurement methods have mainly focused on measuring and reporting this parameter. There are several destructive and non-destructive methods to measure the weld toe geometry. Destructive methods are mainly based on cross sectioning and then measuring the radius using optical microscopy and a software for image analysis. Non-destructive methods can be straight forward like using reference blocks, feeler gauges or Weld Impression Analysis (WIA), also known as the plastic replica technique. They can also be more complicated like Structured Light Projection (SLP) and Laser Scanning Profiling (LSP) methods [35], [48]–[54]. Unfortunately, in a lot of studies on fatigue life of welded components, weld profile data have not always been reported. Furthermore, for most of the reported data, the measurement and evaluation procedure have not been discussed. Many researchers have applied aforementioned techniques to characterise weld geometries. WIA is one of the most common methods which has been used to capture the weld toe geometry [55], [56]. For example, Alam et al. [35] used this technique to measure the weld toe radius and angle for a fillet joint. Pang [48] and Engesvik et al. [49] used a sectioning technique to acquire the toe geometry of welded specimens. Stenberg et al. [50] used reference block, feeler gauge and SLP to measure the toe radius along the weld bead in a T-joint. Their results show that using reference blocks and feeler gauges do not provide the required accuracy and are subjective when measuring the toe radius. Similar results are obtained when measuring the radius by image analysis software from SLP results. Therefore, based on imported data from the SLP measurements, they developed an algorithm that assesses weld bead surface data and
26

automatically identifies and calculates the toe radius in several positions along the weld. Hou [51] used three-dimensional laser scanning technology to obtain the geometry of the weld toe. He processed the scanned result to construct finite element models of the toe to estimate the stress concentration factors along the weld. The use of SLP based techniques has increased recently. The main advantages of using these techniques are that they are automated, flexible and fast. In SLP methods, during the measurement, light patterns with known structures are projected sequentially on the weld profile. At the same time, images of the weld are captured by the camera. Using the triangulation method the 3-D image of the object is then derived. The obtained images can then be post-processed to determine weld geometry parameters [57]. Further research to investigate non-destructive measurement methods capturing the weld surface profiles with high resolution and good precision and then measuring the toe geometry is needed. In one part of this project, weld toe geometry, in particular weld toe radius, has been evaluated using three different non-destructive techniques.
27

3 Experimental
3.1 Base and filler material
The base material used in this study was Weldox 700, a high strength steel with a plate thickness of 8 mm. Gas Metal Arc Welding (GMAW) was used for cruciform welding of plates using two different filler materials, a standard high strength (OK Tubrod 14.03) and an LTT metal-cored wire. The compositions of the base material and filler materials are given in Table 1 and mechanical properties of base and filler materials are summarized in Table 2.
Table 1. Chemical composition of base material and all-weld metals (wt.%).
C Si Mn P S Cr Ni Mo V Ti Cu Al Nb
Weldox 700 0.13 0.3 1.18 0.011 0.003 0.27 0.04 0.13 0.007 0.013 0.01 0.041 0.022
LTT 0.02 0.7 1.3 0.005 0.007 12.8 6.2 0.1 - - - - -
OK Tubrod 14.03a 0.07 0.6 1.7 - - - 2.3 0.6 - - - - - a nominal composition.
Table 2. Mechanical properties of base metal and all-weld metal.
Welding consumable Rp0.2 (MPa)
Rm (MPa)
A5 (%)
Impact toughness at -40ºC (J)
OK Tubrod 14.03a 760 840 23 70
LTT 736 1127 13 49
Weldox 700 817 852 15.5 - a typical values.
3.2 Welding setup
Four series of welds (L1, L2, C1, and C2), each consisting of 11 samples, were produced. L refers to welds produced by the LTT filler material and C refers to the welds produced by the conventional filler material (OK Tubrod 14.03). Ar + 2% CO2 was used as shielding gas. L1 and C1 were single-pass welds while L2 and C2 were double-pass welds. The welding parameters are summarized in Table 3. Dimensions and the configuration of cruciform test samples together with the welding sequence are shown in Figure 11. In order to avoid the influence of welding start/stop positions on fatigue properties, they were
28

located on each side of the flanges. One start/stop position is shown in the photograph of the test weld in Figure 12.
Table 3. Welding parameters
Weld Filler material Number of beads
Current (A)
Voltage (V)
Welding speed (mm/s)
Heat input (kJ/mm)
L1 LTT 1 285 23.9 6.5 1.05
L2 LTT 2 280 23.9 10 0.67
C1 OK Tubrod 14.03 1 240 23.5 5.2 1.09
C2 OK Tubrod 14.03 2 250 20.5 8.8 0.58
Figure 11. Design and dimensions of the cruciform test specimens (dimensions in
mm).
29

Figure 12. Photograph of a test specimen.
3.3 Fatigue testing and evaluation
Fatigue tests have been performed by applying a constant amplitude sinusoidal tensile load in the longitudinal direction using a SCHENK fatigue test equipment and a frequency of 29-40 Hz at a stress ratio of R = 0.1 .The equipment is of the resonance type with a maximum load of 200 kN. Testing was stopped before fracture (run-outs) for samples surviving more than 2 million cycles. For evaluation of the fatigue test data, the evaluation procedure from IIW recommendation for fatigue design of welded joints and components [58], has been used. In this standard, welded joints with the same geometry, welding quality and residual stresses which have been fatigue tested under identical loading conditions represent the same fatigue strength, known as FAT or fatigue class. FAT data are characteristic values which represent 95% survival probability (i.e. 5% failure probability) calculated from the mean on the basis of a two-sided confidence of 75%. The slope of the S-N curves for details assessed on the basis of nominal stress is m=3.00. The IIW FAT class for the used geometry in this project is 71. Using the following equation
log(𝑁𝑁) = log(𝐶𝐶) −𝑚𝑚 ∗ log(∆𝑆𝑆) (3.1) The number of cycles, 𝑁𝑁 were plotted against the ∆𝑆𝑆 and using the least square technique, the mean fatigue strength was estimated. To calculate the FAT value,
30

the mean curve is lowered by 𝑘𝑘 standard deviations. Here, a 𝑘𝑘 value of 2.7 was used, based on the number of tested weld samples.
3.4 Weld toe geometry evaluation
In this project, weld toe geometry measurements is mainly aimed at measuring the weld toe radius but also the angle was measured. The focus has been on evaluating three non-destructive methods for the measurements: Weld Impression Analysis (WIA), Laser Scanning Profiling (LSP) and Structured Light Projection (SLP). In the following each of the three mentioned methods will be discussed in detail. In addition their applicability to radius measurement will be evaluated.
3.4.1 Weld Impression Analysis (WIA)
The WIA method combines the impression technique with image analysis. In literature it is also called the “replica technique” [56]. The main steps in this method are: a) Preparation and cleaning of impression area. b) Taking equal amounts of the two components (i.e. catalyst and base) using the colour coded measuring spoons c) Mixing: kneading the two components with fingertips until colour of mix is uniform. d) Applying the prepared putty onto and around the weld. e) Leaving the putty for about 2-3 minutes until the impression sets. f) Removing the impression. g) Cutting the impression revealing the cross section profile of the weld profile. h) Placing a cross section of the impression under stereo microscope and doing the measurement using image analysis software. Figure 13 shows the application of WIA to a weld sample in a sequence order as mentioned above. In the image analysis software, the radius was measured by using the 3-point command in the software toolbar. The three points are specified by the operator and a circle will be determined which passes through the three points. The radii were measured using a low (6.3x) and a high magnification (between 8x to 40x). WIA-LM and WIA-HM refer to the WIA method for low and high magnification, respectively.
31

Figure 13. Application of Weld Impression Analysis (WIA) to a weld sample.
3.4.2 Laser Scanning Profiling (LSP)
The Laser Scanning Profiling method uses the principle of optical triangulation (light intersection method). The principle is called triangulation because the laser line, the camera and the laser emitter form a triangle. A laser line is projected onto the target surface via a linear optical system. The reflected light from the laser line is received by a CCD element and then evaluated in two dimensions. Apart from the distance information (Z axis), the exact position of each point on the laser line (X axis) is also acquired and received as an output from the system [59]. The radii were calculated based on choosing three points on the X-Z graph using a specially developed Matlab code. The LSP system used for this study was ScanCONTROL from Micro-Epsilon, which is a device with an integrated camera and laser line. Figure 14 a) and b) illustrates the use of the LSP method for measuring the weld toe radius.
32

Figure 14. Laser Scanning Profiling (LSP) for measuring the weld toe radius.
3.4.3 Structured Light Projection (SLP)
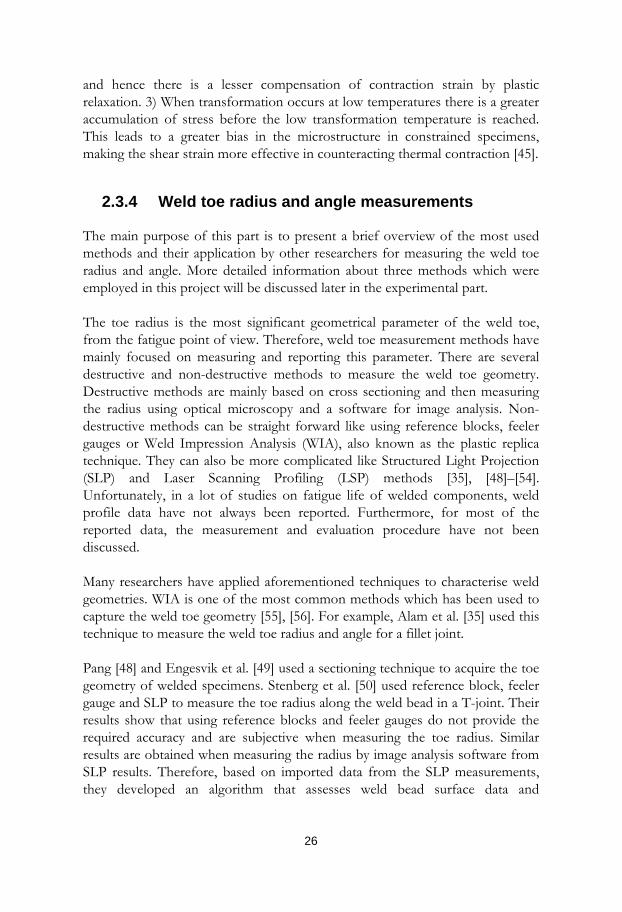
The use of SLP based techniques for geometrical measurements of welded joints has increased recently. The main advantages of these techniques are that they are automated, flexible and fast. The basics of SLP is almost the same as for LSP. In Structured Light Projection (SLP), a pattern of light is projected on the weld sample. The pattern is projected onto the weld surface using either a LCD projector or another stable light source. At the same time, images of the weld are captured by the camera. Using the triangulation method the 3-D shape of the weld is then derived from the images. Figure 15 illustrates using SLP method for measuring the weld toe radius. In the figure, light patterns projected on the weld surface are seen [50]. The SLP based system used in this research is MikroCAD and the software for evaluation is ODSCAD. In this software it is possible to define measurement points from which a radius is calculated based on an iteration method. It is also possible to export the measured surface x-, y-, and z-coordinates into a text file for further data processing.
33
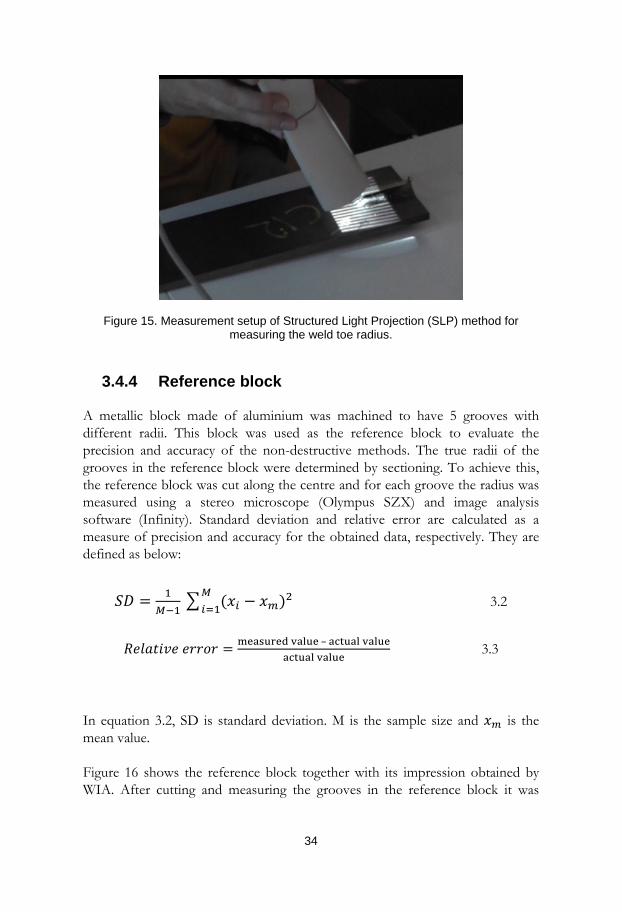
Figure 15. Measurement setup of Structured Light Projection (SLP) method for measuring the weld toe radius.
3.4.4 Reference block
A metallic block made of aluminium was machined to have 5 grooves with different radii. This block was used as the reference block to evaluate the precision and accuracy of the non-destructive methods. The true radii of the grooves in the reference block were determined by sectioning. To achieve this, the reference block was cut along the centre and for each groove the radius was measured using a stereo microscope (Olympus SZX) and image analysis software (Infinity). Standard deviation and relative error are calculated as a measure of precision and accuracy for the obtained data, respectively. They are defined as below:
𝑆𝑆𝐷𝐷 = 1𝑀𝑀−1
� (𝑥𝑥𝑚𝑚 − 𝑥𝑥𝑚𝑚)2𝑀𝑀𝑚𝑚=1 3.2
𝑅𝑅𝑅𝑅𝐷𝐷𝑅𝑅𝑅𝑅𝑁𝑁𝑅𝑅𝑅𝑅 𝑅𝑅𝐶𝐶𝐶𝐶𝐷𝐷𝐶𝐶 = measured value – actual valueactual value
3.3
In equation 3.2, SD is standard deviation. M is the sample size and 𝑥𝑥𝑚𝑚 is the mean value. Figure 16 shows the reference block together with its impression obtained by WIA. After cutting and measuring the grooves in the reference block it was
34

found that the true radii differed from nominal values. Figure 17 shows the true shape of each groove. The measured radii of grooves A, B and C are quite close to the expected values but the radii of grooves D and E are not. The nominal radii of the different grooves together with the true radii after sectioning of the block are listed in Table 4.
Figure 16. Reference block (top) and its impression after moulding using WIA (below).
Figure 17. Cross sections of grooves from the reference block after sectioning.
35

Table 4. Radius for the different grooves in the reference block.
Groove A B C D E
Nominal radius (mm) 6 3 1 0.6 0.2
True radius (mm) 5.64 2.94 0.99 0.65 1.15
Table 5 presents the number of tests performed for the different methods. In addition LSP and SLP methods were applied on the impression which were already obtained using WIA. LSP-WIA and SLP-WIA refer to application of LSP and SLP on the impression obtained by WIA, respectively.
Table 5. Measurements used for the reference block.
Method No. of cross sections
investigated
No. of measurement for
each cross section
No. of measurements
in total
WIA-LM 3 1 3
WIA-HM 3 1 3
LSP 1 5 5
SLP 1 5 5
LSP-WIA 1 3 3
SLP-WIA 1 5 5
3.4.5 Applying measurement methods on welds
All three non-destructive methods were used to measure the weld toe radius for a corner fillet weld which is shown in Figure 18. For measuring the weld toe radius variation along the weld toe, three surface profiles were investigated for each method. Figure 19, obtained with SLP, illustrates the position of the three surface profiles. In the figure WM stands for a surface profile at the centre of the weld toe and WL and WR are located 4 mm to the left and right of WM, respectively.
36

Figure 18. The corner fillet weld used for measuring the weld toe radius.
Figure 19. SLP image showing the location of three cross sections used for radius measurement.
It is not an easy task to fit a circle to the weld toe profile. In some cases, it was hard to determine the radius to be measured. Either a circle with a local smaller radius or a circle with a much bigger radius could be fitted equally well. Radius measurements were therefore performed in two ways to obtain local and general radii for each surface profiles for the SLP and LSP methods. In this study for measuring the local and general radii three points were placed on the profile 1.5 mm and 0.5 mm from each other, respectively. This procedure raised three questions. Firstly, which circle should be considered as the weld toe radius?
37
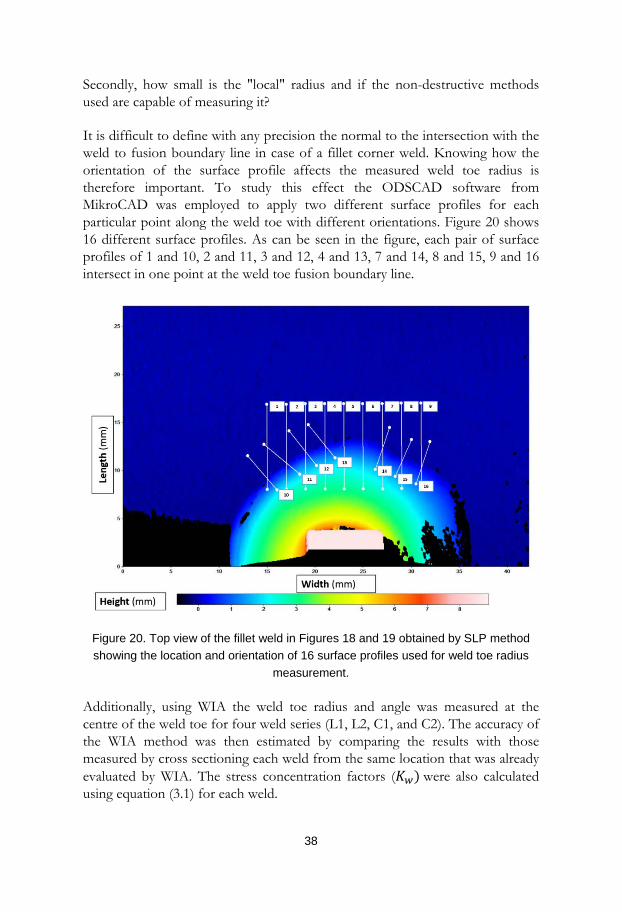
Secondly, how small is the "local" radius and if the non-destructive methods used are capable of measuring it? It is difficult to define with any precision the normal to the intersection with the weld to fusion boundary line in case of a fillet corner weld. Knowing how the orientation of the surface profile affects the measured weld toe radius is therefore important. To study this effect the ODSCAD software from MikroCAD was employed to apply two different surface profiles for each particular point along the weld toe with different orientations. Figure 20 shows 16 different surface profiles. As can be seen in the figure, each pair of surface profiles of 1 and 10, 2 and 11, 3 and 12, 4 and 13, 7 and 14, 8 and 15, 9 and 16 intersect in one point at the weld toe fusion boundary line.
Figure 20. Top view of the fillet weld in Figures 18 and 19 obtained by SLP method showing the location and orientation of 16 surface profiles used for weld toe radius
measurement.
Additionally, using WIA the weld toe radius and angle was measured at the centre of the weld toe for four weld series (L1, L2, C1, and C2). The accuracy of the WIA method was then estimated by comparing the results with those measured by cross sectioning each weld from the same location that was already evaluated by WIA. The stress concentration factors (𝐾𝐾𝑤𝑤) were also calculated using equation (3.1) for each weld.
38

3.5 Residual stress measurements
Residual stresses can be measured using both destructive and non-destructive methods. Some destructive methods are hole drilling and slicing. X-ray diffraction (XRD) and neutron diffraction are examples of non-destructive methods. XRD is the most commonly used method to measure the residual stresses. The measurement of residual stress by X-ray diffraction (XRD) relies on the fundamental interactions between the X-ray beam, and the crystal lattice. Based on Bragg’s law, very small changes in inter-planar spacing of crystalline materials can be measured based on a direct relationship between the inter-planar spacing and the angle of X-ray diffraction:
𝑀𝑀𝑛𝑛 = 2𝑑𝑑sinϴ (3.2) In this equation 𝑛𝑛 is the wavelength of X-ray, 𝑑𝑑 is the inter-planar spacing in the crystal planes and ϴ is the reflection angle. Measuring the strains at the surface of material using the sin2ѱ technique is a common method for determining the stress condition in welded components [60]. The stress normal to the surface is assumed to be zero. The stress to be determined is the stress parallel to the surface (𝜎𝜎ɸ). As illustrated in Figure 21, ɸ is the angle between this stress and the maximum principle stress (𝜎𝜎1).
Figure 21. Plane stress condition at a free surface. The strain component is measured along ɛѱɸ.
39
In the figure ѱ is the rotation angle of the x-ray beam. To obtain 𝜎𝜎ɸ from equation 3.3 it is necessary to measure 𝑑𝑑ɸѱ at a number of different ѱ tilts keeping ɸ constant:
𝑑𝑑ɸѱ = 𝑑𝑑ɸѱ(1 + ʋ)
E 𝜎𝜎ɸsin2ѱ + 𝑑𝑑ɸ0 (3.3)
When plotting 𝑑𝑑ɸѱ against sin2ѱ the gradient of the curve is 𝑑𝑑ɸѱ(1 + ʋ)/𝐸𝐸 multiplied by the stress 𝜎𝜎ɸ . The intercept of the curve gives the reference lattice spacing 𝑑𝑑ɸ0 . In this project the residual stresses were measured using X-rays on an Xstress 3000 instrument using Cr-Kα radiation and a 2mm collimator. The ѱ angle was varied between –45º and +45º. The transverse stress (normal to the weld toe) was measured at the last welded corner along the centreline of the flanges at 1-40 mm from the weld toe [61]. Measurements were performed on the as received welded plates, with no prior grinding or polishing.
40

4 Results
4.1 Fatigue testing
In all samples fracture initiated at the weld toes at the short edges of the flanges and propagated through the base metal. This is shown in Figure 22.
Figure 22. A cruciform fatigue test sample before and after testing.
Figure 23 shows a typical fracture surface of a sample welded with LTT consumables. Beach marks are not visible in the fracture surfaces which makes it hard to locate the exact crack initiation sites. In some cases ratchet marks are visible which help to locate the probable crack initiation sites. Cracks were not found to initiate from welding defects such as spatters or cold laps.
41
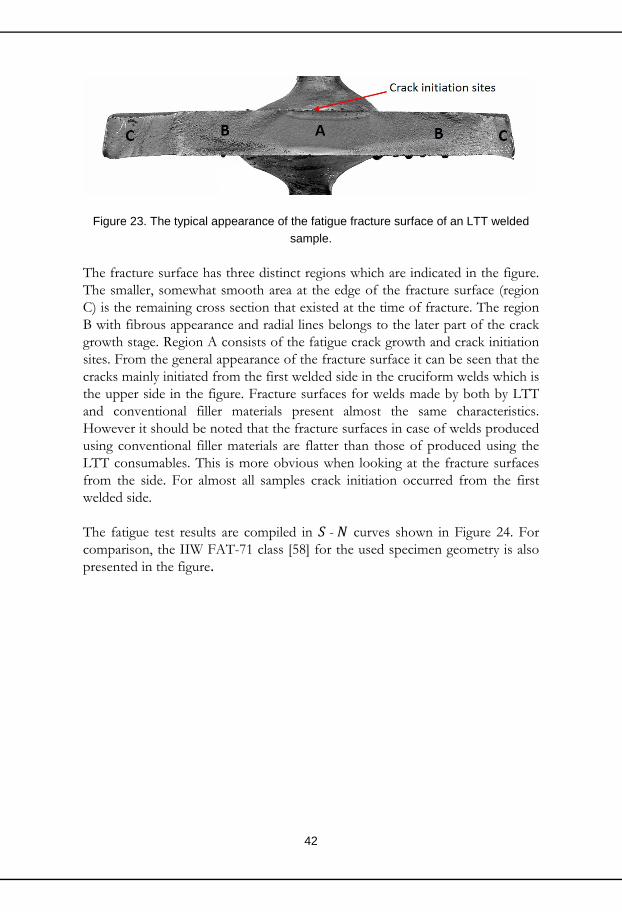
Figure 23. The typical appearance of the fatigue fracture surface of an LTT welded sample.
The fracture surface has three distinct regions which are indicated in the figure. The smaller, somewhat smooth area at the edge of the fracture surface (region C) is the remaining cross section that existed at the time of fracture. The region B with fibrous appearance and radial lines belongs to the later part of the crack growth stage. Region A consists of the fatigue crack growth and crack initiation sites. From the general appearance of the fracture surface it can be seen that the cracks mainly initiated from the first welded side in the cruciform welds which is the upper side in the figure. Fracture surfaces for welds made by both by LTT and conventional filler materials present almost the same characteristics. However it should be noted that the fracture surfaces in case of welds produced using conventional filler materials are flatter than those of produced using the LTT consumables. This is more obvious when looking at the fracture surfaces from the side. For almost all samples crack initiation occurred from the first welded side. The fatigue test results are compiled in 𝑆𝑆 - 𝑁𝑁 curves shown in Figure 24. For comparison, the IIW FAT-71 class [58] for the used specimen geometry is also presented in the figure.
42

Figure 24. Fatigue test results for cruciform specimens produced using LTT (L1 and L2) and conventional filler materials (C1 and C2).
The calculated characteristic fatigue strength (FAT), the mean fatigue strength at 2 million cycles and the slope of the curves are shown in Table 6.
Table 6. Characteristic fatigue strength (FAT), mean fatigue strength at 2 million cycles and slope of the S-N curves (m).
Weld FAT (MPa) Mean fatigue strength (MPa) m
L1 87 117 3.74
L2 110 137 4.41
C1 65 74 2.42
C2 69 78 2.79
It is clear that fatigue strength of LTT welds are significantly higher than for welds produced using the conventional wire (Figure 24 and Table 6). The fatigue strength of the double-pass LTT welds is the highest, followed by the single-pass LTT welds and finally the single and double-pass welds produced by the conventional wire. From the FAT values in Table 6 it can be seen that a fatigue strength improvement of 22% and 55% is achieved for L1 and L2 welds, respectively, when compared with the IIW FAT value of 71 MPa. Experimental FAT-values for welds produced by the conventional filler material were slightly
43
below the IIW FAT 71. Comparing mean fatigue strength levels at 2 million cycles even more clearly shows the higher fatigue strength of the LTT welds. A direct comparison shows an improvement of 58% for the single-pass welds and 76% for the double-pass welds.
4.2 Weld toe geometry measurement
4.2.1 Reference block
Results of all measurements using the three non-destructive methods together with the true radii of the grooves determined by sectioning of the reference block, which was shown in Figure 16, are presented in Table 7. As can be seen in the table all standard deviations are less than 0.2 and all relative error percentages are less than 15% which indicate that all three methods present precise and accurate values especially when the cross section of the object being measured is circular, which are the cases for grooves A, B and C. For non-circular cross sections, grooves D and E, the measurements are associated with a larger relative error. For groove D, the LSP method cannot obtain any measurements because of laser reflections from the V-shaped sides of this groove.
44

Table 7. Result of radius measurements for the reference block using sectioning and non-destructive methods.
Method Average
(mm) Standard deviation
Relative error (%)
Gro
ove
A
Sectioning 5.64 0.05 0 SLP 5.60 0.05 -0.70
LSP 5.90 0.12 4.57 WIA-LM 5.74 0.02 1.73
LSP-WIA 5.87 0.06 4.13
SLP-WIA 6.07 0.03 7.73
Gro
ove
B
Sectioning 2.94 0.04 0 SLP 2.86 0.01 -2.72 LSP 3.01 0.02 2.38
WIA-LM 2.89 0.06 -1.70 WIA-HM 2.88 0.05 -1.92 LSP-WIA 2.82 0.03 -4.19 SLP-WIA 3.13 0.14 -6.32
Gro
ove
C
Sectioning 0.99 0.04 0 SLP 1.08 0.03 8.83 LSP 0.98 0.01 -1.00
WIA-LM 0.95 0.05 -4.62 WIA-HM 0.97 0 -2.10 LSP-WIA 0.91 0.02 -8.08 SLP-WIA 0.95 0.02 -3.63
Gro
ove
D
Sectioning 0.65 0.02 0 SLP 0.66 0.02 1.53 LSP* - - -
WIA-LM 0.61 0.11 -6.15 WIA-HM 0.60 0.02 -6.66 LSP-WIA 0.75 0.09 14.87 SLP-WIA 0.64 0.02 -2.16
Gro
ove
E
Sectioning 1.15 0 0 SLP 1.20 0.10 4.7 LSP 1.26 0.20 9.93
WIA-LM 0.97 0.16 -15.21 WIA-HM 1.26 0.16 10.33 LSP-WIA 1.25 0.03 8.69 SLP-WIA 1.07 0.05 -7.30
*Not applicable because of laser reflections from groove sides.
45

As can be seen in the table, the highest standard deviation was with groove E with the LSP method. The lowest standard deviation was with WIA-HM. The highest relative error is related to measuring the radius for groove E using the WIA method while the lowest relative error was for groove A and the SLP method. LSP-WIA and SLP-WIA present quite precise results but the accuracy is a bit less than when using each method separately. Application of the LSP and SLP methods on the impression obtained by WIA result in low standard deviations but quite high relative errors. In general, considering table 7, by decreasing the radius the accuracy decreases and relative error increases. This shows that bigger radii can be measured more accurately than smaller ones.
4.2.2 Radius measurements on welds
The results of measuring the weld toe radius for the three cross sections in figure 19 are presented in Table 8. As can be seen in the table the weld toe radius varies along the weld and all three methods show almost the same trend for its variation.
Table 8. Weld toe radius results for the three cross sections in the fillet weld (Figure 19). Average of three measurements.
Cross section Method Weld toe radius (mm)
WL
SLP Local 1.17
General 2.57
LSP Local 1.30
General 3.01
WIA LM 1.14 HM 1.19
WM
SLP Local 0.99
General 1.63
LSP Local 0.94
General 2.60
WIA LM 1.15 HM 1.06
WR
SLP Local 0.78
General 1.53
LSP Local 0.78
General 2.46
WIA LM 0.90 HM 0.70
46
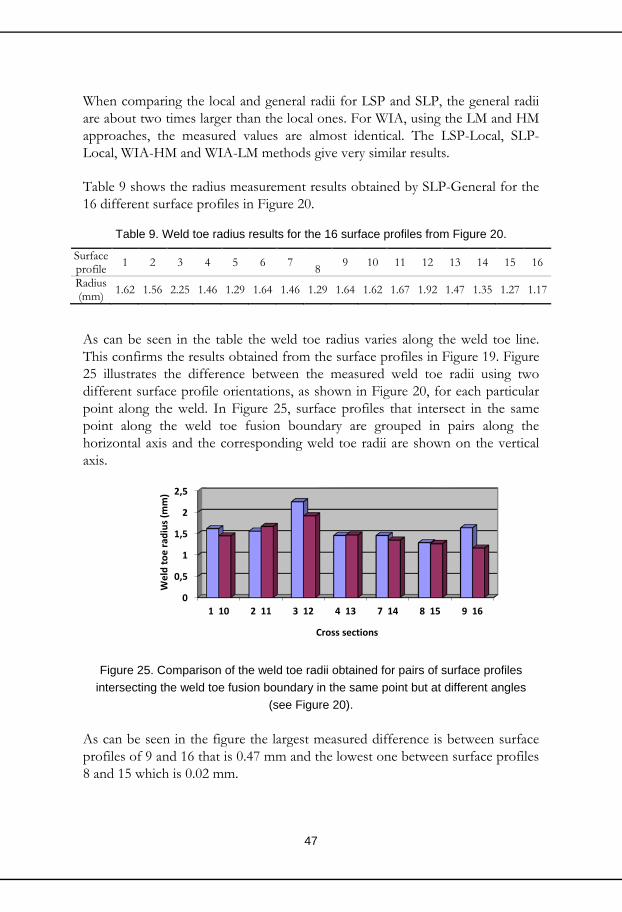
When comparing the local and general radii for LSP and SLP, the general radii are about two times larger than the local ones. For WIA, using the LM and HM approaches, the measured values are almost identical. The LSP-Local, SLP-Local, WIA-HM and WIA-LM methods give very similar results. Table 9 shows the radius measurement results obtained by SLP-General for the 16 different surface profiles in Figure 20.
Table 9. Weld toe radius results for the 16 surface profiles from Figure 20.
Surface profile 1 2 3 4 5 6 7
8 9 10 11 12 13 14 15 16
Radius (mm) 1.62 1.56 2.25 1.46 1.29 1.64 1.46 1.29 1.64 1.62 1.67 1.92 1.47 1.35 1.27 1.17
As can be seen in the table the weld toe radius varies along the weld toe line. This confirms the results obtained from the surface profiles in Figure 19. Figure 25 illustrates the difference between the measured weld toe radii using two different surface profile orientations, as shown in Figure 20, for each particular point along the weld. In Figure 25, surface profiles that intersect in the same point along the weld toe fusion boundary are grouped in pairs along the horizontal axis and the corresponding weld toe radii are shown on the vertical axis.
Figure 25. Comparison of the weld toe radii obtained for pairs of surface profiles
intersecting the weld toe fusion boundary in the same point but at different angles (see Figure 20).
As can be seen in the figure the largest measured difference is between surface profiles of 9 and 16 that is 0.47 mm and the lowest one between surface profiles 8 and 15 which is 0.02 mm.
0
0,5
1
1,5
2
2,5
1 10 2 11 3 12 4 13 7 14 8 15 9 16
Wel
d to
e ra
dius
(mm
)
Cross sections
47
Table 10 and 11 show the results of the weld toe radius and angle measurements using the WIA and sectioning methods, respectively. The results are average from six measurements together with the maximum and minimum values. All radius (r) and angle (ϴ) measurements are in mm and degree, respectively and the results are presented in Table 10. Table 10. Weld toe radius and angle measurements results using WIA together with
the calculated stress concentration factor (Kw).
Weld r (mm)
Max. r Min. r ϴ (degree)
Max. ϴ Min. ϴ Kw*
L1 1.4 1.5 1.2 128 145 127 2.10
L2 1.3 1.6 1.0 134 136 131 2.06
C1 2.6 3.1 2.2 149 159 148 1.6
C2 1.4 1.7 1.0 119 140 120 2.2
*equation 3.1 Table 11. Weld toe radius and angle measurements results obtained by sectioning of
the weld.
Weld r (mm)
Max. r Min. r ϴ (degree)
Max. ϴ Min. ϴ
L1 1.3 1.8 1.0 142 147 139
L2 1.2 1.6 1.0 140 143 136
C1 2.8 3.0 2.8 155 165 147
C2 1.1 1.7 0.6 127 134 122
From Table 10 and 11 it is clear that the largest values for both the weld toe radius and angle is found for the single-pass weld produced by conventional filler material (C1). No significant difference can be seen between L1, L2, and C2.
4.3 Residual stress measurements
Figure 26 shows the longitudinal surface residual stresses (stresses transverse to the weld at the corner) as function of the distance from the weld toe. The measurements were made in front of weld No. 4 in Figure 11. Surface residual stresses very close to the weld toe are higher for welds produced with the
48

conventional wire compared to those welded with the LTT wire. It can also be seen that tensile residual stresses are lower at 1 mm compared to 2 mm from the weld toe for LTT welds, whereas the opposite is true for the conventional welds. At distances closer than 3 mm to the weld toe, residual stress is slightly higher for a double-pass LTT weld compared to the single-pass LTT. The trend is opposite at distances further away. When comparing the two welds produced with conventional consumables and the two welds produced with LTT consumables it should be noted that the differences within the two pairs are not the same, close to the weld toe. The difference between the two LTT welds is about 30 MPa. The difference between the conventional welds is about 40-50 MPa. The experimental uncertainty, close to the weld toe, for all welds is in the order of 4-10 MPa and it reaches to a maximum of about 20 MPa at distances further away.
Figure 26. Longitudinal surface residual stresses (stresses transverse to the weld toe) in front of the weld toe for samples welded with LTT and conventional filler materials.
49


5 Discussion
In this project, the two main factors (weld toe geometry and residual stress) affecting the fatigue life of welded components have been studied. The weld toe geometry has been measured and evaluated using three non-destructive methods. Residual stresses were varied by using two different welding filler materials, one LTT wire and one standard high strength wire. The fatigue strength has been compared based on the relative effects of weld toe geometry and residual stresses. In the following sections the results are discussed.
5.1 Weld toe geometry
The aim of this part is to answer research questions number 2 and 3 of this project. The research questions were: Q2) What is the influence of weld toe geometry on fatigue life? Q3) How can the weld toe geometry be evaluated in a precise and accurate way? Thus, the local weld toe geometry (weld toe radius) has been evaluated using three non-destructive methods. Radius measurements has been done first for a reference block and then for some fillet welds. The results have been presented and discussed in Paper A and Paper B. The results of the radius measurements presented in the results section point to that all three methods measure the weld toe radius in an accurate and precise way. This is based on the fact that low values of standard deviation and relative errors were obtained in the measurements. Comparing the radius measurement result for the reference block and weld sample, it can be concluded that the measurements for the weld are associated with larger scatter. This can be attributed to the better defined geometry of the grooves in the reference block that makes it easier for the operator to fit a circle and measure the radius. When comparing the local and general radii for LSP and SLP for the fillet weld, the general radii are about two times larger than the local ones. For WIA, using the LM and HM approaches, the measured values are almost identical. The LSP-Local, SLP-Local, WIA-HM and WIA-LM methods give very similar results.
51

Therefore, it can be concluded that in WIA the magnification, in the range which have been studied in this research, has little effect on the measured weld toe radius. However, still it is not fully clear whether the local radius should be considered as the weld toe radius or the general one. One way of finding which radius is most relevant would be capturing 3D surface profiles and storing them. Fatigue testing can then be applied on the samples and after the fatigue tests the probable crack initiation sites could be determined. The initiation sites can then be located on the previously stored weld toe data. By finding the cross sections from which cracks initiated and measuring the local and general weld toe radii, it can be decided if the local or general radius should be considered. A weld toe is usually assumed to have a mathematically perfect and uniform geometry when analysing the weld toe stress and strain [51]. However, as illustrated by the result, the weld toe geometry cannot be considered uniform and its variation along the weld should be considered. The uncertainty in the measurement due to the operator is as a factor contributing to the scatter in data. Processing the obtained cross sections using image analysis is another issue resulting in scatter in the results. In the ODSCAD software used in the SLP the radius can be measured by defining a set of points on which a radius can be measured. Based on the operator’s choice of points, the program plots a circle. The Infinity software used in the WIA method relies on placing three points manually on the profile which a circle passes through and again it depends on the operator. To minimize the influence of the operator, an objective method such as using an automated algorithm for evaluating the weld toe radius would be preferred [50], [52]. It can also be suggested that in the community studying fatigue of weldments a standardized procedure for the weld toe geometry measurement should be introduced. This would result in better consistency in the results reported by different researchers. The procedure could address the method, the magnification or range of magnifications used for the geometry evaluation, the required precision and some other parameters affecting the measured values. Another observation is related to the difference between the measured weld toe radii using two different surface profile orientations in case of a fillet weld. It can be concluded that the difference in the measured weld toe radii, when two different surface profiles were used for measuring the weld toe radius in the same point at the weld toe, is small compared to other factors contributing to scatter. Thus, when measuring the weld toe radius, small variations in the surface profile orientation relative to the fusion boundary will not significantly affect results.
52

5.2 Comparison of non-destructive methods
In this part a comparison of the capability of the three methods to quantitatively measure the weld toe characteristics is presented and the advantages and disadvantages of using them are discussed. This can hopefully give some guidance making it easier to decide which methods are appropriate for the weld toe geometry evaluation in a specific application. In the SLP technique, measurements can be performed much faster than with the WIA and LSP methods. It takes only a few seconds to capture a 3-D picture of the weld profile. With LSP the measurements of a line-scan can be done in the same time while for WIA capturing the surface profile of a few centimetres takes at least 10 minutes. In WIA, storage of moulded materials needs special consideration. For example, they should be stored carefully and inadequate storage conditions will shorten the life time of the moulded samples. For SLP and LSP the results can be stored digitally and can be easily assessed at any time. Data can be exported, for example as a text file and used by other programs such as Matlab. Also the graphics can be exported in different formats for both LSP and SLP. From a safety point of view the laser light should be used with caution while SLP is eye safe. There is also no reported danger or harm for use of the polymer components in WIA. Two drawbacks for using LSP method, the first also applies to SLP, are the problem with obtaining information from shiny surfaces and secondly, inappropriate laser reflection from geometries that have edges or inclined surfaces such as groove E in this study. From cost point of view, WIA is cheap and requires no initial investment in comparison to the other methods. The advantages and disadvantages of using three methods are summarized in Table 12 and shown by + and – signs, respectively Considering advantages and disadvantages of all three non-destructive methods, SLP is a good choice for radius measurement as well as quality control of weld surfaces where a compact, high precision, fast and 3D measurement method is required. The WIA method is a suitable and economical choice for weld toe measurement when the aim is just finding the radius value from a short weld length.
53

Table 12. Advantages and disadvantages of the non-destructive methods based on
different criteria.
Criterion SLP LSP WIA
Processing time (shorter time=+) + + -
Accuracy and precision + + +
Safety + - +
Data storage + + -
Applicability for shiny surfaces - - +
Cost (low cost=+) - - +
5.3 Relative effect of weld toe geometry and residual stress
The aim of this part is to compare the relative influence of toe geometry and residual stress on the fatigue life. First the fatigue strength of LTT welds with one and two beads (L1 and L2) has been compared to that of conventional welds with one and two beads (C1 and C2). Then the comparison has been made within the welds made using the same filler materials i.e., between C1 and C2 and also L1 and L2. A summary of the obtained results of weld toe radii, angles, residual stresses and stress concentration factors is presented in Table 13.
Table 13. A summary of the obtained results of weld toe radii, angles, stress concentration factors and residual stresses for LTT and conventional welds.
Weld FAT
(MPa) Radius (mm)
Angle (degree)
Kw* Residual stress (MPa) 1 mm from the weld toe
L1 87 1.4 128 2.10 88
L2 110 1.3 134 2.06 116
C1 65 2.6 149 1.6 301
C2 69 1.4 119 2.2 260
* equation 1.3
54

In Paper C, the relative influences of weld toe geometry and residual stress has been investigated. However in the paper the focus has been on the effect of the weld toe radius. In this part the effect of the weld toe angle has also been considered and it has been taken into account when calculating the stress concentration factor (Kw). It was concluded in Paper C that residual stress has a relatively larger influence than toe geometry. This is based on the fact that significantly higher mean fatigue strength was obtained for LTT welds than for the welds made using conventional filler materials. In particular weld C1, having a significantly larger weld toe radius and angle than the other welds, would be expected to have a higher mean fatigue strength if the weld toe geometry i.e., weld toe radius and angle were the most influential parameter. A comparison of the relative effects of stress and toe geometry can be made for the two welds produced with the conventional filler material (C1 and C2). These welds show almost identical mean fatigue strength. C1 has a toe radius and angle of 2.6 mm and 149º and C2 a toe radius and angle of 1.4 mm and 119º, respectively (Table 13). Assuming the same difference in residual stress at the weld toe as 1 mm away, as results by Ramjaun et al. [62] suggest is reasonable for conventional welding consumables, this makes a quantitative comparison possible. A decrease in residual stress by about 40 MPa (Figure 26) would then balance the decrease in toe radius from 2.6 mm to 1.4 mm and the decrease in weld toe angle from 149º to 119º. This result can be compared to those by Björk et. al. [63] who discussed the relationship between the weld toe geometry and fatigue strength for non-load carrying fillet welded X-joints. The results of their work are summarized in Figure 27. A clear trend can be seen in the figure that the fatigue strength increases with increasing weld toe radius. Although there is significant scatter in the data, typically a 1 mm increase in the weld toe radius from 1.5 mm to 2.5 mm resulted in about 20-30 MPa increase in FAT. Although speculative this suggests that FAT of weld C1 should have been approximately 24-36 MPa higher than for C2 if residual stresses were similar. In other words it seems that a decrease in residual stress of 40 MPa should correspond to an increase on FAT of about 24-36 MPa in this particular case.
55
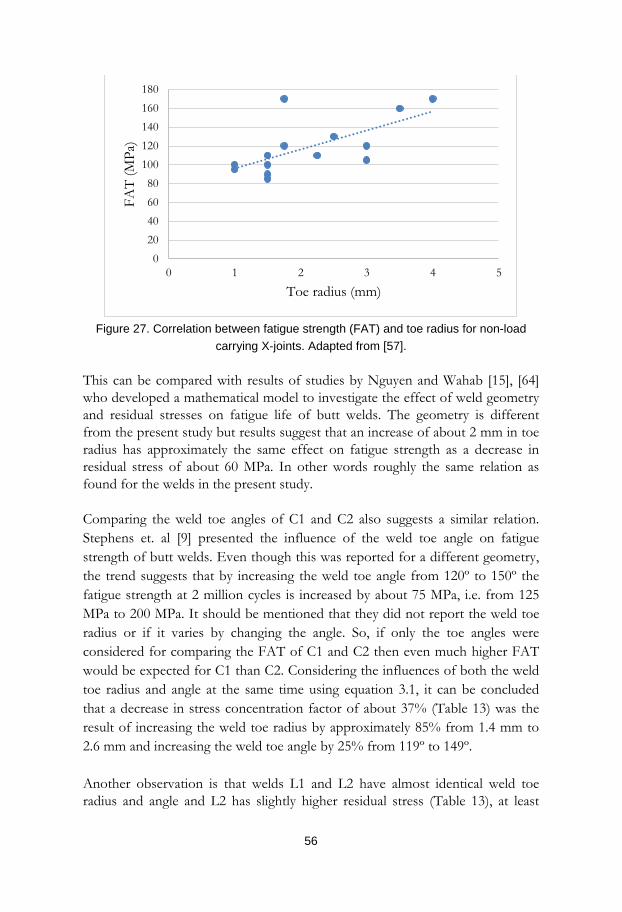
Figure 27. Correlation between fatigue strength (FAT) and toe radius for non-load
carrying X-joints. Adapted from [57]. This can be compared with results of studies by Nguyen and Wahab [15], [64] who developed a mathematical model to investigate the effect of weld geometry and residual stresses on fatigue life of butt welds. The geometry is different from the present study but results suggest that an increase of about 2 mm in toe radius has approximately the same effect on fatigue strength as a decrease in residual stress of about 60 MPa. In other words roughly the same relation as found for the welds in the present study. Comparing the weld toe angles of C1 and C2 also suggests a similar relation. Stephens et. al [9] presented the influence of the weld toe angle on fatigue strength of butt welds. Even though this was reported for a different geometry, the trend suggests that by increasing the weld toe angle from 120º to 150º the fatigue strength at 2 million cycles is increased by about 75 MPa, i.e. from 125 MPa to 200 MPa. It should be mentioned that they did not report the weld toe radius or if it varies by changing the angle. So, if only the toe angles were considered for comparing the FAT of C1 and C2 then even much higher FAT would be expected for C1 than C2. Considering the influences of both the weld toe radius and angle at the same time using equation 3.1, it can be concluded that a decrease in stress concentration factor of about 37% (Table 13) was the result of increasing the weld toe radius by approximately 85% from 1.4 mm to 2.6 mm and increasing the weld toe angle by 25% from 119º to 149º. Another observation is that welds L1 and L2 have almost identical weld toe radius and angle and L2 has slightly higher residual stress (Table 13), at least
020406080
100120140160180
0 1 2 3 4 5
FAT
(MPa
)
Toe radius (mm)
56

close to the weld toe. Still, the mean fatigue strength of L2 is significantly higher than for L1. If the residual stress was the most important factor, then a slightly lower mean fatigue strength would have been expected for L2. This seemingly contradictory result can be related to the method which has been used for residual stress measurement and also the location of measurements. Ramjaun et al. [62] investigated the near surface residual stresses using both X-ray and neutron diffraction methods for butt welds produced using LTT and conventional welding filler materials. Very similar stresses were measured by X-ray and neutron diffraction at some distance from the weld toe (see Figure 28). However, the X-ray measurements did not fully replicate the stress profile in the weld toe region, which were identified by neutron diffraction in the case of LTT welds. Using neutron diffraction a drastic local decrease around the weld toe was observed for the LTT welds whereas this was not seen in the result using X-ray diffraction. Therefore, X-ray measurement cannot be expected to accurately measure the actual local weld toe stress for LTT welds but can give an indication of whether the residual stresses are higher or lower than for conventional welds. It can also be concluded that they are most likely significantly lower than measured by X-ray at 1 mm.
Figure 28. Near surface residual stresses measured using X-rays and neutrons for butt welds produced using LTT filler materials. Reproduced with permission of Dr T.
Ramjaun [62].
57

The higher fatigue strength of L2 in comparison to L1 can be related to the, at the weld toe locally, higher compressive residual stresses in L2 than L1 as explained below. Ramjaun et. al. [62] have found that the volume of the LTT weld metal has an effect on the local weld toe stress level. For a three-pass LTT weld compressive stresses of about 600 MPa were measured whereas the compressive stresses at a single-pass LTT weld was about 400 MPa. Furthermore the second weld pass of L2 will have a composition with a lower Ms-temperature due to less dilution and thereby more effectively lowering the residual stress level. Considering the above discussion, the much better fatigue properties of weld L2 than for L1 can therefore most likely be explained in terms of a lower residual stress locally at the weld toe even though X-ray measurements cannot resolve this. In conclusion the results suggest that a moderate decrease in residual stress of about 15% at the 300 MPa stress level has the same effect on fatigue strength as the increase of the weld toe radius and angle by approximately 85% and 25%, respectively. It should be noted that this result was obtained for radii ranging from 1.4 mm to 2.6 mm and angles ranging from 119º to 149º and it cannot be concluded from the present study whether the relation is linear and applies to other weld toe geometries or stress ranges or not. The larger effect of using LTT consumables than having a larger weld toe radius and angle also shows the importance of the residual stress level. Further studies are needed to make a more quantitative comparison and to study whether the effect is the same or varies for different stress levels and weld toe geometries.
58

6 Conclusions
The effects of weld toe geometry and residual stress on fatigue life have been studied for welds in a high strength steel with a yield strength of more than 800 MPa. The weld toe geometry has been measured and evaluated using three non-destructive methods namely; Weld Impression Analysis (WIA), Laser Scanning Profiling (LSP) and Structured Light Projection (SLP). Residual stresses were varied by using two different welding filler materials, one LTT wire and one standard high strength wire. From this research the following can be concluded. Papers A and B
• All three non-destructive methods could be used successfully for measuring the weld toe radius and angle but the measured values are dependent on the evaluation procedure.
• The weld toe geometry cannot be considered uniform along the weld.
• The main factors contributing to the scatter in data are uncertainty in the weld toe geometry measurement due to the operator and processing of the obtained cross sections using image analysis. The effect of variations of the surface profile orientation relative to the weld toe fusion boundary line is small compared to the other factors.
• SLP is a good choice for radius measurement as well as quality control
of weld surfaces where a compact, high precision, fast and 3D measurement method is required. The WIA method is a suitable and economical choice for weld toe measurement when the aim is just finding the radius value from a short weld length.
Paper C
• The use of Low Transformation Temperature consumables increase fatigue life. The fatigue strength of LTT welds at 2 million cycles was 58% higher for single-pass welds and 76% higher for the double-pass welds when compared to corresponding welds made with conventional filler materials.
59
• The higher fatigue strength of LTT welds than for welds made with conventional consumables is an effect of the significantly lower stress levels at the weld toe.
• For welds made with conventional consumables, a decrease in residual
stress of about 15% at the 300 MPa stress level had the same effect on fatigue strength as the decrease in stress concentration factor of about 37%. The 37% decrease in stress concentration factor was a result of the increase of the weld toe radius by approximately 85% from 1.4 mm to 2.6 mm and an increase of the weld toe angle by 25% from 119º to 149º.
• Residual stress has a relatively larger influence than the weld toe
geometry on fatigue strength of cruciform welds.
60

7 Future work
Further studies are needed to investigate the effects of the weld toe radius and angle on fatigue life of weldments. Determination of the probable crack initiation sites after fatigue testing and then relating them to the previously measured weld toe radii and angle will be a significant step toward better understanding of the effect of the weld toe geometry on the fatigue life of welded parts. The results related to the relative effects of the weld toe geometry and residual stress on fatigue life of welds in this project has been reported for the radii and angles ranging from 1.3 mm to 1.6 mm and 119º to 149º, respectively. To be able to understand whether the relation is linear and applies to other weld toe radii or stress ranges or not, more studies are needed. Residual stresses in both longitudinal and transverse directions should be measured and the accumulative effect of the residual stresses in both directions should be taken into account when comparing the relative effects of toe geometry and residual stress. This would give more accurate and complete information about whether the residual stress has a larger influence on the fatigue life than the weld toe geometry. Also modelling and simulation should be done to predict the residual stresses and to compare these with experimental results. Residual stress measurements using neutron diffraction very close to the surface could be done, similar to those reported in [63], to confirm the assumed lower stress level obtained using LTT welds compared to in welds produced using conventional wires. Fatigue studies with different stress ratios especially with stress ratios less than zero (R≤0) and different loading condition such as bending should also be studied. By this further knowledge about the influence of residual stresses on fatigue can be obtained. This becomes more interesting when external loads, compression or tension, are added to the internal residual stresses with the same or different signs. This research deals with fatigue strength of welds made of a high strength steel, Weldox 700 with an actual yield strength of more than 800 MPa. Since the application of higher strength steels is increasing in industrial components, it would be very interesting to extend this study to steels with higher yield strengths than the one studied here.
61

Finally, fracture surface studies are needed to better understand the effects of the weld toe geometry and residual stress on the fatigue life. It would also make it possible to better explain the different behaviour of welds produced using LTT filler materials compared to those made using conventional wires.
62

8 References
[1] A. M. Gresnigt and C. M. Steenhuis, “High strength steels,” Prog. Struct. Eng. Mater., vol. 1, no. 1, pp. 31–41, Sep. 1997.
[2] L.-E. Svensson, L. Karlsson, and R. Söder, “Welding enabling light weight design of heavy vehicle chassis,” Sci. Technol. Weld. Join., p. 1362171814Y.000, Dec. 2014.
[3] T. R. Gurney, Fatigue of welded structures. CUP Archive, 1979. [4] S. J. Maddox, Fatigue strength of welded structures. Woodhead publishing,
1991. [5] N. E. Dowling, Mechanical behavior of materials : engineering methods for
deformation, fracture, and fatigue. Prentice Hall, 1993. [6] E. Astm, “96 (Reapproved 2002),” Stand. Terminol. Relat. Fatigue Fract.
Test. Annu. Book ASTM Stand., vol. 3, 1823. [7] S. Suresh, Fatigue of materials. Cambridge university press, 1998. [8] N. D. DiMatteo and S. R. Lampman, ASM Handbook, Volume 19: Fatigue
and Fracture. Vol. 19 Vol. 19. Materials Park: A S M International, 1996. [9] R. I. Stephens, A. Fatemi, R. R. Stephens, and H. O. Fuchs, “Metal fatigue
in engineering John Willey & Sons,” N. Y., 2001. [10] T. Lassen, Fatigue life analyses of welded structures. London ; Newport
Beach, CA: ISTE, 2006. [11] J. Bannantine, “Fundamentals of metal fatigue analysis,” Prentice Hall 1990,
p. 273, 1990. [12] K. Weman, Welding processes handbook. Elsevier, 2011. [13] K. J. Kirkhope, R. Bell, L. Caron, and R. I. Basu, “Weld detail fatigue life
improvement techniques,” 1997. [14] R. C. Rice, SAE fatigue design handbook. Society of Automotive
Engineers, 1997. [15] T. N. Nguyen and M. A. Wahab, “The effect of weld geometry and residual
stresses on the fatigue of welded joints under combined loading,” J. Mater. Process. Technol., vol. 77, no. 1–3, pp. 201–208, May 1998.
[16] A. Seto, T. Masuda, S. Machida, and C. Miki, “Very low cycle fatigue properties of butt welded joints containing weld defects. Study of acceptable size of defects in girth welds of gas pipelines,” Weld. Int., vol. 14, no. 1, pp. 26–34, Jan. 2000.
[17] M. B. Jonsson, P. J. Samuelsson, and P. G. B. Marquis, “Development of Weld Quality Criteria Based on Fatigue Performance,” Weld. World, vol. 55, no. 11–12, pp. 79–88, Nov. 2011.
63

[18] P. Schaumann and M. Collmann, “Influence of Weld Defects on the Fatigue Resistance of Thick Steel Plates,” Procedia Eng., vol. 66, pp. 62–72, 2013.
[19] H. Shirahata, C. Miki, R. Yamaguchi, K. Kinoshita, and Y. Yaginuma, “Fatigue crack detection by the use of ultrasonic echo height change with crack tip opening,” Weld. World, vol. 58, no. 5, pp. 681–690, May 2014.
[20] W. Fricke, “IIW guideline for the assessment of weld root fatigue,” Weld. World, vol. 57, no. 6, pp. 753–791, Aug. 2013.
[21] C. F. Boulton, “Acceptance levels of weld defects for fatigue service,” Weld. J., vol. 56, no. 1, p. 13s–22s, 1977.
[22] P. J. Withers and H. K. D. H. Bhadeshia, “Residual stress. Part 1 – Measurement techniques,” Mater. Sci. Technol., vol. 17, no. 4, pp. 355–365, Apr. 2001.
[23] P. J. Withers and H. K. D. H. Bhadeshia, “Residual stress. Part 2 – Nature and origins,” Mater. Sci. Technol., vol. 17, no. 4, pp. 366–375, Apr. 2001.
[24] G. A. Webster and A. N. Ezeilo, “Residual stress distributions and their influence on fatigue lifetimes,” Int. J. Fatigue, vol. 23, Supplement 1, pp. 375–383, 2001.
[25] M. N. James, D. J. Hughes, Z. Chen, H. Lombard, D. G. Hattingh, D. Asquith, J. R. Yates, and P. J. Webster, “Residual stresses and fatigue performance,” Eng. Fail. Anal., vol. 14, no. 2, pp. 384–395, Mar. 2007.
[26] H. E. Williams, H. Ottsen, F. V. Lawrence, and W. H. Munse, “The Effects of Weld Geometry on the Fatigue Behavior of Welded Connections,” 1900.
[27] X. Niu and G. Glinka, “The weld profile effect on stress intensity factors in weldments,” Int. J. Fract., vol. 35, no. 1, pp. 3–20, Sep. 1987.
[28] J. A. Martins Ferreira and C. A. Moura Branco, “Influence of the radius of curvature at the weld toe in the fatigue strength of fillet welded joints,” Int. J. Fatigue, vol. 11, no. 1, pp. 29–36, Jan. 1989.
[29] H. L. J. Pang, “Analysis of weld toe profiles and weld toe cracks,” Int. J. Fatigue, vol. 15, no. 1, pp. 31–36, Jan. 1993.
[30] T.-L. Teng, C.-P. Fung, and P.-H. Chang, “Effect of weld geometry and residual stresses on fatigue in butt-welded joints,” Int. J. Press. Vessels Pip., vol. 79, no. 7, pp. 467–482, Jul. 2002.
[31] V. Caccese, P. A. Blomquist, K. A. Berube, S. R. Webber, and N. J. Orozco, “Effect of weld geometric profile on fatigue life of cruciform welds made by laser/GMAW processes,” Mar. Struct., vol. 19, no. 1, pp. 1–22, Jan. 2006.
[32] C.-H. Lee, K.-H. Chang, G.-C. Jang, and C.-Y. Lee, “Effect of weld geometry on the fatigue life of non-load-carrying fillet welded cruciform joints,” Eng. Fail. Anal., vol. 16, no. 3, pp. 849–855, Apr. 2009.
[33] H. E. Radhi and S. M. Barrans, “Finite Element Analysis of Effect of Weld Toe Radius and Plate Thickness on Fatigue Life of Butt Welded Joint,” 2010.
64

[34] Z. Barsoum and B. Jonsson, “Influence of weld quality on the fatigue strength in seam welds,” Eng. Fail. Anal., vol. 18, no. 3, pp. 971–979, Apr. 2011.
[35] M. M. Alam, Z. Barsoum, P. Jonsén, A. F. H. Kaplan, and H. Å. Häggblad, “The influence of surface geometry and topography on the fatigue cracking behaviour of laser hybrid welded eccentric fillet joints,” Appl. Surf. Sci., vol. 256, no. 6, pp. 1936–1945, Jan. 2010.
[36] ASM International, Ed., ASM Handbook,Volume 6, 10th editon. Materials Park, Ohio: ASM International, 1990.
[37] L. Karlsson, “Improving fatigue life with low temperature transformation (LTT) welding consumables,” Svetsaren, vol. 64, no. 1, pp. 27–31, 2009.
[38] K. J. Kirkhope, R. Bell, L. Caron, R. I. Basu, and K.-T. Ma, “Weld detail fatigue life improvement techniques. Part 1: review,” Mar. Struct., vol. 12, no. 6, pp. 447–474, Jul. 1999.
[39] S. Roy, J. W. Fisher, and B. T. Yen, “Fatigue resistance of welded details enhanced by ultrasonic impact treatment (UIT),” Int. J. Fatigue, vol. 25, no. 9–11, pp. 1239–1247, Sep. 2003.
[40] R. K. Nalla, I. Altenberger, U. Noster, G. Y. Liu, B. Scholtes, and R. O. Ritchie, “On the influence of mechanical surface treatments—deep rolling and laser shock peening—on the fatigue behavior of Ti–6Al–4V at ambient and elevated temperatures,” Mater. Sci. Eng. A, vol. 355, no. 1, pp. 216–230, 2003.
[41] G. B. Marquis and Z. Barsoum, “A Guideline for Fatigue Strength Improvement of High Strength Steel Welded Structures Using High Frequency Mechanical Impact Treatment,” Procedia Eng., vol. 66, pp. 98–107, 2013.
[42] P. J. Haagensen and S. J. Maddox, “IIW Recommendations on Post Weld Improvement of Steel and Aluminium,” IIW Doc No, vol. 13, pp. 1815–00, 2003.
[43] G. Çam, O. Özdemir, and M. Koçak, “Progress in Low Transformation Temperature (LTT) Filler Wires: Review,” in Proceedings of the 63rd Annual Assembly & International Conference of the International Institute of Welding, 2010, pp. 759–765.
[44] J. Altenkirch, J. Gibmeier, A. Kromm, T. Kannengiesser, T. Nitschke-Pagel, and M. Hofmann, “In situ study of structural integrity of low transformation temperature (LTT)-welds,” Mater. Sci. Eng. A, vol. 528, no. 16–17, pp. 5566–5575, Jun. 2011.
[45] M. A. Kromm and T. Kannengiesser, “Characterizing phase transformations of different LTT alloys and their effect on residual stresses and cold cracking,” Weld. World, vol. 55, no. 3–4, pp. 48–56, Mar. 2011.
[46] A. A. Bhatti, Z. Barsoum, V. van der. Mee, A. Kromm, and T. Kannengiesser, “Fatigue Strength Improvement of Welded Structures Using New Low Transformation Temperature Filler Materials,” Procedia Eng., vol. 66, pp. 192–201, 2013.
65

[47] T. I. Ramjaun, H. J. Stone, L. Karlsson, J. Kelleher, S. W. Ooi, K. Dalaei, J. Rebelo Kornmeier, and H. K. D. H. Bhadeshia, “Effects of dilution and baseplate strength on stress distributions in multipass welds deposited using low transformation temperature filler alloys,” Sci. Technol. Weld. Join., vol. 19, no. 6, pp. 461–467, May 2014.
[48] H. L. J. Pang, “Analysis of weld toe profiles and weld toe cracks,” Int. J. Fatigue, vol. 15, no. 1, pp. 31–36, 1993.
[49] K. M. Engesvik and T. Moan, “Probabilistic analysis of the uncertainty in the fatigue capacity of welded joints,” Eng. Fract. Mech., vol. 18, no. 4, pp. 743–762, 1983.
[50] T. Stenberg, E. Lindgren, and Z. Barsoum, “Development of an algorithm for quality inspection of welded structures,” Proc. Inst. Mech. Eng. Part B J. Eng. Manuf., vol. 226, no. 6, pp. 1033–1041, Jun. 2012.
[51] C. Hou, “Fatigue analysis of welded joints with the aid of real three-dimensional weld toe geometry,” Int. J. Fatigue, vol. 29, no. 4, pp. 772–785, Apr. 2007.
[52] T. Peng, “Algorithms and models for 3-D shape measurement using digital fringe projections,” Jan. 2007.
[53] C.-H. Lee, K.-H. Chang, G.-C. Jang, and C.-Y. Lee, “Effect of weld geometry on the fatigue life of non-load-carrying fillet welded cruciform joints,” Eng. Fail. Anal., vol. 16, no. 3, pp. 849–855, Apr. 2009.
[54] H. E. Williams, H. Ottsen, F. V. Lawrence, and W. H. Munse, “The Effects of Weld Geometry on the Fatigue Behavior of Welded Connections,” 1970.
[55] M. M. Alam, Z. Barsoum, P. Jonsén, H. A. Häggblad, and A. Kaplan, “Geometrical aspects of the fatigue behaviour of laser hybrid fillet welds,” in Proceedings of fatigue design conference, Senlis, Paris, France, 2009.
[56] A. Ericson Öberg, M. Johansson, E. J. Holm, P. Hammersberg, and L.-E. Svensson, “The Influence of Correct Transfer of Weld Information on Production Cost,” in Proceedings of the 5th International Swedish Production Symposium, 2012, vol. 2012, pp. 295–302.
[57] T. Björk, J. Samuelsson, and G. Marquis, “The Need for a Weld Quality System for Fatigue Loaded Structures,” Weld. World, vol. 52, no. 1–2, pp. 34–46, Jan. 2008.
[58] A. Hobbacher, Recommendations for fatigue design of welded joints and components. International Institute of Welding, 2004.
[59] I. Eriksson, Methods for automatic inspection of weld geometries. Bachelor’s thesis, University West, Trollhättan, Sweden, 2008.
[60] J. Lu, Handbook of measurement of residual stresses. Egully. com, 1996. [61] L.-E. Svensson, L. Karlsson, and E. Harati, “Increasing fatigue life using
Low Transformation Temperature (LTT) welding consumables,” presented at the 2nd Swedish conference on design and fabrication of welded structures. 9-10 October 2013 in Borlänge, 2013, pp. 49–64.
[62] T. I. Ramjaun, H. J. Stone, L. Karlsson, M. A. Gharghouri, K. Dalaei, R. J. Moat, and H. K. D. H. Bhadeshia, “Surface residual stresses in multipass
66
welds produced using low transformation temperature filler alloys,” Sci. Technol. Weld. Join., vol. 19, no. 7, pp. 623–630, Jul. 2014.
[63] T. Björk, J. Samuelsson, and G. Marquis, “The Need for a Weld Quality System for Fatigue Loaded Structures,” Weld. World, vol. 52, no. 1–2, pp. 34–46, Jan. 2008.
[64] N. T. Ninh and M. A. Wahab, “The effect of residual stresses and weld geometry on the improvement of fatigue life,” J. Mater. Process. Technol., vol. 48, no. 1–4, pp. 581–588, Jan. 1995.
67


9 Summaries of appended papers
9.1 Paper A: Non-destructive measurement of weld toe radius using Weld Impression Analysis, Laser Scanning Profiling and Structured Light Projection methods
This paper is focused on evaluating three non-destructive methods to measure the weld toe radius: Weld Impression Analysis (WIA), Laser Scanning Profiling (LSP) and Structured Light Projection (SLP). Measurements were done on a reference block with five different radii. The accuracy of the three methods was estimated by comparing the results with those measured by cross sectioning the reference block.
Results show that all three methods present precise and accurate values. WIA seems to be a suitable and economical choice when the aim is just finding the radius. However, SLP is a good method to obtain a three-dimensional image of the weld profile fast, which also makes it more suitable for quality control in production.
9.2 Paper B: The measurement of weld toe radius using three non-destructive techniques
The three non-destructive methods Weld Impression Analysis, Laser Scanning Profiling and Structured Light Projection were employed to measure the weld toe radius of fillet welds. All three methods could be used succesfully but results are dependent on the evaluation procedure. The results show that the weld toe geometry cannot be considered uniform and varies along the weld. It was also found that the measured weld toe radii does not vary significantly with minor variations of the surface profile orientation.
69
9.3 Paper C: The relative effects of residual stresses and weld toe geometry on fatigue life of weldments
In this paper, the relative influence of residual stress and weld toe geometry on the fatigue life of cruciform welds was studied. Fatigue strength of cruciform welds produced using Low Transformation Temperature (LTT) filler material has been compared to that of welds produced with a conventional filler material. LTT welds had higher fatigue strength than conventional welds. A moderate decrease in residual stress of about 15% at the 300 MPa stress level had the same effect on fatigue strength as increasing the weld toe radius by approximately 85% from 1.4 mm to 2.6 mm. It was concluded that residual stress had a relatively larger influence than the weld toe geometry on fatigue strength.
70

10 Appended publications
71


isbn 978-91-87531-12-5
Nowadays there is an increasing demand for lighter structures. One possibility to optimize the weight is to make the components from high strength steels and join them by welding. Welding is the main joining method for fabrication of a large proportion of all engineering structures. Many of the engineering components experience fatigue loading during all or part of their life time and welded connections are often the prime location of fatigue failure.
The effects of weld toe geometry and residual stress on fatigue life have been studied for welds in a high strength steel with a yield strength of more than 800 MPa. The weld toe geometry has been measured and evaluated using three non-destructive methods namely; Weld Impression Analysis (WIA), Laser Scanning profiling (LSP) and Structured Light Projection (SLP). Residual stresses were varied by using two different welding filler materials, one Low Transformation Temperature (LTT) wire and one standard high strength wire. Results indicate that all three non-destructive evaluation methods give precise and accurate results. The use of LTT consumables increased fatigue life and residual stress had a larger effect than the weld toe geometry on fatigue strength.
Fatigue strength of welds in 800 MPa yield strength steels– Effects of weld toe geometry and residual stress