Appendices - New Jersey H...appendices. appendix h-1 state aid for local school districts...
18
Appendices
Transcript of Appendices - New Jersey H...appendices. appendix h-1 state aid for local school districts...

Appendices

APPENDIX
H-1
STATE AID FOR LOCAL SCHOOL DISTRICTSCONSOLIDATED SUMMARY
GENERAL FUND AND PROPERTY TAX RELIEF FUND(thousands)
Adjusted PropertyExpended Appropriation Requested Tax
Fiscal Fiscal Fiscal General Relief2016 2017 2018 Fund Fund Total
Formula Aid Programs:Equalization Aid 6,070,004$ 6,088,957$ 6,088,957$ 310,659$ 5,778,298$ 6,088,957$ Supplemental Enrollment Growth Aid 4,141 4,141 4,141 --- 4,141 4,141 Per Pupil Growth Aid 13,460 13,460 13,460 --- 13,460 13,460 PARCC Readiness 13,460 13,460 13,460 --- 13,460 13,460 Professional Learning Community Aid --- 13,427 13,427 --- 13,427 13,427 Educational Adequacy Aid 82,397 82,397 82,397 --- 82,397 82,397 Security Aid 195,491 199,525 199,525 --- 199,525 199,525 Adjustment Aid 570,551 566,024 566,024 --- 566,024 566,024 Preschool Education Aid 655,517 655,517 655,517 --- 655,517 655,517 Under Adequacy Aid 16,763 16,763 16,763 --- 16,763 16,763 School Choice 52,468 53,690 55,038 --- 55,038 55,038 Special Education Categorical Aid 763,304 769,628 769,628 --- 769,628 769,628 Transportation Aid 186,859 192,991 195,991 --- 195,991 195,991 Less:
Growth Savings - Payment Changes (1,971) (7,573) (317) --- (317) (317) Assessment of EDA Debt Service (26,529) (26,529) (26,529) --- (26,529) (26,529)
Subtotal, Formula Aid Programs 8,595,915$ 8,635,878$ 8,647,482$ 310,659$ 8,336,823$ 8,647,482$
School Building Aid 51,478 45,992 40,572 --- 40,572 40,572 School Construction Debt Service Aid 63,403 72,542 89,887 --- 89,887 89,887 School Construction and Renovation Fund 840,278 898,258 918,767 50,000 868,767 918,767
Subtotal, School Facilities Projects 955,159$ 1,016,792$ 1,049,226$ 50,000$ 999,226$ 1,049,226$
TOTAL FORMULA AID 9,551,074$ 9,652,670$ 9,696,708$ 360,659$ 9,336,049$ 9,696,708$
Other Aid to Education:Nonpublic School Aid 96,603$ 95,503$ 86,503$ 86,503$ ---$ 86,503$ Charter School Aid 5,667 42,565 51,355 --- 51,355 51,355 Host District Support Aid --- 25,860 27,683 --- 27,683 27,683 Commercial Valuation Stabilization Aid --- 32,000 32,000 --- 32,000 32,000 Payment for Children with Unknown District of Residence 37,500 38,500 41,000 --- 41,000 41,000 Extraordinary Special Education Costs Aid 164,989 170,000 170,000 3,978 166,022 170,000 General Vocational Aid 4,416 4,860 4,860 4,860 --- 4,860 County Vocational Partnership Grant Program 3,000 1,000 --- --- --- --- Integration Assistance Aid 1,243 --- --- --- --- --- Lead Testing for Schools --- 10,000 --- --- --- --- Other Aid 4,258 803 300 --- 300 300
Subtotal, Other Aid to Education 317,676$ 421,091$ 413,701$ 95,341$ 318,360$ 413,701$
Subtotal, Department of Education 9,868,750$ 10,073,761$ 10,110,409$ 456,000$ 9,654,409$ 10,110,409$
Direct State Payments for Education:
Teachers' Pension and Annuity Fund 761,169 1,083,157 1,495,975 --- 1,495,975 1,495,975 Teachers' Pension and Annuity Fund - Post Retirement Medical 944,044 913,755 970,058 --- 970,058 970,058 Teachers' Pension and Annuity Fund - Non-Contributory Insurance 37,969 40,051 38,770 --- 38,770 38,770 Affordable Care Act Fees 1,718 1,662 784 --- 784 784 Debt Service on Pension Obligation Bonds 184,840 210,750 226,217 --- 226,217 226,217 Post Retirement Medical Other Than TPAF 206,218 211,306 225,469 --- 225,469 225,469 Teachers' Social Security Assistance 747,696 768,295 758,351 --- 758,351 758,351
Subtotal, Direct State Payments for Education 2,883,654$ 3,228,976$ 3,715,624$ ---$ 3,715,624$ 3,715,624$
TOTAL 12,752,404$ 13,302,737$ 13,826,033$ 456,000$ 13,370,033$ 13,826,033$
--------- Recommended Fiscal Year 2018 --------
APPENDIX
H-2
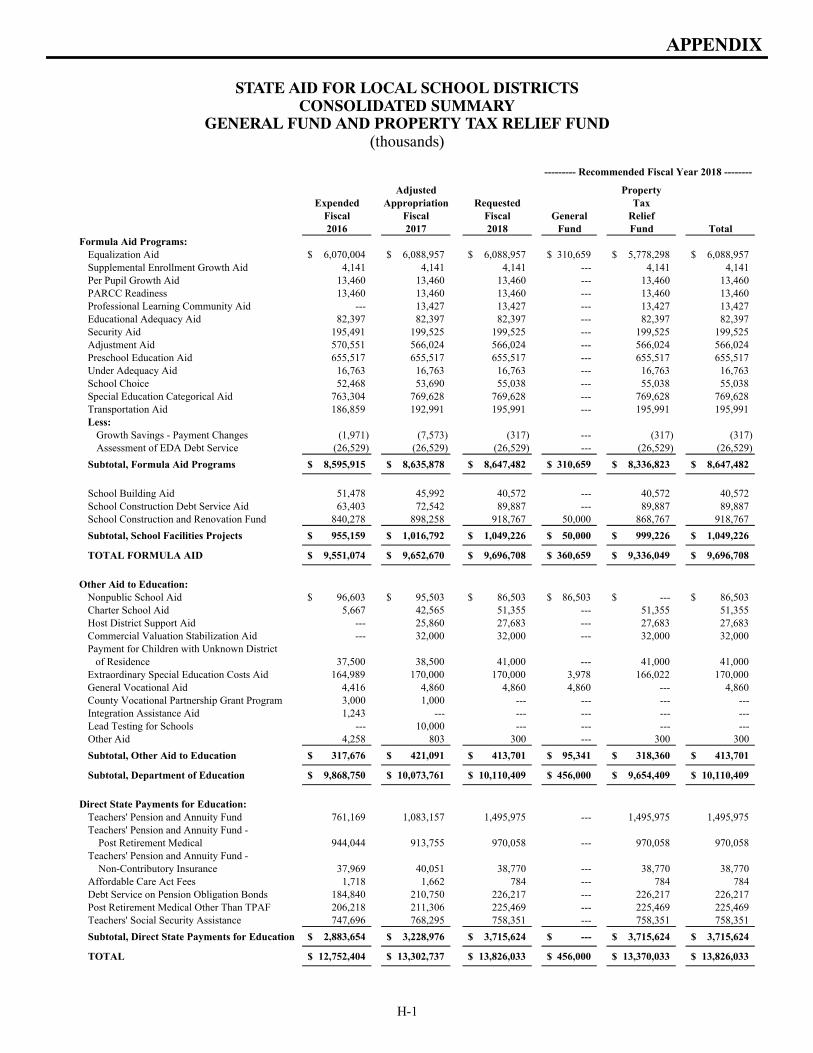
PROPERTY TAX RELIEF(millions)
FY 2017Adjusted FY 2018 ChangeApprop. Budget $ %
School Aid 13,302.8$ 13,826.0$ 523.2 3.9
Municipal Aid Consolidated Municipal Property Tax Relief Aid (CMPTRA) /
Energy Tax Receipts (a) 1,411.6$ 1,427.7$ 16.1 1.1
Transitional Aid to Localities 107.4 93.0 (14.4) (13.4)
Open Space Payments in Lieu of Taxes (PILOT) 6.5 6.5 --- ---
Highlands Protection Fund Aid 4.4 4.4 --- ---
Subtotal, Municipal Aid 1,529.9$ 1,531.6$ 1.7 0.1
Other Local Aid
Transportation Trust Fund - Local Project Aid (b) 280.4$ 496.7$ 216.3 77.1
County College Aid (c) 222.9 223.7 0.8 0.4
Employee Benefits on behalf of Local Governments 163.1 184.6 21.5 13.2
Support of Patients in County Psychiatric Hospitals 105.2 105.2 --- ---
General Assistance Administration 27.7 27.7 --- ---
Supplemental Nutrition Assistance Program Administration 24.2 17.2 (7.0) (28.9)
Essex County Jail Substance Use Disorder Programs 20.0 - (20.0) (100.0)
Library Aid 11.7 11.7 --- ---
South Jersey Port Corporation Property Tax Reserve Fund 5.1 5.1 --- ---
Consolidation Implementation 4.0 1.0 (3.0) (75.0)
County Prosecutor Funding Initiative Pilot Program 4.0 - (4.0) (100.0)
County Environmental Health Act 2.7 2.7 --- ---
Union County Inmate Rehabilitation Services 2.5 - (2.5) (100.0)
County Offices on Aging 2.5 2.5 --- ---
Essex Crime Prevention 2.0 - (2.0) (100.0)
Subtotal, Other Local Aid 878.0$ 1,078.1$ 200.1 22.8
Property Taxpayer Relief Programs
Property Tax Deduction Act (d) 455.8$ 462.2$ 6.4 1.4
Homestead Benefit Program 322.5 291.9 (30.6) (9.5)
Senior and Disabled Citizens' Property Tax Freeze 204.9 200.3 (4.6) (2.2)
Veterans' Property Tax Deductions 51.2 48.5 (2.7) (5.3)
Senior and Disabled Citizens' Property Tax Deductions 10.9 9.9 (1.0) (9.2)
Subtotal, Property Taxpayer Relief Programs 1,045.3$ 1,012.8$ (32.5) (e) (3.1)
GRAND TOTAL, PROPERTY TAX RELIEF 16,756.0$ 17,448.5$ 692.5 4.1
Notes:(a) Energy Tax Receipts, funding at $788.5 million, not part of budgeted State expenditures.(b) Not part of budgeted State expenditures.(c) Includes $18.8 million in funding from the Supplemental Workforce Fund for Basic Skills, not part of budgeted State expenditures.(d) Not part of budgeted State expenditures, and excludes property tax credit claims.(e) FY 2018 continues these programs unaltered. The change amount reflects the change in forecasted costs.
APPENDIX
H-3
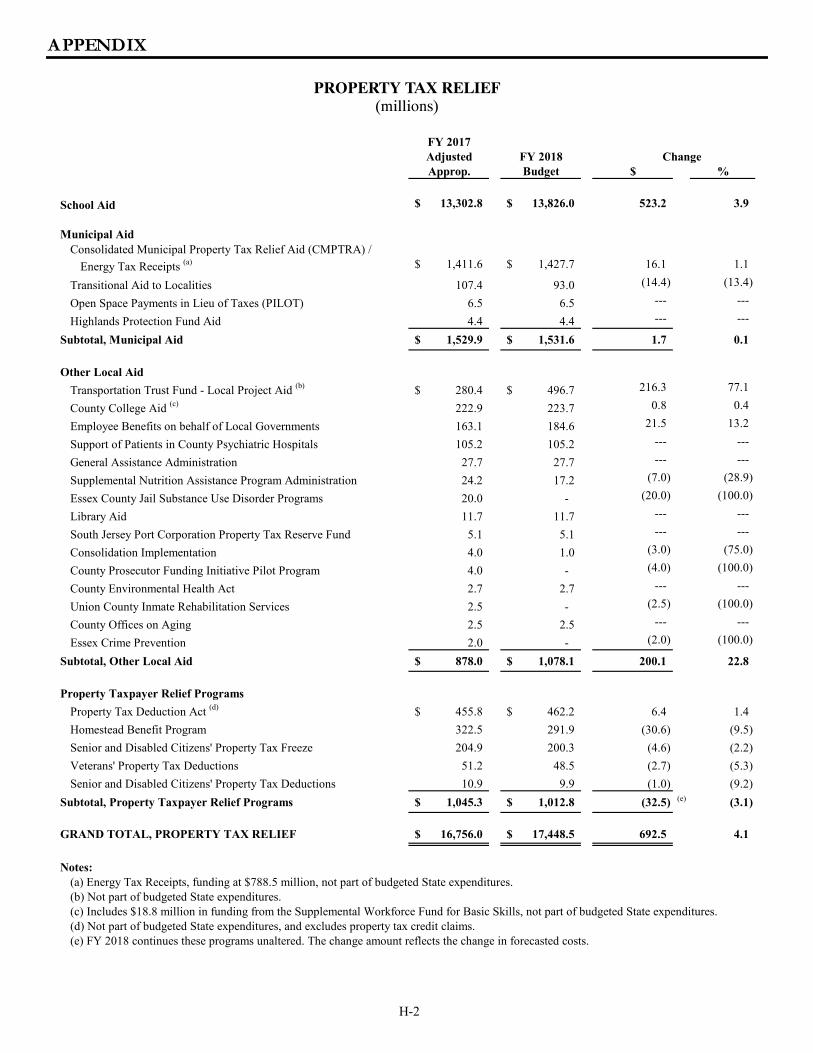
STATE LOTTERY FUND SCHEDULE(thousands)
Department of EducationStatewide Assessment Program....................................................................... 25,550$ Marie H. Katzenbach School for the Deaf....................................................... 6,590
Department of Human Services Operation of State Psychiatric Hospitals......................................................... 307,248 Operation of Centers for People with Developmental Disabilities.................. 94,576
Department of Military and Veterans' AffairsOperation of Homes for Disabled Soldiers...................................................... 15,656
Subtotal, Direct State Services........................................................................ 449,620$
Higher Educational ServicesSenior Public Institutions ................................................................................ 699,459$ Tuition Aid Grants........................................................................................... 419,359 Higher Education Capital Improvement Program........................................... 66,652 Opportunity Program Grants........................................................................... 26,019 Higher Education Facilities Trust Fund........................................................... 19,697 Supplementary Education Program Grants...................................................... 12,803 Student Tuition Assistance Reward Scholarship (NJSTARS I & II)............... 6,907 Aid to Independent Colleges and Universities................................................. 1,000 Governor's Urban Scholarship Program.......................................................... 945
Subtotal, Grants-in-Aid.................................................................................. 1,252,841$
Department of AgricultureSchool Nutrition.............................................................................................. 5,613$
Department of EducationNonpublic School Aid..................................................................................... 86,503
Subtotal, State Aid.......................................................................................... 92,116$
Grand Total.................................................................................................... 1,794,577$
The estimated revenue available from the State Lottery Fund for education and institutions infiscal year 2018 is $1.014 billion. These funds will be applied to support a portion of theprograms listed in the schedule below.
GRANTS-IN-AID
STATE AID
DIRECT STATE SERVICES

APPENDIX
H-4
CASINO REVENUE FUND
The Casino Revenue Fund (CRF) was established in 1976 with the provision that State revenues derived from casino gambling would be applied solely for the purpose of “providing funding for reductions in property taxes, rental, telephone, gas, electric, and municipal utilities charges of eligible senior citizens and disabled residents of the State in accordance with such formulae as the Legislature shall by law provide.” The Fund’s authorized use was expanded in 1981 to include additional or expanded health services or benefits, transportation services or benefits to eligible senior and disabled residents. Total CRF resources of $223.6 million, including $175,000 from the Casino Simulcasting Fund, are projected for fiscal 2018. This total also includes revenues from Internet gaming, which was launched in November 2013. The Pharmaceutical Assistance to the Aged and Disabled (PAAD) program, which at one point in time consumed a majority of the revenues in the CRF, has become less costly as most recipients now receive medications through the federally funded Medicare Part D program. This has allowed greater CRF support for expanded community based services for residents with developmental disabilities.
The summary and projection table on the following page displays CRF revenues and the programs receiving Fund appropriations over the past several years. Some CRF appropriations have been shifted to the General Fund during that time (see the “General Fund/Property Tax Relief Fund Support” section of the table).
BUDGET INITIATIVES AND ONGOING PROGRAMS
The following programs are currently receiving significant funding through the Casino Revenue Fund: Developmental Disabilities Residential Care
— $175.4 million Transportation Assistance to Seniors and Disabled
— $17.8 million Community Based Senior Programs
— $14.7 million Pharmaceutical Assistance to the Aged and Disabled (PAAD)
— $8.2 million Disability Services Personal Assistance
— $3.7 million Sheltered Workshop Transportation
— $2.2 million

APPENDIX
H-5
CASINO REVENUE FUND SUMMARY AND PROJECTION(thousands)
Fiscal Fiscal Fiscal Revised Budget2014 2015 2016 2017 2018
Opening Surplus .................................................................. ---$ ---$ ---$ 7,479$ ---$ Revenues ............................................................................. 221,226 205,964 209,243 215,906 223,469
Lapses and Adjustments (a) ................................................. 162,308 63,887 2,421 (1,877) 175
TOTAL RESOURCES ...................................................... 383,534$ 269,851$ 211,664$ 221,508$ 223,644$
MEDICAL ASSISTANCECommunity Based Senior Programs ................................. 14,747 14,737 14,748 14,748 14,748 Disability Services Waivers (b) ........................................ 16,502 --- --- --- --- Global Budget for Long Term Care (b) ............................ 37,850 --- --- --- --- Hearing Aid Assistance .................................................... 25 23 120 120 120 Human Services Administration ....................................... 902 850 871 871 871 PAAD -- Expanded .......................................................... 50,000 9,261 8,625 8,176 8,176 Personal Assistance .......................................................... 3,734 3,734 3,734 3,734 3,734 Statewide Birth Defects Registry ...................................... 528 516 529 529 529
TRANSPORTATION ASSISTANCESenior Citizens and Disabled Residents ........................... 20,343 18,264 18,824 17,523 17,801 Sheltered Workshop Transportation ................................. 2,196 2,196 2,196 2,196 2,196
HOUSING PROGRAMSDevelopmental Disabilities ............................................... 236,615 220,178 154,446 173,519 175,377
OTHER PROGRAMSHome Health Aide Certification ....................................... 92 92 92 92 92
TOTAL APPROPRIATIONS .......................................... 383,534$ 269,851$ 204,185$ 221,508$ 223,644$
ENDING SURPLUS .......................................................... 0$ 0$ 7,479$ 0$ 0$
GENERAL FUND/PROPERTY TAX RELIEF FUND SUPPORTDevelopmental Disabilities ............................................... 311,652 291,508 296,743 274,826 274,482 Global Budget and Waivers (b) ........................................ 106,297 --- --- --- --- Managed Long Term Services and Supports (b) .............. --- 215,602 315,258 381,538 461,150 PAAD -- Expanded .......................................................... 33,005 65,700 53,404 53,547 53,054 Personal Care/Community Programs (b) .......................... 63,170 31,721 35,977 40,507 38,007 Senior and Disabled Citizens' Property Tax Freeze .......... 211,635 203,572 205,707 204,900 200,300 SOBRA for Aged and Disabled ........................................ 234,262 237,629 244,164 263,419 276,277
TOTAL GENERAL FUND SUPPORT ........................... 960,021$ 1,045,732$ 1,151,253$ 1,218,737$ 1,303,270$
Notes:
Support program.
(a) Lapses and Adjustments include Interest Earnings, Casino Simulcasting Funds, and shifts in General Fund support.(b) Beginning in FY 2015, Global Budget and Waiver services are provided through the Managed Long Term Services and

APPENDIX
H-6
9--1--1 SYSTEM AND EMERGENCY RESPONSE FEE(thousands)
Department of Law and Public SafetyEmergency Operations Center and Hamilton TechPlex Maintenance........ 3,773$ Office of Homeland Security and Preparedness......................................... 9,478 Rural Section Policing................................................................................ 53,398 Urban Search and Rescue........................................................................... 1,000 Division of State Police - Remaining Operating Budget............................ 238,174
Department of Military and Veterans' AffairsMilitary Services - National Guard Support Services................................. 3,807
Department of the TreasuryOffice of Emergency Telecommunication Services (OETS)...................... 900 Statewide 9-1-1 Emergency Telecommunication System........................... 26,822
Total, State Appropriations....................................................................... 337,352$
The estimated revenue from the mobile telecommunications service and telephone exchange servicefee in fiscal year 2018 totals $134.3 million. In accordance with the enabling legislation (P.L.2004,c.48), these funds will be deposited into the 9-1-1 System and Emergency Response Trust Fundaccount and applied to offset a portion of the cost of related programs listed below:

APPENDIX
H-7
NEW JERSEY TRANSPORTATION CAPITAL PLAN(thousands)
FY 2017FY 2016 Adjusted
Expended Approp. Requested Recommended
Total, State Transportation Funds 1,172,464$ 1,600,000$ 2,000,000$ 2,000,000$ Total, Federal Highway & Public Transportation Trust Funds 1,387,834 1,994,745 1,611,439 1,611,439 Third-Party Funds - NJ DOT (a) 1,019,952 290,100 220 220 Third-Party Funds - NJ Transit (a) 18,824 17,523 17,801 17,801 Total, Federal Economic Stimulus --- --- --- ---
SUBTOTAL 3,599,074$ (b) 3,902,368$ 3,629,460$ 3,629,460$ (c)
Port Authority of New York & New Jersey (PANYNJ) 136,506 --- --- ---
TOTAL TRANSPORTATION CAPITAL PLAN 3,735,580$ (b) 3,902,368$ 3,629,460$ 3,629,460$ (c)
STATE TRANSPORTATION FUNDS - DISTRIBUTION
By Project Type State Highway Projects - NJ DOT 453,595$ 737,085$ 826,300$ 826,300$ Local Aid Highway Projects 210,574 280,415 496,700 496,700 Public Transportation Projects - NJ Transit 508,295 582,500 677,000 677,000
Total, State Transportation Funds 1,172,464$ 1,600,000$ 2,000,000$ 2,000,000$
NJ DOT & NJ Transit Project List by Transportation Asset Category Airport Assets 1,180 4,000 4,000 4,000 Bridge Assets 178,258 269,168 296,912 296,912 Capital Program Delivery 114,237 174,000 165,400 165,400 Congestion Relief 8,046 14,396 92,539 92,539 Local System Support 185,255 286,073 498,573 498,573 Mass Transit Assets 482,508 547,263 575,604 575,604 Multimodal Programs 7,642 11,000 37,500 37,500 Road Assets 149,438 227,300 223,000 223,000 Safety Management 9,700 14,700 34,800 34,800 Transportation Support Facilities 36,200 52,100 71,672 71,672
Total, State Transportation Funds 1,172,464$ 1,600,000$ 2,000,000$ 2,000,000$
FEDERAL HIGHWAY, PUBLIC TRANSPORTATION AND THIRD-PARTY FUNDS - DISTRIBUTION
By Project Type State Highway Projects - NJ DOT 1,880,323$ 1,214,457$ 955,290$ 955,290$ Public Transportation Projects - NJ Transit 682,793 1,087,911 674,170 674,170
Total, Federal Highway, Public Transportation & Third-Party Funds 2,563,116$ 2,302,368$ 1,629,460$ 1,629,460$
Federal Economic Stimulus - NJ DOT --- --- --- ---
Total, Federal Economic Stimulus ---$ ---$ ---$ ---$
Total, Federal Highway, Public Transportation, Third-Party & Economic Stimulus Funds 2,563,116$ 2,302,368$ 1,629,460$ 1,629,460$
NJ DOT & NJ Transit Project List by Transportation Asset Category Bridge Assets 1,312,364 504,800 211,070 211,070 Capital Program Delivery 21,282 28,100 37,140 37,140 Congestion Relief 199,810 307,700 323,700 323,700 Local System Support 79,295 97,220 105,310 105,310 Mass Transit Assets 634,168 1,000,391 586,650 586,650 Multimodal Programs 132,999 116,200 19,890 19,890 Road Assets 139,627 189,700 282,800 282,800 Safety Management 43,571 58,257 62,900 62,900
Total, Federal Highway, Public Transportation, Third-Party & Economic Stimulus Funds 2,563,116$ 2,302,368$ 1,629,460$ 1,629,460$
Notes:
and local governments.
by the "American Recovery and Reinvestment Act of 2009."
and finalized in the FY 2018 Transportation Capital Program when the FY 2018 Budget is adopted.(c) The specific projects represented by these amounts will be outlined in the Draft FY 2018 Transportation Capital Program, to be issued in April 2017,
The New Jersey Transportation Capital Plan funds the development and preservation of the State's transportation infrastructure through the Transportation TrustFund Authority (P.L.1984, c.73 as amended), federal transportation system appropriations and third-party sources. The Transportation Trust Fund Authority fundsState highway and bridge projects and public transportation projects outlined in the Department of Transportation's annual capital plan. Funds appropriated to theAuthority are composed of toll road authority contributions, motor fuels taxes, petroleum products gross receipts taxes, and sales and use taxes. The Authorityissues bonds to supplement State appropriations.
Year Ending---------- June 30, 2018 ----------
(a) Third-party funds represent funding provided from other sources, including but not limited to, bi-state and autonomous authorities, private entities
(b) FY 2016 expended is derived from the FY 2016 Transportation Capital Program and may include the federal economic stimulus program authorized
APPENDIX
H-8
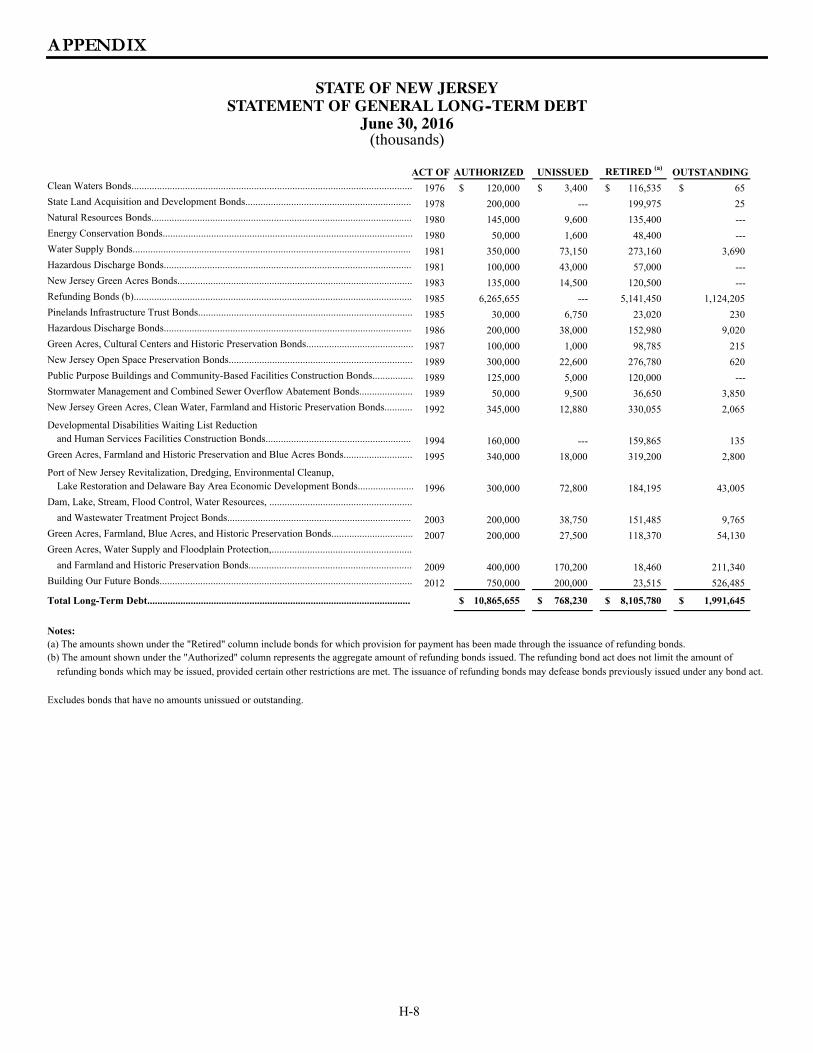
STATE OF NEW JERSEYSTATEMENT OF GENERAL LONG--TERM DEBT
June 30, 2016(thousands)
ACT OF AUTHORIZED UNISSUED RETIRED (a) OUTSTANDINGClean Waters Bonds.............................................................................................................. 1976 120,000$ 3,400$ 116,535$ 65$ State Land Acquisition and Development Bonds................................................................. 1978 200,000 --- 199,975 25 Natural Resources Bonds...................................................................................................... 1980 145,000 9,600 135,400 --- Energy Conservation Bonds.................................................................................................. 1980 50,000 1,600 48,400 --- Water Supply Bonds............................................................................................................. 1981 350,000 73,150 273,160 3,690 Hazardous Discharge Bonds................................................................................................. 1981 100,000 43,000 57,000 --- New Jersey Green Acres Bonds............................................................................................ 1983 135,000 14,500 120,500 --- Refunding Bonds (b)............................................................................................................. 1985 6,265,655 --- 5,141,450 1,124,205 Pinelands Infrastructure Trust Bonds.................................................................................... 1985 30,000 6,750 23,020 230 Hazardous Discharge Bonds................................................................................................. 1986 200,000 38,000 152,980 9,020 Green Acres, Cultural Centers and Historic Preservation Bonds.......................................... 1987 100,000 1,000 98,785 215 New Jersey Open Space Preservation Bonds........................................................................ 1989 300,000 22,600 276,780 620 Public Purpose Buildings and Community-Based Facilities Construction Bonds................ 1989 125,000 5,000 120,000 --- Stormwater Management and Combined Sewer Overflow Abatement Bonds..................... 1989 50,000 9,500 36,650 3,850 New Jersey Green Acres, Clean Water, Farmland and Historic Preservation Bonds........... 1992 345,000 12,880 330,055 2,065
Developmental Disabilities Waiting List Reductionand Human Services Facilities Construction Bonds......................................................... 1994 160,000 --- 159,865 135
Green Acres, Farmland and Historic Preservation and Blue Acres Bonds........................... 1995 340,000 18,000 319,200 2,800
Port of New Jersey Revitalization, Dredging, Environmental Cleanup,Lake Restoration and Delaware Bay Area Economic Development Bonds...................... 1996 300,000 72,800 184,195 43,005
Dam, Lake, Stream, Flood Control, Water Resources, ........................................................
and Wastewater Treatment Project Bonds........................................................................ 2003 200,000 38,750 151,485 9,765 Green Acres, Farmland, Blue Acres, and Historic Preservation Bonds................................ 2007 200,000 27,500 118,370 54,130 Green Acres, Water Supply and Floodplain Protection,.......................................................
and Farmland and Historic Preservation Bonds................................................................ 2009 400,000 170,200 18,460 211,340 Building Our Future Bonds................................................................................................... 2012 750,000 200,000 23,515 526,485
Total Long-Term Debt....................................................................................................... 10,865,655$ 768,230$ 8,105,780$ 1,991,645$
Notes:
Excludes bonds that have no amounts unissued or outstanding.
refunding bonds which may be issued, provided certain other restrictions are met. The issuance of refunding bonds may defease bonds previously issued under any bond act.
(a) The amounts shown under the "Retired" column include bonds for which provision for payment has been made through the issuance of refunding bonds.(b) The amount shown under the "Authorized" column represents the aggregate amount of refunding bonds issued. The refunding bond act does not limit the amount of

APPENDIX
H-9
STATE APPROPRIATIONS LIMITATION ACT(CAP Law)
The State Appropriations Limitation Act (P.L.1990, c.94), commonly called the CAP Law, limits the growth of appropriations in the Direct State Services section of the budget, which encompasses the operations of State government. Exempt from the limitation are Grants-In-Aid; State Aid to counties, municipalities, local school districts and other instrumentalities; federal funds appropriations; Capital Construction; Debt Service; and monies deposited in and expended from the Property Tax Relief Fund, the Casino Control Fund, the Casino Revenue Fund and the Gubernatorial Elections Fund.
The State may exceed the maximum appropriations if a bill making an appropriation is agreed to by a two-thirds vote of all members of each legislative body.
Under the formula in the law, the maximum appropriation for fiscal year 2018 is computed by multiplying the base year appropriation (fiscal 2017) subject to the percentage limitation by the average three-year growth rate in per capita personal income calculated on a fiscal basis. The fiscal 2018 CAP is calculated using 3.34%.
The calculation results in a maximum increase of $208 million over the fiscal 2017 Adjusted Appropriation, or a maximum appropriation of $6.435 billion for Direct State Services for fiscal 2018. The Governor’s recommendation for fiscal 2018, for items under the CAP, is $6.203 billion, or $232.6 million under the CAP limit. Data used to compute the appropriation limit are presented in the accompanying tables.
STATE INCOME (in millions)
Fiscal 2013 $493,390
Fiscal 2014 $499,405
Fiscal 2015 $525,386
Fiscal 2016 $545,541
Source: United States Department of Commerce, Bureau of Economic Analysis
STATE POPULATION
Fiscal 2013 8,899,339
Fiscal 2014 8,938,175
Fiscal 2015 8,958,013
Fiscal 2016 8,944,469
Source: United States Department of Commerce, Census Bureau
STATE PER CAPITA PERSONAL INCOME Personal Income
Percentage Change
Fiscal 2013 55,441
Fiscal 2014 55,873 0.78%
Fiscal 2015 58,650 4.97%
Fiscal 2016 60,992 3.99%
Three-Year Average 3.34%
Source: United States Department of Commerce,
Census Bureau

APPENDIX
H-10
COMPUTATION OF FISCAL 2018 CAPSUBJECT TO EXPENDITURE LIMITATION LAW PERCENTAGE
(thousands)
Adjusted Appropriations for Fiscal 2017 .......................................................... $ 34,615,724
Less Statutory Exemptions: Grants-In-Aid ...................................................................................................... (9,609,295) State Aid ............................................................................................................... (848,035) Capital Construction ............................................................................................. (1,548,438) Debt Service ......................................................................................................... (340,834) Property Tax Relief Fund ..................................................................................... (14,637,380) Casino Control Fund ............................................................................................. (50,268) Casino Revenue Fund ........................................................................................... (221,508) Gubernatorial Elections Fund ............................................................................... (14,080) Less: Defined Benefit Pension Contributions ........................................................ (616,926) Less: Funding In Accordance with Court Settlements .......................................... (333,349) Less: Federal Funds Support of Employee Benefits .............................................. (168,421)
Fiscal 2017 Base Subject to Percentage Limitation ........................................... $ 6,227,190
Per Capita Personal Income Growth Rate .............................................................. 3.34%
Maximum Increase in Appropriation for Fiscal 2018 ............................................. $ 207,988 Maximum Appropriation for Fiscal 2018 ............................................................... 6,435,178
Fiscal 2018 Recommendation ................................................................................. 7,484,300 Less: Defined Benefit Pension Contributions ........................................................ (800,543) Less: Funding In Accordance with Court Settlements .......................................... (318,837) Less: Federal Funds Support of Employee Benefits .............................................. (162,322)
Amount of Fiscal 2018 Appropriation Subject to the CAP Limitation ............ $ 6,202,598
Amount Over/(Under) the CAP Limitation ....................................................... $ (232,580)
APPENDIX
H-11
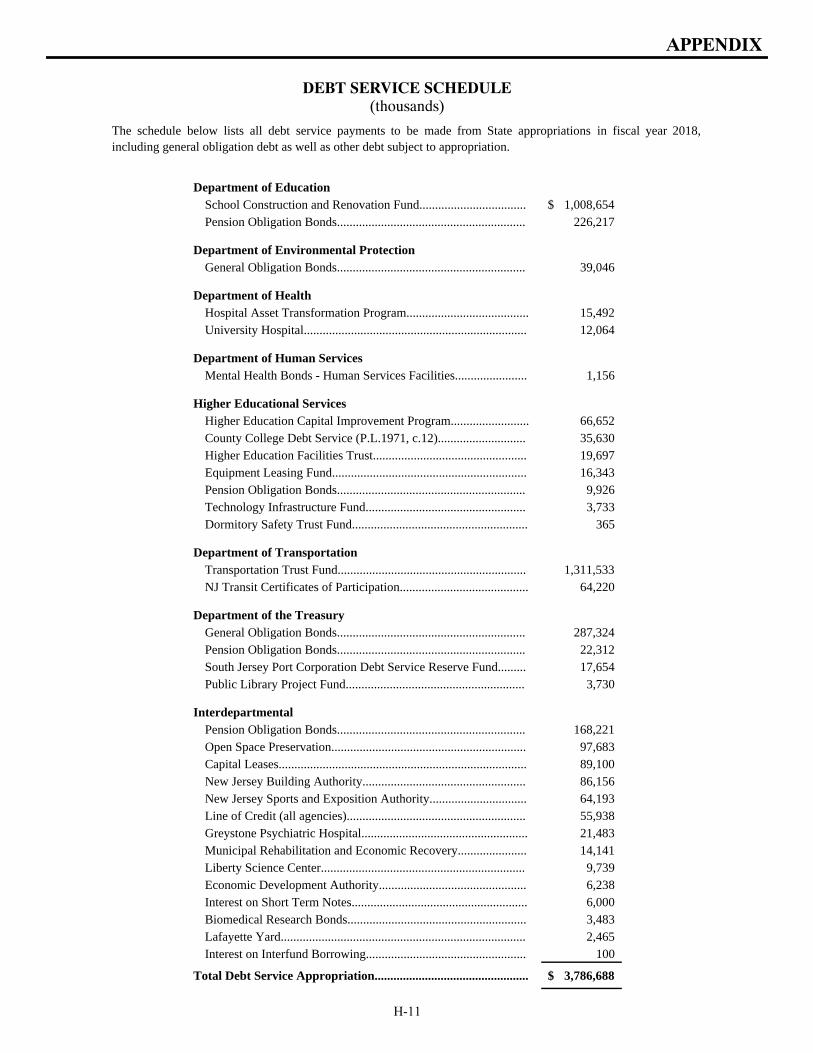
DEBT SERVICE SCHEDULE(thousands)
Department of EducationSchool Construction and Renovation Fund.................................. 1,008,654$ Pension Obligation Bonds............................................................ 226,217
Department of Environmental ProtectionGeneral Obligation Bonds............................................................ 39,046
Department of Health Hospital Asset Transformation Program....................................... 15,492 University Hospital....................................................................... 12,064
Department of Human Services Mental Health Bonds - Human Services Facilities....................... 1,156
Higher Educational ServicesHigher Education Capital Improvement Program......................... 66,652 County College Debt Service (P.L.1971, c.12)............................ 35,630 Higher Education Facilities Trust................................................. 19,697 Equipment Leasing Fund.............................................................. 16,343 Pension Obligation Bonds............................................................ 9,926 Technology Infrastructure Fund................................................... 3,733 Dormitory Safety Trust Fund........................................................ 365
Department of TransportationTransportation Trust Fund............................................................ 1,311,533 NJ Transit Certificates of Participation......................................... 64,220
Department of the TreasuryGeneral Obligation Bonds............................................................ 287,324 Pension Obligation Bonds............................................................ 22,312 South Jersey Port Corporation Debt Service Reserve Fund......... 17,654 Public Library Project Fund......................................................... 3,730
InterdepartmentalPension Obligation Bonds............................................................ 168,221 Open Space Preservation.............................................................. 97,683 Capital Leases............................................................................... 89,100 New Jersey Building Authority.................................................... 86,156 New Jersey Sports and Exposition Authority............................... 64,193 Line of Credit (all agencies)......................................................... 55,938 Greystone Psychiatric Hospital..................................................... 21,483 Municipal Rehabilitation and Economic Recovery...................... 14,141 Liberty Science Center................................................................. 9,739 Economic Development Authority............................................... 6,238 Interest on Short Term Notes........................................................ 6,000 Biomedical Research Bonds......................................................... 3,483 Lafayette Yard.............................................................................. 2,465 Interest on Interfund Borrowing................................................... 100
Total Debt Service Appropriation................................................. 3,786,688$
The schedule below lists all debt service payments to be made from State appropriations in fiscal year 2018,including general obligation debt as well as other debt subject to appropriation.

APPENDIX
H-12
HEALTH CARE SUBSIDY FUND(thousands)
Actual Acutal Budget BudgetFY 2015 FY 2016 FY 2017 FY 2018
FUND BALANCE JULY 1......................................... 10,036$ 13,446$ 4,678$ 3,892$
REVENUES
Provider Taxes
HMO Premiums Assessment................................... 159,047 185,101 195,467 204,073
.53% Hospital Assessment...................................... 111,055 115,480 120,526 125,793
Ambulatory Care Facility Assessment..................... 55,578 54,935 54,386 53,842
Cosmetic Medical Procedures Tax (a).................... 302 19 --- ---
Other Revenue Sources
Cigarette Tax........................................................... 396,500 396,500 396,500 396,500
Alcohol Excise Tax................................................. 22,000 22,000 22,000 22,000
Investment Earnings................................................ 48 156 50 50
TOTAL REVENUES............................................... 744,530$ 774,191$ 788,929$ 802,258$
TOTAL RESOURCES............................................ 754,566$ 787,637$ 793,607$ 806,150$
EXPENDITURES
Charity Care............................................................... 550,000 502,000 302,000 252,000
Children's Health Insurance Program (CHIP)............ 125,546 68,076 17,544 28,758
Federally Qualified Health Centers............................ 28,786 30,408 28,000 28,000
Hospital Mental Health Offset Payments................... 12,207 12,251 12,327 12,327
Delivery System Reform Incentive Payments............ 28,853 28,835 20,655 20,655
NJ FamilyCare........................................................... --- 171,772 411,517 488,000
TOTAL EXPENDITURES...................................... 745,392$ 813,342$ 792,043$ 829,740$
General Fund Support.............................................. (4,272) (30,383) (2,328) (27,482)
NET EXPENDITURES........................................... 741,120$ 782,959$ 789,715$ 802,258$
Projected Surplus/Deficit............................................ 13,446$ 4,678$ 3,892$ 3,892$
Federal Funds Appropriated for Programs Above
Charity Care............................................................... 100,000 --- --- ---
Children's Health Insurance Program (CHIP)............ 219,999 319,410 401,119 433,719
Hospital Mental Health Offset Payments................... 12,207 12,251 12,237 12,237
Delivery System Reform Incentive Payments............ 75,102 75,120 83,300 83,300
Notes:(a) The tax on cosmetic surgery procedures was eliminated in FY15.

APPENDIX
H-13
WORKFORCE
Full-time employees have been reduced by over 10,000 between the beginning of the Christie Administration and January 20, 2017. The Administration continues to manage staffing levels by budgeting the fiscal 2018 funded level at a continuation of the 2017 filled level for most agencies. The budget displays position growth from the 2017 filled level in programs impacted by enacted legislation or the Administration’s priorities. Examples are listed below. While the fiscal 2018 column represents budgeted positions, the Administration remains committed to aggressively managing the State’s workforce downwards.
State funded growth of 76, net of attrition, within the Department of Law and Public Safety, is partly due to the graduation of the 158th State Trooper class. The fiscal 2018 budget provides funding for the recruitment of the 159th class. This will be the ninth new class trained since 2010. With the graduation of the 159th class, the State Trooper level is expected to be at its highest level since the beginning of this Administration. In addition, the fiscal 2018 budget provides for new forensic positions in response to the pretrial detention constitutional admendment for bail reform.
The pretrial detention constitutional amendment for bail reform took effect on January 1, 2017. As a result, the fiscal 2018 budget supports 68 additional State funded positions within the Office of the Public Defender and 159 additional non-State funded positions within the Judiciary. The fiscal 2018 budget also supports 80 additional State funded positions, including 20 new judges authorized by the enactment of P.L.2016, c.103, which further support the implementation of bail reform.
APPENDIX
H-14
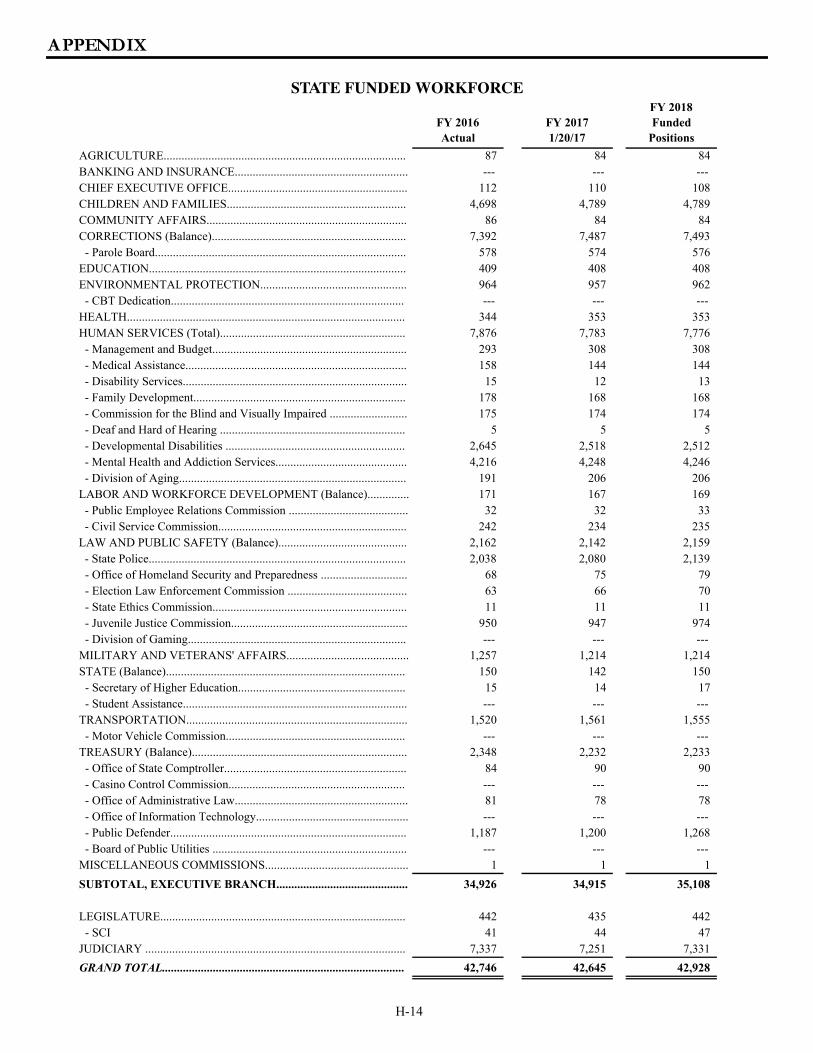
STATE FUNDED WORKFORCE
FY 2016Actual
FY 20171/20/17
FY 2018 Funded
Positions
AGRICULTURE................................................................................. 87 84 84 BANKING AND INSURANCE.......................................................... --- --- --- CHIEF EXECUTIVE OFFICE............................................................ 112 110 108 CHILDREN AND FAMILIES............................................................ 4,698 4,789 4,789 COMMUNITY AFFAIRS................................................................... 86 84 84 CORRECTIONS (Balance)................................................................. 7,392 7,487 7,493 - Parole Board.................................................................................... 578 574 576 EDUCATION...................................................................................... 409 408 408 ENVIRONMENTAL PROTECTION................................................. 964 957 962 - CBT Dedication.............................................................................. --- --- --- HEALTH............................................................................................. 344 353 353 HUMAN SERVICES (Total).............................................................. 7,876 7,783 7,776 - Management and Budget................................................................. 293 308 308 - Medical Assistance.......................................................................... 158 144 144 - Disability Services........................................................................... 15 12 13 - Family Development....................................................................... 178 168 168 - Commission for the Blind and Visually Impaired .......................... 175 174 174 - Deaf and Hard of Hearing .............................................................. 5 5 5 - Developmental Disabilities ............................................................ 2,645 2,518 2,512 - Mental Health and Addiction Services............................................ 4,216 4,248 4,246 - Division of Aging............................................................................ 191 206 206 LABOR AND WORKFORCE DEVELOPMENT (Balance).............. 171 167 169 - Public Employee Relations Commission ........................................ 32 32 33 - Civil Service Commission............................................................... 242 234 235 LAW AND PUBLIC SAFETY (Balance)........................................... 2,162 2,142 2,159 - State Police...................................................................................... 2,038 2,080 2,139 - Office of Homeland Security and Preparedness ............................. 68 75 79 - Election Law Enforcement Commission ........................................ 63 66 70 - State Ethics Commission................................................................. 11 11 11 - Juvenile Justice Commission........................................................... 950 947 974 - Division of Gaming......................................................................... --- --- --- MILITARY AND VETERANS' AFFAIRS......................................... 1,257 1,214 1,214 STATE (Balance)................................................................................ 150 142 150 - Secretary of Higher Education........................................................ 15 14 17 - Student Assistance........................................................................... --- --- --- TRANSPORTATION.......................................................................... 1,520 1,561 1,555 - Motor Vehicle Commission............................................................ --- --- --- TREASURY (Balance)........................................................................ 2,348 2,232 2,233 - Office of State Comptroller............................................................. 84 90 90 - Casino Control Commission........................................................... --- --- --- - Office of Administrative Law.......................................................... 81 78 78 - Office of Information Technology................................................... --- --- --- - Public Defender............................................................................... 1,187 1,200 1,268 - Board of Public Utilities ................................................................. --- --- --- MISCELLANEOUS COMMISSIONS................................................ 1 1 1
SUBTOTAL, EXECUTIVE BRANCH............................................ 34,926 34,915 35,108
LEGISLATURE.................................................................................. 442 435 442 - SCI 41 44 47 JUDICIARY ....................................................................................... 7,337 7,251 7,331
GRAND TOTAL................................................................................. 42,746 42,645 42,928
APPENDIX
H-15
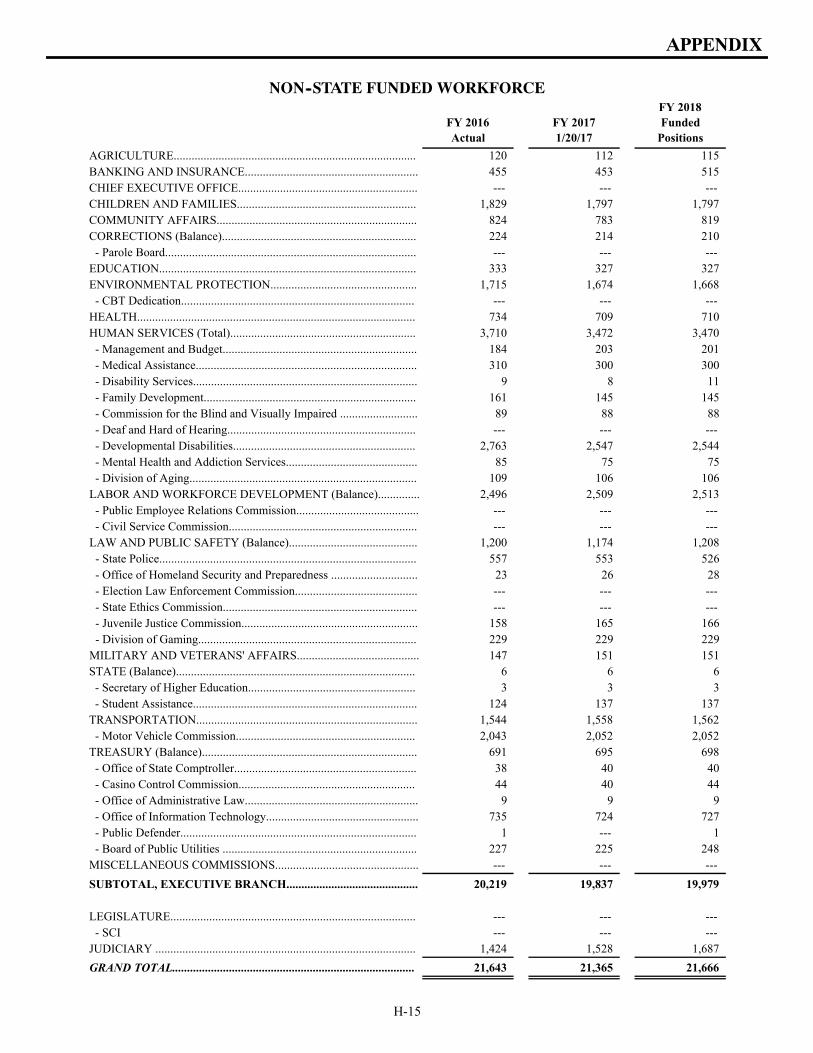
NON--STATE FUNDED WORKFORCE
FY 2016Actual
FY 20171/20/17
FY 2018 Funded
Positions
AGRICULTURE................................................................................. 120 112 115 BANKING AND INSURANCE.......................................................... 455 453 515 CHIEF EXECUTIVE OFFICE............................................................ --- --- --- CHILDREN AND FAMILIES............................................................ 1,829 1,797 1,797 COMMUNITY AFFAIRS................................................................... 824 783 819 CORRECTIONS (Balance)................................................................. 224 214 210 - Parole Board.................................................................................... --- --- --- EDUCATION...................................................................................... 333 327 327 ENVIRONMENTAL PROTECTION................................................. 1,715 1,674 1,668 - CBT Dedication.............................................................................. --- --- --- HEALTH............................................................................................. 734 709 710 HUMAN SERVICES (Total).............................................................. 3,710 3,472 3,470 - Management and Budget................................................................. 184 203 201 - Medical Assistance.......................................................................... 310 300 300 - Disability Services........................................................................... 9 8 11 - Family Development....................................................................... 161 145 145 - Commission for the Blind and Visually Impaired .......................... 89 88 88 - Deaf and Hard of Hearing............................................................... --- --- --- - Developmental Disabilities............................................................. 2,763 2,547 2,544 - Mental Health and Addiction Services............................................ 85 75 75 - Division of Aging............................................................................ 109 106 106 LABOR AND WORKFORCE DEVELOPMENT (Balance).............. 2,496 2,509 2,513 - Public Employee Relations Commission......................................... --- --- --- - Civil Service Commission............................................................... --- --- --- LAW AND PUBLIC SAFETY (Balance)........................................... 1,200 1,174 1,208 - State Police...................................................................................... 557 553 526 - Office of Homeland Security and Preparedness ............................. 23 26 28 - Election Law Enforcement Commission......................................... --- --- --- - State Ethics Commission................................................................. --- --- --- - Juvenile Justice Commission........................................................... 158 165 166 - Division of Gaming......................................................................... 229 229 229 MILITARY AND VETERANS' AFFAIRS......................................... 147 151 151 STATE (Balance)................................................................................ 6 6 6 - Secretary of Higher Education........................................................ 3 3 3 - Student Assistance........................................................................... 124 137 137 TRANSPORTATION.......................................................................... 1,544 1,558 1,562 - Motor Vehicle Commission............................................................ 2,043 2,052 2,052 TREASURY (Balance)........................................................................ 691 695 698 - Office of State Comptroller............................................................. 38 40 40 - Casino Control Commission........................................................... 44 40 44 - Office of Administrative Law.......................................................... 9 9 9 - Office of Information Technology................................................... 735 724 727 - Public Defender............................................................................... 1 --- 1 - Board of Public Utilities ................................................................. 227 225 248 MISCELLANEOUS COMMISSIONS................................................ --- --- ---
SUBTOTAL, EXECUTIVE BRANCH............................................ 20,219 19,837 19,979
LEGISLATURE.................................................................................. --- --- --- - SCI --- --- --- JUDICIARY ....................................................................................... 1,424 1,528 1,687
GRAND TOTAL................................................................................. 21,643 21,365 21,666
APPENDIX
H-16
A supplementary display of Other Governmental Funds andProprietary Funds can be found online at the following address:
www.state.nj.us/treasury/omb/publications/18budget