Monthly Report on Fiscal Position -...
22
Monthly Report on Fiscal Position November 2017 Fiscal Year 2017-18 P REPARED BY: Macroeconomic Wing Finance Division, Ministry Of Finance Government of the People’s Republic of Bangladesh CONTRIBUTED BY: Anarul Kabir, Deputy Secretary Finance Division, Ministry of Finance, and Abdul Mannan, Assistant Chief Finance Division, Ministry of Finance GUIDED BY: Rehana Perven, Joint Secretary Finance Division, Ministry of Finance
Transcript of Monthly Report on Fiscal Position -...
Monthly Report on Fiscal
Position November 2017
Fiscal Year 2017-18
PREPARED BY: Macroeconomic Wing
Finance Division, Ministry Of Finance
Government of the People’s Republic of Bangladesh
CONTRIBUTED BY: Anarul Kabir, Deputy Secretary
Finance Division, Ministry of Finance, and
Abdul Mannan, Assistant Chief
Finance Division, Ministry of Finance
GUIDED BY: Rehana Perven, Joint Secretary
Finance Division, Ministry of Finance
CONTENTS
Monthly Report on Fiscal Position ......................................................................................................... 1
1.0 Non-Development Expenditure ....................................................................................................... 1
1.1 Non-Development expenditure: General Classification ............................................................. 1
1.1.1 Sector-wise Allocation & Growth.................................................................................................................. 1
1.1.2 Broad Sector-wise Allocation ........................................................................................................................ 2
1.1.3 Sectors’ Share in Resource Utilization ......................................................................................................... 2
1.1.4 Sector-wise Utilization .................................................................................................................................... 3
1.1.5 Ministry-wise Utilization ................................................................................................................................ 3
1.2 Non-Development Expenditure: Economic Classification .......................................................... 3
2.0 Development Expenditure ............................................................................................................... 4
2.1 Allocation & Utilization Pattern of Development Expenditure ......................................................... 4
2.2 Broad Sector wise Utilization Pattern .............................................................................................. 5
2.3 Ministry wise Utilization Pattern ..................................................................................................... 5
3.0 Revenue Collection .......................................................................................................................... 6
3.1 Total Revenue .................................................................................................................................. 6
3.2 NBR Tax Revenue ............................................................................................................................ 7
4.0 Budget Deficit .................................................................................................................................. 8
5.0 Financing ........................................................................................................................................... 9
List of Figures
Figure 1: Sector Share in Resource Utilization in FY18 .......................................................................... 2
Figure 2: Non-Development Expenditure ................................................................................................ 3
Figure 3: Actual Expenditure According to Economic classification FY18(up to November 2017) ....... 4
Figure 4: Share of Different Categories in Total Actual Expenditure FY18 (Up to November 2017) .... 4
Figure 5: Broad Sector Wise Share in Development Expenditure ........................................................... 5
Figure 6: Sources of Revenue Collection ................................................................................................. 7
Figure 7 Share Among NBR Taxes ........................................................................................................... 7
Figure 8 Sources Of Financing Deficit ................................................................................................... 9
List of Tables
Table1: Non-Development Expenditure Pattern By Sector ...................................................................... 1
Table 2: Broad Sectorwise Allocation ...................................................................................................... 2
Table 3: Allocation& Utilization Pattern Of Development Expenditure ................................................. 5
Table 4: Revenue Collection Position ...................................................................................................... 6
Table 6: Budget Deficit ............................................................................................................................ 8
List of Appendix
Appendix 1: Sector-Wise Resource Utilization Pattern Of Non-Development Expenditure .................. 10
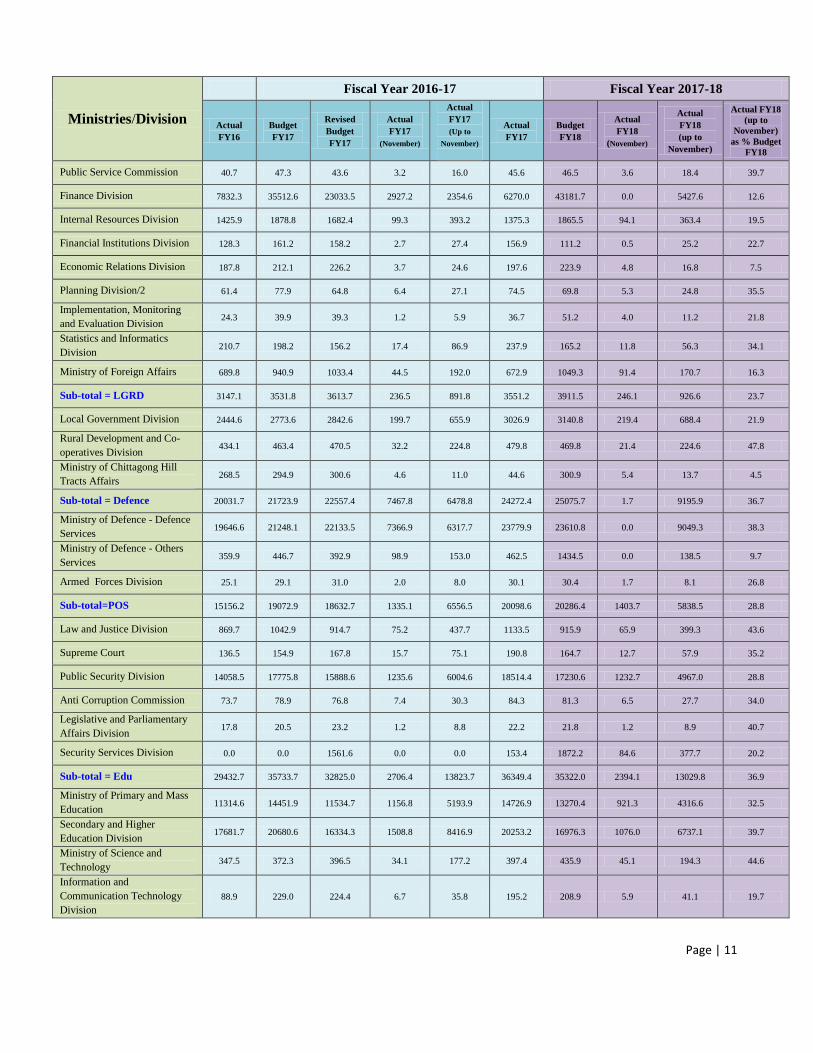
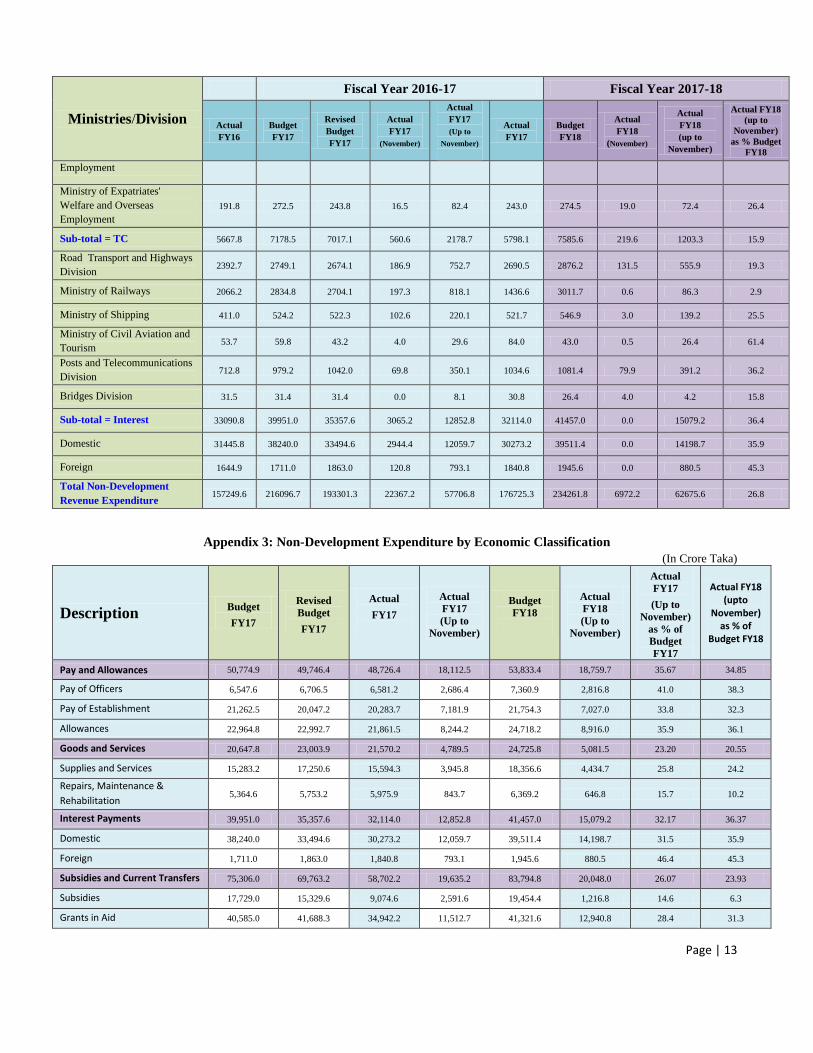
Appendix 2: Ministry Wise Non-Development Expenditure ................................................................... 10
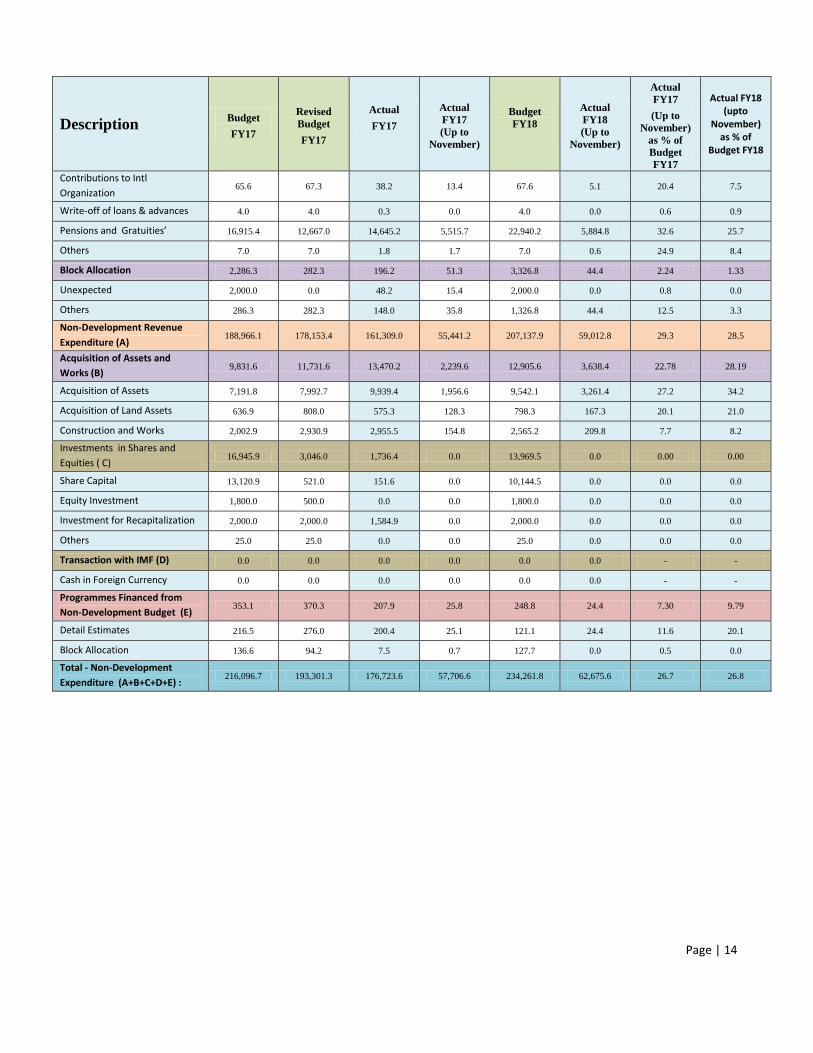
Appendix 3: Non-Development Expenditure by Economic Classification ............................................. 13
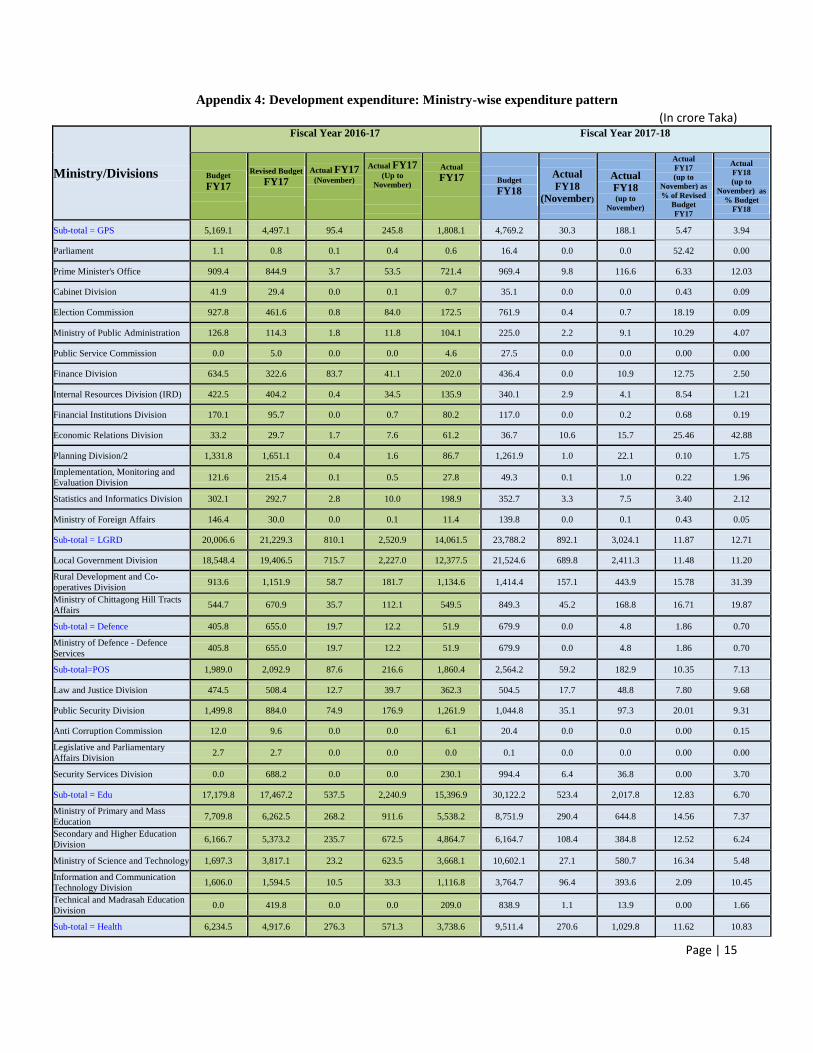
Appendix 4: Development expenditure: Ministry-wise expenditure pattern .......................................... 15
Appendix 5 Revenue Collection .............................................................................................................. 17
Appendix 6 Revenue Receipts (Growth Scenario) .................................................................................. 18
Page | 1
MONTHLY REPORT ON FISCAL POSITION1
1.0 NON-DEVELOPMENT EXPENDITURE
1.1 NON-DEVELOPMENT EXPENDITURE: GENERAL CLASSIFICATION
1.1.1 Sector-wise Allocation& Growth
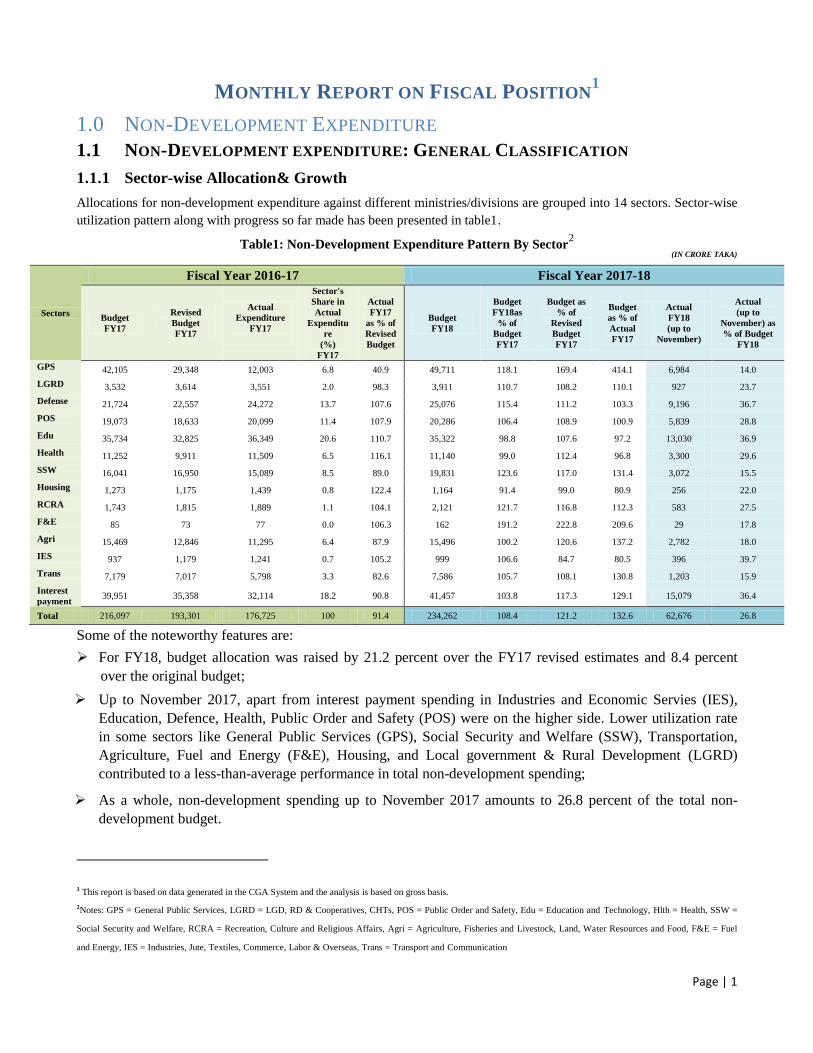
Allocations for non-development expenditure against different ministries/divisions are grouped into 14 sectors. Sector-wise
utilization pattern along with progress so far made has been presented in table1.
Table1: Non-Development Expenditure Pattern By Sector2
(IN CRORE TAKA)
Sectors
Fiscal Year 2016-17 Fiscal Year 2017-18
Budget
FY17
Revised
Budget
FY17
Actual
Expenditure
FY17
Sector's
Share in
Actual
Expenditu
re
(%)
FY17
Actual
FY17
as % of
Revised
Budget
Budget
FY18
Budget
FY18as
% of
Budget
FY17
Budget as
% of
Revised
Budget
FY17
Budget
as % of
Actual
FY17
Actual
FY18
(up to
November)
Actual
(up to
November) as
% of Budget
FY18
GPS 42,105 29,348 12,003 6.8 40.9 49,711 118.1 169.4 414.1 6,984 14.0
LGRD 3,532 3,614 3,551 2.0 98.3 3,911 110.7 108.2 110.1 927 23.7
Defense 21,724 22,557 24,272 13.7 107.6 25,076 115.4 111.2 103.3 9,196 36.7
POS 19,073 18,633 20,099 11.4 107.9 20,286 106.4 108.9 100.9 5,839 28.8
Edu 35,734 32,825 36,349 20.6 110.7 35,322 98.8 107.6 97.2 13,030 36.9
Health 11,252 9,911 11,509 6.5 116.1 11,140 99.0 112.4 96.8 3,300 29.6
SSW 16,041 16,950 15,089 8.5 89.0 19,831 123.6 117.0 131.4 3,072 15.5
Housing 1,273 1,175 1,439 0.8 122.4 1,164 91.4 99.0 80.9 256 22.0
RCRA 1,743 1,815 1,889 1.1 104.1 2,121 121.7 116.8 112.3 583 27.5
F&E 85 73 77 0.0 106.3 162 191.2 222.8 209.6 29 17.8
Agri 15,469 12,846 11,295 6.4 87.9 15,496 100.2 120.6 137.2 2,782 18.0
IES 937 1,179 1,241 0.7 105.2 999 106.6 84.7 80.5 396 39.7
Trans 7,179 7,017 5,798 3.3 82.6 7,586 105.7 108.1 130.8 1,203 15.9
Interest
payment 39,951 35,358 32,114 18.2 90.8 41,457 103.8 117.3 129.1 15,079 36.4
Total 216,097 193,301 176,725 100 91.4 234,262 108.4 121.2 132.6 62,676 26.8
Some of the noteworthy features are:
For FY18, budget allocation was raised by 21.2 percent over the FY17 revised estimates and 8.4 percent
over the original budget;
Up to November 2017, apart from interest payment spending in Industries and Economic Servies (IES),
Education, Defence, Health, Public Order and Safety (POS) were on the higher side. Lower utilization rate
in some sectors like General Public Services (GPS), Social Security and Welfare (SSW), Transportation,
Agriculture, Fuel and Energy (F&E), Housing, and Local government & Rural Development (LGRD)
contributed to a less-than-average performance in total non-development spending;
As a whole, non-development spending up to November 2017 amounts to 26.8 percent of the total non-
development budget.
1 This report is based on data generated in the CGA System and the analysis is based on gross basis.
2Notes: GPS = General Public Services, LGRD = LGD, RD & Cooperatives, CHTs, POS = Public Order and Safety, Edu = Education and Technology, Hlth = Health, SSW =
Social Security and Welfare, RCRA = Recreation, Culture and Religious Affairs, Agri = Agriculture, Fisheries and Livestock, Land, Water Resources and Food, F&E = Fuel
and Energy, IES = Industries, Jute, Textiles, Commerce, Labor & Overseas, Trans = Transport and Communication
Page | 2
1.1.2 Broad Sector-wise Allocation
Allocations for non-development expenditure against different ministries/divisions are also classified under six
broad categories, namely, administration, social infrastructure, physical infrastructure, agriculture, interest
payment and others. The following table contains broad sector-wise information:
Table 2:Broad Sectorwise Allocation
Sector Share
Broad Sectors
Administration Social
Infrastructure
Physical
Infrastructure Agriculture
Interest
Payment Others
Sector Share in Actual
expenditure FY17
31.9 38.4 3.3 6.4 18.2 1.8
Sector Share in Budget
FY18
40.6 30.5 3.3 6.6 17.7 1.3
Sector share in Actual
expenditure FY18
(Up to November)
35.1 32.8 2.0 4.4 24.1 1.6
Note: 1. Administration includes General Public Services, Defense, and Public Order & Safety
2. Social Infrastructure covers Education, Health, Housing, Social Security & Welfare, Local Government Division and
Development& Cooperative
3. Physical Infrastructure covers Fuel & energy and Transport & Communication
4. Agriculture implies Agriculture, Fisheries & Livestock, Land, Water Resources and Food
5. Others includes Recreation, Culture and Religious Affairs, Industries, Jute & Textile, Commerce, Labour& Overseas
Employment
Broadly in the budget for FY18, share of physical infrastructure remains the same, shares of
administration and agriculture sectors have been increased, whereas allocations against all other
categories are reduced in comparison to the actual expenditure of FY17;
Till November 2017, among all categories expenditure on administration sector was the highest.
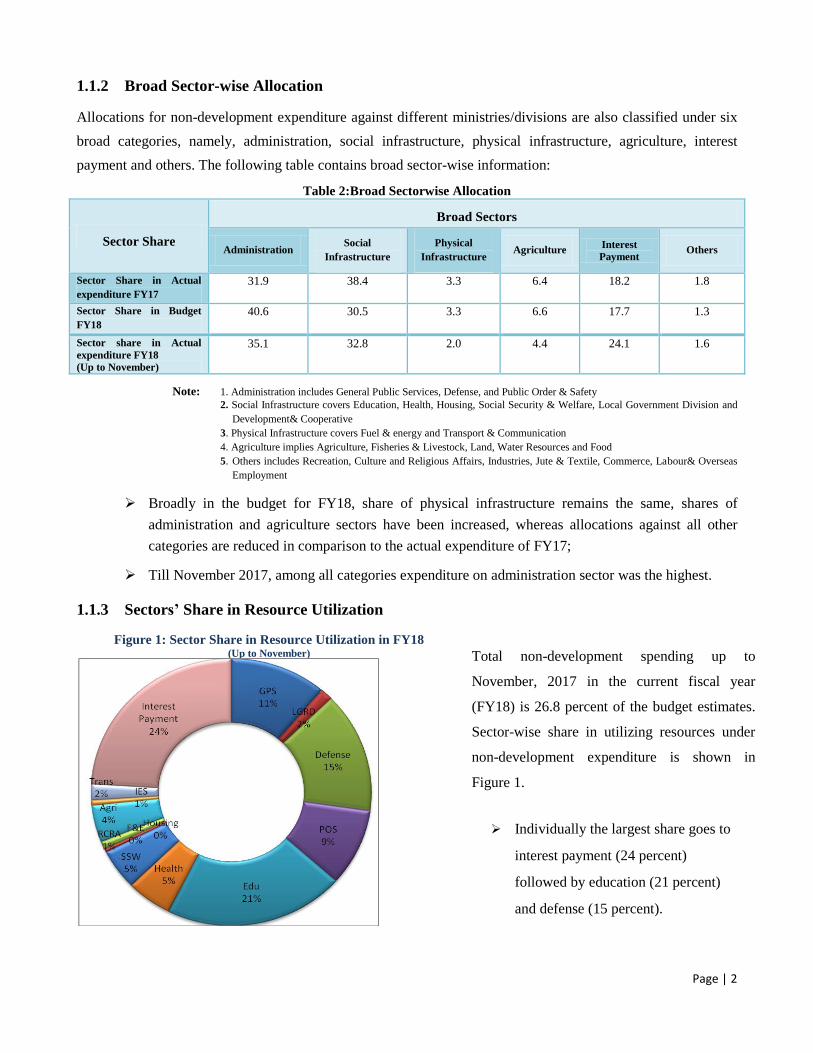
1.1.3 Sectors’ Share in Resource Utilization
Total non-development spending up to
November, 2017 in the current fiscal year
(FY18) is 26.8 percent of the budget estimates.
Sector-wise share in utilizing resources under
non-development expenditure is shown in
Figure 1.
Individually the largest share goes to
interest payment (24 percent)
followed by education (21 percent)
and defense (15 percent).
Figure 1: Sector Share in Resource Utilization in FY18 (Up to November)
Page | 3
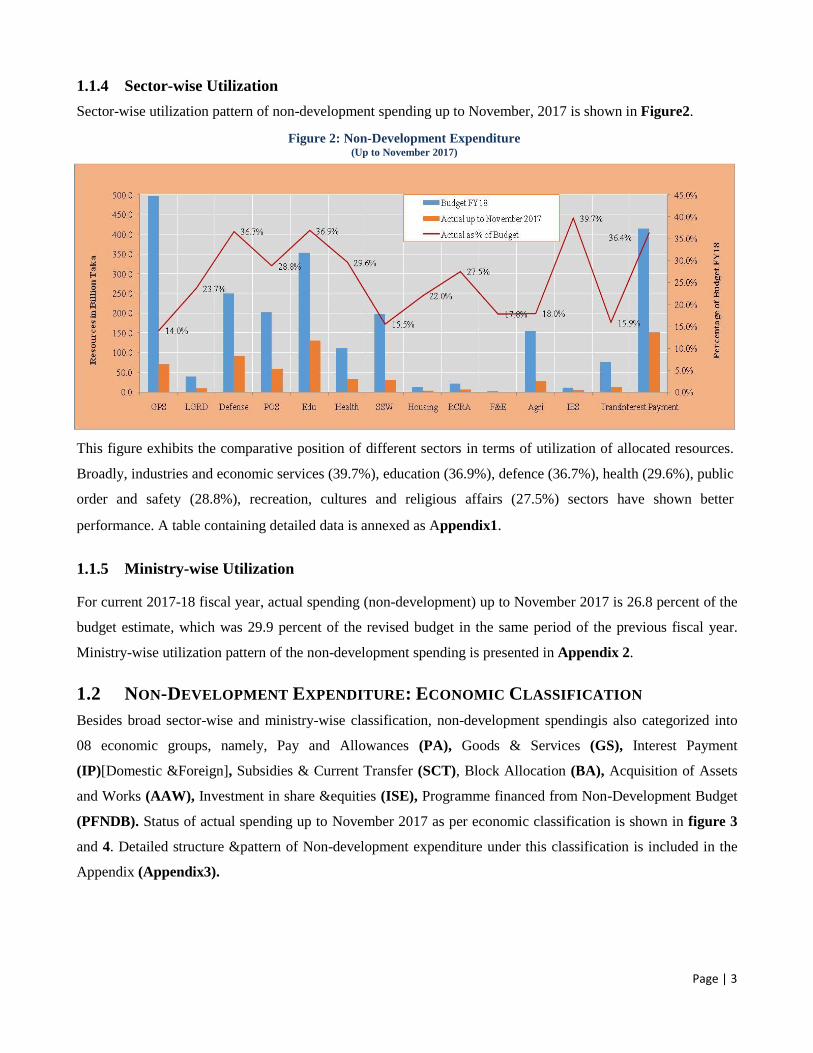
1.1.4 Sector-wise Utilization
Sector-wise utilization pattern of non-development spending up to November, 2017 is shown in Figure2.
This figure exhibits the comparative position of different sectors in terms of utilization of allocated resources.
Broadly, industries and economic services (39.7%), education (36.9%), defence (36.7%), health (29.6%), public
order and safety (28.8%), recreation, cultures and religious affairs (27.5%) sectors have shown better
performance. A table containing detailed data is annexed as Appendix1.
1.1.5 Ministry-wise Utilization
For current 2017-18 fiscal year, actual spending (non-development) up to November 2017 is 26.8 percent of the
budget estimate, which was 29.9 percent of the revised budget in the same period of the previous fiscal year.
Ministry-wise utilization pattern of the non-development spending is presented in Appendix 2.
1.2 NON-DEVELOPMENT EXPENDITURE: ECONOMIC CLASSIFICATION
Besides broad sector-wise and ministry-wise classification, non-development spendingis also categorized into
08 economic groups, namely, Pay and Allowances (PA), Goods & Services (GS), Interest Payment
(IP)[Domestic &Foreign], Subsidies & Current Transfer (SCT), Block Allocation (BA), Acquisition of Assets
and Works (AAW), Investment in share &equities (ISE), Programme financed from Non-Development Budget
(PFNDB). Status of actual spending up to November 2017 as per economic classification is shown in figure 3
and 4. Detailed structure &pattern of Non-development expenditure under this classification is included in the
Appendix (Appendix3).
Figure 2: Non-Development Expenditure (Up to November 2017)
Page | 4
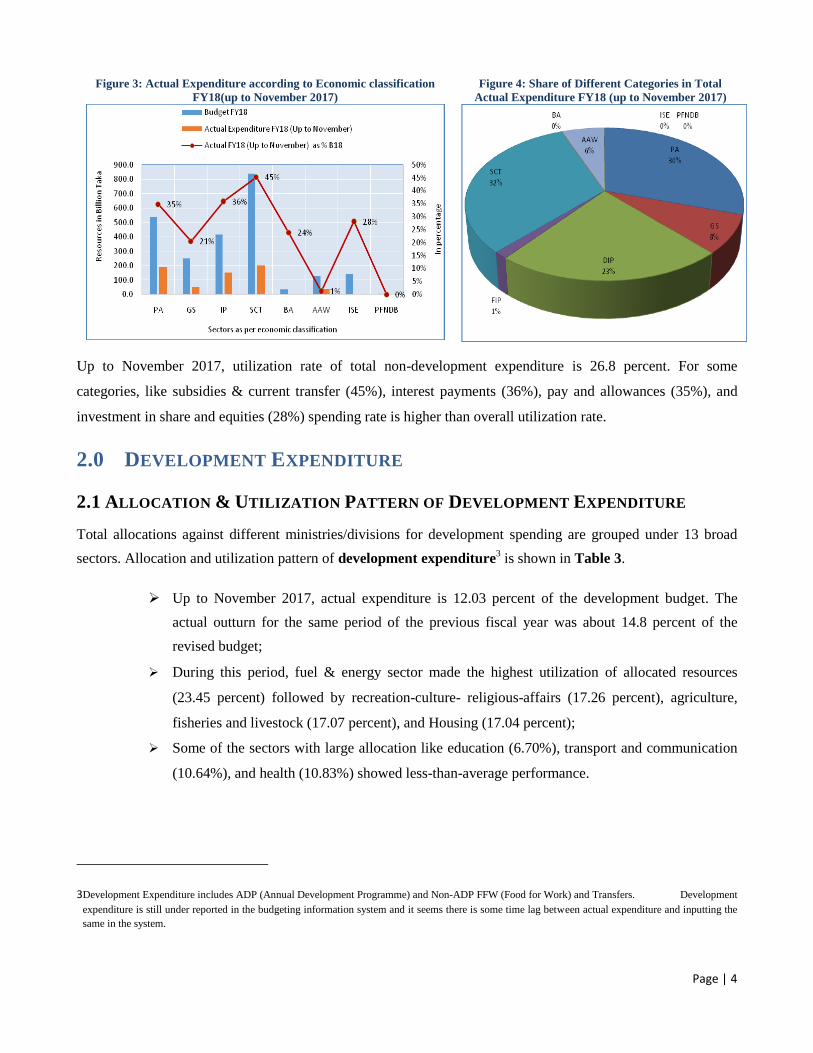
Figure 3: Actual Expenditure according to Economic classification
FY18(up to November 2017)
Figure 4: Share of Different Categories in Total
Actual Expenditure FY18 (up to November 2017)
Up to November 2017, utilization rate of total non-development expenditure is 26.8 percent. For some
categories, like subsidies & current transfer (45%), interest payments (36%), pay and allowances (35%), and
investment in share and equities (28%) spending rate is higher than overall utilization rate.
2.0 DEVELOPMENT EXPENDITURE
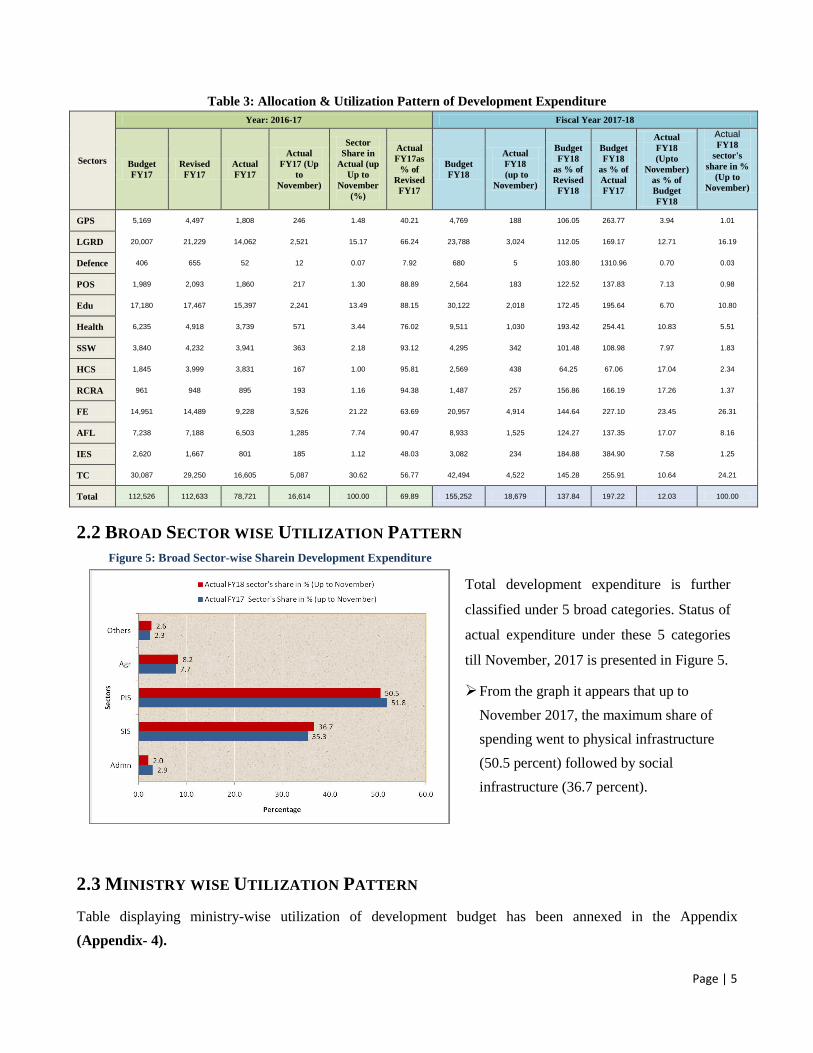
2.1 ALLOCATION & UTILIZATION PATTERN OF DEVELOPMENT EXPENDITURE
Total allocations against different ministries/divisions for development spending are grouped under 13 broad
sectors. Allocation and utilization pattern of development expenditure3 is shown in Table 3.
Up to November 2017, actual expenditure is 12.03 percent of the development budget. The
actual outturn for the same period of the previous fiscal year was about 14.8 percent of the
revised budget;
During this period, fuel & energy sector made the highest utilization of allocated resources
(23.45 percent) followed by recreation-culture- religious-affairs (17.26 percent), agriculture,
fisheries and livestock (17.07 percent), and Housing (17.04 percent);
Some of the sectors with large allocation like education (6.70%), transport and communication
(10.64%), and health (10.83%) showed less-than-average performance.
3Development Expenditure includes ADP (Annual Development Programme) and Non-ADP FFW (Food for Work) and Transfers. Development
expenditure is still under reported in the budgeting information system and it seems there is some time lag between actual expenditure and inputting the
same in the system.
Page | 5
Table 3: Allocation & Utilization Pattern of Development Expenditure
Sectors
Year: 2016-17 Fiscal Year 2017-18
Budget
FY17
Revised
FY17
Actual
FY17
Actual
FY17 (Up
to
November)
Sector
Share in
Actual (up
Up to
November
(%)
Actual
FY17as
% of
Revised
FY17
Budget
FY18
Actual
FY18
(up to
November)
Budget
FY18
as % of
Revised
FY18
Budget
FY18
as % of
Actual
FY17
Actual
FY18
(Upto
November)
as % of
Budget
FY18
Actual FY18
sector's
share in %
(Up to
November)
GPS 5,169 4,497 1,808 246 1.48 40.21 4,769 188 106.05 263.77 3.94 1.01
LGRD 20,007 21,229 14,062 2,521 15.17 66.24 23,788 3,024 112.05 169.17 12.71 16.19
Defence 406 655 52 12 0.07 7.92 680 5 103.80 1310.96 0.70 0.03
POS 1,989 2,093 1,860 217 1.30 88.89 2,564 183 122.52 137.83 7.13 0.98
Edu 17,180 17,467 15,397 2,241 13.49 88.15 30,122 2,018 172.45 195.64 6.70 10.80
Health 6,235 4,918 3,739 571 3.44 76.02 9,511 1,030 193.42 254.41 10.83 5.51
SSW 3,840 4,232 3,941 363 2.18 93.12 4,295 342 101.48 108.98 7.97 1.83
HCS 1,845 3,999 3,831 167 1.00 95.81 2,569 438 64.25 67.06 17.04 2.34
RCRA 961 948 895 193 1.16 94.38 1,487 257 156.86 166.19 17.26 1.37
FE 14,951 14,489 9,228 3,526 21.22 63.69 20,957 4,914 144.64 227.10 23.45 26.31
AFL 7,238 7,188 6,503 1,285 7.74 90.47 8,933 1,525 124.27 137.35 17.07 8.16
IES 2,620 1,667 801 185 1.12 48.03 3,082 234 184.88 384.90 7.58 1.25
TC 30,087 29,250 16,605 5,087 30.62 56.77 42,494 4,522 145.28 255.91 10.64 24.21
Total 112,526 112,633 78,721 16,614 100.00 69.89 155,252 18,679 137.84 197.22 12.03 100.00
2.2 BROAD SECTOR WISE UTILIZATION PATTERN
Figure 5: Broad Sector-wise Sharein Development Expenditure
Total development expenditure is further
classified under 5 broad categories. Status of
actual expenditure under these 5 categories
till November, 2017 is presented in Figure 5.
From the graph it appears that up to
November 2017, the maximum share of
spending went to physical infrastructure
(50.5 percent) followed by social
infrastructure (36.7 percent).
2.3 MINISTRY WISE UTILIZATION PATTERN
Table displaying ministry-wise utilization of development budget has been annexed in the Appendix
(Appendix- 4).
Page | 6
3.0 REVENUE COLLECTION4
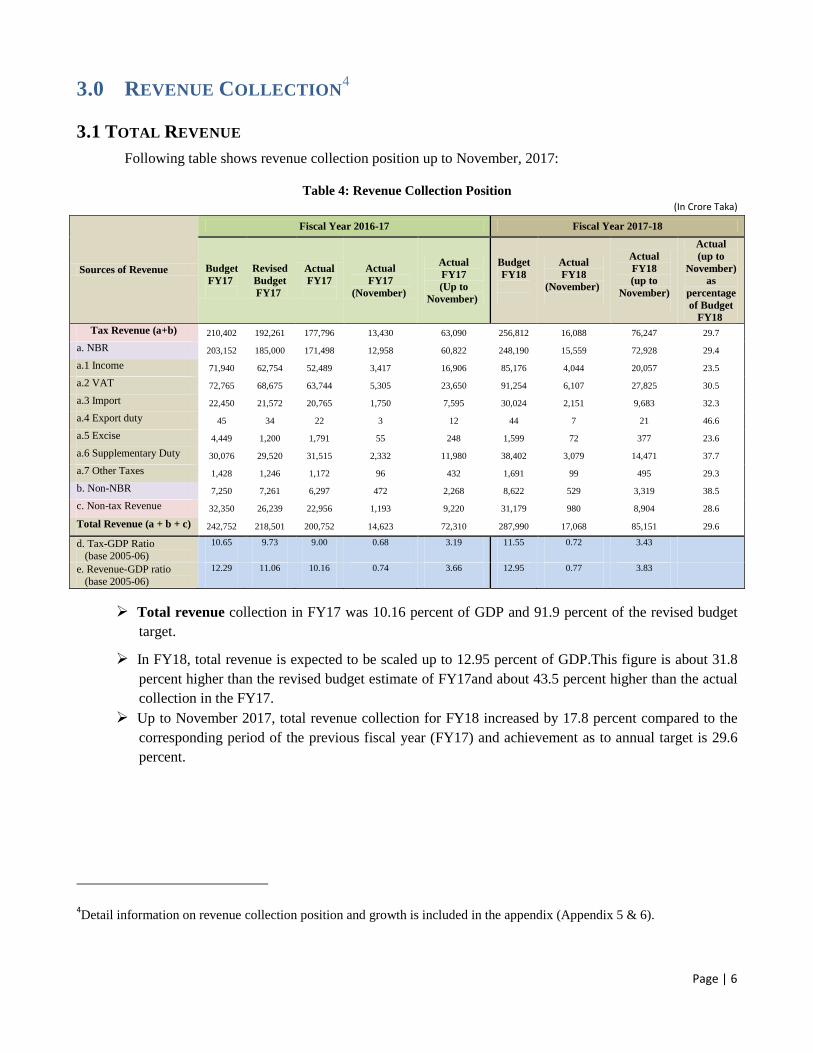
3.1 TOTAL REVENUE
Following table shows revenue collection position up to November, 2017:
Table 4: Revenue Collection Position
(In Crore Taka)
Sources of Revenue
Fiscal Year 2016-17 Fiscal Year 2017-18
Budget
FY17
Revised
Budget
FY17
Actual
FY17
Actual
FY17
(November)
Actual
FY17
(Up to
November)
Budget
FY18
Actual
FY18
(November)
Actual
FY18
(up to
November)
Actual
(up to
November)
as
percentage
of Budget
FY18
Tax Revenue (a+b) 210,402 192,261 177,796 13,430 63,090 256,812 16,088 76,247 29.7
a. NBR 203,152 185,000 171,498 12,958 60,822 248,190 15,559 72,928 29.4
a.1 Income 71,940 62,754 52,489 3,417 16,906 85,176 4,044 20,057 23.5
a.2 VAT 72,765 68,675 63,744 5,305 23,650 91,254 6,107 27,825 30.5
a.3 Import 22,450 21,572 20,765 1,750 7,595 30,024 2,151 9,683 32.3
a.4 Export duty 45 34 22 3 12 44 7 21 46.6
a.5 Excise 4,449 1,200 1,791 55 248 1,599 72 377 23.6
a.6 Supplementary Duty 30,076 29,520 31,515 2,332 11,980 38,402 3,079 14,471 37.7
a.7 Other Taxes 1,428 1,246 1,172 96 432 1,691 99 495 29.3
b. Non-NBR 7,250 7,261 6,297 472 2,268 8,622 529 3,319 38.5
c. Non-tax Revenue 32,350 26,239 22,956 1,193 9,220 31,179 980 8,904 28.6
Total Revenue (a + b + c) 242,752 218,501 200,752 14,623 72,310 287,990 17,068 85,151 29.6
d. Tax-GDP Ratio
(base 2005-06)
10.65 9.73 9.00 0.68 3.19 11.55 0.72 3.43
e. Revenue-GDP ratio
(base 2005-06)
12.29 11.06 10.16 0.74 3.66 12.95 0.77 3.83
Total revenue collection in FY17 was 10.16 percent of GDP and 91.9 percent of the revised budget
target.
In FY18, total revenue is expected to be scaled up to 12.95 percent of GDP.This figure is about 31.8
percent higher than the revised budget estimate of FY17and about 43.5 percent higher than the actual
collection in the FY17.
Up to November 2017, total revenue collection for FY18 increased by 17.8 percent compared to the
corresponding period of the previous fiscal year (FY17) and achievement as to annual target is 29.6
percent.
4Detail information on revenue collection position and growth is included in the appendix (Appendix 5 & 6).
Page | 7
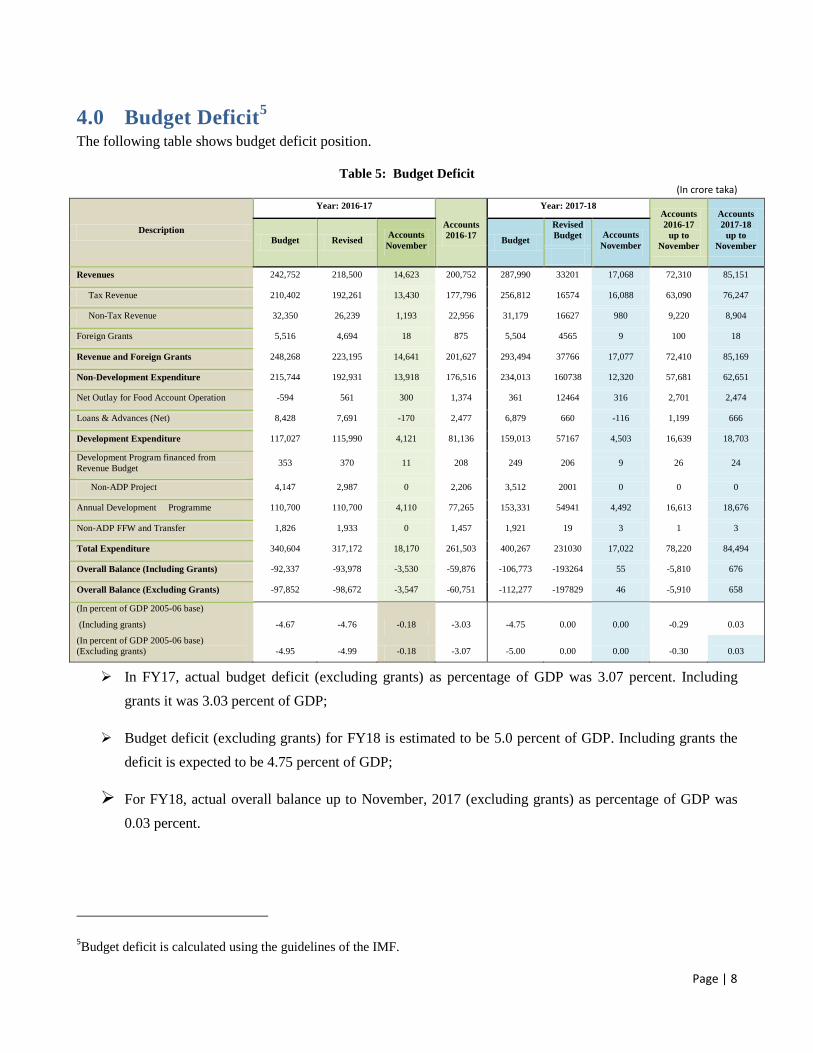
3.2 NBR TAX REVENUE
In FY17 actual tax revenue collection was 9.0 percent of GDP
Tax revenue collection target for FY18 is 11.6 percent of GDP. This is 33.6 percent higher than the
revised budget of FY17 and 44.4 percent higher than the actual collection of the FY17
In FY18 up to November 2017, major portion of the NBR tax comes from indirect taxes. Out of total
NBR tax 38.15 percent was collected from VAT, 27.50 percent from income tax, 19.84 percent from
supplementary duty, and 13.2 percent from import duty and the rest was collected from excise and
export duties and other taxes.
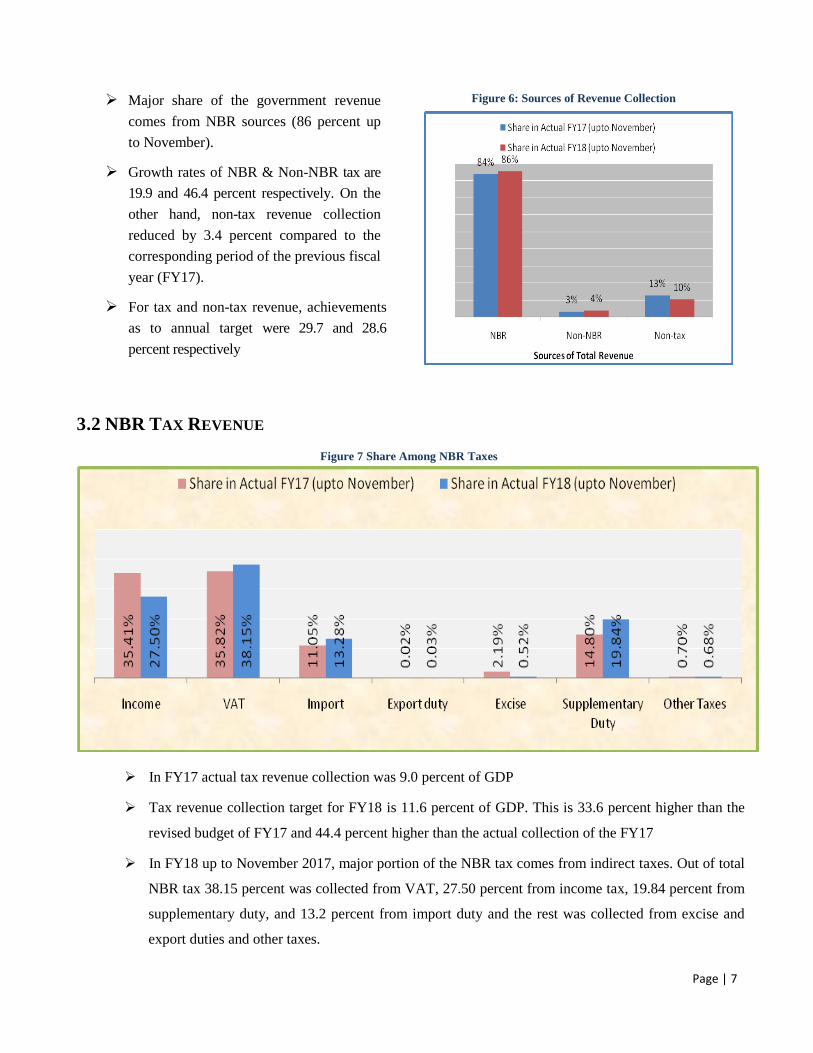
Major share of the government revenue
comes from NBR sources (86 percent up
to November).
Growth rates of NBR & Non-NBR tax are
19.9 and 46.4 percent respectively. On the
other hand, non-tax revenue collection
reduced by 3.4 percent compared to the
corresponding period of the previous fiscal
year (FY17).
For tax and non-tax revenue, achievements
as to annual target were 29.7 and 28.6
percent respectively
Figure 6: Sources of Revenue Collection
Figure 7 Share Among NBR Taxes
Page | 8
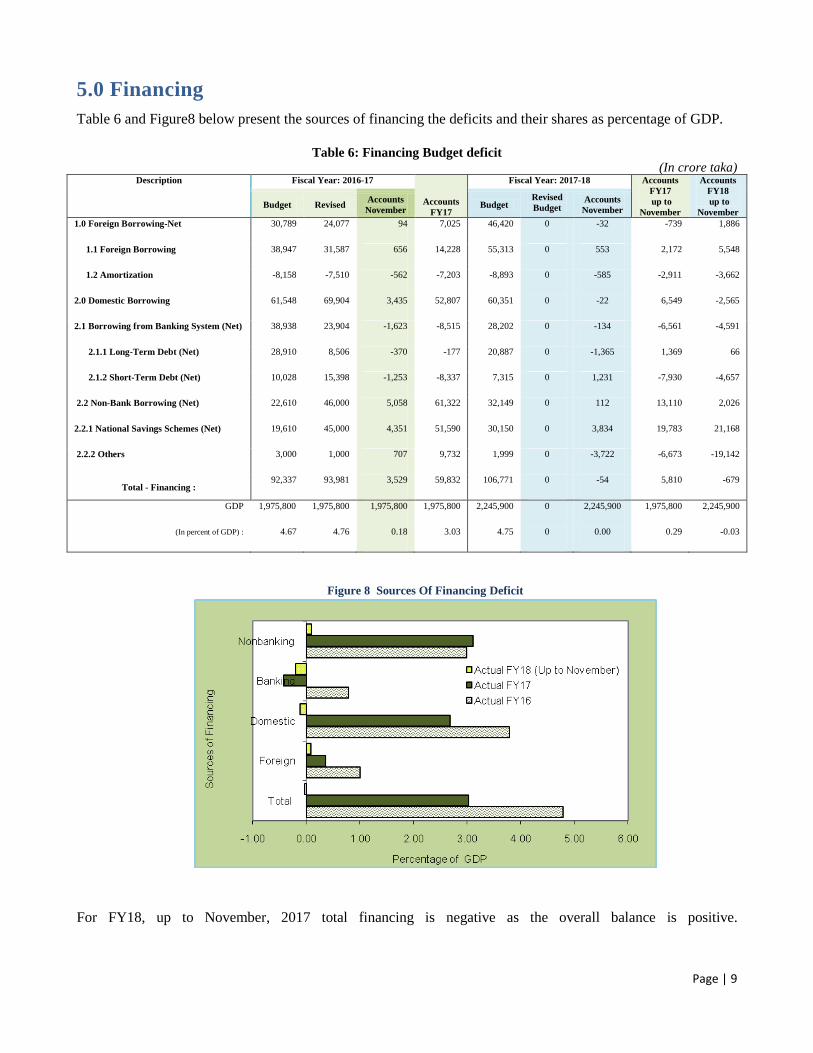
4.0 Budget Deficit5
The following table shows budget deficit position.
Table 5: Budget Deficit
(In crore taka)
Description
Year: 2016-17
Accounts
2016-17
Year: 2017-18 Accounts
2016-17
up to
November
Accounts
2017-18
up to
November Budget Revised
Accounts
November Budget
Revised
Budget Accounts
November
Revenues 242,752 218,500 14,623 200,752 287,990 33201 17,068 72,310 85,151
Tax Revenue 210,402 192,261 13,430 177,796 256,812 16574 16,088 63,090 76,247
Non-Tax Revenue 32,350 26,239 1,193 22,956 31,179 16627 980 9,220 8,904
Foreign Grants 5,516 4,694 18 875 5,504 4565 9 100 18
Revenue and Foreign Grants 248,268 223,195 14,641 201,627 293,494 37766 17,077 72,410 85,169
Non-Development Expenditure 215,744 192,931 13,918 176,516 234,013 160738 12,320 57,681 62,651
Net Outlay for Food Account Operation -594 561 300 1,374 361 12464 316 2,701 2,474
Loans & Advances (Net) 8,428 7,691 -170 2,477 6,879 660 -116 1,199 666
Development Expenditure 117,027 115,990 4,121 81,136 159,013 57167 4,503 16,639 18,703
Development Program financed from
Revenue Budget 353 370 11 208 249 206 9 26 24
Non-ADP Project 4,147 2,987 0 2,206 3,512 2001 0 0 0
Annual Development Programme 110,700 110,700 4,110 77,265 153,331 54941 4,492 16,613 18,676
Non-ADP FFW and Transfer 1,826 1,933 0 1,457 1,921 19 3 1 3
Total Expenditure 340,604 317,172 18,170 261,503 400,267 231030 17,022 78,220 84,494
Overall Balance (Including Grants) -92,337 -93,978 -3,530 -59,876 -106,773 -193264 55 -5,810 676
Overall Balance (Excluding Grants) -97,852 -98,672 -3,547 -60,751 -112,277 -197829 46 -5,910 658
(In percent of GDP 2005-06 base)
(Including grants) -4.67 -4.76 -0.18 -3.03 -4.75 0.00 0.00 -0.29 0.03
(In percent of GDP 2005-06 base)
(Excluding grants) -4.95 -4.99 -0.18 -3.07 -5.00 0.00 0.00 -0.30 0.03
In FY17, actual budget deficit (excluding grants) as percentage of GDP was 3.07 percent. Including
grants it was 3.03 percent of GDP;
Budget deficit (excluding grants) for FY18 is estimated to be 5.0 percent of GDP. Including grants the
deficit is expected to be 4.75 percent of GDP;
For FY18, actual overall balance up to November, 2017 (excluding grants) as percentage of GDP was
0.03 percent.
5Budget deficit is calculated using the guidelines of the IMF.
Page | 9
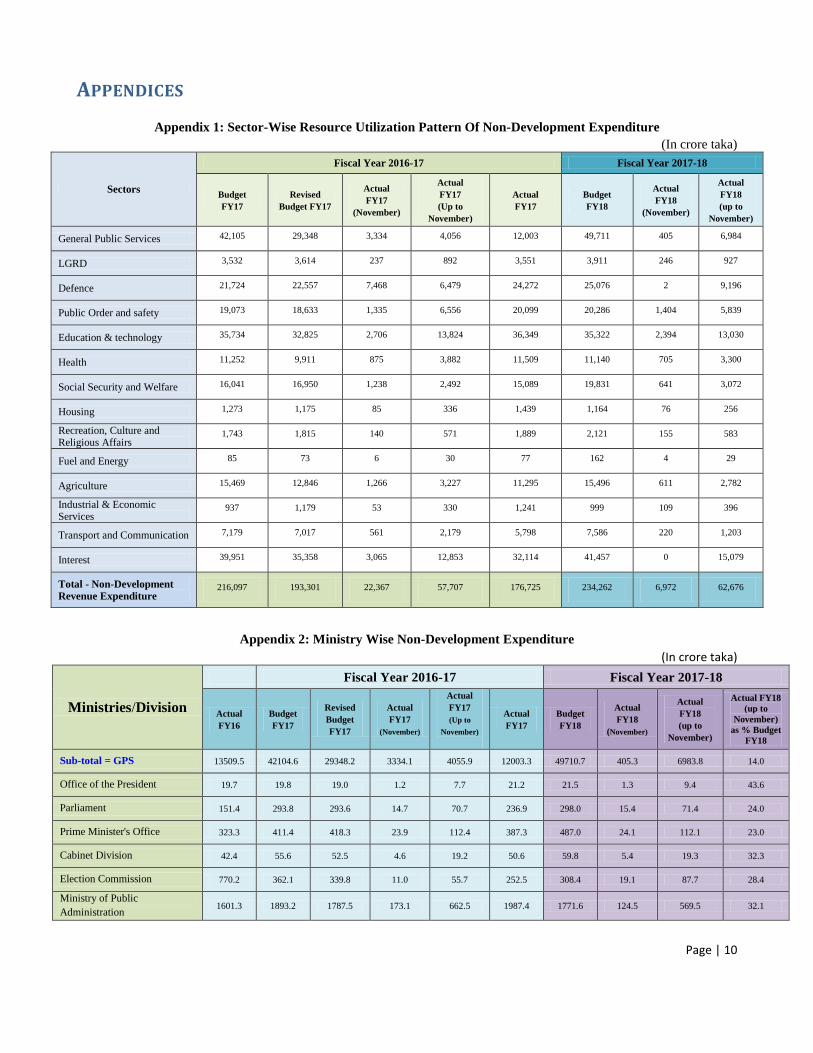
5.0 Financing
Table 6 and Figure8 below present the sources of financing the deficits and their shares as percentage of GDP.
Table 6: Financing Budget deficit
(In crore taka) Description Fiscal Year: 2016-17
Accounts
FY17
Fiscal Year: 2017-18 Accounts
FY17
up to
November
Accounts
FY18
up to
November Budget Revised
Accounts
November Budget
Revised
Budget Accounts
November
1.0 Foreign Borrowing-Net 30,789 24,077 94 7,025 46,420 0 -32 -739 1,886
1.1 Foreign Borrowing 38,947 31,587 656 14,228 55,313 0 553 2,172 5,548
1.2 Amortization -8,158 -7,510 -562 -7,203 -8,893 0 -585 -2,911 -3,662
2.0 Domestic Borrowing 61,548 69,904 3,435 52,807 60,351 0 -22 6,549 -2,565
2.1 Borrowing from Banking System (Net) 38,938 23,904 -1,623 -8,515 28,202 0 -134 -6,561 -4,591
2.1.1 Long-Term Debt (Net) 28,910 8,506 -370 -177 20,887 0 -1,365 1,369 66
2.1.2 Short-Term Debt (Net) 10,028 15,398 -1,253 -8,337 7,315 0 1,231 -7,930 -4,657
2.2 Non-Bank Borrowing (Net) 22,610 46,000 5,058 61,322 32,149 0 112 13,110 2,026
2.2.1 National Savings Schemes (Net) 19,610 45,000 4,351 51,590 30,150 0 3,834 19,783 21,168
2.2.2 Others 3,000 1,000 707 9,732 1,999 0 -3,722 -6,673 -19,142
Total - Financing : 92,337 93,981 3,529 59,832 106,771 0 -54 5,810 -679
GDP 1,975,800 1,975,800 1,975,800 1,975,800 2,245,900 0 2,245,900 1,975,800 2,245,900
(In percent of GDP) : 4.67 4.76 0.18 3.03 4.75 0 0.00 0.29 -0.03
For FY18, up to November, 2017 total financing is negative as the overall balance is positive.
Figure 8 Sources Of Financing Deficit
Page | 10
APPENDICES
Appendix 1: Sector-Wise Resource Utilization Pattern Of Non-Development Expenditure
(In crore taka)
Sectors
Fiscal Year 2016-17 Fiscal Year 2017-18
Budget
FY17
Revised
Budget FY17
Actual
FY17
(November)
Actual
FY17
(Up to
November)
Actual
FY17
Budget
FY18
Actual
FY18
(November)
Actual
FY18
(up to
November)
General Public Services 42,105 29,348 3,334 4,056 12,003 49,711 405 6,984
LGRD 3,532 3,614 237 892 3,551 3,911 246 927
Defence 21,724 22,557 7,468 6,479 24,272 25,076 2 9,196
Public Order and safety 19,073 18,633 1,335 6,556 20,099 20,286 1,404 5,839
Education & technology 35,734 32,825 2,706 13,824 36,349 35,322 2,394 13,030
Health 11,252 9,911 875 3,882 11,509 11,140 705 3,300
Social Security and Welfare 16,041 16,950 1,238 2,492 15,089 19,831 641 3,072
Housing 1,273 1,175 85 336 1,439 1,164 76 256
Recreation, Culture and Religious Affairs
1,743 1,815 140 571 1,889 2,121 155 583
Fuel and Energy 85 73 6 30 77 162 4 29
Agriculture 15,469 12,846 1,266 3,227 11,295 15,496 611 2,782
Industrial & Economic Services
937 1,179 53 330 1,241 999 109 396
Transport and Communication 7,179 7,017 561 2,179 5,798 7,586 220 1,203
Interest 39,951 35,358 3,065 12,853 32,114 41,457 0 15,079
Total - Non-Development
Revenue Expenditure 216,097 193,301 22,367 57,707 176,725 234,262 6,972 62,676
Appendix 2: Ministry Wise Non-Development Expenditure
(In crore taka)
Ministries/Division
Fiscal Year 2016-17 Fiscal Year 2017-18
Actual
FY16
Budget
FY17
Revised
Budget
FY17
Actual
FY17
(November)
Actual
FY17
(Up to
November)
Actual
FY17
Budget
FY18
Actual
FY18
(November)
Actual
FY18
(up to
November)
Actual FY18
(up to
November)
as % Budget
FY18
Sub-total = GPS 13509.5 42104.6 29348.2 3334.1 4055.9 12003.3 49710.7 405.3 6983.8 14.0
Office of the President 19.7 19.8 19.0 1.2 7.7 21.2 21.5 1.3 9.4 43.6
Parliament 151.4 293.8 293.6 14.7 70.7 236.9 298.0 15.4 71.4 24.0
Prime Minister's Office 323.3 411.4 418.3 23.9 112.4 387.3 487.0 24.1 112.1 23.0
Cabinet Division 42.4 55.6 52.5 4.6 19.2 50.6 59.8 5.4 19.3 32.3
Election Commission 770.2 362.1 339.8 11.0 55.7 252.5 308.4 19.1 87.7 28.4
Ministry of Public
Administration 1601.3 1893.2 1787.5 173.1 662.5 1987.4 1771.6 124.5 569.5 32.1
Page | 11
Ministries/Division
Fiscal Year 2016-17 Fiscal Year 2017-18
Actual
FY16
Budget
FY17
Revised
Budget
FY17
Actual
FY17
(November)
Actual
FY17
(Up to
November)
Actual
FY17
Budget
FY18
Actual
FY18
(November)
Actual
FY18
(up to
November)
Actual FY18
(up to
November)
as % Budget
FY18
Public Service Commission 40.7 47.3 43.6 3.2 16.0 45.6 46.5 3.6 18.4 39.7
Finance Division 7832.3 35512.6 23033.5 2927.2 2354.6 6270.0 43181.7 0.0 5427.6 12.6
Internal Resources Division 1425.9 1878.8 1682.4 99.3 393.2 1375.3 1865.5 94.1 363.4 19.5
Financial Institutions Division 128.3 161.2 158.2 2.7 27.4 156.9 111.2 0.5 25.2 22.7
Economic Relations Division 187.8 212.1 226.2 3.7 24.6 197.6 223.9 4.8 16.8 7.5
Planning Division/2 61.4 77.9 64.8 6.4 27.1 74.5 69.8 5.3 24.8 35.5
Implementation, Monitoring
and Evaluation Division 24.3 39.9 39.3 1.2 5.9 36.7 51.2 4.0 11.2 21.8
Statistics and Informatics
Division 210.7 198.2 156.2 17.4 86.9 237.9 165.2 11.8 56.3 34.1
Ministry of Foreign Affairs 689.8 940.9 1033.4 44.5 192.0 672.9 1049.3 91.4 170.7 16.3
Sub-total = LGRD 3147.1 3531.8 3613.7 236.5 891.8 3551.2 3911.5 246.1 926.6 23.7
Local Government Division 2444.6 2773.6 2842.6 199.7 655.9 3026.9 3140.8 219.4 688.4 21.9
Rural Development and Co-
operatives Division 434.1 463.4 470.5 32.2 224.8 479.8 469.8 21.4 224.6 47.8
Ministry of Chittagong Hill
Tracts Affairs 268.5 294.9 300.6 4.6 11.0 44.6 300.9 5.4 13.7 4.5
Sub-total = Defence 20031.7 21723.9 22557.4 7467.8 6478.8 24272.4 25075.7 1.7 9195.9 36.7
Ministry of Defence - Defence
Services 19646.6 21248.1 22133.5 7366.9 6317.7 23779.9 23610.8 0.0 9049.3 38.3
Ministry of Defence - Others
Services 359.9 446.7 392.9 98.9 153.0 462.5 1434.5 0.0 138.5 9.7
Armed Forces Division 25.1 29.1 31.0 2.0 8.0 30.1 30.4 1.7 8.1 26.8
Sub-total=POS 15156.2 19072.9 18632.7 1335.1 6556.5 20098.6 20286.4 1403.7 5838.5 28.8
Law and Justice Division 869.7 1042.9 914.7 75.2 437.7 1133.5 915.9 65.9 399.3 43.6
Supreme Court 136.5 154.9 167.8 15.7 75.1 190.8 164.7 12.7 57.9 35.2
Public Security Division 14058.5 17775.8 15888.6 1235.6 6004.6 18514.4 17230.6 1232.7 4967.0 28.8
Anti Corruption Commission 73.7 78.9 76.8 7.4 30.3 84.3 81.3 6.5 27.7 34.0
Legislative and Parliamentary
Affairs Division 17.8 20.5 23.2 1.2 8.8 22.2 21.8 1.2 8.9 40.7
Security Services Division 0.0 0.0 1561.6 0.0 0.0 153.4 1872.2 84.6 377.7 20.2
Sub-total = Edu 29432.7 35733.7 32825.0 2706.4 13823.7 36349.4 35322.0 2394.1 13029.8 36.9
Ministry of Primary and Mass
Education 11314.6 14451.9 11534.7 1156.8 5193.9 14726.9 13270.4 921.3 4316.6 32.5
Secondary and Higher
Education Division 17681.7 20680.6 16334.3 1508.8 8416.9 20253.2 16976.3 1076.0 6737.1 39.7
Ministry of Science and
Technology 347.5 372.3 396.5 34.1 177.2 397.4 435.9 45.1 194.3 44.6
Information and
Communication Technology
Division
88.9 229.0 224.4 6.7 35.8 195.2 208.9 5.9 41.1 19.7

Page | 12
Ministries/Division
Fiscal Year 2016-17 Fiscal Year 2017-18
Actual
FY16
Budget
FY17
Revised
Budget
FY17
Actual
FY17
(November)
Actual
FY17
(Up to
November)
Actual
FY17
Budget
FY18
Actual
FY18
(November)
Actual
FY18
(up to
November)
Actual FY18
(up to
November)
as % Budget
FY18
Technical and Madrasah
Education Division 0.0 0.0 4335.1 0.0 0.0 776.7 4430.5 345.9 1740.6 39.3
Sub-total = Health 9006.3 11252.4 9911.0 874.5 3882.4 11508.6 11140.2 705.0 3299.7 29.6
Health Services Division 9006.3 11252.4 9911.0 874.5 3882.4 11508.6 8340.3 533.9 3023.5 36.3
Medical Education and Family
Welfare Division 0.0 0.0 0.0 0.0 0.0 0.0 2799.9 171.0 276.2 9.9
Sub-total = SSW 12222.5 16041.5 16950.0 1237.6 2491.6 15089.2 19831.0 640.8 3072.3 15.5
Ministry of Social Welfare 3099.9 4104.2 4003.8 667.4 861.5 4122.1 4624.7 68.6 1160.8 25.1
Ministry of Women and
Children Affairs 1561.3 1982.3 2015.4 24.8 308.7 1986.1 2317.0 98.0 170.6 7.4
Ministry of Liberation Affairs 2116.4 2545.3 2747.9 492.7 1105.0 2656.8 3566.3 358.7 1469.9 41.2
Ministry of Food 999.1 2002.5 2702.9 16.7 71.9 2811.2 3456.6 1.7 12.8 0.4
Ministry of Disaster
Management and Relief 4445.7 5407.2 5480.1 36.0 144.5 3513.0 5866.4 113.8 258.2 4.4
Sub-total = HCS 1288.7 1273.0 1175.3 84.7 336.3 1438.6 1163.9 76.4 255.8 22.0
Ministry of Housing and Public
Works 1288.7 1273.0 1175.3 84.7 336.3 1438.6 1163.9 76.4 255.8 22.0
Sub-total = RCRA 1609.3 1742.5 1815.3 140.1 570.9 1889.2 2120.9 155.1 583.2 27.5
Ministry of Information 548.8 663.3 657.1 41.8 212.1 728.3 621.7 53.1 213.7 34.4
Ministry of Cultural Affairs 268.7 241.1 256.9 27.4 77.1 266.2 223.9 34.7 96.4 43.1
Ministry of Religious Affairs 215.9 203.7 211.6 19.9 72.5 202.8 216.0 21.9 104.4 48.4
Ministry of Youth and Sports 575.9 634.4 689.8 51.1 209.3 691.9 1059.3 45.3 168.6 15.9
Sub-total = FE 63.8 84.7 72.7 5.9 30.2 77.2 161.9 4.4 28.9 17.8
Energy and Mineral Resources
Division 47.7 62.1 43.5 4.3 21.3 52.0 112.9 3.5 17.1 15.1
Power Division 16.1 22.6 29.2 1.6 8.9 25.3 49.0 0.9 11.8 24.0
Sub-total = Agr 12251.4 15469.2 12845.8 1265.7 3227.1 11294.7 15496.4 611.0 2782.2 18.0
Ministry of Agriculture/3 9012.4 11834.5 8604.1 752.2 1798.3 6567.6 11800.0 226.6 1357.9 11.5
Ministry of Fisheries and
Livestock 881.1 991.4 840.1 77.4 385.0 1046.2 913.9 75.0 344.7 37.7
Ministry of Environment and
Forest 506.8 617.8 1494.0 78.6 226.1 1466.2 535.5 30.6 174.1 32.5
Ministry of Land 923.7 1071.6 941.4 91.6 417.8 1243.9 995.4 66.5 325.9 32.7
Ministry of Water Resources 927.5 953.9 966.2 266.0 399.9 970.9 1251.6 212.3 579.6 46.3
Sub-total = IES 771.8 937.0 1179.4 53.0 330.4 1240.7 998.6 109.1 396.5 39.7
Ministry of Industries 180.1 241.5 255.8 5.3 109.4 266.7 304.5 52.8 190.8 62.7
Ministry of Textiles and Jute 122.0 145.4 417.8 6.8 49.5 430.7 151.7 19.8 58.6 38.7
Ministry of Commerce 198.3 173.0 185.8 17.0 53.7 205.4 173.8 10.2 43.7 25.1
Ministry of Labour and 79.6 104.7 76.2 7.3 35.4 94.7 94.2 7.4 31.0 32.9
Page | 13
Ministries/Division
Fiscal Year 2016-17 Fiscal Year 2017-18
Actual
FY16
Budget
FY17
Revised
Budget
FY17
Actual
FY17
(November)
Actual
FY17
(Up to
November)
Actual
FY17
Budget
FY18
Actual
FY18
(November)
Actual
FY18
(up to
November)
Actual FY18
(up to
November)
as % Budget
FY18
Employment
Ministry of Expatriates'
Welfare and Overseas
Employment
191.8 272.5 243.8 16.5 82.4 243.0 274.5 19.0 72.4 26.4
Sub-total = TC 5667.8 7178.5 7017.1 560.6 2178.7 5798.1 7585.6 219.6 1203.3 15.9
Road Transport and Highways
Division 2392.7 2749.1 2674.1 186.9 752.7 2690.5 2876.2 131.5 555.9 19.3
Ministry of Railways 2066.2 2834.8 2704.1 197.3 818.1 1436.6 3011.7 0.6 86.3 2.9
Ministry of Shipping 411.0 524.2 522.3 102.6 220.1 521.7 546.9 3.0 139.2 25.5
Ministry of Civil Aviation and
Tourism 53.7 59.8 43.2 4.0 29.6 84.0 43.0 0.5 26.4 61.4
Posts and Telecommunications
Division 712.8 979.2 1042.0 69.8 350.1 1034.6 1081.4 79.9 391.2 36.2
Bridges Division 31.5 31.4 31.4 0.0 8.1 30.8 26.4 4.0 4.2 15.8
Sub-total = Interest 33090.8 39951.0 35357.6 3065.2 12852.8 32114.0 41457.0 0.0 15079.2 36.4
Domestic 31445.8 38240.0 33494.6 2944.4 12059.7 30273.2 39511.4 0.0 14198.7 35.9
Foreign 1644.9 1711.0 1863.0 120.8 793.1 1840.8 1945.6 0.0 880.5 45.3
Total Non-Development
Revenue Expenditure 157249.6 216096.7 193301.3 22367.2 57706.8 176725.3 234261.8 6972.2 62675.6 26.8
Appendix 3: Non-Development Expenditure by Economic Classification
(In Crore Taka)
Description Budget
FY17
Revised
Budget
FY17
Actual
FY17
Actual
FY17
(Up to
November)
Budget
FY18
Actual
FY18
(Up to
November)
Actual
FY17
(Up to
November)
as % of
Budget
FY17
Actual FY18 (upto
November) as % of
Budget FY18
Pay and Allowances 50,774.9 49,746.4 48,726.4 18,112.5 53,833.4 18,759.7 35.67 34.85
Pay of Officers 6,547.6 6,706.5 6,581.2 2,686.4 7,360.9 2,816.8 41.0 38.3
Pay of Establishment 21,262.5 20,047.2 20,283.7 7,181.9 21,754.3 7,027.0 33.8 32.3
Allowances 22,964.8 22,992.7 21,861.5 8,244.2 24,718.2 8,916.0 35.9 36.1
Goods and Services 20,647.8 23,003.9 21,570.2 4,789.5 24,725.8 5,081.5 23.20 20.55
Supplies and Services 15,283.2 17,250.6 15,594.3 3,945.8 18,356.6 4,434.7 25.8 24.2
Repairs, Maintenance &
Rehabilitation 5,364.6 5,753.2 5,975.9 843.7 6,369.2 646.8 15.7 10.2
Interest Payments 39,951.0 35,357.6 32,114.0 12,852.8 41,457.0 15,079.2 32.17 36.37
Domestic 38,240.0 33,494.6 30,273.2 12,059.7 39,511.4 14,198.7 31.5 35.9
Foreign 1,711.0 1,863.0 1,840.8 793.1 1,945.6 880.5 46.4 45.3
Subsidies and Current Transfers 75,306.0 69,763.2 58,702.2 19,635.2 83,794.8 20,048.0 26.07 23.93
Subsidies 17,729.0 15,329.6 9,074.6 2,591.6 19,454.4 1,216.8 14.6 6.3
Grants in Aid 40,585.0 41,688.3 34,942.2 11,512.7 41,321.6 12,940.8 28.4 31.3
Page | 14
Description Budget
FY17
Revised
Budget
FY17
Actual
FY17
Actual
FY17
(Up to
November)
Budget
FY18
Actual
FY18
(Up to
November)
Actual
FY17
(Up to
November)
as % of
Budget
FY17
Actual FY18 (upto
November) as % of
Budget FY18
Contributions to Intl
Organization 65.6 67.3 38.2 13.4 67.6 5.1 20.4 7.5
Write-off of loans & advances 4.0 4.0 0.3 0.0 4.0 0.0 0.6 0.9
Pensions and Gratuities’ 16,915.4 12,667.0 14,645.2 5,515.7 22,940.2 5,884.8 32.6 25.7
Others 7.0 7.0 1.8 1.7 7.0 0.6 24.9 8.4
Block Allocation 2,286.3 282.3 196.2 51.3 3,326.8 44.4 2.24 1.33
Unexpected 2,000.0 0.0 48.2 15.4 2,000.0 0.0 0.8 0.0
Others 286.3 282.3 148.0 35.8 1,326.8 44.4 12.5 3.3
Non-Development Revenue
Expenditure (A) 188,966.1 178,153.4 161,309.0 55,441.2 207,137.9 59,012.8 29.3 28.5
Acquisition of Assets and
Works (B) 9,831.6 11,731.6 13,470.2 2,239.6 12,905.6 3,638.4 22.78 28.19
Acquisition of Assets 7,191.8 7,992.7 9,939.4 1,956.6 9,542.1 3,261.4 27.2 34.2
Acquisition of Land Assets 636.9 808.0 575.3 128.3 798.3 167.3 20.1 21.0
Construction and Works 2,002.9 2,930.9 2,955.5 154.8 2,565.2 209.8 7.7 8.2
Investments in Shares and
Equities ( C) 16,945.9 3,046.0 1,736.4 0.0 13,969.5 0.0 0.00 0.00
Share Capital 13,120.9 521.0 151.6 0.0 10,144.5 0.0 0.0 0.0
Equity Investment 1,800.0 500.0 0.0 0.0 1,800.0 0.0 0.0 0.0
Investment for Recapitalization 2,000.0 2,000.0 1,584.9 0.0 2,000.0 0.0 0.0 0.0
Others 25.0 25.0 0.0 0.0 25.0 0.0 0.0 0.0
Transaction with IMF (D) 0.0 0.0 0.0 0.0 0.0 0.0 - -
Cash in Foreign Currency 0.0 0.0 0.0 0.0 0.0 0.0 - -
Programmes Financed from
Non-Development Budget (E) 353.1 370.3 207.9 25.8 248.8 24.4 7.30 9.79
Detail Estimates 216.5 276.0 200.4 25.1 121.1 24.4 11.6 20.1
Block Allocation 136.6 94.2 7.5 0.7 127.7 0.0 0.5 0.0
Total - Non-Development
Expenditure (A+B+C+D+E) : 216,096.7 193,301.3 176,723.6 57,706.6 234,261.8 62,675.6 26.7 26.8
Page | 15
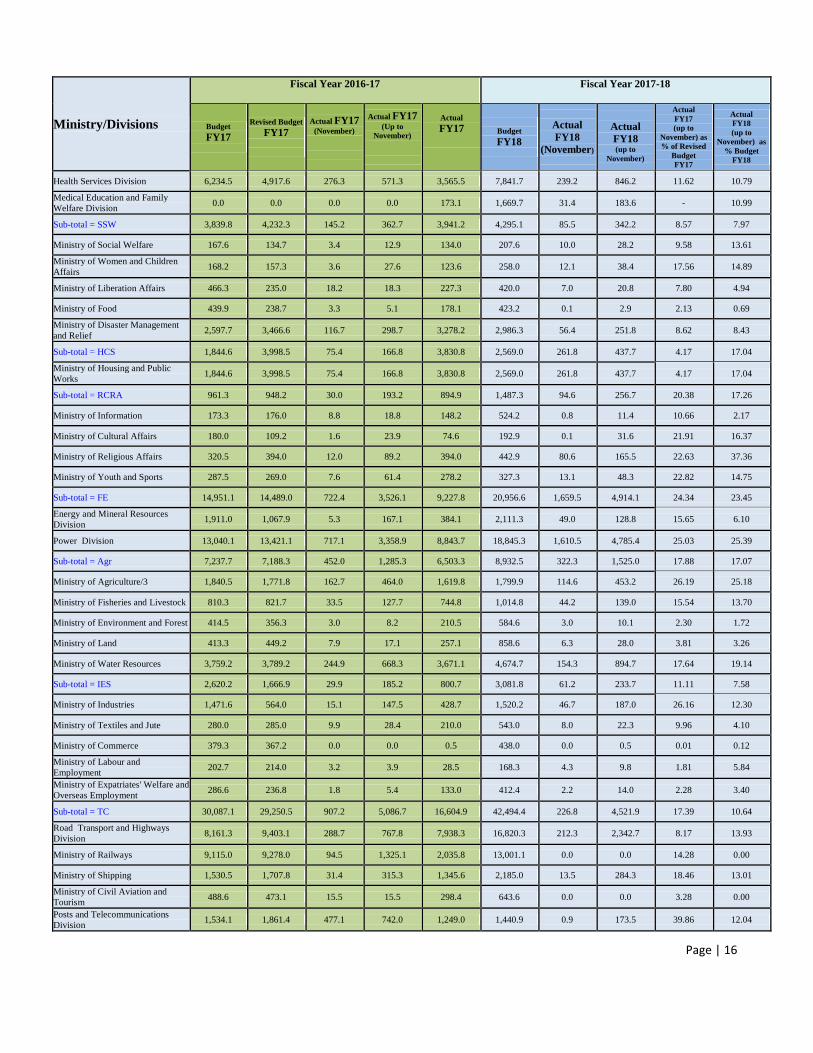
Appendix 4: Development expenditure: Ministry-wise expenditure pattern
(In crore Taka)
Ministry/Divisions
Fiscal Year 2016-17 Fiscal Year 2017-18
Budget
FY17
Revised Budget
FY17
Actual FY17
(November)
Actual FY17
(Up to
November)
Actual
FY17
Budget
FY18
Actual
FY18
(November)
Actual
FY18 (up to
November)
Actual
FY17
(up to
November) as
% of Revised
Budget
FY17
Actual
FY18
(up to
November) as
% Budget
FY18
Sub-total = GPS 5,169.1 4,497.1 95.4 245.8 1,808.1 4,769.2 30.3 188.1 5.47 3.94
Parliament 1.1 0.8 0.1 0.4 0.6 16.4 0.0 0.0 52.42 0.00
Prime Minister's Office 909.4 844.9 3.7 53.5 721.4 969.4 9.8 116.6 6.33 12.03
Cabinet Division 41.9 29.4 0.0 0.1 0.7 35.1 0.0 0.0 0.43 0.09
Election Commission 927.8 461.6 0.8 84.0 172.5 761.9 0.4 0.7 18.19 0.09
Ministry of Public Administration 126.8 114.3 1.8 11.8 104.1 225.0 2.2 9.1 10.29 4.07
Public Service Commission 0.0 5.0 0.0 0.0 4.6 27.5 0.0 0.0 0.00 0.00
Finance Division 634.5 322.6 83.7 41.1 202.0 436.4 0.0 10.9 12.75 2.50
Internal Resources Division (IRD) 422.5 404.2 0.4 34.5 135.9 340.1 2.9 4.1 8.54 1.21
Financial Institutions Division 170.1 95.7 0.0 0.7 80.2 117.0 0.0 0.2 0.68 0.19
Economic Relations Division 33.2 29.7 1.7 7.6 61.2 36.7 10.6 15.7 25.46 42.88
Planning Division/2 1,331.8 1,651.1 0.4 1.6 86.7 1,261.9 1.0 22.1 0.10 1.75
Implementation, Monitoring and
Evaluation Division 121.6 215.4 0.1 0.5 27.8 49.3 0.1 1.0 0.22 1.96
Statistics and Informatics Division 302.1 292.7 2.8 10.0 198.9 352.7 3.3 7.5 3.40 2.12
Ministry of Foreign Affairs 146.4 30.0 0.0 0.1 11.4 139.8 0.0 0.1 0.43 0.05
Sub-total = LGRD 20,006.6 21,229.3 810.1 2,520.9 14,061.5 23,788.2 892.1 3,024.1 11.87 12.71
Local Government Division 18,548.4 19,406.5 715.7 2,227.0 12,377.5 21,524.6 689.8 2,411.3 11.48 11.20
Rural Development and Co-
operatives Division 913.6 1,151.9 58.7 181.7 1,134.6 1,414.4 157.1 443.9 15.78 31.39
Ministry of Chittagong Hill Tracts
Affairs 544.7 670.9 35.7 112.1 549.5 849.3 45.2 168.8 16.71 19.87
Sub-total = Defence 405.8 655.0 19.7 12.2 51.9 679.9 0.0 4.8 1.86 0.70
Ministry of Defence - Defence
Services 405.8 655.0 19.7 12.2 51.9 679.9 0.0 4.8 1.86 0.70
Sub-total=POS 1,989.0 2,092.9 87.6 216.6 1,860.4 2,564.2 59.2 182.9 10.35 7.13
Law and Justice Division 474.5 508.4 12.7 39.7 362.3 504.5 17.7 48.8 7.80 9.68
Public Security Division 1,499.8 884.0 74.9 176.9 1,261.9 1,044.8 35.1 97.3 20.01 9.31
Anti Corruption Commission 12.0 9.6 0.0 0.0 6.1 20.4 0.0 0.0 0.00 0.15
Legislative and Parliamentary
Affairs Division 2.7 2.7 0.0 0.0 0.0 0.1 0.0 0.0 0.00 0.00
Security Services Division 0.0 688.2 0.0 0.0 230.1 994.4 6.4 36.8 0.00 3.70
Sub-total = Edu 17,179.8 17,467.2 537.5 2,240.9 15,396.9 30,122.2 523.4 2,017.8 12.83 6.70
Ministry of Primary and Mass
Education 7,709.8 6,262.5 268.2 911.6 5,538.2 8,751.9 290.4 644.8 14.56 7.37
Secondary and Higher Education
Division 6,166.7 5,373.2 235.7 672.5 4,864.7 6,164.7 108.4 384.8 12.52 6.24
Ministry of Science and Technology 1,697.3 3,817.1 23.2 623.5 3,668.1 10,602.1 27.1 580.7 16.34 5.48
Information and Communication
Technology Division 1,606.0 1,594.5 10.5 33.3 1,116.8 3,764.7 96.4 393.6 2.09 10.45
Technical and Madrasah Education
Division 0.0 419.8 0.0 0.0 209.0 838.9 1.1 13.9 0.00 1.66
Sub-total = Health 6,234.5 4,917.6 276.3 571.3 3,738.6 9,511.4 270.6 1,029.8 11.62 10.83
Page | 16
Ministry/Divisions
Fiscal Year 2016-17 Fiscal Year 2017-18
Budget
FY17
Revised Budget
FY17
Actual FY17
(November)
Actual FY17
(Up to
November)
Actual
FY17
Budget
FY18
Actual
FY18
(November)
Actual
FY18 (up to
November)
Actual
FY17
(up to
November) as
% of Revised
Budget
FY17
Actual
FY18
(up to
November) as
% Budget
FY18
Health Services Division 6,234.5 4,917.6 276.3 571.3 3,565.5 7,841.7 239.2 846.2 11.62 10.79
Medical Education and Family
Welfare Division 0.0 0.0 0.0 0.0 173.1 1,669.7 31.4 183.6 - 10.99
Sub-total = SSW 3,839.8 4,232.3 145.2 362.7 3,941.2 4,295.1 85.5 342.2 8.57 7.97
Ministry of Social Welfare 167.6 134.7 3.4 12.9 134.0 207.6 10.0 28.2 9.58 13.61
Ministry of Women and Children
Affairs 168.2 157.3 3.6 27.6 123.6 258.0 12.1 38.4 17.56 14.89
Ministry of Liberation Affairs 466.3 235.0 18.2 18.3 227.3 420.0 7.0 20.8 7.80 4.94
Ministry of Food 439.9 238.7 3.3 5.1 178.1 423.2 0.1 2.9 2.13 0.69
Ministry of Disaster Management
and Relief 2,597.7 3,466.6 116.7 298.7 3,278.2 2,986.3 56.4 251.8 8.62 8.43
Sub-total = HCS 1,844.6 3,998.5 75.4 166.8 3,830.8 2,569.0 261.8 437.7 4.17 17.04
Ministry of Housing and Public
Works 1,844.6 3,998.5 75.4 166.8 3,830.8 2,569.0 261.8 437.7 4.17 17.04
Sub-total = RCRA 961.3 948.2 30.0 193.2 894.9 1,487.3 94.6 256.7 20.38 17.26
Ministry of Information 173.3 176.0 8.8 18.8 148.2 524.2 0.8 11.4 10.66 2.17
Ministry of Cultural Affairs 180.0 109.2 1.6 23.9 74.6 192.9 0.1 31.6 21.91 16.37
Ministry of Religious Affairs 320.5 394.0 12.0 89.2 394.0 442.9 80.6 165.5 22.63 37.36
Ministry of Youth and Sports 287.5 269.0 7.6 61.4 278.2 327.3 13.1 48.3 22.82 14.75
Sub-total = FE 14,951.1 14,489.0 722.4 3,526.1 9,227.8 20,956.6 1,659.5 4,914.1 24.34 23.45
Energy and Mineral Resources
Division 1,911.0 1,067.9 5.3 167.1 384.1 2,111.3 49.0 128.8 15.65 6.10
Power Division 13,040.1 13,421.1 717.1 3,358.9 8,843.7 18,845.3 1,610.5 4,785.4 25.03 25.39
Sub-total = Agr 7,237.7 7,188.3 452.0 1,285.3 6,503.3 8,932.5 322.3 1,525.0 17.88 17.07
Ministry of Agriculture/3 1,840.5 1,771.8 162.7 464.0 1,619.8 1,799.9 114.6 453.2 26.19 25.18
Ministry of Fisheries and Livestock 810.3 821.7 33.5 127.7 744.8 1,014.8 44.2 139.0 15.54 13.70
Ministry of Environment and Forest 414.5 356.3 3.0 8.2 210.5 584.6 3.0 10.1 2.30 1.72
Ministry of Land 413.3 449.2 7.9 17.1 257.1 858.6 6.3 28.0 3.81 3.26
Ministry of Water Resources 3,759.2 3,789.2 244.9 668.3 3,671.1 4,674.7 154.3 894.7 17.64 19.14
Sub-total = IES 2,620.2 1,666.9 29.9 185.2 800.7 3,081.8 61.2 233.7 11.11 7.58
Ministry of Industries 1,471.6 564.0 15.1 147.5 428.7 1,520.2 46.7 187.0 26.16 12.30
Ministry of Textiles and Jute 280.0 285.0 9.9 28.4 210.0 543.0 8.0 22.3 9.96 4.10
Ministry of Commerce 379.3 367.2 0.0 0.0 0.5 438.0 0.0 0.5 0.01 0.12
Ministry of Labour and
Employment 202.7 214.0 3.2 3.9 28.5 168.3 4.3 9.8 1.81 5.84
Ministry of Expatriates' Welfare and
Overseas Employment 286.6 236.8 1.8 5.4 133.0 412.4 2.2 14.0 2.28 3.40
Sub-total = TC 30,087.1 29,250.5 907.2 5,086.7 16,604.9 42,494.4 226.8 4,521.9 17.39 10.64
Road Transport and Highways
Division 8,161.3 9,403.1 288.7 767.8 7,938.3 16,820.3 212.3 2,342.7 8.17 13.93
Ministry of Railways 9,115.0 9,278.0 94.5 1,325.1 2,035.8 13,001.1 0.0 0.0 14.28 0.00
Ministry of Shipping 1,530.5 1,707.8 31.4 315.3 1,345.6 2,185.0 13.5 284.3 18.46 13.01
Ministry of Civil Aviation and
Tourism 488.6 473.1 15.5 15.5 298.4 643.6 0.0 0.0 3.28 0.00
Posts and Telecommunications
Division 1,534.1 1,861.4 477.1 742.0 1,249.0 1,440.9 0.9 173.5 39.86 12.04
Page | 17
Ministry/Divisions
Fiscal Year 2016-17 Fiscal Year 2017-18
Budget
FY17
Revised Budget
FY17
Actual FY17
(November)
Actual FY17
(Up to
November)
Actual
FY17
Budget
FY18
Actual
FY18
(November)
Actual
FY18 (up to
November)
Actual
FY17
(up to
November) as
% of Revised
Budget
FY17
Actual
FY18
(up to
November) as
% Budget
FY18
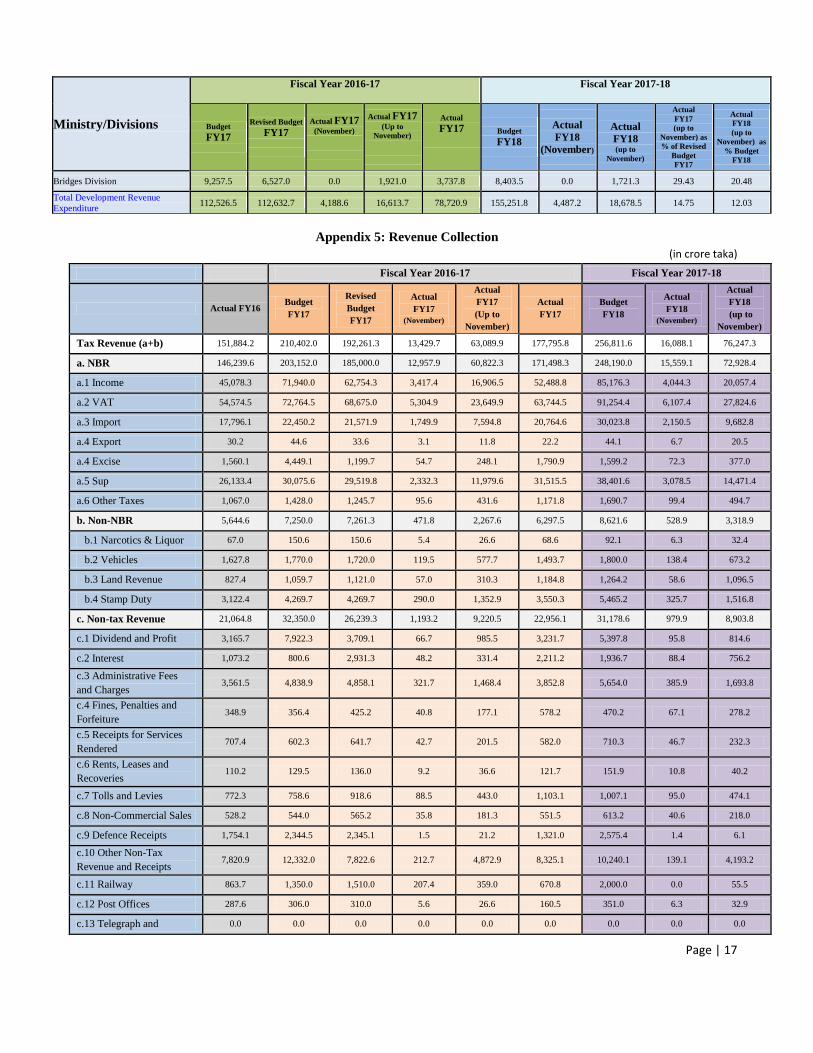
Bridges Division 9,257.5 6,527.0 0.0 1,921.0 3,737.8 8,403.5 0.0 1,721.3 29.43 20.48
Total Development Revenue
Expenditure 112,526.5 112,632.7 4,188.6 16,613.7 78,720.9 155,251.8 4,487.2 18,678.5 14.75 12.03
Appendix 5: Revenue Collection
(in crore taka)
Fiscal Year 2016-17 Fiscal Year 2017-18
Actual FY16 Budget
FY17
Revised
Budget
FY17
Actual
FY17
(November)
Actual
FY17
(Up to
November)
Actual
FY17
Budget
FY18
Actual
FY18
(November)
Actual
FY18
(up to
November)
Tax Revenue (a+b) 151,884.2 210,402.0 192,261.3 13,429.7 63,089.9 177,795.8 256,811.6 16,088.1 76,247.3
a. NBR 146,239.6 203,152.0 185,000.0 12,957.9 60,822.3 171,498.3 248,190.0 15,559.1 72,928.4
a.1 Income 45,078.3 71,940.0 62,754.3 3,417.4 16,906.5 52,488.8 85,176.3 4,044.3 20,057.4
a.2 VAT 54,574.5 72,764.5 68,675.0 5,304.9 23,649.9 63,744.5 91,254.4 6,107.4 27,824.6
a.3 Import 17,796.1 22,450.2 21,571.9 1,749.9 7,594.8 20,764.6 30,023.8 2,150.5 9,682.8
a.4 Export 30.2 44.6 33.6 3.1 11.8 22.2 44.1 6.7 20.5
a.4 Excise 1,560.1 4,449.1 1,199.7 54.7 248.1 1,790.9 1,599.2 72.3 377.0
a.5 Sup 26,133.4 30,075.6 29,519.8 2,332.3 11,979.6 31,515.5 38,401.6 3,078.5 14,471.4
a.6 Other Taxes 1,067.0 1,428.0 1,245.7 95.6 431.6 1,171.8 1,690.7 99.4 494.7
b. Non-NBR 5,644.6 7,250.0 7,261.3 471.8 2,267.6 6,297.5 8,621.6 528.9 3,318.9
b.1 Narcotics & Liquor 67.0 150.6 150.6 5.4 26.6 68.6 92.1 6.3 32.4
b.2 Vehicles 1,627.8 1,770.0 1,720.0 119.5 577.7 1,493.7 1,800.0 138.4 673.2
b.3 Land Revenue 827.4 1,059.7 1,121.0 57.0 310.3 1,184.8 1,264.2 58.6 1,096.5
b.4 Stamp Duty 3,122.4 4,269.7 4,269.7 290.0 1,352.9 3,550.3 5,465.2 325.7 1,516.8
c. Non-tax Revenue 21,064.8 32,350.0 26,239.3 1,193.2 9,220.5 22,956.1 31,178.6 979.9 8,903.8
c.1 Dividend and Profit 3,165.7 7,922.3 3,709.1 66.7 985.5 3,231.7 5,397.8 95.8 814.6
c.2 Interest 1,073.2 800.6 2,931.3 48.2 331.4 2,211.2 1,936.7 88.4 756.2
c.3 Administrative Fees
and Charges 3,561.5 4,838.9 4,858.1 321.7 1,468.4 3,852.8 5,654.0 385.9 1,693.8
c.4 Fines, Penalties and
Forfeiture 348.9 356.4 425.2 40.8 177.1 578.2 470.2 67.1 278.2
c.5 Receipts for Services
Rendered 707.4 602.3 641.7 42.7 201.5 582.0 710.3 46.7 232.3
c.6 Rents, Leases and
Recoveries 110.2 129.5 136.0 9.2 36.6 121.7 151.9 10.8 40.2
c.7 Tolls and Levies 772.3 758.6 918.6 88.5 443.0 1,103.1 1,007.1 95.0 474.1
c.8 Non-Commercial Sales 528.2 544.0 565.2 35.8 181.3 551.5 613.2 40.6 218.0
c.9 Defence Receipts 1,754.1 2,344.5 2,345.1 1.5 21.2 1,321.0 2,575.4 1.4 6.1
c.10 Other Non-Tax
Revenue and Receipts 7,820.9 12,332.0 7,822.6 212.7 4,872.9 8,325.1 10,240.1 139.1 4,193.2
c.11 Railway 863.7 1,350.0 1,510.0 207.4 359.0 670.8 2,000.0 0.0 55.5
c.12 Post Offices 287.6 306.0 310.0 5.6 26.6 160.5 351.0 6.3 32.9
c.13 Telegraph and 0.0 0.0 0.0 0.0 0.0 0.0 0.0 0.0 0.0
Page | 18
Fiscal Year 2016-17 Fiscal Year 2017-18
Actual FY16 Budget
FY17
Revised
Budget
FY17
Actual
FY17
(November)
Actual
FY17
(Up to
November)
Actual
FY17
Budget
FY18
Actual
FY18
(November)
Actual
FY18
(up to
November)
Telephone Board
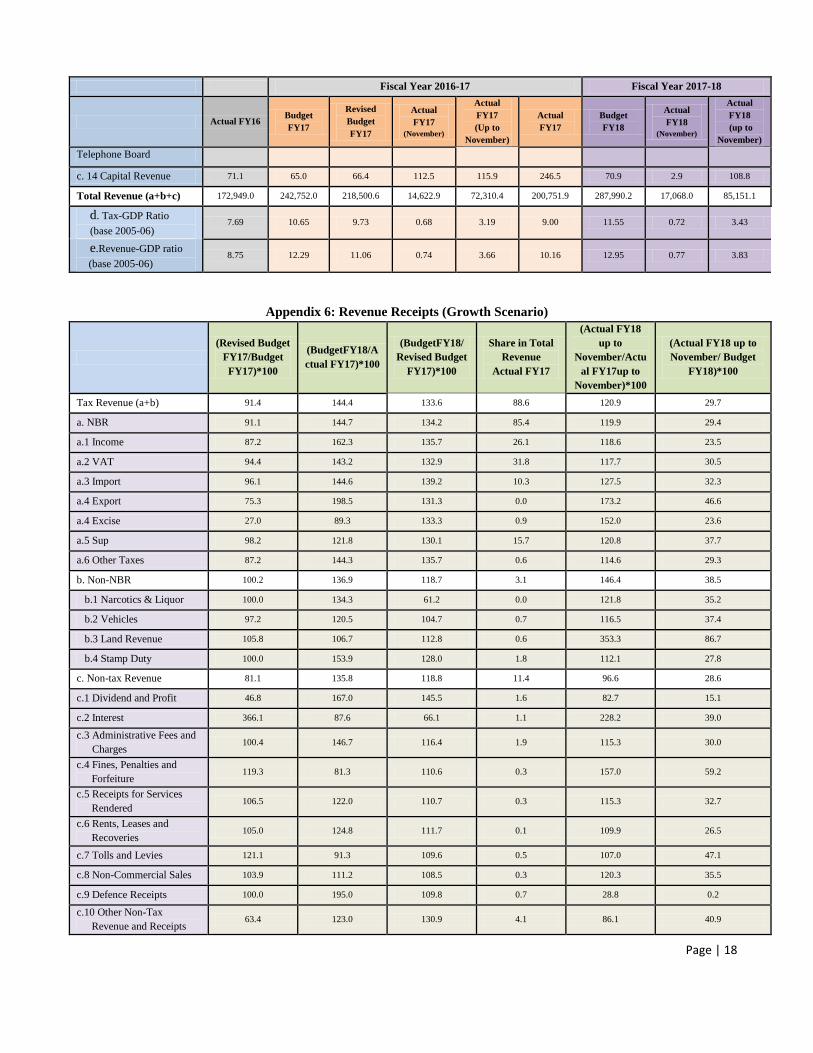
c. 14 Capital Revenue 71.1 65.0 66.4 112.5 115.9 246.5 70.9 2.9 108.8
Total Revenue (a+b+c) 172,949.0 242,752.0 218,500.6 14,622.9 72,310.4 200,751.9 287,990.2 17,068.0 85,151.1
d. Tax-GDP Ratio
(base 2005-06) 7.69 10.65 9.73 0.68 3.19 9.00 11.55 0.72 3.43
e.Revenue-GDP ratio
(base 2005-06) 8.75 12.29 11.06 0.74 3.66 10.16 12.95 0.77 3.83
Appendix 6: Revenue Receipts (Growth Scenario)
(Revised Budget
FY17/Budget
FY17)*100
(BudgetFY18/A
ctual FY17)*100
(BudgetFY18/
Revised Budget
FY17)*100
Share in Total
Revenue
Actual FY17
(Actual FY18
up to
November/Actu
al FY17up to
November)*100
(Actual FY18 up to
November/ Budget
FY18)*100
Tax Revenue (a+b) 91.4 144.4 133.6 88.6 120.9 29.7
a. NBR 91.1 144.7 134.2 85.4 119.9 29.4
a.1 Income 87.2 162.3 135.7 26.1 118.6 23.5
a.2 VAT 94.4 143.2 132.9 31.8 117.7 30.5
a.3 Import 96.1 144.6 139.2 10.3 127.5 32.3
a.4 Export 75.3 198.5 131.3 0.0 173.2 46.6
a.4 Excise 27.0 89.3 133.3 0.9 152.0 23.6
a.5 Sup 98.2 121.8 130.1 15.7 120.8 37.7
a.6 Other Taxes 87.2 144.3 135.7 0.6 114.6 29.3
b. Non-NBR 100.2 136.9 118.7 3.1 146.4 38.5
b.1 Narcotics & Liquor 100.0 134.3 61.2 0.0 121.8 35.2
b.2 Vehicles 97.2 120.5 104.7 0.7 116.5 37.4
b.3 Land Revenue 105.8 106.7 112.8 0.6 353.3 86.7
b.4 Stamp Duty 100.0 153.9 128.0 1.8 112.1 27.8
c. Non-tax Revenue 81.1 135.8 118.8 11.4 96.6 28.6
c.1 Dividend and Profit 46.8 167.0 145.5 1.6 82.7 15.1
c.2 Interest 366.1 87.6 66.1 1.1 228.2 39.0
c.3 Administrative Fees and
Charges 100.4 146.7 116.4 1.9 115.3 30.0
c.4 Fines, Penalties and
Forfeiture 119.3 81.3 110.6 0.3 157.0 59.2
c.5 Receipts for Services
Rendered 106.5 122.0 110.7 0.3 115.3 32.7
c.6 Rents, Leases and
Recoveries 105.0 124.8 111.7 0.1 109.9 26.5
c.7 Tolls and Levies 121.1 91.3 109.6 0.5 107.0 47.1
c.8 Non-Commercial Sales 103.9 111.2 108.5 0.3 120.3 35.5
c.9 Defence Receipts 100.0 195.0 109.8 0.7 28.8 0.2
c.10 Other Non-Tax
Revenue and Receipts 63.4 123.0 130.9 4.1 86.1 40.9
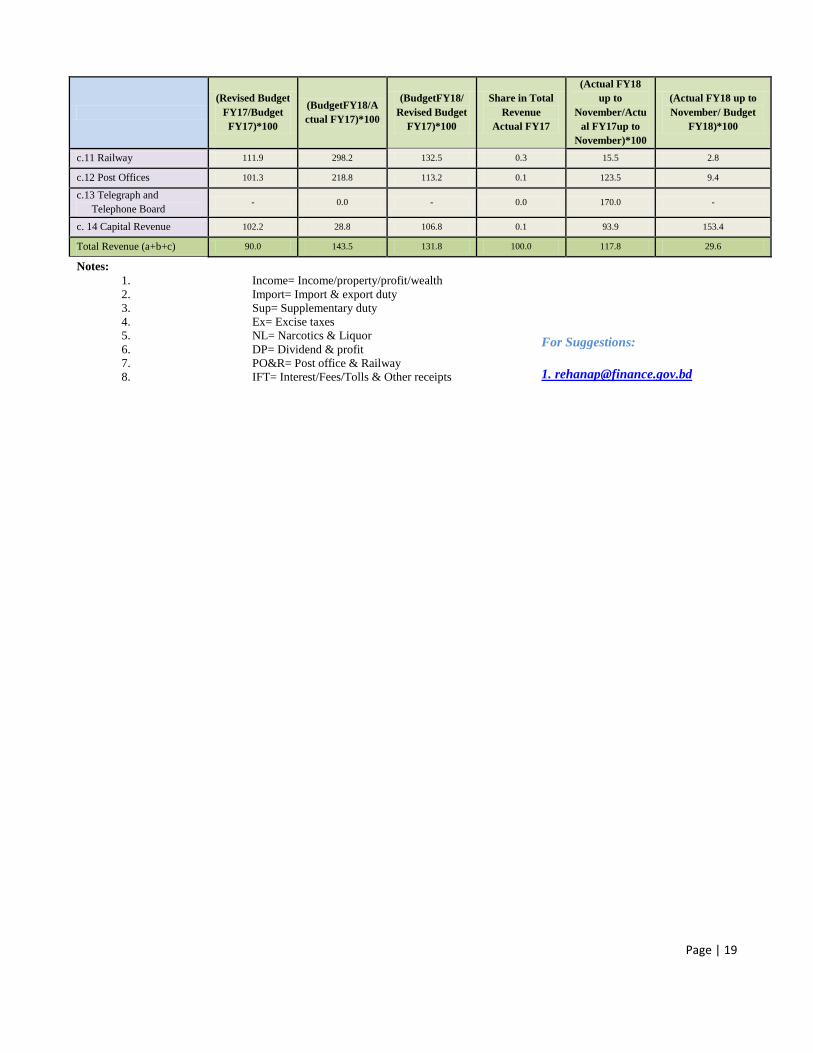
Page | 19
(Revised Budget
FY17/Budget
FY17)*100
(BudgetFY18/A
ctual FY17)*100
(BudgetFY18/
Revised Budget
FY17)*100
Share in Total
Revenue
Actual FY17
(Actual FY18
up to
November/Actu
al FY17up to
November)*100
(Actual FY18 up to
November/ Budget
FY18)*100
c.11 Railway 111.9 298.2 132.5 0.3 15.5 2.8
c.12 Post Offices 101.3 218.8 113.2 0.1 123.5 9.4
c.13 Telegraph and
Telephone Board - 0.0 - 0.0 170.0 -
c. 14 Capital Revenue 102.2 28.8 106.8 0.1 93.9 153.4
Total Revenue (a+b+c) 90.0 143.5 131.8 100.0 117.8 29.6
Notes:
1. Income= Income/property/profit/wealth
2. Import= Import & export duty
3. Sup= Supplementary duty
4. Ex= Excise taxes
5. NL= Narcotics & Liquor
6. DP= Dividend & profit
7. PO&R= Post office & Railway
8. IFT= Interest/Fees/Tolls & Other receipts
For Suggestions:
For Suggestions: