
App Epidemics: Modelling the Effects of Publicity in … · App Epidemics: Modelling the Effects of...
8
App Epidemics: Modelling the Effects of Publicity in a Mobile App Ecosystem Soo Ling Lim 1 and Peter J. Bentley 2 1 Department of Statistical Science 2 Department of Computer Science University College London, United Kingdom. [email protected] Abstract In mobile app ecosystems, an app can behave like a virus. Once downloaded, it may cause its user to recommend that app to friends who then may download the app and “infect” other friends. Epidemics occur when a small number of downloads causes a snowballing effect that results in a massive number of downloads (and consequently, a rich developer). This paper presents AppEco, the first Artificial Life model of mobile application ecosystems. AppEco models the app store, app developers, apps, users, and their behaviour. We use AppEco to simulate Apple’s iOS app ecosystem and investigate common publicity strategies adopted by developers and their effects on app downloads. Specifically, we investigate three causal factors for a widespread “app infection” from epidemiology: the users’ exposure to the app, the users’ susceptibility to the app, and the infectiousness of the app. Introduction In our technological world we frequently mirror the natural world, often without realising it. Today we have “mobile app ecosystems”, in which app developers build software apps and users consume the apps in an environment provided by an app store. Within the app ecosystem, developers may evolve their strategies, adapting to the requirements of users and producing new apps that fit into ever-changing niches. Apps may infect users like a virus – once downloaded, an app may cause its user to recommend that app to friends who then may download the app, and so on. Consequently, while epidemiologists develop new ways to prevent the spread of biological viruses, app developers are trying to find the most effective ways to spread their apps virally. In this study, we use knowledge from the field of epidemiology to investigate the effectiveness of common app publicity strategies. One approach to such a study might be to experiment with a real app store: flood the store with thousands of new apps, publicise them using different strategies, and analyse the results. However, some strategies, such as television broadcasting of the app to millions of users, are costly to implement in the real world. Other strategies, such as paying users to download an app in order to manipulate its ranking on the app store, are frowned upon 1 . Another approach might be to attempt to use machine learning 1 http://paidcontent.org/article/419-apple-promises-a-crack- down-on-those-who-manipulate-app-store-rankings/ to predict success or failure based on past data. However, data on publicity for specific apps and resulting downloads is not available, and because the app store comprises a non-static (constantly-growing) complex system, such predictions could never be made with any confidence. For these reasons, we use an Artificial Life (Alife) agent-based model as an experimental tool for this work. Alife methods have proven their worth with many previous simulations of ecosystems. In this paper, we present AppEco, an Alife model of mobile app ecosystems. AppEco models developers (agents that build apps) and users (agents that download apps). It simulates the app store environment, which hosts and organises apps, and enables users to browse and download apps. Significantly, AppEco also models apps (artefacts produced by the developers and downloaded by users) and their features. AppEco allows us to conduct experiments, test hypothesis about various processes in the ecosystem, and ask “what if” questions, all of which are difficult if not impossible to conduct in a real-world setting. We use AppEco to simulate Apple’s iOS app ecosystem and study common publicity strategies adopted by developers and their effects on app downloads. Specifically, we investigate three causal factors for a widespread “app infection” from epidemiology: the users’ exposure to the app, the users’ susceptibility to the app, and the infectiousness of the app. The rest of the paper is organised as follows. The following section describes existing work. The section after that describes AppEco. We then describe the application of AppEco to simulate the iOS app ecosystem, the experiments and results. The final section provides our conclusions. Background Epidemiology is the study of the distribution and determinants of diseases and other health-related events in specified populations, and the application of this study to the control of health problems (Dicker et al., 2006). Much epidemiologic research is devoted to searching for causal factors that influence one’s risk of disease so that appropriate public health action might be taken (Rothman et al., 2008). A simple model of disease causation for infectious disease is the epidemiologic triangle, which consists of an external agent, a susceptible host, and an environment that brings the host and agent together. Disease results from the interaction between the agent and the susceptible host in an environment that
Transcript of App Epidemics: Modelling the Effects of Publicity in … · App Epidemics: Modelling the Effects of...
App Epidemics: Modelling the Effects of Publicity in a Mobile App Ecosystem
Soo Ling Lim1 and Peter J. Bentley2
1Department of Statistical Science 2Department of Computer Science
University College London, United Kingdom. [email protected]
Abstract In mobile app ecosystems, an app can behave like a virus. Once downloaded, it may cause its user to recommend that app to friends who then may download the app and “infect” other friends. Epidemics occur when a small number of downloads causes a snowballing effect that results in a massive number of downloads (and consequently, a rich developer). This paper presents AppEco, the first Artificial Life model of mobile application ecosystems. AppEco models the app store, app developers, apps, users, and their behaviour. We use AppEco to simulate Apple’s iOS app ecosystem and investigate common publicity strategies adopted by developers and their effects on app downloads. Specifically, we investigate three causal factors for a widespread “app infection” from epidemiology: the users’ exposure to the app, the users’ susceptibility to the app, and the infectiousness of the app.
Introduction In our technological world we frequently mirror the natural world, often without realising it. Today we have “mobile app ecosystems”, in which app developers build software apps and users consume the apps in an environment provided by an app store. Within the app ecosystem, developers may evolve their strategies, adapting to the requirements of users and producing new apps that fit into ever-changing niches. Apps may infect users like a virus – once downloaded, an app may cause its user to recommend that app to friends who then may download the app, and so on. Consequently, while epidemiologists develop new ways to prevent the spread of biological viruses, app developers are trying to find the most effective ways to spread their apps virally.
In this study, we use knowledge from the field of epidemiology to investigate the effectiveness of common app publicity strategies. One approach to such a study might be to experiment with a real app store: flood the store with thousands of new apps, publicise them using different strategies, and analyse the results. However, some strategies, such as television broadcasting of the app to millions of users, are costly to implement in the real world. Other strategies, such as paying users to download an app in order to manipulate its ranking on the app store, are frowned upon1. Another approach might be to attempt to use machine learning 1 http://paidcontent.org/article/419-apple-promises-a-crack-down-on-those-who-manipulate-app-store-rankings/
to predict success or failure based on past data. However, data on publicity for specific apps and resulting downloads is not available, and because the app store comprises a non-static (constantly-growing) complex system, such predictions could never be made with any confidence. For these reasons, we use an Artificial Life (Alife) agent-based model as an experimental tool for this work. Alife methods have proven their worth with many previous simulations of ecosystems.
In this paper, we present AppEco, an Alife model of mobile app ecosystems. AppEco models developers (agents that build apps) and users (agents that download apps). It simulates the app store environment, which hosts and organises apps, and enables users to browse and download apps. Significantly, AppEco also models apps (artefacts produced by the developers and downloaded by users) and their features. AppEco allows us to conduct experiments, test hypothesis about various processes in the ecosystem, and ask “what if” questions, all of which are difficult if not impossible to conduct in a real-world setting. We use AppEco to simulate Apple’s iOS app ecosystem and study common publicity strategies adopted by developers and their effects on app downloads. Specifically, we investigate three causal factors for a widespread “app infection” from epidemiology: the users’ exposure to the app, the users’ susceptibility to the app, and the infectiousness of the app.
The rest of the paper is organised as follows. The following section describes existing work. The section after that describes AppEco. We then describe the application of AppEco to simulate the iOS app ecosystem, the experiments and results. The final section provides our conclusions.
Background Epidemiology is the study of the distribution and determinants of diseases and other health-related events in specified populations, and the application of this study to the control of health problems (Dicker et al., 2006). Much epidemiologic research is devoted to searching for causal factors that influence one’s risk of disease so that appropriate public health action might be taken (Rothman et al., 2008). A simple model of disease causation for infectious disease is the epidemiologic triangle, which consists of an external agent, a susceptible host, and an environment that brings the host and agent together. Disease results from the interaction between the agent and the susceptible host in an environment that
supports transmission of the agent from a source to that host (Dicker et al., 2006). An epidemic is the occurrence of more cases of disease than expected in a given area or a specific population during a particular period. Epidemics occur when an agent and susceptible hosts are present in adequate numbers, and the agent can be effectively conveyed from a source to the susceptible hosts. The chances of an epidemic increases when there is an increase to host susceptibility or an increase to host exposure (Dicker et al., 2006).
In the fields of Alife, Evolutionary Computing, and Agent-Based Simulation, researchers have modelled various aspects of ecosystems such as evolutionary dynamics within interacting populations. Classic works in this area include studies by Axelrod and Hamilton (1981) on the evolution of cooperation and Maynard Smith and Price (1973) on conflicts between animals of the same species. More recently, Holland (1992) created Echo, a generic ecosystem model in which evolving agents are situated in a resource-limited environment. Olague et al. (2006) developed the infection algorithm, a bio-inspired approach based on an artificial epidemic process, to address the stereo image matching problem. Dorin (2005) used knowledge from epidemiology to model the co-evolution of transmissible disease and a population of non-randomly mixed susceptible agents. Agar and Wilson (2002) used simulation to study illicit drug epidemics. App stores have large populations of apps, developers, and users, and can benefit from similar studies.
While the study of mobile app ecosystems is a current and significant topic for researchers, to date there has been little work focussing on app publicity (Jansen et al., 2009; Lin & Ye, 2009). However there is related work that contextualises and informs our study. For example, Garg and Telang (2011) developed algorithms to predict the current sales of an app based on its ranking on Apple’s iOS App Store Top Apps Chart. Such work may enable investors to estimate likely profits should an app reach a specific rank, however there is no certainty that a new app will appear on the chart. Bohmer et al. (2011) developed a mobile app to collect mobile app usage information from over 4,100 users of Android devices. They found that although users spend almost an hour a day using their phones, an average session with an app lasts less than a minute. They also found that news apps are most popular in the morning and games are at night, but communication apps dominate through most of the day. These studies are informative, but limited to studying what is already out there, and “what-if” questions cannot be answered.
AppEco In an app ecosystem, coevolving systems of apps, developers, and users form complex relationships, filling niches, competing and cooperating, similar to species in a biological ecosystem (Lin & Ye, 2009). The health of the app ecosystem is largely determined by the communities of developers that create innovative solutions that users want to buy (Cusumano, 2010; Jansen et al., 2009). In an app ecosystem, application software (such as games, medical applications, and productivity tools) that is built for a mobile platform is sold via an app store running on the platform. The app store concept has democratised the software industry – almost anyone can build and sell apps. Once built, an app quickly
becomes available to a worldwide market. Mobile device users can download the apps, use them immediately and provide feedback to the developers.
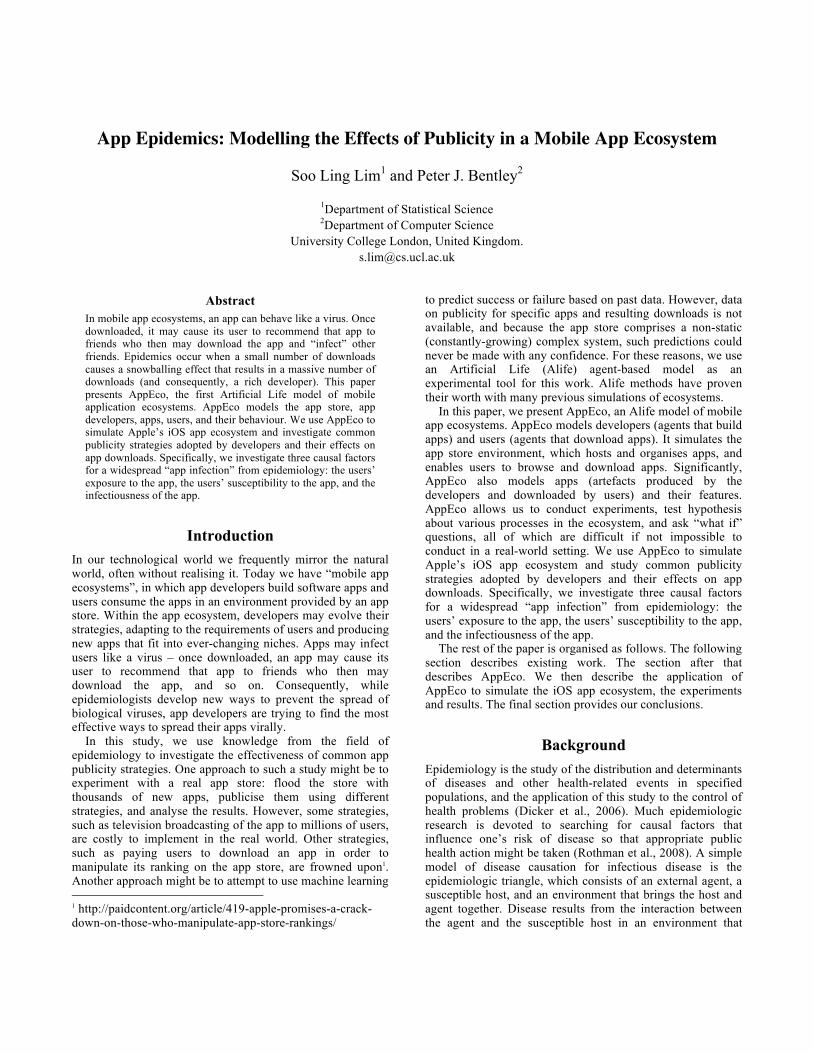
AppEco is an Artificial Life simulation of mobile app ecosystems. The model consists of agents that are abstractions of app users and developers, as well as artefacts that are abstractions of apps. Developer agents build and upload apps to the app store; user agents browse the store and download the apps, see Figure 1. Each download corresponds to a new sale. A distinguishing feature of the AppEco model compared to more traditional agent-based models is the explicit modelling of artefacts as well as the agents that produce and use the artefacts. Different from agents, artefacts are not autonomous, they represent passive entities of the system that are intentionally created and used by agents. App artefacts are important in a model of an app ecosystem because the agents interact with one another via the apps.
Figure 1. The interaction between developers, apps, and users in AppEco.
AppEco Components AppEco consists of app developers, apps, users, and the app store. Each component is described as follows. Developers. In AppEco, a developer agent represents a solo developer or a team of developers working together to produce an app. Each developer agent has a development duration (devDuration, a random value between [devmin, devmax]), which specifies the number of days it needs to build an app. Each developer also records the number of days it has already spent building the app (daysTaken). Each developer is initially active (it continuously builds and upload apps to the app store) but may become inactive (it stops building apps) with probability PInactive. This models part-time developers, hobbyists, and the tendency of developers to stop building apps2. Every developer records the number of apps it has developed and the number of downloads it has received. In this work every developer uses an evolutionary strategy of making a variation of its own best app (app with highest number of downloads) each time. This models the ability of developers to learn from downloads and improve on their best app. This strategy is commonly used by many developers who learn from their experience3. A famous example is Rovio, who 2 http://t-machine.org/index.php/2009/06/11/may-2009-survey-of-iphone-developers/ 3 Our previous work investigated developers with different development strategies (Lim & Bentley, 2012). For example, innovative developers build a different app each time;
developed many game apps before hitting the jackpot with Angry Birds. They then built on their success, releasing new apps such as Angry Birds Seasons, and Angry Birds Rio4. Apps. Each app artefact is built and uploaded by a developer agent. The features of the app are abstracted as a 10x10 feature grid (F) for each app. If a cell in F is filled, then the app offers that particular feature. A grid is used so that feature similarity can be represented in the future, e.g., features that are similar can be represented as cells that are near to one another on the grid. The cells in F are filled probabilistically if this is the developer’s first app. Otherwise, the developer fills F with copies of the features from his own best app (as determined by the highest daily average downloads) with random mutation. The choice of which app to copy occurs when the developer is starting to build the app. If no apps by this developer have downloads, the developer fills F with a copy of his most recent app. There is a 0.5 probability that mutation occurs during a copy. Mutation is implemented by randomly selecting a filled cell in F and randomly “moving” it to an empty cell in F.
For ranking purposes, each app keeps a record of the total number of downloads it has received to date and the number of downloads it has received on each of the previous seven days. Each app has a probability of PInfectious to be infectious. If the app is infectious, users who download the app recommend it to their friends. Apps can be infectious because they have exciting features (e.g., Angry Birds). Apps can also have infectious features. For example, WhatsApp Messenger5 (No. 1 in 99 countries) is a mobile messaging app that allows users to exchange messages without having to pay for SMS. The user needs his friends to download the app to receive his messages. His friends will, in turn, ask their friends to download the app. For simplicity, the AppEco model currently assumes that all apps are sold at the same price; the model of variations in app pricing and categories of apps is left for future work. Each app also records the time when it was uploaded.
Users. Inspired by the recommender systems literature (Adomavicius & Tuzhilin, 2005), each user agent has preferences (or taste information) that determine the app features that it prefers. Developers are unaware of the users’ preferences. The preferences of a user agent are abstracted as a 10x10 preference grid (P). The top right quadrant in P is always empty, to model features that are undesirable to all users. For example, no users want an app to have the features of a difficult-to-use or malicious program. The top left and bottom right quadrant in P are filled probabilistically, such that each cell in the grid has a probability PPref of being filled, to model features that are desirable to some users. The bottom left quadrant in P is filled probabilistically, such that each cell in the grid has a probability 2xPPref of being filled, to model copycats copy other developers’ apps. Here we use the evolutionary strategy alone to simplify analysis; the effects of publicity are not significantly altered by the use of different developer strategies. 4http://www.wired.co.uk/magazine/archive/2011/04/features/how-rovio-made-angry-birds-a-winner 5 http://www.whatsapp.com/
popular features desirable to many users. An example preference grid is illustrated in Figure 2 (right).
If a cell in P is filled, then the user agent desires the feature represented by that cell. If the feature grid F of an app has a cell in the same location filled, then it means the app offers a feature desired by the user agent (i.e. the user is susceptible to infection by that app). For example, in Figure 2, all four of the features offered by App 1 match the user agent’s preferences, but only two of the features offered by App 2 match the user agent’s preferences. Using the AppEco model, an app such as Angry Birds (to which many users are susceptible) can be abstracted as an app with F that matches P of many users, while an app to which few users are susceptible has F that matches few or no users’ P. For simplicity, preference matching is binary: filled cells either match or do not match. Finally, a user agent keeps a record of the apps it has downloaded, the number of days between each browse of the app store, and the number of days that have elapsed since it last browsed the app store.
App 1
User
App 2
4 out of 4 matches
2 out of 4
matches
The top right quadrant (in white) is always empty to model
features offered by apps that are undesirable to all users.
The bottom left quadrant (in green) is twice as likely to be
filled to model features that are desirable to many users.
Figure 2. Matching app features with user preferences.
Each user waits a number of days between browsing for new apps (daysBtwBrowse, a random value between [bromin, bromax]). They also record the number of days that has elapsed after their last browse (daysElapsed). When users are initialised at the start of the simulation, daysElapsed is set to be a random number between [0, daysBtwBrowse] so that users don’t all browse at the same time when they start. Users also record the number of friends they can influence and thus potentially “infect” (numFriends). The value of numFriends is a random number with a power law distribution in the range [0, 150]. (Many people will be able influence very few friends, but a few people can influence many friends.) The upper limit of this range is derived from the Dunbar number of 150 (Dunbar, 1992). Dunbar (1992) showed that the human brain is only capable of managing relationships with about 150 people (staying in contact at least once per year and knowing how friends relate to others). Dunbar suggests that this number remains the same despite new social networking technologies such as Facebook and Twitter6. 6http://www.nytimes.com/2010/12/26/opinion/26dunbar.html?_r=2&ref=facebookinc
App Store. The app store is the environment used by the agents to store and access apps. Its primary function is to provide a shop front for users and enable them to locate and download apps that match their preferences. To achieve this, it provides three browsing methods: the Top Apps Chart, the New Apps Chart, and Keyword Search. These browsing methods provide changing subsets of apps to users; they are the “watering holes” of the ecosystem at which all users drink. As such, they provide a vital mode of transmission of apps to users. These three methods are modelled because they are common to many app stores, such as iOS, Android, and BlackBerry. The Top Apps Chart ranks apps based on the number of downloads the apps have received. Specifically, apps are ranked in the order of decreasing score, calculated as 8*D1+5*D2+5*D3+3*D4 where Dn is the number of downloads received by the app on the nth day before the current day7. The New Apps Chart displays apps that have recently been uploaded by developer agents; only a small subset of new apps is chosen for this chart. Keyword Search returns a list of apps that match the keyword entered by the user agent. In AppEco, Keyword Search is abstracted as a random search for a random number of apps. It is implemented in this way because keywords may not correspond to features, so a matching keyword does not mean the app has desirable features for the user.
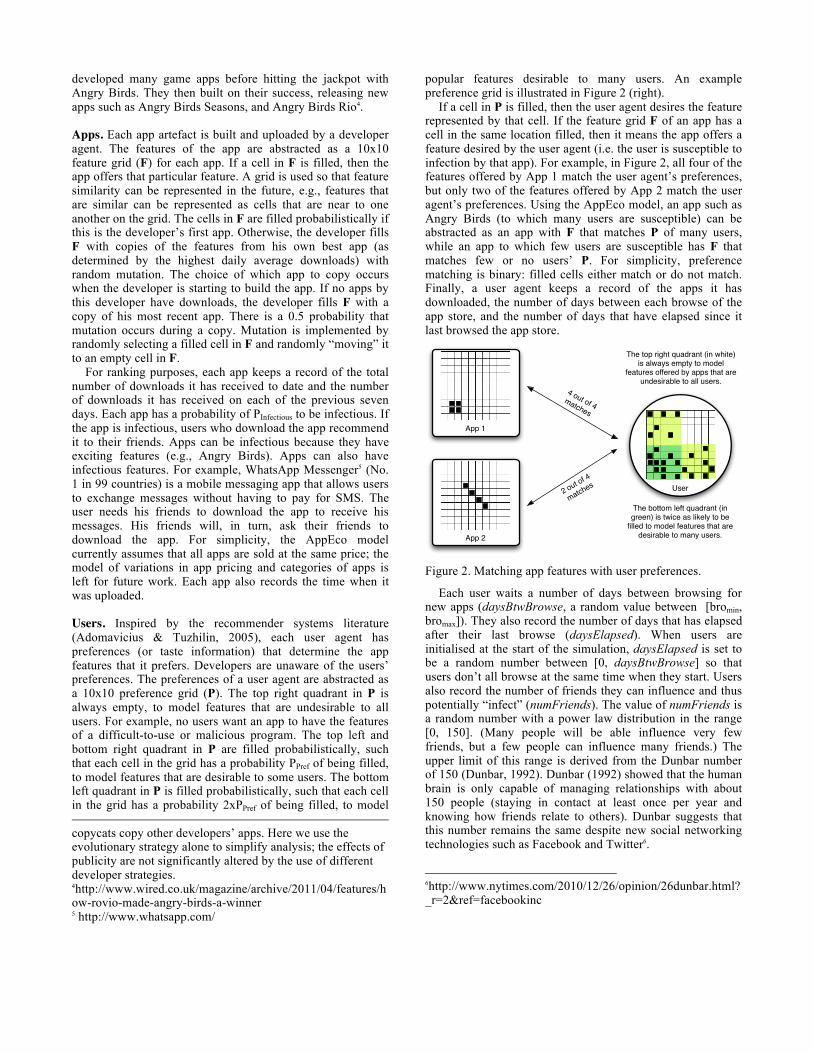
AppEco Algorithm The AppEco algorithm models the daily interactions between the AppEco components described in the previous section. Each timestep in the algorithm represents a day in the real ecosystem. The AppEco algorithm is depicted in Figure 3 and detailed as follows. (AppEco is implemented in C++ and the code can be requested from the authors via email.)
Figure 3. The AppEco algorithm.
Initialise ecosystem. This step launches AppEco with the population of developer and user agents as defined in Equation 1, with timestep t = 0. It is common for app stores to have apps before it is opened. For example, the iOS App Store had 500 apps the day it was launched8. As such, this step also creates an initial number of app artefacts (NInitApp). The developers of these initial apps are randomly selected from the pool of initial developers. The attributes of initial developers, apps, and users are set as described in the previous section. 7 http://www.slideshare.net/misteroo/how-to-market-your-app 8 http://www.apple.com/pr/library/2008/07/10iPhone-3G-on-Sale-Tomorrow.html
Developer agents build and upload apps. For each active developer, daysTaken is incremented by 1. If daysTaken exceeds this developer’s devDuration, the app is completed. The developer then uploads the app to the store, resets daysTaken to 0. The feature attribute of the app is set such that each cell in the 10x10 feature grid has a probability PFeat of being filled. Update app store. The New Apps Chart is updated. When timestep t = 0, the New Apps Chart consists of a random selection of initial apps. In each following timestep, each new app has a probability POnNewChart of appearing on the New Apps Chart. Apps are randomly selected here because the selection criteria are not the focus of this work and real app stores do not reveal how they select apps for the New Apps Chart. The maximum number of apps in the chart is defined by NMaxNewChart. As newly selected apps are added to the chart, older apps appear lower in the chart and are no longer listed when their position exceeds the chart size. The Top Apps Chart is also updated. When timestep t = 0, the Top Apps Chart is empty because no apps have been downloaded yet. In each following timestep, apps are ranked as described in the previous section. The maximum number of apps in the Top Apps Chart is defined by NMaxTopChart. User agents browse and download apps. For each user, daysElapsed is incremented by 1. If daysElapsed exceeds daysBtwBrowse, then the user browses the app store. The user browses the New Apps Chart and the Top Apps Chart, and conducts Keyword Search (which returns a random number of apps between [keymin, keymax]). The user browses each app that it has not previously downloaded: the feature grid of the app is compared with the preference grid of the user. If all the features offered by the app match the user’s preferences, then the user downloads the app. For example, in Figure 2, the user downloads App 1 but not App 2. If the user has downloaded an infectious app in the current timestep, the user will recommend the app to his friends who will then browse the app in the next timestep and download the app if it matches their preferences. Increase agent population. This step increases the number of user and developer agents in the ecosystem for the next timestep. Inspired by the ecology literature (Kingsland, 1995), the population growth of user and developer agents is modelled using a sigmoid growth function commonly used to model the population growth in natural systems. The equation models the growth rate of user and developer agents in an app ecosystem declining as their population density increases, with the size of the ecosystem limited by the market share of the mobile platform. The population size at timestep t, popt, is defined by Equation 1.
popt =MinPop+(MaxPop-MinPop)
1+ eS∗t−D (1)
where MinPop is the minimum population, MaxPop is the maximum population, S determines the slope of the growth curve (S is negative for a growth curve), and D shifts the curve from left to right. Different growth formulas (Kingsland, 1995) can be used to model different ecosystems.
Experiments It is the dream of all developers to be able to spread their app throughout an ecosystem and have their apps “infect” as many users as possible. We first calibrate AppEco to match, as much as is feasible, the behaviour of a real app store. We selected Apple’s iOS App Store for our experiments, as it is one of the oldest and most established app stores. We then perform experiments to investigate three causal factors for epidemics that are relevant to mobile app ecosystems (Dicker et al., 2006).
Calibrating AppEco for iOS We collected the following iOS data over a period of three years, from the start of the iOS ecosystem in July 2008 (Q4 2008) until the end of June 2011 (Q3 2011):
• Number of iOS developers. The number of iOS developers is based on the number of worldwide iOS developers month over month compiled by Gigaom9.
• Number of iOS apps and downloads. The number of apps and downloads is based on statistics provided in Apple press releases and Apple Events10. For example, in the Apple Special Event on 9th Sept 2009, Apple CEO Steve Jobs announced the App Store to reach 75,000 apps and 1.8 billion downloads, and Apple’s press release on 28th Sept 2009 announced that the App Store had more than 85,000 apps and 2 billion downloads11.
• Number of iOS users. The number of iOS users is based on the number of iOS devices (iPod Touch, iPhone, and iPad) sold by Apple over time. The sales figures are available from Apple’s quarterly financial data11, and for simplicity the calculation assumes that each user has one iOS device.
Using this and other publically available data we calibrated AppEco to simulate the iOS app ecosystem. Table 1 summarises the calibrated values for the system constants. In order to match (curve-fit) the iOS User and Developer growth rates, values such as D and S for users and developers were determined through tuning experiments.
[PopminUser, PopmaxUser] [1500, 40000] [devmin, devmax] [1, 180] DUser -4.0 PPref 0.4 SUser -0.0038 PFeat 0.04 [PopminDev, PopmaxDev] [1000, 120000] POnNewChart 0.001 DDev -4.0 NMaxNewChart 40 SDev -0.005 NMaxTopChart 50 NInitApp 500 PInactive 0.0027 [bromin, bromax] [1, 360] [keymin, keymax] [0, 50]
Table 1. Constant Values Resulting from iOS Calibration
It is computationally infeasible in terms of memory to simulate hundreds of millions of users. To ensure that the system is computationally feasible, one app represents one real app, and one developer agent represents one real 9 http://gigaom.com/apple/infographic-apple-app-stores-march-to-500000-apps/ 10 http://www.apple.com/apple-events/ 11 http://www.apple.com/pr/library/
developer, but one user agent represents 10,000 real users. As such, the value of numFriends for one user agent is the average numFriends for 10,000 real users. This course-grain simulation is necessary to enable the modelling of the entire app ecosystem using the available computing resources. Mobile app ecosystems are international ecosystems. Publicity occurs in different countries and infections are not bounded by the users’ physical location. For this reason, modelling just one country or a subset of app users would not provide an accurate simulation of the true app store ecosystem.
After calibration the behaviour of AppEco closely resembles the behaviour of the iOS ecosystem, including emergent rates such as the number of apps and downloads. A run of the simulation takes approximately 22 seconds CPU time on a MacBook Air with a 1.8GHz Intel Core i7 Processor and 4GB of 1333 MHz DDR3 memory. After three years (1080 timesteps assuming 30 days a month), the model typically contains more than 100,000 developer agents, 500,000 apps, 20,000 user agents (corresponding to 200m real users), and 1.5 million downloads (corresponding to 15bn real downloads).
Experimental Setup Our objective in the experiments is to understand the effects of app publicity in the ecosystem: what makes an app epidemic? We investigate three causal factors for epidemics (Dicker et al., 2006):
• changes in host exposure, through app publicity and app appearance on app store charts
• changes in host susceptibility, by varying the degree to which app features meet the preferences of users, and
• changes in app infectiousness, by varying whether users influence their friends to download the app. Although epidemics usually result from infectious agents, non-infectious diseases can also exist in epidemic proportions.
In each experiment, an app is inserted into the App Store two years after the App Store is opened (timestep = 720), when the ecosystem is reasonably mature. The app is then studied for a year. We model changes in host exposure by using the following publicity strategies for the app:
• No exposure. The app is not publicised. • Mass exposure. A total of 100 user agents
(corresponding to 1,000,000 real users) look at the app. This models mass broadcast such as TV and radio12. If the users like the app’s features, they will download the app and if the app is infectious, they will recommend the app to their friends, as described in the previous section.
• Targeted exposure. One targeted user agent (10,000 real users) will look at the app. This models advertisements through specialist magazines or conferences to influential users7. Targeted users are users whose preferences matches the app’s features (chosen by selection from a random sample of 1000 users agents). The targeted user will recommend the app to his friends regardless of whether the app is infectious.
12 For example, http://www.bbc.co.uk/news/11145583
• Recurring exposure. One user agent (10,000 real users) looks at the app, first at timestep TAppPub, and then after that a different user agent will look at the app every 30 timesteps, for 6 times. This models periodical advertisements through magazines or websites7.
• Enhancing mode of transmission through Top Apps Chart (TAC). Some developers choose to pay people to download their apps in order to inflate artificially the total number of downloads the app receives1. Their goal is to improve the app’s ranking on the Top Apps Chart, which will then make the app more visible to users and increase subsequent downloads. We model this strategy by adding one unit of downloads (equivalent to 10,000 downloads in the real world) to an app.
• Enhancing mode of transmission through New Apps Chart (NAC). Similar to the Top Apps Chart, appearing on the New Apps Chart also increases user visibility. This chart is known as the New and Noteworthy Chart on the iOS App Store. Although the selection criteria for the chart is unclear, developers who have succeeded suggested making innovative and desired apps, creating new interfaces for existing app features13, and most commonly, getting the app known by the right people14. We model this strategy by placing the app at the top of the New Apps Chart on a given timestep.
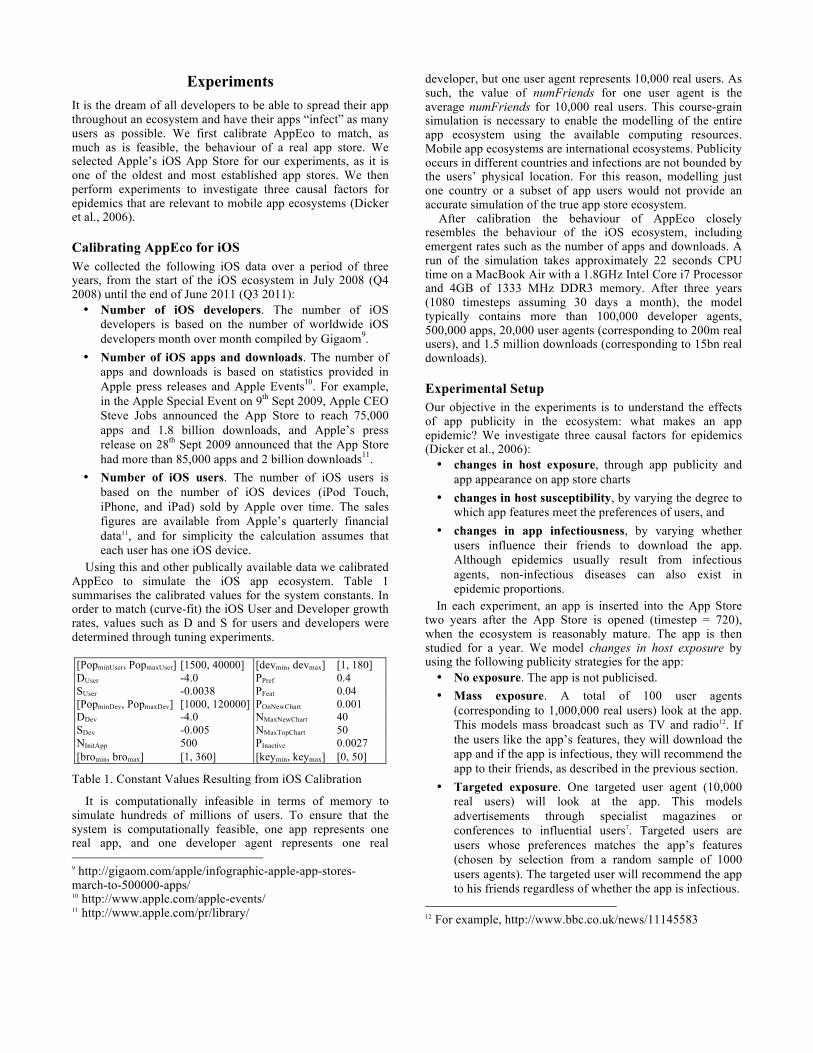
We model changes in host susceptibility by designing three apps for the experiments: an “excellent” app with features only in the bottom left of F, ensuring that a large percentage of users will be susceptible to infection, a “good” app with two features in the bottom left of F and two features in the top left and bottom right quadrants of F, and an “average” app with features in the top left and bottom right quadrants of F, as illustrated in Figure 4. Bad apps with features in the top right quadrant of F will never be downloaded regardless of publicity. For this reason experiments with bad apps are entirely predictable and are excluded from the study.
Figure 4. Excellent app, good app, and average app.
We model changes in app infectiousness by performing the experiments for both infectious and non-infectious apps (i.e., apps that users tell all their friends about, and apps that nobody tells their friends about).
Results and Analysis Table 2 summarises the results of the experiments. We analyse the results in terms of each causal factor in turn. Host Exposure. For the good app and average app, NAC is the most effective publicity strategy. For example, as can be 13 http://blog.smashapp.com/tag/new-and-noteworthy/ 14 http://forums.toucharcade.com/showthread.php?t=14134
seen in Table 2, the average app received about 170 downloads when NAC is used, but approximately 5 downloads or less when other publicity strategies are used, and 0.26 downloads with No Exposure. Appearing on the new apps chart gives the app a high visibility over a number of weeks and users who access the app store will be able to see the app. The second most effective publicity for the good and average app is Mass Exposure. Mass Exposure reaches many users, which increases the app’s chances of reaching susceptible users.
This result is the same for excellent, but non-infectious app. But surprisingly, when the excellent app is infectious, No Exposure produced the highest average number of downloads compared to the other publicity strategies. However, the standard deviation for excellent infectious apps is very large, which means that the number of downloads vary greatly in different runs. As a result, none of the publicity strategies is a clear winner or loser. Investigation of individual runs reveals that when the app is highly infectious, increasing the app’s exposure to users increases the number of infected users very quickly, then the number of susceptible users falls below the level required to sustain transmission for future epidemics (everyone is already infected and is thus immune). As a result, the app falls out of the Top Apps Chart, and is forgotten.
TAC is often the worse publicity strategy. Competition from other apps means that an increase of 10,000 downloads is insufficient to boost the app into the Top Apps Chart. Targeted and Recurring Exposure are comparable, with Targeted Exposure achieving slightly more downloads. Recurring Exposure increases the chances of an epidemic, while Targeted Exposure ensures that the target tells his friends about the app. Interestingly, Targeted Exposure for excellent non-infectious app has a large standard deviation of 8 times the average. This is caused by one lucky run, whereby the publicity boosted the app into the Top Apps Chart. Once there, the high visibility created more downloads for the app, which in turn, maintained its position on the chart. As a result, the app remained in the chart for 152 days and received more than 4000 downloads. All other runs have approximately 12 downloads on average.
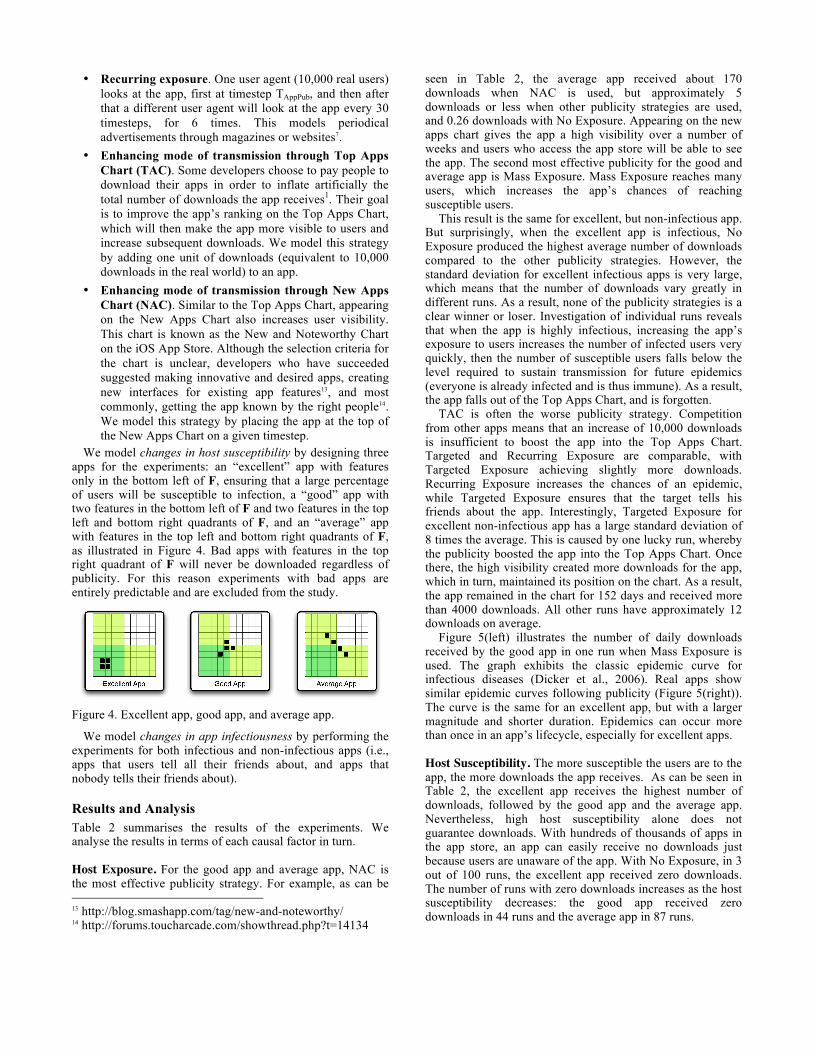
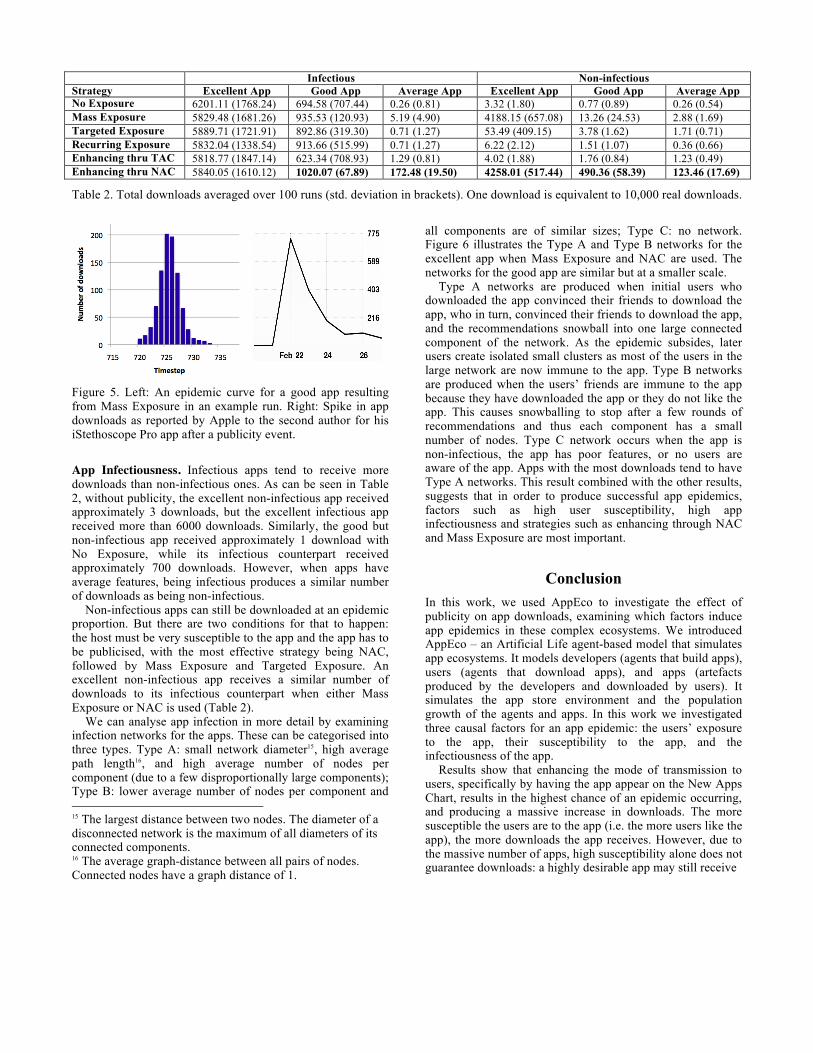
Figure 5(left) illustrates the number of daily downloads received by the good app in one run when Mass Exposure is used. The graph exhibits the classic epidemic curve for infectious diseases (Dicker et al., 2006). Real apps show similar epidemic curves following publicity (Figure 5(right)). The curve is the same for an excellent app, but with a larger magnitude and shorter duration. Epidemics can occur more than once in an app’s lifecycle, especially for excellent apps. Host Susceptibility. The more susceptible the users are to the app, the more downloads the app receives. As can be seen in Table 2, the excellent app receives the highest number of downloads, followed by the good app and the average app. Nevertheless, high host susceptibility alone does not guarantee downloads. With hundreds of thousands of apps in the app store, an app can easily receive no downloads just because users are unaware of the app. With No Exposure, in 3 out of 100 runs, the excellent app received zero downloads. The number of runs with zero downloads increases as the host susceptibility decreases: the good app received zero downloads in 44 runs and the average app in 87 runs.
Infectious Non-infectious Strategy Excellent App Good App Average App Excellent App Good App Average App No Exposure 6201.11 (1768.24) 694.58 (707.44) 0.26 (0.81) 3.32 (1.80) 0.77 (0.89) 0.26 (0.54) Mass Exposure 5829.48 (1681.26) 935.53 (120.93) 5.19 (4.90) 4188.15 (657.08) 13.26 (24.53) 2.88 (1.69) Targeted Exposure 5889.71 (1721.91) 892.86 (319.30) 0.71 (1.27) 53.49 (409.15) 3.78 (1.62) 1.71 (0.71) Recurring Exposure 5832.04 (1338.54) 913.66 (515.99) 0.71 (1.27) 6.22 (2.12) 1.51 (1.07) 0.36 (0.66) Enhancing thru TAC 5818.77 (1847.14) 623.34 (708.93) 1.29 (0.81) 4.02 (1.88) 1.76 (0.84) 1.23 (0.49) Enhancing thru NAC 5840.05 (1610.12) 1020.07 (67.89) 172.48 (19.50) 4258.01 (517.44) 490.36 (58.39) 123.46 (17.69)
Table 2. Total downloads averaged over 100 runs (std. deviation in brackets). One download is equivalent to 10,000 real downloads.
Figure 5. Left: An epidemic curve for a good app resulting from Mass Exposure in an example run. Right: Spike in app downloads as reported by Apple to the second author for his iStethoscope Pro app after a publicity event.
App Infectiousness. Infectious apps tend to receive more downloads than non-infectious ones. As can be seen in Table 2, without publicity, the excellent non-infectious app received approximately 3 downloads, but the excellent infectious app received more than 6000 downloads. Similarly, the good but non-infectious app received approximately 1 download with No Exposure, while its infectious counterpart received approximately 700 downloads. However, when apps have average features, being infectious produces a similar number of downloads as being non-infectious.
Non-infectious apps can still be downloaded at an epidemic proportion. But there are two conditions for that to happen: the host must be very susceptible to the app and the app has to be publicised, with the most effective strategy being NAC, followed by Mass Exposure and Targeted Exposure. An excellent non-infectious app receives a similar number of downloads to its infectious counterpart when either Mass Exposure or NAC is used (Table 2).
We can analyse app infection in more detail by examining infection networks for the apps. These can be categorised into three types. Type A: small network diameter15, high average path length16, and high average number of nodes per component (due to a few disproportionally large components); Type B: lower average number of nodes per component and 15 The largest distance between two nodes. The diameter of a disconnected network is the maximum of all diameters of its connected components. 16 The average graph-distance between all pairs of nodes. Connected nodes have a graph distance of 1.
all components are of similar sizes; Type C: no network. Figure 6 illustrates the Type A and Type B networks for the excellent app when Mass Exposure and NAC are used. The networks for the good app are similar but at a smaller scale.
Type A networks are produced when initial users who downloaded the app convinced their friends to download the app, who in turn, convinced their friends to download the app, and the recommendations snowball into one large connected component of the network. As the epidemic subsides, later users create isolated small clusters as most of the users in the large network are now immune to the app. Type B networks are produced when the users’ friends are immune to the app because they have downloaded the app or they do not like the app. This causes snowballing to stop after a few rounds of recommendations and thus each component has a small number of nodes. Type C network occurs when the app is non-infectious, the app has poor features, or no users are aware of the app. Apps with the most downloads tend to have Type A networks. This result combined with the other results, suggests that in order to produce successful app epidemics, factors such as high user susceptibility, high app infectiousness and strategies such as enhancing through NAC and Mass Exposure are most important.
Conclusion In this work, we used AppEco to investigate the effect of publicity on app downloads, examining which factors induce app epidemics in these complex ecosystems. We introduced AppEco – an Artificial Life agent-based model that simulates app ecosystems. It models developers (agents that build apps), users (agents that download apps), and apps (artefacts produced by the developers and downloaded by users). It simulates the app store environment and the population growth of the agents and apps. In this work we investigated three causal factors for an app epidemic: the users’ exposure to the app, their susceptibility to the app, and the infectiousness of the app.
Results show that enhancing the mode of transmission to users, specifically by having the app appear on the New Apps Chart, results in the highest chance of an epidemic occurring, and producing a massive increase in downloads. The more susceptible the users are to the app (i.e. the more users like the app), the more downloads the app receives. However, due to the massive number of apps, high susceptibility alone does not guarantee downloads: a highly desirable app may still receive
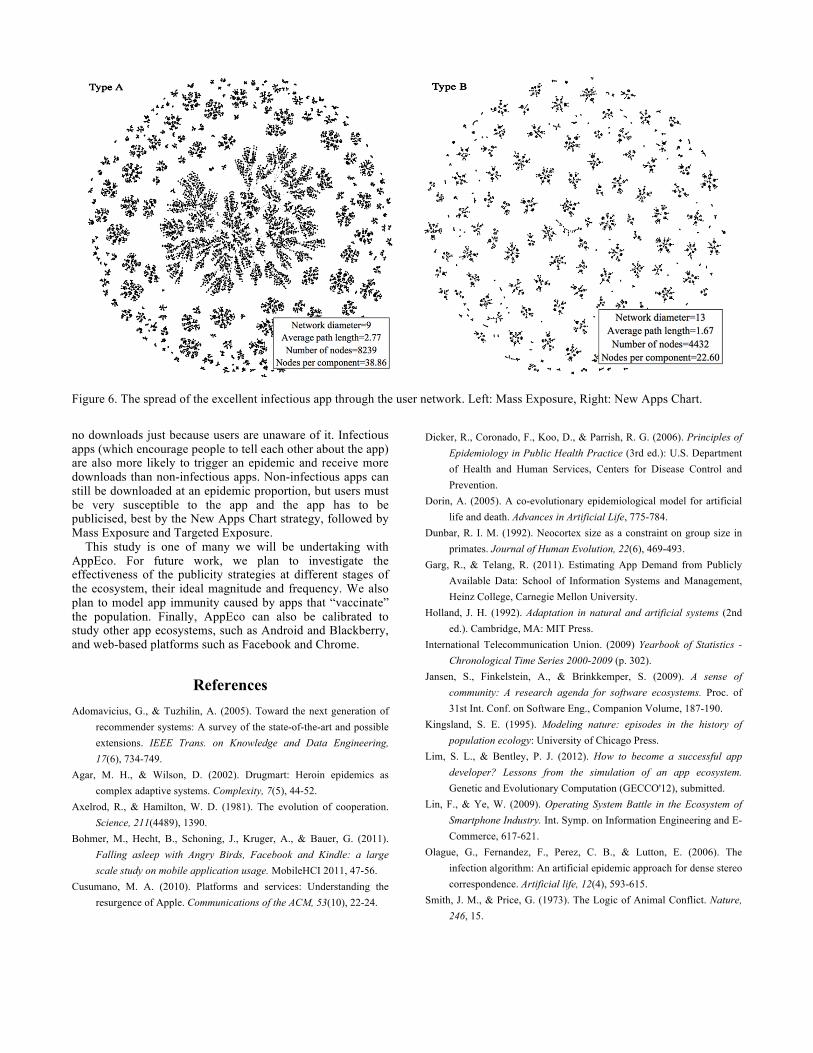
Figure 6. The spread of the excellent infectious app through the user network. Left: Mass Exposure, Right: New Apps Chart.
no downloads just because users are unaware of it. Infectious apps (which encourage people to tell each other about the app) are also more likely to trigger an epidemic and receive more downloads than non-infectious apps. Non-infectious apps can still be downloaded at an epidemic proportion, but users must be very susceptible to the app and the app has to be publicised, best by the New Apps Chart strategy, followed by Mass Exposure and Targeted Exposure.
This study is one of many we will be undertaking with AppEco. For future work, we plan to investigate the effectiveness of the publicity strategies at different stages of the ecosystem, their ideal magnitude and frequency. We also plan to model app immunity caused by apps that “vaccinate” the population. Finally, AppEco can also be calibrated to study other app ecosystems, such as Android and Blackberry, and web-based platforms such as Facebook and Chrome.
References Adomavicius, G., & Tuzhilin, A. (2005). Toward the next generation of
recommender systems: A survey of the state-of-the-art and possible extensions. IEEE Trans. on Knowledge and Data Engineering, 17(6), 734-749.
Agar, M. H., & Wilson, D. (2002). Drugmart: Heroin epidemics as complex adaptive systems. Complexity, 7(5), 44-52.
Axelrod, R., & Hamilton, W. D. (1981). The evolution of cooperation. Science, 211(4489), 1390.
Bohmer, M., Hecht, B., Schoning, J., Kruger, A., & Bauer, G. (2011). Falling asleep with Angry Birds, Facebook and Kindle: a large scale study on mobile application usage. MobileHCI 2011, 47-56.
Cusumano, M. A. (2010). Platforms and services: Understanding the resurgence of Apple. Communications of the ACM, 53(10), 22-24.
Dicker, R., Coronado, F., Koo, D., & Parrish, R. G. (2006). Principles of Epidemiology in Public Health Practice (3rd ed.): U.S. Department of Health and Human Services, Centers for Disease Control and Prevention.
Dorin, A. (2005). A co-evolutionary epidemiological model for artificial life and death. Advances in Artificial Life, 775-784.
Dunbar, R. I. M. (1992). Neocortex size as a constraint on group size in primates. Journal of Human Evolution, 22(6), 469-493.
Garg, R., & Telang, R. (2011). Estimating App Demand from Publicly Available Data: School of Information Systems and Management, Heinz College, Carnegie Mellon University.
Holland, J. H. (1992). Adaptation in natural and artificial systems (2nd ed.). Cambridge, MA: MIT Press.
International Telecommunication Union. (2009) Yearbook of Statistics - Chronological Time Series 2000-2009 (p. 302).
Jansen, S., Finkelstein, A., & Brinkkemper, S. (2009). A sense of community: A research agenda for software ecosystems. Proc. of 31st Int. Conf. on Software Eng., Companion Volume, 187-190.
Kingsland, S. E. (1995). Modeling nature: episodes in the history of population ecology: University of Chicago Press.
Lim, S. L., & Bentley, P. J. (2012). How to become a successful app developer? Lessons from the simulation of an app ecosystem. Genetic and Evolutionary Computation (GECCO'12), submitted.
Lin, F., & Ye, W. (2009). Operating System Battle in the Ecosystem of Smartphone Industry. Int. Symp. on Information Engineering and E-Commerce, 617-621.
Olague, G., Fernandez, F., Perez, C. B., & Lutton, E. (2006). The infection algorithm: An artificial epidemic approach for dense stereo correspondence. Artificial life, 12(4), 593-615.
Smith, J. M., & Price, G. (1973). The Logic of Animal Conflict. Nature, 246, 15.