Indonesia Ecommerce Industry|Indonesia Online Sales Market|Segmentation Retail Indonesia

APMP.L-K8
International Comparison of Surface Roughness
Final report January 2013
Measurements
July 2008 to June 2010
Prepared by
Mr Andrew Baker National Measurement Insitute
Australia (NMIA)
Co-authored by
S.L.Tan, National Metrology Centre (NMC, A*STAR), Singapore R.Leach, National Physical Laboratory (NPL), UK
L.Jung, Physikalisch-Technische Bundesanstalt (PTB), Germany S.Y.Wong, Standards and Calibration Laboratory (SCL), Hong Kong
A. Tonmueanwai, National Institute of Metrology, Thailand (NIMT), Thailand K. Naoi, National Metrology Institute of Japan (NMIJ), Japan
J. Kim, Korea Research Institute of Standards and Science (KRISS), South Korea T.B.Renegar, National Institute of Standards and Technology (NIST), USA
K P Chaudhary, National Physical Laboratory India (NPLI), India O. Kruger, National Metrology Institute of South Africa (NMISA), South Africa
M. Amer, National Institute of Standards (NIS), Egypt S. Gao, National Institute of Metrology (NIM), China
C. L. Tsai, National Measurement Laboratory (CMS), Chinese Taipei N. Anh, Vietnam Metrology Institute (VMI), Vietnam
A. Drijarkara, Kalibrasi Instrumentasi dan Metrologi Lembaga Ilmu Pengetahuan Indonesia (KIM-LIPI), Indonesia

TABLE OF CONTENTS Abstract ............................................................................................................................................. 3
1 Introduction .............................................................................................................................. 3
2 Description of the standards ..................................................................................................... 4
3 Participating laboratories and measurement schedule ............................................................. 5
4 Measuring equipment................................................................................................................ 7
5 Measurement conditions
a Grooves ........................................................................................................................... 8
b Roughness section ........................................................................................................... 8
c Softgauges ..................................................................................................................... 10
6 Comments on documents submitted ...................................................................................... 10
7 Analysis methods ................................................................................................................... 10
8 Condition and stability of standards ....................................................................................... 12
9 Results and observations for physical standards .................................................................... 13
10 Comments on groove depth results ........................................................................................ 15
11 Comments on parameter results ............................................................................................. 16
12 Correlations due to traceability path ...................................................................................... 17
13 Comments on softgauge results ............................................................................................. 18
14 Final conclusions and remarks ............................................................................................... 18
15 Acknowledgements ................................................................................................................ 19
16 References .............................................................................................................................. 19
Appendix A. Table of documents submitted by each laboratory .................................................... 20
Appendix B. Artefact Results Graphs ............................................................................................. 21
Appendix C. Full reported results ................................................................................................... 33
Appendix D. Softgauge results ....................................................................................................... 69
Appendix E. Alternative analysis .................................................................................................... 74
APMP.L-K8 report, 10 January 2013 Page 2 of 74

Abstract: Surface roughness calibration services of sixteen countries from four metrology regions are compared through measurements of roughness and step height standards. The artefacts circulated include three steps of nominal depths 0.4 µm, 2.4 µm and 10 µm, whereas the roughness sections of both type C and type D profiles have nominal Ra values of 0.2 µm, 0.95 µm, 1.5 µm and 3.1 µm. Two softgauges were also circulated for comparison of software independent of hardware. For the steps, parameter d is reported, while for the type C and type D standards and softgauges, fourteen different roughness parameters are reported between them. Concluding measurements from the pilot in general show good standard stability, however, for some parameters on the artefacts of larger roughness, stability may be considered less certain and this may be an issue in additional outliers in results from the last few laboratories in the schedule. For each parameter, a key comparison reference value (KCRV) is determined using a weighted mean with outliers excluded based on the Birge ratio method until all accepted values form a statistically consistent population. For the five artefacts, out of thirty-five separate parameters, only ten have good agreement of all submitted results. Where some parameters had to be excluded from the KCRV, some laboratories had consistent problems with particular types of parameter over the different artefacts, while for other laboratories the types of parameters excluded seemed to be random. Comparison of softgauge results and artefact results has proven to be inconclusive. 1. Introduction The broad objective of the Asia Pacific Metrology Program (APMP) is to improve the measurement capabilities in the Asia Pacific region by sharing facilities and experience in metrology. Comparison of calibrations by different laboratories on given artefacts adds confidence in the measurement of standards and leads to international acceptance of the measurements carried out by these laboratories. This intercomparison concerns the calibration of surface roughness standards by both contact and non-contact methods. Standards and data files are circulated for groove and parameter measurement with each laboratory to decide which method is appropriate for each standard. The comparison was expanded to include laboratories from the EURAMET, SIM and SADCMET with measurements spanning two years as shown in Table 3.
APMP.L-K8 report, 10 January 2013 Page 3 of 74

2. Description of the standards The artefacts circulated for assessment of surface texture are listed in Table 1 and Figures 1 to 6. Table 1. Nominal sizes of standards and softgauges. All sizes in micrometres.
Type [4] Model Serial Number Nominal Depth
Nominal Ra
Nominal RSm
(A) 0.4 - - A1 112/331 A277 (B) 2.7 - -
A1 45/13222 7462 10 - - D1 4058/01A1 5276 - 0.2 - C1 112/331 A277 - 0.95 80 D1 4058/01A3 5256 - 1.5 - C1 2073a 1286 - 3.1 100 F1 Cos4 - 0.5 F1 Sin_2_16 - 0.4
Figure 1. s/n A277: two grooves and roughness Figure 2. s/n 7462: 10 µm groove
Figure 3. type D1 s/n 5276 and 5256 roughness Figure 4. type C1 s/n 1286
-1.5
-1
-0.5
0
0.5
1
1.5
0 800 1600 2400 3200 4000 4800 5600
-1.5
-1
-0.5
0
0.5
1
1.5
0 800 1600 2400 3200 4000 4800 5600
Figure 5. Softgauge profile Cos4 Figure 6. Softgauge profile Sin_2_16
APMP.L-K8 report, 10 January 2013 Page 4 of 74
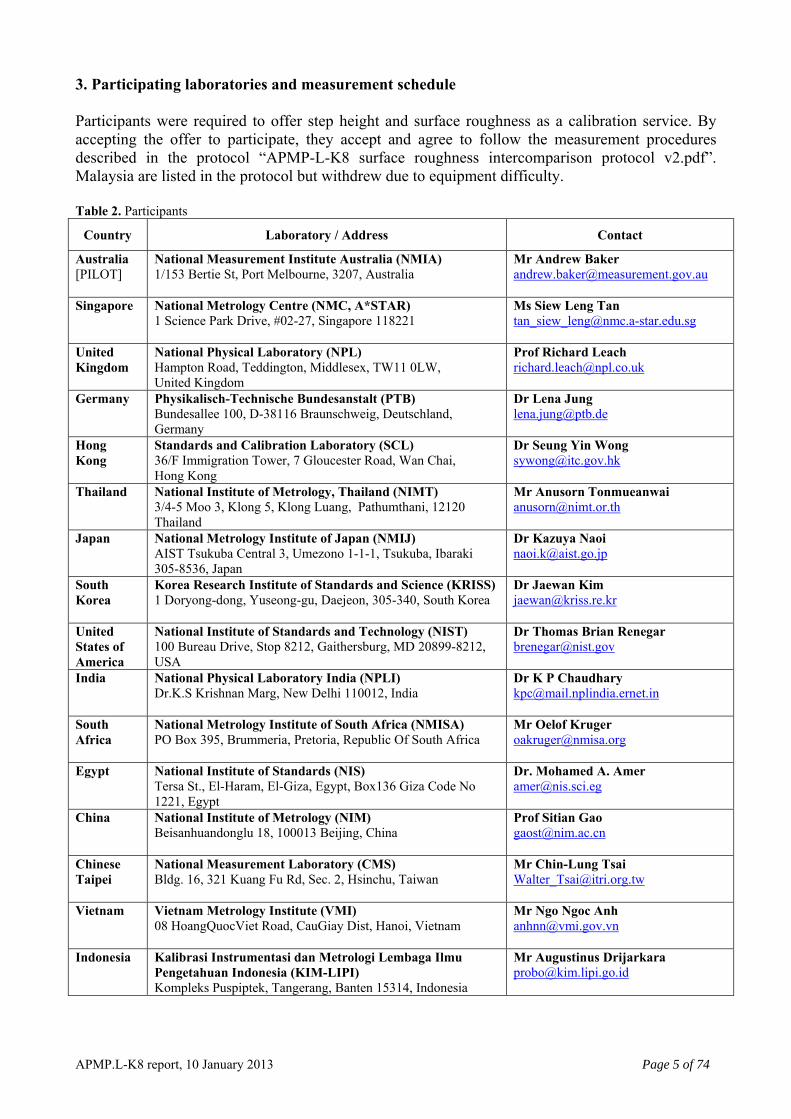
3. Participating laboratories and measurement schedule Participants were required to offer step height and surface roughness as a calibration service. By accepting the offer to participate, they accept and agree to follow the measurement procedures described in the protocol “APMP-L-K8 surface roughness intercomparison protocol v2.pdf”. Malaysia are listed in the protocol but withdrew due to equipment difficulty. Table 2. Participants
Country Laboratory / Address Contact
Australia [PILOT]
National Measurement Institute Australia (NMIA) 1/153 Bertie St, Port Melbourne, 3207, Australia
Mr Andrew Baker [email protected]
Singapore National Metrology Centre (NMC, A*STAR) 1 Science Park Drive, #02-27, Singapore 118221
Ms Siew Leng Tan [email protected]
United Kingdom
National Physical Laboratory (NPL) Hampton Road, Teddington, Middlesex, TW11 0LW, United Kingdom
Prof Richard Leach [email protected]
Germany Physikalisch-Technische Bundesanstalt (PTB) Bundesallee 100, D-38116 Braunschweig, Deutschland, Germany
Dr Lena Jung [email protected]
Hong Kong
Standards and Calibration Laboratory (SCL) 36/F Immigration Tower, 7 Gloucester Road, Wan Chai, Hong Kong
Dr Seung Yin Wong [email protected]
Thailand National Institute of Metrology, Thailand (NIMT) 3/4-5 Moo 3, Klong 5, Klong Luang, Pathumthani, 12120 Thailand
Mr Anusorn Tonmueanwai [email protected]
Japan National Metrology Institute of Japan (NMIJ) AIST Tsukuba Central 3, Umezono 1-1-1, Tsukuba, Ibaraki 305-8536, Japan
Dr Kazuya Naoi [email protected]
South Korea
Korea Research Institute of Standards and Science (KRISS) 1 Doryong-dong, Yuseong-gu, Daejeon, 305-340, South Korea
Dr Jaewan Kim [email protected]
United States of America
National Institute of Standards and Technology (NIST) 100 Bureau Drive, Stop 8212, Gaithersburg, MD 20899-8212, USA
Dr Thomas Brian Renegar [email protected]
India National Physical Laboratory India (NPLI) Dr.K.S Krishnan Marg, New Delhi 110012, India
Dr K P Chaudhary [email protected]
South Africa
National Metrology Institute of South Africa (NMISA) Mr Oelof Kruger PO Box 395, Brummeria, Pretoria, Republic Of South Africa [email protected]
Egypt National Institute of Standards (NIS)
Tersa St., El-Haram, El-Giza, Egypt, Box136 Giza Code No 1221, Egypt
Dr. Mohamed A. Amer [email protected]
China National Institute of Metrology (NIM) Beisanhuandonglu 18, 100013 Beijing, China
Prof Sitian Gao [email protected]
Chinese Taipei
National Measurement Laboratory (CMS) Bldg. 16, 321 Kuang Fu Rd, Sec. 2, Hsinchu, Taiwan
Mr Chin-Lung Tsai [email protected]
Vietnam Vietnam Metrology Institute (VMI) 08 HoangQuocViet Road, CauGiay Dist, Hanoi, Vietnam
Mr Ngo Ngoc Anh [email protected]
Indonesia Kalibrasi Instrumentasi dan Metrologi Lembaga Ilmu Pengetahuan Indonesia (KIM-LIPI) Kompleks Puspiptek, Tangerang, Banten 15314, Indonesia
Mr Augustinus Drijarkara [email protected]
APMP.L-K8 report, 10 January 2013 Page 5 of 74

The comparison was carried out in circular form with repeat measurements by the pilot, Australia. Only the first measurements by the pilot are included in determination of the key comparison reference values. Superficial checks were made by the coordinator, Andrew Baker, while on secondment to NPL in May 2009. The actual schedule is listed in Table 3. Significant customs delays occurred due to a lost Carnet between Germany and Hong Kong and also a customs clearance difficulty between the NMIA mid-cycle check at NPL in the UK and the USA. Overall the delays did not affect the intercomparison. Table 3. Measurement schedule
Country Laboratory Region Planned Schedule Actual Schedule (approximate) Carnet
Australia NMIA APMP July 2008 July 2008 -
Singapore NMC, A*STAR APMP August 2008 August 2008 Yes
United Kingdom NPL EURAMET September 2008 September 2008 Yes
Germany PTB EURAMET October 2008 October 2008 Yes
Hong Kong SCL APMP November 2008 December 2008 Yes
Thailand NIMT APMP December 2008 / January 2009 January 2009 Yes
Japan NMIJ APMP January / February 2009
January / February 2009 Yes
Malaysia SIRIM APMP March 2009 Withdrawn Yes
South Korea KRISS APMP April 2009 April 2009 Yes
Australia (check) NMIA APMP May 2009 May 2009 (in UK) Yes
USA NIST SIM June 2009 June / July 2009 Yes
India NPLI APMP July 2009 August 2009 Yes
South Africa NMISA AFRIMET August 2009 October 2009 Yes
Egypt NIS AFRIMET September 2009 November 2009 No
China NIM APMP October 2009 December 2009 / January 2010 No
Chinese Taipei CMS APMP November 2009 February 2010 No
Vietnam VMI APMP December 2009 / January 2010 March / April 2010 No
Indonesia KIM-LIPI APMP January 2010 / February 2010 April / May 2010 No
Australia (repeat) NMIA APMP March 2010 June 2010 Yes
APMP.L-K8 report, 10 January 2013 Page 6 of 74
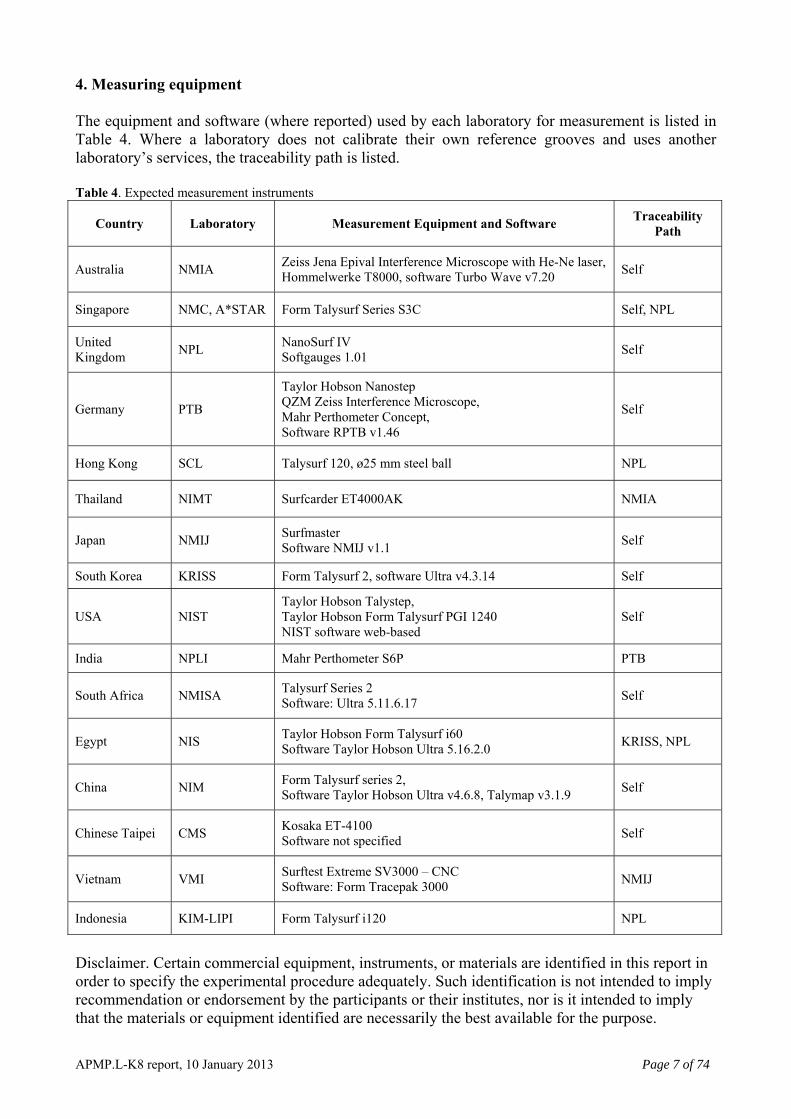
4. Measuring equipment The equipment and software (where reported) used by each laboratory for measurement is listed in Table 4. Where a laboratory does not calibrate their own reference grooves and uses another laboratory’s services, the traceability path is listed. Table 4. Expected measurement instruments
Country Laboratory Measurement Equipment and Software Traceability Path
Australia NMIA Zeiss Jena Epival Interference Microscope with He-Ne laser, Hommelwerke T8000, software Turbo Wave v7.20 Self
Singapore NMC, A*STAR Form Talysurf Series S3C Self, NPL
United Kingdom NPL NanoSurf IV
Softgauges 1.01 Self
Germany PTB
Taylor Hobson Nanostep QZM Zeiss Interference Microscope, Mahr Perthometer Concept, Software RPTB v1.46
Self
Hong Kong SCL Talysurf 120, ø25 mm steel ball NPL
Thailand NIMT Surfcarder ET4000AK NMIA
Japan NMIJ Surfmaster Software NMIJ v1.1 Self
South Korea KRISS Form Talysurf 2, software Ultra v4.3.14 Self
USA NIST Taylor Hobson Talystep, Taylor Hobson Form Talysurf PGI 1240 NIST software web-based
Self
India NPLI Mahr Perthometer S6P PTB
South Africa NMISA Talysurf Series 2 Software: Ultra 5.11.6.17 Self
Egypt NIS Taylor Hobson Form Talysurf i60 Software Taylor Hobson Ultra 5.16.2.0 KRISS, NPL
China NIM Form Talysurf series 2, Software Taylor Hobson Ultra v4.6.8, Talymap v3.1.9 Self
Chinese Taipei CMS Kosaka ET-4100 Software not specified Self
Vietnam VMI Surftest Extreme SV3000 – CNC Software: Form Tracepak 3000 NMIJ
Indonesia KIM-LIPI Form Talysurf i120 NPL
Disclaimer. Certain commercial equipment, instruments, or materials are identified in this report in order to specify the experimental procedure adequately. Such identification is not intended to imply recommendation or endorsement by the participants or their institutes, nor is it intended to imply that the materials or equipment identified are necessarily the best available for the purpose.
APMP.L-K8 report, 10 January 2013 Page 7 of 74
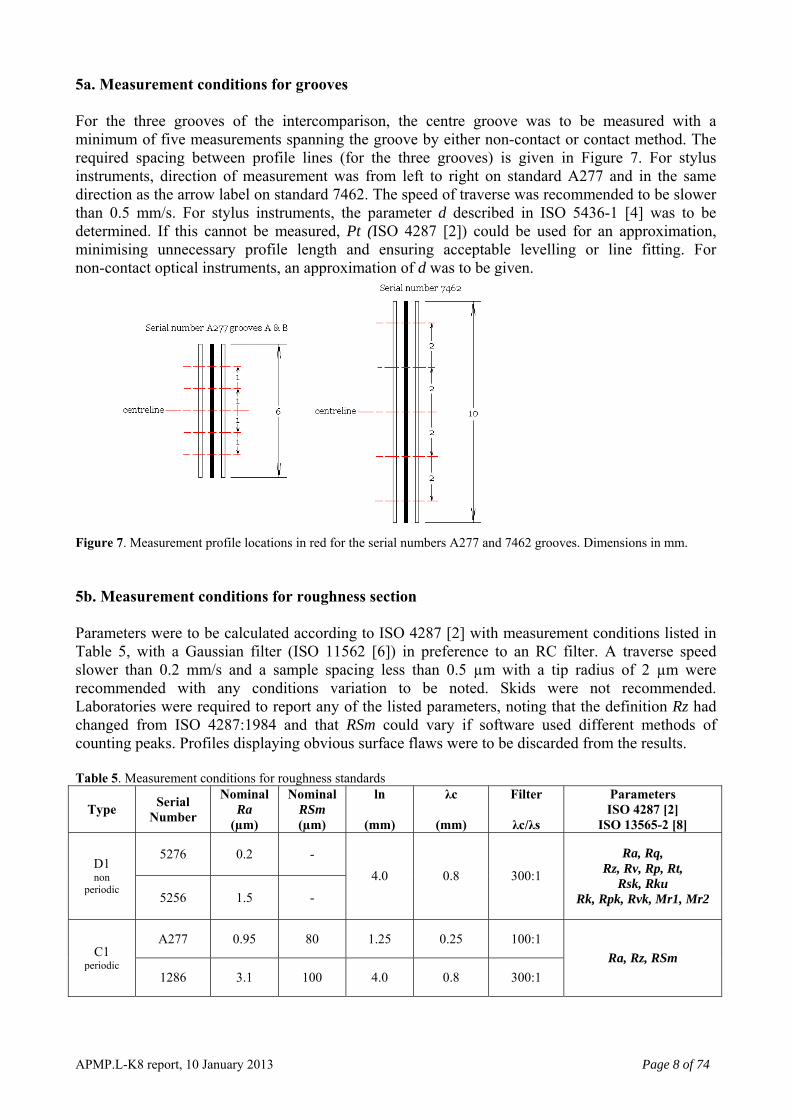
5a. Measurement conditions for grooves For the three grooves of the intercomparison, the centre groove was to be measured with a minimum of five measurements spanning the groove by either non-contact or contact method. The required spacing between profile lines (for the three grooves) is given in Figure 7. For stylus instruments, direction of measurement was from left to right on standard A277 and in the same direction as the arrow label on standard 7462. The speed of traverse was recommended to be slower than 0.5 mm/s. For stylus instruments, the parameter d described in ISO 5436-1 [4] was to be determined. If this cannot be measured, Pt (ISO 4287 [2]) could be used for an approximation, minimising unnecessary profile length and ensuring acceptable levelling or line fitting. For non-contact optical instruments, an approximation of d was to be given.
Figure 7. Measurement profile locations in red for the serial numbers A277 and 7462 grooves. Dimensions in mm. 5b. Measurement conditions for roughness section Parameters were to be calculated according to ISO 4287 [2] with measurement conditions listed in Table 5, with a Gaussian filter (ISO 11562 [6]) in preference to an RC filter. A traverse speed slower than 0.2 mm/s and a sample spacing less than 0.5 µm with a tip radius of 2 µm were recommended with any conditions variation to be noted. Skids were not recommended. Laboratories were required to report any of the listed parameters, noting that the definition Rz had changed from ISO 4287:1984 and that RSm could vary if software used different methods of counting peaks. Profiles displaying obvious surface flaws were to be discarded from the results. Table 5. Measurement conditions for roughness standards
Type Serial Number
Nominal Ra
(µm)
Nominal RSm (µm)
ln
(mm)
λc
(mm)
Filter
λc/λs
Parameters ISO 4287 [2]
ISO 13565-2 [8]
5276 0.2 - D1 non
periodic 5256 1.5 -
4.0 0.8 300:1
Ra, Rq, Rz, Rv, Rp, Rt,
Rsk, Rku Rk, Rpk, Rvk, Mr1, Mr2
A277 0.95 80 1.25 0.25 100:1 C1
periodic 1286 3.1 100 4.0 0.8 300:1
Ra, Rz, RSm
APMP.L-K8 report, 10 January 2013 Page 8 of 74

The recommended profile locations on each roughness standard are shown in figures 8, 9 and 10 with either twelve, fifteen or twenty measurements to be made.
Figure 8. Profile locations for serial number A277 roughness section. 20 profiles, ln = 1.25 mm. Dimensions in mm.
5
measurement area
5
40
20 17
17
0 4.1 8.15 12.2
0.3 4.35
0.55 4.6 8.65 12.7
8.4 12.5
measurement area 2
centreline
Figure 9. Profile locations for both type D standards, 12 profiles, ln = 4.0 mm. Dimensions in mm.
Figure 10. Profile locations for the type C serial number 1286 standard. 15 profiles, ln = 4.0 mm. Dimensions in mm.
APMP.L-K8 report, 10 January 2013 Page 9 of 74
5c. Measurement conditions for softgauges Softgauges are computer data files that typify a digital representation of a surface. Two profiles were supplied on a memory stick in SMD format according to ISO 5436-2 [5], however, other non-standard formats were also supplied. Each laboratory was to determine which format was suitable for their software and determine the parameters listed in Table 6 using the conditions listed. There was some confusion during the intercomparison about what filtering to apply. The instruction listed in the protocol was intended to have a long wave filter of 0.8 mm applied but no short wave filter (λs) applied. For Rz and RSm see notes in previous section. Table 6. Measurement conditions
Type F1
Filename ln (mm)
λc (mm)
Filter λc/λs
Parameters ISO 4287
1 Cos4
2 Sin_2_16 5.6 0.8 OFF
Ra, Rq, Rz, Rp, Rv, Rt,
RSm
6. Comments on documents submitted Each laboratory was requested to submit results using the protocol Appendix C template, full reports (as would be given to any calibration client) and full uncertainty calculations. All laboratories submitted results from the protocol forms. Many laboratories did not measure all parameters. Not all laboratories submitted evidence of the surface condition of each standard before and after measurement. Not all laboratories submitted full calibration reports. Not all laboratories submitted uncertainty calculations. Refer to Appendix A for a table of which documents each laboratory submitted. 7. Analysis methods When all results had been submitted, the reference value for each measured quantity was determined from the weighted mean of the values xi from each individual laboratory, as shown in equation 1.
⎥⎦
⎤⎢⎣
⎡⎥⎦
⎤⎢⎣
⎡= ∑∑
==
N
ii
N
iiiw xuxuxx
1
2
1
2 )(1)( (1)
To avoid bias, only the first set of measurements from the pilot laboratory was included in reference value determination. The standard uncertainty of the reference value was taken as the standard deviation of the mean of the set of reported xi values. The calculation for the standard uncertainty of the weighted mean, including correlation terms, is shown in equation 2.
2
1
21
1 1
1
1
22 )(/1)(
1)(
1),(2)(/1)( ⎥⎦
⎤⎢⎣
⎡
⎥⎥⎦
⎤
⎢⎢⎣
⎡+⎥
⎦
⎤⎢⎣
⎡= ∑∑ ∑∑
=
−
= +=
−
=
N
ii
N
i
N
ij jiji
N
iiw xu
xuxuxxrxuxu (2)
APMP.L-K8 report, 10 January 2013 Page 10 of 74

Assessment of each laboratory’s result was made with the degree of equivalence ratio, En, with respect to the reference value. The calculation for the determination of En is:
)()(2 22 xuxu
xxE
i
in
−
−= (3)
where u(xi) is the standard uncertainty of the individual laboratory and )(xu is the standard uncertainty of the weighted mean. The largest value of En which exceeded unity is excluded and the reference value and En ratio are recalculated. Only one result is excluded at a time. The Birge ratio is a value that can be used to test of the consistency of a set of data and its uncertainties. If the measurements being compared come from the same population, then the propagated (internal) uncertainty, )( wI xu , should agree with that calculated from the standard deviation of the weighted mean (external uncertainty), )( wE xu , as given in equations 4 and 5.
1
1
22 )(/1)(−
=⎥⎦
⎤⎢⎣
⎡= ∑
N
iiwI xuxu (4)
⎥⎦
⎤⎢⎣
⎡−⎥
⎦
⎤⎢⎣
⎡−= ∑∑
==
N
ii
N
iiwiwE xuNxuxxxu
1
2
1
222 )(/1)1()()()( (5)
For an infinite population size, the ratio should approximate a value of 1. For a limited population size, the Birge criterion is given by:
1
81−
+=N
RB (6)
where N is the number of accepted measurements. For sixteen laboratories, RB is equal to 1.32. The criterion is recalculated if any results are excluded. A Birge ratio much larger than the criterion implies that some data contain systematic offsets or alternately that some uncertainties have been underestimated. A ratio much less than the criterion implies that uncertainties have been overestimated. The results will point to calculations that may need further investigation and possibly reassessment. The reference value will be selected that best reflects the population.
B
For a population with a number of results of En greater than 1 and the Birge ratio greater than the Birge criterion, the result with the largest En was removed and the weighted mean, the uncertainty of the mean, all En values, the Birge ratio and Birge criterion were recalculated. This iteration process was repeated until the Birge ratio became less than the Birge criterion and the exclusion process was stopped. If the population still contained a laboratory with an En greater than 1, this laboratory was retained in the calculation of the KCRV.
APMP.L-K8 report, 10 January 2013 Page 11 of 74

8. Condition and stability of standards Many laboratories reported the surface condition of the standards before and after measurement. Only minor damage was reported in the form of minor scratches or corrosion spots. Graphs of results in Appendix B suggest that any damage during the two year period of the intercomparison is not significant. Few laboratories reported any results affected by flaws observed in profiles. The pilot completed full measurements on the standards as the first laboratory and the last laboratory. Some intermediate measurements were made in the middle of the schedule; however, these were simple condition tests and cannot be used for quantative comparison. The En ratios for each parameter of the last measurements of NMIA and the first measurements of NMIA are listed in Table 7. Note that this equivalence number is not the same as that calculated for the initial and final NMIA results in the tables in Appendix C which are relative to the KCRV. The majority of parameters gave a very good reproducibility and therefore the standards in general can be considered stable for the period of the project. However, for the two coarse standards, 1286 and 5256, the En values of many parameters do not repeat as well as for the smaller standards. This could be a significant issue in interpreting outliers from laboratories at the end of the schedule. It can be seen from individual parameter results that where the NMIA final result is significantly different to the initial result, the previous laboratory results are often in the opposing direction from the KCRV suggesting no real trend. As shown in Figure 11, only one parameter, Rk for standard 5256, gave an En larger than 1. Observation of the individual laboratory results show that the three results prior to the last NMIA results were lower than the KCRV while the last NMIA result was higher. Overall this suggests that the 5256 standard for Rk can be considered stable for the period of the intercomparison. Table 7. NMIA En first and last measurements
GrA GrB Gr Ra Rz RSm Rq Rp Rv Rt Rsk Rku Rk Rpk Rvk Mr1 Mr2 A277 0.04 0.33 - 0.15 0.4 0 - - - - - - - - - - - 7462 - - 0.08 - - - - - - - - - - - - - - 1286 - - - 0.54 0.8 0 - - - - - - - - - - - 5276 - - - 0.16 0.09 - 0.17 0.02 0.06 0.26 0.03 0.53 0.39 0.12 0.03 0.15 * 5256 - - - 0.62 0.72 - 0.6 0.36 0.7 0.86 0.1 0.19 1.18 0.04 0.92 0.02 0.03
* Note: The parameter Mr2 was not remeasured at the end of the intercomparison due to a parameter selection error.
0
1
2
3
4
5
6
7
8
9
10
11
12
13
0.0 - 0.1 0.1 - 0.2 0.2 - 0.3 0.3 - 0.4 0.4 - 0.5 0.5 - 0.6 0.6 - 0.7 0.7 - 0.8 0.8 - 0.9 0.9 - 1.0 1.0 - 1.1 1.1 - 1.2
E n ratio range
Freq
uenc
y
A277
7462
1286
5276
5256
Figure 11. Frequency of En ratio range for NMIA first and last measurements.
APMP.L-K8 report, 10 January 2013 Page 12 of 74

9. Results and observations for physical standards A total of thirty-five parameters, including three groove depths, were measured across the five artefacts. Using the En and Birge ratio method described in section 7, for each parameter, outliers were excluded from the KCRV. This process is shown in Appendices B and C and a summary of the final results are shown in Table 8. The uncertainty of the KCRV for each parameter has a coverage factor of k = 2.0, resulting in a confidence level of approximately 95%. Table 8. Results of outlier exclusion and key comparison reference value calculation
S/N Param Final Changen KCRV First Second Third Fourth Fifth n KCRV U95%
µm µm µm µmA277 Gr A 14 0.383 VMI STOP 13 0.383 0.001 -
Gr B 15 2.834 NPLI VMI STOP 13 2.834 0.003 -Ra 16 0.931 KRISS NPLI NIST STOP 13 0.931 0.003 -Rz 16 2.482 NMISA NPLI KIM-LIPI STOP 13 2.486 0.005 0.005
RSm 15 76.235 KIM-LIPI KRISS NIS STOP 12 76.284 0.076 0.049
7462 Groove 15 10.043 VMI NPLI STOP 13 10.037 0.011 -0.006
1286 Ra 16 3.106 KIM-LIPI STOP 15 3.106 0.003 -Rz 16 9.815 KIM-LIPI STOP 15 9.817 0.010 0.003
RSm 15 99.158 KIM-LIPI KRISS STOP 13 99.160 0.016 0.002
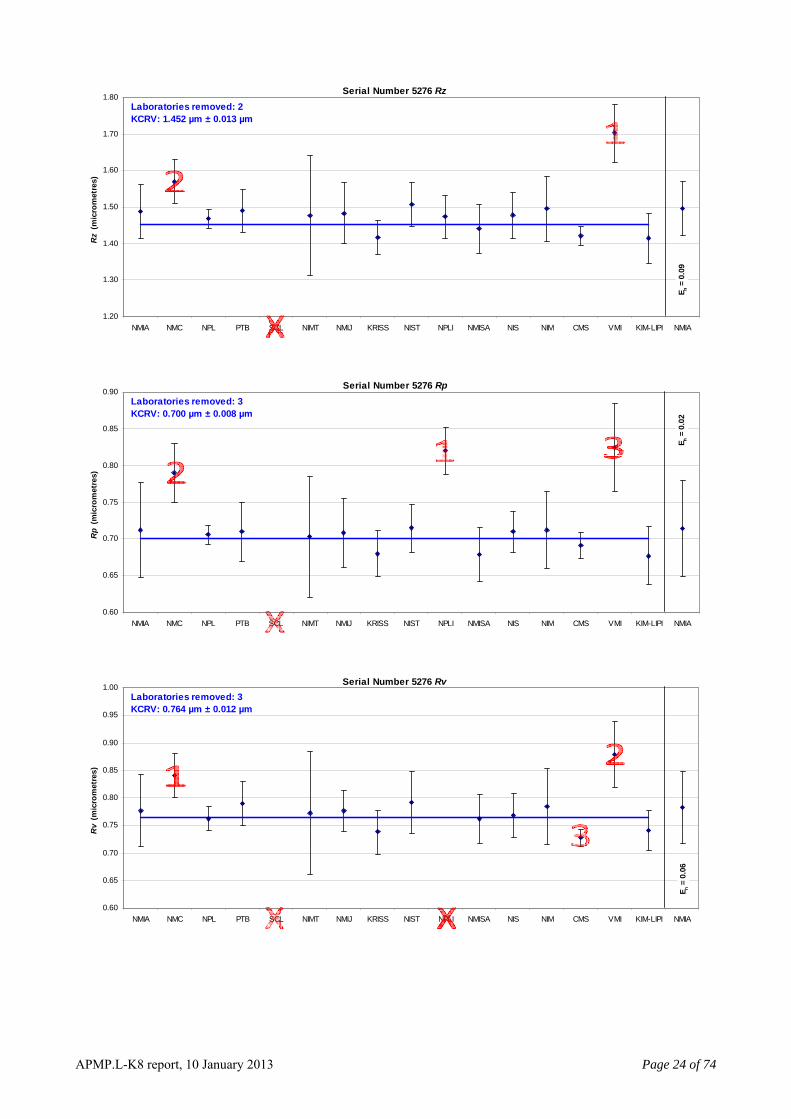
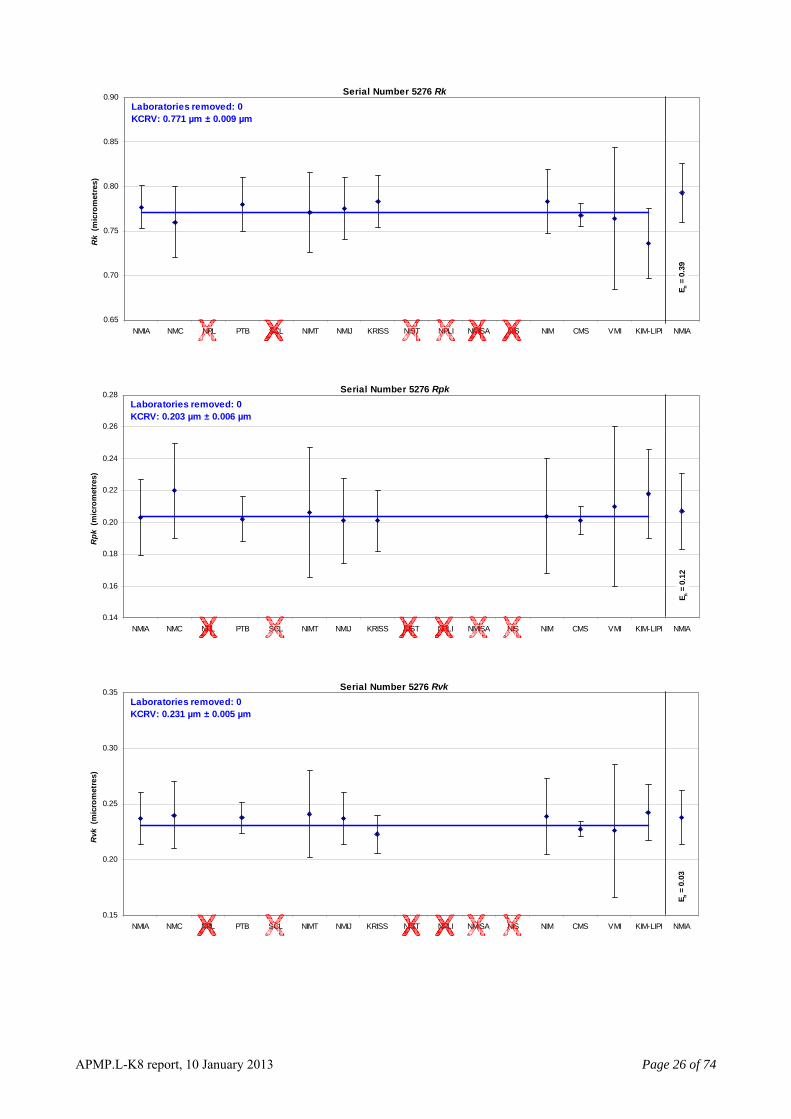
5276 Ra 15 0.223 STOP 15 0.223 0.001 -Rq 15 0.271 STOP 15 0.271 0.001 -Rz 15 1.464 VMI NMC STOP 13 1.452 0.013 -0.012Rp 15 0.707 NPLI NMC VMI STOP 12 0.700 0.008 -0.007Rv 14 0.758 NMC VMI CMS STOP 11 0.764 0.011 0.006Rt 15 1.673 STOP 15 1.673 0.018 -
Rsk 13 -0.071 NPLI STOP 12 -0.062 0.010 0.009Rku 12 2.594 STOP 12 2.594 0.018 -Rk 10 0.771 STOP 10 0.771 0.009 -
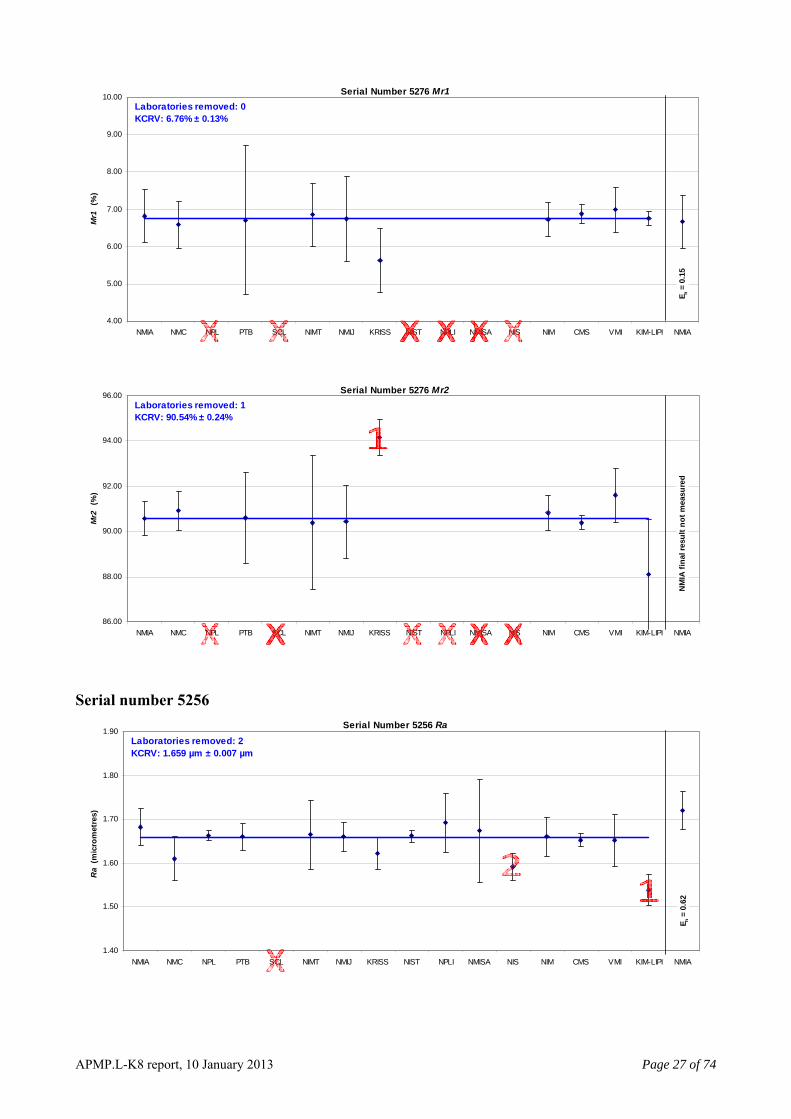
Rpk 10 0.203 STOP 10 0.203 0.006 -Rvk 10 0.231 STOP 10 0.231 0.005 -Mr1 10 6.761 STOP 10 6.761 0.131 -Mr2 10 90.895 KRISS STOP 9 90.539 0.240 -0.355
5256 Ra 15 1.653 KIM-LIPI NIS STOP 13 1.656 0.006 0.003Rq 15 2.013 KIM-LIPI NIS STOP 13 2.018 0.006 0.005Rz 15 8.523 VMI NMC KIM-LIPI NIS STOP 11 8.055 0.042 -0.468Rp 15 2.870 NPLI VMI KIM-LIPI STOP 12 2.871 0.018 -Rv 14 5.292 VMI NMC NIS KIM-LIPI STOP 10 5.186 0.031 -0.106Rt 15 10.375 NIS CMS KIM-LIPI STOP 12 10.434 0.043 0.059
Rsk 13 -0.718 NPLI NPL CMS STOP 10 -0.813 0.018 -0.095Rku 12 2.831 NMC NIM VMI NMIA KRISS TO 7 2.724 0.028 -0.108Rk 10 4.199 NIM VMI STOP 8 4.151 0.038 -0.048
Rpk 10 0.266 STOP 10 0.266 0.017 -Rvk 10 3.331 CMS VMI KIM-LIPI STOP 7 3.386 0.031 0.055Mr1 8 2.565 STOP 8 2.565 0.221 -Mr2 10 78.035 NIM STOP 9 77.765 0.436 -0.270
Totals 35 464 404Removed 60
Initial Outliers removed
For the thirty five parameters listed, 466 results were submitted; however, two results were rejected from judgement of the co-ordinator, both for standard 5256 parameter Mr1. The KIM-LIPI result was high but with a very small uncertainty which was considered too small to be realistic. The KRISS result was an order of magnitude high and an obvious error. Of the accepted 464 results, sixty were excluded from the KCRV calculations. A total of six parameters had one result excluded,
APMP.L-K8 report, 10 January 2013 Page 13 of 74

seven parameters had two results excluded, nine parameters had three results excluded, two parameters had four results excluded, one had five results excluded, leaving only ten of thirty-five parameters having no results excluded. Individual laboratory performance is shown in Table 9. Table 9. Individual laboratory performance
Results Parameters excluded
Accept Excl % A277 7462 1286 5276 5256
Australia NMIA 35 1 2.9% - - - - Rku
Singapore NMC, A*Star 35 6 17.1% - - - Rz, Rp, Rv Rz, Rv, Rku
UK NPL 25 1 4.0% - - - - Rsk
Germany PTB 35 0 0 - - - - -
Hong Kong SCL 4 0 0 - - - - -
Thailand NIMT 35 0 0 - - - - -
Japan NMIJ 35 0 0 - - - - -
South Korea KRISS 34 5 14.7% Ra, RSm - RSm Mr2 Rku, Mr11
USA NIST 21 1 4.8% Ra2 - - - -
India NPLI 20 8 40% B, Ra, Rz Gr - Rp, Rsk Rp, Rsk
South Africa NMISA 25 1 4% Rz - - - -
Egypt NIS 21 6 28.6% RSm - - - Ra, Rq,
Rz, Rv, Rt China NIM 35 3 8.6% - - - - Rku, Rk, Mr2
Chinese Teipei CMS 35 4 11.4% - - - Rv Rt, Rsk, Rvk
Vietnam VMI 35 12 34.3% A, B Gr - Rz, Rp, Rv Rz, Rp, Rv,
Rku, Rk, Rvk Ra, Rq, Rz, Rp,
Rv, Rt, Rvk, Mr11
Indonesia KIM-LIPI 34 12 35.3% Rz, RSm - Ra, Rz,
RSm
Accepted 464 76 15 47 164 162
Excluded 60 12 2 4 10 32
Percentage 12.9% 15.8% 13.3% 8.5% 6.1% 19.8%
1 Parameter Mr1 excluded by judgement of the co-ordinator as described previously. 2 Refer to section 11 for discussion on stylus tip correction affecting this reported result.
APMP.L-K8 report, 10 January 2013 Page 14 of 74

Out of 464 accepted results, sixty were excluded which is 12.9%. The most consistent results were for standards 1286 and 5276. Figure 12 shows the overall performance of excluded results compared to submitted results. In general, the lower the total results excluded, the better that laboratory agreed with the key comparison reference value. Refer to the graphs in Appendix B for any particular parameter. The higher incidence of results excluded toward the end of the schedule suggests a possible trend in the standards, however, the stability of the standards was considered good. As mentioned in section 8, the coarse standards, while considered stable, did show a bigger change over the two years of measurements than the fine standards and grooves. Looking at the parameters excluded from the last two laboratories VMI and KIM-LIPI do show that most outliers for the 5256 standard, however, for KIM-LIPI all removed parameters are lower than the KCRV while the NMIA final measurement was higher than the KCRV. This strongly suggests that any change in the standards is not the cause of outliers. It should also be noted that many parameters are mathematically related which means that a laboratory with one outlier is more likely to have a group of outliers, making the statistics potentially misleading. This can be seen easily in the NMC, A*Star results which have mostly peak parameters removed and is likely to be an issue for KIM-LIPI, VMI and NIS. This is further discussed in section 11.
Artefact parameter results submitted and excluded
1
6
1 0 0 0 0
5
1
8
1
6
3
4
12 12
0
2
4
6
8
10
12
14
NMIA NMC NPL PTB SCL NIMT NMIJ KRISS NIST NPLI NMISA NIS NIM CMS VMI KIM-LIPI
2.9% 17.1% 4.0% 0% 0% 0% 0% 14.7% 4.8% 40.0% 4.0% 28.6% 8.6% 11.4% 34.3% 35.3%
35
35
25 35 4 35 21 25
21
35
34
35
35 34
20
35
Figure 12. Laboratory results removed from KCRV calculation. 10. Comments on groove depth results Results submitted for the three groove depths varied between stylus methods reporting d or Pt, defined in ISO 5436-1 and ISO 4287 respectively. Where some laboratories used interferometric methods, an approximation of d is reported. No results made using d, either by stylus or interferometric methods were excluded from reported reference values. It is known that NPLI, VMI and KIM-LIPI reported Pt instead of d. For the three grooves in the intercomparison, only NPLI and VMI had results determined as too large. This is what would be expected since the Pt calculation is made from maximum to minimum profile points over a longer sampling length. The KIM-LIPI Pt results for the three grooves were good.
APMP.L-K8 report, 10 January 2013 Page 15 of 74
11. Comments on parameter results From Table 9, some patterns can be seen for some laboratories. For example, NMC A*Star had outlier results for some peak to valley parameters on the type D standards but only one other parameter. This may suggest a possible sensitivity to noise or a problem in the software algorithm, however, it is difficult to specify a particular problem as some other peak parameters were accepted. It is noted that NMC A*Star reported the older Ry instead of Rz whereas all other laboratories reported Rz or failed to acknowledge using the older parameter. VMI and KIM-LIPI also had peak parameter outliers, also on the type D artefacts. KRISS had outliers for RSm on both type C artefacts. NPLI had outliers with Rp and Rsk on both type D standards. All other outliers seem to be of random occurrence. Any cause for these must be assessed by the laboratory concerned. After completion of all measurements and initial circulation of data, some laboratories reported discovering errors in measurement of calculation of some parameters. Only one known laboratory used a filter setting not specified in the protocol. NPLI reported using a 100:1 ratio where a 300:1 ratio was specified. It is not clear if this may have affected their low Rsk values. Since most NPLI results were acceptable, this in general did not appear to significantly affect the intercomparison. A different than nominal tip radius could increase or decrease some parameters since the profile obtained from measurement is a dilation of the true surface due to the stylus geometry. If the profile exhibits steep slopes the profile dilation may be fairly significant, possibly affecting Ra, Rq and others. Participants were not asked to measure their stylus radius as part of the measurement process. Many laboratories acknowledge that the stylus tip is measured at periodic intervals or when erroneous results suggest errors and then the tip is measured either optically or by the razor-blade method [15]. It is understood that nearly all laboratories used a nominal 2 µm tip radius, however NIST reported using a 1.5 µm radius tip, SCL used a 1 µm tip while NPLI used a 4 µm tip. Several NIST parameter results are larger than the reported KCRV although only one result was classed as an outlier. In discussions with NIST, it was found that they apply a correction to all results and report parameters with referral to a theoretical tip radius of zero. The magnitude of this correction can be significant for parameters such as Ra and is dependent on the surface measured and the tip geometry. NIST advises that the rationale for performing such tip correction comes from the definition of “mechanical surface: boundary of the erosion, by a spherical ball of radius r, of the locus of the centre of an ideal tactile sphere, also with radius r, rolled over the skin model of a workpiece” and that this definition appears both in ISO Standard 14406:2010 [9] and in Final Draft International Standard 25178-2 [10] dealing with areal surface texture parameters. NIST considers that the error caused by tip-size is justifiably removed for conformance with the GUM guideline (JCGM100:2008) [11] on treatment of significant systematic effects (section 3.2.4) although application of such a correction has not been a common practice and no other participating laboratories applied this correction. Therefore the intercomparison is marginally skewed since the NIST results are not a true comparison to all other results. In general though, due to a reasonable number of participants, this is not significant. If the single NIST outlier (for s/n A277 Ra) is excluded from analysis, the KCRV reduces by 3 nm and the remaining outliers for that parameter are removed regardless. NIST reports that if its tip-corrected profiles for this surface are numerically dilated using a 2 µm stylus radius, the Ra value decreases by 12.0 nm, yielding an estimate of 0.9377 µm for the uncorrected Ra. The uncorrected result would be in significantly better agreement with the KCRV. NIST results remain as submitted. The effect on other parameters such as Rq, are as of yet, not investigated. Further discussions will be required at the NMI and CCL level to determine a course of action, whether other laboratories follow or reject the NIST correction.
APMP.L-K8 report, 10 January 2013 Page 16 of 74

Since SCL submitted few results, any trend is more difficult to determine. For the two Ra and two Rz results, these all tended to be close to the KCRV and any effect from tip radius cannot be determined. Some of the excluded results from NPLI were groove depths and Rp. A large stylus would not have significant effect on grooves and would likely have a reducing effect on Rp if the stylus could not reach valleys that a 2 µm tip would reach. The results given do not clearly identify any trend caused by variations in stylus radius. 12. Correlations due to traceability path As listed in table 4, at the time of measurement for this intercomparison, most laboratories calibrate their own references traceable to the definition of the metre, except for five laboratories: • NMC, A*STAR obtain some cross-referencing in their traceability through calibration of
some standards at NPL; • SCL obtain traceability through NPL; • NIMT obtain traceability through NMIA; • NPLI obtain traceability through PTB; • NIS obtain traceability though KRISS and NPL • VMI obtain traceability through NMIJ; • KIM-LIPI obtain traceability through NPL.
If a strong correlation exists in these relationships, the En ratio of any parameter should be small between the related laboratories and some consistency in direction of offset should exist in the results compared to the other laboratories and the reference value. This does not show in any results for any laboratory: • No pattern can be seen in the NMC, A*STAR results compared to the NPL results. Where
some peak to valley NMC, A*STAR results are excluded, the equivalent results from NPL are good. Other results do not shift in direction or magnitude with the NPL results.
• The NIMT results do appear very close to those of NMIA, however, in general the results are also close to the reference values so any possible correlation is not apparent.
• The NPLI results show no trend relationship to the PTB results. • Only one of the six removed parameters for NIS (s/n A277 RSm) matches that of the KRISS
parameters removed. All other results are either within uncertainties or vary in apparently random fashion. The same conclusion is made in comparison to NPL results from which one parameter was excluded.
• The VMI results have more parameters excluded with again no apparent relationship to the NMIJ results.
• The KIM-LIPI results tend toward being below the NPL results for most parameters but not for all.
In conclusion, no laboratory that obtains its traceability via another laboratory shows any correlation to its source laboratory greater than any expected random variation in results.
APMP.L-K8 report, 10 January 2013 Page 17 of 74

13. Comments on softgauge results The two softgauges as supplied by NPL were circulated in numerous formats with ten of sixteen laboratories submitting results. Numerical and graphical results of softgauge tests from each laboratory are shown in Appendix D. Since there is no measurement, only a software output, no uncertainty value is reported. Two tables are provided for results comparison. A population standard deviation can be determined and used as a nominal type of uncertainty for calculation of an En value of each laboratory result to the average. Alternately, the difference of each result to the supplied NPL result is shown. Using either method, it can be seen that essentially all the results for both Cos4 and Sin_2_16 are very similar for NPL, PTB and NIST, all three laboratories using in-house developed software. This is possibly expected due to the well published developmental work these laboratories have conducted in this area. The NIS results, using Taylor Hobson Ultra software, also agree well with these three laboratories for Sin_2_16 but not so well for Cos4. One possible reason for this could be that the Sin_2_16 profile is repeated every 400 µm, including in the profile lead-in. The Cos4 profile varies in amplitude, increasing in the lead-in and reducing in the lead-out. This would imply that software that incorrectly removes the lead-in and lead-out should get lower results for Cos4 but not necessarily for Sin_2_16. This appears to be the case for the NIS results and should be investigated. Note also that three laboratories, KRISS, NMISA and NIS, use a version of Taylor Hobson Ultra software while another, NIM, uses Talymap Gold software, produced by Digital Surf (France) but sold by Taylor Hobson (UK). Investigation of the data of just these laboratories suggests no direct relationship. For other results, there may be some relationships between the softgauge results and the artefact results. For example, NMIA results for the Sin_2_16 Ra and Rq parameters are higher than the average and this can be seen in results of the same parameters on the type D 5276 and 5256 results, although any difference is within uncertainties. The difference is not seen on the type C standards A277 and 1286 for Ra so any relationship is probably coincidental. 14. Final conclusions and remarks With sixteen laboratories participating in this intercomparison, a total of thirty-five parameters measured across five roughness standards and seven parameters on each of two softgauges, significant variation of results was always expected and this has proven to be the case. The measurement schedule planned was approximately twenty months and with some delays was completed in twenty-four months. The repeat measurements by the pilot laboratory showed overall acceptable stability of the standards, especially the grooves and fine surfaces, so as a general conclusion, the variation observed between some laboratory results is most likely from the measurement process and differences in software algorithms. In any measurement process you may expect 5% of results to lie outside the acceptable population. For the analysis made here on all artefact parameters, approximately 13% of submitted results have been determined to be outside statistically acceptable limits. This is not necessarily an unexpected event considering that many parameters are mathematically related. Overall, laboratory performance was mixed for all standards but worst on the larger type D roughness standard serial number 5256. Many laboratories may be satisfied with the outcomes of this intercomparison although some will have to review their systems and the effect that reported measured differences from any of the key comparison reference values may have on their surface texture calibration service.
APMP.L-K8 report, 10 January 2013 Page 18 of 74

APMP.L-K8 report, 10 January 2013 Page 19 of 74
15 Acknowledgements Many thanks to the APMP Technical Committee for Length (TCL) Chair during the intercomparison period, Ms Siew Leng Tan of NMC, A*STAR for discussions and advice in preparing the protocol. Thanks to Dr Lena Jung and Dr Ludger Koenders of PTB for providing the two type D standards for this intercomparison and early discussions in development of some project details. Thanks to Dr Ted Vorburger and Mr Brian Renegar of NIST for providing the type C standard, serial number 1286 and additional project development including in-depth discussion on tip radius. Thanks to Professor Richard Leach of NPL for supplying the softgauges and both Richard and Dr Peter Harris of NPL for support in verifying the analysis methods (assessed using ideal data). Lastly, thank you to all participants for following the schedule as best as possible in measurement, submission of results and subsequent verification and discussions. 16 References [1] ISO 3274 Surface Texture – Instruments for the assessment of surface texture – Profile method, International Organization
for Standardization, Geneva, Switzerland, 1996. [2] ISO 4287 Geometrical Product Specifications (GPS) – Surface texture: Profile method – Terms, definitions and surface
texture parameters, International Organization for Standardization, Geneva, Switzerland, 1997. [3] ISO 4288 Geometrical Product Specifications (GPS) – Surface texture: Profile method – Rules and procedures for the
assessment of surface texture, International Organization for Standardization, Geneva, Switzerland, 1996. [4] ISO 5436-1 Geometrical Product Specifications (GPS) – Surface texture: Profile method; Measurement standards – Part
1: Material measures, International Organization for Standardization, Geneva, Switzerland, 2000. [5] ISO 5436-2 Geometrical Product Specifications (GPS) - Surface texture: Profile method; Measurement standards - Part 2:
Software measurement standards, International Organization for Standardization, 2001 [6] ISO 11562 Geometrical Product Specifications (GPS) – Surface texture: Profile method – Metrological characteristics of
phase correct filters, International Organization for Standardization, Geneva, Switzerland, 1996. [7] ISO 12179 Geometrical Product Specifications (GPS) – Surface texture: Profile method – Calibration of contact (stylus
instruments), International Organization for Standardization, Geneva, Switzerland, 2000 [8] ISO 13565-2 Geometrical Product Specifications (GPS) - Surface texture: Profile method - Part 2: Height characterization
using the linear material ratio curve, 1996 [9] ISO 14406 Geometrical product specifications (GPS) - Extraction, 2010 [10] ISO FDIS 25178-2 Geometrical product specifications (GPS) - Surface texture: Areal - Part 2: Terms, definitions and
surface texture parameters, 2011 [11] JCGM 100:2008 – Evaluation of measurement data - Guide to the expression of uncertainty in measurement. [12] M.G Cox, “The Evaluation of Key Comparison Data”, Metrologia, 2002, 39, 589-595. [13] R. Kacker, R. Datla, A. Parr, “Combined result and associated uncertainty from interlaboratory evaluations based on the
ISO Guide” Metrologia 39 (2002) p279-293. [14] J.L. Gardiner, CCPR Key Comparison Processing Methods, Background Material, 1999 [15] J.F.Song and T.V. Vorburger, “Stylus Profiling at High Resolution and Low Force”, Applied Optics 30, p42-50, 1991 [16] WJ Giardini, C. Calderon, F. Cheng-yen, K.K. Hau, C.S Kang, S.M. Lee, F. Lesha, A.M. MeKawi, R. Monteros, C. Quan,
V. Roonwal, N. Sakano, R.P. Singhal, S.Y. Wong, S.Z.A. Zahwi, “International Comparison of Surface Texture Parameters Organized by the Asia Pacific Metrology Programme”, Metrologia, 2002, 39, 225-229.
[17] EUROMET Supplementary Comparison, “Surface Texture”, Project 600, Technical Report (Physikalisch-Technische
Bundesanstalt, Braunschweig, Germany, March 23, 2001). [18] K. Doytchinov, F. Kornblit, C.C. Castellanos, J.C.V. Oliveira, T.B. Renegar, T.V. Vorburger, “International Comparison of
Surface Roughness and Step Height (Depth) Standards, SIML-S2 (SIM 4.8)”.

-
PMP.L-K8 report, 10 January 2013 Page 20 of 74
Appendix A. Documents submitted by each laboratory. Lab All A277
Groove A A277
Groove B 7462
Groove A277
Roughness 5276
Roughness 5256
Roughness 1286
Roughness Cos4
Softgauge Sin_2_16 Softgauge
D
amag
e re
port
Res
ults
(App
C)
Rep
ort
Unc
erta
inty
C
alcu
latio
ns
Res
ults
(App
C)
Rep
ort
Unc
erta
inty
C
alcu
latio
ns
Res
ults
(App
C)
Rep
ort
Unc
erta
inty
C
alcu
latio
ns
Res
ults
(App
C)
Rep
ort
Unc
erta
inty
C
alcu
latio
ns
Res
ults
(App
C)
Rep
ort
Unc
erta
inty
C
alcu
latio
ns
Res
ults
(App
C)
Rep
ort
Unc
erta
inty
C
alcu
latio
ns
Res
ults
(App
C)
Rep
ort
Unc
erta
inty
C
alcu
latio
ns
Res
ults
(App
C)
Res
ults
(App
C)
NMIA Yes Y Y Y Y Y Y Y Y Y Y Y Y Y Y Y Y Y Y Y Y Y Y Y
NMC, A*STAR No Y Y Y Y Y Y Y Y Y Y Y Y Y Y Y Y Y Y Y Y Y Y Y
NPL1 Yes Y Y - Y Y - Y Y - Y Y - Y Y - Y Y - Y Y - -
PTB1 Pictures Y Y Y Y Y Y Y Y Y Y Y Y Y Y Y Y Y Y Y Y Y Y Y
SCL Yes - - - - - - - - - Y Y Y - - - - - - Y Y Y - -
NIMT Yes Y Y - Y Y - Y Y - Y Y - Y Y1 Y Y Y1 Y Y Y - - -
NMIJ Yes Y - Y Y - Y Y - Y Y - Y Y - Y Y - Y Y - Y Y Y
KRISS Yes Y Y - Y Y - Y Y - Y Y - Y Y - Y Y - Y Y - Y Y
NIST Yes Y Y Y Y Y Y Y Y Y Y Y Y Y Y Y Y Y Y Y Y Y Y Y
NPLI No Y - - Y - - Y - - Y - - Y - - Y - - Y - - - -
NMISA No Y - - Y - - Y - - Y - - Y - - Y - - Y - - Y Y
NIS No Y - Y Y - Y Y - Y Y - Y Y - Y Y - Y Y - Y Y Y
NIM1 No Y Y Y Y Y Y Y Y Y Y Y Y Y Y Y Y Y Y Y Y Y Y Y
CMS No Y - Y Y - Y Y - Y Y - Y Y - Y Y - Y Y - Y Y Y
VMI1 No Y Y Y Y Y Y Y Y Y Y Y Y Y Y Y Y Y Y Y Y Y - -
KIM-LIPI Yes Y - Y Y - Y Y - Y Y - Y Y - Y Y - Y Y - Y - -
1 Indicates laboratory provided a project report rather than individual reports for each standard.
A

Appendix B. Artefact Results Graphs Graphs display the comparison of each laboratory result for each standard groove depth or parameter as listed in the graph title. All submitted results are displayed with expanded uncertainty. Where a laboratory did not submit a result, its position in that graph is crossed. The key comparison reference value, KCRV, is determined by weighted mean method with outliers excluded one at a time (largest En from the KCRV) until the Birge ratio is less than the Birge limit. Usually this coincided with all values with an En > 1 removed, however, for some parameters, a reported value with an En > 1 may be accepted as part of the population since the Birge ratio was less than the Birge limit. The final KCRV is shown on each graph as a blue line after all outliers have been removed. Each outlier is labelled in order of exclusion. The final repeated measurement from the pilot laboratory NMIA is shown to the right in each graph. Only the first NMIA result is used to determine the KCRV. Refer to Appendix C for all submitted results and calculations of the initial KCRV with comments on each parameter results. For simplicity, in graphs, NMC, A*Star is referred to as NMC. Serial number A277
Serial Number A277 Groove A
0.30
0.35
0.40
0.45
0.50
0.55
0.60
0.65
NMIA NMC NPL PTB SCL NIMT NMIJ KRISS NIST NPLI NMISA NIS NIM CMS VMI KIM-LIPI NMIA
d (m
icro
met
res)
Laboratories removed: 1KCRV: 0.383 µm ± 0.001 µm
E n =
0.0
4
Serial Number A277 Groove B
2.50
2.70
2.90
3.10
3.30
3.50
3.70
3.90
NMIA NMC NPL PTB SCL NIMT NMIJ KRISS NIST NPLI NMISA NIS NIM CMS VMI KIM-LIPI NMIA
d (m
icro
met
res)
Laboratories removed: 2KCRV: 2.834 µm ± 0.003 µm
E n =
0.3
3
APMP.L-K8 report, 10 January 2013 Page 21 of 74

Serial Number A277 Ra
0.80
0.85
0.90
0.95
1.00
NMIA NMC NPL PTB SCL NIMT NMIJ KRISS NIST NPLI NMISA NIS NIM CMS VMI KIM-LIPI NMIA
Ra
(mic
rom
etre
s)
Laboratories removed: 3KCRV: 0.931 µm ± 0.003 µm
E n =
0.1
5
Serial Number A277 Rz
2.20
2.40
2.60
2.80
3.00
3.20
3.40
NMIA NMC NPL PTB SCL NIMT NMIJ KRISS NIST NPLI NMISA NIS NIM CMS VMI KIM-LIPI NMIA
Rz
(mic
rom
etre
s)
Laboratories removed: 3KCRV: 2.486 µm ± 0.005 µm
E n =
0.4
0
Serial Number A277 RSm
70
72
74
76
78
80
NMIA NMC NPL PTB SCL NIMT NMIJ KRISS NIST NPLI NMISA NIS NIM CMS VMI KIM-LIPI NMIA
RSm
(mic
rom
etre
s)
Laboratories removed: 3KCRV: 76.28 µm ± 0.076 µm
E n =
0.0
0
APMP.L-K8 report, 10 January 2013 Page 22 of 74

Serial number 7462 Serial Number 7462
9.00
9.50
10.00
10.50
11.00
11.50
12.00
12.50
NMIA NMC NPL PTB SCL NIMT NMIJ KRISS NIST NPLI NMISA NIS NIM CMS VMI KIM-LIPI NMIA
d (m
icro
met
res)
Laboratories removed: 2KCRV: 10.037 µm ± 0.011 µm
E n = 0
.08
Serial number 5276
Serial Number 5276 Ra
0.16
0.18
0.20
0.22
0.24
0.26
0.28
NMIA NMC NPL PTB SCL NIMT NMIJ KRISS NIST NPLI NMISA NIS NIM CMS VMI KIM-LIPI NMIA
Ra
(mic
rom
etre
s)
Laboratories removed: 0KCRV: 0.223 µm ± 0.002 µm
E n = 0
.16
Serial Number 5276 Rq
0.20
0.22
0.24
0.26
0.28
0.30
0.32
0.34
NMIA NMC NPL PTB SCL NIMT NMIJ KRISS NIST NPLI NMISA NIS NIM CMS VMI KIM-LIPI NMIA
Rq
(mic
rom
etre
s)
Laboratories removed: 0KCRV: 0.271 µm ± 0.002 µm
E n = 0
.17
APMP.L-K8 report, 10 January 2013 Page 23 of 74
Serial Number 5276 Rz
1.20
1.30
1.40
1.50
1.60
1.70
1.80
NMIA NMC NPL PTB SCL NIMT NMIJ KRISS NIST NPLI NMISA NIS NIM CMS VMI KIM-LIPI NMIA
Rz
(mic
rom
etre
s)
Laboratories removed: 2KCRV: 1.452 µm ± 0.013 µm
E n = 0
.09
Serial Number 5276 Rp
0.60
0.65
0.70
0.75
0.80
0.85
0.90
NMIA NMC NPL PTB SCL NIMT NMIJ KRISS NIST NPLI NMISA NIS NIM CMS VMI KIM-LIPI NMIA
Rp
(mic
rom
etre
s)
Laboratories removed: 3KCRV: 0.700 µm ± 0.008 µm
E n = 0
.02
Serial Number 5276 Rv
0.60
0.65
0.70
0.75
0.80
0.85
0.90
0.95
1.00
NMIA NMC NPL PTB SCL NIMT NMIJ KRISS NIST NPLI NMISA NIS NIM CMS VMI KIM-LIPI NMIA
Rv
(mic
rom
etre
s)
Laboratories removed: 3KCRV: 0.764 µm ± 0.012 µm
E n = 0
.06
APMP.L-K8 report, 10 January 2013 Page 24 of 74

Serial Number 5276 Rt
1.40
1.50
1.60
1.70
1.80
1.90
2.00
NMIA NMC NPL PTB SCL NIMT NMIJ KRISS NIST NPLI NMISA NIS NIM CMS VMI KIM-LIPI NMIA
Rt
(mic
rom
etre
s)
Laboratories removed: 0KCRV: 1.673 µm ± 0.019 µm
E n = 0
.26
Serial Number 5276 Rsk
-0.40
-0.30
-0.20
-0.10
0.00
0.10
0.20
0.30
NMIA NMC NPL PTB SCL NIMT NMIJ KRISS NIST NPLI NMISA NIS NIM CMS VMI KIM-LIPI NMIA
Rsk
(dim
ensi
onle
ss)
Laboratories removed: 1KCRV: -0.062 ± 0.010
E n = 0
.03
Serial Number 5276 Rku
1.00
1.50
2.00
2.50
3.00
3.50
4.00
NMIA NMC NPL PTB SCL NIMT NMIJ KRISS NIST NPLI NMISA NIS NIM CMS VMI KIM-LIPI NMIA
Rku
(dim
ensi
onle
ss)
Laboratories removed: 0KCRV: 2.594 ± 0.018
E n = 0
.53
APMP.L-K8 report, 10 January 2013 Page 25 of 74
Serial Number 5276 Rk
0.65
0.70
0.75
0.80
0.85
0.90
NMIA NMC NPL PTB SCL NIMT NMIJ KRISS NIST NPLI NMISA NIS NIM CMS VMI KIM-LIPI NMIA
Rk
(mic
rom
etre
s)Laboratories removed: 0KCRV: 0.771 µm ± 0.009 µm
E n = 0
.39
Serial Number 5276 Rpk
0.14
0.16
0.18
0.20
0.22
0.24
0.26
0.28
NMIA NMC NPL PTB SCL NIMT NMIJ KRISS NIST NPLI NMISA NIS NIM CMS VMI KIM-LIPI NMIA
Rpk
(mic
rom
etre
s)
Laboratories removed: 0KCRV: 0.203 µm ± 0.006 µm
E n = 0
.12
Serial Number 5276 Rvk
0.15
0.20
0.25
0.30
0.35
NMIA NMC NPL PTB SCL NIMT NMIJ KRISS NIST NPLI NMISA NIS NIM CMS VMI KIM-LIPI NMIA
Rvk
(mic
rom
etre
s)
Laboratories removed: 0KCRV: 0.231 µm ± 0.005 µm
E n = 0
.03
APMP.L-K8 report, 10 January 2013 Page 26 of 74
Serial Number 5276 Mr1
4.00
5.00
6.00
7.00
8.00
9.00
10.00
NMIA NMC NPL PTB SCL NIMT NMIJ KRISS NIST NPLI NMISA NIS NIM CMS VMI KIM-LIPI NMIA
Mr1
(%)
Laboratories removed: 0KCRV: 6.76% ± 0.13%
E n = 0
.15
Serial Number 5276 Mr2
86.00
88.00
90.00
92.00
94.00
96.00
NMIA NMC NPL PTB SCL NIMT NMIJ KRISS NIST NPLI NMISA NIS NIM CMS VMI KIM-LIPI NMIA
Mr2
(%)
Laboratories removed: 1KCRV: 90.54% ± 0.24%
NM
IA fi
nal r
esul
t not
mea
sure
d
Serial number 5256
Serial Number 5256 Ra
1.40
1.50
1.60
1.70
1.80
1.90
NMIA NMC NPL PTB SCL NIMT NMIJ KRISS NIST NPLI NMISA NIS NIM CMS VMI KIM-LIPI NMIA
Ra
(mic
rom
etre
s)
Laboratories removed: 2KCRV: 1.659 µm ± 0.007 µm
E n = 0
.62
APMP.L-K8 report, 10 January 2013 Page 27 of 74

Serial Number 5256 Rq
1.80
1.90
2.00
2.10
2.20
NMIA NMC NPL PTB SCL NIMT NMIJ KRISS NIST NPLI NMISA NIS NIM CMS VMI KIM-LIPI NMIA
Rq
(mic
rom
etre
s)
Laboratories removed: 2KCRV: 2.018 µm ± 0.007 µm
E n = 0
.60
Serial Number 5256 Rz
7.00
7.50
8.00
8.50
9.00
9.50
10.00
10.50
11.00
NMIA NMC NPL PTB SCL NIMT NMIJ KRISS NIST NPLI NMISA NIS NIM CMS VMI KIM-LIPI NMIA
Rz
(mic
rom
etre
s)
Laboratories removed: 4KCRV: 8.055 µm ± 0.042 µm
E n = 0
.72
Serial Number 5256 Rp
2.50
3.00
3.50
4.00
4.50
NMIA NMC NPL PTB SCL NIMT NMIJ KRISS NIST NPLI NMISA NIS NIM CMS VMI KIM-LIPI NMIA
Rp
(mic
rom
etre
s)
Laboratories removed: 3KCRV: 2.871 µm ± 0.018 µm
E n = 0
.36
APMP.L-K8 report, 10 January 2013 Page 28 of 74

Serial Number 5256 Rv
4.00
4.50
5.00
5.50
6.00
6.50
7.00
7.50
8.00
NMIA NMC NPL PTB SCL NIMT NMIJ KRISS NIST NPLI NMISA NIS NIM CMS VMI KIM-LIPI NMIA
Rv
(mic
rom
etre
s)
Laboratories removed: 4KCRV: 5.186 µm ± 0.031 µm
E n = 0
.70
Serial Number 5256 Rt
7.00
8.00
9.00
10.00
11.00
12.00
13.00
NMIA NMC NPL PTB SCL NIMT NMIJ KRISS NIST NPLI NMISA NIS NIM CMS VMI KIM-LIPI NMIA
Rt
(mic
rom
etre
s)
Laboratories removed: 3KCRV: 10.434 µm ± 0.043 µm
E n = 0
.86
Serial Number 5256 Rsk
-1.20
-1.00
-0.80
-0.60
-0.40
-0.20
0.00
NMIA NMC NPL PTB SCL NIMT NMIJ KRISS NIST NPLI NMISA NIS NIM CMS VMI KIM-LIPI NMIA
Rsk
(dim
ensi
onle
ss)
Laboratories removed: 2KCRV: -0.813 ± 0.018
E n = 0
.10
APMP.L-K8 report, 10 January 2013 Page 29 of 74

Serial Number 5256 Rku
0.50
1.50
2.50
3.50
4.50
NMIA NMC NPL PTB SCL NIMT NMIJ KRISS NIST NPLI NMISA NIS NIM CMS VMI KIM-LIPI NMIA
Rku
(dim
ensi
onle
ss)
Laboratories removed: 5KCRV: 2.724 ± 0.028
E n = 0
.19
Serial Number 5256 Rk
2.00
3.00
4.00
5.00
6.00
NMIA NMC NPL PTB SCL NIMT NMIJ KRISS NIST NPLI NMISA NIS NIM CMS VMI KIM-LIPI NMIA
Rk
(mic
rom
etre
s)
Laboratories removed: 2KCRV: 4.151 µm ± 0.038 µm
E n = 1
.18
Serial Number 5256 Rpk
-0.40
-0.20
0.00
0.20
0.40
0.60
0.80
1.00
NMIA NMC NPL PTB SCL NIMT NMIJ KRISS NIST NPLI NMISA NIS NIM CMS VMI KIM-LIPI NMIA
Rpk
(mic
rom
etre
s)
Laboratories removed: 0KCRV: 0.266 µm ± 0.017 µm
E n = 0
.04
APMP.L-K8 report, 10 January 2013 Page 30 of 74

Serial Number 5256 Rvk
2.00
2.50
3.00
3.50
4.00
NMIA NMC NPL PTB SCL NIMT NMIJ KRISS NIST NPLI NMISA NIS NIM CMS VMI KIM-LIPI NMIA
Rvk
(mic
rom
etre
s)
Laboratories removed: 3KCRV: 3.386 µm ± 0.031 µm
E n = 0
.92
Serial Number 5256 Mr1
0.00
2.00
4.00
6.00
8.00
NMIA NMC NPL PTB SCL NIMT NMIJ KRISS NIST NPLI NMISA NIS NIM CMS VMI KIM-LIPI NMIA
Mr1
(%)
Laboratories removed as outliers: 0KCRV: 2.56% ± 0.22%KIM-LIPI result of 3.4% ± 0.17% excluded from analysis due to unrealistic uncertainty. KRISS result of 25.4% ± 4.0% excluded due to significant difference from all others.
E n = 0
.02
Serial Number 5256 Mr2
74.00
76.00
78.00
80.00
82.00
84.00
NMIA NMC NPL PTB SCL NIMT NMIJ KRISS NIST NPLI NMISA NIS NIM CMS VMI KIM-LIPI NMIA
Mr2
(%)
Laboratories removed: 1KCRV: 77.76% ± 0.44%
E n = 0
.03
APMP.L-K8 report, 10 January 2013 Page 31 of 74

Serial number 1286
Serial Number 1286 Ra
2.90
2.95
3.00
3.05
3.10
3.15
3.20
3.25
3.30
NMIA NMC NPL PTB SCL NIMT NMIJ KRISS NIST NPLI NMISA NIS NIM CMS VMI KIM-LIPI NMIA
Ra
(mic
rom
etre
s)
Laboratories removed: 1KCRV: 3.106 µm ± 0.003 µm
E n = 0
.54
Serial Number 1286 Rz
9.00
9.20
9.40
9.60
9.80
10.00
10.20
10.40
NMIA NMC NPL PTB SCL NIMT NMIJ KRISS NIST NPLI NMISA NIS NIM CMS VMI KIM-LIPI NMIA
Rz
(mic
rom
etre
s)
Laboratories removed: 1KCRV: 9.817 µm ± 0.010 µm
E n = 0
.80
Serial Number 1286 RSm
92.00
94.00
96.00
98.00
100.00
102.00
104.00
NMIA NMC NPL PTB SCL NIMT NMIJ KRISS NIST NPLI NMISA NIS NIM CMS VMI KIM-LIPI NMIA
RSm
(mic
rom
etre
s)
Laboratories removed: 2KCRV: 99.16 µm ± 0.016 µm
E n = 0
.00
APMP.L-K8 report, 10 January 2013 Page 32 of 74

APMP.L-K8 report, 10 January 2013 Page 33 of 74
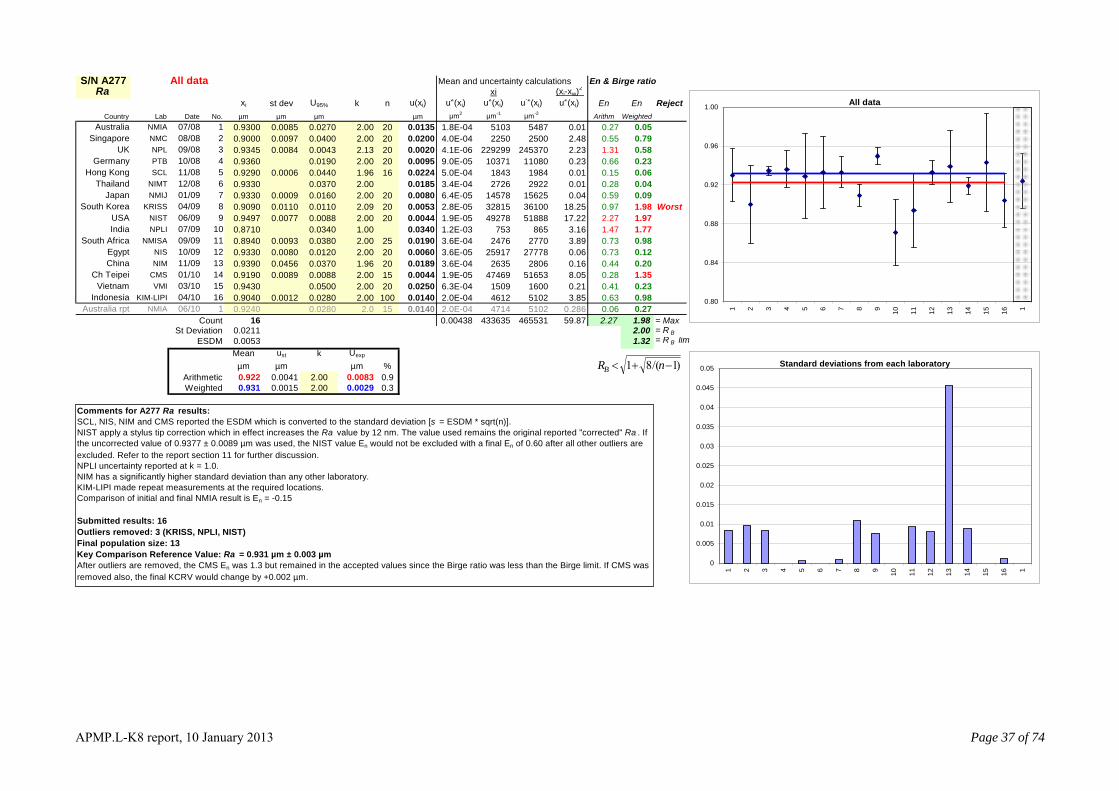
Appendix C. Full reported results Each laboratory submitted results using the Appendix C form in the protocol. These results were transcribed into the analysis spreadsheets to statistically determine and remove outliers from the parameter population using the En and Birge limit method. Values listed for standard deviation and number of measurements (n) are for information only and are not used in calculations. Standard deviations are shown in graphs for a comparison of each laboratory’s measurement variation. Some laboratories reported the Estimated Standard Deviation of the Mean (EDSM). These are adjusted to the standard deviations using that laboratories reported number of measurements, n, in the formula s = ESDM * √n. Only the full submitted results are shown with the initial En ratios which are calculated from each laboratory result, the mean KCRV result and associated uncertainties at a confidence interval of 95%. En ratios above 1.0 are highlighted in red. Note that the order of outlier removal may be different to that implied by the initial En magnitudes. As each outlier is removed, the KCRV will change, therefore each laboratory En will change. Each iteration for outlier removal is not shown with the order of outlier removal listed in the text. The coverage factor, k, of mean values is assumed to be from a large population which is consistent with the reported coverage factor for each laboratory. Arithmetic mean calculations are for information only. The arithmetic mean of all results is shown on the upper graph as a red line. Weighted mean of all results are shown on the graph as a blue line. Where the Birge ratio is greater than the Birge limit, the laboratory with the worst result (largest En > 1) based on the weighted mean is excluded and all values recalculated. Subsequent iterations are not shown. Refer to the page on each parameter for additional comments particular to that parameter.

S/N A277 All data Mean and uncertainty calculations En & Birge ratio2 Groove A (xxi i-xw)
xi st dev U95% k n u(xi) u2(xi) u2(xi) u-2(xi) u2(xi) En En RejectCountry Lab Date No. µm µm µm µm µm2 µm-1 µm-2 Arithm Weighted Arithmentic Mean Weighted Mean
Australia NMIA 07/08 1 0.3820 0.0006 0.0070 2.00 5 0.0035 1.2E-05 31184 81633 0.06 0.392 0.399 0.406 0.382 0.383 0.384 Singapore NMC 08/08 2 0.4000 0.0012 0.0400 2.00 5 0.0200 4.0E-04 1000 2500 0.73 0.392 0.399 0.406 0.382 0.383 0.384
UK NPL 09/08 3 0.3825 0.0009 0.0017 2.09 5 0.0008 6.6E-07 578131 1511453 0.20 0.392 0.399 0.406 0.382 0.383 0.384 Germany PTB 10/08 4 0.3840 0.0100 2.18 5 0.0046 2.1E-05 18249 47524 0.06 0.392 0.399 0.406 0.382 0.383 0.384
Hong Kong SCL 11/08 5 0.392 0.399 0.406 0.382 0.383 0.384Thailand NIMT 12/08 6 0.3870 0.0022 0.0047 2.00 5 0.0024 5.5E-06 69780 180309 3.09 0.392 0.399 0.406 0.382 0.383 0.384
Japan NMIJ 01/09 7 0.3820 0.0003 0.0070 2.00 5 0.0035 1.2E-05 31184 81633 0.06 0.392 0.399 0.406 0.382 0.383 0.384South Korea KRISS 04/09 8 0.3860 0.0150 0.0210 2.78 5 0.0076 5.7E-05 6765 17525 0.17 0.392 0.399 0.406 0.382 0.383 0.384
USA NIST 06/09 9 0.3824 0.0005 0.0019 2.00 9 0.0010 9.0E-07 423712 1108033 0.23 0.392 0.399 0.406 0.382 0.383 0.384India NPLI 07/09 10 0.392 0.399 0.406 0.382 0.383 0.384
South Africa NMISA 09/09 11 0.3816 0.0100 0.0150 2.00 5 0.0075 5.6E-05 6784 17778 0.03 0.392 0.399 0.406 0.382 0.383 0.384Egypt NIS 10/09 12 0.3840 0.0060 0.0290 2.00 5 0.0145 2.1E-04 1826 4756 0.01 0.392 0.399 0.406 0.382 0.383 0.384China NIM 11/09 13 0.3800 0.0042 0.0340 1.96 5 0.0173 3.0E-04 1263 3323 0.03 0.392 0.399 0.406 0.382 0.383 0.384
Ch Teipei CMS 01/10 14 0.3825 0.0005 0.0050 2.00 20 0.0025 6.3E-06 61200 160000 0.02 0.392 0.399 0.406 0.382 0.383 0.384Vietnam VMI 03/10 15 0.5620 0.0600 2.00 5 0.0300 9.0E-04 624 1111 35.66 0.392 0.399 0.406 0.382 0.383 0.384
Indonesia KIM-LIPI 04/10 16 0.4110 0.0018 0.0250 2.00 25 0.0125 1.6E-04 2630 6400 5.07 0.392 0.399 0.406 0.382 0.383 0.384Australia rpt NMIA 06/10 1 0.3810 0.0041 0.0240 2.00 6 0.0120 1.4E-04 2646 6944 0.024 0.392 0.399 0.406 0.382 0.383 0.384
Count 14 0.00214 1234332 3223978 45.42 = MaxSt Deviation 0.0477 1.8
1.77
2.431.26
1.491.77
2.42
1.07
2.002.70 2.99 Worst
1.12
0.120.02 0.43
0.180.11
0.860.12
0.59 0.150.21
0.080.51 0.040.55 0.08
0.07
0.460.73 0.082.70 2.99
7 = R BESDM 0.0127 1.34 = R B lim
Mean ust k Uexp
µm µm µm %Arithmetic 0.0033 2.00 1.7Weighted 0.383 0.0006 2.00 0.0011 0.3
0.399 0.0066
All data
0.30
0.35
0.40
0.45
0.50
0.55
0.60
0.65
1 2 3 4 5 6 7 8 9 10 11 12 13 14 15 16 1
)1/(81 −+< nRBStandard deviations from each laboratory
0
0.002
0.004
0.006
0.008
0.01
0.012
0.014
0.016
1 2 3 4 5 6 7 8 9 10 11 12 13 14 15 16 1
Comments for A277 groove A results:No results given for SCL and NPLI.VMI and KIM-LIPI report Pt instead of d. Both of these results are higher than the reference value.NIMT, NIS, NIM and CMS reported the ESDM which is converted to the standard deviation [s = ESDM * sqrt(n)]. KRISS and NMISA have larger standard deviations than other laboratories.CMS and KIM-LIPI made repeat measurements at the required locations.Comparison of initial and final NMIA result is En = -0.04
Submitted results: 14Outliers removed: 1 (VMI)Final population size: 13Key Comparison Reference Value: d = 0.383 µm ± 0.001 µmAfter outliers are removed, the KIM-LIPI En was 1.1 but remained in the accepted values since the Birge ratio was less than the Birge limit. If KIM-LIPI was removed also, the final KCRV does not change.
APMP.L-K8 report, 10 January 2013 Page 34 of 74

S/N A277 All data Mean and uncertainty calculations En & Birge ratio2 Groove B (xxi i-xw)
xi st dev U95% k n u(xi) u2(xi) u2(xi) u-2(xi) u2(xi) En En RejectCountry Lab Date No. µm µm µm µm µm2 µm-1 µm-2 Arithm Weighted Arithmentic Mean Weighted Mean
Australia NMIA 07/08 1 2.8250 0.0047 0.0180 2.00 5 0.0090 8.1E-05 34877 12346 1.09 2.883 2.910 2.936 2.832 2.834 2.837 Singapore NMC 08/08 2 2.8300 0.0061 0.1000 2.00 5 0.0500 2.5E-03 1132 400 0.01 2.883 2.910 2.936 2.832 2.834 2.837
UK NPL 09/08 3 2.8360 0.0036 0.0050 2.65 5 0.0019 3.6E-06 796632 280900 0.72 2.883 2.910 2.936 2.832 2.834 2.837 Germany PTB 10/08 4 2.8340 0.0100 2.21 5 0.0045 2.0E-05 138415 48841 0.01 2.883 2.910 2.936 2.832 2.834 2.837
Hong Kong SCL 11/08 5 2.883 2.910 2.936 2.832 2.834 2.837Thailand NIMT 12/08 6 2.8350 0.0067 0.0170 2.00 5 0.0085 7.2E-05 39239 13841 0.00 2.883 2.910 2.936 2.832 2.834 2.837
Japan NMIJ 01/09 7 2.8330 0.0002 0.0100 2.00 5 0.0050 2.5E-05 113320 40000 0.08 2.883 2.910 2.936 2.832 2.834 2.837South Korea KRISS 04/09 8 2.8410 0.0340 0.0560 2.78 5 0.0201 4.1E-04 7001 2464 0.11 2.883 2.910 2.936 2.832 2.834 2.837
USA NIST 06/09 9 2.8336 0.0030 0.0076 2.00 9 0.0038 1.4E-05 196233 69252 0.04 2.883 2.910 2.936 2.832 2.834 2.837India NPLI 07/09 10 3.3510 0.1340 1.00 0.1340 1.8E-02 187 56 14.86 2.883 2.910 2.936 2.832 2.834 2.837
South Africa NMISA 09/09 11 2.8502 0.0130 0.0620 2.00 5 0.0310 9.6E-04 2966 1041 0.26 2.883 2.910 2.936 2.832 2.834 2.837Egypt NIS 10/09 12 2.7990 0.0050 0.0600 2.00 5 0.0300 9.0E-04 3110 1111 1.39 2.883 2.910 2.936 2.832 2.834 2.837China NIM 11/09 13 2.8340 0.0076 0.0350 1.96 5 0.0179 3.2E-04 8887 3136 0.00 2.883 2.910 2.936 2.832 2.834 2.837
Ch Teipei CMS 01/10 14 2.8300 0.0033 0.0100 2.00 20 0.0050 2.5E-05 113200 40000 0.77 2.883 2.910 2.936 2.832 2.834 2.837Vietnam VMI 03/10 15 3.5420 0.2500 2.00 5 0.1250 1.6E-02 227 64 32.04 2.883 2.910 2.936 2.832 2.834 2.837
Indonesia KIM-LIPI 04/10 16 2.7700 0.0230 0.0510 2.00 25 0.0255 6.5E-04 4260 1538 6.38 2.883 2.910 2.936 2.832 2.834 2.837Australia rpt NMIA 06/10 1 2.8360 0.0036 0.0280 2.0 6 0.0140 2.0E-04 14469 5102 0.013 2.883 2.910 2.936 2.832 2.834 2.837
Count 15 0.03956 1459686 514989 57.77 = MaxSt Deviation 0.2218 2.03 = R B
E
2.64
2.732.67
2.372.701.112.753.23 3.85 Worst
1.691.722.812.52 2.832.43 1.261.913.23
0.520.77 0.04
0.280.04
0.030.130.120.10
0.88 0.250.590.010.42
0.063.85
SDM 0.0573 1.33 = R B limMean ust k Uexp
µm µm µm %Arithmetic 0.0133 2.00 0.9Weighted 2.834 0.0014 2.00 0.0028 0.1
2.910 0.0265
All data
2.50
2.70
2.90
3.10
3.30
3.50
3.70
3.90
1 2 3 4 5 6 7 8 9 10 11 12 13 14 15 16 1
)1/(81 −+< nRBStandard deviations from each laboratory
0
0.005
0.01
0.015
0.02
0.025
0.03
0.035
0.04
1 2 3 4 5 6 7 8 9 10 11 12 13 14 15 16 1
Comments for A277 groove B results:No result given for SCL.NPLI, VMI and KIM-LIPI report Pt instead of d.NIMT, NIS, NIM and SCL reported the ESDM which is converted to the standard deviation [s = ESDM * sqrt(n)]. NPLI uncertainty reported at k = 1.0.KRISS and KIM-LIPI have larger random surface variation than other laboratories.CMS and KIM-LIPI made repeat measurements at the required locations.Comparison of initial and final NMIA result is En = 0.33
Submitted results: 15Outliers removed: 2 (NPLI, VMI)Final population size: 13Key Comparison Reference Value: d = 2.834 µm ± 0.003 µmAfter outliers are removed, the KIM-LIPI En was 1.2 but remained in the accepted values since the Birge ratio was less than the Birge limit. If Indonesia was removed also, the final KCRV does not change.
APMP.L-K8 report, 10 January 2013 Page 35 of 74

S/N 7462 All data Mean and uncertainty calculations En & Birge ratio2 Groove xi (xi-xw)
xi st dev U95% k n u(xi) u2(xi) u2(xi) u-2(xi) u2(xi) En En RejectCountry Lab Date No. µm µm µm µm µm2 µm-1 µm-2 Arithm Weighted Arithmentic Mean Weighted Mean
Australia NMIA 07/08 1 10.032 0.0176 0.050 2.00 15 0.0250 6.3E-04 16051 1600 0.20 10.081 10.152 10.223 10.032 10.043 10.054 Singapore NMC 08/08 2 10.020 0.0122 0.400 2.00 5 0.2000 4.0E-02 251 25 0.01 10.081 10.152 10.223 10.032 10.043 10.054
UK NPL 09/08 3 10.040 0.0198 0.026 2.87 5 0.0091 8.2E-05 122335 12185 0.12 10.081 10.152 10.223 10.032 10.043 10.054 Germany PTB 10/08 4 10.041 0.025 2.18 5 0.0115 1.3E-04 76350 7604 0.04 10.081 10.152 10.223 10.032 10.043 10.054
Hong Kong SCL 11/08 5 10.081 10.152 10.223 10.032 10.043 10.054Thailand NIMT 12/08 6 10.040 0.0268 0.064 2.00 5 0.0320 1.0E-03 9805 977 0.01 10.081 10.152 10.223 10.032 10.043 10.054
Japan NMIJ 01/09 7 10.039 0.0082 0.051 2.00 5 0.0255 6.5E-04 15439 1538 0.03 10.081 10.152 10.223 10.032 10.043 10.054South Korea KRISS 04/09 8 10.030 0.0430 0.100 2.00 5 0.0500 2.5E-03 4012 400 0.07 10.081 10.152 10.223 10.032 10.043 10.054
USA NIST 06/09 9 10.040 0.0222 0.031 2.00 8 0.0155 2.4E-04 41790 4162 0.04 10.081 10.152 10.223 10.032 10.043 10.054India NPLI 07/09 10 11.515 0.460 1.00 15 0.4600 2.1E-01 54 5 10.24 10.081 10.152 10.223 10.032 10.043 10.054
South Africa NMISA 09/09 11 10.032 0.0190 0.205 2.00 5 0.1025 1.1E-02 955 95 0.01 10.081 10.152 10.223 10.032 10.043 10.054Egypt NIS 10/09 12 10.033 0.0420 0.092 2.00 5 0.0460 2.1E-03 4741 473 0.05 10.081 10.152 10.223 10.032 10.043 10.054China NIM 11/09 13 10.047 0.0590 0.064 1.96 5 0.0327 1.1E-03 9423 938 0.01 10.081 10.152 10.223 10.032 10.043 10.054
Ch Teipei CMS 01/10 14 10.017 0.0275 0.034 2.00 20 0.0170 2.9E-04 34661 3460 2.37 10.081 10.152 10.223 10.032 10.043 10.054Vietnam VMI 03/10 15 10.349 0.080 2.00 5 0.0400 1.6E-03 6468 625 58.45 10.081 10.152 10.223 10.032 10.043 10.054
Indonesia KIM-LIPI 04/10 16 10.005 0.1727 0.222 2.00 25 0.1110 1.2E-02 812 81 0.12 10.081 10.152 10.223 10.032 10.043 10.054Australia rpt NMIA 06/10 1 10.038 0.0248 0.052 2.00 6 0.0260 6.8E-04 14849 1479 0.040 10.081 10.152 10.223 10.032 10.043 10.054
Count 15 0.28475 343147 34167.1 71.78 = MaxSt Deviation 0.3860 2.2
1.38
1.481.47
1.171.29
1.442.93 3.20
1.021.101.711.84 3.79 Worst
1.292.93
0.220.32 0.06
0.110.08
0.050.08
0.99 0.130.10
0.55 0.060.110.060.73
0.63 0.170.103.79
6 = R BESDM 0.0997 1.33 = R B lim
Mean ust k Uexp
µm µm µm %Arithmetic 0.0356 2.00 0.7Weighted 10.043 0.0054 2.00 0.0108 0.1
10.152 0.0711
All data
9.50
10.00
10.50
11.00
11.50
12.00
12.50
1 2 3 4 5 6 7 8 9 10 11 12 13 14 15 16 1
)1/(81 −+< nRBStandard deviations from each laboratory
0
0.02
0.04
0.06
0.08
0.1
0.12
0.14
0.16
0.18
0.2
1 2 3 4 5 6 7 8 9 10 11 12 13 14 15 16 1
Comments for 7462 groove results:No results given for SCL.NPLI, VMI and KIM-LIPI report Pt instead of d . Two of these results are significantly higher than the reference value.NIMT, NIS, NIM and CMS reported the ESDM which is converted to the standard deviation [s = ESDM * sqrt(n)]. NPLI uncertainty reported at k = 1.0.KIM-LIPI has a larger standard deviation than other laboratories.NPLI, CMS and KIM-LIPI made repeat measurements at the required locations.Comparison of initial and final NMIA result is En = 0.08.
Submitted results: 15Outliers removed: 2 (VMI, NPLI)Final population size: 13Key Comparison Reference Value: d = 10.037 µm ± 0.011 µm
APMP.L-K8 report, 10 January 2013 Page 36 of 74
S/N A277 All data Mean and uncertainty calculations En & Birge ratio2 Ra xi (xi-xw)
xi st dev U95% k n u(xi) u2(xi) u2(xi) u-2(xi) u2(xi) En En RejectCountry Lab Date No. µm µm µm µm µm2 µm-1 µm-2 Arithm Weighted Arithmentic Mean Weighted Mean
Australia NMIA 07/08 1 0.9300 0.0085 0.0270 2.00 20 0.0135 1.8E-04 5103 5487 0.01 0.914 0.922 0.931 0.929 0.931 0.934 Singapore NMC 08/08 2 0.9000 0.0097 0.0400 2.00 20 0.0200 4.0E-04 2250 2500 2.48 0.914 0.922 0.931 0.929 0.931 0.934
UK NPL 09/08 3 0.9345 0.0084 0.0043 2.13 20 0.0020 4.1E-06 229299 245370 2.23 0.914 0.922 0.931 0.929 0.931 0.934 Germany PTB 10/08 4 0.9360 0.0190 2.00 20 0.0095 9.0E-05 10371 11080 0.23 0.914 0.922 0.931 0.929 0.931 0.934
Hong Kong SCL 11/08 5 0.9290 0.0006 0.0440 1.96 16 0.0224 5.0E-04 1843 1984 0.01 0.914 0.922 0.931 0.929 0.931 0.934Thailand NIMT 12/08 6 0.9330 0.0370 2.00 0.0185 3.4E-04 2726 2922 0.01 0.914 0.922 0.931 0.929 0.931 0.934
Japan NMIJ 01/09 7 0.9330 0.0009 0.0160 2.00 20 0.0080 6.4E-05 14578 15625 0.04 0.914 0.922 0.931 0.929 0.931 0.934South Korea KRISS 04/09 8 0.9090 0.0110 0.0110 2.09 20 0.0053 2.8E-05 32815 36100 18.25 0.914 0.922 0.931 0.929 0.931 0.934
USA NIST 06/09 9 0.9497 0.0077 0.0088 2.00 20 0.0044 1.9E-05 49278 51888 17.22 0.914 0.922 0.931 0.929 0.931 0.934India NPLI 07/09 10 0.8710 0.0340 1.00 0.0340 1.2E-03 753 865 3.16 0.914 0.922 0.931 0.929 0.931 0.934
South Africa NMISA 09/09 11 0.8940 0.0093 0.0380 2.00 25 0.0190 3.6E-04 2476 2770 3.89 0.914 0.922 0.931 0.929 0.931 0.934Egypt NIS 10/09 12 0.9330 0.0080 0.0120 2.00 20 0.0060 3.6E-05 25917 27778 0.06 0.914 0.922 0.931 0.929 0.931 0.934China NIM 11/09 13 0.9390 0.0456 0.0370 1.96 20 0.0189 3.6E-04 2635 2806 0.16 0.914 0.922 0.931 0.929 0.931 0.934
Ch Teipei CMS 01/10 14 0.9190 0.0089 0.0088 2.00 15 0.0044 1.9E-05 47469 51653 8.05 0.914 0.922 0.931 0.929 0.931 0.934Vietnam VMI 03/10 15 0.9430 0.0500 2.00 20 0.0250 6.3E-04 1509 1600 0.21 0.914 0.922 0.931 0.929 0.931 0.934
Indonesia KIM-LIPI 04/10 16 0.9040 0.0012 0.0280 2.00 100 0.0140 2.0E-04 4612 5102 3.85 0.914 0.922 0.931 0.929 0.931 0.934Australia rpt NMIA 06/10 1 0.9240 0.0280 2.0 15 0.0140 2.0E-04 4714 5102 0.286 0.914 0.922 0.931 0.929 0.931 0.934
Count 16 0.00438 433635 465531 59.87 = MaxSt Deviation 0.0211 2.00 = R B
E
0.27 0.050.55 0.79
0.580.66 0.230.15 0.060.28 0.040.59 0.090.97
0.73 0.980.73 0.120.44 0.200.280.41 0.230.63 0.980.06 0.272.27 1.98
1.31
1.98 Worst2.27 1.971.47 1.77
1.35
SDM 0.0053 1.32 = R B limMean ust k Uexp
µm µm µm %Arithmetic 0.0041 2.00 0.9Weighted 0.931 0.0015 2.00 0.0029 0.3
0.922 0.0083
All data
0.80
0.84
0.88
0.92
0.96
1.00
1 2 3 4 5 6 7 8 9 10 11 12 13 14 15 16 1
)1/(81 −+< nRBStandard deviations from each laboratory
0
0.005
0.01
0.015
0.02
0.025
0.03
0.035
0.04
0.045
0.05
1 2 3 4 5 6 7 8 9 10 11 12 13 14 15 16 1
Comments for A277 Ra results:SCL, NIS, NIM and CMS reported the ESDM which is converted to the standard deviation [s = ESDM * sqrt(n)]. NIST apply a stylus tip correction which in effect increases the Ra value by 12 nm. The value used remains the original reported "corrected" Ra . If the uncorrected value of 0.9377 ± 0.0089 µm was used, the NIST value En would not be excluded with a final En of 0.60 after all other outliers are excluded. Refer to the report section 11 for further discussion. NPLI uncertainty reported at k = 1.0.NIM has a significantly higher standard deviation than any other laboratory.KIM-LIPI made repeat measurements at the required locations.Comparison of initial and final NMIA result is En = -0.15
Submitted results: 16Outliers removed: 3 (KRISS, NPLI, NIST)Final population size: 13Key Comparison Reference Value: Ra = 0.931 µm ± 0.003 µmAfter outliers are removed, the CMS En was 1.3 but remained in the accepted values since the Birge ratio was less than the Birge limit. If CMS was removed also, the final KCRV would change by +0.002 µm.
APMP.L-K8 report, 10 January 2013 Page 37 of 74

S/N A277 All data Mean and uncertainty calculations En & Birge ratio2 Rz xi (xi-xw)
xi st dev U95% k n u(xi) u2(xi) u2(xi) u-2(xi) u2(xi) En En RejectCountry Lab Date No. µm µm µm µm µm2 µm-1 µm-2 Arithm Weighted Arithmentic Mean Weighted Mean
Australia NMIA 07/08 1 2.5210 0.0150 0.0470 2.00 20 0.0235 5.5E-04 4565 1811 2.78 2.534 2.558 2.582 2.477 2.482 2.487 Singapore NMC 08/08 2 2.5000 0.0605 0.1000 2.00 20 0.0500 2.5E-03 1000 400 0.13 2.534 2.558 2.582 2.477 2.482 2.487
UK NPL 09/08 3 2.4850 0.0108 0.0060 2.13 20 0.0028 7.9E-06 313172 126025 1.29 2.534 2.558 2.582 2.477 2.482 2.487 Germany PTB 10/08 4 2.4900 0.0500 2.00 20 0.0250 6.3E-04 3984 1600 0.11 2.534 2.558 2.582 2.477 2.482 2.487
Hong Kong SCL 11/08 5 2.5100 0.0051 0.1200 1.96 16 0.0612 3.7E-03 670 267 0.21 2.534 2.558 2.582 2.477 2.482 2.487Thailand NIMT 12/08 6 2.4970 0.1180 2.00 0.0590 3.5E-03 717 287 0.07 2.534 2.558 2.582 2.477 2.482 2.487
Japan NMIJ 01/09 7 2.4930 0.0021 0.0610 2.00 20 0.0305 9.3E-04 2680 1075 0.13 2.534 2.558 2.582 2.477 2.482 2.487South Korea KRISS 04/09 8 2.5060 0.0230 0.0260 2.09 20 0.0124 1.5E-04 16193 6462 3.79 2.534 2.558 2.582 2.477 2.482 2.487
USA NIST 06/09 9 2.4790 0.0156 0.0570 2.00 20 0.0285 8.1E-04 3052 1231 0.01 2.534 2.558 2.582 2.477 2.482 2.487India NPLI 07/09 10 3.0880 0.1340 1.00 0.1340 1.8E-02 172 56 20.47 2.534 2.558 2.582 2.477 2.482 2.487
South Africa NMISA 09/09 11 3.0390 0.0410 0.1078 2.00 25 0.0539 2.9E-03 1046 344 106.87 2.534 2.558 2.582 2.477 2.482 2.487Egypt NIS 10/09 12 2.4620 0.0290 0.0660 2.00 20 0.0330 1.1E-03 2261 918 0.36 2.534 2.558 2.582 2.477 2.482 2.487China NIM 11/09 13 2.4910 0.0778 0.0490 1.96 20 0.0250 6.3E-04 3986 1600 0.14 2.534 2.558 2.582 2.477 2.482 2.487
Ch Teipei CMS 01/10 14 2.4820 0.0128 0.0180 2.00 15 0.0090 8.1E-05 30642 12346 0.00 2.534 2.558 2.582 2.477 2.482 2.487Vietnam VMI 03/10 15 2.5200 0.0750 2.00 20 0.0375 1.4E-03 1792 711 1.04 2.534 2.558 2.582 2.477 2.482 2.487
Indonesia KIM-LIPI 04/10 16 2.3700 0.0143 0.0440 4.00 100 0.0110 1.2E-04 19587 8264 103.29 2.534 2.558 2.582 2.477 2.482 2.487Australia rpt NMIA 06/10 1 2.5480 0.0185 0.0480 2.00 15 0.0240 5.8E-04 4424 1736 7.609 2.534 2.558 2.582 2.477 2.482 2.487
Count 16 0.037 405518 163397 240.69 = MaxSt Deviation 0.2004 4.01 = R B
E
0.71 0.830.57 0.18
0.410.16
0.39 0.230.51 0.131.00 0.18
0.910.05
0.300.190.01
0.49 0.51
0.194.35
2.961.23
1.481.283.89 4.524.35 5.16 Worst1.371.232.54
3.76 2.521.375.16
SDM 0.0501 1.32 = R B limMean ust k Uexp
µm µm µm %Arithmetic 0.0120 2.00 0.9Weighted 2.482 0.0025 2.00 0.0049 0.2
2.558 0.0240
All data
2.00
2.20
2.40
2.60
2.80
3.00
3.20
3.40
1 2 3 4 5 6 7 8 9 10 11 12 13 14 15 16 1
)1/(81 −+< nRBStandard deviations from each laboratory
0
0.01
0.02
0.03
0.04
0.05
0.06
0.07
0.08
0.09
1 2 3 4 5 6 7 8 9 10 11 12 13 14 15 16 1
Comments for A277 Rz results:NMC A*Star reports Ry instead of Rz.SCL, NIS, NIM and CMS reported the ESDM which is converted to the standard deviation [s = ESDM * sqrt(n)]. NPLI uncertainty reported at k = 1.0.NIM and NMC A*Star have higher standard deviations than any other laboratory.KIM-LIPI made repeat measurements at the required locations.Comparison of initial and final NMIA result is En = 0.40
Submitted results: 16Outliers removed: 3 (NMISA, NPLI, KIM-LIPI)Final population size: 13Key Comparison Reference Value: Ra = 2.486 µm ± 0.005 µm
APMP.L-K8 report, 10 January 2013 Page 38 of 74

S/N A277 All data Mean and uncertainty calculations En & Birge ratio2 RSm xi (xi-xw)
xi st dev U95% k n u(xi) u2(xi) u2(xi) u-2(xi) u2(xi) En En RejectCountry Lab Date No. µm µm µm µm µm2 µm-1 µm-2 Arithm Weighted Arithmentic Mean Weighted Mean
Australia NMIA 07/08 1 76.200 0.1070 1.000 2.00 20 0.5000 2.5E-01 305 4 0.00 75.069 75.599 76.130 76.160 76.235 76.309 Singapore NMC 08/08 2 76.270 0.1812 2.000 2.00 20 1.0000 1.0E+00 76 1 0.00 75.069 75.599 76.130 76.160 76.235 76.309
UK NPL 09/08 3 76.351 0.2594 0.125 2.15 20 0.0581 3.4E-03 22588 296 3.99 75.069 75.599 76.130 76.160 76.235 76.309 Germany PTB 10/08 4 76.270 0.250 2.13 20 0.1174 1.4E-02 5536 73 0.09 75.069 75.599 76.130 76.160 76.235 76.309
Hong Kong SCL 11/08 5 75.069 75.599 76.130 76.160 76.235 76.309Thailand NIMT 12/08 6 76.340 1.450 2.00 0.7250 5.3E-01 145 2 0.02 75.069 75.599 76.130 76.160 76.235 76.309
Japan NMIJ 01/09 7 76.176 0.0648 0.208 2.00 20 0.1040 1.1E-02 7043 92 0.32 75.069 75.599 76.130 76.160 76.235 76.309South Korea KRISS 04/09 8 75.050 1.2230 0.570 2.09 20 0.2727 7.4E-02 1009 13 18.87 75.069 75.599 76.130 76.160 76.235 76.309
USA NIST 06/09 9 76.230 0.3508 0.160 2.00 20 0.0800 6.4E-03 11911 156 0.00 75.069 75.599 76.130 76.160 76.235 76.309India NPLI 07/09 10 76.500 3.060 1.00 3.0600 9.4E+00 8 0 0.01 75.069 75.599 76.130 76.160 76.235 76.309
South Africa NMISA 09/09 11 74.300 1.5559 2.710 2.00 25 1.3550 1.8E+00 40 1 2.04 75.069 75.599 76.130 76.160 76.235 76.309Egypt NIS 10/09 12 74.661 0.1475 0.801 2.00 20 0.4005 1.6E-01 465 6 15.44 75.069 75.599 76.130 76.160 76.235 76.309China NIM 11/09 13 75.200 5.4600 2.400 1.96 20 1.2245 1.5E+00 50 1 0.71 75.069 75.599 76.130 76.160 76.235 76.309
Ch Teipei CMS 01/10 14 76.310 0.4790 0.240 2.00 20 0.1200 1.4E-02 5299 69 0.39 75.069 75.599 76.130 76.160 76.235 76.309Vietnam VMI 03/10 15 76.150 1.500 2.00 20 0.7500 5.6E-01 135 2 0.01 75.069 75.599 76.130 76.160 76.235 76.309
Indonesia KIM-LIPI 04/10 16 71.980 0.3152 1.420 2.00 100 0.7100 5.0E-01 143 2 35.91 75.069 75.599 76.130 76.160 76.235 76.309Australia rpt NMIA 06/10 1 76.200 0.0002 1.00 2.00 15 0.5000 2.5E-01 305 4 0.005 75.069 75.599 76.130 76.160 76.235 76.309
Count 15 15.8248 54755 718.242 77.83 = MaxSt Deviation 1.2205 2.3
0.53 0.030.32 0.02
0.800.13
0.48 0.070.27
0.710.03
0.29 0.090.47 0.710.980.16 0.43
0.300.35 0.06
0.53 0.032.39 2.99
1.381.14
1.012.06
1.14
1.96
1.22
2.39 2.99 Worst
6 = R BESDM 0.3151 1.33 = R B lim
Mean ust k Uexp
µm µm µm %Arithmetic 0.2652 2.00 0.7Weighted 76.235 0.0373 2.00 0.0746 0.1
75.599 0.5304
All data
70.00
72.00
74.00
76.00
78.00
80.00
1 2 3 4 5 6 7 8 9 10 11 12 13 14 15 16 1
)1/(81 −+< nRBStandard deviations from each laboratory
0
1
2
3
4
5
6
1 2 3 4 5 6 7 8 9 10 11 12 13 14 15 16 1
Comments for A277 RSm results:No result given for SCL.NMC A*Star reports Sm instead of RSm.NIS, NIM and CMS reported the ESDM which is converted to the standard deviation [s = ESDM * sqrt(n)]. NPLI uncertainty reported at k = 1.0.NIM has a higher standard deviation than any other laboratory.KIM-LIPI made repeat measurements at the required locations.Comparison of initial and final NMIA result is En = 0.00
Submitted results: 15Outliers removed: 3 (KIM-LIPI, KRISS, NIS)Final population size: 12Key Comparison Reference Value: RSm = 76.28 µm ± 0.076 µm
APMP.L-K8 report, 10 January 2013 Page 39 of 74

S/N 5276 All data Mean and uncertainty calculations En & Birge ratio2 Ra xi (xi-xw)
xi st dev U95% k n u(xi) u2(xi) u2(xi) u-2(xi) u2(xi) En En RejectCountry Lab Date No. µm µm µm µm µm2 µm-1 µm-2 Arithm Weighted Arithmentic Mean Weighted Mean
Australia NMIA 07/08 1 0.2250 0.0110 0.0220 2.00 12 0.0110 1.2E-04 1860 8264 0.02 0.217 0.223 0.228 0.222 0.223 0.225 Singapore NMC 08/08 2 0.2200 0.0011 0.0300 2.00 12 0.0150 2.3E-04 978 4444 0.05 0.217 0.223 0.228 0.222 0.223 0.225
UK NPL 09/08 3 0.2234 0.0014 0.0016 2.05 12 0.0008 6.1E-07 366734 1641602 0.00 0.217 0.223 0.228 0.222 0.223 0.225 Germany PTB 10/08 4 0.2250 0.0050 2.00 12 0.0025 6.3E-06 36000 160000 0.39 0.217 0.223 0.228 0.222 0.223 0.225
Hong Kong SCL 11/08 5 0.217 0.223 0.228 0.222 0.223 0.225Thailand NIMT 12/08 6 0.2240 0.0020 0.0120 2.00 12 0.0060 3.6E-05 6222 27778 0.01 0.217 0.223 0.228 0.222 0.223 0.225
Japan NMIJ 01/09 7 0.2240 0.0002 0.0080 2.00 12 0.0040 1.6E-05 14000 62500 0.02 0.217 0.223 0.228 0.222 0.223 0.225South Korea KRISS 04/09 8 0.2230 0.0060 0.0080 2.20 12 0.0036 1.3E-05 16864 75625 0.01 0.217 0.223 0.228 0.222 0.223 0.225
USA NIST 06/09 9 0.2255 0.0014 0.0075 2.00 12 0.0038 1.4E-05 16036 71111 0.30 0.217 0.223 0.228 0.222 0.223 0.225India NPLI 07/09 10 0.2210 0.0080 1.00 12 0.0080 6.4E-05 3453 15625 0.09 0.217 0.223 0.228 0.222 0.223 0.225
South Africa NMISA 09/09 11 0.2220 0.0988 0.0170 2.00 13 0.0085 7.2E-05 3073 13841 0.03 0.217 0.223 0.228 0.222 0.223 0.225Egypt NIS 10/09 12 0.2220 0.0030 0.0090 2.00 12 0.0045 2.0E-05 10963 49383 0.10 0.217 0.223 0.228 0.222 0.223 0.225China NIM 11/09 13 0.2250 0.0048 0.0320 1.96 12 0.0163 2.7E-04 844 3752 0.01 0.217 0.223 0.228 0.222 0.223 0.225
Ch Teipei CMS 01/10 14 0.2223 0.0009 0.0050 2.00 12 0.0025 6.3E-06 35568 160000 0.21 0.217 0.223 0.228 0.222 0.223 0.225Vietnam VMI 03/10 15 0.2200 0.0500 2.00 12 0.0250 6.3E-04 352 1600 0.02 0.217 0.223 0.228 0.222 0.223 0.225
Indonesia KIM-LIPI 04/10 16 0.2180 0.0030 0.0250 2.00 60 0.0125 1.6E-04 1395 6400 0.19 0.217 0.223 0.228 0.222 0.223 0.225Australia rpt NMIA 06/10 1 0.2300 0.0019 0.0230 2.00 12 0.0115 1.3E-04 1739 7561 0.325 0.217 0.223 0.228 0.222 0.223 0.225
Count 15 0.00164 514341 2301924 1.46 = MaxSt Deviation 0.0022 0.3
0.10 0.070.09 0.110.13 0.020.32 0.30
0.10 0.050.14 0.070.03 0.050.31 0.270.17 0.300.04 0.080.06 0.160.07 0.050.05 0.220.05 0.070.18 0.220.31 0.280.32 0.30
Worst
2 = R BESDM 0.0006 1.33 = R B lim
Mean ust k Uexp
µm µm µm %Arithmetic 0.0027 2.00 2.4Weighted 0.223 0.0007 2.00 0.0013 0.6
0.223 0.0054
All data
0.14
0.16
0.18
0.20
0.22
0.24
0.26
0.28
0.30
1 2 3 4 5 6 7 8 9 10 11 12 13 14 15 16 1
)1/(81 −+< nRBStandard deviations from each laboratory
0
0.02
0.04
0.06
0.08
0.1
0.12
1 2 3 4 5 6 7 8 9 10 11 12 13 14 15 16 1
Comments for 5276 Ra results:SCL did not submit a result.NIS, NIM and CMS reported the ESDM which is converted to the standard deviation [s = ESDM * sqrt(n)]. NPLI uncertainty reported at k = 1.0.KIM-LIPI repeated the measurement set 5 times.NMISA has a significantly higher standard deviation than any other laboratory.Comparison of initial and final NMIA result is En = 0.16.
Submitted results: 15Outliers removed: 0Final population size: 15Key Comparison Reference Value: Ra = 0.223 µm ± 0.002 µm
APMP.L-K8 report, 10 January 2013 Page 40 of 74

S/N 5276 All data Mean and uncertainty calculations En & Birge ratio2 Rq xi (xi-xw)
xi st dev U95% k n u(xi) u2(xi) u2(xi) u-2(xi) u2(xi) En En RejectCountry Lab Date No. µm µm µm µm µm2 µm-1 µm-2 Arithm Weighted Arithmentic Mean Weighted Mean
Australia NMIA 07/08 1 0.2730 0.0015 0.0250 2.00 12 0.0125 1.6E-04 1747 6400 0.02 0.264 0.270 0.275 0.270 0.271 0.273 Singapore NMC 08/08 2 0.2600 0.0013 0.0300 2.00 12 0.0150 2.3E-04 1156 4444 0.54 0.264 0.270 0.275 0.270 0.271 0.273
UK NPL 09/08 3 0.2710 0.0019 0.0018 2.06 12 0.0009 7.6E-07 354943 1309753 0.01 0.264 0.270 0.275 0.270 0.271 0.273 Germany PTB 10/08 4 0.2730 0.0050 2.00 12 0.0025 6.3E-06 43680 160000 0.59 0.264 0.270 0.275 0.270 0.271 0.273
Hong Kong SCL 11/08 5 0.264 0.270 0.275 0.270 0.271 0.273Thailand NIMT 12/08 6 0.2720 0.0020 0.0120 2.00 12 0.0060 3.6E-05 7556 27778 0.02 0.264 0.270 0.275 0.270 0.271 0.273
Japan NMIJ 01/09 7 0.2720 0.0001 0.0080 2.00 12 0.0040 1.6E-05 17000 62500 0.05 0.264 0.270 0.275 0.270 0.271 0.273South Korea KRISS 04/09 8 0.2700 0.0080 0.0080 2.20 12 0.0036 1.3E-05 20419 75625 0.09 0.264 0.270 0.275 0.270 0.271 0.273
USA NIST 06/09 9 0.2739 0.0016 0.0095 2.00 12 0.0048 2.3E-05 12140 44321 0.35 0.264 0.270 0.275 0.270 0.271 0.273India NPLI 07/09 10 0.2740 0.0100 1.00 12 0.0100 1.0E-04 2740 10000 0.09 0.264 0.270 0.275 0.270 0.271 0.273
South Africa NMISA 09/09 11 0.2730 0.0067 0.0190 2.00 13 0.0095 9.0E-05 3025 11080 0.04 0.264 0.270 0.275 0.270 0.271 0.273Egypt NIS 10/09 12 0.2690 0.0030 0.0110 2.00 12 0.0055 3.0E-05 8893 33058 0.14 0.264 0.270 0.275 0.270 0.271 0.273China NIM 11/09 13 0.2730 0.0048 0.0320 1.96 12 0.0163 2.7E-04 1024 3752 0.01 0.264 0.270 0.275 0.270 0.271 0.273
Ch Teipei CMS 01/10 14 0.2698 0.0010 0.0051 2.00 12 0.0026 6.5E-06 41492 153787 0.25 0.264 0.270 0.275 0.270 0.271 0.273Vietnam VMI 03/10 15 0.2650 0.0500 2.00 12 0.0250 6.3E-04 424 1600 0.06 0.264 0.270 0.275 0.270 0.271 0.273
Indonesia KIM-LIPI 04/10 16 0.2570 0.0031 0.0250 2.00 60 0.0125 1.6E-04 1645 6400 1.27 0.264 0.270 0.275 0.270 0.271 0.273Australia rpt NMIA 06/10 1 0.2790 0.0020 0.0250 2.00 12 0.0125 1.6E-04 1786 6400 0.402 0.264 0.270 0.275 0.270 0.271 0.273
Count 15 0.00175 517882 1910498 3.55 = MaxSt Deviation 0.0051 0.50 = R B
E
0.13 0.080.32 0.370.22 0.030.44 0.37
0.17 0.080.23 0.110.03 0.130.38 0.290.37 0.290.17 0.100.06 0.190.10 0.060.01 0.240.09 0.120.50 0.560.36 0.320.50 0.56
Worst
SDM 0.0013 1.33 = R B limMean ust k Uexp
µm µm µm %Arithmetic 0.0028 2.00 2.1Weighted 0.271 0.0007 2.00 0.0014 0.5
0.270 0.0056
All data
0.20
0.22
0.24
0.26
0.28
0.30
0.32
0.34
1 2 3 4 5 6 7 8 9 10 11 12 13 14 15 16 1
)1/(81 −+< nRBStandard deviations from each laboratory
0
0.001
0.002
0.003
0.004
0.005
0.006
0.007
0.008
0.009
1 2 3 4 5 6 7 8 9 10 11 12 13 14 15 16 1
Comments for 5276 Rq results:SCL did not submit a result.NIS, NIM and CMS reported the ESDM which is converted to the standard deviation [s = ESDM * sqrt(n)]. NPLI uncertainty reported at k = 1.0.KIM-LIPI repeated the measurement set 5 times.KRISS and NMISA have significantly higher standard deviations than any other laboratory.Comparison of initial and final NMIA result is En = 0.17.
Submitted results: 15Outliers removed: 0Final population size: 15Key Comparison Reference Value: Rq = 0.271 µm ± 0.002 µm
APMP.L-K8 report, 10 January 2013 Page 41 of 74
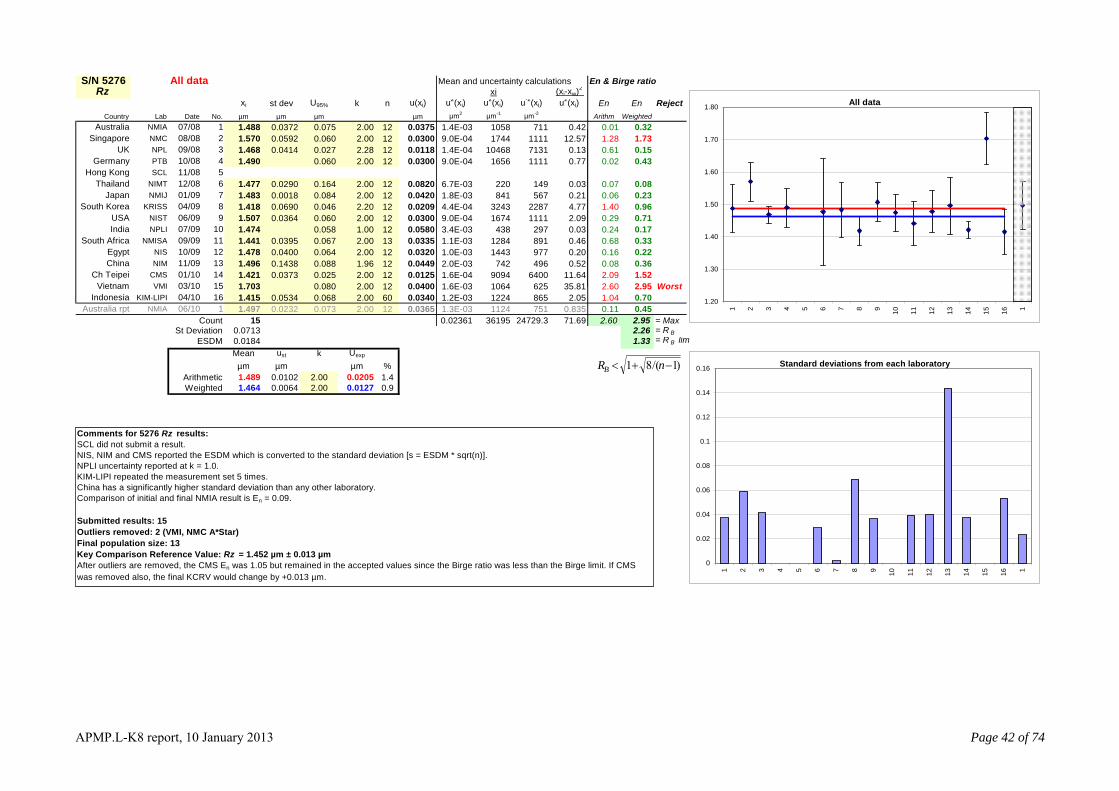
S/N 5276 All data Mean and uncertainty calculations En & Birge ratio2 Rz xi (xi-xw)
xi st dev U95% k n u(xi) u2(xi) u2(xi) u-2(xi) u2(xi) En En RejectCountry Lab Date No. µm µm µm µm µm2 µm-1 µm-2 Arithm Weighted Arithmentic Mean Weighted Mean
Australia NMIA 07/08 1 1.488 0.0372 0.075 2.00 12 0.0375 1.4E-03 1058 711 0.42 1.468 1.489 1.509 1.451 1.464 1.476 Singapore NMC 08/08 2 1.570 0.0592 0.060 2.00 12 0.0300 9.0E-04 1744 1111 12.57 1.468 1.489 1.509 1.451 1.464 1.476
UK NPL 09/08 3 1.468 0.0414 0.027 2.28 12 0.0118 1.4E-04 10468 7131 0.13 1.468 1.489 1.509 1.451 1.464 1.476 Germany PTB 10/08 4 1.490 0.060 2.00 12 0.0300 9.0E-04 1656 1111 0.77 1.468 1.489 1.509 1.451 1.464 1.476
Hong Kong SCL 11/08 5 1.468 1.489 1.509 1.451 1.464 1.476Thailand NIMT 12/08 6 1.477 0.0290 0.164 2.00 12 0.0820 6.7E-03 220 149 0.03 1.468 1.489 1.509 1.451 1.464 1.476
Japan NMIJ 01/09 7 1.483 0.0018 0.084 2.00 12 0.0420 1.8E-03 841 567 0.21 1.468 1.489 1.509 1.451 1.464 1.476South Korea KRISS 04/09 8 1.418 0.0690 0.046 2.20 12 0.0209 4.4E-04 3243 2287 4.77 1.468 1.489 1.509 1.451 1.464 1.476
USA NIST 06/09 9 1.507 0.0364 0.060 2.00 12 0.0300 9.0E-04 1674 1111 2.09 1.468 1.489 1.509 1.451 1.464 1.476India NPLI 07/09 10 1.474 0.058 1.00 12 0.0580 3.4E-03 438 297 0.03 1.468 1.489 1.509 1.451 1.464 1.476
South Africa NMISA 09/09 11 1.441 0.0395 0.067 2.00 13 0.0335 1.1E-03 1284 891 0.46 1.468 1.489 1.509 1.451 1.464 1.476Egypt NIS 10/09 12 1.478 0.0400 0.064 2.00 12 0.0320 1.0E-03 1443 977 0.20 1.468 1.489 1.509 1.451 1.464 1.476China NIM 11/09 13 1.496 0.1438 0.088 1.96 12 0.0449 2.0E-03 742 496 0.52 1.468 1.489 1.509 1.451 1.464 1.476
Ch Teipei CMS 01/10 14 1.421 0.0373 0.025 2.00 12 0.0125 1.6E-04 9094 6400 11.64 1.468 1.489 1.509 1.451 1.464 1.476Vietnam VMI 03/10 15 1.703 0.080 2.00 12 0.0400 1.6E-03 1064 625 35.81 1.468 1.489 1.509 1.451 1.464 1.476
Indonesia KIM-LIPI 04/10 16 1.415 0.0534 0.068 2.00 60 0.0340 1.2E-03 1224 865 2.05 1.468 1.489 1.509 1.451 1.464 1.476Australia rpt NMIA 06/10 1 1.497 0.0232 0.073 2.00 12 0.0365 1.3E-03 1124 751 0.835 1.468 1.489 1.509 1.451 1.464 1.476
Count 15 0.02361 36195 24729.3 71.69 = MaxSt Deviation 0.0713 2.2
0.01 0.32
0.61 0.150.02 0.43
0.07 0.080.06 0.23
0.960.29 0.710.24 0.170.68 0.330.16 0.220.08 0.36
0.700.11 0.452.60 2.95
1.28 1.73
1.40
2.09 1.522.60 2.95 Worst1.04
6 = R BESDM 0.0184 1.33 = R B lim
Mean ust k Uexp
µm µm µm %Arithmetic 0.0102 2.00 1.4Weighted 1.464 0.0064 2.00 0.0127 0.9
1.489 0.0205
All data
1.20
1.30
1.40
1.50
1.60
1.70
1.80
1 2 3 4 5 6 7 8 9 10 11 12 13 14 15 16 1
)1/(81 −+< nRBStandard deviations from each laboratory
0
0.02
0.04
0.06
0.08
0.1
0.12
0.14
0.16
1 2 3 4 5 6 7 8 9 10 11 12 13 14 15 16 1
Comments for 5276 Rz results:SCL did not submit a result.NIS, NIM and CMS reported the ESDM which is converted to the standard deviation [s = ESDM * sqrt(n)]. NPLI uncertainty reported at k = 1.0.KIM-LIPI repeated the measurement set 5 times.China has a significantly higher standard deviation than any other laboratory.Comparison of initial and final NMIA result is En = 0.09.
Submitted results: 15Outliers removed: 2 (VMI, NMC A*Star)Final population size: 13Key Comparison Reference Value: Rz = 1.452 µm ± 0.013 µmAfter outliers are removed, the CMS En was 1.05 but remained in the accepted values since the Birge ratio was less than the Birge limit. If CMS was removed also, the final KCRV would change by +0.013 µm.
APMP.L-K8 report, 10 January 2013 Page 42 of 74
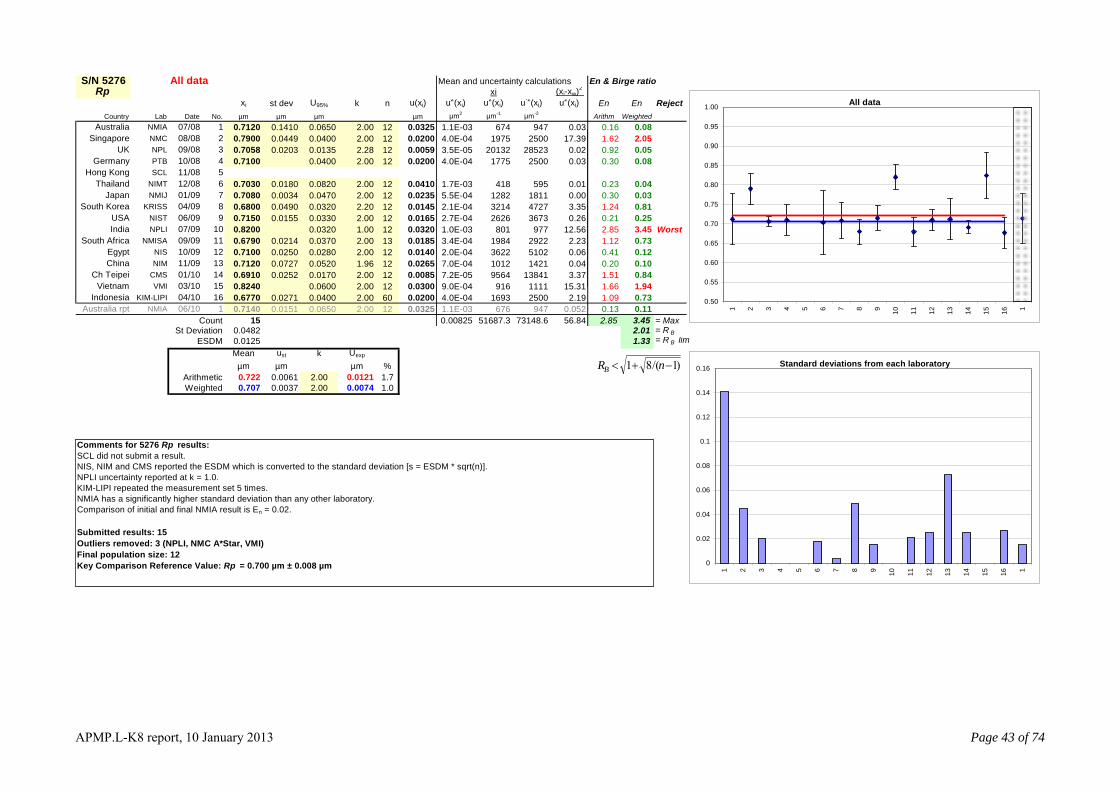
S/N 5276 All data Mean and uncertainty calculations En & Birge ratio2 Rp xi (xi-xw)
xi st dev U95% k n u(xi) u2(xi) u2(xi) u-2(xi) u2(xi) En En RejectCountry Lab Date No. µm µm µm µm µm2 µm-1 µm-2 Arithm Weighted Arithmentic Mean Weighted Mean
Australia NMIA 07/08 1 0.7120 0.1410 0.0650 2.00 12 0.0325 1.1E-03 674 947 0.03 0.710 0.722 0.735 0.699 0.707 0.714 Singapore NMC 08/08 2 0.7900 0.0449 0.0400 2.00 12 0.0200 4.0E-04 1975 2500 17.39 0.710 0.722 0.735 0.699 0.707 0.714
UK NPL 09/08 3 0.7058 0.0203 0.0135 2.28 12 0.0059 3.5E-05 20132 28523 0.02 0.710 0.722 0.735 0.699 0.707 0.714 Germany PTB 10/08 4 0.7100 0.0400 2.00 12 0.0200 4.0E-04 1775 2500 0.03 0.710 0.722 0.735 0.699 0.707 0.714
Hong Kong SCL 11/08 5 0.710 0.722 0.735 0.699 0.707 0.714Thailand NIMT 12/08 6 0.7030 0.0180 0.0820 2.00 12 0.0410 1.7E-03 418 595 0.01 0.710 0.722 0.735 0.699 0.707 0.714
Japan NMIJ 01/09 7 0.7080 0.0034 0.0470 2.00 12 0.0235 5.5E-04 1282 1811 0.00 0.710 0.722 0.735 0.699 0.707 0.714South Korea KRISS 04/09 8 0.6800 0.0490 0.0320 2.20 12 0.0145 2.1E-04 3214 4727 3.35 0.710 0.722 0.735 0.699 0.707 0.714
USA NIST 06/09 9 0.7150 0.0155 0.0330 2.00 12 0.0165 2.7E-04 2626 3673 0.26 0.710 0.722 0.735 0.699 0.707 0.714India NPLI 07/09 10 0.8200 0.0320 1.00 12 0.0320 1.0E-03 801 977 12.56 0.710 0.722 0.735 0.699 0.707 0.714
South Africa NMISA 09/09 11 0.6790 0.0214 0.0370 2.00 13 0.0185 3.4E-04 1984 2922 2.23 0.710 0.722 0.735 0.699 0.707 0.714Egypt NIS 10/09 12 0.7100 0.0250 0.0280 2.00 12 0.0140 2.0E-04 3622 5102 0.06 0.710 0.722 0.735 0.699 0.707 0.714China NIM 11/09 13 0.7120 0.0727 0.0520 1.96 12 0.0265 7.0E-04 1012 1421 0.04 0.710 0.722 0.735 0.699 0.707 0.714
Ch Teipei CMS 01/10 14 0.6910 0.0252 0.0170 2.00 12 0.0085 7.2E-05 9564 13841 3.37 0.710 0.722 0.735 0.699 0.707 0.714Vietnam VMI 03/10 15 0.8240 0.0600 2.00 12 0.0300 9.0E-04 916 1111 15.31 0.710 0.722 0.735 0.699 0.707 0.714
Indonesia KIM-LIPI 04/10 16 0.6770 0.0271 0.0400 2.00 60 0.0200 4.0E-04 1693 2500 2.19 0.710 0.722 0.735 0.699 0.707 0.714Australia rpt NMIA 06/10 1 0.7140 0.0151 0.0650 2.00 12 0.0325 1.1E-03 676 947 0.052 0.710 0.722 0.735 0.699 0.707 0.714
Count 15 0.00825 51687.3 73148.6 56.84 = MaxSt Deviation 0.0482 2.01 = R B
E
0.16 0.08
0.92 0.050.30 0.08
0.23 0.040.30 0.03
0.810.21 0.25
0.730.41 0.120.20 0.10
0.84
0.730.13 0.112.85 3.45
1.62 2.05
1.24
2.85 3.45 Worst1.12
1.511.66 1.941.09
SDM 0.0125 1.33 = R B limMean ust k Uexp
µm µm µm %Arithmetic 0.0061 2.00 1.7Weighted 0.707 0.0037 2.00 0.0074 1.0
0.722 0.0121
All data
0.50
0.55
0.60
0.65
0.70
0.75
0.80
0.85
0.90
0.95
1.00
1 2 3 4 5 6 7 8 9 10 11 12 13 14 15 16 1
)1/(81 −+< nRBStandard deviations from each laboratory
0
0.02
0.04
0.06
0.08
0.1
0.12
0.14
0.16
1 2 3 4 5 6 7 8 9 10 11 12 13 14 15 16 1
Comments for 5276 Rp results:SCL did not submit a result.NIS, NIM and CMS reported the ESDM which is converted to the standard deviation [s = ESDM * sqrt(n)]. NPLI uncertainty reported at k = 1.0.KIM-LIPI repeated the measurement set 5 times.NMIA has a significantly higher standard deviation than any other laboratory.Comparison of initial and final NMIA result is En = 0.02.
Submitted results: 15Outliers removed: 3 (NPLI, NMC A*Star, VMI)Final population size: 12Key Comparison Reference Value: Rp = 0.700 µm ± 0.008 µm
APMP.L-K8 report, 10 January 2013 Page 43 of 74

S/N 5276 All data Mean and uncertainty calculations En & Birge ratio2 Rv xi (xi-xw)
xi st dev U95% k n u(xi) u2(xi) u2(xi) u-2(xi) u2(xi) En En RejectCountry Lab Date No. µm µm µm µm µm2 µm-1 µm-2 Arithm Weighted Arithmentic Mean Weighted Mean
Australia NMIA 07/08 1 0.7770 0.0315 0.0660 2.00 12 0.0330 1.1E-03 713 918 0.34 0.765 0.779 0.794 0.749 0.758 0.767 Singapore NMC 08/08 2 0.8400 0.0228 0.0400 2.00 12 0.0200 4.0E-04 2100 2500 16.88 0.765 0.779 0.794 0.749 0.758 0.767
UK NPL 09/08 3 0.7623 0.0324 0.0214 2.28 12 0.0094 8.8E-05 8653 11351 0.23 0.765 0.779 0.794 0.749 0.758 0.767 Germany PTB 10/08 4 0.7900 0.0400 2.00 12 0.0200 4.0E-04 1975 2500 2.59 0.765 0.779 0.794 0.749 0.758 0.767
Hong Kong SCL 11/08 5 0.765 0.779 0.794 0.749 0.758 0.767Thailand NIMT 12/08 6 0.7730 0.0270 0.1120 2.00 12 0.0560 3.1E-03 246 319 0.07 0.765 0.779 0.794 0.749 0.758 0.767
Japan NMIJ 01/09 7 0.7760 0.0020 0.0380 2.00 12 0.0190 3.6E-04 2150 2770 0.91 0.765 0.779 0.794 0.749 0.758 0.767South Korea KRISS 04/09 8 0.7380 0.0620 0.0400 2.20 12 0.0182 3.3E-04 2232 3025 1.19 0.765 0.779 0.794 0.749 0.758 0.767
USA NIST 06/09 9 0.7920 0.0281 0.0560 2.00 12 0.0280 7.8E-04 1010 1276 1.49 0.765 0.779 0.794 0.749 0.758 0.767India NPLI 07/09 10 0.765 0.779 0.794 0.749 0.758 0.767
South Africa NMISA 09/09 11 0.7620 0.0301 0.0450 2.00 13 0.0225 5.1E-04 1505 1975 0.03 0.765 0.779 0.794 0.749 0.758 0.767Egypt NIS 10/09 12 0.7680 0.0310 0.0400 2.00 12 0.0200 4.0E-04 1920 2500 0.26 0.765 0.779 0.794 0.749 0.758 0.767China NIM 11/09 13 0.7840 0.1081 0.0690 1.96 12 0.0352 1.2E-03 633 807 0.55 0.765 0.779 0.794 0.749 0.758 0.767
Ch Teipei CMS 01/10 14 0.7280 0.0212 0.0150 2.00 12 0.0075 5.6E-05 12942 17778 15.82 0.765 0.779 0.794 0.749 0.758 0.767Vietnam VMI 03/10 15 0.8790 0.0600 2.00 12 0.0300 9.0E-04 977 1111 16.31 0.765 0.779 0.794 0.749 0.758 0.767
Indonesia KIM-LIPI 04/10 16 0.7410 0.0221 0.0360 2.00 60 0.0180 3.2E-04 2287 3086 0.87 0.765 0.779 0.794 0.749 0.758 0.767Australia rpt NMIA 06/10 1 0.7830 0.0244 0.0650 2.00 12 0.0325 1.1E-03 741 947 0.600 0.765 0.779 0.794 0.749 0.758 0.767
Count 14 0.01001 39344 51916.5 57.55 = MaxSt Deviation 0.0397 2.10 = R B
E
0.03 0.29
0.66 0.190.25 0.79
0.06 0.140.08 0.470.97 0.480.22 0.60
0.37 0.090.27 0.250.07 0.38
0.99 0.450.06 0.382.48 2.01
1.43 2.01 Worst
2.48 1.721.62 2.00
SDM 0.0106 1.34 = R B limMean ust k Uexp
µm µm µm %Arithmetic 0.0071 2.00 1.8Weighted 0.758 0.0044 2.00 0.0088 1.2
0.779 0.0143
All data
0.60
0.65
0.70
0.75
0.80
0.85
0.90
0.95
1.00
1 2 3 4 5 6 7 8 9 10 11 12 13 14 15 16 1
)1/(81 −+< nRBStandard deviations from each laboratory
0
0.02
0.04
0.06
0.08
0.1
0.12
1 2 3 4 5 6 7 8 9 10 11 12 13 14 15 16 1
Comments for 5276 Rv results:SCL did not submit a result.NIS, NIM and CMS reported the ESDM which is converted to the standard deviation [s = ESDM * sqrt(n)]. NPLI uncertainty reported at k = 1.0.KIM-LIPI repeated the measurement set 5 times.NIM has a significantly higher standard deviation than any other laboratory.Comparison of initial and final NMIA result is En = 0.06.
Submitted results: 14Outliers removed: 3 (NMC A*Star, VMI, CMS)Final population size: 11Key Comparison Reference Value: Rv = 0.764 µm ± 0.012 µm
APMP.L-K8 report, 10 January 2013 Page 44 of 74

S/N 5276 All data Mean and uncertainty calculations En & Birge ratio2 Rt (xxi i-xw)
xi st dev U95% k n u(xi) u2(xi) u2(xi) u-2(xi) u2(xi) En En RejectCountry Lab Date No. µm µm µm µm µm2 µm-1 µm-2 Arithm Weighted Arithmentic Mean Weighted Mean
Australia NMIA 07/08 1 1.695 0.0731 0.100 2.00 12 0.0500 2.5E-03 678 400 0.19 1.647 1.678 1.708 1.655 1.673 1.692 Singapore NMC 08/08 2 1.630 0.0449 0.060 2.00 12 0.0300 9.0E-04 1811 1111 2.07 1.647 1.678 1.708 1.655 1.673 1.692
UK NPL 09/08 3 1.717 0.0663 0.044 2.28 12 0.0193 3.7E-04 4610 2685 5.16 1.647 1.678 1.708 1.655 1.673 1.692 Germany PTB 10/08 4 1.710 0.090 2.00 12 0.0450 2.0E-03 844 494 0.67 1.647 1.678 1.708 1.655 1.673 1.692
Hong Kong SCL 11/08 5 1.647 1.678 1.708 1.655 1.673 1.692Thailand NIMT 12/08 6 1.699 0.0530 0.260 2.00 12 0.1300 1.7E-02 101 59 0.04 1.647 1.678 1.708 1.655 1.673 1.692
Japan NMIJ 01/09 7 1.706 0.0121 0.185 2.00 12 0.0925 8.6E-03 199 117 0.13 1.647 1.678 1.708 1.655 1.673 1.692South Korea KRISS 04/09 8 1.616 0.1270 0.082 2.20 12 0.0373 1.4E-03 1163 720 2.35 1.647 1.678 1.708 1.655 1.673 1.692
USA NIST 06/09 9 1.714 0.0594 0.069 2.00 12 0.0345 1.2E-03 1440 840 1.40 1.647 1.678 1.708 1.655 1.673 1.692India NPLI 07/09 10 1.667 0.066 1.00 12 0.0660 4.4E-03 383 230 0.01 1.647 1.678 1.708 1.655 1.673 1.692
South Africa NMISA 09/09 11 1.624 0.093 2.00 13 0.0465 2.2E-03 751 462 1.12 1.647 1.678 1.708 1.655 1.673 1.692Egypt NIS 10/09 12 1.692 0.0690 0.105 2.00 12 0.0525 2.8E-03 614 363 0.13 1.647 1.678 1.708 1.655 1.673 1.692China NIM 11/09 13 1.720 0.2515 0.150 1.96 12 0.0765 5.9E-03 294 171 0.37 1.647 1.678 1.708 1.655 1.673 1.692
Ch Teipei CMS 01/10 14 1.656 0.0570 0.038 2.00 12 0.0190 3.6E-04 4587 2770 0.82 1.647 1.678 1.708 1.655 1.673 1.692Vietnam VMI 03/10 15 1.703 0.090 2.00 12 0.0450 2.0E-03 841 494 0.44 1.647 1.678 1.708 1.655 1.673 1.692
Indonesia KIM-LIPI 04/10 16 1.617 0.0489 0.065 2.00 60 0.0325 1.1E-03 1531 947 2.99 1.647 1.678 1.708 1.655 1.673 1.692Australia rpt NMIA 06/10 1 1.732 0.0638 0.100 2.00 12 0.0500 2.5E-03 693 400 1.385 1.647 1.678 1.708 1.655 1.673 1.692
Count 15 0.05241 19847.5 11862.3 17.88 = MaxSt Deviation 0.0390 1.13 = R B
E
0.17 0.210.71 0.690.73 0.920.34 0.40
0.08 0.100.15 0.180.71 0.680.48 0.570.15 0.090.55 0.520.13 0.180.28 0.310.45 0.410.27 0.320.85 0.830.52 0.580.85 0.92
Worst
SDM 0.0101 1.33 = R B limMean ust k Uexp
µm µm µm %Arithmetic 0.0153 2.00 1.8Weighted 1.673 0.0092 2.00 0.0184 1.1
1.678 0.0305
All data
1.00
1.20
1.40
1.60
1.80
2.00
2.20
1 2 3 4 5 6 7 8 9 10 11 12 13 14 15 16 1
)1/(81 −+< nRBStandard deviations from each laboratory
0
0.05
0.1
0.15
0.2
0.25
0.3
1 2 3 4 5 6 7 8 9 10 11 12 13 14 15 16 1
Comments for 5276 Rt results:SCL did not submit a result.NIS, NIM and CMS reported the ESDM which is converted to the standard deviation [s = ESDM * sqrt(n)]. NPLI uncertainty reported at k = 1.0.KIM-LIPI repeated the measurement set 5 times.NIM has a significantly higher standard deviation than any other laboratory.Comparison of initial and final NMIA result is En = 0.26.
Submitted results: 15Outliers removed: 0Final population size: 15Key Comparison Reference Value: Rt = 1.673 µm ± 0.019 µm
APMP.L-K8 report, 10 January 2013 Page 45 of 74
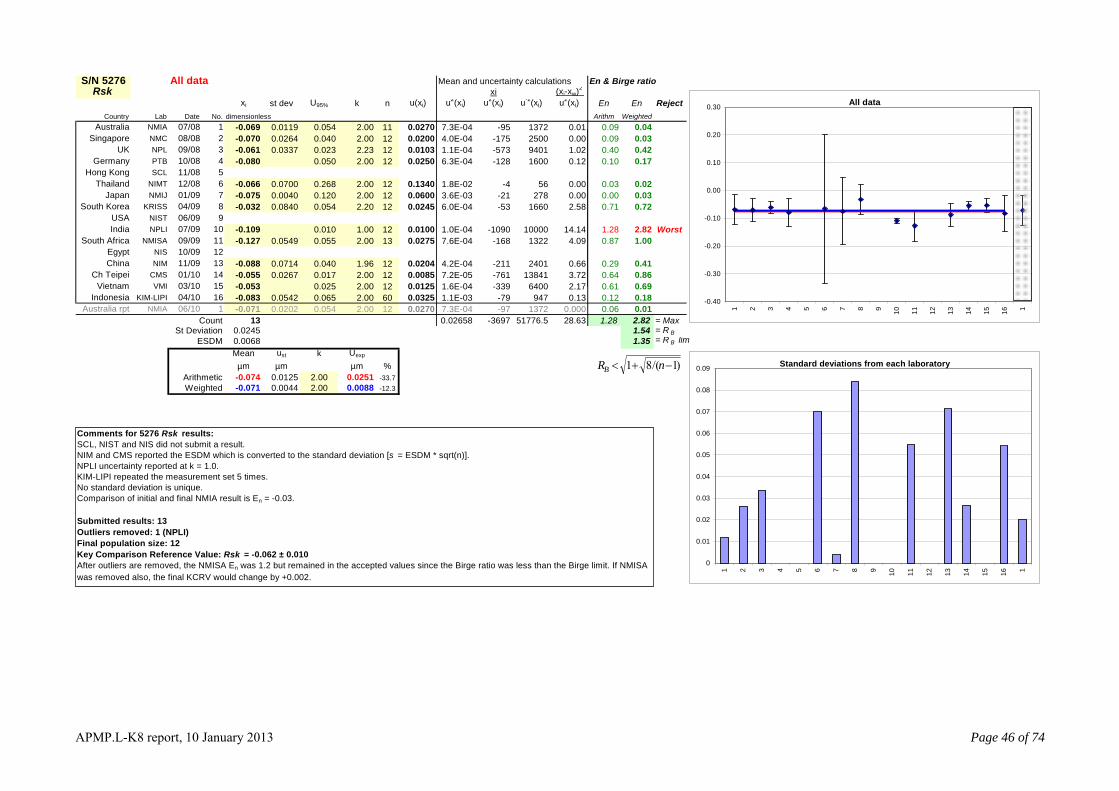
S/N 5276 All data Mean and uncertainty calculations En & Birge ratio2 Rsk (xxi i-xw)
xi st dev U95% k n u(xi) u2(xi) u2(xi) u-2(xi) u2(xi) En En RejectCountry Lab Date No. dimensionless Arithm Weighted Arithmentic Mean Weighted Mean
Australia NMIA 07/08 1 -0.069 0.0119 0.054 2.00 11 0.0270 7.3E-04 -95 1372 0.01 -0.100 -0.074 -0.049 -0.080 -0.071 -0.063 Singapore NMC 08/08 2 -0.070 0.0264 0.040 2.00 12 0.0200 4.0E-04 -175 2500 0.00 -0.100 -0.074 -0.049 -0.080 -0.071 -0.063
UK NPL 09/08 3 -0.061 0.0337 0.023 2.23 12 0.0103 1.1E-04 -573 9401 1.02 -0.100 -0.074 -0.049 -0.080 -0.071 -0.063 Germany PTB 10/08 4 -0.080 0.050 2.00 12 0.0250 6.3E-04 -128 1600 0.12 -0.100 -0.074 -0.049 -0.080 -0.071 -0.063
Hong Kong SCL 11/08 5 -0.100 -0.074 -0.049 -0.080 -0.071 -0.063Thailand NIMT 12/08 6 -0.066 0.0700 0.268 2.00 12 0.1340 1.8E-02 -4 56 0.00 -0.100 -0.074 -0.049 -0.080 -0.071 -0.063
Japan NMIJ 01/09 7 -0.075 0.0040 0.120 2.00 12 0.0600 3.6E-03 -21 278 0.00 -0.100 -0.074 -0.049 -0.080 -0.071 -0.063South Korea KRISS 04/09 8 -0.032 0.0840 0.054 2.20 12 0.0245 6.0E-04 -53 1660 2.58 -0.100 -0.074 -0.049 -0.080 -0.071 -0.063
USA NIST 06/09 9 -0.100 -0.074 -0.049 -0.080 -0.071 -0.063India NPLI 07/09 10 -0.109 0.010 1.00 12 0.0100 1.0E-04 -1090 10000 14.14 -0.100 -0.074 -0.049 -0.080 -0.071 -0.063
South Africa NMISA 09/09 11 -0.127 0.0549 0.055 2.00 13 0.0275 7.6E-04 -168 1322 4.09 -0.100 -0.074 -0.049 -0.080 -0.071 -0.063Egypt NIS 10/09 12 -0.100 -0.074 -0.049 -0.080 -0.071 -0.063China NIM 11/09 13 -0.088 0.0714 0.040 1.96 12 0.0204 4.2E-04 -211 2401 0.66 -0.100 -0.074 -0.049 -0.080 -0.071 -0.063
Ch Teipei CMS 01/10 14 -0.055 0.0267 0.017 2.00 12 0.0085 7.2E-05 -761 13841 3.72 -0.100 -0.074 -0.049 -0.080 -0.071 -0.063Vietnam VMI 03/10 15 -0.053 0.025 2.00 12 0.0125 1.6E-04 -339 6400 2.17 -0.100 -0.074 -0.049 -0.080 -0.071 -0.063
Indonesia KIM-LIPI 04/10 16 -0.083 0.0542 0.065 2.00 60 0.0325 1.1E-03 -79 947 0.13 -0.100 -0.074 -0.049 -0.080 -0.071 -0.063Australia rpt NMIA 06/10 1 -0.071 0.0202 0.054 2.00 12 0.0270 7.3E-04 -97 1372 0.000 -0.100 -0.074 -0.049 -0.080 -0.071 -0.063
Count 13 0.02658 -3697 51776.5 28.63 = MaxSt Deviation 0.0245 1.54 = R B
E
0.09 0.040.09 0.030.40 0.420.10 0.17
0.03 0.020.00 0.030.71 0.72
0.87 1.00
0.29 0.410.64 0.860.61 0.690.12 0.180.06 0.011.28 2.82
1.28 2.82 Worst
SDM 0.0068 1.35 = R B limMean ust k Uexp
µm µm µm %Arithmetic 0.0125 2.00 -33.7Weighted -0.071 0.0044 2.00 0.0088 -12.3
-0.074 0.0251
All data
-0.40
-0.30
-0.20
-0.10
0.00
0.10
0.20
0.30
1 2 3 4 5 6 7 8 9 10 11 12 13 14 15 16 1
)1/(81 −+< nRBStandard deviations from each laboratory
0
0.01
0.02
0.03
0.04
0.05
0.06
0.07
0.08
0.09
1 2 3 4 5 6 7 8 9 10 11 12 13 14 15 16 1
Comments for 5276 Rsk results:SCL, NIST and NIS did not submit a result.NIM and CMS reported the ESDM which is converted to the standard deviation [s = ESDM * sqrt(n)]. NPLI uncertainty reported at k = 1.0.KIM-LIPI repeated the measurement set 5 times.No standard deviation is unique.Comparison of initial and final NMIA result is En = -0.03.
Submitted results: 13Outliers removed: 1 (NPLI)Final population size: 12Key Comparison Reference Value: Rsk = -0.062 ± 0.010After outliers are removed, the NMISA En was 1.2 but remained in the accepted values since the Birge ratio was less than the Birge limit. If NMISA was removed also, the final KCRV would change by +0.002.
APMP.L-K8 report, 10 January 2013 Page 46 of 74

S/N 5276 All data Mean and uncertainty calculations En & Birge ratio2 Rku xi (xi-xw)
xi st dev U95% k n u(xi) u2(xi) u2(xi) u-2(xi) u2(xi) En En RejectCountry Lab Date No. dimensionless Arithm Weighted Arithmentic Mean Weighted Mean
Australia NMIA 07/08 1 2.612 0.0378 0.071 2.00 12 0.0355 1.3E-03 2073 793 0.25 2.539 2.608 2.677 2.576 2.594 2.613 Singapore NMC 08/08 2 2.610 0.0325 0.400 2.00 12 0.2000 4.0E-02 65 25 0.01 2.539 2.608 2.677 2.576 2.594 2.613
UK NPL 09/08 3 2.609 0.0560 0.044 2.09 12 0.0211 4.4E-04 5887 2256 0.48 2.539 2.608 2.677 2.576 2.594 2.613 Germany PTB 10/08 4 2.610 0.050 2.00 12 0.0250 6.3E-04 4176 1600 0.39 2.539 2.608 2.677 2.576 2.594 2.613
Hong Kong SCL 11/08 5 2.539 2.608 2.677 2.576 2.594 2.613Thailand NIMT 12/08 6 2.605 0.0330 0.133 2.00 12 0.0665 4.4E-03 589 226 0.03 2.539 2.608 2.677 2.576 2.594 2.613
Japan NMIJ 01/09 7 2.601 0.0250 0.684 2.00 12 0.3420 1.2E-01 22 9 0.00 2.539 2.608 2.677 2.576 2.594 2.613South Korea KRISS 04/09 8 2.564 0.1060 0.072 2.20 12 0.0327 1.1E-03 2394 934 0.86 2.539 2.608 2.677 2.576 2.594 2.613
USA NIST 06/09 9 2.539 2.608 2.677 2.576 2.594 2.613India NPLI 07/09 10 2.539 2.608 2.677 2.576 2.594 2.613
South Africa NMISA 09/09 11 2.684 0.0697 0.114 2.00 13 0.0570 3.2E-03 826 308 2.47 2.539 2.608 2.677 2.576 2.594 2.613Egypt NIS 10/09 12 2.539 2.608 2.677 2.576 2.594 2.613China NIM 11/09 13 2.630 0.1257 0.071 1.96 12 0.0362 1.3E-03 2004 762 0.96 2.539 2.608 2.677 2.576 2.594 2.613
Ch Teipei CMS 01/10 14 2.562 0.0339 0.038 2.00 12 0.0190 3.6E-04 7097 2770 2.91 2.539 2.608 2.677 2.576 2.594 2.613Vietnam VMI 03/10 15 2.643 0.070 2.00 12 0.0350 1.2E-03 2158 816 1.93 2.539 2.608 2.677 2.576 2.594 2.613
Indonesia KIM-LIPI 04/10 16 2.564 0.0188 0.049 2.00 60 0.0245 6.0E-04 4272 1666 1.54 2.539 2.608 2.677 2.576 2.594 2.613Australia rpt NMIA 06/10 1 2.559 0.0271 0.071 2.00 12 0.0355 1.3E-03 2031 793 0.996 2.539 2.608 2.677 2.576 2.594 2.613
Count 12 0.17153 31562 12165.3 11.82 = MaxSt Deviation 0.0351 1.04 = R B
E
0.04 0.240.01 0.040.01 0.310.03 0.29
0.02 0.080.01 0.010.44 0.41
0.57 0.78
0.22 0.490.58 0.770.36 0.670.52 0.580.49 0.480.58 0.78
Worst
SDM 0.0101 1.36 = R B limMean ust k Uexp
µm µm µm %Arithmetic 0.0345 2.00 2.6Weighted 2.594 0.0091 2.00 0.0181 0.7
2.608 0.0690
All data
1.50
1.70
1.90
2.10
2.30
2.50
2.70
2.90
3.10
3.30
3.50
1 2 3 4 5 6 7 8 9 10 11 12 13 14 15 16 1
)1/(81 −+< nRBStandard deviations from each laboratory
0
0.02
0.04
0.06
0.08
0.1
0.12
0.14
1 2 3 4 5 6 7 8 9 10 11 12 13 14 15 16 1
Comments for 5276 Rku results:SCL, NIST, NPLI and NIS did not submit a result.NIM and CMS reported the ESDM which is converted to the standard deviation [s = ESDM * sqrt(n)]. KIM-LIPI repeated the measurement set 5 times.KRISS and NIM have higher standard deviations than any other laboratory.Comparison of initial and final NMIA result is En = -0.53.
Submitted results: 12Outliers removed: 0Final population size: 12Key Comparison Reference Value: Rku = 2.594 ± 0.018
APMP.L-K8 report, 10 January 2013 Page 47 of 74

S/N 5276 All data Mean and uncertainty calculations En & Birge ratio2 Rk (xxi i-xw)
xi st dev U95% k n u(xi) u2(xi) u2(xi) u-2(xi) u2(xi) En En RejectCountry Lab Date No. µm µm µm µm µm2 µm-1 µm-2 Arithm Weighted Arithmentic Mean Weighted Mean
Australia NMIA 07/08 1 0.777 0.0113 0.024 2.00 12 0.0120 1.4E-04 5396 6944 0.24 0.757 0.770 0.783 0.763 0.771 0.780 Singapore NMC 08/08 2 0.760 0.0233 0.040 2.00 12 0.0200 4.0E-04 1900 2500 0.31 0.757 0.770 0.783 0.763 0.771 0.780
UK NPL 09/08 3 0.757 0.770 0.783 0.763 0.771 0.780 Germany PTB 10/08 4 0.780 0.030 2.00 12 0.0150 2.3E-04 3467 4444 0.35 0.757 0.770 0.783 0.763 0.771 0.780
Hong Kong SCL 11/08 5 0.757 0.770 0.783 0.763 0.771 0.780Thailand NIMT 12/08 6 0.771 0.0110 0.045 2.00 12 0.0225 5.1E-04 1523 1975 0.00 0.757 0.770 0.783 0.763 0.771 0.780
Japan NMIJ 01/09 7 0.775 0.0013 0.035 2.00 12 0.0175 3.1E-04 2531 3265 0.05 0.757 0.770 0.783 0.763 0.771 0.780South Korea KRISS 04/09 8 0.783 0.0430 0.029 2.20 12 0.0132 1.7E-04 4506 5755 0.82 0.757 0.770 0.783 0.763 0.771 0.780
USA NIST 06/09 9 0.757 0.770 0.783 0.763 0.771 0.780India NPLI 07/09 10 0.757 0.770 0.783 0.763 0.771 0.780
South Africa NMISA 09/09 11 0.757 0.770 0.783 0.763 0.771 0.780Egypt NIS 10/09 12 0.757 0.770 0.783 0.763 0.771 0.780China NIM 11/09 13 0.783 0.0294 0.036 1.96 12 0.0184 3.4E-04 2321 2964 0.42 0.757 0.770 0.783 0.763 0.771 0.780
Ch Teipei CMS 01/10 14 0.768 0.0110 0.013 2.00 12 0.0065 4.2E-05 18178 23669 0.22 0.757 0.770 0.783 0.763 0.771 0.780Vietnam VMI 03/10 15 0.764 0.080 2.00 12 0.0400 1.6E-03 478 625 0.03 0.757 0.770 0.783 0.763 0.771 0.780
Indonesia KIM-LIPI 04/10 16 0.736 0.0255 0.039 2.00 60 0.0195 3.8E-04 1936 2630 3.24 0.757 0.770 0.783 0.763 0.771 0.780Australia rpt NMIA 06/10 1 0.793 0.0113 0.033 2.00 12 0.0165 2.7E-04 2913 3673 1.765 0.757 0.770 0.783 0.763 0.771 0.780
Count 10 0.00412 42233.8 54772.2 5.69 = MaxSt Deviation 0.0142 0.79 = R B
E
0.27 0.230.23 0.27
0.32 0.29
0.03 0.000.14 0.110.42 0.39
0.35 0.320.09 0.200.07 0.090.82 0.880.66 0.640.82 0.88
Worst
SDM 0.0045 1.39 = R B limMean ust k Uexp
µm µm µm %Arithmetic 0.0064 2.00 1.7Weighted 0.771 0.0043 2.00 0.0085 1.1
0.770 0.0128
All data
0.65
0.67
0.69
0.71
0.73
0.75
0.77
0.79
0.81
0.83
0.85
1 2 3 4 5 6 7 8 9 10 11 12 13 14 15 16 1
)1/(81 −+< nRBStandard deviations from each laboratory
0
0.005
0.01
0.015
0.02
0.025
0.03
0.035
0.04
0.045
0.05
1 2 3 4 5 6 7 8 9 10 11 12 13 14 15 16 1
Comments for 5276 Rk results:NPL, SCL, NIST, NPLI, NMISA and NIS did not submit a result.NIM and CMS reported the ESDM which is converted to the standard deviation [s = ESDM * sqrt(n)]. KIM-LIPI repeated the measurement set 5 times.KRISS has a higher standard deviation than any other laboratory.Comparison of initial and final NMIA result is En = 0.39.
Submitted results: 10Outliers removed: 0Final population size: 10Key Comparison Reference Value: Rk = 0.771 µm ± 0.009 µm
APMP.L-K8 report, 10 January 2013 Page 48 of 74

S/N 5276 All data Mean and uncertainty calculations En & Birge ratio2 Rpk (xxi i-xw)
xi st dev U95% k n u(xi) u2(xi) u2(xi) u-2(xi) u2(xi) En En RejectCountry Lab Date No. µm µm µm µm µm2 µm-1 µm-2 Arithm Weighted Arithmentic Mean Weighted Mean
Australia NMIA 07/08 1 0.2030 0.0074 0.024 2.00 12 0.0120 1.4E-04 1410 6944 0.00 0.197 0.207 0.216 0.197 0.203 0.209 Singapore NMC 08/08 2 0.2200 0.0119 0.030 2.00 12 0.0150 2.3E-04 978 4444 1.24 0.197 0.207 0.216 0.197 0.203 0.209
UK NPL 09/08 3 0.197 0.207 0.216 0.197 0.203 0.209 Germany PTB 10/08 4 0.2020 0.014 2.00 12 0.0070 4.9E-05 4122 20408 0.03 0.197 0.207 0.216 0.197 0.203 0.209
Hong Kong SCL 11/08 5 0.197 0.207 0.216 0.197 0.203 0.209Thailand NIMT 12/08 6 0.2060 0.0080 0.041 2.00 12 0.0205 4.2E-04 490 2380 0.02 0.197 0.207 0.216 0.197 0.203 0.209
Japan NMIJ 01/09 7 0.2010 0.0021 0.027 2.00 12 0.0135 1.8E-04 1103 5487 0.03 0.197 0.207 0.216 0.197 0.203 0.209South Korea KRISS 04/09 8 0.2010 0.0280 0.019 2.20 12 0.0086 7.5E-05 2695 13407 0.07 0.197 0.207 0.216 0.197 0.203 0.209
USA NIST 06/09 9 0.197 0.207 0.216 0.197 0.203 0.209India NPLI 07/09 10 0.197 0.207 0.216 0.197 0.203 0.209
South Africa NMISA 09/09 11 0.197 0.207 0.216 0.197 0.203 0.209Egypt NIS 10/09 12 0.197 0.207 0.216 0.197 0.203 0.209China NIM 11/09 13 0.2040 0.0305 0.036 1.96 12 0.0184 3.4E-04 605 2964 0.00 0.197 0.207 0.216 0.197 0.203 0.209
Ch Teipei CMS 01/10 14 0.2012 0.0122 0.009 2.00 12 0.0046 2.1E-05 9509 47259 0.20 0.197 0.207 0.216 0.197 0.203 0.209Vietnam VMI 03/10 15 0.2100 0.050 2.00 12 0.0250 6.3E-04 336 1600 0.07 0.197 0.207 0.216 0.197 0.203 0.209
Indonesia KIM-LIPI 04/10 16 0.2180 0.0123 0.028 2.00 60 0.0140 2.0E-04 1112 5102 1.11 0.197 0.207 0.216 0.197 0.203 0.209Australia rpt NMIA 06/10 1 0.2070 0.0087 0.024 2.00 12 0.0120 1.4E-04 1438 6944 0.096 0.197 0.207 0.216 0.197 0.203 0.209
Count 10 0.00227 22359.3 109996 2.78 = MaxSt Deviation 0.0071 0.5
0.14 0.010.43 0.55
0.27 0.08
0.01 0.070.20 0.080.26 0.11
0.07 0.020.41 0.190.07 0.130.38 0.510.01 0.150.43 0.55
Worst
6 = R BESDM 0.0022 1.39 = R B lim
Mean ust k Uexp
µm µm µm %Arithmetic 0.0048 2.00 4.6Weighted 0.203 0.0030 2.00 0.0060 3.0
0.207 0.0095
All data
0.14
0.16
0.18
0.20
0.22
0.24
0.26
0.28
1 2 3 4 5 6 7 8 9 10 11 12 13 14 15 16 1
)1/(81 −+< nRBStandard deviations from each laboratory
0
0.005
0.01
0.015
0.02
0.025
0.03
0.035
1 2 3 4 5 6 7 8 9 10 11 12 13 14 15 16 1
Comments for 5276 Rpk results:NPL, SCL, NIST, NPLI, NMISA and NIS did not submit a result.NIM and CMS reported the ESDM which is converted to the standard deviation [s = ESDM * sqrt(n)]. KIM-LIPI repeated the measurement set 5 times.KRISS and NIM have significantly higher standard deviations than any other laboratory.Comparison of initial and final NMIA result is En = 0.12.
Submitted results: 10Outliers removed: 0Final population size: 10Key Comparison Reference Value: Rpk = 0.203 µm ± 0.006 µm
APMP.L-K8 report, 10 January 2013 Page 49 of 74

S/N 5276 All data Mean and uncertainty calculations En & Birge ratio2 Rvk (xxi i-xw)
xi st dev U95% k n u(xi) u2(xi) u2(xi) u-2(xi) u2(xi) En En RejectCountry Lab Date No. µm µm µm µm µm2 µm-1 µm-2 Arithm Weighted Arithmentic Mean Weighted Mean
Australia NMIA 07/08 1 0.2370 0.0073 0.0230 2.00 12 0.0115 1.3E-04 1792 7561 0.30 0.225 0.235 0.245 0.226 0.231 0.236 Singapore NMC 08/08 2 0.2400 0.0067 0.0300 2.00 12 0.0150 2.3E-04 1067 4444 0.38 0.225 0.235 0.245 0.226 0.231 0.236
UK NPL 09/08 3 0.225 0.235 0.245 0.226 0.231 0.236 Germany PTB 10/08 4 0.2380 0.0140 2.00 12 0.0070 4.9E-05 4857 20408 1.08 0.225 0.235 0.245 0.226 0.231 0.236
Hong Kong SCL 11/08 5 0.225 0.235 0.245 0.226 0.231 0.236Thailand NIMT 12/08 6 0.2410 0.0090 0.0390 2.00 12 0.0195 3.8E-04 634 2630 0.28 0.225 0.235 0.245 0.226 0.231 0.236
Japan NMIJ 01/09 7 0.2370 0.0012 0.0230 2.00 12 0.0115 1.3E-04 1792 7561 0.30 0.225 0.235 0.245 0.226 0.231 0.236South Korea KRISS 04/09 8 0.2230 0.0250 0.0170 2.20 12 0.0077 6.0E-05 3735 16747 1.00 0.225 0.235 0.245 0.226 0.231 0.236
USA NIST 06/09 9 0.225 0.235 0.245 0.226 0.231 0.236India NPLI 07/09 10 0.225 0.235 0.245 0.226 0.231 0.236
South Africa NMISA 09/09 11 0.225 0.235 0.245 0.226 0.231 0.236Egypt NIS 10/09 12 0.225 0.235 0.245 0.226 0.231 0.236China NIM 11/09 13 0.2390 0.0246 0.0340 1.96 12 0.0173 3.0E-04 794 3323 0.23 0.225 0.235 0.245 0.226 0.231 0.236
Ch Teipei CMS 01/10 14 0.2276 0.0064 0.0067 2.00 12 0.0034 1.1E-05 20281 89107 0.86 0.225 0.235 0.245 0.226 0.231 0.236Vietnam VMI 03/10 15 0.2260 0.0600 2.00 12 0.0300 9.0E-04 251 1111 0.02 0.225 0.235 0.245 0.226 0.231 0.236
Indonesia KIM-LIPI 04/10 16 0.2420 0.0055 0.0250 2.00 60 0.0125 1.6E-04 1549 6400 0.82 0.225 0.235 0.245 0.226 0.231 0.236Australia rpt NMIA 06/10 1 0.2380 0.0070 0.0240 2.00 12 0.0120 1.4E-04 1653 6944 0.369 0.225 0.235 0.245 0.226 0.231 0.236
Count 10 0.00235 36751.2 159294 5.27 = MaxSt Deviation 0.0069 0.7
0.08 0.270.16 0.31
0.17 0.49
0.15 0.260.08 0.270.62 0.44
0.11 0.240.63 0.370.15 0.080.26 0.440.11 0.300.63 0.49
Worst
7 = R BESDM 0.0022 1.39 = R B lim
Mean ust k Uexp
µm µm µm %Arithmetic 0.0048 2.00 4.1Weighted 0.231 0.0025 2.00 0.0050 2.2
0.235 0.0097
All data
0.16
0.18
0.20
0.22
0.24
0.26
0.28
0.30
1 2 3 4 5 6 7 8 9 10 11 12 13 14 15 16 1
)1/(81 −+< nRBStandard deviations from each laboratory
0
0.005
0.01
0.015
0.02
0.025
0.03
1 2 3 4 5 6 7 8 9 10 11 12 13 14 15 16 1
Comments for 5276 Rvk results:NPL, SCL, NIST, NPLI, NMISA and NIS did not submit a result.NIM and CMS reported the ESDM which is converted to the standard deviation [s = ESDM * sqrt(n)]. KIM-LIPI repeated the measurement set 5 times.KRISS and NIM have significantly higher standard deviations than any other laboratory.Comparison of initial and final NMIA result is En = 0.03.
Submitted results: 10Outliers removed: 0Final population size: 10Key Comparison Reference Value: Rvk = 0.231 µm ± 0.005 µm
APMP.L-K8 report, 10 January 2013 Page 50 of 74

S/N 5276 All data Mean and uncertainty calculations En & Birge ratio2 Mr1 (xxi i-xw)
xi st dev U95% k n u(xi) u2(xi) u2(xi) u-2(xi) u2(xi) En En RejectCountry Lab Date No. % % % % µm2 µm-1 µm-2 Arithm Weighted Arithmentic Mean Weighted Mean
Australia NMIA 07/08 1 6.817 0.263 0.712 2.20 12 0.3236 1.0E-01 65 10 0.03 6.379 6.664 6.950 6.630 6.761 6.892 Singapore NMC 08/08 2 6.580 0.5149 0.650 2.00 12 0.3250 1.1E-01 62 9 0.31 6.379 6.664 6.950 6.630 6.761 6.892
UK NPL 09/08 3 6.379 6.664 6.950 6.630 6.761 6.892 Germany PTB 10/08 4 6.700 2.000 2.00 12 1.0000 1.0E+00 7 1 0.00 6.379 6.664 6.950 6.630 6.761 6.892
Hong Kong SCL 11/08 5 6.379 6.664 6.950 6.630 6.761 6.892Thailand NIMT 12/08 6 6.848 0.25 0.841 2.00 12 0.4205 1.8E-01 39 6 0.04 6.379 6.664 6.950 6.630 6.761 6.892
Japan NMIJ 01/09 7 6.733 0.04 1.141 2.00 12 0.5705 3.3E-01 21 3 0.00 6.379 6.664 6.950 6.630 6.761 6.892South Korea KRISS 04/09 8 5.630 1.36 0.870 2.20 12 0.3955 1.6E-01 36 6 8.18 6.379 6.664 6.950 6.630 6.761 6.892
USA NIST 06/09 9 6.379 6.664 6.950 6.630 6.761 6.892India NPLI 07/09 10 6.379 6.664 6.950 6.630 6.761 6.892
South Africa NMISA 09/09 11 6.379 6.664 6.950 6.630 6.761 6.892Egypt NIS 10/09 12 6.379 6.664 6.950 6.630 6.761 6.892China NIM 11/09 13 6.720 0.8151 0.460 1.96 12 0.2347 5.5E-02 122 18 0.03 6.379 6.664 6.950 6.630 6.761 6.892
Ch Teipei CMS 01/10 14 6.870 0.2600 0.260 2.00 12 0.1300 1.7E-02 407 59 0.70 6.379 6.664 6.950 6.630 6.761 6.892Vietnam VMI 03/10 15 6.985 0.600 2.00 12 0.3000 9.0E-02 78 11 0.56 6.379 6.664 6.950 6.630 6.761 6.892
Indonesia KIM-LIPI 04/10 16 6.760 0.190 2.00 60 0.0950 9.0E-03 749 111 0.00 6.379 6.664 6.950 6.630 6.761 6.892Australia rpt NMIA 06/10 1 6.667 0.24 0.709 2.00 12 0.3545 1.3E-01 53 8 0.070 6.379 6.664 6.950 6.630 6.761 6.892
Count 10 2.04005 1584.65 234.378 9.86 = MaxSt Deviation 0.3797 1.05 = R B
E
0.20 0.080.12 0.27
0.02 0.03
0.21 0.100.06 0.02
0.10 0.090.53 0.370.48 0.360.28 0.000.00 0.131.13 1.29
1.13 1.29 Worst
SDM 0.1201 1.39 = R B limMean ust k Uexp
µm µm µm %Arithmetic 0.1428 2.00 4.3Weighted 6.761 0.0653 2.00 0.1306 1.9
6.664 0.2857
All data
4.00
4.50
5.00
5.50
6.00
6.50
7.00
7.50
8.00
8.50
9.00
1 2 3 4 5 6 7 8 9 10 11 12 13 14 15 16 1
)1/(81 −+< nRBStandard deviations from each laboratory
0
0.2
0.4
0.6
0.8
1
1.2
1.4
1.6
1 2 3 4 5 6 7 8 9 10 11 12 13 14 15 16 1
Comments for 5276 Mr1 results:NPL, SCL, NIST, NPLI, NMISA and NIS did not submit a result.NIM and CMS reported the ESDM which is converted to the standard deviation [s = ESDM * sqrt(n)]. KIM-LIPI repeated the measurement set 5 times.KRISS have significantly higher standard deviations than any other laboratory.Comparison of initial and final NMIA result is En = -0.15.
Submitted results: 10Outliers removed: 0Final population size: 10Key Comparison Reference Value: Mr1 = 6.76% ± 0.13%After outliers are removed, the South Korea En was 1.29 but remained in the accepted values since the Birge ratio was less than the Birge limit. If South Korea was removed, the final KCRV would change by +0.06%.
APMP.L-K8 report, 10 January 2013 Page 51 of 74

S/N 5276 All data Mean and uncertainty calculations En & Birge ratio2 Mr2 (xxi i-xw)
xi st dev U95% k n u(xi) u2(xi) u2(xi) u-2(xi) u2(xi) En En RejectCountry Lab Date No. % % % % µm2 µm-1 µm-2 Arithm Weighted Arithmentic Mean Weighted Mean
Australia NMIA 07/08 1 90.575 0.494 0.745 2.20 12 0.3386 1.1E-01 790 9 0.89 90.303 90.805 91.308 90.667 90.895 91.123 Singapore NMC 08/08 2 90.920 1.240 0.850 2.18 12 0.3899 1.5E-01 598 7 0.00 90.303 90.805 91.308 90.667 90.895 91.123
UK NPL 09/08 3 90.303 90.805 91.308 90.667 90.895 91.123 Germany PTB 10/08 4 90.600 2.000 2.00 12 1.0000 1.0E+00 91 1 0.09 90.303 90.805 91.308 90.667 90.895 91.123
Hong Kong SCL 11/08 5 90.303 90.805 91.308 90.667 90.895 91.123Thailand NIMT 12/08 6 90.393 0.66 2.988 2.00 12 1.4940 2.2E+00 40 0 0.11 90.303 90.805 91.308 90.667 90.895 91.123
Japan NMIJ 01/09 7 90.439 0.07 1.623 2.00 12 0.8115 6.6E-01 137 2 0.32 90.303 90.805 91.308 90.667 90.895 91.123South Korea KRISS 04/09 8 94.160 1.26 0.800 2.20 12 0.3636 1.3E-01 712 8 80.63 90.303 90.805 91.308 90.667 90.895 91.123
USA NIST 06/09 9 90.303 90.805 91.308 90.667 90.895 91.123India NPLI 07/09 10 90.303 90.805 91.308 90.667 90.895 91.123
South Africa NMISA 09/09 11 90.303 90.805 91.308 90.667 90.895 91.123Egypt NIS 10/09 12 90.303 90.805 91.308 90.667 90.895 91.123China NIM 11/09 13 90.830 1.3998 0.790 1.96 12 0.4031 1.6E-01 559 6 0.03 90.303 90.805 91.308 90.667 90.895 91.123
Ch Teipei CMS 01/10 14 90.400 0.4700 0.310 2.00 12 0.1550 2.4E-02 3763 42 10.19 90.303 90.805 91.308 90.667 90.895 91.123Vietnam VMI 03/10 15 91.617 1.200 2.00 12 0.6000 3.6E-01 254 3 1.45 90.303 90.805 91.308 90.667 90.895 91.123
Indonesia KIM-LIPI 04/10 16 88.120 2.430 2.00 60 1.2150 1.5E+00 60 1 5.22 90.303 90.805 91.308 90.667 90.895 91.123Australia rpt NMIA 06/10 1 90.303 90.805 91.308 90.667 90.895 91.123
Count 10 6.31221 7004.44 77.061 98.92 3.55 3.93 = MaxSt Deviation 1.4795 3.3
0.26 0.410.12 0.03
0.10 0.15
0.14 0.170.22 0.28
0.03 0.080.690.62 0.59
3.55 3.93 Worst
1.29
1.08 1.14
2 = R BESDM 0.4679 1.39 = R B lim
Mean ust k Uexp
µm µm µm %Arithmetic 0.2512 2.00 0.6Weighted 90.895 0.1139 2.00 0.2278 0.3
90.805 0.5025
All data
86.00
87.00
88.00
89.00
90.00
91.00
92.00
93.00
94.00
95.00
96.00
1 2 3 4 5 6 7 8 9 10 11 12 13 14 15 16 1
)1/(81 −+< nRBStandard deviations from each laboratory
0
0.2
0.4
0.6
0.8
1
1.2
1.4
1.6
1 2 3 4 5 6 7 8 9 10 11 12 13 14 15 16 1
Comments for 5276 Mr2 results:NPL, SCL, NIST, NPLI, NMISA and NIS did not submit a result.NIM and CMS reported the ESDM which is converted to the standard deviation [s = ESDM * sqrt(n)]. KIM-LIPI repeated the measurement set 5 times.NIM, KRISS and NMC A*Star have significantly higher standard deviations than any other laboratory.The final NMIA result was not recorded so no En was calculated.
Submitted results: 10Outliers removed: 1 (South Korea)Final population size: 9Key Comparison Reference Value: Mr2 = 90.54% ± 0.24%After outliers are removed, the Indonesia En was 0.99 and the Vietnam En was 0.88.
APMP.L-K8 report, 10 January 2013 Page 52 of 74

S/N 5256 All data Mean and uncertainty calculations En & Birge ratio2 Ra xi (xi-xw)
xi st dev U95% k n u(xi) u2(xi) u2(xi) u-2(xi) u2(xi) En En RejectCountry Lab Date No. µm µm µm µm µm2 µm-1 µm-2 Arithm Weighted Arithmentic Mean Weighted Mean
Australia NMIA 07/08 1 1.682 0.0183 0.043 2.00 12 0.0215 4.6E-04 3639 2163 1.86 1.630 1.646 1.661 1.647 1.653 1.659 Singapore NMC 08/08 2 1.610 0.0179 0.050 2.00 12 0.0250 6.3E-04 2576 1600 2.92 1.630 1.646 1.661 1.647 1.653 1.659
UK NPL 09/08 3 1.663 0.0162 0.011 2.28 12 0.0048 2.3E-05 71446 42962 4.56 1.630 1.646 1.661 1.647 1.653 1.659 Germany PTB 10/08 4 1.660 0.030 2.00 12 0.0150 2.3E-04 7378 4444 0.24 1.630 1.646 1.661 1.647 1.653 1.659
Hong Kong SCL 11/08 5 1.630 1.646 1.661 1.647 1.653 1.659Thailand NIMT 12/08 6 1.665 0.0200 0.078 2.00 12 0.0390 1.5E-03 1095 657 0.10 1.630 1.646 1.661 1.647 1.653 1.659
Japan NMIJ 01/09 7 1.661 0.0012 0.033 2.00 12 0.0165 2.7E-04 6101 3673 0.25 1.630 1.646 1.661 1.647 1.653 1.659South Korea KRISS 04/09 8 1.622 0.0480 0.035 2.20 12 0.0159 2.5E-04 6409 3951 3.72 1.630 1.646 1.661 1.647 1.653 1.659
USA NIST 06/09 9 1.662 0.0175 0.014 2.00 12 0.0070 4.9E-05 33918 20408 1.77 1.630 1.646 1.661 1.647 1.653 1.659India NPLI 07/09 10 1.692 0.068 1.00 12 0.0680 4.6E-03 366 216 0.33 1.630 1.646 1.661 1.647 1.653 1.659
South Africa NMISA 09/09 11 1.674 0.0988 0.117 2.00 13 0.0585 3.4E-03 489 292 0.13 1.630 1.646 1.661 1.647 1.653 1.659Egypt NIS 10/09 12 1.591 0.0490 0.031 2.00 12 0.0155 2.4E-04 6622 4162 15.84 1.630 1.646 1.661 1.647 1.653 1.659China NIM 11/09 13 1.660 0.0565 0.045 1.96 12 0.0230 5.3E-04 3149 1897 0.10 1.630 1.646 1.661 1.647 1.653 1.659
Ch Teipei CMS 01/10 14 1.653 0.0163 0.015 2.00 12 0.0075 5.6E-05 29387 17778 0.00 1.630 1.646 1.661 1.647 1.653 1.659Vietnam VMI 03/10 15 1.652 0.060 2.00 12 0.0300 9.0E-04 1836 1111 0.00 1.630 1.646 1.661 1.647 1.653 1.659
Indonesia KIM-LIPI 04/10 16 1.538 0.0132 0.036 2.00 60 0.0180 3.2E-04 4747 3086 40.60 1.630 1.646 1.661 1.647 1.653 1.659Australia rpt NMIA 06/10 1 1.720 0.0178 0.043 2.00 11 0.0215 4.6E-04 3721 2163 9.800 1.630 1.646 1.661 1.647 1.653 1.659
Count 15 0.01352 179157 108403 72.43 = MaxSt Deviation 0.0400 2.2
0.79 0.670.68 0.850.91 0.820.42 0.24
0.24 0.160.42 0.250.62 0.860.78 0.610.66 0.580.24 0.18
0.30 0.160.34 0.020.10 0.01
1.58 1.95
2.75 3.14 Worst1.63 1.552.75 3.14
7 = R BESDM 0.0103 1.33 = R B lim
Mean ust k Uexp
µm µm µm %Arithmetic 0.0078 2.00 0.9Weighted 1.653 0.0030 2.00 0.0061 0.4
1.646 0.0155
All data
1.50
1.55
1.60
1.65
1.70
1.75
1.80
1 2 3 4 5 6 7 8 9 10 11 12 13 14 15 16 1
)1/(81 −+< nRBStandard deviations from each laboratory
0
0.02
0.04
0.06
0.08
0.1
0.12
1 2 3 4 5 6 7 8 9 10 11 12 13 14 15 16 1
Comments for 5256 Ra results:SCL did not submit a result.NIS, NIM and CMS reported the ESDM which is converted to the standard deviation [s = ESDM * sqrt(n)]. NPLI uncertainty reported at k = 1.0.KIM-LIPI repeated the measurement set 5 times.NMISA has a significantly higher standard deviation than any other laboratory.Comparison of initial and final NMIA result is En = 0.62.
Submitted results: 15Outliers removed: 2 (KIM-LIPI, NIS)Final population size: 13Key Comparison Reference Value: Ra = 1.659 µm ± 0.007 µmAfter outliers are removed, the KRISS En was 1.02 but remained in the accepted values since the Birge ratio was less than the Birge limit. If KRISS was removed also, the final KCRV would change by +0.002 µm.
APMP.L-K8 report, 10 January 2013 Page 53 of 74

S/N 5256 All data Mean and uncertainty calculations En & Birge ratio2 Rq xi (xi-xw)
xi st dev U95% k n u(xi) u2(xi) u2(xi) u-2(xi) u2(xi) En En RejectCountry Lab Date No. µm µm µm µm µm2 µm-1 µm-2 Arithm Weighted Arithmentic Mean Weighted Mean
Australia NMIA 07/08 1 2.054 0.0155 0.057 2.00 12 0.0285 8.1E-04 2529 1231 2.05 1.983 2.001 2.019 2.007 2.013 2.020 Singapore NMC 08/08 2 1.960 0.0153 0.050 2.00 12 0.0250 6.3E-04 3136 1600 4.53 1.983 2.001 2.019 2.007 2.013 2.020
UK NPL 09/08 3 2.014 0.0167 0.011 2.28 12 0.0048 2.3E-05 86525 42962 0.03 1.983 2.001 2.019 2.007 2.013 2.020 Germany PTB 10/08 4 2.020 0.040 2.00 12 0.0200 4.0E-04 5050 2500 0.12 1.983 2.001 2.019 2.007 2.013 2.020
Hong Kong SCL 11/08 5 1.983 2.001 2.019 2.007 2.013 2.020Thailand NIMT 12/08 6 2.016 0.0190 0.074 2.00 12 0.0370 1.4E-03 1473 730 0.01 1.983 2.001 2.019 2.007 2.013 2.020
Japan NMIJ 01/09 7 2.013 0.0014 0.032 2.00 12 0.0160 2.6E-04 7863 3906 0.00 1.983 2.001 2.019 2.007 2.013 2.020South Korea KRISS 04/09 8 1.990 0.0630 0.045 2.20 12 0.0205 4.2E-04 4756 2390 1.29 1.983 2.001 2.019 2.007 2.013 2.020
USA NIST 06/09 9 2.031 0.0145 0.014 2.00 12 0.0070 4.9E-05 41449 20408 6.45 1.983 2.001 2.019 2.007 2.013 2.020India NPLI 07/09 10 2.012 0.080 1.00 12 0.0800 6.4E-03 314 156 0.00 1.983 2.001 2.019 2.007 2.013 2.020
South Africa NMISA 09/09 11 2.041 0.1221 0.142 2.00 13 0.0710 5.0E-03 405 198 0.15 1.983 2.001 2.019 2.007 2.013 2.020Egypt NIS 10/09 12 1.928 0.0580 0.037 2.00 12 0.0185 3.4E-04 5633 2922 21.22 1.983 2.001 2.019 2.007 2.013 2.020China NIM 11/09 13 2.028 0.0492 0.042 1.96 12 0.0214 4.6E-04 4417 2178 0.48 1.983 2.001 2.019 2.007 2.013 2.020
Ch Teipei CMS 01/10 14 2.020 0.0137 0.016 2.00 12 0.0080 6.4E-05 31563 15625 0.72 1.983 2.001 2.019 2.007 2.013 2.020Vietnam VMI 03/10 15 2.020 0.060 2.00 12 0.0300 9.0E-04 2244 1111 0.05 1.983 2.001 2.019 2.007 2.013 2.020
Indonesia KIM-LIPI 04/10 16 1.866 0.0321 0.051 2.00 60 0.0255 6.5E-04 2870 1538 33.33 1.983 2.001 2.019 2.007 2.013 2.020Australia rpt NMIA 06/10 1 2.102 0.0159 0.057 2.00 11 0.0285 8.1E-04 2588 1231 9.705 1.983 2.001 2.019 2.007 2.013 2.020
Count 15 0.01781 200227 99456.4 70.42 = MaxSt Deviation 0.0487 2.24 = R B
E
0.89 0.710.770.63 0.060.44 0.17
0.20 0.040.33 0.010.22 0.51
0.14 0.020.28 0.20
0.59 0.350.80 0.390.31 0.11
1.06
1.33 1.16
1.77 2.27
2.50 2.86 Worst1.69 1.552.50 2.86
SDM 0.0126 1.33 = R B limMean ust k Uexp
µm µm µm %Arithmetic 0.0089 2.00 0.9Weighted 2.013 0.0032 2.00 0.0063 0.3
2.001 0.0178
All data
1.70
1.80
1.90
2.00
2.10
2.20
2.30
1 2 3 4 5 6 7 8 9 10 11 12 13 14 15 16 1
)1/(81 −+< nRBStandard deviations from each laboratory
0
0.02
0.04
0.06
0.08
0.1
0.12
0.14
1 2 3 4 5 6 7 8 9 10 11 12 13 14 15 16 1
Comments for 5256 Rq results:SCL did not submit a result.NIS, NIM and CMS reported the ESDM which is converted to the standard deviation [s = ESDM * sqrt(n)]. NPLI uncertainty reported at k = 1.0.KIM-LIPI repeated the measurement set 5 times.NMISA has a significantly higher standard deviation than any other laboratory.Comparison of initial and final NMIA result is En = 0.60.
Submitted results: 15Outliers removed: 2 (KIM-LIPI, NIS)Final population size: 13Key Comparison Reference Value: Rq = 2.018 µm ± 0.007 µmAfter outliers are removed, the NMC A*Star En was 1.2 but remained in the accepted values since the Birge ratio was less than the Birge limit. If NMC A*Star was removed also, the final KCRV would change by only +0.001 µm.
APMP.L-K8 report, 10 January 2013 Page 54 of 74

S/N 5256 All data Mean and uncertainty calculations En & Birge ratio2 Rz xi (xi-xw)
xi st dev U95% k n u(xi) u2(xi) u2(xi) u-2(xi) u2(xi) En En RejectCountry Lab Date No. µm µm µm µm µm2 µm-1 µm-2 Arithm Weighted Arithmentic Mean Weighted Mean
Australia NMIA 07/08 1 8.165 0.0579 0.140 2.00 10 0.0700 4.9E-03 1666 204 26.18 8.136 8.216 8.297 8.487 8.523 8.559 Singapore NMC 08/08 2 9.700 0.2396 0.300 2.00 12 0.1500 2.3E-02 431 44 61.55 8.136 8.216 8.297 8.487 8.523 8.559
UK NPL 09/08 3 8.056 0.1196 0.079 2.28 12 0.0346 1.2E-03 6710 833 181.77 8.136 8.216 8.297 8.487 8.523 8.559 Germany PTB 10/08 4 8.010 0.160 2.00 12 0.0800 6.4E-03 1252 156 41.14 8.136 8.216 8.297 8.487 8.523 8.559
Hong Kong SCL 11/08 5 8.136 8.216 8.297 8.487 8.523 8.559Thailand NIMT 12/08 6 8.083 0.1160 0.618 2.00 12 0.3090 9.5E-02 85 10 2.03 8.136 8.216 8.297 8.487 8.523 8.559
Japan NMIJ 01/09 7 8.061 0.0172 0.328 2.00 12 0.1640 2.7E-02 300 37 7.94 8.136 8.216 8.297 8.487 8.523 8.559South Korea KRISS 04/09 8 7.950 0.3140 0.210 2.20 12 0.0955 9.1E-03 873 110 36.05 8.136 8.216 8.297 8.487 8.523 8.559
USA NIST 06/09 9 8.140 0.1540 0.110 2.00 12 0.0550 3.0E-03 2691 331 48.53 8.136 8.216 8.297 8.487 8.523 8.559India NPLI 07/09 10 7.577 0.304 1.00 12 0.3040 9.2E-02 82 11 9.69 8.136 8.216 8.297 8.487 8.523 8.559
South Africa NMISA 09/09 11 8.082 0.4356 0.505 2.00 13 0.2525 6.4E-02 127 16 3.05 8.136 8.216 8.297 8.487 8.523 8.559Egypt NIS 10/09 12 7.608 0.2470 0.170 2.00 12 0.0850 7.2E-03 1053 138 115.92 8.136 8.216 8.297 8.487 8.523 8.559China NIM 11/09 13 8.060 0.4074 0.230 1.96 12 0.1173 1.4E-02 585 73 15.58 8.136 8.216 8.297 8.487 8.523 8.559
Ch Teipei CMS 01/10 14 7.991 0.1316 0.094 2.00 12 0.0470 2.2E-03 3617 453 128.19 8.136 8.216 8.297 8.487 8.523 8.559Vietnam VMI 03/10 15 10.419 0.080 2.00 12 0.0400 1.6E-03 6512 625 2246.41 8.136 8.216 8.297 8.487 8.523 8.559
Indonesia KIM-LIPI 04/10 16 7.345 0.2214 0.269 2.00 60 0.1345 1.8E-02 406 55 76.73 8.136 8.216 8.297 8.487 8.523 8.559Australia rpt NMIA 06/10 1 8.309 0.0894 0.141 2.00 10 0.0705 5.0E-03 1672 201 9.227 8.136 8.216 8.297 8.487 8.523 8.559
Count 15 0.36858 26389.4 3096.21 3000.76 = MaxSt Deviation 0.7961 14.64 = R B
E
0.32
0.21 0.710.46
0.56
0.26 0.87
0.64
0.5719.35
2.484.77 3.891.42 5.381.15 3.13
1.401.18 2.69
3.312.03 3.09
3.23 5.271.99
1.82 5.2919.35 21.62 Worst
3.10 4.341.47
21.62
SDM 0.2056 1.33 = R B limMean ust k Uexp
µm µm µm %Arithmetic 0.0405 2.00 1.0Weighted 8.523 0.0180 2.00 0.0359 0.4
8.216 0.0809
All data
6.00
6.50
7.00
7.50
8.00
8.50
9.00
9.50
10.00
10.50
11.00
1 2 3 4 5 6 7 8 9 10 11 12 13 14 15 16 1
)1/(81 −+< nRB Standard deviations from each laboratory
0
0.05
0.1
0.15
0.2
0.25
0.3
0.35
0.4
0.45
0.5
1 2 3 4 5 6 7 8 9 10 11 12 13 14 15 16 1
Comments for 5256 Rz results:SCL did not submit a result.NIS, NIM and CMS reported the ESDM which is converted to the standard deviation [s = ESDM * sqrt(n)]. NPLI uncertainty reported at k = 1.0.KIM-LIPI repeated the measurement set 5 times.NMISA and NIM have higher standard deviations than any other laboratory.Comparison of initial and final NMIA result is En = 0.72.
Submitted results: 15Outliers removed: 4 (VMI, NMC A*Star, KIM-LIPI, NIS)Final population size: 11Key Comparison Reference Value: Rz = 8.055 µm ± 0.042 µmAfter outliers are removed, the NPLI En was 1.5 but remained in the accepted values since the Birge ratio was less than the Birge limit. If NPLI was removed also, the final KCRV would change by only +0.002 µm.
APMP.L-K8 report, 10 January 2013 Page 55 of 74

S/N 5256 All data Mean and uncertainty calculations En & Birge ratio2 Rp xi (xi-xw)
xi st dev U95% k n u(xi) u2(xi) u2(xi) u-2(xi) u2(xi) En En RejectCountry Lab Date No. µm µm µm µm µm2 µm-1 µm-2 Arithm Weighted Arithmentic Mean Weighted Mean
Australia NMIA 07/08 1 2.920 0.0567 0.096 2.00 12 0.0480 2.3E-03 1267 434 1.07 2.948 2.985 3.023 2.854 2.870 2.887 Singapore NMC 08/08 2 2.990 0.0771 0.100 2.00 12 0.0500 2.5E-03 1196 400 5.72 2.948 2.985 3.023 2.854 2.870 2.887
UK NPL 09/08 3 2.878 0.0531 0.035 2.28 12 0.0154 2.4E-04 12213 4244 0.24 2.948 2.985 3.023 2.854 2.870 2.887 Germany PTB 10/08 4 2.870 0.090 2.00 12 0.0450 2.0E-03 1417 494 0.00 2.948 2.985 3.023 2.854 2.870 2.887
Hong Kong SCL 11/08 5 2.948 2.985 3.023 2.854 2.870 2.887Thailand NIMT 12/08 6 2.917 0.0640 0.254 2.00 12 0.1270 1.6E-02 181 62 0.13 2.948 2.985 3.023 2.854 2.870 2.887
Japan NMIJ 01/09 7 2.867 0.0110 0.097 2.00 12 0.0485 2.4E-03 1219 425 0.00 2.948 2.985 3.023 2.854 2.870 2.887South Korea KRISS 04/09 8 2.803 0.1220 0.082 2.20 12 0.0373 1.4E-03 2018 720 3.27 2.948 2.985 3.023 2.854 2.870 2.887
USA NIST 06/09 9 2.899 0.0571 0.047 2.00 12 0.0235 5.5E-04 5249 1811 1.48 2.948 2.985 3.023 2.854 2.870 2.887India NPLI 07/09 10 4.261 0.170 1.00 12 0.1700 2.9E-02 147 35 66.91 2.948 2.985 3.023 2.854 2.870 2.887
South Africa NMISA 09/09 11 2.874 0.1800 0.209 2.00 13 0.1045 1.1E-02 263 92 0.00 2.948 2.985 3.023 2.854 2.870 2.887Egypt NIS 10/09 12 2.891 0.1040 0.072 2.00 12 0.0360 1.3E-03 2231 772 0.33 2.948 2.985 3.023 2.854 2.870 2.887China NIM 11/09 13 2.880 0.2162 0.130 1.96 12 0.0663 4.4E-03 655 227 0.02 2.948 2.985 3.023 2.854 2.870 2.887
Ch Teipei CMS 01/10 14 2.833 0.0596 0.035 2.00 12 0.0175 3.1E-04 9251 3265 4.57 2.948 2.985 3.023 2.854 2.870 2.887Vietnam VMI 03/10 15 3.148 0.125 2.00 12 0.0625 3.9E-03 806 256 19.73 2.948 2.985 3.023 2.854 2.870 2.887
Indonesia KIM-LIPI 04/10 16 2.750 0.0379 0.063 2.00 60 0.0315 9.9E-04 2771 1008 14.61 2.948 2.985 3.023 2.854 2.870 2.887Australia rpt NMIA 06/10 1 2.969 0.0431 0.094 2.00 10 0.0470 2.2E-03 1344 453 4.399 2.948 2.985 3.023 2.854 2.870 2.887
Count 15 0.07821 40884.4 14243.4 118.09 = MaxSt Deviation 0.3638 2.90 = R B
E
0.64 0.510.04
0.200.00
0.27 0.180.030.810.57
0.52 0.020.28
0.78 0.070.96
0.167.33
1.182.101.18
1.142.021.447.33 8.14 Worst
1.16
2.981.25 2.203.22 1.85
1.038.14
SDM 0.0939 1.33 = R B limMean ust k Uexp
µm µm µm %Arithmetic 0.0186 2.00 1.2Weighted 2.870 0.0084 2.00 0.0168 0.6
2.985 0.0373
All data
2.50
2.70
2.90
3.10
3.30
3.50
3.70
3.90
4.10
4.30
4.50
1 2 3 4 5 6 7 8 9 10 11 12 13 14 15 16 1
)1/(81 −+< nRBStandard deviations from each laboratory
0
0.05
0.1
0.15
0.2
0.25
1 2 3 4 5 6 7 8 9 10 11 12 13 14 15 16 1
Comments for 5256 Rp results:SCL did not submit a result.NIS, NIM and CMS reported the ESDM which is converted to the standard deviation [s = ESDM * sqrt(n)]. NPLI uncertainty reported at k = 1.0.KIM-LIPI repeated the measurement set 5 times.NIM and NMISA have higher standard deviations than any other laboratory.Comparison of initial and final NMIA result is En = 0.36.
Submitted results: 15Outliers removed: 3 (NPLI, VMI, KIM-LIPI)Final population size: 12Key Comparison Reference Value: Rp = 2.871 µm ± 0.018 µmAfter outliers are removed, the NMC A*Star En was 1.2 but remained in the accepted values since the Birge ratio was less than the Birge limit. If NMC A*Star was removed also, the final KCRV would change by only +0.004 µm.
APMP.L-K8 report, 10 January 2013 Page 56 of 74
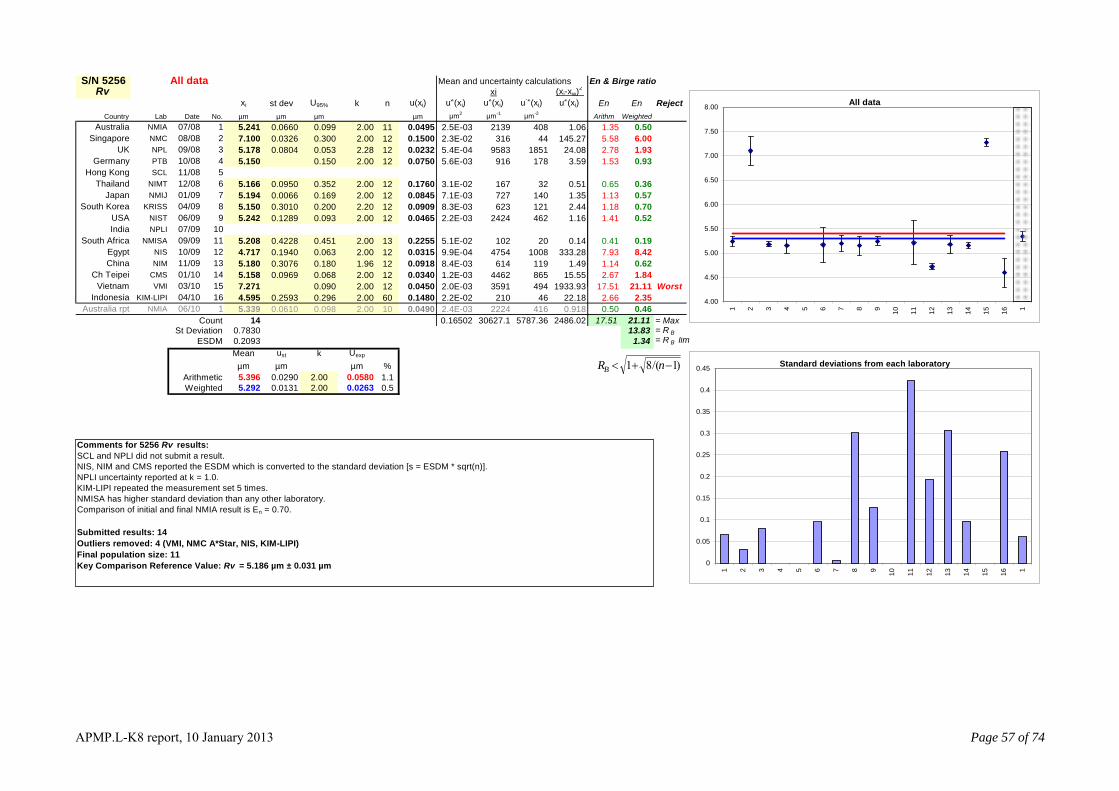
S/N 5256 All data Mean and uncertainty calculations En & Birge ratio2 Rv xi (xi-xw)
xi st dev U95% k n u(xi) u2(xi) u2(xi) u-2(xi) u2(xi) En En RejectCountry Lab Date No. µm µm µm µm µm2 µm-1 µm-2 Arithm Weighted Arithmentic Mean Weighted Mean
Australia NMIA 07/08 1 5.241 0.0660 0.099 2.00 11 0.0495 2.5E-03 2139 408 1.06 5.338 5.396 5.454 5.266 5.292 5.318 Singapore NMC 08/08 2 7.100 0.0326 0.300 2.00 12 0.1500 2.3E-02 316 44 145.27 5.338 5.396 5.454 5.266 5.292 5.318
UK NPL 09/08 3 5.178 0.0804 0.053 2.28 12 0.0232 5.4E-04 9583 1851 24.08 5.338 5.396 5.454 5.266 5.292 5.318 Germany PTB 10/08 4 5.150 0.150 2.00 12 0.0750 5.6E-03 916 178 3.59 5.338 5.396 5.454 5.266 5.292 5.318
Hong Kong SCL 11/08 5 5.338 5.396 5.454 5.266 5.292 5.318Thailand NIMT 12/08 6 5.166 0.0950 0.352 2.00 12 0.1760 3.1E-02 167 32 0.51 5.338 5.396 5.454 5.266 5.292 5.318
Japan NMIJ 01/09 7 5.194 0.0066 0.169 2.00 12 0.0845 7.1E-03 727 140 1.35 5.338 5.396 5.454 5.266 5.292 5.318South Korea KRISS 04/09 8 5.150 0.3010 0.200 2.20 12 0.0909 8.3E-03 623 121 2.44 5.338 5.396 5.454 5.266 5.292 5.318
USA NIST 06/09 9 5.242 0.1289 0.093 2.00 12 0.0465 2.2E-03 2424 462 1.16 5.338 5.396 5.454 5.266 5.292 5.318India NPLI 07/09 10 5.338 5.396 5.454 5.266 5.292 5.318
South Africa NMISA 09/09 11 5.208 0.4228 0.451 2.00 13 0.2255 5.1E-02 102 20 0.14 5.338 5.396 5.454 5.266 5.292 5.318Egypt NIS 10/09 12 4.717 0.1940 0.063 2.00 12 0.0315 9.9E-04 4754 1008 333.28 5.338 5.396 5.454 5.266 5.292 5.318China NIM 11/09 13 5.180 0.3076 0.180 1.96 12 0.0918 8.4E-03 614 119 1.49 5.338 5.396 5.454 5.266 5.292 5.318
Ch Teipei CMS 01/10 14 5.158 0.0969 0.068 2.00 12 0.0340 1.2E-03 4462 865 15.55 5.338 5.396 5.454 5.266 5.292 5.318Vietnam VMI 03/10 15 7.271 0.090 2.00 12 0.0450 2.0E-03 3591 494 1933.93 5.338 5.396 5.454 5.266 5.292 5.318
Indonesia KIM-LIPI 04/10 16 4.595 0.2593 0.296 2.00 60 0.1480 2.2E-02 210 46 22.18 5.338 5.396 5.454 5.266 5.292 5.318Australia rpt NMIA 06/10 1 5.339 0.0610 0.098 2.00 10 0.0490 2.4E-03 2224 416 0.918 5.338 5.396 5.454 5.266 5.292 5.318
Count 14 0.16502 30627.1 5787.36 2486.02 = MaxSt Deviation 0.7830 13.83 = R B
E
1.355.58 6.002.78 1.931.53
1.131.181.41
7.93 8.421.142.67 1.84
17.51 21.11 Worst2.66 2.35
0.50
0.93
0.65 0.360.570.700.52
0.41 0.19
0.62
0.50 0.4617.51 21.11
SDM 0.2093 1.34 = R B limMean ust k Uexp
µm µm µm %Arithmetic 0.0290 2.00 1.1Weighted 5.292 0.0131 2.00 0.0263 0.5
5.396 0.0580
All data
4.00
4.50
5.00
5.50
6.00
6.50
7.00
7.50
8.00
1 2 3 4 5 6 7 8 9 10 11 12 13 14 15 16 1
)1/(81 −+< nRBStandard deviations from each laboratory
0
0.05
0.1
0.15
0.2
0.25
0.3
0.35
0.4
0.45
1 2 3 4 5 6 7 8 9 10 11 12 13 14 15 16 1
Comments for 5256 Rv results:SCL and NPLI did not submit a result.NIS, NIM and CMS reported the ESDM which is converted to the standard deviation [s = ESDM * sqrt(n)]. NPLI uncertainty reported at k = 1.0.KIM-LIPI repeated the measurement set 5 times.NMISA has higher standard deviation than any other laboratory.Comparison of initial and final NMIA result is En = 0.70.
Submitted results: 14Outliers removed: 4 (VMI, NMC A*Star, NIS, KIM-LIPI)Final population size: 11Key Comparison Reference Value: Rv = 5.186 µm ± 0.031 µm
APMP.L-K8 report, 10 January 2013 Page 57 of 74

S/N 5256 All data Mean and uncertainty calculations En & Birge ratio2 Rt (xxi i-xw)
xi st dev U95% k n u(xi) u2(xi) u2(xi) u-2(xi) u2(xi) En En RejectCountry Lab Date No. µm µm µm µm µm2 µm-1 µm-2 Arithm Weighted Arithmentic Mean Weighted Mean
Australia NMIA 07/08 1 10.480 0.0982 0.204 2.00 12 0.1020 1.0E-02 1007 96 1.06 9.822 10.036 10.249 10.337 10.375 10.413 Singapore NMC 08/08 2 10.080 0.0835 0.400 2.00 12 0.2000 4.0E-02 252 25 2.18 9.822 10.036 10.249 10.337 10.375 10.413
UK NPL 09/08 3 10.448 0.1030 0.068 2.28 12 0.0298 8.9E-04 11746 1124 6.00 9.822 10.036 10.249 10.337 10.375 10.413 Germany PTB 10/08 4 10.390 0.210 2.00 12 0.1050 1.1E-02 942 91 0.02 9.822 10.036 10.249 10.337 10.375 10.413
Hong Kong SCL 11/08 5 9.822 10.036 10.249 10.337 10.375 10.413Thailand NIMT 12/08 6 10.337 0.4230 2.475 2.00 12 1.2375 1.5E+00 7 1 0.00 9.822 10.036 10.249 10.337 10.375 10.413
Japan NMIJ 01/09 7 10.435 0.0207 0.292 2.00 12 0.1460 2.1E-02 490 47 0.17 9.822 10.036 10.249 10.337 10.375 10.413South Korea KRISS 04/09 8 10.040 1.0410 0.670 2.20 12 0.3045 9.3E-02 108 11 1.21 9.822 10.036 10.249 10.337 10.375 10.413
USA NIST 06/09 9 10.452 0.1091 0.093 2.00 12 0.0465 2.2E-03 4834 462 2.74 9.822 10.036 10.249 10.337 10.375 10.413India NPLI 07/09 10 9.887 0.396 1.00 12 0.3960 1.6E-01 63 6 1.52 9.822 10.036 10.249 10.337 10.375 10.413
South Africa NMISA 09/09 11 9.617 1.0831 1.127 2.00 13 0.5635 3.2E-01 30 3 1.81 9.822 10.036 10.249 10.337 10.375 10.413Egypt NIS 10/09 12 8.319 0.5760 0.178 2.00 12 0.0890 7.9E-03 1050 126 533.64 9.822 10.036 10.249 10.337 10.375 10.413China NIM 11/09 13 10.400 0.3301 0.190 1.96 12 0.0969 9.4E-03 1107 106 0.07 9.822 10.036 10.249 10.337 10.375 10.413
Ch Teipei CMS 01/10 14 10.677 0.1081 0.093 2.00 12 0.0465 2.2E-03 4938 462 42.19 9.822 10.036 10.249 10.337 10.375 10.413Vietnam VMI 03/10 15 10.419 0.160 2.00 12 0.0800 6.4E-03 1628 156 0.30 9.822 10.036 10.249 10.337 10.375 10.413
Indonesia KIM-LIPI 04/10 16 8.557 1.0611 1.185 2.00 60 0.5925 3.5E-01 24 3 9.41 9.822 10.036 10.249 10.337 10.375 10.413Australia rpt NMIA 06/10 1 10.728 0.0908 0.203 2.00 10 0.1015 1.0E-02 1041 97 12.098 9.822 10.036 10.249 10.337 10.375 10.413
Count 15 2.56124 28226.5 2720.64 602.32 = MaxSt Deviation 0.7041 6.5
1.50
1.841.18
1.10
1.791.23
6.18 11.29 Worst1.272.75 3.001.441.23 1.532.35 1.716.18 11.29
0.510.10 0.73
0.940.07
0.12 0.020.20
0.01 0.500.77
0.330.37 0.67
0.13
0.27
6 = R BESDM 0.1818 1.33 = R B lim
Mean ust k Uexp
µm µm µm %Arithmetic 0.1067 2.00 2.1Weighted 10.375 0.0192 2.00 0.0383 0.4
10.036 0.2134
All data
6.00
7.00
8.00
9.00
10.00
11.00
12.00
13.00
14.00
1 2 3 4 5 6 7 8 9 10 11 12 13 14 15 16 1
)1/(81 −+< nRBStandard deviations from each laboratory
0
0.2
0.4
0.6
0.8
1
1.2
1 2 3 4 5 6 7 8 9 10 11 12 13 14 15 16 1
Comments for 5256 Rt results:SCL did not submit a result.NIS, NIM and CMS reported the ESDM which is converted to the standard deviation [s = ESDM * sqrt(n)]. NPLI uncertainty reported at k = 1.0.KIM-LIPI repeated the measurement set 5 times.South Korea, South Africa and Indonesia have significantly higher standard deviations than any other laboratory.Comparison of initial and final NMIA result is En = 0.86.
Submitted results: 15Outliers removed: 3 (NIS, CMS, KIM-LIPI)Final population size: 12Key Comparison Reference Value: Rt = 10.434 µm ± 0.043 µmAfter outliers are removed, the NPLI En was 1.5 but remained in the accepted values since the Birge ratio was less than the Birge limit. If NPLI was removed also, the final KCRV would change by only +0.002 µm.
APMP.L-K8 report, 10 January 2013 Page 58 of 74

S/N 5256 All data Mean and uncertainty calculations En & Birge ratio2 Rsk (xxi i-xw)
xi st dev U95% k n u(xi) u2(xi) u2(xi) u-2(xi) u2(xi) En En RejectCountry Lab Date No. dimensionless Arithm Weighted Arithmentic Mean Weighted Mean
Australia NMIA 07/08 1 -0.813 0.0163 0.065 2.00 12 0.0325 1.1E-03 -770 947 8.54 -0.768 -0.725 -0.682 -0.730 -0.718 -0.706 Singapore NMC 08/08 2 -0.820 0.0137 0.030 2.00 12 0.0150 2.3E-04 -3644 4444 46.23 -0.768 -0.725 -0.682 -0.730 -0.718 -0.706
UK NPL 09/08 3 -0.693 0.0396 0.026 2.52 12 0.0103 1.1E-04 -6510 9394 5.88 -0.768 -0.725 -0.682 -0.730 -0.718 -0.706 Germany PTB 10/08 4 -0.690 0.140 2.00 12 0.0700 4.9E-03 -141 204 0.16 -0.768 -0.725 -0.682 -0.730 -0.718 -0.706
Hong Kong SCL 11/08 5 -0.768 -0.725 -0.682 -0.730 -0.718 -0.706Thailand NIMT 12/08 6 -0.670 0.0720 0.334 2.00 12 0.1670 2.8E-02 -24 36 0.08 -0.768 -0.725 -0.682 -0.730 -0.718 -0.706
Japan NMIJ 01/09 7 -0.653 0.0040 0.313 2.00 12 0.1565 2.4E-02 -27 41 0.17 -0.768 -0.725 -0.682 -0.730 -0.718 -0.706South Korea KRISS 04/09 8 -0.835 0.1420 0.091 2.20 12 0.0414 1.7E-03 -488 584 8.00 -0.768 -0.725 -0.682 -0.730 -0.718 -0.706
USA NIST 06/09 9 -0.768 -0.725 -0.682 -0.730 -0.718 -0.706India NPLI 07/09 10 -0.499 0.015 1.00 12 0.0150 2.3E-04 -2218 4444 213.18 -0.768 -0.725 -0.682 -0.730 -0.718 -0.706
South Africa NMISA 09/09 11 -0.777 0.1897 0.190 2.00 13 0.0949 9.0E-03 -86 111 0.39 -0.768 -0.725 -0.682 -0.730 -0.718 -0.706Egypt NIS 10/09 12 -0.768 -0.725 -0.682 -0.730 -0.718 -0.706China NIM 11/09 13 -0.817 0.0468 0.026 1.96 12 0.0133 1.8E-04 -4643 5683 55.68 -0.768 -0.725 -0.682 -0.730 -0.718 -0.706
Ch Teipei CMS 01/10 14 -0.677 0.1081 0.070 2.00 12 0.0350 1.2E-03 -553 816 1.37 -0.768 -0.725 -0.682 -0.730 -0.718 -0.706Vietnam VMI 03/10 15 -0.817 0.070 2.00 12 0.0350 1.2E-03 -667 816 8.00 -0.768 -0.725 -0.682 -0.730 -0.718 -0.706
Indonesia KIM-LIPI 04/10 16 -0.660 0.1388 0.156 2.00 60 0.0780 6.1E-03 -108 164 0.55 -0.768 -0.725 -0.682 -0.730 -0.718 -0.706Australia rpt NMIA 06/10 1 -0.804 0.0231 0.066 2.00 11 0.0330 1.1E-03 -738 918 6.790 -0.768 -0.725 -0.682 -0.730 -0.718 -0.706
Count 13 0.07831 -19879 27686 348.24 = MaxSt Deviation 0.0986 5.39 = R B
ESDM 0.0273
1.13 1.441.82 3.16
1.10 1.27
4.95 11.39 Worst
1.84 3.46
1.12 1.39
1.01 1.284.95 11.39
0.63 0.870.24 0.20
0.16 0.140.23 0.21
0.27 0.31
0.58 0.58
0.40 0.37
1.35 = R B limMean ust k Uexp
µm µm µm %Arithmetic 0.0215 2.00 -5.9Weighted -0.718 0.0060 2.00 0.0120 -1.7
-0.725 0.0431
All data
-1.20
-1.00
-0.80
-0.60
-0.40
-0.20
0.00
1 2 3 4 5 6 7 8 9 10 11 12 13 14 15 16 1
)1/(81 −+< nRBStandard deviations from each laboratory
0
0.02
0.04
0.06
0.08
0.1
0.12
0.14
0.16
0.18
0.2
1 2 3 4 5 6 7 8 9 10 11 12 13 14 15 16 1
Comments for 5256 Rsk results:SCL, NIST and NIS did not submit a result.NIM and CMS reported the ESDM which is converted to the standard deviation [s = ESDM * sqrt(n)]. NPLI uncertainty reported at k = 1.0.KIM-LIPI repeated the measurement set 5 times.NMISA, KRISS, and KIM-LIPI had the highest standard deviations.Comparison of initial and final NMIA result is En = 0.10.
Submitted results: 13Outliers removed: 3 (NPLI, NPL, CMS)Final population size: 10Key Comparison Reference Value: Rsk = -0.813 ± 0.018
APMP.L-K8 report, 10 January 2013 Page 59 of 74
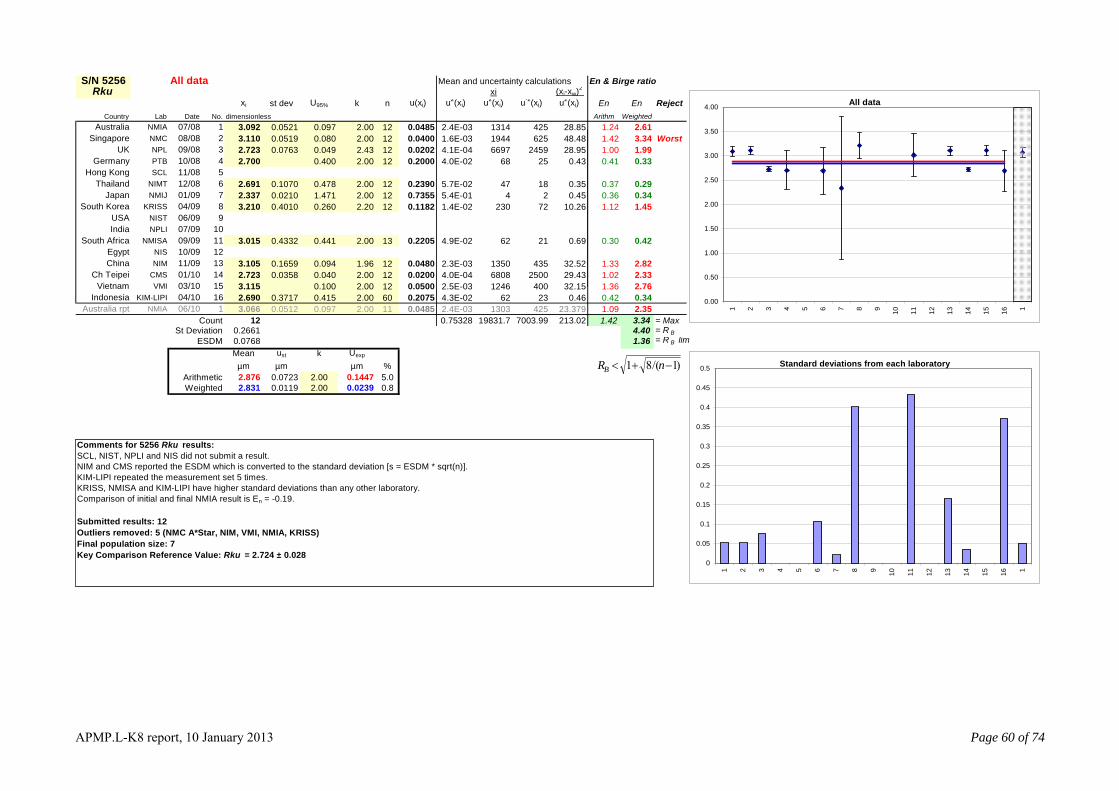
S/N 5256 All data Mean and uncertainty calculations En & Birge ratio2 Rku xi (xi-xw)
xi st dev U95% k n u(xi) u2(xi) u2(xi) u-2(xi) u2(xi) En En RejectCountry Lab Date No. dimensionless Arithm Weighted Arithmentic Mean Weighted Mean
Australia NMIA 07/08 1 3.092 0.0521 0.097 2.00 12 0.0485 2.4E-03 1314 425 28.85 2.731 2.876 3.021 2.808 2.831 2.855 Singapore NMC 08/08 2 3.110 0.0519 0.080 2.00 12 0.0400 1.6E-03 1944 625 48.48 2.731 2.876 3.021 2.808 2.831 2.855
UK NPL 09/08 3 2.723 0.0763 0.049 2.43 12 0.0202 4.1E-04 6697 2459 28.95 2.731 2.876 3.021 2.808 2.831 2.855 Germany PTB 10/08 4 2.700 0.400 2.00 12 0.2000 4.0E-02 68 25 0.43 2.731 2.876 3.021 2.808 2.831 2.855
Hong Kong SCL 11/08 5 2.731 2.876 3.021 2.808 2.831 2.855Thailand NIMT 12/08 6 2.691 0.1070 0.478 2.00 12 0.2390 5.7E-02 47 18 0.35 2.731 2.876 3.021 2.808 2.831 2.855
Japan NMIJ 01/09 7 2.337 0.0210 1.471 2.00 12 0.7355 5.4E-01 4 2 0.45 2.731 2.876 3.021 2.808 2.831 2.855South Korea KRISS 04/09 8 3.210 0.4010 0.260 2.20 12 0.1182 1.4E-02 230 72 10.26 2.731 2.876 3.021 2.808 2.831 2.855
USA NIST 06/09 9 2.731 2.876 3.021 2.808 2.831 2.855India NPLI 07/09 10 2.731 2.876 3.021 2.808 2.831 2.855
South Africa NMISA 09/09 11 3.015 0.4332 0.441 2.00 13 0.2205 4.9E-02 62 21 0.69 2.731 2.876 3.021 2.808 2.831 2.855Egypt NIS 10/09 12 2.731 2.876 3.021 2.808 2.831 2.855China NIM 11/09 13 3.105 0.1659 0.094 1.96 12 0.0480 2.3E-03 1350 435 32.52 2.731 2.876 3.021 2.808 2.831 2.855
Ch Teipei CMS 01/10 14 2.723 0.0358 0.040 2.00 12 0.0200 4.0E-04 6808 2500 29.43 2.731 2.876 3.021 2.808 2.831 2.855Vietnam VMI 03/10 15 3.115 0.100 2.00 12 0.0500 2.5E-03 1246 400 32.15 2.731 2.876 3.021 2.808 2.831 2.855
Indonesia KIM-LIPI 04/10 16 2.690 0.3717 0.415 2.00 60 0.2075 4.3E-02 62 23 0.46 2.731 2.876 3.021 2.808 2.831 2.855Australia rpt NMIA 06/10 1 3.066 0.0512 0.097 2.00 11 0.0485 2.4E-03 1303 425 23.379 2.731 2.876 3.021 2.808 2.831 2.855
Count 12 0.75328 19831.7 7003.99 213.02 = MaxSt Deviation 0.2661 4.40 = R B
E
1.24 2.611.42 3.34 Worst1.00 1.99
1.12 1.45
1.33 2.821.02 2.331.36 2.76
1.09 2.351.42 3.34
0.41 0.33
0.37 0.290.36 0.34
0.30 0.42
0.42 0.34
SDM 0.0768 1.36 = R B limMean ust k Uexp
µm µm µm %Arithmetic 0.0723 2.00 5.0Weighted 2.831 0.0119 2.00 0.0239 0.8
2.876 0.1447
All data
0.00
0.50
1.00
1.50
2.00
2.50
3.00
3.50
4.00
1 2 3 4 5 6 7 8 9 10 11 12 13 14 15 16 1
)1/(81 −+< nRBStandard deviations from each laboratory
0
0.05
0.1
0.15
0.2
0.25
0.3
0.35
0.4
0.45
0.5
1 2 3 4 5 6 7 8 9 10 11 12 13 14 15 16 1
Comments for 5256 Rku results:SCL, NIST, NPLI and NIS did not submit a result.NIM and CMS reported the ESDM which is converted to the standard deviation [s = ESDM * sqrt(n)]. KIM-LIPI repeated the measurement set 5 times.KRISS, NMISA and KIM-LIPI have higher standard deviations than any other laboratory.Comparison of initial and final NMIA result is En = -0.19.
Submitted results: 12Outliers removed: 5 (NMC A*Star, NIM, VMI, NMIA, KRISS)Final population size: 7Key Comparison Reference Value: Rku = 2.724 ± 0.028
APMP.L-K8 report, 10 January 2013 Page 60 of 74
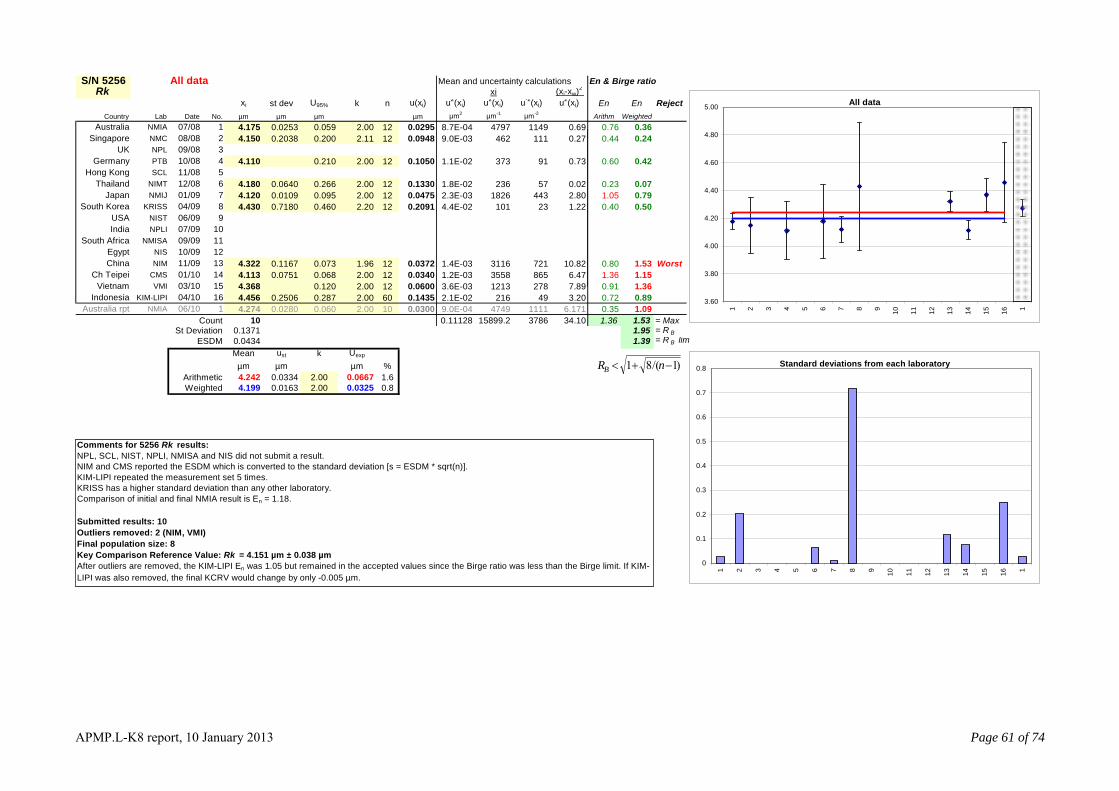
S/N 5256 All data Mean and uncertainty calculations En & Birge ratio2 Rk (xxi i-xw)
xi st dev U95% k n u(xi) u2(xi) u2(xi) u-2(xi) u2(xi) En En RejectCountry Lab Date No. µm µm µm µm µm2 µm-1 µm-2 Arithm Weighted Arithmentic Mean Weighted Mean
Australia NMIA 07/08 1 4.175 0.0253 0.059 2.00 12 0.0295 8.7E-04 4797 1149 0.69 4.176 4.242 4.309 4.167 4.199 4.232 Singapore NMC 08/08 2 4.150 0.2038 0.200 2.11 12 0.0948 9.0E-03 462 111 0.27 4.176 4.242 4.309 4.167 4.199 4.232
UK NPL 09/08 3 4.176 4.242 4.309 4.167 4.199 4.232 Germany PTB 10/08 4 4.110 0.210 2.00 12 0.1050 1.1E-02 373 91 0.73 4.176 4.242 4.309 4.167 4.199 4.232
Hong Kong SCL 11/08 5 4.176 4.242 4.309 4.167 4.199 4.232Thailand NIMT 12/08 6 4.180 0.0640 0.266 2.00 12 0.1330 1.8E-02 236 57 0.02 4.176 4.242 4.309 4.167 4.199 4.232
Japan NMIJ 01/09 7 4.120 0.0109 0.095 2.00 12 0.0475 2.3E-03 1826 443 2.80 4.176 4.242 4.309 4.167 4.199 4.232South Korea KRISS 04/09 8 4.430 0.7180 0.460 2.20 12 0.2091 4.4E-02 101 23 1.22 4.176 4.242 4.309 4.167 4.199 4.232
USA NIST 06/09 9 4.176 4.242 4.309 4.167 4.199 4.232India NPLI 07/09 10 4.176 4.242 4.309 4.167 4.199 4.232
South Africa NMISA 09/09 11 4.176 4.242 4.309 4.167 4.199 4.232Egypt NIS 10/09 12 4.176 4.242 4.309 4.167 4.199 4.232China NIM 11/09 13 4.322 0.1167 0.073 1.96 12 0.0372 1.4E-03 3116 721 10.82 4.176 4.242 4.309 4.167 4.199 4.232
Ch Teipei CMS 01/10 14 4.113 0.0751 0.068 2.00 12 0.0340 1.2E-03 3558 865 6.47 4.176 4.242 4.309 4.167 4.199 4.232Vietnam VMI 03/10 15 4.368 0.120 2.00 12 0.0600 3.6E-03 1213 278 7.89 4.176 4.242 4.309 4.167 4.199 4.232
Indonesia KIM-LIPI 04/10 16 4.456 0.2506 0.287 2.00 60 0.1435 2.1E-02 216 49 3.20 4.176 4.242 4.309 4.167 4.199 4.232Australia rpt NMIA 06/10 1 4.274 0.0280 0.060 2.00 10 0.0300 9.0E-04 4749 1111 6.171 4.176 4.242 4.309 4.167 4.199 4.232
Count 10 0.11128 15899.2 3786 34.10 = MaxSt Deviation 0.1371 1.95 = R B
E
0.76 0.360.44 0.24
0.60 0.42
0.23 0.070.79
0.40 0.50
0.80
0.910.72 0.890.351.36
1.05
1.53 Worst1.36 1.15
1.36
1.091.53
SDM 0.0434 1.39 = R B limMean ust k Uexp
µm µm µm %Arithmetic 0.0334 2.00 1.6Weighted 4.199 0.0163 2.00 0.0325 0.8
4.242 0.0667
All data
3.60
3.80
4.00
4.20
4.40
4.60
4.80
5.00
1 2 3 4 5 6 7 8 9 10 11 12 13 14 15 16 1
)1/(81 −+< nRBStandard deviations from each laboratory
0
0.1
0.2
0.3
0.4
0.5
0.6
0.7
0.8
1 2 3 4 5 6 7 8 9 10 11 12 13 14 15 16 1
Comments for 5256 Rk results:NPL, SCL, NIST, NPLI, NMISA and NIS did not submit a result.NIM and CMS reported the ESDM which is converted to the standard deviation [s = ESDM * sqrt(n)]. KIM-LIPI repeated the measurement set 5 times.KRISS has a higher standard deviation than any other laboratory.Comparison of initial and final NMIA result is En = 1.18.
Submitted results: 10Outliers removed: 2 (NIM, VMI)Final population size: 8Key Comparison Reference Value: Rk = 4.151 µm ± 0.038 µmAfter outliers are removed, the KIM-LIPI En was 1.05 but remained in the accepted values since the Birge ratio was less than the Birge limit. If KIM-LIPI was also removed, the final KCRV would change by only -0.005 µm.
APMP.L-K8 report, 10 January 2013 Page 61 of 74

S/N 5256 All data Mean and uncertainty calculations En & Birge ratio2 Rpk (xxi i-xw)
xi st dev U95% k n u(xi) u2(xi) u2(xi) u-2(xi) u2(xi) En En RejectCountry Lab Date No. µm µm µm µm µm2 µm-1 µm-2 Arithm Weighted Arithmentic Mean Weighted Mean
Australia NMIA 07/08 1 0.258 0.0154 0.059 2.00 11 0.0295 8.7E-04 296 1149 0.08 0.234 0.290 0.346 0.249 0.266 0.283 Singapore NMC 08/08 2 0.340 0.0776 0.060 2.15 12 0.0279 7.8E-04 437 1284 7.02 0.234 0.290 0.346 0.249 0.266 0.283
UK NPL 09/08 3 0.234 0.290 0.346 0.249 0.266 0.283 Germany PTB 10/08 4 0.260 0.040 2.00 12 0.0200 4.0E-04 650 2500 0.09 0.234 0.290 0.346 0.249 0.266 0.283
Hong Kong SCL 11/08 5 0.234 0.290 0.346 0.249 0.266 0.283Thailand NIMT 12/08 6 0.293 0.1140 0.501 2.00 12 0.2505 6.3E-02 5 16 0.01 0.234 0.290 0.346 0.249 0.266 0.283
Japan NMIJ 01/09 7 0.253 0.0035 0.040 2.00 12 0.0200 4.0E-04 633 2500 0.43 0.234 0.290 0.346 0.249 0.266 0.283South Korea KRISS 04/09 8 0.276 0.1230 0.079 2.20 12 0.0359 1.3E-03 214 776 0.08 0.234 0.290 0.346 0.249 0.266 0.283
USA NIST 06/09 9 0.234 0.290 0.346 0.249 0.266 0.283India NPLI 07/09 10 0.234 0.290 0.346 0.249 0.266 0.283
South Africa NMISA 09/09 11 0.234 0.290 0.346 0.249 0.266 0.283Egypt NIS 10/09 12 0.234 0.290 0.346 0.249 0.266 0.283China NIM 11/09 13 0.243 0.0655 0.049 1.96 12 0.0250 6.3E-04 389 1600 0.85 0.234 0.290 0.346 0.249 0.266 0.283
Ch Teipei CMS 01/10 14 0.256 0.0493 0.032 2.00 12 0.0160 2.6E-04 1000 3906 0.40 0.234 0.290 0.346 0.249 0.266 0.283Vietnam VMI 03/10 15 0.320 0.135 2.00 12 0.0675 4.6E-03 70 219 0.64 0.234 0.290 0.346 0.249 0.266 0.283
Indonesia KIM-LIPI 04/10 16 0.401 0.1509 0.170 2.00 60 0.0850 7.2E-03 56 138 2.52 0.234 0.290 0.346 0.249 0.266 0.283Australia rpt NMIA 06/10 1 0.261 0.0254 0.060 2.00 12 0.0300 9.0E-04 290 1111 0.029 0.234 0.290 0.346 0.249 0.266 0.283
Count 10 0.07915 3748.78 14088.7 12.11 = MaxSt Deviation 0.0501 1.1
0.39 0.130.61
0.43 0.14
0.01 0.050.54 0.300.14 0.12
0.63 0.450.53 0.280.21 0.400.62 0.790.35 0.080.63 1.19
1.19 Worst
6 = R BESDM 0.0158 1.39 = R B lim
Mean ust k Uexp
µm µm µm %Arithmetic 0.0281 2.00 19.4Weighted 0.266 0.0084 2.00 0.0168 6.3
0.290 0.0563
All data
-0.40
-0.20
0.00
0.20
0.40
0.60
0.80
1.00
1 2 3 4 5 6 7 8 9 10 11 12 13 14 15 16 1
)1/(81 −+< nRBStandard deviations from each laboratory
0
0.02
0.04
0.06
0.08
0.1
0.12
0.14
0.16
1 2 3 4 5 6 7 8 9 10 11 12 13 14 15 16 1
Comments for 5256 Rpk results:NPL, SCL, NIST, NPLI, NMISA and NIS did not submit a result.NIM and CMS reported the ESDM which is converted to the standard deviation [s = ESDM * sqrt(n)]. KIM-LIPI repeated the measurement set 5 times.KIM-LIPI, KRISS and NIMT have significantly higher standard deviations than any other laboratory.Comparison of initial and final NMIA result is En = 0.04.
Submitted results: 10Outliers removed: 0Final population size: 10Key Comparison Reference Value: Rpk = 0.266 µm ± 0.017 µmThe NMC A*Star En was 1.2 but remained in the accepted values since the Birge ratio was less than the Birge limit. If NMC A*Star was removed, the final KCRV would change by -0.007 µm.
APMP.L-K8 report, 10 January 2013 Page 62 of 74
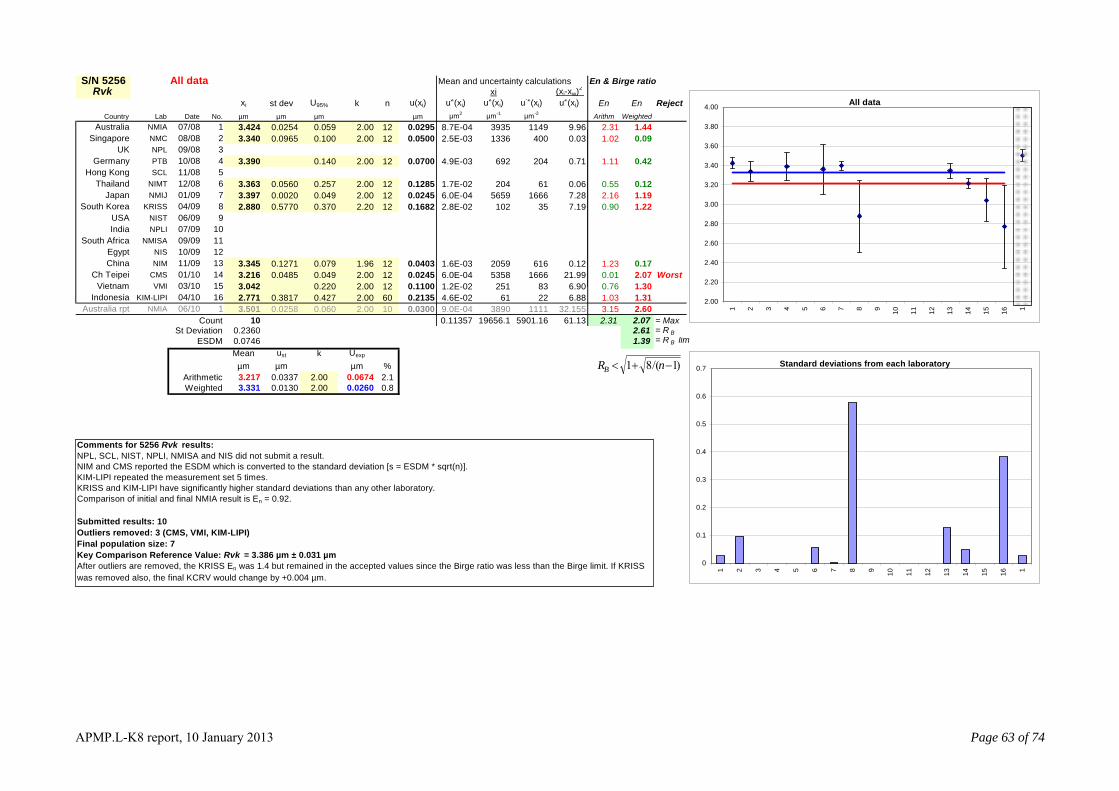
S/N 5256 All data Mean and uncertainty calculations En & Birge ratio2 Rvk (xxi i-xw)
xi st dev U95% k n u(xi) u2(xi) u2(xi) u-2(xi) u2(xi) En En RejectCountry Lab Date No. µm µm µm µm µm2 µm-1 µm-2 Arithm Weighted Arithmentic Mean Weighted Mean
Australia NMIA 07/08 1 3.424 0.0254 0.059 2.00 12 0.0295 8.7E-04 3935 1149 9.96 3.149 3.217 3.284 3.305 3.331 3.357 Singapore NMC 08/08 2 3.340 0.0965 0.100 2.00 12 0.0500 2.5E-03 1336 400 0.03 3.149 3.217 3.284 3.305 3.331 3.357
UK NPL 09/08 3 3.149 3.217 3.284 3.305 3.331 3.357 Germany PTB 10/08 4 3.390 0.140 2.00 12 0.0700 4.9E-03 692 204 0.71 3.149 3.217 3.284 3.305 3.331 3.357
Hong Kong SCL 11/08 5 3.149 3.217 3.284 3.305 3.331 3.357Thailand NIMT 12/08 6 3.363 0.0560 0.257 2.00 12 0.1285 1.7E-02 204 61 0.06 3.149 3.217 3.284 3.305 3.331 3.357
Japan NMIJ 01/09 7 3.397 0.0020 0.049 2.00 12 0.0245 6.0E-04 5659 1666 7.28 3.149 3.217 3.284 3.305 3.331 3.357South Korea KRISS 04/09 8 2.880 0.5770 0.370 2.20 12 0.1682 2.8E-02 102 35 7.19 3.149 3.217 3.284 3.305 3.331 3.357
USA NIST 06/09 9 3.149 3.217 3.284 3.305 3.331 3.357India NPLI 07/09 10 3.149 3.217 3.284 3.305 3.331 3.357
South Africa NMISA 09/09 11 3.149 3.217 3.284 3.305 3.331 3.357Egypt NIS 10/09 12 3.149 3.217 3.284 3.305 3.331 3.357China NIM 11/09 13 3.345 0.1271 0.079 1.96 12 0.0403 1.6E-03 2059 616 0.12 3.149 3.217 3.284 3.305 3.331 3.357
Ch Teipei CMS 01/10 14 3.216 0.0485 0.049 2.00 12 0.0245 6.0E-04 5358 1666 21.99 3.149 3.217 3.284 3.305 3.331 3.357Vietnam VMI 03/10 15 3.042 0.220 2.00 12 0.1100 1.2E-02 251 83 6.90 3.149 3.217 3.284 3.305 3.331 3.357
Indonesia KIM-LIPI 04/10 16 2.771 0.3817 0.427 2.00 60 0.2135 4.6E-02 61 22 6.88 3.149 3.217 3.284 3.305 3.331 3.357Australia rpt NMIA 06/10 1 3.501 0.0258 0.060 2.00 10 0.0300 9.0E-04 3890 1111 32.155 3.149 3.217 3.284 3.305 3.331 3.357
Count 10 0.11357 19656.1 5901.16 61.13 = MaxSt Deviation 0.2360 2.61 = R B
E
2.31 1.441.02
1.11
2.16 1.191.22
1.232.07 Worst1.30
1.03 1.313.15 2.602.31 2.07
0.09
0.42
0.55 0.12
0.90
0.170.010.76
SDM 0.0746 1.39 = R B limMean ust k Uexp
µm µm µm %Arithmetic 0.0337 2.00 2.1Weighted 3.331 0.0130 2.00 0.0260 0.8
3.217 0.0674
All data
2.00
2.20
2.40
2.60
2.80
3.00
3.20
3.40
3.60
3.80
4.00
1 2 3 4 5 6 7 8 9 10 11 12 13 14 15 16 1
)1/(81 −+< nRBStandard deviations from each laboratory
0
0.1
0.2
0.3
0.4
0.5
0.6
0.7
1 2 3 4 5 6 7 8 9 10 11 12 13 14 15 16 1
Comments for 5256 Rvk results:NPL, SCL, NIST, NPLI, NMISA and NIS did not submit a result.NIM and CMS reported the ESDM which is converted to the standard deviation [s = ESDM * sqrt(n)]. KIM-LIPI repeated the measurement set 5 times.KRISS and KIM-LIPI have significantly higher standard deviations than any other laboratory.Comparison of initial and final NMIA result is En = 0.92.
Submitted results: 10Outliers removed: 3 (CMS, VMI, KIM-LIPI)Final population size: 7Key Comparison Reference Value: Rvk = 3.386 µm ± 0.031 µmAfter outliers are removed, the KRISS En was 1.4 but remained in the accepted values since the Birge ratio was less than the Birge limit. If KRISS was removed also, the final KCRV would change by +0.004 µm.
APMP.L-K8 report, 10 January 2013 Page 63 of 74
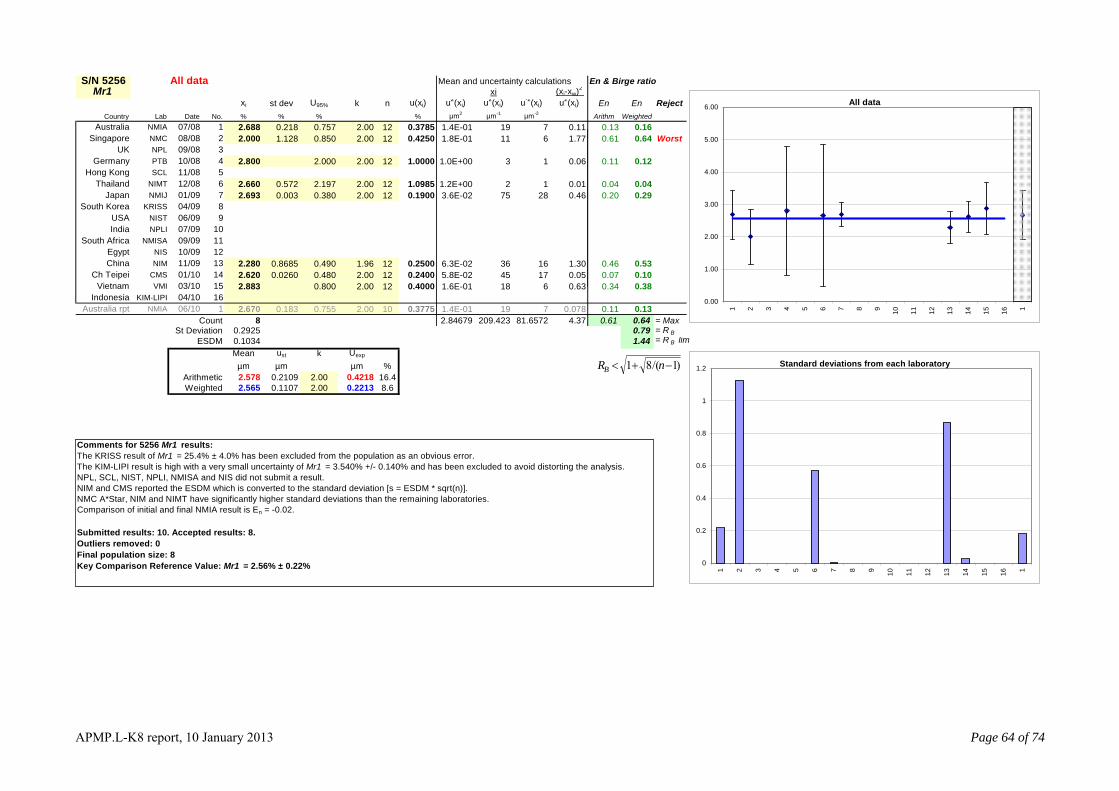
S/N 5256 All data Mean and uncertainty calculations En & Birge ratio2 Mr1 (xxi i-xw)
xi st dev U95% k n u(xi) u2(xi) u2(xi) u-2(xi) u2(xi) En En RejectCountry Lab Date No. % % % % µm2 µm-1 µm-2 Arithm Weighted Arithmentic Mean Weighted Mean
Australia NMIA 07/08 1 2.688 0.218 0.757 2.00 12 0.3785 1.4E-01 19 7 0.11 2.156 2.578 3.000 2.343 2.565 2.786 Singapore NMC 08/08 2 2.000 1.128 0.850 2.00 12 0.4250 1.8E-01 11 6 1.77 2.156 2.578 3.000 2.343 2.565 2.786
UK NPL 09/08 3 2.156 2.578 3.000 2.343 2.565 2.786 Germany PTB 10/08 4 2.800 2.000 2.00 12 1.0000 1.0E+00 3 1 0.06 2.156 2.578 3.000 2.343 2.565 2.786
Hong Kong SCL 11/08 5 2.156 2.578 3.000 2.343 2.565 2.786Thailand NIMT 12/08 6 2.660 0.572 2.197 2.00 12 1.0985 1.2E+00 2 1 0.01 2.156 2.578 3.000 2.343 2.565 2.786
Japan NMIJ 01/09 7 2.693 0.003 0.380 2.00 12 0.1900 3.6E-02 75 28 0.46 2.156 2.578 3.000 2.343 2.565 2.786South Korea KRISS 04/09 8 2.156 2.578 3.000 2.343 2.565 2.786
USA NIST 06/09 9 2.156 2.578 3.000 2.343 2.565 2.786India NPLI 07/09 10 2.156 2.578 3.000 2.343 2.565 2.786
South Africa NMISA 09/09 11 2.156 2.578 3.000 2.343 2.565 2.786Egypt NIS 10/09 12 2.156 2.578 3.000 2.343 2.565 2.786China NIM 11/09 13 2.280 0.8685 0.490 1.96 12 0.2500 6.3E-02 36 16 1.30 2.156 2.578 3.000 2.343 2.565 2.786
Ch Teipei CMS 01/10 14 2.620 0.0260 0.480 2.00 12 0.2400 5.8E-02 45 17 0.05 2.156 2.578 3.000 2.343 2.565 2.786Vietnam VMI 03/10 15 2.883 0.800 2.00 12 0.4000 1.6E-01 18 6 0.63 2.156 2.578 3.000 2.343 2.565 2.786
Indonesia KIM-LIPI 04/10 16 2.156 2.578 3.000 2.343 2.565 2.786Australia rpt NMIA 06/10 1 2.670 0.183 0.755 2.00 10 0.3775 1.4E-01 19 7 0.078 2.156 2.578 3.000 2.343 2.565 2.786
Count 8 2.84679 209.423 81.6572 4.37 = MaxSt Deviation 0.2925 0.79 = R B
E
0.13 0.160.61 0.64
0.11 0.12
0.04 0.040.20 0.29
0.46 0.530.07 0.100.34 0.38
0.11 0.130.61 0.64
Worst
SDM 0.1034 1.44 = R B limMean ust k Uexp
µm µm µm %Arithmetic 0.2109 2.00 16.4Weighted 2.565 0.1107 2.00 0.2213 8.6
2.578 0.4218
All data
0.00
1.00
2.00
3.00
4.00
5.00
6.00
1 2 3 4 5 6 7 8 9 10 11 12 13 14 15 16 1
)1/(81 −+< nRBStandard deviations from each laboratory
0
0.2
0.4
0.6
0.8
1
1.2
1 2 3 4 5 6 7 8 9 10 11 12 13 14 15 16 1
Comments for 5256 Mr1 results:The KRISS result of Mr1 = 25.4% ± 4.0% has been excluded from the population as an obvious error. The KIM-LIPI result is high with a very small uncertainty of Mr1 = 3.540% +/- 0.140% and has been excluded to avoid distorting the analysis.NPL, SCL, NIST, NPLI, NMISA and NIS did not submit a result.NIM and CMS reported the ESDM which is converted to the standard deviation [s = ESDM * sqrt(n)]. NMC A*Star, NIM and NIMT have significantly higher standard deviations than the remaining laboratories.Comparison of initial and final NMIA result is En = -0.02.
Submitted results: 10. Accepted results: 8.Outliers removed: 0Final population size: 8Key Comparison Reference Value: Mr1 = 2.56% ± 0.22%
APMP.L-K8 report, 10 January 2013 Page 64 of 74

S/N 5256 All data Mean and uncertainty calculations En & Birge ratio2 Mr2 (xxi i-xw)
xi st dev U95% k n u(xi) u2(xi) u2(xi) u-2(xi) u2(xi) En En RejectCountry Lab Date No. % % % % µm2 µm-1 µm-2 Arithm Weighted Arithmentic Mean Weighted Mean
Australia NMIA 07/08 1 77.471 0.5977 0.968 2.00 12 0.4840 2.3E-01 331 4 1.36 77.627 78.168 78.708 77.661 78.035 78.409 Singapore NMC 08/08 2 78.000 1.2060 1.000 2.00 12 0.5000 2.5E-01 312 4 0.00 77.627 78.168 78.708 77.661 78.035 78.409
UK NPL 09/08 3 77.627 78.168 78.708 77.661 78.035 78.409 Germany PTB 10/08 4 77.000 2.000 2.00 12 1.0000 1.0E+00 77 1 1.07 77.627 78.168 78.708 77.661 78.035 78.409
Hong Kong SCL 11/08 5 77.627 78.168 78.708 77.661 78.035 78.409Thailand NIMT 12/08 6 77.715 0.6750 2.078 2.00 12 1.0390 1.1E+00 72 1 0.09 77.627 78.168 78.708 77.661 78.035 78.409
Japan NMIJ 01/09 7 77.066 0.0740 1.325 2.00 12 0.6625 4.4E-01 176 2 2.14 77.627 78.168 78.708 77.661 78.035 78.409South Korea KRISS 04/09 8 79.200 2.4270 1.500 2.20 12 0.6818 4.6E-01 170 2 2.92 77.627 78.168 78.708 77.661 78.035 78.409
USA NIST 06/09 9 77.627 78.168 78.708 77.661 78.035 78.409India NPLI 07/09 10 77.627 78.168 78.708 77.661 78.035 78.409
South Africa NMISA 09/09 11 77.627 78.168 78.708 77.661 78.035 78.409Egypt NIS 10/09 12 77.627 78.168 78.708 77.661 78.035 78.409China NIM 11/09 13 78.780 1.2498 0.710 1.96 12 0.3622 1.3E-01 600 8 4.23 77.627 78.168 78.708 77.661 78.035 78.409
Ch Teipei CMS 01/10 14 77.170 0.7500 0.890 2.00 12 0.4450 2.0E-01 390 5 3.78 77.627 78.168 78.708 77.661 78.035 78.409Vietnam VMI 03/10 15 79.946 2.100 2.00 12 1.0500 1.1E+00 73 1 3.31 77.627 78.168 78.708 77.661 78.035 78.409
Indonesia KIM-LIPI 04/10 16 79.330 3.100 2.00 60 1.5500 2.4E+00 33 0 0.70 77.627 78.168 78.708 77.661 78.035 78.409Australia rpt NMIA 06/10 1 77.510 0.5259 0.968 2.00 10 0.4840 2.3E-01 331 4 1.177 77.627 78.168 78.708 77.661 78.035 78.409
Count 10 7.30181 2233.25 28.6185 19.61 = MaxSt Deviation 1.0669 1.4
0.63 0.540.15 0.03
0.56 0.51
0.21 0.150.77 0.700.65 0.75
0.69 0.930.96 0.900.82 0.900.37 0.410.59 0.510.96 0.93
Worst
8 = R BESDM 0.3374 1.39 = R B lim
Mean ust k Uexp
µm µm µm %Arithmetic 0.2702 2.00 0.7Weighted 78.035 0.1869 2.00 0.3739 0.5
78.168 0.5404
All data
74.00
75.00
76.00
77.00
78.00
79.00
80.00
81.00
82.00
83.00
1 2 3 4 5 6 7 8 9 10 11 12 13 14 15 16 1
)1/(81 −+< nRBStandard deviations from each laboratory
0
0.5
1
1.5
2
2.5
3
1 2 3 4 5 6 7 8 9 10 11 12 13 14 15 16 1
Comments for 5256 Mr2 results:NPL, SCL, NIST, NPLI, NMISA and NIS did not submit a result.NIM and CMS reported the ESDM which is converted to the standard deviation [s = ESDM * sqrt(n)]. KIM-LIPI repeated the measurement set 5 times.KRISS has a significantly higher standard deviation than any other laboratory.Comparison of initial and final NMIA result is En = 0.03.
Submitted results: 10Outliers removed: 1 (NIM)Final population size: 9Key Comparison Reference Value: Mr2 = 77.76% ± 0.44%The NIM result had an En of 0.93 but was removed since the Birge ratio was greater than the Birge limit. While the NIM result was closer to the KCRV than VMI and CMS, its uncertainty was significantly smaller. After removal of NIM, the VMI En was 1.02 but kept due to an acceptable Birge ratio. The CMS En was then 0.60.
APMP.L-K8 report, 10 January 2013 Page 65 of 74
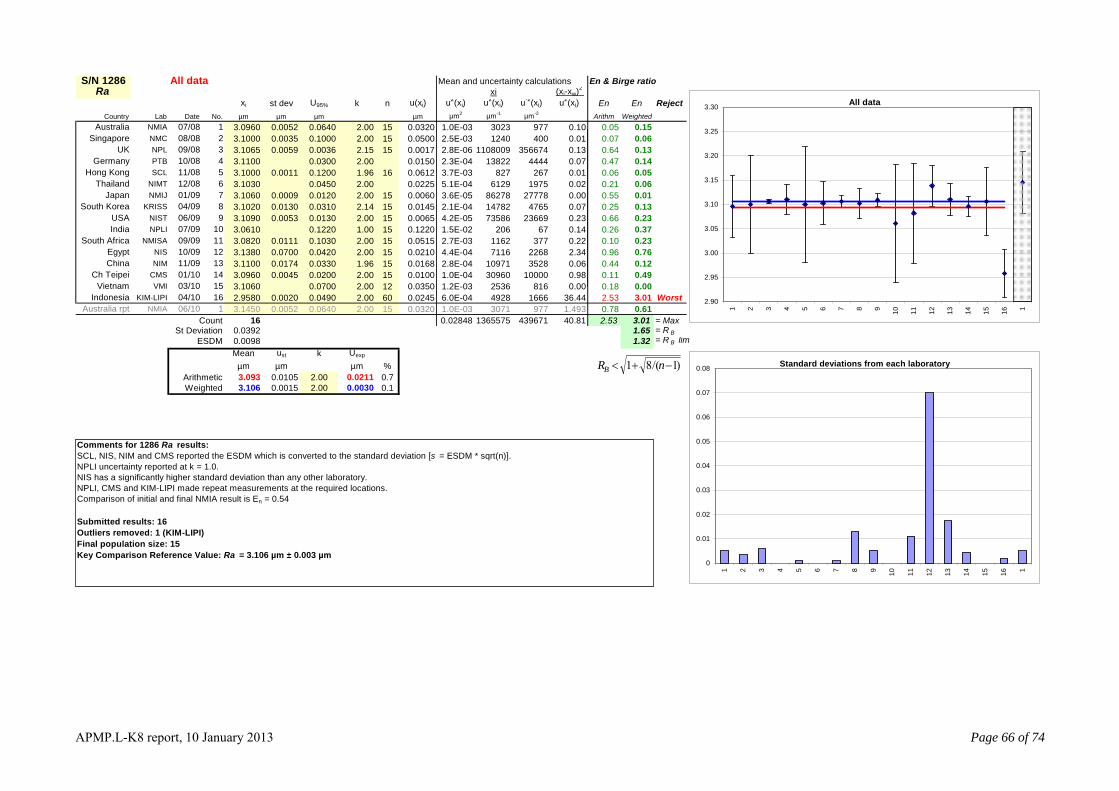
S/N 1286 All data Mean and uncertainty calculations En & Birge ratio2 Ra xi (xi-xw)
xi st dev U95% k n u(xi) u2(xi) u2(xi) u-2(xi) u2(xi) En En RejectCountry Lab Date No. µm µm µm µm µm2 µm-1 µm-2 Arithm Weighted Arithmentic Mean Weighted Mean
Australia NMIA 07/08 1 3.0960 0.0052 0.0640 2.00 15 0.0320 1.0E-03 3023 977 0.10 3.072 3.093 3.114 3.103 3.106 3.109 Singapore NMC 08/08 2 3.1000 0.0035 0.1000 2.00 15 0.0500 2.5E-03 1240 400 0.01 3.072 3.093 3.114 3.103 3.106 3.109
UK NPL 09/08 3 3.1065 0.0059 0.0036 2.15 15 0.0017 2.8E-06 1108009 356674 0.13 3.072 3.093 3.114 3.103 3.106 3.109 Germany PTB 10/08 4 3.1100 0.0300 2.00 0.0150 2.3E-04 13822 4444 0.07 3.072 3.093 3.114 3.103 3.106 3.109
Hong Kong SCL 11/08 5 3.1000 0.0011 0.1200 1.96 16 0.0612 3.7E-03 827 267 0.01 3.072 3.093 3.114 3.103 3.106 3.109Thailand NIMT 12/08 6 3.1030 0.0450 2.00 0.0225 5.1E-04 6129 1975 0.02 3.072 3.093 3.114 3.103 3.106 3.109
Japan NMIJ 01/09 7 3.1060 0.0009 0.0120 2.00 15 0.0060 3.6E-05 86278 27778 0.00 3.072 3.093 3.114 3.103 3.106 3.109South Korea KRISS 04/09 8 3.1020 0.0130 0.0310 2.14 15 0.0145 2.1E-04 14782 4765 0.07 3.072 3.093 3.114 3.103 3.106 3.109
USA NIST 06/09 9 3.1090 0.0053 0.0130 2.00 15 0.0065 4.2E-05 73586 23669 0.23 3.072 3.093 3.114 3.103 3.106 3.109India NPLI 07/09 10 3.0610 0.1220 1.00 15 0.1220 1.5E-02 206 67 0.14 3.072 3.093 3.114 3.103 3.106 3.109
South Africa NMISA 09/09 11 3.0820 0.0111 0.1030 2.00 15 0.0515 2.7E-03 1162 377 0.22 3.072 3.093 3.114 3.103 3.106 3.109Egypt NIS 10/09 12 3.1380 0.0700 0.0420 2.00 15 0.0210 4.4E-04 7116 2268 2.34 3.072 3.093 3.114 3.103 3.106 3.109China NIM 11/09 13 3.1100 0.0174 0.0330 1.96 15 0.0168 2.8E-04 10971 3528 0.06 3.072 3.093 3.114 3.103 3.106 3.109
Ch Teipei CMS 01/10 14 3.0960 0.0045 0.0200 2.00 15 0.0100 1.0E-04 30960 10000 0.98 3.072 3.093 3.114 3.103 3.106 3.109Vietnam VMI 03/10 15 3.1060 0.0700 2.00 12 0.0350 1.2E-03 2536 816 0.00 3.072 3.093 3.114 3.103 3.106 3.109
Indonesia KIM-LIPI 04/10 16 2.9580 0.0020 0.0490 2.00 60 0.0245 6.0E-04 4928 1666 36.44 3.072 3.093 3.114 3.103 3.106 3.109Australia rpt NMIA 06/10 1 3.1450 0.0052 0.0640 2.00 15 0.0320 1.0E-03 3071 977 1.493 3.072 3.093 3.114 3.103 3.106 3.109
Count 16 0.02848 1365575 439671 40.81 = MaxSt Deviation 0.0392 1.65 = R B
E
0.05 0.150.07 0.060.64 0.130.47 0.140.06 0.050.21 0.060.55 0.010.25 0.130.66 0.230.26 0.370.10 0.230.96 0.760.44 0.120.11 0.490.18 0.00
0.78 0.612.53 3.01
2.53 3.01 Worst
SDM 0.0098 1.32 = R B limMean ust k Uexp
µm µm µm %Arithmetic 0.0105 2.00 0.7Weighted 3.106 0.0015 2.00 0.0030 0.1
3.093 0.0211
All data
2.90
2.95
3.00
3.05
3.10
3.15
3.20
3.25
3.30
1 2 3 4 5 6 7 8 9 10 11 12 13 14 15 16 1
)1/(81 −+< nRBStandard deviations from each laboratory
0
0.01
0.02
0.03
0.04
0.05
0.06
0.07
0.08
1 2 3 4 5 6 7 8 9 10 11 12 13 14 15 16 1
Comments for 1286 Ra results:SCL, NIS, NIM and CMS reported the ESDM which is converted to the standard deviation [s = ESDM * sqrt(n)]. NPLI uncertainty reported at k = 1.0.NIS has a significantly higher standard deviation than any other laboratory.NPLI, CMS and KIM-LIPI made repeat measurements at the required locations.Comparison of initial and final NMIA result is En = 0.54
Submitted results: 16Outliers removed: 1 (KIM-LIPI)Final population size: 15Key Comparison Reference Value: Ra = 3.106 µm ± 0.003 µm
APMP.L-K8 report, 10 January 2013 Page 66 of 74
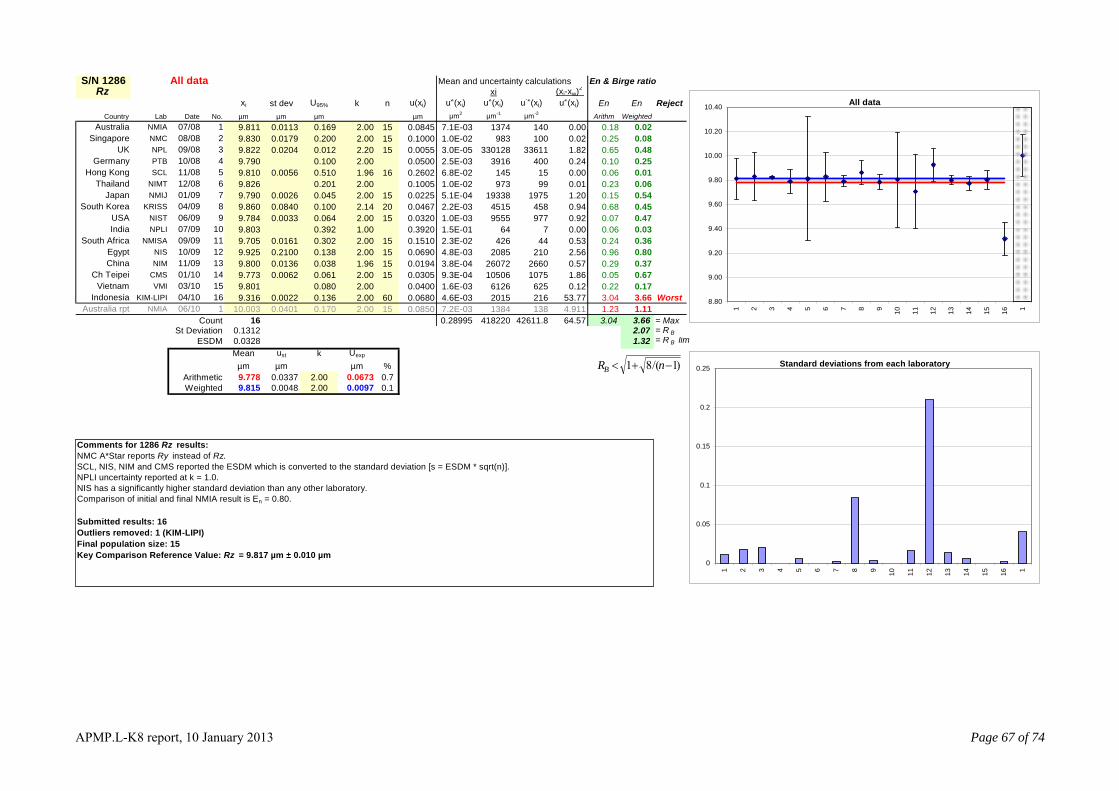
S/N 1286 All data Mean and uncertainty calculations En & Birge ratio2 Rz xi (xi-xw)
xi st dev U95% k n u(xi) u2(xi) u2(xi) u-2(xi) u2(xi) En En RejectCountry Lab Date No. µm µm µm µm µm2 µm-1 µm-2 Arithm Weighted Arithmentic Mean Weighted Mean
Australia NMIA 07/08 1 9.811 0.0113 0.169 2.00 15 0.0845 7.1E-03 1374 140 0.00 9.711 9.778 9.845 9.805 9.815 9.824 Singapore NMC 08/08 2 9.830 0.0179 0.200 2.00 15 0.1000 1.0E-02 983 100 0.02 9.711 9.778 9.845 9.805 9.815 9.824
UK NPL 09/08 3 9.822 0.0204 0.012 2.20 15 0.0055 3.0E-05 330128 33611 1.82 9.711 9.778 9.845 9.805 9.815 9.824 Germany PTB 10/08 4 9.790 0.100 2.00 0.0500 2.5E-03 3916 400 0.24 9.711 9.778 9.845 9.805 9.815 9.824
Hong Kong SCL 11/08 5 9.810 0.0056 0.510 1.96 16 0.2602 6.8E-02 145 15 0.00 9.711 9.778 9.845 9.805 9.815 9.824Thailand NIMT 12/08 6 9.826 0.201 2.00 0.1005 1.0E-02 973 99 0.01 9.711 9.778 9.845 9.805 9.815 9.824
Japan NMIJ 01/09 7 9.790 0.0026 0.045 2.00 15 0.0225 5.1E-04 19338 1975 1.20 9.711 9.778 9.845 9.805 9.815 9.824South Korea KRISS 04/09 8 9.860 0.0840 0.100 2.14 20 0.0467 2.2E-03 4515 458 0.94 9.711 9.778 9.845 9.805 9.815 9.824
USA NIST 06/09 9 9.784 0.0033 0.064 2.00 15 0.0320 1.0E-03 9555 977 0.92 9.711 9.778 9.845 9.805 9.815 9.824India NPLI 07/09 10 9.803 0.392 1.00 0.3920 1.5E-01 64 7 0.00 9.711 9.778 9.845 9.805 9.815 9.824
South Africa NMISA 09/09 11 9.705 0.0161 0.302 2.00 15 0.1510 2.3E-02 426 44 0.53 9.711 9.778 9.845 9.805 9.815 9.824Egypt NIS 10/09 12 9.925 0.2100 0.138 2.00 15 0.0690 4.8E-03 2085 210 2.56 9.711 9.778 9.845 9.805 9.815 9.824China NIM 11/09 13 9.800 0.0136 0.038 1.96 15 0.0194 3.8E-04 26072 2660 0.57 9.711 9.778 9.845 9.805 9.815 9.824
Ch Teipei CMS 01/10 14 9.773 0.0062 0.061 2.00 15 0.0305 9.3E-04 10506 1075 1.86 9.711 9.778 9.845 9.805 9.815 9.824Vietnam VMI 03/10 15 9.801 0.080 2.00 0.0400 1.6E-03 6126 625 0.12 9.711 9.778 9.845 9.805 9.815 9.824
Indonesia KIM-LIPI 04/10 16 9.316 0.0022 0.136 2.00 60 0.0680 4.6E-03 2015 216 53.77 9.711 9.778 9.845 9.805 9.815 9.824Australia rpt NMIA 06/10 1 10.003 0.0401 0.170 2.00 15 0.0850 7.2E-03 1384 138 4.911 9.711 9.778 9.845 9.805 9.815 9.824
Count 16 0.28995 418220 42611.8 64.57 = MaxSt Deviation 0.1312 2.0
0.18 0.020.25 0.080.65 0.480.10 0.250.06 0.010.23 0.060.15 0.540.68 0.450.07 0.470.06 0.030.24 0.360.96 0.800.29 0.370.05 0.670.22 0.173.04 3.66 Worst1.23 1.113.04 3.66
7 = R BESDM 0.0328 1.32 = R B lim
Mean ust k Uexp
µm µm µm %Arithmetic 0.0337 2.00 0.7Weighted 9.815 0.0048 2.00 0.0097 0.1
9.778 0.0673
All data
8.80
9.00
9.20
9.40
9.60
9.80
10.00
10.20
10.40
1 2 3 4 5 6 7 8 9 10 11 12 13 14 15 16 1
)1/(81 −+< nRBStandard deviations from each laboratory
0
0.05
0.1
0.15
0.2
0.25
1 2 3 4 5 6 7 8 9 10 11 12 13 14 15 16 1
Comments for 1286 Rz results:NMC A*Star reports Ry instead of Rz.SCL, NIS, NIM and CMS reported the ESDM which is converted to the standard deviation [s = ESDM * sqrt(n)]. NPLI uncertainty reported at k = 1.0.NIS has a significantly higher standard deviation than any other laboratory.Comparison of initial and final NMIA result is En = 0.80.
Submitted results: 16Outliers removed: 1 (KIM-LIPI)Final population size: 15Key Comparison Reference Value: Rz = 9.817 µm ± 0.010 µm
APMP.L-K8 report, 10 January 2013 Page 67 of 74
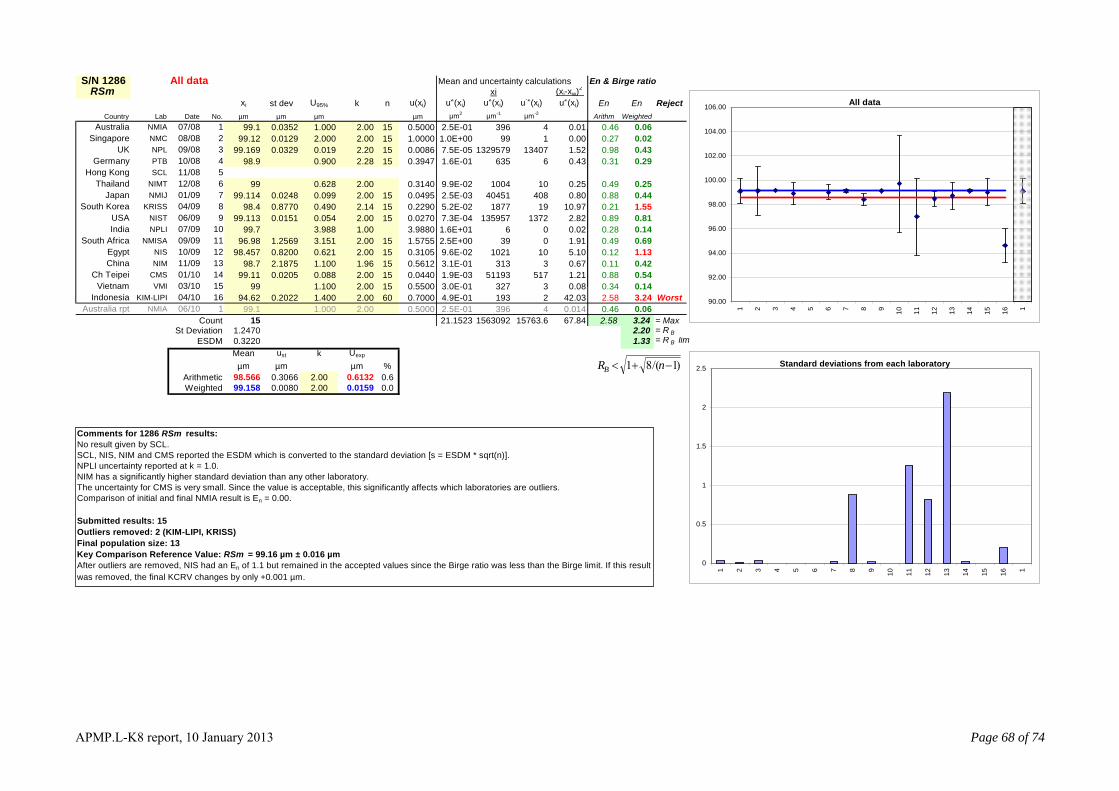
S/N 1286 All data Mean and uncertainty calculations En & Birge ratio2 RSm xi (xi-xw)
xi st dev U95% k n u(xi) u2(xi) u2(xi) u-2(xi) u2(xi) En En RejectCountry Lab Date No. µm µm µm µm µm2 µm-1 µm-2 Arithm Weighted Arithmentic Mean Weighted Mean
Australia NMIA 07/08 1 99.1 0.0352 1.000 2.00 15 0.5000 2.5E-01 396 4 0.01 97.952 98.566 99.179 99.142 99.158 99.174 Singapore NMC 08/08 2 99.12 0.0129 2.000 2.00 15 1.0000 1.0E+00 99 1 0.00 97.952 98.566 99.179 99.142 99.158 99.174
UK NPL 09/08 3 99.169 0.0329 0.019 2.20 15 0.0086 7.5E-05 1329579 13407 1.52 97.952 98.566 99.179 99.142 99.158 99.174 Germany PTB 10/08 4 98.9 0.900 2.28 15 0.3947 1.6E-01 635 6 0.43 97.952 98.566 99.179 99.142 99.158 99.174
Hong Kong SCL 11/08 5 97.952 98.566 99.179 99.142 99.158 99.174Thailand NIMT 12/08 6 99 0.628 2.00 0.3140 9.9E-02 1004 10 0.25 97.952 98.566 99.179 99.142 99.158 99.174
Japan NMIJ 01/09 7 99.114 0.0248 0.099 2.00 15 0.0495 2.5E-03 40451 408 0.80 97.952 98.566 99.179 99.142 99.158 99.174South Korea KRISS 04/09 8 98.4 0.8770 0.490 2.14 15 0.2290 5.2E-02 1877 19 10.97 97.952 98.566 99.179 99.142 99.158 99.174
USA NIST 06/09 9 99.113 0.0151 0.054 2.00 15 0.0270 7.3E-04 135957 1372 2.82 97.952 98.566 99.179 99.142 99.158 99.174India NPLI 07/09 10 99.7 3.988 1.00 3.9880 1.6E+01 6 0 0.02 97.952 98.566 99.179 99.142 99.158 99.174
South Africa NMISA 09/09 11 96.98 1.2569 3.151 2.00 15 1.5755 2.5E+00 39 0 1.91 97.952 98.566 99.179 99.142 99.158 99.174Egypt NIS 10/09 12 98.457 0.8200 0.621 2.00 15 0.3105 9.6E-02 1021 10 5.10 97.952 98.566 99.179 99.142 99.158 99.174China NIM 11/09 13 98.7 2.1875 1.100 1.96 15 0.5612 3.1E-01 313 3 0.67 97.952 98.566 99.179 99.142 99.158 99.174
Ch Teipei CMS 01/10 14 99.11 0.0205 0.088 2.00 15 0.0440 1.9E-03 51193 517 1.21 97.952 98.566 99.179 99.142 99.158 99.174Vietnam VMI 03/10 15 99 1.100 2.00 15 0.5500 3.0E-01 327 3 0.08 97.952 98.566 99.179 99.142 99.158 99.174
Indonesia KIM-LIPI 04/10 16 94.62 0.2022 1.400 2.00 60 0.7000 4.9E-01 193 2 42.03 97.952 98.566 99.179 99.142 99.158 99.174Australia rpt NMIA 06/10 1 99.1 1.000 2.00 0.5000 2.5E-01 396 4 0.014 97.952 98.566 99.179 99.142 99.158 99.174
Count 15 21.1523 1563092 15763.6 67.84 = MaxSt Deviation 1.2470 2.20 = R B
E
0.46 0.060.27 0.020.98 0.430.31 0.29
0.49 0.250.88 0.440.210.89 0.810.28 0.140.49 0.690.120.11 0.420.88 0.540.34 0.14
0.46 0.062.58 3.24
1.55
1.13
2.58 3.24 Worst
SDM 0.3220 1.33 = R B limMean ust k Uexp
µm µm µm %Arithmetic 0.3066 2.00 0.6Weighted 99.158 0.0080 2.00 0.0159 0.0
98.566 0.6132
All data
90.00
92.00
94.00
96.00
98.00
100.00
102.00
104.00
106.00
1 2 3 4 5 6 7 8 9 10 11 12 13 14 15 16 1
)1/(81 −+< nRBStandard deviations from each laboratory
0
0.5
1
1.5
2
2.5
1 2 3 4 5 6 7 8 9 10 11 12 13 14 15 16 1
Comments for 1286 RSm results:No result given by SCL.SCL, NIS, NIM and CMS reported the ESDM which is converted to the standard deviation [s = ESDM * sqrt(n)].NPLI uncertainty reported at k = 1.0.NIM has a significantly higher standard deviation than any other laboratory.The uncertainty for CMS is very small. Since the value is acceptable, this significantly affects which laboratories are outliers.Comparison of initial and final NMIA result is En = 0.00.
Submitted results: 15Outliers removed: 2 (KIM-LIPI, KRISS)Final population size: 13Key Comparison Reference Value: RSm = 99.16 µm ± 0.016 µmAfter outliers are removed, NIS had an En of 1.1 but remained in the accepted values since the Birge ratio was less than the Birge limit. If this result was removed, the final KCRV changes by only +0.001 µm.
APMP.L-K8 report, 10 January 2013 Page 68 of 74

PMP.L-K8 report, 10 January 2013 Page 69 of 74
Appendix D. Softgauge results Submitted results and graphs are shown for the Cos4 softgauge, including the software and the file format used. Uncertainties are not applicable. Two comparisons are determined; an En value and a difference from the supplied NPL value. Some results from NIS are excluded in mean calculations. Softgauge Cos4 results Note: Singapore, Hong Kong, Thailand, South Korea, India, China, Vietnam and Indonesia did not submit any results. Uncertainty not applicable.
Software File Cutoff Filter Ra Rq Rz Rp Rv Rt RSmLaboratory Date No. µm µm mm µm µm µm µm µm µm µmAustralia 07/08 NMIA 1 Turbo Wave v7.20 4PTB.SMD, ASC 0.8 off 0.498000 0.572000 1.754500 0.880500 0.874000 2.005000 200.000000
UK 09/08 NPL 3 Softgauges 1.01 4NPL.SMD 0.8 off 0.528782 0.589208 1.806400 0.910959 0.895441 1.998763 199.999972 Germany 10/08 PTB 4 RPTB v1.46 4PTB.SMD 0.8 off 0.528760 0.598850 1.806360 0.910920 0.895440 1.998760 199.980000
Japan 01/09 NMIJ 7 NMIJ v1.1 PRF 0.8 off 0.446000 0.500000 1.590000 0.806000 0.784000 1.999000 200.000000South Korea 04/09 KRISS 8 FTS Ultra v4.3.14 PRF 0.8 off 0.497400 0.576300 1.718300 0.868500 0.849800 1.995700 197.490000
USA 06/09 NIST 9 NIST ‘SMATS’ web-based 1 ASC 0.8 off 0.528780 0.589190 1.806360 0.910890 0.895440 1.998760 199.999970South Africa 09/09 NMISA 11 Ultra v5.11.6.17 ? 0.8 off 0.560700 0.625800 1.860800 0.930200 0.930600 1.955900 196.300000
Egypt 10/09 NIS 12 Ultra v5.16.2.0 SMD ? off 0.445500 0.531200 0.002800 0.001400 0.001400 0.002800 197.650000China 11/09 NIM 13 Talymap Gold v5.1.1.5374 PRF ? off 0.445500 0.531100 1.998600 1.000000 0.998500 1.998600 199.520000
Ch Teipei 01/10 CMS 14 ? SMD 0.8 off 0.445500 0.531200 1.657000 0.824500 0.832500 1.998800 200.0007001 NIST software: Surface Metrology Algorithm Testing System (SMATS), Arithmetic Mean 0.492492 0.564485 1.777591 0.893608 0.883969 1.994365 199.094064 http://physics.nist.gov/smats St Deviation 0.0440 0.0392 0.1183 0.0579 0.0608 0.0146 1.3959
Count 10 10 9 9 9 9 10
Calculation of En for each laboratory to arithmetic mean using the population standard deviation as nominal uncertainties.Software File Cutoff Filter Ra Rq Rz Rp Rv Rt RSm
µm µm mm En En En En En En EnAustralia 07/08 NMIA 1 Turbo Wave v7.20 4PTB.SMD, ASC 0.8 off 0.09 0.14 -0.14 -0.16 -0.12 0.51 0.46
UK 09/08 NPL 3 Softgauges 1.01 4NPL.SMD 0.8 off 0.58 0.45 0.17 0.21 0.13 0.21 0.46 Germany 10/08 PTB 4 RPTB v1.46 4PTB.SMD 0.8 off 0.58 0.62 0.17 0.21 0.13 0.21 0.45
Japan 01/09 NMIJ 7 NMIJ v1.1 PRF 0.8 off -0.75 -1.16 -1.12 -1.07 -1.16 0.22 0.46South Korea 04/09 KRISS 8 FTS Ultra v4.3.14 PRF 0.8 off 0.08 0.21 -0.35 -0.31 -0.40 0.06 -0.81
USA 06/09 NIST 9 NIST ‘SMATS’ web-based 1 ASC 0.8 off 0.58 0.45 0.17 0.21 0.13 0.21 0.46South Africa 09/09 NMISA 11 Ultra v5.11.6.17 ? 0.8 off 1.10 1.11 0.50 0.45 0.54 -1.86 -1.42
Egypt 10/09 NIS 12 Ultra v5.16.2.0 SMD ? off -0.75 -0.60 - - - - -0.73China 11/09 NIM 13 Talymap Gold v5.1.1.5374 PRF ? off -0.75 -0.60 1.32 1.30 1.33 0.20 0.22
Ch Teipei 01/10 CMS 14 ? SMD 0.8 off -0.75 -0.60 -0.72 -0.84 -0.60 0.21 0.46
Difference from NPL values Software File Cutoff Filter Ra Rq Rz Rp Rv Rt RSmµm µm mm µm µm µm µm µm µm µm
Australia 07/08 NMIA 1 Turbo Wave v7.20 4PTB.SMD, ASC 0.8 off -0.030782 -0.017208 -0.051900 -0.030459 -0.021441 0.006237 0.000028UK 09/08 NPL 3 Softgauges 1.01 4NPL.SMD 0.8 off 0.000000 0.000000 0.000000 0.000000 0.000000 0.000000 0.000000
Germany 10/08 PTB 4 RPTB v1.46 4PTB.SMD 0.8 off -0.000022 0.009642 -0.000040 -0.000039 -0.000001 -0.000003 -0.019972Japan 01/09 NMIJ 7 NMIJ v1.1 PRF 0.8 off -0.082782 -0.089208 -0.216400 -0.104959 -0.111441 0.000237 0.000028
South Korea 04/09 KRISS 8 FTS Ultra v4.3.14 PRF 0.8 off -0.031382 -0.012908 -0.088100 -0.042459 -0.045641 -0.003063 -2.509972USA 06/09 NIST 9 NIST ‘SMATS’ web-based 1 ASC 0.8 off -0.000002 -0.000018 -0.000040 -0.000069 -0.000001 -0.000003 -0.000002
South Africa 09/09 NMISA 11 Ultra v5.11.6.17 ? 0.8 off 0.031918 0.036592 0.054400 0.019241 0.035159 -0.042863 -3.699972Egypt 10/09 NIS 12 Ultra v5.16.2.0 SMD ? off -0.083282 -0.058008 -1.803600 -0.909559 -0.894041 -1.995963 -2.349972China 11/09 NIM 13 Talymap Gold v5.1.1.5374 PRF ? off -0.083282 -0.058108 0.192200 0.089041 0.103059 -0.000163 -0.479972
Ch Teipei 01/10 CMS 14 ? SMD 0.8 off -0.083282 -0.058008 -0.149400 -0.086459 -0.062941 0.000037 0.000728 A

APMP.L-K8 report, 10 January 2013 Page 70 of 74
The red line in each graph is the average of all results.
Cos4: Ra (µm)
0.40
0.45
0.50
0.55
0.60
0.65
0.70
NMIA NPL PTB NMIJ KRISS NIST NMISA NIS NIM CMS
Cos4: Rq (µm)
0.40
0.45
0.50
0.55
0.60
0.65
0.70
NMIA NPL PTB NMIJ KRISS NIST NMISA NIS NIM CMS
Cos4: Rz (µm)
1.50
1.60
1.70
1.80
1.90
2.00
2.10
NMIA NPL PTB NMIJ KRISS NIST NMISA NIS NIM CMS
Cos4: Rp (µm)
0.80
0.90
1.00
1.10
0.50
0.60
0.70
NMIA NPL PTB NMIJ KRISS NIST NMISA NIS NIM CMS
Cos4: Rv (µm)
0.50
0.60
0.70
0.80
0.90
1.00
1.10
NMIA NPL PTB NMIJ KRISS NIST NMISA NIS NIM CMS
Cos4: Rt (µm)
1.94
1.95
1.96
1.97
1.98
1.99
2.00
2.01
NMIA NPL PTB NMIJ KRISS NIST NMISA NIS NIM CMS
Cos4: RSm (µm)
NMIA NPL PTB NMIJ KRISS NIST NMISA NIS NIM CMS195
196
197
198
199
200
201

Submitted results and graphs are shown for the Sin_2_16 softgauge, including the software and the file format used. Uncertainties are not applicable. Two comparisons are determined; an En value and a difference from the supplied NPL value. NIS did not submit a result for RSm.
PMP.L-K8 report, 10 January 2013 Page 71 of 74
Softgauge Sin_2_16 results Note: Singapore, Hong Kong, Thailand, South Korea, India, China, Vietnam and Indonesia did not submit a result. Uncertainty not applicable.
Software File Cutoff Filter Ra Rq Rz Rp Rv Rt RSmLaboratory Date No. µm µm mm µm µm µm µm µm µm µmAustralia 07/08 NMIA 1 Turbo Wave v7.20 4PTB.SMD, ASC 0.8 off 0.412000 0.505000 1.990000 0.995000 0.995000 1.990000 50.000000
UK 09/08 NPL 3 Softgauges 1.01 4NPL.SMD 0.8 off 0.405566 0.500000 1.990376 0.995188 0.995188 1.990376 49.999991 Germany 10/08 PTB 4 RPTB v1.46 4PTB.SMD 0.8 off 0.405560 0.500020 1.990340 0.995170 0.995170 1.990340 50.000000
Japan 01/09 NMIJ 7 NMIJ v1.1 PRF 0.8 off 0.405000 0.500000 1.990000 0.995000 0.995000 1.990000 50.000000South Korea 04/09 KRISS 8 FTS Ultra v4.3.14 PRF 0.8 off 0.404700 0.499000 1.986500 0.993200 0.993200 1.986500 50.000000
USA 06/09 NIST 9 NIST ‘SMATS’ web-based 1 ASC 0.8 off 0.405510 0.500000 1.990340 0.995170 0.995170 1.990340 50.000080South Africa 09/09 NMISA 11 Ultra v5.11.6.17 ? 0.8 off 0.403800 0.497900 1.981700 0.991900 0.989700 1.981700 50.000000
Egypt 10/09 NIS 12 Ultra v5.16.2.0 SMD ? off 0.405700 0.500100 1.990400 0.995200 0.995200 1.990400 no resultChina 11/09 NIM 13 Talymap Gold v5.1.1.5374 PRF ? off 0.404700 0.499000 1.986600 0.993300 0.993300 1.986600 50.000000
Ch Teipei 01/10 CMS 14 ? SMD 0.8 off 0.405500 0.500000 1.990400 0.995200 0.995200 1.990400 56.6327001 NIST software: Surface Metrology Algorithm Testing System (SMATS), Arithmetic Mean 0.405804 0.500102 1.988473 0.994348 0.994103 1.988473 50.736975 http://physics.nist.gov/smats St Deviation 0.0023 0.0019 0.0030 0.0012 0.0018 0.0030 2.2109
Count 10 10 9 9 9 9 9
Calculation of En for each laboratory to arithmetic mean using the population standard deviation as nominal uncertainties.Software File Cutoff Filter Ra Rq Rz Rp Rv Rt RSm
µm µm mm En En En En En En EnAustralia 07/08 NMIA 1 Turbo Wave v7.20 4PTB.SMD, ASC 0.8 off 1.94 1.86 0.36 0.38 0.34 0.36 -0.24
UK 09/08 NPL 3 Softgauges 1.01 4NPL.SMD 0.8 off -0.07 -0.04 0.45 0.48 0.42 0.45 -0.24 Germany 10/08 PTB 4 RPTB v1.46 4PTB.SMD 0.8 off -0.08 -0.03 0.44 0.47 0.41 0.44 -0.24
Japan 01/09 NMIJ 7 NMIJ v1.1 PRF 0.8 off -0.25 -0.04 0.36 0.38 0.34 0.36 -0.24South Korea 04/09 KRISS 8 FTS Ultra v4.3.14 PRF 0.8 off -0.35 -0.42 -0.46 -0.66 -0.35 -0.46 -0.24
USA 06/09 NIST 9 NIST ‘SMATS’ web-based 1 ASC 0.8 off -0.09 -0.04 0.44 0.47 0.41 0.44 -0.24South Africa 09/09 NMISA 11 Ultra v5.11.6.17 ? 0.8 off -0.63 -0.83 -1.59 -1.41 -1.69 -1.59 -0.24
Egypt 10/09 NIS 12 Ultra v5.16.2.0 SMD ? off -0.03 0.00 0.45 0.49 0.42 0.45 n/aChina 11/09 NIM 13 Talymap Gold v5.1.1.5374 PRF ? off -0.35 -0.42 -0.44 -0.60 -0.31 -0.44 -0.24
Ch Teipei 01/10 CMS 14 ? SMD 0.8 off -0.10 -0.04 0.45 0.49 0.42 0.45 1.89
Difference from NPL values Software File Cutoff Filter Ra Rq Rz Rp Rv Rt RSmµm µm mm µm µm µm µm µm µm µm
Australia 07/08 NMIA 1 Turbo Wave v7.20 4PTB.SMD, ASC 0.8 off 0.006434 0.005000 -0.000376 -0.000188 -0.000188 -0.000376 0.000009UK 09/08 NPL 3 Softgauges 1.01 4NPL.SMD 0.8 off 0.000000 0.000000 0.000000 0.000000 0.000000 0.000000 0.000000
Germany 10/08 PTB 4 RPTB v1.46 4PTB.SMD 0.8 off -0.000006 0.000020 -0.000036 -0.000018 -0.000018 -0.000036 0.000009Japan 01/09 NMIJ 7 NMIJ v1.1 PRF 0.8 off -0.000566 0.000000 -0.000376 -0.000188 -0.000188 -0.000376 0.000009
South Korea 04/09 KRISS 8 FTS Ultra v4.3.14 PRF 0.8 off -0.000866 -0.001000 -0.003876 -0.001988 -0.001988 -0.003876 0.000009USA 06/09 NIST 9 NIST ‘SMATS’ web-based 1 ASC 0.8 off -0.000056 0.000000 -0.000036 -0.000018 -0.000018 -0.000036 0.000089
South Africa 09/09 NMISA 11 Ultra v5.11.6.17 ? 0.8 off -0.001766 -0.002100 -0.008676 -0.003288 -0.005488 -0.008676 0.000009Egypt 10/09 NIS 12 Ultra v5.16.2.0 SMD ? off 0.000134 0.000100 0.000024 0.000012 0.000012 0.000024 n/aChina 11/09 NIM 13 Talymap Gold v5.1.1.5374 PRF ? off -0.000866 -0.001000 -0.003776 -0.001888 -0.001888 -0.003776 0.000009
Ch Teipei 01/10 CMS 14 ? SMD 0.8 off -0.000066 0.000000 0.000024 0.000012 0.000012 0.000024 6.632709
A

The red line in each graph is the average of all results.
Sin_2_16: Ra (µm)
0.398
0.400
0.402
0.404
0.406
0.408
0.410
0.412
0.414
NMIA NPL PTB NMIJ KRISS NIST NMISA NIS NIM CMS
Sin_2_16: Rq (µm)
0.494
0.496
0.498
0.500
0.502
0.504
0.506
NMIA NPL PTB NMIJ KRISS NIST NMISA NIS NIM CMS
Sin_2_16: Rz (µm)
1.976
1.978
1.980
1.982
1.984
1.986
1.988
1.990
1.992
NMIA NPL PTB NMIJ KRISS NIST NMISA NIS NIM CMS
Sin_2_16: RSm (µm)
48
49
50
51
52
53
54
55
56
57
58
NMIA NPL PTB NMIJ KRISS NIST NMISA NIS NIM CMS
Sin_2_16: Rp (µm)
0.990
0.991
0.992
0.993
0.994
0.995
0.996
NMIA NPL PTB NMIJ KRISS NIST NMISA NIS NIM CMS
Sin_2_16: Rv (µm)
0.988
0.990
0.992
0.994
0.996
0.998
NMIA NPL PTB NMIJ KRISS NIST NMISA NIS NIM CMS
Sin_2_16: Rt (µm)
1.976
1.978
1.980
1.982
1.984
1.986
1.988
1.990
1.992
NMIA NPL PTB NMIJ KRISS NIST NMISA NIS NIM CMS
APMP.L-K8 report, 10 January 2013 Page 72 of 74
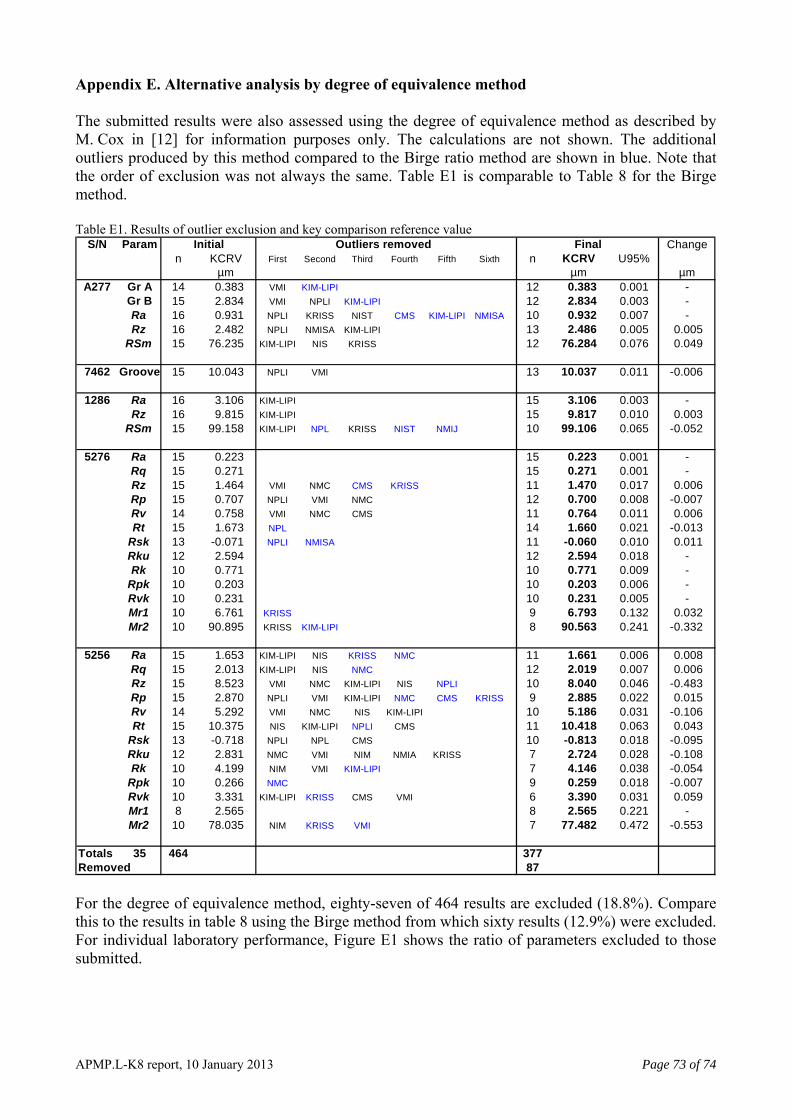
Appendix E. Alternative analysis by degree of equivalence method The submitted results were also assessed using the degree of equivalence method as described by M. Cox in [12] for information purposes only. The calculations are not shown. The additional outliers produced by this method compared to the Birge ratio method are shown in blue. Note that the order of exclusion was not always the same. Table E1 is comparable to Table 8 for the Birge method. Table E1. Results of outlier exclusion and key comparison reference value
S/N Param Changen KCRV First Second Third Fourth Fifth Sixth n KCRV U95%
µm µm µmA277 Gr A 14 0.383 VMI KIM-LIPI STOP 12 0.383 0.001 -
Gr B 15 2.834 VMI NPLI KIM-LIPI STOP 12 2.834 0.003 -Ra 16 0.931 NPLI KRISS NIST CMS KIM-LIPI NMISA TO 10 0.932 0.007 -Rz 16 2.482 NPLI NMISA KIM-LIPI STOP 13 2.486 0.005 0.005
RSm 15 76.235 KIM-LIPI NIS KRISS STOP 12 76.284 0.076 0.049
7462 Groove 15 10.043 NPLI VMI STOP 13 10.037 0.011 -0.006
1286 Ra 16 3.106 KIM-LIPI STOP 15 3.106 0.003 -Rz 16 9.815 KIM-LIPI STOP 15 9.817 0.010 0.003
RSm 15 99.158 KIM-LIPI NPL KRISS NIST NMIJ STOP 10 99.106 0.065 -0.052
5276 Ra 15 0.223 STOP 15 0.223 0.001 -Rq 15 0.271 STOP 15 0.271 0.001 -Rz 15 1.464 VMI NMC CMS KRISS STOP 11 1.470 0.017 0.006Rp 15 0.707 NPLI VMI NMC STOP 12 0.700 0.008 -0.007Rv 14 0.758 VMI NMC CMS STOP 11 0.764 0.011 0.006Rt 15 1.673 NPL STOP 14 1.660 0.021 -0.013
Rsk 13 -0.071 NPLI NMISA STOP 11 -0.060 0.010 0.011Rku 12 2.594 STOP 12 2.594 0.018 -Rk 10 0.771 STOP 10 0.771 0.009 -
Rpk 10 0.203 STOP 10 0.203 0.006 -Rvk 10 0.231 STOP 10 0.231 0.005 -Mr1 10 6.761 KRISS STOP 9 6.793 0.132 0.032Mr2 10 90.895 KRISS KIM-LIPI STOP 8 90.563 0.241 -0.332
5256 Ra 15 1.653 KIM-LIPI NIS KRISS NMC STOP 11 1.661 0.006 0.008Rq 15 2.013 KIM-LIPI NIS NMC STOP 12 2.019 0.007 0.006Rz 15 8.523 VMI NMC KIM-LIPI NIS NPLI STOP 10 8.040 0.046 -0.483Rp 15 2.870 NPLI VMI KIM-LIPI NMC CMS KRISS TO 9 2.885 0.022 0.015Rv 14 5.292 VMI NMC NIS KIM-LIPI STOP 10 5.186 0.031 -0.106Rt 15 10.375 NIS KIM-LIPI NPLI CMS STOP 11 10.418 0.063 0.043
Rsk 13 -0.718 NPLI NPL CMS STOP 10 -0.813 0.018 -0.095Rku 12 2.831 NMC VMI NIM NMIA KRISS STOP 7 2.724 0.028 -0.108Rk 10 4.199 NIM VMI KIM-LIPI STOP 7 4.146 0.038 -0.054
Rpk 10 0.266 NMC STOP 9 0.259 0.018 -0.007Rvk 10 3.331 KIM-LIPI KRISS CMS VMI STOP 6 3.390 0.031 0.059Mr1 8 2.565 STOP 8 2.565 0.221 -Mr2 10 78.035 NIM KRISS VMI STOP 7 77.482 0.472 -0.553
Totals 35 464 377Removed 87
FinalInitial Outliers removed
For the degree of equivalence method, eighty-seven of 464 results are excluded (18.8%). Compare this to the results in table 8 using the Birge method from which sixty results (12.9%) were excluded. For individual laboratory performance, Figure E1 shows the ratio of parameters excluded to those submitted.
APMP.L-K8 report, 10 January 2013 Page 73 of 74

Artefact parameter results submitted and excluded using degree of equivalence method
1
10
3
0 0 0 1
11
2
10
3
6
3
7
13
17
0
2
4
6
8
10
12
14
16
18
NMIA NMC NPL PTB SCL NIMT NMIJ KRISS NIST NPLI NMISA NIS NIM CMS VMI KIM-LIPI
2.9% 28.6% 12.0% 0% 0% 0% 2.9% 32.4% 9.5% 50.0% 12.0% 28.6% 8.6% 20.0% 37.1% 50.0%
35
35
2535 4 35 21
25
21
35
34
35
35
34
20
35
Figure E1. Laboratory results removed from key comparison reference value using degree of equivalence method. Only six of the sixteen laboratories had no additional outliers under this analysis method. Some laboratories had up to six additional outliers removed compared to the Birge method. This may be due to the Birge ratio method being used in conjunction with the En ratio where these two calculations are not directly related. The degree of equivalence method is more statistically rigorous; therefore this analysis has been included for participants’ information and their own further investigation.
APMP.L-K8 report, 10 January 2013 Page 74 of 74