ANTICIPATING THE OPPORTUNITIES AND CHALLENGES OF …the past ten years. This map shows that the...
23
T HE U TAH A GING I NITIATIVE A NTICIPATING THE O PPORTUNITIES AND C HALLENGES OF OUR A GING P OPULATION C ONTENTS : • Utah’s Future Elderly – Key Facts • Demographic Realities • The Senior Boom • The Impact on Utah Counties • Two Converging Population Waves: Children and Seniors • The Critical Issues o Preparing for Retirement o Health and Lifestyle o Workforce of the Future o Building Life‐ Cycle Communities • Implications for State Government • The Utah Aging Initiative Utah Department of Human Services Center for Public Policy and Administration – University of Utah
Transcript of ANTICIPATING THE OPPORTUNITIES AND CHALLENGES OF …the past ten years. This map shows that the...

THE UTAH AGING INITIATIVE ANTICIPATING THE OPPORTUNITIES AND CHALLENGES OF OUR AGING POPULATION CONTENTS : • Utah’s Future Elderly – Key Facts • Demographic Realities • The Senior Boom • The Impact on Utah Counties • Two Converging Population Waves: Children and Seniors • The Critical Issues
o Preparing for Retirement o Health and Lifestyle o Workforce of the Future o Building Life‐Cycle Communities
• Implications for State Government • The Utah Aging Initiative Utah Department of Human Serv ices Center for Publ ic Pol icy and Administ rat ion – Univers i ty of Utah

1
Utah’s Future Elderly – Key Facts • Utah has the 6th fastest growth rate in the nation for people age 65 and older.
• The 65 and older population grew by 49,700 (27%) between 1990 and 2000 and will continue to increase by 50,000 (24%) between 2000 and 2010.
• The 65 and older population will grow by 126,700 (51%) from 2010 to 2020, when baby boomers begin reaching age 65.
• The 75 and older population will increase 60% between 2020 and 2030, when the baby boom generation begins reaching age 75.
• In Utah, one person will turn 65 years old every 23 minutes in 2015. • By 2015, seven Utah counties are projected to have more than 15% of their population over age 65; 26 of the 29 counties will have more than 10% over age 65.
The Purpose of This Briefing Book The rapid aging of Utah’s population represents a situation that cannot be ignored and must be addressed. It will present opportunities and challenges to every public agency and community. This document was developed to:
• Present basic demographic facts and figures about the aging of Utah’s baby boom population.
• Identify the needs and strengths of older citizens in the 21st century.
• Assist state and local governments to analyze, plan, and prepare for the
impacts of the aging population on services and operations.

2
The Demographic Realities: Utah will experience dramatic growth in its senior population • The 65 and older population will increase from 213,201 in 2000 to 319,564
in 2015, a growth rate of 50%. • By 2030, it will have grown to 544,529, an increase of 331,328 or 155%
compared to Utah’s senior population in 2000.
Increase in the Number of Individuals in Utah Over Age 65
0
2000
4000
6000
8000
10000
12000
14000
16000
18000
2000
2002
2004
2006
2008
2010
2012
2014
2016
2018
2020
Source: Bureau of Economic and Business Research, University of Utah, 2003.
The “Baby Boom” Generation The Baby‐Boomer generation, born between 1946 and 1964, is the largest generation in American history; this group is now between the ages of 39 and 57 and will begin turning 65 in the year 2011. Baby Boomers are currently middle‐aged, with children spanning elementary school to college. Many are caring for aging parents while they are also caring for children (and sometimes grandchildren) in the home.

3
The chart to the left shows the number of births in the United States between 1910 and 1996. The large surge in births shown in the middle of the chart is the Baby Boom Generation – the large group that is expected to begin retiring in the near future with significant impacts on health services, long‐term care, transportation, and many other public services. Some of the general characteristics of this generation are likely to carry over into their senior years:
• More likely to spend than save for retirement compared to prior generations.
• More focused on personal interests than society as a whole. • Work is viewed as a life‐fulfilling opportunity – this generation is defined
by their occupations. • Willingness to use the political process to obtain public services for
themselves and their families. • Two‐thirds expect to work at least part time after retirement.
As this group ages they will continue to have a dramatic impact on society and will demand more services in their later years. The vertical lines show the year that each generation begins turning 65 years of age.

4
The Senior Boom From 2000 to 2030, the largest growth in the older population will occur among 65 to 85 year olds. The 85 and older population will increase less dramatically; however, they will experience an increase of more than 100% between 2000 and 2030, and as the Baby Boom Generation ages, the 85 and older group will increase by 7 percent annually beginning in 2032.
• By 2015, the Utah population aged 65 to 85 will increase by 51% (to 98,124), while those over 85 will increase by 38% (to 8,239).
• From 2015 to 2030, the 65 to 85 population will experience an increase of 72% (to 209,267), and the 85 and older population will increase by 52% (to 15,698).
• The primary growth in the age 65‐85 population will occur between the years 2011 and 2030. The Baby Boom generation begins turning 85 in the year 2031.
Projected Annual Increase in Utah's Senior Population
0%
1%
2%
3%
4%
5%
6%
7%
8%
200320072011201520192023202720312035203920432047
65‐85
85+
Source: Bureau of Economic and Business Research, University of Utah, 2003.
Aging in Utah by Gender Women and men will not age equally. Among Utah’s 65 and older population, women will outnumber men from 2000 to 2030 in both the 65‐85 and the 85 and older age groups due to their higher life expectancy. The life expectancy of Utahns is 79 years (Utah ranks third highest in the nation); 76.7 years for males

5
and 81.5 years for females. By the year 2025 the life expectancy for women will be nearly 85 and 79.5 for men. Elderly women will be an at‐risk group having less retirement income than men and more often living alone. They will require more services because of their higher longevity and because many were not the primary source of income in their families.
• According to 2000 census figures, 40% of U.S. women over age 62 live alone, while only 17% of men over age 62 live alone.
• In 2001, the median income of older women was $11,113, compared to $19,688 for older men.
• Social Security provides more than half the income of nearly two‐thirds of the elderly population, with women accounting for 57% of the recipients.
• Older women experience the majority of chronic illnesses (78%). • The percent of women in the over 65 population will decrease from 57% to
54% in 2030 and men will increase form 43% to 46%. Aging in Utah by Cultural and Ethnic Characteristics Utah is one of the fastest changing states in the nation in terms of diversity; the minority population is expected to increase 278% by 2025. Projections of Utah’s racial and ethnic population by age is unreliable due to the relatively small numbers involved, however, it can be assumed that increasing minority populations will include a corresponding increase in those over the age of 65. Increasing numbers of seniors in minority populations will require greater consideration of cultural customs in providing services.
Minority Population Growth in Utah 2000-2025
0
5000
10000
15000
20000
25000
1 2 3 4 5 6
African-American
Native American
Asian-American/PacificIslanderHispanic
Source: Bureau of Economic and Business Research, University of Utah, 2003; Bureau of Census

6
The Impact on Utah Counties Many seniors want to “retire in place” or stay in the homes and communities where they have lived most of their lives. In other cases, seniors are moving to retirement communities or moving closer to their families. In some counties, the younger population is moving away in search of jobs. As a result, many Utah communities are showing signs of age. The 65 and older population of Piute, Kane and Washington counties are already over 17 percent, with several rural counties close to that percentage. • According to the 2000 Census, 8.5 percent of Utahns were aged 65 or older; in
the United States 12.4 percent of the population was over age 65. • By 2015, seven Utah counties will have more than 15% of their population
over age 65. • All but Cache, Utah and Tooele counties will have at least 10% of their
population over age 65 by the year 2015. • The growth of the senior population may significantly impact a community’s
tax base and its ability to fund and provide public services needed by seniors. • Although rural counties already have some of the largest percentages of
seniors in the state, rural communities often have limited access to, and funding for, the public transportation, healthcare, and other social services needed by seniors to live independently.
The following set of maps illustrates how Utah’s senior population is currently and how they are expected to be distributed among the state’s 29 counties: The first map shows the percent of the county population over age 65 in 2004. The counties with the highest percentage of seniors are in the retirement communities in Southwest Utah and in Piute and Daggett and Rich counties, three of the least populated rural counties in the state. Much of rural Utah already has more than 13 percent of its population over age 65.

7
The second map illustrates the number of seniors in each county as of 2004. This map shows that most seniors live along the Wasatch Front, from Cache County to Utah County and a large number now live in Washington County. The third map describes the percent change in the senior population in Utah over the past ten years. This map shows that the percent of the population over age 65 has increased in different types of counties – urban and rural, retirement destinations and aging communities. The fourth map projects the percent change in the senior population by county over the next ten years. It is anticipated that the senior populations will grow most rapidly in Summit, Wasatch and Tooele counties.
8
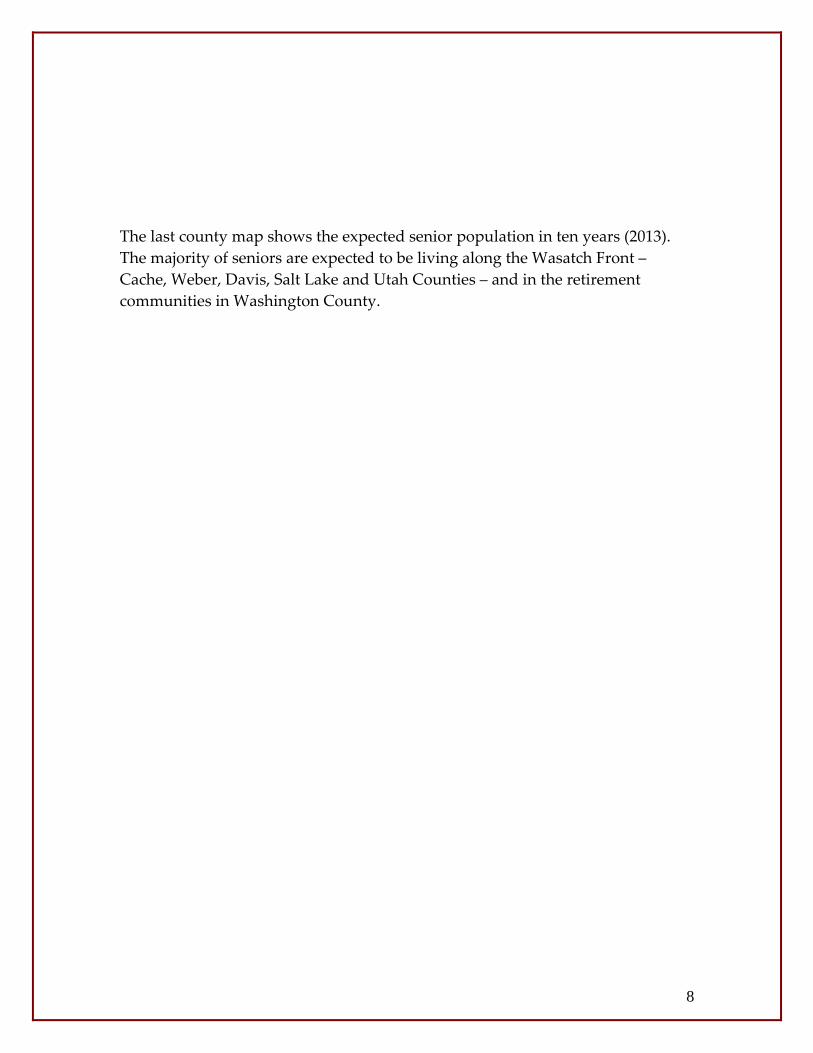
The last county map shows the expected senior population in ten years (2013). The majority of seniors are expected to be living along the Wasatch Front – Cache, Weber, Davis, Salt Lake and Utah Counties – and in the retirement communities in Washington County.

9
Two Converging Population Waves: Children and Seniors — A Unique Situation for Utah Utah’s school age population (age 5‐17) is anticipated to increase by over 21 percent between 2003 and 2011, coinciding with the growth in the 65 and older population. This trend will continue until 2012, when the rate of growth among the school‐age population reaches its peak. No other state in the nation will experience such dramatic increases in both its young and old population. The rest of the nation will experience decreasing rates of population growth among school age children.
Growth Rates of School Age and Senior Populations
0.0%
0.5%
1.0%
1.5%
2.0%
2.5%
3.0%
3.5%
4.0%
4.5%
5.0%
2003
2005
2007
2009
2011
2013
2015
Growth Rate ages5-17Growth Rate 65 &over
Source: Bureau of Economic and Business Research, University of Utah, 2003.
The coincidence of increasing numbers of seniors at the same time as larger school age populations could be viewed as a cause of concern or a benefit to the State. The time, talent and experience of the older population may provide a large untapped resource to help address the increasing number of children in Utah’s schools. A recent AARP study indicated that 50% of Americans over age fifty are planning to volunteer in the future. The growing numbers of seniors may provide much needed expertise to address the needs of Utah’s children in the schools. The strain on Utah’s public education system could be significantly relieved by utilizing senior volunteers and part‐time workers – particularly in hard to fill positions like math, computer, business and science curricula.
10
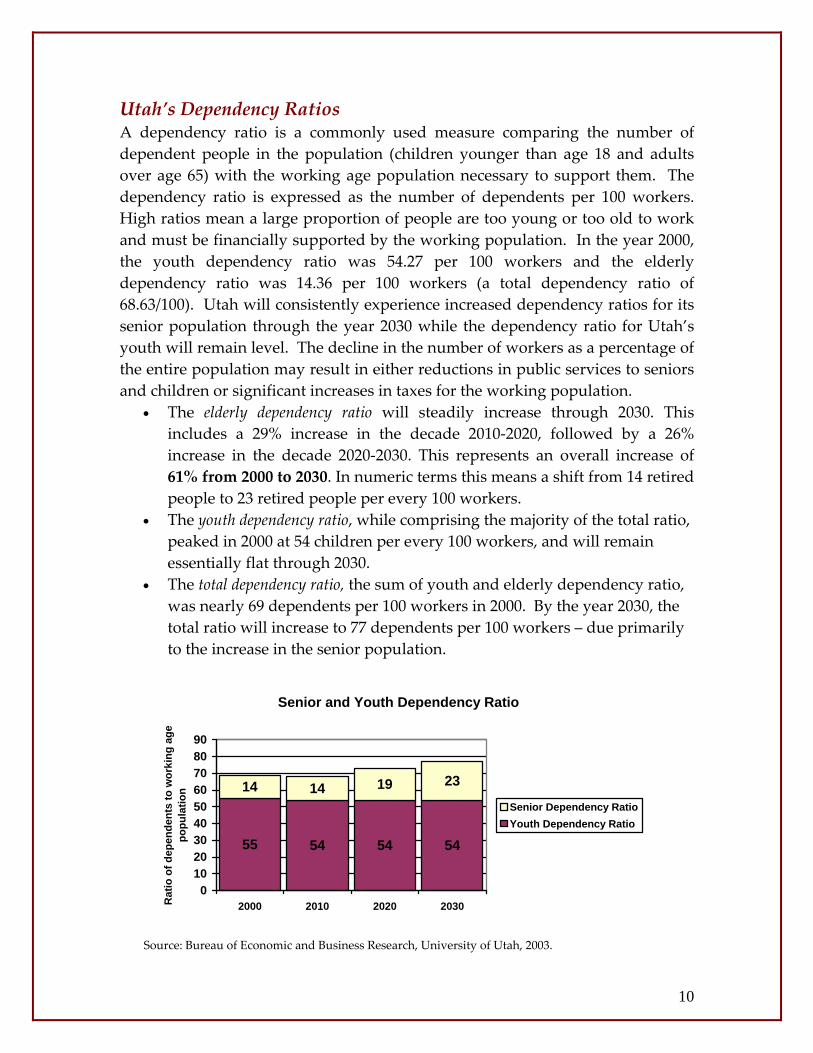
Utah’s Dependency Ratios A dependency ratio is a commonly used measure comparing the number of dependent people in the population (children younger than age 18 and adults over age 65) with the working age population necessary to support them. The dependency ratio is expressed as the number of dependents per 100 workers. High ratios mean a large proportion of people are too young or too old to work and must be financially supported by the working population. In the year 2000, the youth dependency ratio was 54.27 per 100 workers and the elderly dependency ratio was 14.36 per 100 workers (a total dependency ratio of 68.63/100). Utah will consistently experience increased dependency ratios for its senior population through the year 2030 while the dependency ratio for Utah’s youth will remain level. The decline in the number of workers as a percentage of the entire population may result in either reductions in public services to seniors and children or significant increases in taxes for the working population.
• The elderly dependency ratio will steadily increase through 2030. This includes a 29% increase in the decade 2010‐2020, followed by a 26% increase in the decade 2020‐2030. This represents an overall increase of 61% from 2000 to 2030. In numeric terms this means a shift from 14 retired people to 23 retired people per every 100 workers.
• The youth dependency ratio, while comprising the majority of the total ratio, peaked in 2000 at 54 children per every 100 workers, and will remain essentially flat through 2030.
• The total dependency ratio, the sum of youth and elderly dependency ratio, was nearly 69 dependents per 100 workers in 2000. By the year 2030, the total ratio will increase to 77 dependents per 100 workers – due primarily to the increase in the senior population.
Senior and Youth Dependency Ratio
55 54 54 54
14 14 19 23
0102030405060708090
2000 2010 2020 2030Rat
io o
f dep
ende
nts
to w
orki
ng a
ge
popu
latio
n
Senior Dependency RatioYouth Dependency Ratio
Source: Bureau of Economic and Business Research, University of Utah, 2003.

11
The Critical Issues of Aging in Utah Preparing for Retirement Financing Retirement. Retirees rely on four sources of income during retirement: Social Security, pensions, personal savings, and earnings. Although Social Security was intended to be a supplement to other retirement savings, most retirees will rely on Social Security as a main source of income after they retire. This amount alone will be insufficient to maintain their standard of living.
• The annual costs of Social Security (the payment of benefits) will exceed tax revenue starting in 2017 and by 2041 it is projected the system will run out of funds unless some changes occur.
• Baby Boomers are expected to live longer than previous generations, requiring benefits and services over a longer life span. This is significant as health care costs account for as much as 40% of monthly income for some seniors.
• The ability of Baby Boomers to afford all their health related costs is diminishing: o The Federal Reserve Board reports that 54% of households participate
in an employee‐sponsored retirement plan. Only 11% of individuals with incomes under $10,000 and 33% between $10,000 and $25,000 participated in an employer‐sponsored retirement plan.
o The US household savings rate has bottomed‐out at 1%, sharply lower than its historical average 8% from 1980‐1994, and compared to other industrialized countries (7% in Great Britain and 15% in Germany and France).
o At least one half of all seniors risk outliving their assets or experiencing an impoverishing event.
• Increasing health costs and diminishing means to pay for them, are compounded by a lack of planning: o Two‐thirds of Utahns over age 55 have not financially planned for
retirement. o 79% believe inadequate finances could delay their retirement even
though 63% of US employees participate in a retirement plan independent of Social Security or their employer.
Personal responsibility for health maintenance and long‐term care. Planning for retirement includes having sufficient funds to maintain an accustomed

12
quality of life, but also preparing for the later years when health care needs will be a major expense.
• Long term care institutions or nursing homes, can cost approximately $40,000 per year in the Salt Lake City area.
• Home health care can be a cheaper and often more desirable alternative for seniors, costing about $7,000 a year; however, home care is not available in all parts of the state and can be difficult to obtain due to limited availability.
• Care for an elderly loved one is physically, emotionally and financially draining, particularly for the caregiver, regardless of the severity or simplicity of the help needed.
Volunteer caregiving. Currently, 25.8 million Americans provide care to someone over the age of 50, the majority of whom are family, friends and volunteers, a number that is expected to rise to 39 million by 2007. Paying for these services would cost $45‐$94 billion annually, however relying on volunteers costs businesses in other ways. A survey of employed informal caregivers reports the following:
• 69% arrived late or left the workplace earlier than normal. • 67% took time off to attend to an elderly dependent. • 64% used sick days or vacation time for caregiving duties. • Many passed up promotions, refused transfers, took leaves of absence,
quit their jobs or retired early to care for an elderly person. Health and Lifestyle The baby boom generation should act now to prepare for their retirement so they will not have to depend on public programs that will be stretched to their limits in the coming decades. The most effective strategy for addressing the needs of the coming senior boom is to have retirement plans in place and adopt healthy lifestyles. The burden on public programs for senior citizens can be substantially alleviated if those who are nearing retirement begin saving programs, pension plans and mortgage arrangements so they will be financially prepared for retirement. Heavy medical expenses can be alleviated by forming habits of regular exercise, good nutrition and medical maintenance. Health coverage, Medicaid and Medicare. Medical expenses such as health care coverage and prescription drugs are major expenses for senior citizens. Many seniors lose health care coverage upon retirement and are faced with a major expense that their employer may have paid when they were working.

13
• The United States spends more on health care than any other country in the world, 69 percent more than Germany, 83 percent more than Canada, and 134% more than the average of all industrialized countries.
• Health insurance coverage is eroding; some employers are reducing the number of employees covered, while insurance companies are increasing premiums and decreasing some of the benefits covered under their health plans.
Public programs such as Medicare and Medicaid provide medical coverage for seniors aged 65 and over. Medicare provides health coverage for a premium to almost all Americans aged 65 or older. Due to the large numbers expected to enter the Medicare system and recent legislation providing prescription drug coverage, Medicare reserve funds (hospital insurance program) are expected to become depleted without legislation to adjust reserves. • The Centers for Medicare and Medicaid Services report that Utah
beneficiaries received more than one billion dollars in Medicare funds in FY 2001. This amount equaled an average of $5,120 per beneficiary.
Medicaid is a program that pays for medical assistance for certain individuals and families with low incomes and resources. This program became law in 1965 and is jointly funded by the Federal and state governments to assist states in providing medical long‐term care assistance to people who meet certain eligibility criteria. Medicaid is the largest source of funding for medical and health‐related services for people with limited income. • The National Academy for State Health Policy reports that Medicaid pays for
over 40 percent of long‐term care services nationwide. • Long‐term care for the elderly and persons with disabilities is the largest
single component of Medicaid. • Nationwide, Medicaid is the second largest item in state budgets (behind
education) and accounts for 15 percent of state spending, totaling $218 billion in 2001.
• Due to the rapidly rising costs of medical care including Medicaid, states are trying to contain costs and improve the health care and long‐term care systems.
• The Bureau of Economic and Business Research at the University of Utah reported the State of Utah and other local agencies allocated approximately $322.3 million for Medicaid services. This contribution was matched by $663.7 million in federal funds. Together, these funds provided health care services to 188,817 low income residents throughout the state.
14
Prescription drugs. The increase in the cost of prescription medications has exceeded the cost of living by almost four times over the last few years. Americans spent over $182.7 billion on prescription drug sales in 2002 alone, with prescription medications comprising the majority of the elderly’s out‐of‐pocket expenditures for medical expenses. According to the Kaiser Foundation, more than one‐quarter of all seniors living at or below 200 percent of the poverty level must choose between spending their money on prescription medications and their basic necessities of living (food or housing).
• Seniors are major users of prescription drugs; composing 15 percent of the population, seniors use approximately 33 percent of all prescription medications and 50 percent of over‐the‐counter and herbal remedies.
• The cost of pharmaceuticals for non‐insured Americans is over 15 percent higher than it is for Americans who have insurance.
• The retail price of prescription drugs has increased on average more than 7.3 percent per year over the last decade.
• The consumer price index for prescription drugs and medical supplies rose from 181.7 in 1990 to 316.5 in 2002 – an increase of 74 percent.
• The number of prescriptions filled has increased by about a third in a seven year time span from 2.125 million in 1995 to 3.138 million in 2002.
• Many pharmaceutical companies spend more than $1 billion per year in their sales efforts, primarily to convince physicians to prescribe their products over competing products.
Utah’s Workforce of the Future Productive Aging. The baby boom generation has the highest labor force participation rates for both men and women than any other generation before them. For a variety of reasons, many older workers will continue working beyond the traditional retirement age as full or part‐time employees or as volunteers. Retaining senior workers can be a substantial benefit to both the employer and the seniors themselves. Seniors provide a qualified and experienced labor force to support Utah’s economic growth and quality education. • The withdrawal of older workers from the labor force results in a national
loss of productivity estimated at $100 billion per year. • Two‐thirds of baby boomers intend to work at least part‐time after age 65.

15
Older workers. Although many seniors will need to work longer either in full time or part‐time employment, there are a number of advantages to those who work longer and their employers. A large percentage of seniors plan on working beyond age 65.
• 45% of older workers do not plan to retire at age 65; 27% plan to continue working past age 70 and another 18% plan to work past age 80. Two‐thirds of baby boomers intend to work at least part‐time after age 65.
• 48% of employable Utahns between ages 55 and 64 work full‐time and 13% work part time.
• Some of the benefits of employing senior workers include: o Seniors have low absentee and turnover rates o Retain institutional values and memory o Continue to pay into benefit programs but utilize benefits and
pensions less • Older workers benefit from working after age 60 because they:
o Have income 1.5 times that of the average retiree o Report very good to excellent health and believe they will live
longer than retirees o Participate in an active lifestyle
Employment needs for the aging population. An increasing aging population will create the need for many more health care and eldercare professionals. It is anticipated that there will be ongoing shortages of caregivers, nurses, physical therapists, occupational therapists and medical specialists in geriatrics. Several years are required for education and training in most of these professions; methods to attract individuals into long‐term care professions to address the needs of Utah’s aging population should be under way now. Alternative views of retirement. A number of factors are contributing to a change in the way we now view retirement. People are living longer as a result of improved health care and are interested in trying new careers or doing something they have always wanted to do. Some professions (such as the military or public safety) allow individuals to draw a pension relatively early in their careers and continue working in a different occupation. Many have not been able to retire when they planned because of the poor performance of investments. Others will need to continue working to pay for health care coverage or earn enough income to maintain their quality of life. Lifelong learning. One of the characteristics of the baby boom generation is a more frequent change in jobs or even careers than prior generations. As older
16
workers remain in the workplace, this trend is expected to continue with many returning to colleges and universities to learn new skills and acquire additional training. Academic programs at Utah’s universities are already adjusting schedules and curricula to accommodate the working professional. Utilizing accumulated experience and wisdom. Those who plan on retirement in the next few years are some of the most educated and experienced workers in history. The amount of institutional and practical knowledge that may be lost could be devastating to the organizations that lose these experienced employees. Several organizations are finding ways of retaining employees through creative methods of phased retirement or rehiring employees after retirement. In other cases, experienced retirees are finding new occupations or starting out in fields that have interested them for years. To attract and retain older workers, employers will need to modify their benefit packages and work schedules to accommodate the needs of senior workers. Volunteerism. One of the fastest growing activities among senior citizens is volunteering in an area of interest from health care to public education. A creative and mutually beneficial way of addressing some of our more serious needs in public schools, youth corrections, and health care staffing may be to utilize the experienced and well educated seniors as volunteers performing as teacher’s aides, subject‐matter experts, tutors and mentors. Managing volunteers requires special consideration for the needs of seniors who are giving their time and talents for the satisfaction of knowing they are making a difference. Organizations should develop a supportive environment including specialized training and unique incentives to attract and accommodate volunteers. Building Lifecycle Communities Lifecycle communities are designed and function to meet the changing physical, social and service needs of the residents as they age. Sense of community. Communities are places where the residents live, work and socialize together, with community spirit created by caring for and serving each other. There is a sense of security and safety and recognition of the needs of residents as they change over time. As seniors age in place or move to retirement communities, services to the elderly will need to be more accessible by providing services to an aging population that is more decentralized and independent.

17
Preventing abuse of the elderly. Some of the fastest growing incidences of crime are those perpetuated against the elderly. Identity theft, fraud, scams, and elder abuse are some of the types of crime experienced against our senior population. As the number of those reaching their senior years increases, it can be expected that crimes against this group will also rise. Law enforcement and legislators will need to direct their efforts to protect this sometimes vulnerable group. Community planning. The community plans developed today will shape community life tomorrow. Many rural communities and inner‐urban areas already have a high concentration of senior citizens who have special needs for public transportation and low‐maintenance housing. Community planning should take into account the aging of the population who will need transportation, housing and recreational alternatives. Transportation and walkable communities. An increase in the number of older drivers and pedestrians will call for changes in the way roads, crosswalks and walkways are built. Roads and parking spaces may need to be widened, the visibility of roadway signs improved, speed limits reexamined, street crossing times increased, sidewalks and street lighting improved, and public transit expanded. Housing choices. As a community’s population ages, its resident housing needs change. Healthy communities will provide larger and smaller homes with rental and ownership alternatives. An older population may desire smaller, low maintenance housing near family, friends, businesses, places of worship and parks. The trend toward urban apartments may become increasingly attractive to the elderly who wish to live near commercial and cultural activities and not have to care for lawns and home maintenance. In rural and urban communities, more attention will need to be given to remodeling and renovating homes to meet the needs for mobility and access of the elderly who live there. Family, friends and neighbor caregivers. Family, friends and volunteers provide the vast majority of long‐term care for the frail elderly. Today, over 25.8 million Americans provide care to someone over the age of 50. Many of these caregivers are “sandwiched” between caring for children in the home as well as parents, neighbors or friends. As the population ages, the demand for caregiving upon friends and family will increase. An important way to improve caregiving would be to provide support for those who volunteer their time for the elderly by offering training and contact with others facing these demands.

18
Improving public services to the aging population. Community services will become more age‐sensitive as the senior population becomes a larger percentage of the population. Municipal services such as police, fire, parks and public utilities will change to meet the needs of an aging population. The trend toward participation in government will include seniors along with other users of public services in developing and delivering services that meet the needs of citizens. E‐Government considering seniors’ needs. As governments increase the availability of public services and information through Internet access, the design of Web pages and Internet‐based forms should consider the needs of seniors by making these sites senior friendly – utilizing larger character sizes and keeping the sites simple with as few steps as possible.

19
Implications for Utah State Government The dramatic growth of the senior population will have significant impacts on most state agencies in Utah. Several agencies have seriously considered this increase and are in the process of preparing for the expected changes. Agencies across state government will need to become more aware of the changes in the state’s demographic make up and the impacts these changes will have on state revenues and services. Agencies that anticipate the needs of Utah’s expanding senior population by adopting age‐based public policies will be better prepared for the demands placed on their agencies. The potential impact of a large segment of the population leaving the workforce will seriously affect state income taxes and possibly sales tax revenues. Direct services to the elderly will see the greatest impacts, but the effects will also be felt by agencies providing services to the general public that could be utilized more intensively by a growing senior population. Individual discussions with state agency leaders regarding the expected increase in Utah’s senior population have helped increase awareness of the issues and produced a list of the impacts and related activities. Each agency expressed concern regarding the impact of a rapidly increasing senior population with several common themes expressed across Utah’s state agencies. General Trends across State Agencies Increased Demand for Services As the number of seniors and school age children increases so will the demand for many state supported services. At the same time tax revenue is expected to decrease with fewer people in the workforce to support seniors and children. State agencies will need to redesign their services to accommodate Utah’s changing population and plan for an increase in services with limited funding. Changes in the State Workforce Many agencies anticipate between 50 and 75 percent of their management teams will retire over the next decade – causing a “brain drain” or loss of expertise that will be difficult to replace. Recruiting younger workers to replace retiring employees is increasingly difficult as wages lag the private sector. State agencies will need to develop succession plans to replace retiring managers and utilize the experience and expertise of older workers.

20
Public Service Opportunities for volunteer or part‐time work will increase as many of the well‐educated and experienced baby boom generation retire. As the number of children increase in Utah’s public schools, seniors can serve as subject matter experts, mentors and teachers aides. Senior volunteers can be mentors for those making the transition from youth corrections to successful adulthood. The State and school districts have an opportunity to address their public service needs using innovative employment and volunteer public service of older workers. Impact on State Services As the population ages, state agencies will need to consider changes in the nature or delivery of the services they provide to make them more accessible. Many agencies are providing their services online. Other agencies are providing more services to rural communities and in urban neighborhoods. Forms and instructions are being redesigned to be more customer friendly, and road, highway and pedestrian construction engineers are considering the needs of the elderly in their designs. Health Issues In some ways, the baby boom generation has a split personality. Although this generation is more health conscious and concerned about fitness, many suffer from chronic diseases such as heart disease, obesity and diabetes and will need a higher level of medical services. The cost of health care continues to rise faster than the rest of the economy and is causing many to delay retirement to maintain health benefits and when retired, is a major portion of the retiree’s budget. A major concern is the shortage of critical health care components to support the large numbers of elderly who will require health care services; trained caregivers, nurses and health care facilities are likely to be in short supply. The State needs to find ways of reducing health care costs for seniors and encourage those in the baby boom generation to be more health conscious and prepare for health care coverage for retirement. Public Safety Issues With more people entering their senior years, it is expected that crimes inflicted on the elderly will increase, including elder abuse, identity theft and guardianship fraud. The State needs to develop training for law enforcement in these areas of crime prevention and inform the public how to recognize and avoid falling victim to elder‐related crime. Another issue is the high cost of incarcerating seniors in the State corrections system. The State needs to explore
21
alternative methods of sentencing and imprisonment for the elderly convicted of serious crimes. The Utah Aging Initiative. The Utah Aging Initiative is a collaborative effort of Utah state agencies led by the Utah Department of Human Services. The purpose is to raise the awareness of government agencies on the challenges presented by our increasing older population. This briefing book is the first of a continuing series of educational studies designed to bring vital information to public policy makers.

22
References 2002 Old Age Survivor and Disability Insurance (OASDI) Trustees Report, Long Range Estimates
and Projections of Future Financial Status. Aging in the 21 Century, Institute for Research on Women and Gender, Sanford University, 2002. Aging Initiative: Project 2030 Final Report. Minnesota Dept. of Human Services, December 1998. Centers for Medicare and Medicaid Services, Medicare Estimated Benefit Payments by State for
Fiscal Year 2001. http://cms.hhs.gov/statistics/feeforservice/BenefitPayments01.pdf Centers for Medicare and Medicaid Services, 2004 Annual Report of the Boards of Trustees of the
Hospital Insurance and Supplementary Medical Insurance Trust Funds. Jan Crispin‐Little, The Economic Impact and Importance of Medicaid and CHIP on Utah’s
Economy. Utah Business and Economic Review, Volume 63 Numbers 3&4, 2003. Mike Chabries, The Aging of Utah’s Prison Population – Problems and Implications.
Presentation to the Utah Gerontological Society, September 25, 2001. Dependency Ratios in Utah, Bureau of Economic and Business Research, University of Utah,
April 2003. Labor Force Participation Rates in Utah, Bureau of Economic and Business Research, University
of Utah, January 2003. Derek Mason, Terry Peak, Richard Krannich, and Michael Sanderson, Planning for the Needs of
Utah’s Senior Citizens, Executive Summary. March 20, 2002. Maxwell, S. Moon, December 2000, “Growth in Medicare and Out of Pocket Spending: Impact on
Vulnerable Beneficiaries.” The Urban Institute. Dann Milne, Debbie Chang, Robert Mollica, State Perspectives on Medicaid Long‐Term Care:
Report from a July 2003 State Forum, National Academy for State Health Policy, 2004. National Long‐Term Care Survey, Administration on Aging, 2000. Older Americans 2000: Key Indicators of Well‐Being. Federal Interagency Forum on Aging
Related Statistics. Project 2015: The Future of Aging in New York State. NYS Office for the Aging. Projected Life Expectancy for Utah, Bureau of Economic and Business Research, University of
Utah, April 2003. Projections of males, females and total population from 1990 to 2050 for Utah Counties. Bureau
of Economic and Business Research, University of Utah, 2003. Resource Directory for Older People, National Institute on Aging The State of Aging in Montana: Final Report Summary, DPHHS – Senior and Long Term Care. U.S. Census Bureau, 1990 Summary Tape File (Utah), Age, Sex, and Group Quarters: 1990; Profile
of Selected Social Characteristics for Utah: 1990, Table DP‐2. U.S. Census Bureau, Census 2000 Summary File (SF 1), General Demographic Characteristics
(Utah), Table DP‐1; Selected Social Characteristics (DP‐2); Selected Economic Characteristics (DP‐3); Selected Housing Characteristics (DP‐4); General Housing Characteristics (QT‐H1).
Utah Behavioral Risk Factor Surveillance System (BRFSS) Brief, Utah Department of Health, 2002. Scott Wright and Sarah Jane Rice. Utah Handbook on Aging 2001. Scott Wright, ed. Utah Sourcebook on Aging. Who are Young Retirees and Older Workers, National Academy on an Aging Society, 2000.