Annual Water Quality Report - Yucaipa Valley Water...
6
Annual Water Quality Report 12770 Second Street, Yucaipa, California 92399 For more information, please contact the Yucaipa Valley Water District offices at (909) 797-5117 or visit our website at www.yvwd.dst.ca.us. Yucaipa Valley Water District is taking proactive steps to preserve and protect our water resources. The illustration below shows a simple overview of the District’s drinking water system (blue); sewer system (green); recycled water system (purple); and salt removal system (brown). Yucaipa Valley Water District is frequently recognized in the United States and internationally for the technological advancements in water quality produced by the Yucaipa Val- ley Regional Water Filtration Facility. The facility, which features microfiltra- tion and nanofiltration technologies, is frequently visited by students of all ages as well as specialists in water treatment from other water agencies. If you would like to join us for a tour, please contact Resource Sustain- ability Manager Jennifer Ares at (909) 790-3301 for more information. Space is limited. Please have your account number, address and contact information available. District Replenishes Local Groundwater Basin So That It Can Be Used As A Hedge Against Future Droughts Yucaipa Water Treatment Plant Gains National and International Recognition By carefully integrating our infra- structure, we can use water more efficiently, while meeting increasingly strict regulatory requirements. Work- ing closely with San Bernardino Val- ley Municipal Water District, Yucaipa Valley Water District will have stored more than two billion gallons of high quality water in our local groundwater basin by the end of this year. This additional water supply will be used to protect our community from future water shortages and long-term droughts.
Transcript of Annual Water Quality Report - Yucaipa Valley Water...

Annual WaterQuality Report
12770 Second Street, Yucaipa, California 92399
For more information, please contact the YucaipaValley Water District offices at (909) 797-5117 or
visit our website at www.yvwd.dst.ca.us.
Yucaipa Valley Water District is taking proactive steps to preserve and protect our water resources. The illustration below shows a simple overview of the District’s drinking water system
(blue); sewer system (green); recycled water system (purple); and salt removal system (brown).
Yucaipa Valley Water District is frequently recognized in the United States and internationally for the technological advancements in water quality produced by the Yucaipa Val-ley Regional Water Filtration Facility.
The facility, which features microfiltra-tion and nanofiltration technologies, is frequently visited by students of all
ages as well as specialists in water treatment from other water agencies.
If you would like to join us for a tour, please contact Resource Sustain-ability Manager Jennifer Ares at (909) 790-3301 for more information. Space is limited. Please have your account number, address and contact information available.
District Replenishes Local Groundwater Basin So That It Can Be Used As A Hedge Against Future Droughts
Yucaipa Water Treatment Plant Gains National and International Recognition
By carefully integrating our infra-structure, we can use water more efficiently, while meeting increasingly strict regulatory requirements. Work-ing closely with San Bernardino Val-ley Municipal Water District, Yucaipa Valley Water District will have stored more than two billion gallons of high quality water in our local groundwater basin by the end of this year. This additional water supply will be used to protect our community from future water shortages and long-term droughts.

Ten years ago, 95% of the District’s water supply was from groundwater sources and the remaining 5% was collected from local surface water sources.
The District now has additional water facilities to put to work. The operation of the Yucaipa Valley Re-gional Water Filtration Facility provides pure drinking water to our customers.
Additionally, the Wochholz Regional Water Recycling Facility is capable of producing high quality recycled water for the irrigation of school grounds, parks and golf courses. This source of recycled water will be increasingly utilized in the near future to further drought-proof our community.
The District also plans to add two water meters to every new home with large lots. One water meter will
be used for drinking water in the home, while a second recycled water meter connected to a separate pipeline will provide recycled water for the irrigation of front and rear yards.
The implementation of this plan is expected to reduce the amount of drinking water demands for new homes by nearly 50%.
As water becomes an increasingly precious commodity, Yucaipa Valley Water District is stepping up its recycling efforts. This will allow more water to be reused on golf courses, school grounds, roadside medians and for other landscaping purposes, including the front and rear yards of new homes.
Each time we use water in our homes, we turn it into wastewater. While nature has purified water for millions of years, Yucaipa Valley Water District has the technology and infrastructure capable of recycling our wastewater and making it usable water once again. This source of high quality irrigation water is the only water source that will increase in the future.
A Diversified Water Resource Portfolio
Yucaipa Valley Water District continues to develop a robust portfolio of water resources
Water Resources from the Wochholz Regional Water Recycling Facility

In 2011, Yucaipa Valley Water District provided over 3.6 billion gallons of drinking water to our customers. About one third of the water supplied to our customers (roughly 1.5 billion gallons) was imported water filtered to become pure drinking water at the Yucaipa Valley Regional Water Filtration Facility. By importing water to supplement local water needs, the District was able to avoid pumping 1.5 billion gallons of water from our local groundwater basin. Working with San Bernardino Valley Municipal Water District, we also recharged our groundwater basin with an additional 800 million gallons of imported water. The 2.3 billion gallons added to our local groundwater bank helps Yucaipa Valley Water District recover from over 50 years of excessive groundwater production and will help to further provide redun-dancy and drought protection for our community.
Yucaipa Valley Water District continu-ously works to provide new ways to ensure that our residential and busi-ness customers have a reliable water supply at a reasonable price. We are firmly committed to maintaining high quality water for you, our customers.
In 2011, Yucaipa Valley Water District met all of the drinking water quality standards based on thousands of wa-
ter samples and test results reported by independent laboratories.
The information in this report is sub-mitted to the California Department of Public Health as well as the U.S. Environmental Protection Agency. Both agencies monitor our compli-ance with the many regulatory and testing standards required to ensure that safe drinking water is consistent-
ly delivered to our customers.In this report, we attempt to convey the extensive laboratory data and test results in a simple manner to inform our customers of the exceptionally high quality drinking water we pro-vide. If you have any questions or would like more information, please contact Assistant General Manager Jack Nelson directly at (909) 797-5119, Ext. 3.
Annual Water Quality Report
Terms Used In This Report
Where Does Our Water Come From?
Maximum Contaminant Level (MCL): The highest level of a con-taminant or chemical that is allowed in drinking water. Primary MCLs are set as close to the Public Health Goals (PHGs) Maximum Contami-nent Level Goal (or MCLGs) as is economically and technologically feasible. Secondary MCLs are set to protect the odor, taste, and appear-ance of drinking water.
Maximum Contaminant Level Goal (MCLG): The level of a contaminant in drinking water below which there is no known or expected risk to health. MCLGs are set by the U.S. Environ-mental Protection Agency.
Public Health Goal (PHG): The level of a contaminant in drinking water below which there is no known or expected risk to health. PHGs are set by the California Environmental Protection Agency.
Maximum Residual Disinfectant Level (MRDL): The level of a disin-fectant added for water treatment that may not be exceeded at a consum-er’s tap.
Maximum Residual Disinfectant Level Goal (MRDLG): The level of a disinfectant added for water treat-ment below which there is no known or expected risk to health. MRDLGs are set by the U.S. Environmental Protection Agency.
Primary Drinking Water Standards (PDWS): MCLs and MRDLs for contaminants that affect health along with their monitoring and reporting requirements and water treatment requirements.
Secondary Drinking Water Stan-dards (SDWS): MCLs for con-taminants that affect taste, odor, or appearance of the drinking water. Contaminants with SDWSs do not affect the health at the MCLs.
Treatment Technique: A required process intended to reduce the level of a contaminant in drinking water.
Regulatory Action Level (AL): The concentration of a contaminant which, if exceeded, triggers treatment or other requirements that a water system must follow.
Non-Detected (ND): A constituent that is not detected at a testing limit.
Units of Measurement:
mg/l milligrams per liter, or parts per millionug/l micrograms per liter, or parts per billionng/l nanograms per liter, or parts per trillionpCi/l picocuries per liter, a measure of radiationNTU Nephelometric Turbidity Units, a measure of the cloudiness of a liquid

The following tables list all of the drinking water contaminants that were detected during the most recent sampling periods prior to December 31, 2011. The presence of these contaminants in the water does not necessarily indicate that the water poses a health risk. The Department of Public Health allows us to mon-itor for certain contaminants less than once per year because the concentrations of these contaminants do not change frequently. Some of the data provided below is more than one year old and is representative of long-term water quality.
Este aviso contiene información muy importante sobre su agua potable.
Tradúzcalo ó hable con alguien que lo entienda bien.
2011 Drinking Water Quality Information
Sampling Results Showing the Detection of Coliform BacteriaMicrobiologicalContaminants
Highest Numberof Detections
Number of Monthsin Violation
Highest LevelAllowed (MCL)
Ideal GoalPublic HealthGoal (MCLG)
Typical Sourcesof Bacteria
Naturally present in theenvironment and are usedas an indicator that otherpotentially harmful bacte-ria may be present
Human and animalfecal waste
TotalColiformBacteria
FecalColiform
No more than 1 sample in a month with a dectection
A routine sample anda repeat sample detecttotal Coliform and either
sample also detectsfecal Coliform or E. coli
0
0
1.8%7
0
(In a month)0
(In a year)0
Sampling Results for Certain Inorganic MineralsChemical orConstituent
Average levelDetected
Range ofDetections
Highest LevelAllowed (MCL
or MRDL)
Ideal Goal PublicHealth Goal (MCLG
or MRDLG
Typical Sourcesof Contaminant
Naturally occuring mineralfound in ground and surfacewater
Naturally occuring mineralfound in ground and surfacewater
Naturally occuring mineralfound in ground and surfacewater
Naturally occuring mineralfound in ground and surfacewater
Calcium
Sodium
Potassium
Magnesium
No Standard
No Standard
No Standard
No Standard
None
None
None
None
15 - 110 mg/l
13 - 50 mg/l
ND - 6.0 mg/l
4.6 - 38 mg/l
36.7 mg/l
28 mg/l
2.0 mg/l
9.6 mg/l
Sampling Results Showing the Detection of Lead and CopperLead and Copper
(Monitoring completed in 2007)
Number of Samples Collected
90th PercentileLevel Detected
Number of SitesExceeding
Action Level (AL)
RegulatoryAction Level/
Public Health Goal
Typical Sourcesof Contaminant
Internal corrosion of house-hold water plumbingsystems; discharges from industrial manufacturers; erosion of natural deposits
Internal corrosion of household water plumb-ing systems; erosion of natural deposits; leaching from wood preservatives
Lead (ug/l)
Copper (mg/l)
0
1
15 / 0
1.3 / 0.17
<5
0.15
39
39
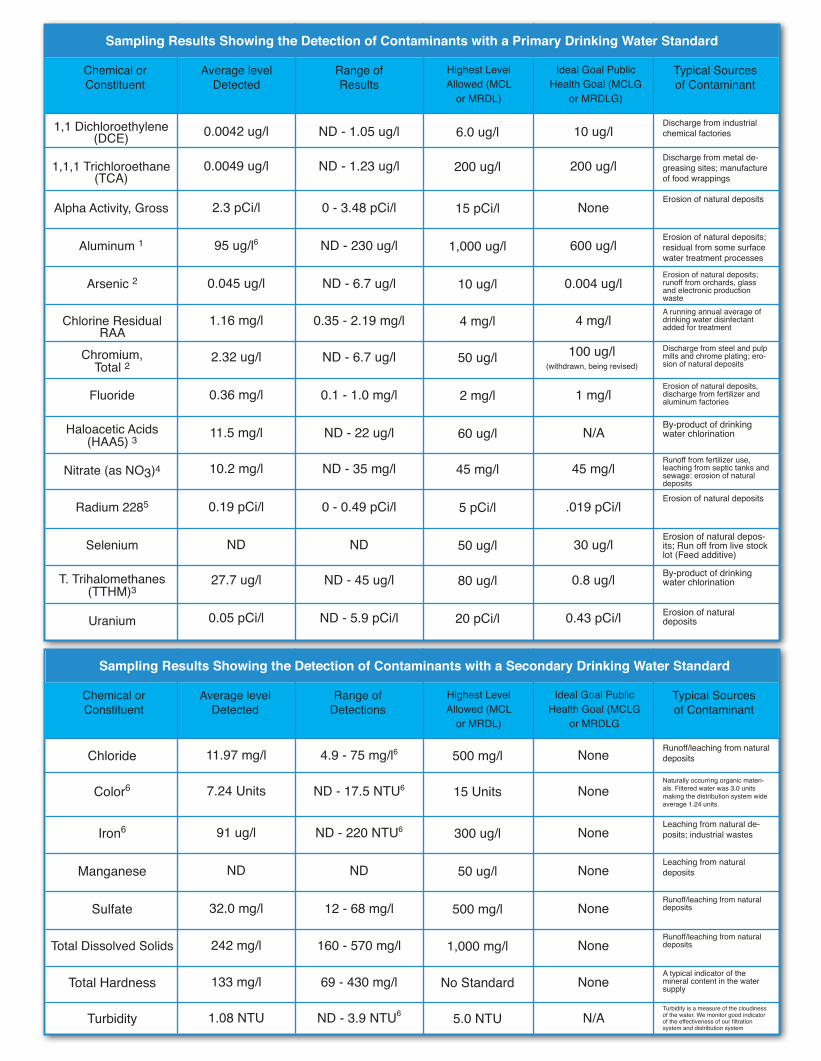
Sampling Results Showing the Detection of Contaminants with a Primary Drinking Water Standard
Chemical orConstituent
Average levelDetected
Range ofResults
Highest LevelAllowed (MCL
or MRDL)
Ideal Goal PublicHealth Goal (MCLG
or MRDLG)
Typical Sourcesof Contaminant
Discharge from industrialchemical factories
Discharge from metal de-greasing sites; manufacture of food wrappings
Erosion of natural deposits
Erosion of natural deposits;residual from some surfacewater treatment processes
Erosion of natural deposits;runoff from orchards, glass and electronic production wasteA running annual average ofdrinking water disinfectantadded for treatment
Discharge from steel and pulp mills and chrome plating; ero-sion of natural deposits
Erosion of natural deposits,discharge from fertilizer andaluminum factories
By-product of drinking water chlorination
Runoff from fertilizer use, leaching from septic tanks and sewage: erosion of natural deposits
Erosion of natural deposits
By-product of drinking water chlorination
Erosion of natural depos-its; Run off from live stock lot (Feed additive)
Erosion of natural deposits
1,1 Dichloroethylene(DCE)
1,1,1 Trichloroethane (TCA)
Alpha Activity, Gross
Aluminum 1
Arsenic 2
Chlorine ResidualRAA
Chromium,Total 2
Fluoride
Haloacetic Acids(HAA5) 3
Nitrate (as NO3)4
Radium 2285
T. Trihalomethanes(TTHM)3
Selenium
Uranium
6.0 ug/l
200 ug/l
15 pCi/l
1,000 ug/l
10 ug/l
4 mg/l
50 ug/l
2 mg/l
60 ug/l
45 mg/l
5 pCi/l
80 ug/l
50 ug/l
20 pCi/l
10 ug/l
200 ug/l
None
600 ug/l
0.004 ug/l
4 mg/l
100 ug/l(withdrawn, being revised)
1 mg/l
N/A
45 mg/l
.019 pCi/l
0.8 ug/l
30 ug/l
0.43 pCi/l
ND - 1.05 ug/l
ND - 1.23 ug/l
0 - 3.48 pCi/l
ND - 230 ug/l
ND - 6.7 ug/l
0.35 - 2.19 mg/l
ND - 6.7 ug/l
0.1 - 1.0 mg/l
ND - 22 ug/l
ND - 35 mg/l
0 - 0.49 pCi/l
ND - 45 ug/l
ND
ND - 5.9 pCi/l
0.0042 ug/l
0.0049 ug/l
2.3 pCi/l
95 ug/l6
0.045 ug/l
1.16 mg/l
2.32 ug/l
0.36 mg/l
11.5 mg/l
10.2 mg/l
0.19 pCi/l
27.7 ug/l
ND
0.05 pCi/l
Sampling Results Showing the Detection of Contaminants with a Secondary Drinking Water Standard
Chemical orConstituent
Average levelDetected
Range ofDetections
Highest LevelAllowed (MCL
or MRDL)
Ideal Goal PublicHealth Goal (MCLG
or MRDLG
Typical Sourcesof Contaminant
Runoff/leaching from natural deposits
Naturally occurring organic materi-als. Filtered water was 3.0 units making the distribution system wide average 1.24 units.
Leaching from natural de-posits; industrial wastes
Leaching from natural deposits
Runoff/leaching from natural deposits
Runoff/leaching from natural deposits
A typical indicator of the mineral content in the water supply
Turbidity is a measure of the cloudiness of the water. We monitor good indicator of the effectiveness of our filtration system and distribution system
Chloride
Color6
Iron6
Manganese
Sulfate
Total Dissolved Solids
Total Hardness
Turbidity
500 mg/l
15 Units
300 ug/l
50 ug/l
500 mg/l
1,000 mg/l
No Standard
5.0 NTU
None
None
None
None
None
None
None
N/A
4.9 - 75 mg/l6
ND - 17.5 NTU6
ND - 220 NTU6
ND
12 - 68 mg/l
160 - 570 mg/l
69 - 430 mg/l
ND - 3.9 NTU6
11.97 mg/l
7.24 Units
91 ug/l
ND
32.0 mg/l
242 mg/l
133 mg/l
1.08 NTU
12770 Second Street, Yucaipa, California 92399
PRSRT STDU.S. Postage Paid
San Bernardino, CAPermit No. 2546
ECRWSS
1. About Aluminum. A secondary MCL for aluminum is 200 ug/l. The secondary standard is based on aesthetics.2. About Arsenic and Chromium: While your drinking water meets the current standard for arsenic and chromium, a small portion of our water does contain low levels. The standard balances the current understanding of arsenic and chromium possible health effects against the costs of removing them from drinking water. California Department of Public Health continues to research the health effects of low levels of arsenic, which is a mineral known to cause cancer in humans at high concentrations as well as other health effects such as skin damage and circulatory problems. Chromium is suspected of causing allergic dermatitis after many years of exposure. The U.S. Environmental Protection Agency has adopted a revised MCL of 10 ug/l, or 10 parts per billion for arsenic and 50 ug/l, or 50 parts per billion for chromium. The Ideal Public Health Goal for Total Chromium has been withdrawn and is under reconsideration for a new standard. 3. About Trihalomethanes: Compliance with the MCL for Total Trihalomethanes and Haloacetic Acids is based on an annual running average of four quarterly samples for each site. Results presented are for 2011. Both quarterly and annual running averages are below the MCL’s.4. About Nitrate: The District did not serve drinking water above 45 mg/l which has been shown to be a health risk for infants of less than six months of age. Such nitrate levels in drinking water can interfere with the capacity of the infant’s blood to carry oxygen, resulting in a serious illness; symptoms include shortness of breath and blueness of the skin. Nitrate levels above 45 mg/l may
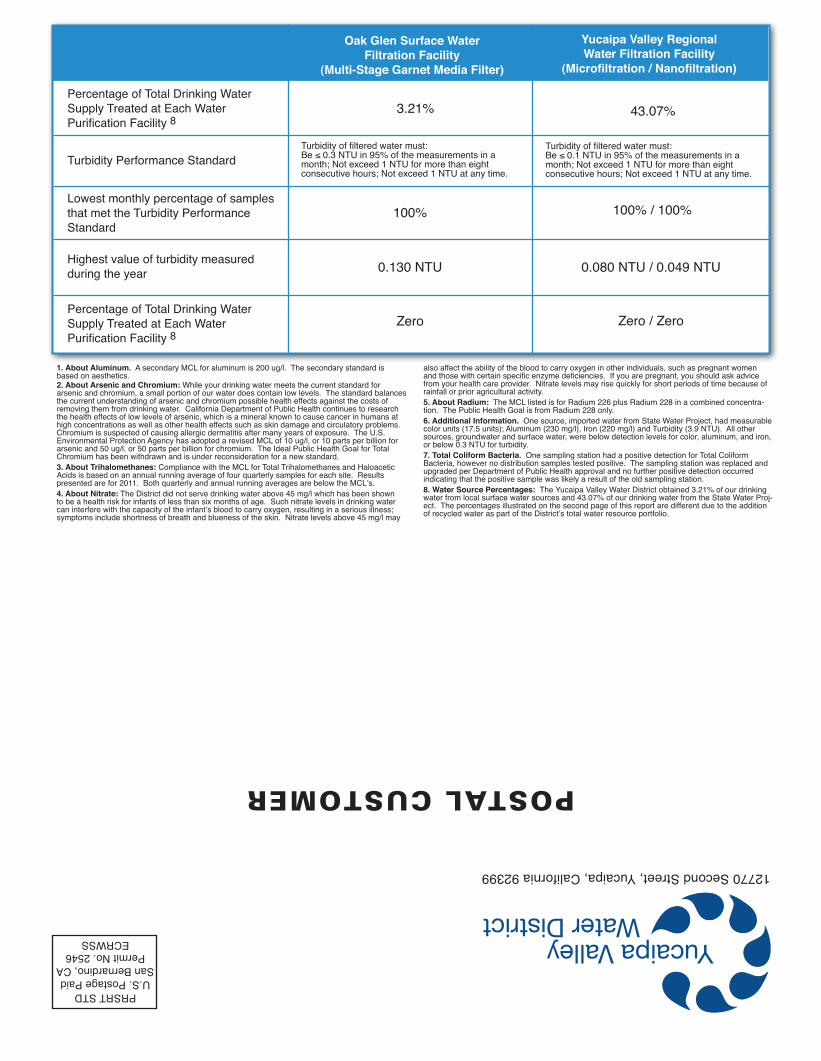
also affect the ability of the blood to carry oxygen in other individuals, such as pregnant women and those with certain specific enzyme deficiencies. If you are pregnant, you should ask advice from your health care provider. Nitrate levels may rise quickly for short periods of time because of rainfall or prior agricultural activity.5. About Radium: The MCL listed is for Radium 226 plus Radium 228 in a combined concentra-tion. The Public Health Goal is from Radium 228 only.6. Additional Information. One source, imported water from State Water Project, had measurable color units (17.5 units); Aluminum (230 mg/l), Iron (220 mg/l) and Turbidity (3.9 NTU). All other sources, groundwater and surface water, were below detection levels for color, aluminum, and iron, or below 0.3 NTU for turbidity.7. Total Coliform Bacteria. One sampling station had a positive detection for Total Coliform Bacteria, however no distribution samples tested positive. The sampling station was replaced and upgraded per Department of Public Health approval and no further positive detection occurred indicating that the positive sample was likely a result of the old sampling station.8. Water Source Percentages: The Yucaipa Valley Water District obtained 3.21% of our drinking water from local surface water sources and 43.07% of our drinking water from the State Water Proj-ect. The percentages illustrated on the second page of this report are different due to the addition of recycled water as part of the District’s total water resource portfolio.
Oak Glen Surface Water Filtration Facility
(Multi-Stage Garnet Media Filter)
Yucaipa Valley Regional Water Filtration Facility
(Microfiltration / Nanofiltration)
Percentage of Total Drinking Water Supply Treated at Each Water Purification Facility 8
Turbidity Performance StandardTurbidity of filtered water must: Be ≤ 0.3 NTU in 95% of the measurements in a month; Not exceed 1 NTU for more than eight consecutive hours; Not exceed 1 NTU at any time.
Turbidity of filtered water must: Be ≤ 0.1 NTU in 95% of the measurements in a month; Not exceed 1 NTU for more than eight consecutive hours; Not exceed 1 NTU at any time.
Lowest monthly percentage of samples that met the Turbidity Performance Standard
Highest value of turbidity measured during the year
Percentage of Total Drinking Water Supply Treated at Each Water Purification Facility 8
3.21%
100%
0.130 NTU
Zero
43.07%
100% / 100%
Zero / Zero
0.080 NTU / 0.049 NTUPOSTAL CUSTOMER