Annual Statistical Report 2010 – 11
98
Provide every young person with the lifelong skills, values and confidence to be self-reliant and to contribute to the development of Vanuatu Annual Statistical Report 2010 – 11 Policy and Planning Unit Ministry of Education June 2012
Transcript of Annual Statistical Report 2010 – 11

Provide every young person with the lifelong skills, values and
confidence to be self-reliant and to contribute to the development
of Vanuatu
Annual Statistical Report 2010 – 11
Policy and Planning Unit Ministry of Education
June 2012

Republic of Vanuatu Ministry of Education Annual Statistical Report 2010 – 2011
Published by the Policy and Planning Unit,MoE
© 2012
For statistics on education in Vanuatu contact:
Ms Fabiola Bibi Ministry of Education Private Mail Bag 9028 Port Vila, VANUATU Telephone (678) 22309 Facsimile (678) 24569 Email [email protected]

1
The Ministry of Education (MoE) is continuing with the implementation of policies developed to meet the goals in the Vanuatu Education Sector Strategy (VESS) 2007 – 2016 while developing monitoring and evaluation frameworks and reporting processes across the departments in the Ministry. All of these rely on timely and accurate statistical indicators.
Since 2007 the MoE has been developing and expanding the information in the Vanuatu Education Information System (VEMIS). VEMIS contains information from the Annual School Census which covers every Early Childhood Education centre, every primary school and every secondary school in Vanuatu. VEMIS contains financial information from schools and work is ongoing to improve the quality and coverage of this information to align school income, such as that coming to primary schools through the school grants, with expenditure. This is no easy task. The Vanuatu Standardised Test of Achievement VANSTA examination results are incorporated into VEMIS and this report contains analysis of these examination results for the first time.
This Annual Statistical Report is an essential tool to assess the progress towards achieving the milestones in VESS as well as providing official national statistics on the education sector in Vanuatu. We at the MoE strongly believe that the information contained in this report will provide the foundation for detailed analysis of the trends in the sector and measured against policy outcomes and outputs such as that needed to monitor the progress of the Vanuatu Education Road Map (VERM), and to modify the plan as necessary. Statistical information from VEMIS is one of the major sources of information for VERM monitoring, and it is used along with detailed financial analysis, management and administrative reports and other specific studies for this.
This report is combined for the years 2010 and 2011 based on a format agreed to in consultation with stakeholders in late 2011 to improve the timeliness of the annual statistical reports after a considerable delay with the 2009 report. It contains analysis of the key findings for 2010 and 2011 in relation to the three goals in VESS for decision makers and numerous statistical tables for policy analysts and planners.
The Ministry of Education would like to thank all the schools throughout Vanuatu which continue to support VEMIS through completing the annual school survey forms, the information that has been provided is important for the further growth and development of the education system. Among the many contributors to this report to whom I am thankful I would like to make special mention of the work made by the VEMIS data entry operators and their attention to detail and ongoing efforts to improve the quality of VEMIS statistics.
Jesse Dick
Director General MINISTRY OF EDUCATION
Foreword

2 Annual Statistical Report 2010-11
This report has been produced by the Planning and Policy Unit (PPU) of the Ministry of Education. This report is the first of its kind produced by the PPU. For the first time the MoE has included statistics from outside the Annual School Survey data in VEMIS from areas to do with examination results and post-secondary education and training. Improving the coverage of the annual statistics report is a work in progress.
The statistical information and analysis in this report has been provided by a number of people. Among the many contributors to this report to whom I am thankful I would like to make special mention of the efforts made by staff from the Ministry of Education: John Gideon, Michelle Maschmedt, Liku Jimmy, Melvin Boesel, Dawn Reuben, and Julia Whippy. Contributors from outside the Ministry of Education include Benjamin Shing and Johnson Vora from the Prime Minister’s Office, and Willie Rex (Ministry of Finance).
The Ministry of Education is grateful for the support from the Vanuatu National Statistics Office (VNSO) which provided the detailed sub-national population estimates required to derive many of the official statistical indicators from the VEMIS data. The VNSO also provided assistance in finalising the contents of this report and analysis.
Conducting an annual census of all schools is a huge challenge. I would like to acknowledge the efforts made by the PPU to produce this report, with special mention for the PPU Statistician, Ms Fabiola Bibi, the Zone Curriculum Advisors (ZCA’s) and the Province Education Officers (PEO’s) who coordinate the distribution of the of the Annual School Survey. This report relies on the work done by the VEMIS data entry operators and their attention to detail and ongoing efforts to improve the quality of VEMIS statistics for which I am extremely thankful.
I would like to thank all the schools throughout Vanuatu for their continuing support of the Annual School Survey and the other information schools provide which is entered into VEMIS. The information provided is vital for the growth and development of the education system.
John Niroa
Director, Policy and Planning Unit MINISTRY OF EDUCATION
Acknowledgements

3
Key results
1. Increase access to education Increasing access in primary education is a priority goal for the Vanuatu Government and the Ministry of Education (MoE). In order to meet its targets in meeting 100% of net enrolment by 2015 in primary education, the MoE with funding support from the development partners has implemented the Universal Primary Education (UPE) policy which introduced fee free education by
providing school grants rolled out nationwide in 2010. There was a growth of over 3,000 children enrolled in primary schools Year 1 to 6 in 2010.
The second objective to increase access to basic education is to have a 100% transition rate from Year 6 to Year 7 by 2015. In 2010 82 out of every 100 children in Year 6 went on to Year 7 in 2011.
The success of the policy of fee free education for year 1 – 6 is evident in the gross and net enrolment rates for this level. Gross enrolment is enrolment of any aged child in Year 1 – 6 while net enrolment is the enrolment of children aged 6 – 11 years of
age in Year 1 – 6. The Gross Enrolment Rate (GER) of 119% in 2011 shows that children both younger and older than 6 – 11 years are enrolled in Year 1 – 6. A closer examination of the age and enrolment data shows that the GER is high because of children older than 11 years enrolled in Year 1 – 6. The Net Enrolment Rate in primary education for the age group 6 to 11 years old was 88% in both 2010 and 2011. This means that the MoE estimates that 12% of children aged 6 – 11 years of age are not enrolled in school.
At ECE level the GER at ECE is 58% and the NER is 41% which means that just over half of the children entering Year 1 at primary level have not been through an ECE programme and will find the school environment in Year 1 challenging.
At the conclusion of primary school the NER for Year 7 is 65%, which declines for each successive year of secondary
Enrolment by Level, 2007 - 2011In 2011 total enrolment was 71,911; an increase of 14% since '07
15,25716,734
18,298 18,066
37,667 38,658 41,783 42,324
10,442 11,584 11,272 11,6010
10,000
20,000
30,000
40,000
50,000
60,000
70,000
80,000
'07 '08 '09 '10 '11
'07 Total = 63,366 '11 Total = 71,991
Secondary
Primary
ECE
Primary GER has been increasing steadilyProgress i s being made towards universa l primary education but ECE and secondary GER i s low
59%
58%
35%
45%
55%
65%
75%
85%
95%
105%
115%
125%
'07 '08 '09 '10 '11
ECE
GIRLS
BOYS
GER is total enrolment as a percent of of f ical primary age population.
120%
117%
35%
45%
55%
65%
75%
85%
95%
105%
115%
125%
'07 '08 '09 '10 '11
Primary 1 - 6
39%
43%
35%
45%
55%
65%
75%
85%
95%
105%
115%
125%
'07 '08 '09 '10 '11
Secondary 7+

4 Annual Statistical Report 2010-11
education. The overall GER for secondary level in 2011 was 41% with the NER decreasing to 30%. In Penama and Malampa provinces both the GER and NER at secondary level have been decreasing since 2009 while in Tafea there was some improvement in secondary enrolment in 2011.
The MoE needs to maximise the effectiveness of its UPE policy to increase access to primary education through parallel policies to improve enrolment rates in ECE and providing alternative learning pathways to students completing the fee free primary cycle at Year 6. The data shows that primary school leavers are not continuing on to secondary level education. There are 425 primary schools in Vanuatu receiving school grants to replace fees. This grant was initially Vt 6,800 per child which increased to Vt 8,900 per child in 2011. The MoE needs to ensure that its financial and human resource management systems are able to monitor and evaluate how this funding is being used and whether it is effective in improving learning
outcomes for children.
The government provides funding for 59% of all primary and secondary schools in Vanuatu, and provides financial assistance for another 22% of schools operated by religious denominations. The remaining 19% of ECE centres and schools are self-funding.
The majority of ECE centres and schools are registered as English
language schools. In 2011 about two of every three ECE centre, primary and secondary schools were registered as an English language school: two out of every three child enrolled from ECE to upper secondary level are in English speaking schools. At primary and secondary level about one in three students are enrolled in French speaking schools.
In 2011 the MoE began to collect enrolment and related information from post-secondary institutions beginning with government managed institutions and Technical and Vocational Education and Training (TVET) projects. The statistics collected indicate that these providers provided training for about 4,350 students in 2011, about half of which were through TVET project programs including programs run through Rural Training Centres.
NER is highest at primaryNER is increas ing at ECE and i s lowest at secondary level
NER is of f ical age enrolment as a percent of of f ical primary age population.
40%
41%
20%
30%
40%
50%
60%
70%
80%
90%
'07 '08 '09 '10 '11
ECE
GIRLS
BOYS
87%
89%
20%
30%
40%
50%
60%
70%
80%
90%
'07 '08 '09 '10 '11
Primary 1 - 6
28%
32%
20%
30%
40%
50%
60%
70%
80%
90%
'07 '08 '09 '10 '11
Secondary 7+
Government
Church (Govt. assisted)
Private
Community
Church
Other
42,266 (59%)
15,649 (22%)
11,030 (15%)
2,561 (4%)
336 (0%)
149 (0 %)
Total = 71,991
Total Enrolment by Education Authority, 2011
5
The policy to increase the number of scholarships awarded continued in 2010 and 2011 with 593 scholarships awarded in 2011. The vast majority of scholarships are for degree courses making up 89% of scholarships awarded in 2011. Over half or 55% of the scholarships awarded in 2011 were funded by the government of Vanuatu, followed by 22% awarded by Australia and 17% by New Zealand. Students progress well through their scholarship courses, with 20% expecting to graduate in 2011 and only 3% failing to meet the requirements. In 2011 just over one in five or 22% of scholarship students were studying commerce courses (including economics), compared with 18% studying arts, 12% science and 11% law. In 2011 4% of scholarship students were enrolled in education studies.
2. Improve the quality of education The MoE is working to make sure that school children receive the best possible quality of education. Education costs in Vanuatu are high compared to many countries. The high cost of transporting materials to islands and remote schools and low enrolment in some schools limit the amount of money available to the MoE to provide resources and materials to all students. The multilingual school system means that there is additional complexity, for example in making sure that there are qualified teachers and textbooks available in schools registered under English, French, Bislama and vernacular languages.
Quality education is the centre of success in education in both learning and teaching. It should be assessed by the outstanding student achievements. The Vanuatu Standardised Test of Achievement (VANSTA) in 2009 results at Year 4 was of concern for boys in both English and French schools where only 17% were able to read and write satisfactorily. Year 4 English boys scored only slightly better in numeracy with 17% showing proficiency compared to 31% of French language schools. The rates for Year 4 girls were generally higher than boys, but still not 33% which demonstrates satisfactory numeracy and literacy. At Year 6 literacy and numeracy rates were higher; with for example 46% of Year 6 girls in English schools and 29% in French schools demonstrating satisfactory literacy. Clearly these results are of concern for the quality of education and the learning gain of students in both language streams of primary education.
In 2010, 100% of children who sat the Year 8 national exam passed to Year 9 while the proportion of students who passed the Year 10 exam was 38% in English schools and 100% in French junior secondary schools. There is a significant difference between the two languages and raises questions about whether the Year 10 selection criteria are consistent or whether there are other issues to address such as the number of places available in Year 11 classes in English schools compared to French ones.
There are two exams at the end of the twelfth year of schooling – the Year 12 English school stream and Année 12 French school stream. The twelfth year examination results for 2010 show better achievement in Year 12 English results; although the overall pass rates were not high. In 2010 there were 736 Year 12 English candidates and 461 Année 12 French students sitting exams. In English schools about 50% passed to Year 13 while only 25% advanced in French schools. In 2011 26% of the 524 French students sitting Année 12 passed compared with 56% of the Year 12 students passing.
Male scholarship recipients outnumber females
But the gender gap has been narrowing since 2008
270
323
0
50
100
150
200
250
300
350
'04 '05 '06 '07 '08 '09 '10 '11
In '11 54% of scholarship recipients were males
Males
Females
Year

6 Annual Statistical Report 2010-11
57% 55%60%
64% 66%
0%
25%
50%
75%
2007 2008 2009 2010 2011
Primary68%
62% 65% 64% 63%
0%
25%
50%
75%
2007 2008 2009 2010 2011
Secondary
Proportion of teachers certified in Government schools
The mediocrity of the examination results at various levels of schooling, particularly at the younger ages, could reflect the high proportion of unqualified and uncertified teachers along with other factors such as the rate of teacher absenteeism from the classroom, poor preparation of school lesson plans, inadequate in-service training and a lack of teaching resources. The Government of Vanuatu is working to improve the qualifications of teachers and established the Vanuatu In-Service Unit at the Vanuatu Institute of Teacher Education (VITE) in 2010 which offers Year 1-13 classroom teachers training with a curriculum designed specifically for their needs. Teachers learn how, when, and where to incorporate lessons and appropriate resources and learning materials into their teaching. They are also trained how to design assessment tools and align lesson plans with learning outcomes. The goal is to prepare today's teachers for tomorrow's demands in teaching. However it is a large challenge for this program to deliver this one-year in-service course for all untrained teachers. The process of identifying the untrained teachers is ongoing; presenting the MoE with additional challenges about taking teachers out of the classroom and making sure replacement teachers are also qualified. In 2010, 47% of ECE teachers were certified to teach, 58% of primary school teachers were certified to teach and 48% had academic qualifications but not the specific certification for teaching. In secondary level, 61% of teachers had teaching certification while 39% had some academic qualification but not formal teacher certification.
In 2011 for every 100 students who started Year 1 of primary 70 survive through five years of primary school to Year 6 compared with 97 in 2009. This means that based on 2011 statistics 30% of students do not complete five years of primary schooling. Within the three years 2009 to 2011, the survival rate to Year 5 decreased by 37%. At the same time as the survival rate decreased the proportion of drop outs in Year 1 – 6 increased from 2% in 2009 to 8% in 2011 and the 2011 repeater rate was 12%. The MoE is implementing 15 minimum quality standards to improve the quality of education and achieve the VERM strategic goals.
The pupil: textbook ratio is another important indicator used to assess the efficiency of resource utilisation. The average number of textbooks per pupil was 2.5 in 2010 which gives a rough indication of allocation resources to the primary school students. On the other hand, the sharing of textbooks by core subject and per pupil is very low for Basic Science 0.0, General studies 0.3 and Maths 0.4.
In 2010 the MoE began a program to enable schools to use their school grants to pay for textbooks in all government and government assisted primary schools in Vanuatu which continued in 2011. The annual school survey results show that in 2011 the pupil: textbook ratios in Sanma, Shefa and Tafea provinces did not significantly improve from 2010 levels; perhaps the additional textbooks purchased were offset by increased enrolment or that the survey took place before the 2011 textbooks were delivered.

7
3. Improve planning, fiscal and financial management The Vanuatu Education Sector Strategy (VESS) for 2007-16 focuses on better educational outcomes and education as a right achieved through achieving long-term strategies by implementing annual initiatives to achieve short-term results. The Vanuatu Educational Road Map (VERM) sets out the agenda for the development of education sector over the medium term. It is based on the Millennium Development Goals (MDGs), principally the second MDG to achieve universal primary education. It incorporates the strategic vision outlined in VESS, though VESS remains the policy document that sets the framework.
The MoE receives about 25% or one quarter of the Government recurrent budget: the highest proportion of any Ministry. In 2011 the MoE received Vt 3,857,879,096 from Government and a further Vt 470,192,769 from development partners (Australia, New Zealand and UNICEF). In 2010 the combined Government and donor funds for education was about 9% of the value of all of the goods and services produced in Vanuatu as measured by the Gross Domestic Product (GDP).
In 2010 and 2011 the Government increased its funds to the MoE by 16% showing its financial commitment to the fee-free primary education policy and increased scholarships for tertiary study.
The allocation of school funds in Vanuatu is based on VEMIS school enrolment data. As of 2009 about 23-24% of total government spending was allocated to education, which represents about 6% of the GDP. About 55% of these resources were allocated to primary education and 30% to secondary. Due to high transportation cost and a proliferation of small primary schools with low student-teacher ratios (lower than 24 students to 1 teacher in 2010) and consequently a high budgetary allocation to teacher salaries, the per student cost of education is high, with the government funding provided not sufficient and parents and caregivers are often still asked to contribute financially. This puts students from low socio-economic backgrounds at a distinct disadvantage and consequently pose equity issues for these students. The government’s main challenge is to decrease the cost of education so that it can provide better access and quality at every level for all school aged children.

8 Annual Statistical Report 2010-11
Province key results 2007 - 2011
9 Annual Statistical Report 2010-11
Republic of Vanuatu

10 Annual Statistical Report 2010-11
Contents
Key results .......................................................................................................................................................... 3
Province key results 2007 – 2011 ....................................................................................................................... 8
Introduction ...................................................................................................................................................... 14
1. Access to education ...................................................................................................................... 15
1.1. Enrolment rates .......................................................................................................................................... 15 1.1.1. Enrolment by education authority .............................................................................................................. 15 1.1.2. Enrolment by school level ........................................................................................................................... 18 1.1.3. Enrolment by province ................................................................................................................................ 19 1.1.4. Mono-lingual, bi-lingual and dual lingual ................................................................................................... 19 1.1.5. Gross Enrolment Rate ................................................................................................................................. 22 1.1.6. Net Enrolment Rate .................................................................................................................................... 25 1.1.7. Drop-outs .................................................................................................................................................... 26 1.2. Schools ........................................................................................................................................................ 27 1.2.1. Education authority .................................................................................................................................... 27 1.2.2. Province ...................................................................................................................................................... 30 1.3. Scholarships for tertiary study .................................................................................................................... 31 1.4. Post-secondary education .......................................................................................................................... 33
2. Quality of education ..................................................................................................................... 35
2.1. Examination results..................................................................................................................................... 35 2.1.1. VANSTA ....................................................................................................................................................... 35 2.1.1.1. National literacy and numeracy achievement, 2009 .................................................................................. 35 2.1.2. Year 8 .......................................................................................................................................................... 37 2.1.3. Year 10 ........................................................................................................................................................ 38 2.1.4. Year 12 ........................................................................................................................................................ 39 2.1.5. Vanuatu Rural Development Training Centres Associations (VRDTCA) ...................................................... 39 2.2. School cycle completion ............................................................................................................................. 41 2.2.1. Drop-out, repeater and promotion rate ..................................................................................................... 41 2.2.2. Survival Rate ............................................................................................................................................... 42 2.2.3. Coefficient of efficiency .............................................................................................................................. 42 2.3. Teachers ...................................................................................................................................................... 43 2.3.1. Education authority .................................................................................................................................... 43 2.3.2. Province ...................................................................................................................................................... 44 2.3.3. Mono-lingual, bi-lingual and dual lingual ................................................................................................... 44 2.3.4. Student:teacher ratios ................................................................................................................................ 45 2.3.5. Certification and qualification..................................................................................................................... 46 2.3.6. In-service training ....................................................................................................................................... 48 2.4. School facilities in schools ........................................................................................................................... 48 2.4.1. Classrooms .................................................................................................................................................. 48 2.4.2. Water supply ............................................................................................................................................... 49 2.4.3. Sanitation .................................................................................................................................................... 49

11 Annual Statistical Report 2010-11
Republic of Vanuatu
2.4.4. Primary schools with secure tenure ........................................................................................................... 50 2.5. School resources ......................................................................................................................................... 51 2.5.1. Reading books ............................................................................................................................................. 51 2.5.2. Resources and equipment in primary schools ............................................................................................ 52 2.5.3. Text books ................................................................................................................................................... 53 2.5.4. Libraries ...................................................................................................................................................... 54
3. Management and planning .......................................................................................................... 57
3.1. Resources for education ............................................................................................................................. 57 3.1.1. Total expenditure ........................................................................................................................................ 57 3.1.2. Government allocation ............................................................................................................................... 58 3.1.3. Donor partner allocation ............................................................................................................................ 59 3.1.4. Unit costs of education ............................................................................................................................... 60
Annex 1: 2011 Annual School Survey and VEMIS data ..................................................................................... 61
Annex 2: Provincial enrolment, authority school level and name, 2010 – 2011.............................................. 69
Abbreviations.................................................................................................................................................... 93
Glossary ............................................................................................................................................................ 95
Tables and figures
Table 1-1: Enrolment by education authority and school level, 2008 - 2011 ..................................................................... 15
Table 1-2: Enrolment by education authority, sex and school level, 2010– 2011 .............................................................. 16
Table 1-3: ECE enrolment by education authority and province, 2010-2011 ..................................................................... 16
Table 1-4: Primary (Year 1 – 6) enrolment by education authority and province, 2010-2011 ........................................... 17
Table 1-5: Secondary (Year 7+) enrolment by education authority and province, 2011 .................................................... 17
Table 1-6: Enrolment by education authority and level, 2010-2011 .................................................................................. 18
Table 1-7: Enrolment by school type and year level, 2009 - 2011 ...................................................................................... 18
Table 1-8: Enrolment by province, school type and sex, 2010-2011 .................................................................................. 19
Table 1-9: Enrolment by province and school type, 2010– 2011 ....................................................................................... 19
Table 1-10: Number of schools, language school is registered in and level of school, 2009 – 2011 .................................. 20
Table 1-11: Number of students enrolled, language school is registered in and level of school, 2009 – 2011 ................. 20
Table 1-12: Number of ECE centres, language school is registered in and province, 2010 – 2011 .................................... 20
Table 1-13: ECE centre enrolment, language school is registered in and province, 2010 – 2011 ...................................... 21
Table 1-14: Number of primary schools*, language school is registered in and province, 2010 – 2011 ........................... 21
Table 1-15: Primary school* enrolment, language school is registered in and province, 2010 – 2011 ............................. 21
Table 1-16: Number of secondary schools#, language school is registered in and province, 2010 – 2011 ....................... 22
Table 1-17: Secondary school# enrolment, language school is registered in and province, 2010 – 2011 ......................... 22
Table 1-18: Gross Enrolment Ratio (GER), school type, 2007 – 2011 ................................................................................. 23
Table 1-19: Enrolment, level and sex, 2008-2011 .............................................................................................................. 23
Table 1-20: Population for each class Year, age for Year, and sex, 2008-2011 .................................................................. 24
Table 1-21: Gross Enrolment Rate (GER) and the GPI of the GER, level and province 2009-2011 ..................................... 24

12 Annual Statistical Report 2010-11
Table 1-22: Net Enrolment Ratio (NER), school type, 2007 – 2011 .................................................................................... 25
Table 1-23: Official age enrolment, level and sex, 2008-2011............................................................................................ 25
Table 1-24: Net Enrolment Rate (NER) and the GPI of the NER, level and province, 2009-2011 ....................................... 26
Table 1-25: Number of drop-outs, sex and level, 2008-2011 ............................................................................................. 26
Table 1-26: Table 1 25: Number of drop-outs, sex and education authority, 2010-2011 .................................................. 27
Table 1-27: Total number of schools, education authority, 2007 - 2011 ........................................................................... 27
Table 1-28: Total number of ECE centres, education authority, 2007 - 2011..................................................................... 27
Table 1-29: Total number of schools, education authority, province, 2010 - 2011 ........................................................... 28
Table 1-30: Total number of ECE centres, education authority, province, 2010 - 2011 ..................................................... 28
Table 1-31: Total number of Primary schools*, education authority, 2007 - 2011 ............................................................ 29
Table 1-32: Total number of Primary schools*, education authority, province, 2010 - 2011 ............................................ 29
Table 1-33: Total number of Secondary schools#, education authority, 2007 - 2011 ........................................................ 29
Table 1-34: Total number of Secondary schools#, education authority, province, 2010 - 2011 ........................................ 30
Table 1-35: Total number of schools, province, 2007 - 2011 ............................................................................................. 30
Table 1-36: Total number of schools, school level, province, 2009 - 2011 ......................................................................... 31
Table 1-37: Scholarship recipients, sex, 2004 - 2011 .......................................................................................................... 31
Table 1-38: Scholarship recipients, first time awardees and returning awardees, 2010 - 2011 ........................................ 31
Table 1-39: Scholarship recipients, sex, province of origin, 2010 - 2011............................................................................ 32
Table 1-40: Scholarship recipients by funding country, 2010 – 2011 ................................................................................. 32
Table 1-41: Outcomes of scholarship funding, 2010 – 2011 .............................................................................................. 32
Table 1-42: Number of students enrolled in selected post-secondary institutions, 2011 ................................................. 33
Table 1-43: Number of instructors or trainers in selected post-secondary institutions, 2011 ........................................... 33
Figure 2-1: National Literacy and Numeracy Achievement, 2009 ...................................................................................... 36
Figure 2-2: Overall Literacy and Numeracy by Medium of Assessment, 2009 ................................................................... 36
Figure 2-3: Students who sat the year 8 exam as % of VEMIS enrolment data, 2007-2010 .............................................. 37
Figure 2-4: Students who sat the year 10 exam as % of VEMIS enrolment data, 2007-2010 ............................................ 38
Figure 2-5: % of Year 10 students who passed the National Exam, 2007-2010 ................................................................. 38
Figure 2-6: % of Year 12 Students who passed the 2010 PSSC and Year 12 francophone exams ...................................... 39
Table 2-7: Number of RTCs by Province, 2011 ................................................................................................................... 40
Table 2-8: Rural Training Centre Trainees Statistics, 2010 ................................................................................................. 40
Table 2-9: 2011 RTC Graduates .......................................................................................................................................... 41
Table 2-10: Number of RTC’s Trainers, 2011 ...................................................................................................................... 41
Table 2-11: Drop-out, repeater and promotion rates, 2009 – 2011 ................................................................................... 41
Table 2-12: Survival rate to Year 6, 10 and 13, 2009 – 2011 .............................................................................................. 42
Figure 2-13: Coefficient of efficiency, 2008 - 2011 ............................................................................................................. 42
Table 2-14: Number of teachers, school level and authority, 2010 - 2011 ........................................................................ 43
Table 2-15: Number of teachers, school level and province, 2010 - 2011 ......................................................................... 44
Table 2-16: Number of teachers, school level and language, 2010 - 2011 ......................................................................... 44
Table 2-17: Students, teachers and student teacher ratio (STR), authority, school level, 2010 - 2011 ............................. 45
13 Annual Statistical Report 2010-11
Republic of Vanuatu
Table 2-18: Students, teachers and student:teacher ratio (STR), province, school level, 2010 - 2011 .............................. 45
Table 2-19: Number of teachers, number and percent certified, school level, 2007 – 2011 ............................................. 46
Table 2-20: Number of ECE teachers, authority, number and percent certified, school level, 2007 – 2011 ..................... 46
Table 2-21: Number of Primary* teachers, authority, number and percent certified, school level, 2007 – 2011 ............. 47
Table 2-22: Number of Secondary# teachers, authority, number and percent certified, school level, 2007 – 2011......... 47
Table 2-23: Percent of teachers who are certified and qualified, school level, 2010 – 2011 ............................................. 48
Table 2-24: Number of teachers attending in-service training, school level, 2007 – 2011 ................................................ 48
Table 2-25: Classrooms, enrolment and student:classroom ratio, school level, 2010-2011 .............................................. 48
Table 2-26: Number of types of water supplies in schools, school level, 2010 – 2011 ...................................................... 49
Table 2-27: Number of toilets for females and males in schools, school level, 2010 – 2011 ............................................. 50
Table 2-28: Primary school and type of tenure by province, 2010 ..................................................................................... 50
Table 2-29: Reading book:student ratio, 2010-2011 .......................................................................................................... 51
Table 2-30: Additional resources and equipment in primary schools, 2010-2011 ............................................................. 52
Figure 2-31: Primary school student:textbook ratio, 2010-2011 ....................................................................................... 53
Figure 2-32: Secondary school student:textbook ratio, 2010-2011 ................................................................................... 53
Table 2-33: Distribution (% of each item) of primary school library resources by province, 2010-2011 ........................... 54
Table 2-34: % of primary school library resources by authority, 2010-2011 ...................................................................... 54
Table 2-35: % of secondary school library resources by province, 2010-2011 ................................................................... 55
Table 2-36: % of secondary school library resources by authority, 2010-2011 .................................................................. 55
Figure 3-1: MoE source of funds - recurrent Government budget and grants, million Vatu, 2010 - 2011 ........................ 57
Figure 3-2: MoE budget as a proportion of Vanuatu budget (recurrent expenditure), 2000 – 2012 ................................. 57
Figure 3-3: MoE budget amount and total government budget, million Vatu (recurrent expenditure), 2000 – 2012 ...... 58
Figure 3-4: Total education expenditure (Government and Donor) as a percent of GDP, 2010 - 2012 ............................. 58
Figure 3-5: MoE recurrent expenditure: budget and actual (million Vatu) ........................................................................ 58
Figure 3-6: VERM expenditure grouped by main activity, 2010 ......................................................................................... 59
Figure 3-7: VERM expenditure grouped by main activity, 2011 ......................................................................................... 59
Table 3-8: Expenditure, enrolment and expenditure per student in government funded and assisted schools, 2011 ..... 60
Figure 0-1: Survey Return Rates for ECE Schools, 2007 – 2011 .......................................................................................... 63
Figure 0-2: Survey Return Rates for Primary Schools, 2007 – 2011 ................................................................................... 63
Figure 0-3: Survey Return Rates for Secondary Schools, 2007 – 2011 ............................................................................... 64
Figure 0-4: % of actual and estimated schools in VEMIS, 2010-2011 ................................................................................. 64
Figure 0-5: School type and % of estimated and actual enrolment in VEMIS, 2010-2011 ................................................. 65
Figure 0-6: School type and % of estimated and actual Number of Teachers, 2010-2011 ................................................ 67
14 Annual Statistical Report 2010-11
Introduction This report contains the major statistical indicators and information from the Vanuatu Education Management Information System (VEMIS). The purpose of this report is to provide official statistics on education in Vanuatu for policy planning, monitoring and evaluation. The information contained in this report is analysed in other reports by the Ministry. This report contains analysis based on the main messages from the statistical information.
This report is structured according to the three priority areas for the Ministry of Education as identified in the VESS and with specific strategies and policies in the Vanuatu Education Road Map(VERM):
1. Increase equitable access to education for all people at all levels of education in Vanuatu. 2. Improve the quality of education. 3. Improve and strengthen the management of the education system in Vanuatu.
This report contains statistical information for monitoring and evaluating progress towards achieving the three broad goals of the Ministry of Education
This report presents the statistics available in VEMIS of relevance to VERM, VESS and a number of other key policy areas such as the Education For All (EFA) global initiative as well as official statistics required for monitoring progress towards achieving the Millennium Development Goals. Each section of this report presents the statistical information in a summary from the VEMIS baseline year of 2007; a comparison between different provinces as well as details of the indicator itself. This report does not contain detailed analysis or explanations of trends as the purpose of this report is to present the statistical information only. Detailed analysis is available in other reports prepared by the MOE.
Annex 1 of this report contains a summary of the process used to collect the information in the Annual School Census and an assessment of the quality of the information collected in terms of the overall response rates and reliability of statistical information. Some of the information in VEMIS is not from the school survey, such as the school examination results and financial information. This data is included in VEMIS for to meet the needs for broader planning and policy making, monitoring and evaluation. Annex 1 also contains information about the estimates used for the school aged population used in this report.
1. Access • Universal primary education • ECE prior to primary • Expand places at secondary and TVET • Children with special needs
2. Quality • Expand and strengthen in-service training • Student:teacher ratios and school resources are
within regulation limits • Improved school facilities • Bi-lingual and dual language schools • Relevant curriculum
3. Management & Planning • Decentralisation of management and administration
to provinces • Effecitive monitoring and evaluation through VEMIS • Procurement and disrtibution systems cost efficient • Effective auditing of schools
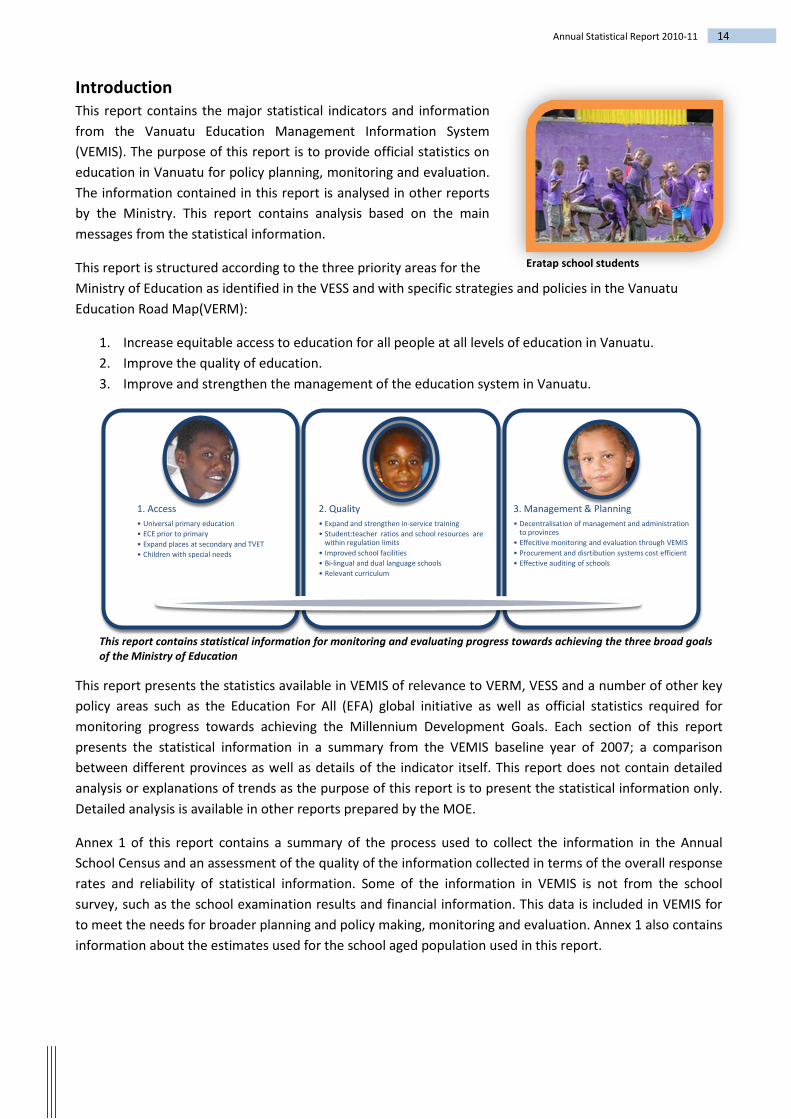
Eratap school students
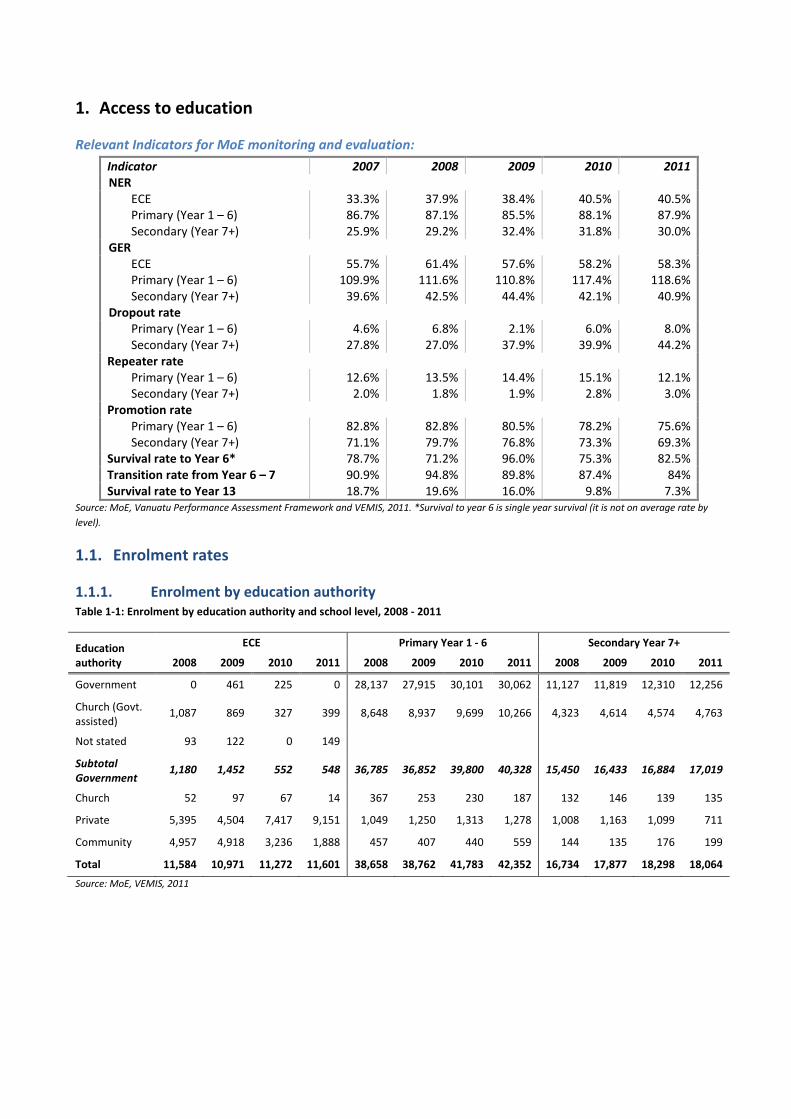
1. Access to education
Relevant Indicators for MoE monitoring and evaluation: Indicator 2007 2008 2009 2010 2011 NER
ECE Primary (Year 1 – 6) Secondary (Year 7+)
33.3% 86.7% 25.9%
37.9% 87.1% 29.2%
38.4% 85.5% 32.4%
40.5% 88.1% 31.8%
40.5% 87.9% 30.0%
GER ECE Primary (Year 1 – 6) Secondary (Year 7+)
55.7% 109.9%
39.6%
61.4% 111.6%
42.5%
57.6% 110.8%
44.4%
58.2% 117.4%
42.1%
58.3% 118.6%
40.9% Dropout rate
Primary (Year 1 – 6) Secondary (Year 7+)
4.6% 27.8%
6.8% 27.0%
2.1% 37.9%
6.0% 39.9%
8.0% 44.2%
Repeater rate Primary (Year 1 – 6) Secondary (Year 7+)
12.6% 2.0%
13.5% 1.8%
14.4% 1.9%
15.1% 2.8%
12.1% 3.0%
Promotion rate Primary (Year 1 – 6) Secondary (Year 7+)
82.8% 71.1%
82.8% 79.7%
80.5% 76.8%
78.2% 73.3%
75.6% 69.3%
Survival rate to Year 6* 78.7% 71.2% 96.0% 75.3% 82.5% Transition rate from Year 6 – 7 90.9% 94.8% 89.8% 87.4% 84% Survival rate to Year 13 18.7% 19.6% 16.0% 9.8% 7.3%
Source: MoE, Vanuatu Performance Assessment Framework and VEMIS, 2011. *Survival to year 6 is single year survival (it is not on average rate by level).
1.1. Enrolment rates
1.1.1. Enrolment by education authority Table 1-1: Enrolment by education authority and school level, 2008 - 2011
Education authority
ECE Primary Year 1 - 6 Secondary Year 7+
2008 2009 2010 2011 2008 2009 2010 2011 2008 2009 2010 2011
Government 0 461 225 0 28,137 27,915 30,101 30,062 11,127 11,819 12,310 12,256
Church (Govt. assisted)
1,087 869 327 399 8,648 8,937 9,699 10,266 4,323 4,614 4,574 4,763
Not stated 93 122 0 149
Subtotal Government
1,180 1,452 552 548 36,785 36,852 39,800 40,328 15,450 16,433 16,884 17,019
Church 52 97 67 14 367 253 230 187 132 146 139 135
Private 5,395 4,504 7,417 9,151 1,049 1,250 1,313 1,278 1,008 1,163 1,099 711
Community 4,957 4,918 3,236 1,888 457 407 440 559 144 135 176 199
Total 11,584 10,971 11,272 11,601 38,658 38,762 41,783 42,352 16,734 17,877 18,298 18,064 Source: MoE, VEMIS, 2011

16 Annual Statistical Report 2010-11
Table 1-2: Enrolment by education authority, sex and school level, 2010– 2011
ECE Primary 1-6 Secondary 7-13/14
Year Authority Type Male Female Total Male Female Total Male Female Total 2010 Government of Vanuatu 120 105 225 15,907 14,194 30,101 6,216 6,094 12,310
Church (Government Assisted) 170 157 327 5,075 4,624 9,699 2,221 2,353 4,574
Subtotal Government 290 262 552 20,982 18,818 39,800 8,437 8,447 16,884
Church (Not Government Assisted) 40 27 67 120 110 230 76 63 139
Community 1,683 1,553 3,236 216 224 440 99 77 176
Private 3,766 3,651 7,417 685 628 1313 572 527 1,099
Total 5,779 5,493 11,272 22,003 19,780 41,783 9,184 9,114 18,298 2011 Government of Vanuatu
15,863 14,199 30,062 6,128 6,128 12,256
Church (Government Assisted) 220 179 399 5,431 4,835 10,266 2,361 2,402 4,763
Not stated 81 68 149
Subtotal Government 301 247 548 21,294 19,034 40,328 8,489 8,530 17,019
Church (Not Government Assisted) 9 5 14 99 88 187 71 64 135
Community 954 934 1,888 305 254 559 115 84 199
Private 4,756 4,395 9,151 681 597 1,278 356 355 711
Total 6,020 5,581 11,601 22,379 19,973 42,352 9,031 9,033 18,064 Source: MoE, VEMIS, 2011
Table 1-3: ECE enrolment by education authority and province, 2010-2011
Province Year Authority Type Torba Sanma Penama Malampa Shefa Tafea Vanuatu 2010 Government of Vanuatu 0 7 0
218
225
Church (Government Assisted) 9 85 0 99 24 110 327
Subtotal Government 9 92 0 99 242 110 552
Church (Not Government Assisted)
14
44 9 67
Community 320 676 461 351 670 758 3,236
Private 180 2,379 621 1,174 2,137 926 7,417
Total 509 3,147 1,096 1,624 3,093 1,803 11,272 2011 Church (Government Assisted)
63 70 116 66 84 399
Subtotal Government 0 63 70 116 66 84 399
Church (Not Government Assisted)
14
14
Community 193 396 285 463 313 238 1,888
Private 371 2,430 1,096 1,335 2,133 1,786 9,151
Not stated
86 63 149
Total 564 2,889 1,465 1,914 2,598 2,171 11,601 Source: MoE, VEMIS, 2011

17 Annual Statistical Report 2010-11
Republic of Vanuatu
Table 1-4: Primary (Year 1 – 6) enrolment by education authority and province, 2010-2011
Province
Vanuatu Year Education authority Torba Sanma Penama Malampa Shefa Tafea
2010 Government 1,602 5,373 4,368 4,769 7,967 6,022 30,101 Church (Govt. assisted) 2,719 1,369 2,065 1,669 1,877 9,699 Subtotal Government 1,602 8,092 5,737 6,834 9,636 7,899 39,800 Church 102 66 62 230 Private 26 70 344 440 Community 26 189 157 760 181 1,313 Total 2010 1,628 8,409 5,737 7,061 10,806 8,142 41,783 2011 Government 1,594 5,658 4,329 4,829 7,887 5,765 30,062 Church (Govt. assisted) 7 2,858 1,461 2,014 2,025 1,901 10,266 Subtotal Government 1,601 8,516 5,790 6,843 9,912 7,666 40,328 Church 92 95 187 Private 40 77 442 559 Community 67 54 166 920 71 1,278 Total 2011 1,668 8,702 5,790 7,086 11,369 7,737 42,352 Source: MoE, VEMIS, 2011
Table 1-5: Secondary (Year 7+) enrolment by education authority and province, 2011
Province
Vanuatu Year Education authority Torba Sanma Penama Malampa Shefa Tafea
2010 Government 461 2,315 1,247 1,921 4,830 1,536 12,310 Church (Govt. assisted) 54 1,114 1,127 512 1,322 445 4,574 Subtotal Government 515 3,429 2,374 2,433 6,152 1,981 16,884 Church 139 139 Private 5 171 176 Community 81 18 905 95 1,099 Total 2010 515 3,654 2,374 2,451 7,228 2,076 18,298 2011 Government 473 2,339 1,006 1,871 4,871 1,696 12,256 Church (Govt. assisted) 77 1,111 1,184 559 1,278 554 4,763 Subtotal Government 550 3,450 2,190 2,430 6,149 2,250 17,019 Church 135 135 Private 16 8 175 199 Community 57 22 632 711 Total 2011 550 3,658 2,190 2,460 6,956 2,250 18,064 Source: MoE, VEMIS, 2011

18 Annual Statistical Report 2010-11
Table 1-6: Enrolment by education authority and level, 2010-2011
Level
Year Education authority ECE Primary (1-6) Jnr Secondary (7-10) Snr Secondary (11+) Vanuatu
2010 Government 225 30,101 9,628 2,682 42,636
Church (Govt. assisted) 327 9,699 3,188 1,386 14,600
Subtotal Government 552 39,800 12,816 4,068 57,236
Church 67 230 137 2 436
Private 3,236 440 136 40 3,852
Community 7,417 1,313 748 351 9,829
Total 2010 11,272 41,783 13,837 4,461 71,353 2011 Government 30,062 9,695 2,561 42,318 Church (Govt. assisted) 399 10,266 3,330 1,433 15,428 Subtotal Government 399 40,328 13,025 3,994 57,746 Church 14 187 135 336 Private 1,888 559 169 30 2,646 Community 9,151 1,278 449 262 11,140 Other 149 149 Total 2011 11,601 42,352 13,778 4,286 72,017 Source: MoE, VEMIS, 2011
1.1.2. Enrolment by school level Table 1-7: Enrolment by school type and year level, 2009 - 2011
2009 2010 2011
Level ECE Primary
1 - 6 Secondary
7+ ECE Primary
1 - 6 Secondary
7+ ECE Primary
1 - 6 Secondary
7+
ECE 10,971 11,272 11,601
Year 1 7,851 9,188 8,957
Year 2 7,236 7,462 7,911
Year 3 6,722 7,228 7,207
Year 4 6,166 6,523 6,738
Year 5 5,590 5,987 6,037
Year 6 5,197 5,395 5,502
Year 7 3,859 4,214 4,224
Year 8 3,560 3,584 3,645
Year 9 3,261 3,362 3,177
Year 10 2,756 2,677 2,732
Year 11 2,127 1,977 1,865
Year 12 1,481 1,590 1,589
Year 13 688 697 677
Year 14 145 197 155
Total 10,971 38,762 17,877 11,272 41,783 18,298 11,601 42,352 18,064 Source: MoE, VEMIS, 2011

19 Annual Statistical Report 2010-11
Republic of Vanuatu
1.1.3. Enrolment by province Table 1-8: Enrolment by province, school type and sex, 2010-2011
ECE Primary 1-6 Secondary 7 +
Year Province Male Female Male Female Male Female
2010 Torba 263 246 870 758 275 240
Sanma 1,503 1,644 4,469 3,940 1,825 1,829
Penama 535 561 3,029 2,708 1,193 1,181
Malampa 805 819 3,793 3,268 1,195 1,256
Shefa 1,524 1,569 5,549 5,257 3,632 3,596
Tafea 863 940 4,293 3,849 994 1,082
Vanuatu 2010 5,493 5,779 22,003 19,780 9,114 9,184
2011 Torba 276 288 869 799 265 285
Sanma 1,408 1,481 4636 4066 1,870 1,788
Penama 700 765 3057 2733 1,071 1,119
Malampa 894 1,020 3767 3319 1,255 1,205
Shefa 1,254 1,344 5913 5456 3,447 3,509
Tafea 1,049 1,122 4137 3600 1,123 1,127
Vanuatu 2011 5,581 6,020 22379 19973 9,031 9,033
Source: MoE, VEMIS, 2011
Table 1-9: Enrolment by province and school type, 2010– 2011
ECE Primary (1-6) Jnr Secondary (7-10) Snr Secondary (11+)
Province 2009 2010 2011 2009 2010 2011 2009 2010 2011 2009 2010 2011
Torba 561 509 564 1,564 1,628 1,668 458 487 493 29 28 57
Sanma 3,052 3,147 2,889 7,538 8,409 8,702 2,950 2,854 2,891 745 800 767
Penama 1,023 1,096 1,465 5,236 5,737 5,790 1,866 1,783 1,704 661 591 486
Malampa 1,595 1,624 1,914 6,789 7,061 7,086 2,208 2,157 2,174 384 294 286
Shefa 2,742 3,093 2,598 10,109 10,806 11,369 4,197 4,744 4,578 2,416 2,484 2,378
Tafea 1,998 1,803 2,171 7,526 8,142 7,737 1,757 1,812 1,938 206 264 312
Vanuatu 10,971 11,272 11,601 38,762 41,783 42,352 13,436 13,837 13,778 4,441 4,461 4,286
Source: MoE, VEMIS, 2011
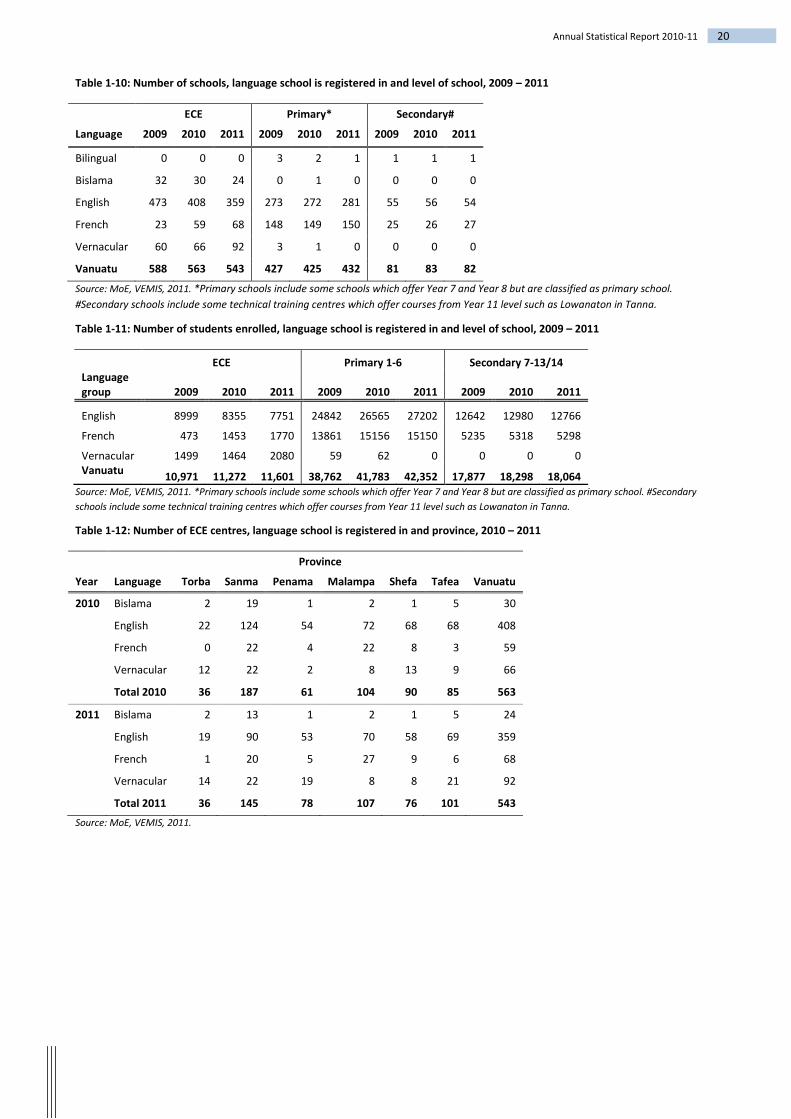
1.1.4. Mono-lingual, bi-lingual and dual lingual The VEMIS data about language of instruction is based on the languages used in the registration of the school. Information is also collected on the students studying English and French language.
20 Annual Statistical Report 2010-11
Table 1-10: Number of schools, language school is registered in and level of school, 2009 – 2011
ECE Primary* Secondary#
Language 2009 2010 2011 2009 2010 2011 2009 2010 2011
Bilingual 0 0 0 3 2 1 1 1 1
Bislama 32 30 24 0 1 0 0 0 0
English 473 408 359 273 272 281 55 56 54
French 23 59 68 148 149 150 25 26 27
Vernacular 60 66 92 3 1 0 0 0 0
Vanuatu 588 563 543 427 425 432 81 83 82
Source: MoE, VEMIS, 2011. *Primary schools include some schools which offer Year 7 and Year 8 but are classified as primary school. #Secondary schools include some technical training centres which offer courses from Year 11 level such as Lowanaton in Tanna.
Table 1-11: Number of students enrolled, language school is registered in and level of school, 2009 – 2011
ECE Primary 1-6 Secondary 7-13/14 Language group 2009 2010 2011 2009 2010 2011 2009 2010 2011
English 8999 8355 7751 24842 26565 27202 12642 12980 12766
French 473 1453 1770 13861 15156 15150 5235 5318 5298
Vernacular 1499 1464 2080 59 62 0 0 0 0 Vanuatu 10,971 11,272 11,601 38,762 41,783 42,352 17,877 18,298 18,064
Source: MoE, VEMIS, 2011. *Primary schools include some schools which offer Year 7 and Year 8 but are classified as primary school. #Secondary schools include some technical training centres which offer courses from Year 11 level such as Lowanaton in Tanna.
Table 1-12: Number of ECE centres, language school is registered in and province, 2010 – 2011
Province
Vanuatu Year Language Torba Sanma Penama Malampa Shefa Tafea
2010 Bislama 2 19 1 2 1 5 30
English 22 124 54 72 68 68 408
French 0 22 4 22 8 3 59
Vernacular 12 22 2 8 13 9 66
Total 2010 36 187 61 104 90 85 563
2011 Bislama 2 13 1 2 1 5 24
English 19 90 53 70 58 69 359
French 1 20 5 27 9 6 68
Vernacular 14 22 19 8 8 21 92
Total 2011 36 145 78 107 76 101 543
Source: MoE, VEMIS, 2011.

21 Annual Statistical Report 2010-11
Republic of Vanuatu
Table 1-13: ECE centre enrolment, language school is registered in and province, 2010 – 2011
Province
Vanuatu Year Language Torba Sanma Penama Malampa Shefa Tafea
2010 Bislama 29 240 17 34 26 97 443
English 318 2,093 960 1,081 2,430 1,473 8,355
French 0 543 99 397 341 73 1,453
Vernacular 162 271 20 112 296 160 1,021
Total 2010 509 3,147 1,096 1,624 3,093 1,803 11,272
2011 Bislama 39 161 17 28 35 95 375
English 276 1,822 976 1,203 1,983 1,491 7,751
French 25 515 146 536 433 115 1,770
Vernacular 224 391 326 147 147 470 1,705
Total 2011 564 2,889 1,465 1,914 2,598 2,171 11,601
Source: MoE, VEMIS, 2011.
Table 1-14: Number of primary schools*, language school is registered in and province, 2010 – 2011
Province
Vanuatu Year Language Torba Sanma Penama Malampa Shefa Tafea
2010 Bilingual 2 0 0 0 0 0 2
Bislama 0 0 0 0 0 1 1
English 14 62 41 54 61 40 272
French 7 28 23 34 20 37 149
Vernacular 0 0 0 0 0 1 1
Total 2010 23 90 64 88 81 79 425
2011 Bislama 1 0 0 0 0 0 1
English 16 66 41 55 63 40 281
French 8 32 22 34 19 35 150
Total 2011 25 98 63 89 82 75 432
Source: MoE, VEMIS, 2011. *Primary schools include some schools which offer Year 7 and Year 8 but are classified as primary school.
Table 1-15: Primary school* enrolment, language school is registered in and province, 2010 – 2011
Year Language Group Torba Sanma Penama Malampa Shefa Tafea Total
2010
English 1215 5391 3847 4154 7641 4317 26565
French 413 3018 1890 2907 3165 3763 15156
Vernacular
62 62
2011 Total 1628 8409 5737 7061 10806 8142 41783
2011
English 1244 5503 3849 4272 8186 4148 27202
French 424 3199 1941 2814 3183 3589 15150
2012 Total 1668 8702 5790 7086 11369 7737 42352 Source: MoE, VEMIS, 2011. *Primary schools include some schools which offer Year 7 and Year 8 but are classified as primary school.

22 Annual Statistical Report 2010-11
Table 1-16: Number of secondary schools#, language school is registered in and province, 2010 – 2011
Province
Vanuatu Year Language Torba Sanma Penama Malampa Shefa Tafea
2010 Bilingual 0 1 0 0 0 0 1
English 2 11 8 8 18 9 56
French 1 4 2 8 6 5 26
Total 2010 3 16 10 16 24 14 83
2011 Bilingual 0 1 0 0 0 0 1
English 2 10 9 7 18 8 54
French 1 4 3 8 6 5 27
Total 2011 3 15 12 15 24 13 82
Source: MoE, VEMIS, 2011. #Secondary schools include some technical training centres which offer courses from Year 11 level such as Lowanaton in Tanna.
Table 1-17: Secondary school# enrolment, language school is registered in and province, 2010 – 2011
Survey Year Language Group Torba Sanma Penama Malampa Shefa Tafea Vanuatu
2010
English 405 2362 2017 1538 5257 1401 12980
French 110 1292 357 913 1971 675 5318
2010 Total 515 3654 2374 2451 7228 2076 18298
2011
English 436 2432 1841 1507 5083 1467 12766
French 114 1226 349 953 1873 783 5298
2011 Total 550 3658 2190 2460 6956 2250 18064 Source: MoE, VEMIS, 2011. #Secondary schools include some technical training centres which offer courses from Year 11 level such as Lowanaton in Tanna.
1.1.5. Gross Enrolment Rate Gross Enrolment Rate (GER): Total enrolment in ECE, Primary or Secondary education expressed as a
percentage of the total population of children who are of the official age group for that level of education.
Gender Parity Index (GPI): The female value for any indicator divided by the male value to show the gender parity of the indicator with a value of 1 or very close to it indicating gender parity; a value over 1 indicating a difference in favour of females and a value less than 1 a difference in favour of males.
ECE official age group: The official age group used by the MoE for ECE is children aged between 4 and 5 years (inclusive).
Primary 1 – 6 official age group: The official age group used by the MoE for primary Year 1 – 6 is children aged between six and eleven years (inclusive).
Secondary 7+ official age group: The official age group used by the MoE for secondary Year 7 – 14 is children aged between 12 and 19 years (inclusive).

23 Annual Statistical Report 2010-11
Republic of Vanuatu
Table 1-18: Gross Enrolment Ratio (GER), school type, 2007 – 2011
ECE Primary, 1-6 Secondary, 7+
Year Male Female Total GPI Male Female Total GPI Male Female Total GPI
2007 56.4% 55.1% 55.7% 0.95 109.8% 110.1% 109.9% 1.00 39.0% 40.2% 39.6% 1.03
2008 62.9% 59.9% 61.4% 0.96 110.9% 112.5% 111.6% 1.01 42.1% 42.9% 42.5% 1.02
2009 58.7% 56.5% 57.6% 0.96 110.7% 110.8% 110.8% 1.00 43.1% 45.8% 44.4% 1.06
2010 58.0% 58.4% 58.2% 1.01 118.2% 116.5% 117.4% 0.99 40.7% 43.7% 42.1% 1.07
2011 58.7% 57.8% 58.3% 0.98 120.4% 116.7% 118.6% 0.97 39.1% 42.8% 40.9% 1.10 Source: MoE, VEMIS, 2011.
Table 1-19: Enrolment, level and sex, 2008-2011
2008 2009 2010 2011 Level Male Female Total Male Female Total Male Female Total Male Female Total Total
ECE 6,088 5,496 11,584 5,734 5,237 10,971 5,779 5,493 11,272 6,020 5,581 11,601 45,428
Year 1 4,318 3,926 8,244 4,110 3,741 7,851 4,764 4,424 9,188 4,740 4,217 8,957 34,240
Year 2 3,751 3,363 7,114 3,840 3,396 7,236 3,947 3,515 7,462 4,133 3,778 7,911 29,723
Year 3 3,564 3,144 6,708 3,575 3,147 6,722 3,833 3,395 7,228 3,926 3,281 7,207 27,865
Year 4 3,268 2,936 6,204 3,308 2,858 6,166 3,455 3,068 6,523 3,457 3,281 6,738 25,631
Year 5 2,909 2,727 5,636 2,907 2,683 5,590 3,199 2,788 5,987 3,182 2,855 6,037 23,250
Year 6 2,414 2,338 4,752 2,712 2,485 5,197 2,805 2,590 5,395 2,941 2,561 5,502 20,846
Year 7 2,149 2,060 4,209 1,890 1,969 3,859 2,205 2,009 4,214 2,131 2,093 4,224 16,506
Year 8 1,665 1,745 3,410 1,786 1,774 3,560 1,759 1,825 3,584 1,858 1,787 3,645 14,199
Year 9 1,633 1,562 3,195 1,556 1,705 3,261 1,701 1,661 3,362 1,537 1,640 3,177 12,995
Year 10 1,029 1,061 2,090 1,388 1,368 2,756 1,297 1,380 2,677 1,363 1,369 2,732 10,255
Year 11 890 866 1,756 1,096 1,031 2,127 1,014 963 1,977 927 938 1,865 7,725
Year 12 755 590 1,345 745 736 1,481 804 786 1,590 844 745 1,589 6,005
Year 13 304 318 622 323 365 688 309 388 697 298 379 677 2,684
Year 14 44 63 107 67 78 145 95 102 197 73 82 155 604
Total 34,781 32,195 66,976 35,037 32,573 67,610 36,966 34,387 71,353 37,430 34,587 72,017 277,956
Source: MoE, VEMIS, 2011.
24 Annual Statistical Report 2010-11
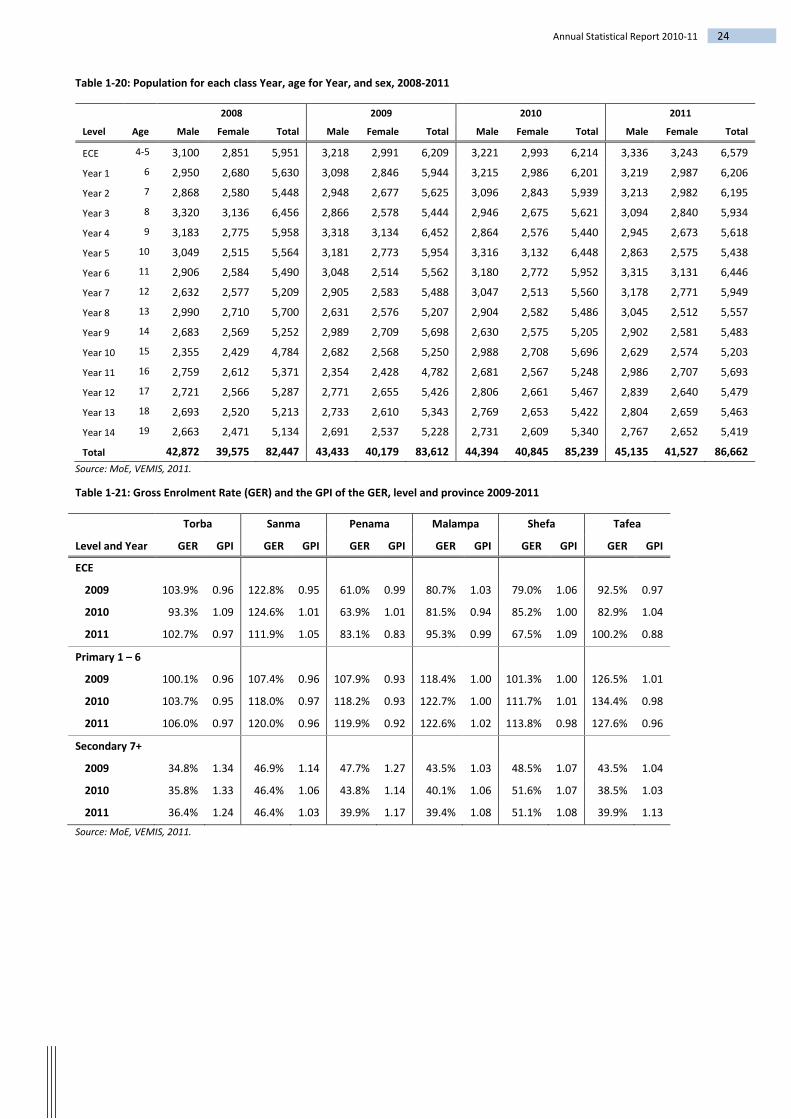
Table 1-20: Population for each class Year, age for Year, and sex, 2008-2011
2008 2009 2010 2011
Level Age Male Female Total Male Female Total Male Female Total Male Female Total
ECE 4-5 3,100 2,851 5,951 3,218 2,991 6,209 3,221 2,993 6,214 3,336 3,243 6,579
Year 1 6 2,950 2,680 5,630 3,098 2,846 5,944 3,215 2,986 6,201 3,219 2,987 6,206
Year 2 7 2,868 2,580 5,448 2,948 2,677 5,625 3,096 2,843 5,939 3,213 2,982 6,195
Year 3 8 3,320 3,136 6,456 2,866 2,578 5,444 2,946 2,675 5,621 3,094 2,840 5,934
Year 4 9 3,183 2,775 5,958 3,318 3,134 6,452 2,864 2,576 5,440 2,945 2,673 5,618
Year 5 10 3,049 2,515 5,564 3,181 2,773 5,954 3,316 3,132 6,448 2,863 2,575 5,438
Year 6 11 2,906 2,584 5,490 3,048 2,514 5,562 3,180 2,772 5,952 3,315 3,131 6,446
Year 7 12 2,632 2,577 5,209 2,905 2,583 5,488 3,047 2,513 5,560 3,178 2,771 5,949
Year 8 13 2,990 2,710 5,700 2,631 2,576 5,207 2,904 2,582 5,486 3,045 2,512 5,557
Year 9 14 2,683 2,569 5,252 2,989 2,709 5,698 2,630 2,575 5,205 2,902 2,581 5,483
Year 10 15 2,355 2,429 4,784 2,682 2,568 5,250 2,988 2,708 5,696 2,629 2,574 5,203
Year 11 16 2,759 2,612 5,371 2,354 2,428 4,782 2,681 2,567 5,248 2,986 2,707 5,693
Year 12 17 2,721 2,566 5,287 2,771 2,655 5,426 2,806 2,661 5,467 2,839 2,640 5,479
Year 13 18 2,693 2,520 5,213 2,733 2,610 5,343 2,769 2,653 5,422 2,804 2,659 5,463
Year 14 19 2,663 2,471 5,134 2,691 2,537 5,228 2,731 2,609 5,340 2,767 2,652 5,419
Total 42,872 39,575 82,447 43,433 40,179 83,612 44,394 40,845 85,239 45,135 41,527 86,662 Source: MoE, VEMIS, 2011.
Table 1-21: Gross Enrolment Rate (GER) and the GPI of the GER, level and province 2009-2011
Torba Sanma Penama Malampa Shefa Tafea
Level and Year GER GPI GER GPI GER GPI GER GPI GER GPI GER GPI
ECE
2009 103.9% 0.96 122.8% 0.95 61.0% 0.99 80.7% 1.03 79.0% 1.06 92.5% 0.97
2010 93.3% 1.09 124.6% 1.01 63.9% 1.01 81.5% 0.94 85.2% 1.00 82.9% 1.04
2011 102.7% 0.97 111.9% 1.05 83.1% 0.83 95.3% 0.99 67.5% 1.09 100.2% 0.88
Primary 1 – 6
2009 100.1% 0.96 107.4% 0.96 107.9% 0.93 118.4% 1.00 101.3% 1.00 126.5% 1.01
2010 103.7% 0.95 118.0% 0.97 118.2% 0.93 122.7% 1.00 111.7% 1.01 134.4% 0.98
2011 106.0% 0.97 120.0% 0.96 119.9% 0.92 122.6% 1.02 113.8% 0.98 127.6% 0.96
Secondary 7+
2009 34.8% 1.34 46.9% 1.14 47.7% 1.27 43.5% 1.03 48.5% 1.07 43.5% 1.04
2010 35.8% 1.33 46.4% 1.06 43.8% 1.14 40.1% 1.06 51.6% 1.07 38.5% 1.03
2011 36.4% 1.24 46.4% 1.03 39.9% 1.17 39.4% 1.08 51.1% 1.08 39.9% 1.13
Source: MoE, VEMIS, 2011.

25 Annual Statistical Report 2010-11
Republic of Vanuatu
1.1.6. Net Enrolment Rate Net Enrolment Rate (NER): Total enrolment of pupils of the official age group for ECE, Primary or Secondary education expressed as a percentage of the total population of children who are of the official age group for that level of education.
Table 1-22: Net Enrolment Ratio (NER), school type, 2007 – 2011
ECE Primary, 1-6 Secondary, 7-13/14
Year Male Female Total GPI Male Female Total GPI Male Female Total GPI
2007 33.0% 33.5% 33.3% 1.02 85.9% 87.6% 86.7% 1.02 25.8% 25.9% 25.9% 1.00
2008 38.2% 37.6% 37.9% 0.98 85.6% 88.7% 87.1% 1.04 29.2% 29.2% 29.2% 1.00
2009 38.3% 38.5% 38.4% 1.01 84.6% 86.6% 85.5% 1.02 31.3% 33.6% 32.4% 1.07
2010 39.5% 41.6% 40.5% 1.05 87.5% 88.7% 88.1% 1.01 30.0% 33.7% 31.8% 1.12
2011 40.3% 40.8% 40.5% 1.01 87.0% 88.7% 87.9% 1.02 28.0% 32.2% 30.0% 1.15
Source: MoE, VEMIS, 2011.
Table 1-23: Official age enrolment, level and sex, 2010-2011
2010 2011
Level Official age Male Female Total Male Female Total
ECE 4 – 5 3,257 3,237 6,494 3,380 3,197 6,577
Year 1 6 1,326 1,347 2,673 1,261 1,230 2,491
Year 2 7 792 850 1,642 744 816 1,560
Year 3 8 666 691 1,357 581 636 1,217
Year 4 9 510 525 1,035 477 565 1,042
Year 5 10 462 519 981 445 461 906
Year 6 11 415 470 885 396 440 836
Year 7 12 365 421 786 459 483 942
Year 8 13 325 380 705 380 427 807
Year 9 14 360 416 776 288 376 664
Year 10 15 312 382 694 289 393 682
Year 11 16 218 313 531 213 283 496
Year 12 17 197 244 441 206 254 460
Year 13 18 101 122 223 111 129 240
Year 14 19 19 34 53 16 18 34
Total 36,966 34,387 71,353 37,430 34,587 72,017 Source: MoE, VEMIS, 2011.
The table 1-19 and 1-23 enable you to calculate the percentage of students by age specific for each year level. These tables also indicate the high number of under- and over-age students enrolled in all levels of education.

26 Annual Statistical Report 2010-11
Table 1-24: Net Enrolment Rate (NER) and the GPI of the NER, level and province, 2009-2011
Torba Sanma Penama Malampa Shefa Tafea
Level and Year NER GPI NER GPI NER GPI NER GPI NER GPI NER GPI
ECE
2009 54.6% 0.95 62.2% 0.94 35.0% 1.06 45.6% 1.09 45.5% 1.08 47.6% 0.99
2010 48.3% 1.06 67.6% 1.06 36.9% 1.02 48.0% 1.09 55.4% 1.11 42.3% 1.10
2011 52.8% 0.98 56.9% 1.06 49.0% 0.96 55.1% 0.92 44.5% 1.10 52.2% 1.04
Primary 1 – 6
2009 75.1% 1.01 81.5% 0.99 83.4% 0.95 90.1% 1.04 83.8% 1.01 91.6% 1.00
2010 72.8% 0.99 86.3% 1.00 86.5% 0.96 90.5% 1.03 90.6% 1.02 97.3% 1.01
2011 73.7% 1.06 87.4% 1.02 87.5% 0.98 89.0% 1.06 90.5% 1.02 90.0% 1.00
Secondary 7+
2009 34.2% 1.32 45.6% 1.14 46.7% 1.28 42.2% 1.04 43.9% 1.10 42.9% 1.04
2010 35.6% 1.32 45.4% 1.06 42.8% 1.17 39.8% 1.07 47.0% 1.10 37.9% 1.04
2011 36.1% 1.24 45.1% 1.04 39.4% 1.18 38.4% 1.09 46.6% 1.10 39.1% 1.14
Source: MoE, VEMIS, 2011.
1.1.7. Drop-outs Table 1-25: Number of drop-outs, sex and level, 2008-2011
2008 2009 2010 2011
Level Male Female Total Male Female Total Male Female Total Male Female Total
Year 1 82 75 157 116 95 211 49 36 85 49 48 97
Year 2 63 54 117 82 79 161 42 30 72 56 48 104
Year 3 68 54 122 74 66 140 44 32 76 52 42 94
Year 4 60 44 104 81 59 140 36 36 72 55 37 92
Year 5 72 59 131 69 42 111 42 34 76 69 45 114
Year 6 74 59 133 79 50 129 54 33 87 85 51 136
Year 7 83 68 151 76 75 151 59 43 102 72 69 141
Year 8 55 61 116 58 50 108 46 38 84 50 52 102
Year 9 47 46 93 30 42 72 38 62 100 55 70 125
Year 10 41 34 75 30 26 56 55 47 102 64 40 104
Year 11 39 31 70 36 20 56 35 32 67 34 31 65
Year 12 30 24 54 15 21 36 22 14 36 47 24 71
Year 13 5 12 17 6 5 11 14 15 29 10 11 21
Year 14 4 4 4 4 2 8 10 6 6
Total 719 625 1,344 752 634 1,386 538 460 998 698 574 1,272 Source: MoE, VEMIS, 2011.

27 Annual Statistical Report 2010-11
Republic of Vanuatu
Table 1-26: Table 1 25: Number of drop-outs, sex and education authority, 2010-2011
2010 2011
Authority Male Female Total Male Female Total
Government of Vanuatu 323 295 618 486 397 883
Church (Government Assisted) 162 130 292 148 131 279
Subtotal Government 485 425 910 634 528 1,162
Church 2 4 6 1 1 2
Private 14 13 27 56 40 96
Community 37 18 55 7 5 12
Total 538 460 998 698 574 1,272 Source: MoE, VEMIS, 2011.
1.2. Schools
1.2.1. Education authority Table 1-27: Total number of schools, education authority, 2007 - 2011
Authority 2007 2008 2009 2010 2011
Government of Vanuatu 424 387 351 344 339
Church (Government Assisted) 182 187 178 152 163
Subtotal Government 606 574 529 496 502
Church 15 15 13 10 6
Private 243 296 258 372 428
Community 383 299 292 193 116
Not stated 1 5 5 0 5
Total 1,248 1,189 1,097 1,069 1,057 Source: MoE, VEMIS, 2011.
Table 1-28: Total number of ECE centres, education authority, 2007 - 2011
Authority 2007 2008 2009 2010 2011
Government of Vanuatu 26 0 15 0 0 Church (Government Assisted) 55 56 47 19 21 Subtotal Government 81 56 62 19 21 Church (Not Government Assisted) 3 3 4 3 1 Community 375 290 300 190 115 Private 219 273 235 351 406 Not stated 1 5 5 0 0 Total 679 627 606 563 543
Source: MoE, VEMIS, 2011.

28 Annual Statistical Report 2010-11
Table 1-29: Total number of schools, education authority, province, 2010 - 2011
Province
Year Authority Torba Sanma Penama Malampa Shefa Tafea Total
2010 Government of Vanuatu 24 60 67 55 75 63 344
Church (Government Assisted) 2 43 38 19 21 29 152
Subtotal Government 26 103 105 74 96 92 496
Church
4
1 2 3 10
Private 23 52 26 27 28 37 193
Community 13 134 76 33 69 45 372
Total 62 293 207 135 195 177 1,069
2011 Government of Vanuatu 24 63 66 53 72 61 339
Church (Government Assisted) 2 46 39 24 22 30 163
Subtotal Government 26 109 105 77 94 91 502
Church
4
1 1
6
Private 12 29 27 17 17 14 116
Community 26 116 79 58 68 81 428
Not stated
2 3 5
Total 64 258 211 153 182 189 1,057 Source: MoE, VEMIS, 2011.
Table 1-30: Total number of ECE centres, education authority, province, 2010 - 2011
Number of ECE Schools Province Year Authority Torba Sanma Penama Malampa Shefa Tafea Total
2010 Church (Government Assisted) 1 7
7 1 3 19
Subtotal Government 1 7 0 7 1 3 19
Church (Not Government Assisted)
1
1 1 3
Community 23 52 27 23 28 37 190
Private 12 128 33 74 61 43 351
Total 36 187 61 104 91 84 563 2011 Church (Government Assisted)
5 2 7 2 5 21
Subtotal Government 0 5 2 7 2 5 21
Church (Not Government Assisted)
1
1
Community 12 28 17 25 16 17 115
Private 24 112 59 76 58 77 406
Total 36 145 79 108 76 99 543 Source: MoE, VEMIS, 2011.

29 Annual Statistical Report 2010-11
Republic of Vanuatu
Table 1-31: Total number of Primary schools*, education authority, 2007 - 2011
Authority 2007 2008 2009 2010 2011
Government of Vanuatu 356 344 301 294 294
Church (Government Assisted) 102 103 116 104 117
Subtotal Government 458 447 417 398 411
Church 9 9 8 5 3
Private 16 16 21 14 15
Community 7 8 8 6 3
Total 490 480 454 423 432 Source: MoE, VEMIS, 2011. *Primary schools include some schools which offer Year 7 and Year 8 but are classified as primary school.
Table 1-32: Total number of Primary schools*, education authority, province, 2010 - 2011
Province
Year Authority Torba Sanma Penama Malampa Shefa Tafea Total
2010 Government of Vanuatu 22 52 50 56 59 55 294
Church (Government Assisted)
31 14 26 13 20 104
Subtotal Government 22 83 64 82 72 75 398
Church
2
1 2 5
Private
1
3 2
6
Community 1 4
2 5 2 14
Total 23 90 64 87 80 79 423 2011 Government of Vanuatu 22 56 49 56 59 52 294
Church (Government Assisted) 1 36 14 31 14 21 117
Subtotal Government 23 92 63 87 73 73 411
Church
2
1
3
Private
1
2
3
Community 2 3
2 6 2 15
Total 25 98 63 89 82 75 432 Source: MoE, VEMIS, 2011. *Primary schools include some schools which offer Year 7 and Year 8 but are classified as primary school.
Table 1-33: Total number of Secondary schools#, education authority, 2007 - 2011
Authority 2007 2008 2009 2010 2011
Government of Vanuatu 42 43 42 45 45
Church (Government Assisted) 27 28 27 28 29
Subtotal Government 69 71 69 73 74
Church 2 3 2 2 2
Private 7 7 7 7 5
Community 1 1 1 1 1
Total 79 82 79 83 82 Source: MoE, VEMIS, 2011. #Secondary schools include some technical training centres which offer courses from Year 11 level such as Lowanaton in Tanna.

30 Annual Statistical Report 2010-11
Table 1-34: Total number of Secondary schools#, education authority, province, 2010 - 2011
Province
Year Authority Torba Sanma Penama Malampa Shefa Tafea Total
2010 Government of Vanuatu 2 7 5 11 12 8 45
Church (Government Assisted) 1 5 5 5 7 5 28
Subtotal Government 3 12 10 16 19 13 73
Church
2
2
Private
1
1
Community
2
4 1 7
Total 3 16 10 16 24 14 83
2011 Government of Vanuatu 2 7 4 10 13 9 45
Church (Government Assisted) 1 5 8 5 6 4 29
Subtotal Government 3 12 12 15 19 13 74
Church
2
2
Private
1
1
Community
1
4
5
Total 3 15 12 15 24 13 82 Source: MoE, VEMIS, 2011. #Secondary schools include some technical training centres which offer courses from Year 11 level such as Lowanaton in Tanna.
1.2.2. Province Table 1-35: Total number of schools, province, 2007 - 2011
Province 2007 2008 2009 2010 2011
Torba 67 76 81 62 64
Sanma 316 420 308 293 258
Penama 152 176 134 135 154
Malampa 308 316 213 207 212
Shefa 252 285 194 195 182
Tafea 237 285 187 177 187
Total 1,248 1,189 1,097 1,069 1,057
Source: MoE, VEMIS, 2011.

31 Annual Statistical Report 2010-11
Republic of Vanuatu
Table 1-36: Total number of schools, school level, province, 2009 - 2011
Province
Year Authority Torba Sanma Penama Malampa Shefa Tafea Total
2009 ECE 36 199 64 108 101 98 606
Primary* 23 103 64 89 81 94 454
Secondary# 2 16 10 16 24 11 79
Total 61 308 134 213 194 187 1,097 2010 ECE 36 187 61 104 91 84 563
Primary* 23 90 64 87 80 79 423
Secondary# 3 16 10 16 24 14 83
Total 62 293 135 207 195 177 1,069 2011 ECE 36 145 79 108 76 99 543
Primary* 25 98 63 89 82 75 432
Secondary# 3 15 12 15 24 13 82
Total 64 258 154 212 182 187 1,057 Source: MoE, VEMIS, 2011. *Primary schools include some schools which offer Year 7 and Year 8 but are classified as primary school. #Secondary schools include some technical training centres which offer courses from Year 11 level such as Lowanaton in Tanna.
1.3. Scholarships for tertiary study Table 1-37: Scholarship recipients, sex, 2004 - 2011
Year Male Female Total
2004 169 99 268
2005 159 111 270
2006 169 107 276
2007 188 99 287
2008 195 125 320
2009 178 139 317
2010 238 185 423
2011 323 270 593 Source: Training and Scholarships Unit, Ministry of Education, Annual Development Report, 2009.
Table 1-38: Scholarship recipients, first time awardees and returning awardees, 2010 - 2011
Year New Awardees Returning Awardees Total
2010 187 236 423
2011 308 285 593 Source: Training and Scholarships Unit, Ministry of Education.

32 Annual Statistical Report 2010-11
Table 1-39: Scholarship recipients, sex, province of origin, 2010 - 2011
Province
2010 2011
Male Female Total Male Female Total
Torba 2 4 6 1 2 3
Sanma 17 17 34 21 22 43
Penama 91 52 143 111 82 193
Malampa 67 56 123 99 102 201
Shefa 26 35 61 49 41 90
Tafea 35 21 56 42 21 63
Total 238 185 423 323 270 593 Source: Training and Scholarships Unit, Ministry of Education.
Table 1-40: Scholarship recipients by funding country, 2010 – 2011
Country 2006 2007 2008 2009 2010 2011
Vanuatu 103 105 120 107 172 326
Australia 92 94 104 113 118 132
New Zealand 35 32 31 30 99 102
China 0 0 0 0 17 15
France 30 25 23 18 17 18
Other 0 0 0 0 0 0
Total 260 256 278 268 423 593 Source: Training and Scholarships Unit, Ministry of Education.
Table 1-41: Outcomes of scholarship funding, 2010 – 2011
Scholarship outcome 2010 2011
Continuing studies 309 436
Expected graduates 92 119
Deferral 7 22
Suspension 6 12
Termination 9 4
Total 423 593 Source: Training and Scholarships Unit, Ministry of Education.

33 Annual Statistical Report 2010-11
Republic of Vanuatu
1.4. Post-secondary education The Ministry of Education requests enrolment data from formal registered post-secondary institutions in Vanuatu, however not all of these are able to provide statistics for this report (for example there are no statistics from the USP Extension Centre). This section includes statistics from institutions and providers which provided statistics for this report and the data presented here is provisional.
Table 1-42: Number of students enrolled in selected post-secondary institutions, 2011
Institution
Enrolment
Male Female Total
Vanuatu Maritime College (VMC) 694 177 871
Vanuatu Institute of Teacher Education (VITE) 89 106 195
Vanuatu Institute of Technology (VIT) 479 335 814
Vanuatu Nursing College (VNC) 40 42 82
Vanuatu Police Training College (VPTC) 43 16 59
Australian Pacific Training College (APTC) 205 110 315
Technical and Vocational Education Training (TVET) 1,412 1,069 2,481
Total 2,962 1,855 4,817 Source: Education Institutions returns to the Ministry of Education.
Source: TVET data is extracted from the VANUATU TVET SECTOR STRENGTHENING PROGRAM PHASE 2report, been launched in March 2011.
Table 1-43: Number of instructors or trainers in selected post-secondary institutions, 2011
Institution
Instructors/Trainers
Male Female Total
Vanuatu Maritime College (VMC) 16 0 16
Vanuatu Institute of Teacher Education (VITE) 20 9 29
Vanuatu Institute of Technology (VIT) 31 22 53
Vanuatu Nursing College (VNC) 3 1 4
Australian Pacific Training College (APTC) 9 2 11
Total 89 37 126 Source: Education Institutions returns to the Ministry of Education. Note not all institutions in Table 1-42 above were able to provide information due to the specialist nature of training provided and the use of special trainers.
Training Provider Support Services (TPSS)
The Training Provider Support Services (TPSS) assist training providers to work within the national quality framework through supporting their registration and course accreditation with VNTC as well as the affiliation of trainers with registered training providers to expand the number of trainers available to train at provincial level. In 2010, the program assisted a total of 16 training providers to register with the VNTC including St Michel College and 14 Rural Training Centres (RTCs). A total of 45 new training modules were developed and accredited to meet training demand in subjects including carpentry and joinery, small engine maintenance, construction, tourism, small business and prawn farming. The Program is assisting with the upgrading of skills and certification of local trainers as well as general capacity building assistance for training providers. In 2010, the Centre facilitated three Train the Trainer (TTT) courses to assist existing or prospective trainers to gain recognized qualifications. A total of 58 TTT participants (17 female) attended representing training providers from the public, private, NGO and government sectors.


2. Quality of education
Relevant Indicators for MoE monitoring and evaluation: Indicator 2007 2008 2009 2010 2011 Government Primary* school teachers certified (%)
52.5% 50.9% 56.0% 58.9% 58.7%
Student: textbook ratio (primary) 3.1 2.7 2.9 2.5 2.7
Classroom: student ratio (primary) 22.8 22.6 22.6 23.0 22.9
GIR:GPI Year 1 1.02 1.04 1.02 1.01 1.02 Source: MoE, Vanuatu Performance Assessment Framework, VEMIS, 2011. *Government Primary schools include some schools which offer Year 7 and Year 8 but are classified as primary school; government assisted church schools are not included.
2.1. Examination results
2.1.1. VANSTA
2.1.1.1. National literacy and numeracy achievement, 2009 There are two VANSTA 1 reports, prepared from the 2009 administration of Vanuatu’s standardized tests of achievements (VANSTA) in Literacy and Numeracy at the end of Year 4. These levels of achievement are derived for curriculum outcomes at Year 4 for English and Mathematics in Vanuatu. Six levels are used to describe pupils’ achievement of the learning outcomes, ranging from L5, the highest through L4, L3, L2, L1, to L0, the lowest:
L5: Full mastery of the learning outcome
L3+: satisfactory achievement L4: Substantial mastery of the learning outcome
L3: Moderate mastery of the learning outcome
L2: Minor mastery of the learning outcome
L1: Minimal mastery of the learning outcome Lc: critical underachievement
L0: No obvious mastery of the learning outcome
Lc represents the combination of level L1 and level L0. Achievement at level Lc is deemed to represent critical underachievement as matched against the curriculum learning outcomes.
L3+ combines the upper end achievement at levels L5, L4 and L3.
Achievement at levels L3+ represents satisfactory achievement of the learning outcome.

36 Annual Statistical Report 2010-11
Figure 2-1: National Literacy and Numeracy Achievement, 2009
Source: National Exam’s Office, Ministry of Education (SPBEA)
The above graph shows the level of literacy and numeracy achievement in 2009. In overall, less than 5% of students reached L5 level which is stand for very excellent outcomes of reading and writing skills. On the other hand, 61% of students are categorized in L1 which is for minimal mastery of the learning outcome. Ministry of Education is now looking at improving the level of literacy at school level by focusing its resources in various program activities to upgrade literacy standards in all schools.
Numeracy is marginally better than literacy. The L5 numeracy outcome on Geometry, measurement, number, operations and proportions is 8%. In fact about 65% of students in year 4 have very poor numeracy skill in 2009.
Figure 2-2: Overall Literacy and Numeracy by Medium of Assessment, 2009
Source: VANSTA 1 and 2 Report
The National Literacy marginally better in Anglophone than Francophone speaking primary schools. The above graph shows that 19% of Anglophone speaking schools have moderate learning outcomes and 16% francophone L3. The numeracy achievement shows very little difference between the two systems. About 2 in every 3 students still struggling at Year 3 level although they have completed Year 4.
The overall literacy and numeracy achievement by gender indicate that girls in primary are doing better than boys. But there is still high percentage of students in L1+L0 whose level of reading, writing, comprehension, spellings, and grammar and language studies is very low. The above graph shows that 65% of boys have very
3% 4% 11%
22%
61%
8% 7% 9% 11%
65%
0%
10%
20%
30%
40%
50%
60%
70%
L5 L4 L3 L2 L1+L0
Literacy Numeracy
59% 66% 65% 61%
23% 11% 20% 11%
18% 23% 15% 28%
0%
20%
40%
60%
80%
100%
Literacy Numeracy Literacy Numeracy
Anglophone Francophone
critical underachievement minor achievement satisfactory achievement

37 Annual Statistical Report 2010-11
Republic of Vanuatu
poor literacy skills in primary year 4 whereas girls literacy skill is 54%. In terms of the numeracy skills, 67% boys have very poor numeracy skills than girls (65%) in primary schools.
The analysis of VANSTA tests results can be disaggregated by province and achievement skills subjects. This detail information could be obtained from the VANSTA 1 and 2 reports.
In 2010, theVanuatu Early Grade Reading Assessment (VANEGRA) was carried in some schools across Vanuatu. In the English schools most students developed some basic skills in Years 1, 2 and 3, however by the end of Year 3 only about 1 in 4 students were at the fluency level where they were able to able to understand most of the text they read. Results were similar in French schools. Factors that were shown to be related to better reading performance included: speaking English at home, owning the reading textbook, having literate parents, having books at home, reading at school and at home, attending kindergarten, doing homework, and receiving help from a family member to do homework. Teacher certification and experience showed no statistical effect on student reading outcomes; however, attending in-service teacher training on reading showed benefits. Better student reading performance was seen where a school library was used by students, and having and using the recommended Vanuatu reading texts.
2.1.2. Year 8 Figure 2-3: Students who sat the year 8 exam as % of VEMIS enrolment data, 2007-2010
Source: VEMIS and Exam’s data
For every 100 students enrolled in Year 8 as recorded in VEMIS only 86% of Year 8 English speaking sat the Year 8 exam and 87% of French speaking in 2010 as indicated by the national exam’s unit. There is a difference of 14% of Year 8 English speaking students who have not taken part in the Year 8 National Exam and 13% French speaking in 2010 for unknown reasons. Both VEMIS and the Exam Unit need to work together to investigate the difference between numbers enrolled and the number sitting exams.
Since 2007, for every 100 students who sat the year 8 national exam, 100% passed to Year 9 regardless of the low level of achievement skills in literacy and numeracy in assessments like VANSTA. It seems that there needs to be more transparency in the process of firstly selecting children eligible to sit the Year 8 exam and secondly whether it is appropriate based on the results of the Year 8 exam to pass 100% of students to Year 9.
88.1% 86.1%
90.3%
86.1%
86.5% 88.2%
82.6%
86.8%
78%
80%
82%
84%
86%
88%
90%
92%
2007 2008 2009 2010
English
French

38 Annual Statistical Report 2010-11
The internal learning outcomes assessments need to be taken into consideration to value the academic performance of a student before he/she is promoted up to the next year level. The promotion rate from Year 8 to Year 9 reduces by only 6% each year: on average in the past five years 94% of students in Year 8 have been promoted to Year 9.
2.1.3. Year 10 Figure 2-4: Students who sat the year 10 exam as % of VEMIS enrolment data, 2007-2010
Source: VEMIS and exam’s data
The Year 10 exam selection criteria are based on the good performance scores of the students. For every 100 students who enrolled in year 10 in 2010 only 88% of English speaking students sat the Year 10 exam and 87% French speaking students did. It is important to know why 12% of English speaking students and 13% in the French speaking students did not participate in the Year 10 exam in 2010.
Figure 2-5: % of Year 10 students who passed the National Exam, 2007-2010
Source: VEMIS and Exam’s data
89%
91% 92%
88%
83%
87% 88% 87%
78%
80%
82%
84%
86%
88%
90%
92%
94%
2007 2008 2009 2010
English French
1,396 1,384
1,986 2,048
663 706 770 629
59%
78%
39% 38%
0%
10%
20%
30%
40%
50%
60%
70%
80%
90%
100%
0
500
1,000
1,500
2,000
2,500
2007 2008 2009 2010
Year
10
exam
pas
s rat
e
Num
ber o
f Yea
r 10
sitt
ing
exam
s
English Exam candidates French Exam candidates English Pass rate French Pass rate

39 Annual Statistical Report 2010-11
Republic of Vanuatu
Part of the process to select a student for Year 11 involves the number of spaces available in the secondary schools and the rankings scores given after the exam. 100% of Year 10 students sitting the exam in French schools are placed in Year 11. Over the four years 2007 – 2010 there were an average of 777 students in English schools were placed in Year 11 based on the Year 10 exam results and space compared with 577 in the French schools. In 2010, in English schools 38% of Year 10 students, or 685 students, were placed in Year 11 and 100% of French speaking students (546) were selected to advance to Year 11.
This is not to say that the students who were not placed in Year 11 discontinue their education and training. The pass rate in 2008 was 78% or 39% difference of students have probably continued their education in either a vocational school, drop out from the system and somehow have been re-enrolled in other schools.
2.1.4. Year 12 Figure 2-6: % of Year 12 Students who passed the 2010 PSSC and Year 12 francophone exams
Source: National Exams database, MoE
In 2010, 1,197 Year 12 (English) and Année 12 (French) students in English and French secondary schools sat the Year 12 exam, of which 475 students advanced to Year/ Année 13 in 2011, with 722 students unplaced. The PSSC Year 12 (English schools) shows better achievement than the Année 12 (the equivalent in the French schools) selection because only 25% of the total number in Année 12 sat passed to Year 13 in French schools in 2011. But the overall pass rates were low at 49% for Year 12 and 25% for Année 12.
2.1.5. Vanuatu Rural Development Training Centres Associations (VRDTCA) The Vanuatu Rural Training Centres Development Association (VRDTCA) is the umbrella organisation for the Rural Training Centres (RTCs) that operate throughout Vanuatu. RTCs offer training to rural students intended to enhance their livelihood options. RTCs operate within a vocational training sector in Vanuatu that is undergoing significant change and formalisation. The comparatively recent addition of; the Vanuatu National Training Council whose job is the audit and quality control of vocational training providers as well as the accreditation of the material they deliver against the Vanuatu Qualifications Framework has significant impact on RTCs.
0
100
200
300
400
500
600
700
800
Total Male Total Female Total Sat Placed Male Placed Female Total Placed
Yr 12 Total Année 12 Total
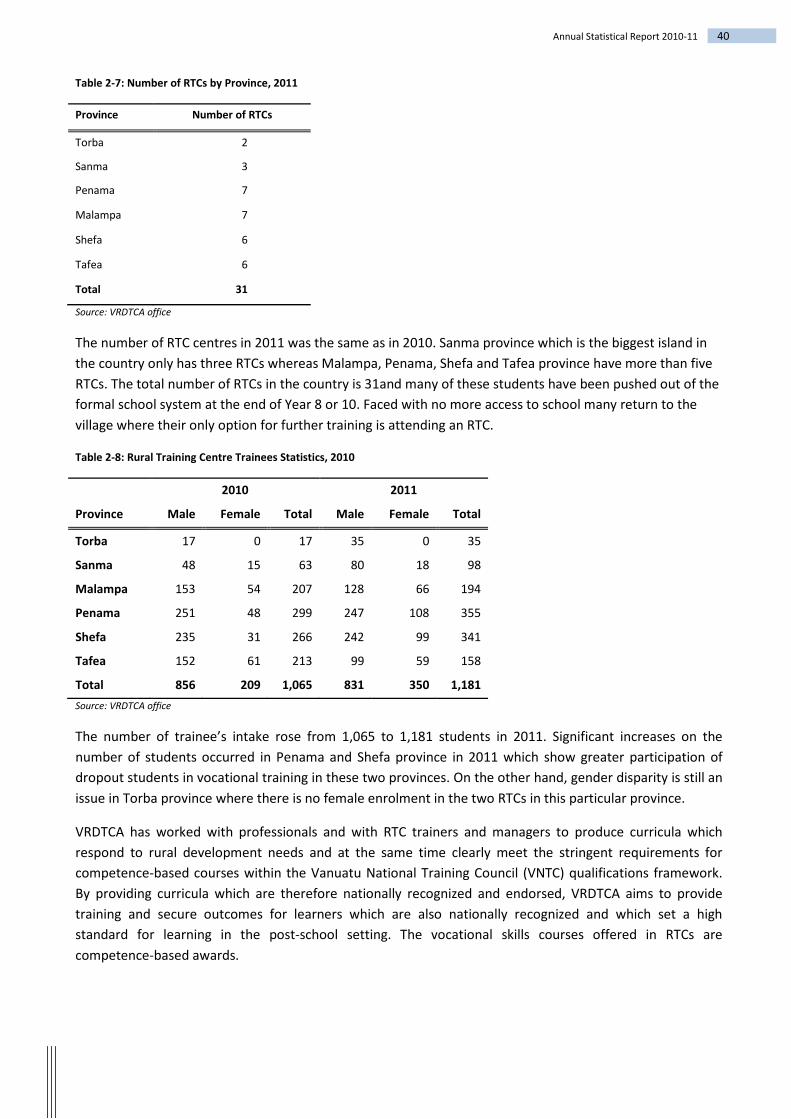
40 Annual Statistical Report 2010-11
Table 2-7: Number of RTCs by Province, 2011
Province Number of RTCs
Torba 2
Sanma 3
Penama 7
Malampa 7
Shefa 6
Tafea 6
Total 31
Source: VRDTCA office
The number of RTC centres in 2011 was the same as in 2010. Sanma province which is the biggest island in the country only has three RTCs whereas Malampa, Penama, Shefa and Tafea province have more than five RTCs. The total number of RTCs in the country is 31and many of these students have been pushed out of the formal school system at the end of Year 8 or 10. Faced with no more access to school many return to the village where their only option for further training is attending an RTC.
Table 2-8: Rural Training Centre Trainees Statistics, 2010
Province
2010 2011
Male Female Total Male Female Total
Torba 17 0 17 35 0 35
Sanma 48 15 63 80 18 98
Malampa 153 54 207 128 66 194
Penama 251 48 299 247 108 355
Shefa 235 31 266 242 99 341
Tafea 152 61 213 99 59 158
Total 856 209 1,065 831 350 1,181 Source: VRDTCA office
The number of trainee’s intake rose from 1,065 to 1,181 students in 2011. Significant increases on the number of students occurred in Penama and Shefa province in 2011 which show greater participation of dropout students in vocational training in these two provinces. On the other hand, gender disparity is still an issue in Torba province where there is no female enrolment in the two RTCs in this particular province.
VRDTCA has worked with professionals and with RTC trainers and managers to produce curricula which respond to rural development needs and at the same time clearly meet the stringent requirements for competence-based courses within the Vanuatu National Training Council (VNTC) qualifications framework. By providing curricula which are therefore nationally recognized and endorsed, VRDTCA aims to provide training and secure outcomes for learners which are also nationally recognized and which set a high standard for learning in the post-school setting. The vocational skills courses offered in RTCs are competence-based awards.

41 Annual Statistical Report 2010-11
Republic of Vanuatu
Table 2-9: 2011 RTC Graduates
Province VNTC Certificates VRDTCA Certificates Total
Torba 3 0 3
Sanma 27 0 27
Penama 85 20 105
Malampa 27 52 79
Shefa 0 32 32
Tafea 12 61 73
Total 154 165 319 Source: VRDTCA office
Among the 1,181 RTC students who took part in the VNTC and VRDTCA exams, only 154 were awarded the VNTC certificates and 165 the VRDTCA certificates. Shefa province, where the number of students is more than 300, only had 32 succeeding in the VNTC and VRDTCA exams. In proportion, 27% of the students who enrolled in the RTCs in 2011 were awarded the VNTC and VRDTCA certificates.
Table 2-10: Number of RTC’s Trainers, 2011
Province Male Female Total
Torba 6 3 9
Sanma 8 5 13
Penama 36 10 46
Malampa 27 10 37
Shefa 8 2 10
Tafea 37 12 49
Total 122 42 164 Source: VRDTCA office
The number of trainers does not really reflect the number of students by province. Provinces like Penama and Shefa would have used more trainers from other supporting organizations which would not have been included in Table 2-9 above. The overall student: trainer ratio is 7.2 students to one trainer which indicates that most of the trainers have adequate time to concentrate on the learning success of each student.
2.2. School cycle completion
2.2.1. Drop-out, repeater and promotion rate Table 2-11: Drop-out, repeater and promotion rates, 2009 – 2011
Primary Year 1 – 6 Secondary Year 7+
Year Drop-out rate Repeater Rate Promotion Rate Drop-out rate Repeater Rate Promotion Rate
2009 2.1% 14.4% 83.9% 37.9% 1.9% 60.1%
2010 6.0% 15.1% 78.8% 39.9% 2.8% 57.2%
2011 8.0% 12.1% 79.9% 44.2% 3.0% 52.9% Source: MoE, VEMIS, 2011.

42 Annual Statistical Report 2010-11
2.2.2. Survival Rate Table 2-12: Survival rate to Year 6, 10 and 13, 2009 – 2011
Year
Survival rate
to year 6 to year 10 to year 13
2009 96.7% 61.3% 16.0%
2010 74.6% 39.4% 9.7%
2011 69.5% 33.7% 5.1% Source: MoE, VEMIS, 2011.
2.2.3. Coefficient of efficiency Figure 2-13: Coefficient of efficiency, 2008 - 2011
Source: MoE, VEMIS, 2011.
The definition of the Coefficient of efficiency is included in the glossary.
0.0
0.1
0.2
0.3
0.4
0.5
0.6
0.7
0.8
0.9
Year 1 Year 2 Year 3 Year 4 Year 5 Year 6 Year 7 Year 8 Year 9 Year 10 Year 11 Year 12 Year 13
2011 2010 2009 2008

43 Annual Statistical Report 2010-11
Republic of Vanuatu
2.3. Teachers
2.3.1. Education authority Table 2-14: Number of teachers, school level and authority, 2010 - 2011
Number of Teachers
School Level Authority Type 2010 2011
Early Childhood Education Government of Vanuatu 9
Church (Government Assisted) 29 28
Church (Not Government Assisted) 3 1
Private 517 609
Community 257 170
Not stated 0 4
Total 815 812
Primary, Year 1-6 Government of Vanuatu 1,164 1,173
Church (Government Assisted) 385 428
Church (Not Government Assisted) 13 11
Private 55 61
Community 18 13
Total 1,635 1,686
Secondary, Year 7-13/14 Government of Vanuatu 735 727
Church (Government Assisted) 341 341
Church (Not Government Assisted) 10 10
Private 42 61
Community 9 11
Not stated 0 2
Total 1,137 1,152
Total 3,587 3,650 Source: MoE, VEMIS, 2011.
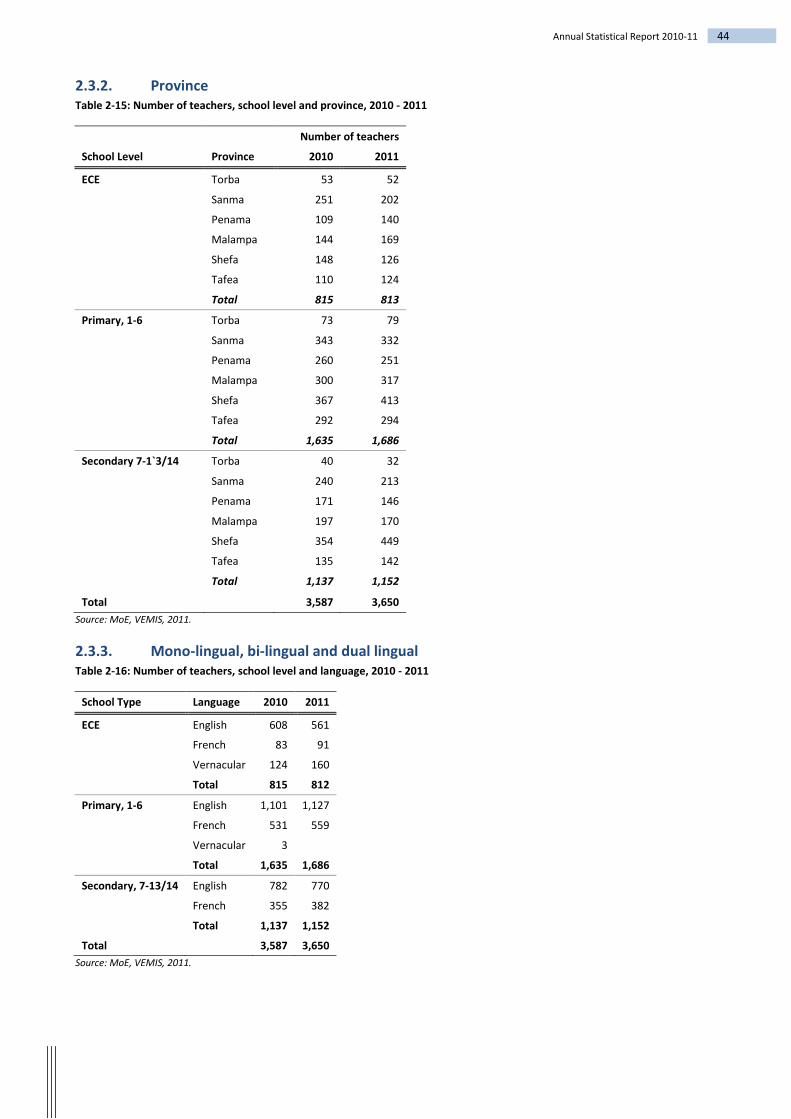
44 Annual Statistical Report 2010-11
2.3.2. Province Table 2-15: Number of teachers, school level and province, 2010 - 2011
Number of teachers
School Level Province 2010 2011
ECE Torba 53 52
Sanma 251 202
Penama 109 140
Malampa 144 169
Shefa 148 126
Tafea 110 124
Total 815 813
Primary, 1-6 Torba 73 79
Sanma 343 332
Penama 260 251
Malampa 300 317
Shefa 367 413
Tafea 292 294
Total 1,635 1,686
Secondary 7-1`3/14 Torba 40 32
Sanma 240 213
Penama 171 146
Malampa 197 170
Shefa 354 449
Tafea 135 142
Total 1,137 1,152
Total 3,587 3,650 Source: MoE, VEMIS, 2011.
2.3.3. Mono-lingual, bi-lingual and dual lingual Table 2-16: Number of teachers, school level and language, 2010 - 2011
School Type Language 2010 2011
ECE English 608 561
French 83 91
Vernacular 124 160
Total 815 812
Primary, 1-6 English 1,101 1,127
French 531 559
Vernacular 3
Total 1,635 1,686
Secondary, 7-13/14 English 782 770
French 355 382
Total 1,137 1,152
Total 3,587 3,650 Source: MoE, VEMIS, 2011.
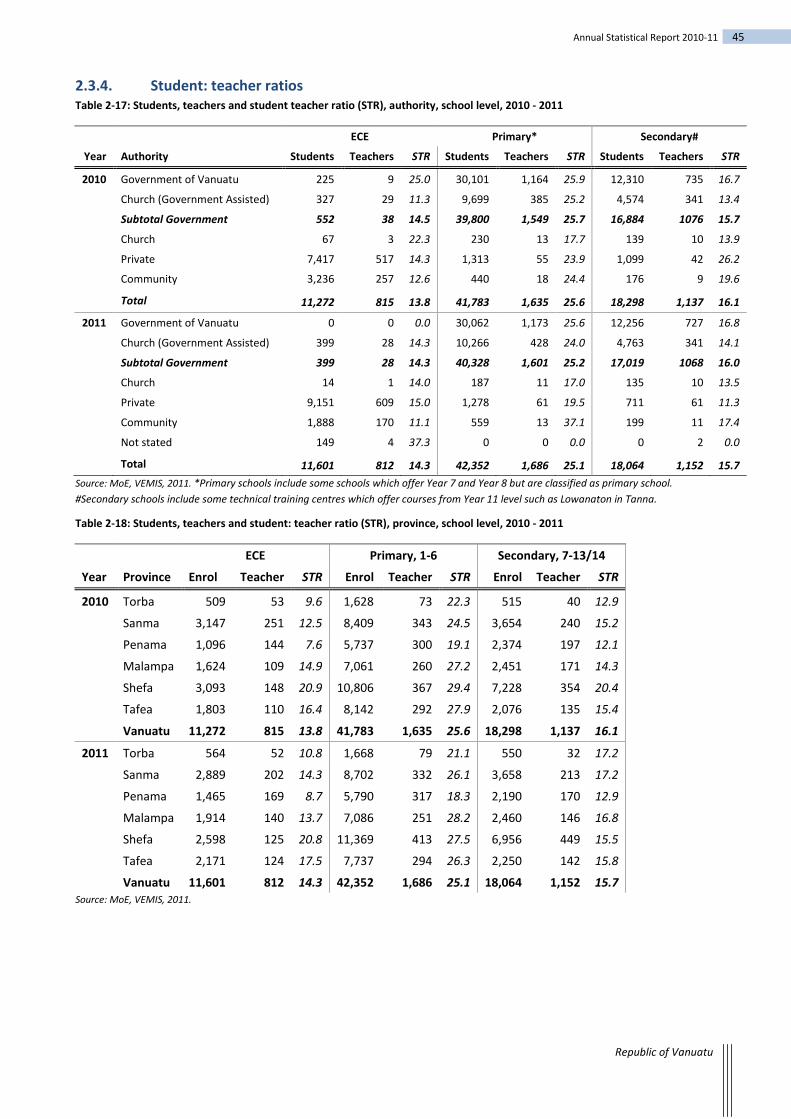
45 Annual Statistical Report 2010-11
Republic of Vanuatu
2.3.4. Student: teacher ratios Table 2-17: Students, teachers and student teacher ratio (STR), authority, school level, 2010 - 2011
ECE Primary* Secondary#
Year Authority Students Teachers STR Students Teachers STR Students Teachers STR
2010 Government of Vanuatu 225 9 25.0 30,101 1,164 25.9 12,310 735 16.7
Church (Government Assisted) 327 29 11.3 9,699 385 25.2 4,574 341 13.4
Subtotal Government 552 38 14.5 39,800 1,549 25.7 16,884 1076 15.7
Church 67 3 22.3 230 13 17.7 139 10 13.9
Private 7,417 517 14.3 1,313 55 23.9 1,099 42 26.2
Community 3,236 257 12.6 440 18 24.4 176 9 19.6
Total 11,272 815 13.8 41,783 1,635 25.6 18,298 1,137 16.1
2011 Government of Vanuatu 0 0 0.0 30,062 1,173 25.6 12,256 727 16.8
Church (Government Assisted) 399 28 14.3 10,266 428 24.0 4,763 341 14.1
Subtotal Government 399 28 14.3 40,328 1,601 25.2 17,019 1068 16.0
Church 14 1 14.0 187 11 17.0 135 10 13.5
Private 9,151 609 15.0 1,278 61 19.5 711 61 11.3
Community 1,888 170 11.1 559 13 37.1 199 11 17.4
Not stated 149 4 37.3 0 0 0.0 0 2 0.0
Total 11,601 812 14.3 42,352 1,686 25.1 18,064 1,152 15.7 Source: MoE, VEMIS, 2011. *Primary schools include some schools which offer Year 7 and Year 8 but are classified as primary school. #Secondary schools include some technical training centres which offer courses from Year 11 level such as Lowanaton in Tanna.
Table 2-18: Students, teachers and student: teacher ratio (STR), province, school level, 2010 - 2011
ECE Primary, 1-6 Secondary, 7-13/14
Year Province Enrol Teacher STR Enrol Teacher STR Enrol Teacher STR
2010 Torba 509 53 9.6 1,628 73 22.3 515 40 12.9
Sanma 3,147 251 12.5 8,409 343 24.5 3,654 240 15.2
Penama 1,096 144 7.6 5,737 300 19.1 2,374 197 12.1
Malampa 1,624 109 14.9 7,061 260 27.2 2,451 171 14.3
Shefa 3,093 148 20.9 10,806 367 29.4 7,228 354 20.4
Tafea 1,803 110 16.4 8,142 292 27.9 2,076 135 15.4
Vanuatu 11,272 815 13.8 41,783 1,635 25.6 18,298 1,137 16.1
2011 Torba 564 52 10.8 1,668 79 21.1 550 32 17.2
Sanma 2,889 202 14.3 8,702 332 26.1 3,658 213 17.2
Penama 1,465 169 8.7 5,790 317 18.3 2,190 170 12.9
Malampa 1,914 140 13.7 7,086 251 28.2 2,460 146 16.8
Shefa 2,598 125 20.8 11,369 413 27.5 6,956 449 15.5
Tafea 2,171 124 17.5 7,737 294 26.3 2,250 142 15.8
Vanuatu 11,601 812 14.3 42,352 1,686 25.1 18,064 1,152 15.7 Source: MoE, VEMIS, 2011.
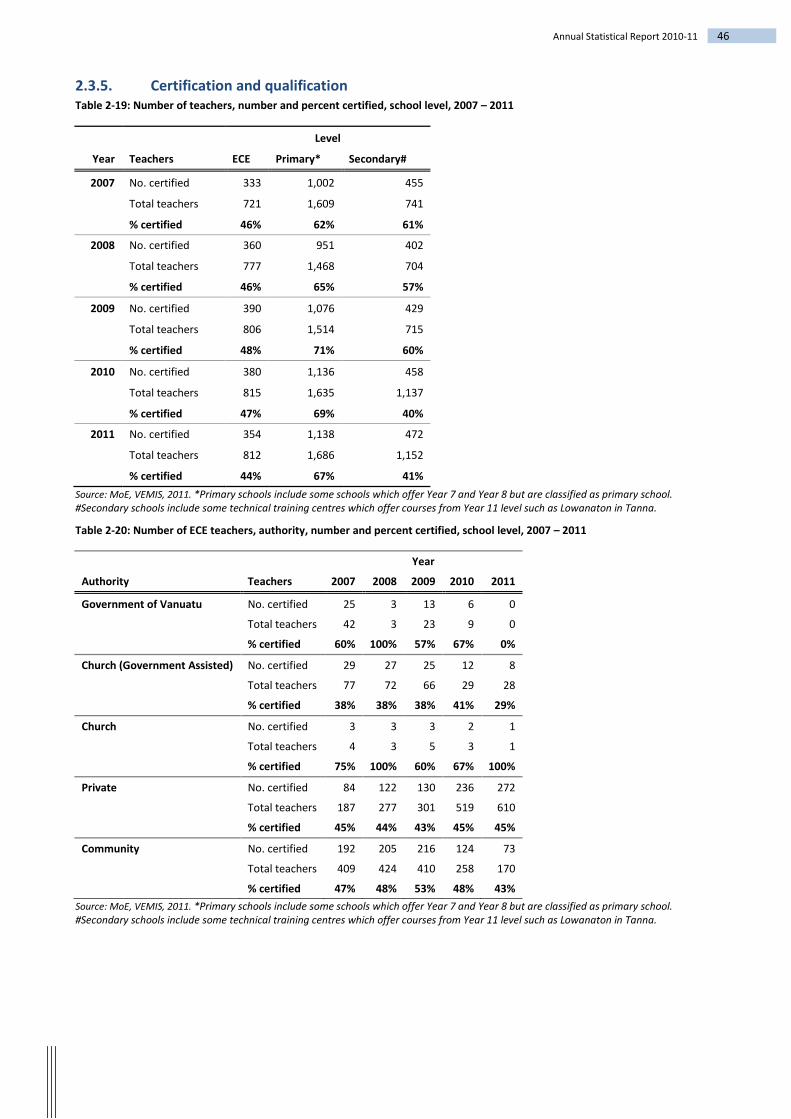
46 Annual Statistical Report 2010-11
2.3.5. Certification and qualification Table 2-19: Number of teachers, number and percent certified, school level, 2007 – 2011
Level
Year Teachers ECE Primary* Secondary#
2007 No. certified 333 1,002 455
Total teachers 721 1,609 741
% certified 46% 62% 61%
2008 No. certified 360 951 402
Total teachers 777 1,468 704
% certified 46% 65% 57%
2009 No. certified 390 1,076 429
Total teachers 806 1,514 715
% certified 48% 71% 60%
2010 No. certified 380 1,136 458
Total teachers 815 1,635 1,137
% certified 47% 69% 40%
2011 No. certified 354 1,138 472
Total teachers 812 1,686 1,152
% certified 44% 67% 41% Source: MoE, VEMIS, 2011. *Primary schools include some schools which offer Year 7 and Year 8 but are classified as primary school. #Secondary schools include some technical training centres which offer courses from Year 11 level such as Lowanaton in Tanna.
Table 2-20: Number of ECE teachers, authority, number and percent certified, school level, 2007 – 2011
Year
Authority Teachers 2007 2008 2009 2010 2011
Government of Vanuatu No. certified 25 3 13 6 0
Total teachers 42 3 23 9 0
% certified 60% 100% 57% 67% 0%
Church (Government Assisted) No. certified 29 27 25 12 8
Total teachers 77 72 66 29 28
% certified 38% 38% 38% 41% 29%
Church No. certified 3 3 3 2 1
Total teachers 4 3 5 3 1
% certified 75% 100% 60% 67% 100%
Private No. certified 84 122 130 236 272
Total teachers 187 277 301 519 610
% certified 45% 44% 43% 45% 45%
Community No. certified 192 205 216 124 73
Total teachers 409 424 410 258 170
% certified 47% 48% 53% 48% 43% Source: MoE, VEMIS, 2011. *Primary schools include some schools which offer Year 7 and Year 8 but are classified as primary school. #Secondary schools include some technical training centres which offer courses from Year 11 level such as Lowanaton in Tanna.

47 Annual Statistical Report 2010-11
Republic of Vanuatu
Table 2-21: Number of Primary* teachers, authority, number and percent certified, school level, 2007 – 2011
Year
Authority Teachers 2007 2008 2009 2010 2011
Government of Vanuatu No. certified 782 731 806 866 872
Total teachers 1,372 1,329 1,338 1,350 1,329
% certified 57% 55% 60% 64% 66%
Church (Government Assisted) No. certified 170 166 204 207 212
Total teachers 372 364 407 418 435
% certified 46% 46% 50% 50% 49%
Church No. certified 5 2 5 4 4
Total teachers 8 11 9 7 8
% certified 63% 18% 56% 57% 50%
Private No. certified 7 19 32 27 22
Total teachers 23 47 56 55 69
% certified 30% 40% 57% 49% 32%
Community No. certified 4 4 3 4 3
Total teachers 18 22 25 20 21
% certified 22% 18% 12% 20% 14% Source: MoE, VEMIS, 2011. *Primary schools include some schools which offer Year 7 and Year 8 but are classified as primary school.
Table 2-22: Number of Secondary# teachers, authority, number and percent certified, school level, 2007 – 2011
Year
Authority Teachers 2007 2008 2009 2010 2011
Government of Vanuatu No. certified 278 233 268 283 292
Total teachers 411 374 410 441 467
% certified 68% 62% 65% 64% 63%
Church (Government Assisted) No. certified 131 115 119 145 138
Total teachers 232 230 219 263 254
% certified 56% 50% 54% 55% 54%
Church No. certified 3 0 0 1 1
Total teachers 7 7 4 1 1
% certified 43% 0% 0% 100% 100%
Private No. certified 11 16 15 8 8
Total teachers 23 21 24 30 49
% certified 48% 76% 63% 27% 16%
Community No. certified 1 3 1 0 0
Total teachers 8 11 8 3 9
% certified 13% 27% 13% 0% 0%
Not stated No. certified 0 0 0 0 0
Total teachers 1 0 0 0 1
% certified 0% 0% 0% 0% 0% Source: MoE, VEMIS, 2011. #Secondary schools include some technical training centres which offer courses from Year 11 level such as Lowanaton in Tanna.

48 Annual Statistical Report 2010-11
Table 2-23: Percent of teachers who are certified and qualified, school level, 2010 – 2011
School Level Teachers certified and qualified 2010 2011
ECE % Certified and Qualified Teachers
% Certified 46.5% 43.6%
% Qualified 53.3% 56.4%
Primary, 1-6 % Certified and Qualified Teachers
% Certified 56.9% 57.7%
% Qualified 43.1% 42.3%
Secondary, 7-13/14 % Certified and Qualified Teachers
% Certified 60.9% 57.6%
% Qualified 39.1% 42.4% Source: MoE, VEMIS, 2011.
2.3.6. In-service training Table 2-24: Number of teachers attending in-service training, school level, 2007 – 2011
In-service 5 Years
School level 2007 2008 2009 2010 2011 Total
Early Childhood Education 335 317 327 308 255 1,542
Primary School 567 503 547 499 436 2,552
Secondary School 176 120 110 98 73 577
Total 1,078 940 984 905 764 4,671 Source: MoE, VEMIS, 2011.
2.4. School facilities The school Minimum Quality Standard is currently being finalised. There are 15 Standards altogether and Standard 9 directs that school buildings meet the MoE infrastructure standards, for heads of schools to conduct monthly safety audits of buildings and that a maintenance plan is implemented. School buildings need to be safe and comfortable to ensure that all children can attend classes and maintain good health. The Facilities Unit from the MoE is in the process of developing minimum infrastructure standards for classrooms, toilets, water facilities etc. Once completed, these standards will help school committees to decide how to upgrade and maintain their school infrastructure.
2.4.1. Classrooms Table 2-25: Classrooms, enrolment and student: classroom ratio, school level, 2010-2011
Year School Level Classrooms Enrolment Student: Classroom ratio
2010 ECE 673 11,272 16.7
Primary 1-6 2,035 41,783 20.5
Secondary 7-13/14 503 18,298 36.3
Total 3,211 71,353 22.2
2011 ECE 696 11,601 16.6
Primary 1-6 2,050 42,352 20.6
Secondary 7-13/14 515 18,064 35.0
Total 3,261 72,017 22.0 Source: MoE, VEMIS, 2011.

49 Annual Statistical Report 2010-11
Republic of Vanuatu
2.4.2. Water supply In the Minimum Quality Standard (MQS), the Standard 10 indicates that all teachers and students have access to at least two litres of potable water every day. When teachers and students do not drink enough water, they will feel thirsty and they will have difficulties to concentrate during lesson time. Therefore, teachers and students need to drink at least 2 litres of drinking water every day to keep focussed during the lessons.
Table 2-26: Number of types of water supplies in schools, school level, 2010 – 2011
Type of Water supply ECE Primary School Secondary School Total
2010 Roof Tank 246 270 68 584
Well (non-drinkable) 44 45 16 105
Well (drinkable) 112 106 26 244
Stream/River 138 87 19 244
Piped 260 208 53 521
Total 800 716 182 1,698
2011 Roof Tank 268 306 67 641
Well (non-drinkable) 50 47 21 118
Well (drinkable) 119 105 24 248
Stream/River 140 94 14 248
Piped 254 200 54 508
Total 831 752 180 1,763 Source: MoE, VEMIS, 2011.
2.4.3. Sanitation According to the regulations, the schools must at least two toilets, for boys and another for girls. The standard Pupil: Toilet ratio as stated in Standard 9 of the MQS is 1:20 for girls and 1:20 for boys. All school buildings need to be accessible by teachers and students. Toilets are open for use and classrooms are used for teaching and not as a storage place.

50 Annual Statistical Report 2010-11
Table 2-27: Number of toilets for females and males in schools, school level, 2010 – 2011
Sex Survey Year School level Enrolment Toilets Pupil: Toilet Ratio GPI:PTR
Female
2010 Primary School 19,780 619 35.88 0.92
Early Childhood Education 5,493 367 14.97 1.21
Secondary School 9,114 501 13.35 0.90
Total 34,387 1,487 23.13 0.97
2011 Primary School 19,973 601 36.94 0.81
Early Childhood Education 5,581 315 17.72 1.27
Secondary School 9,033 474 14.33 0.91
Total 34,587 1,390 24.87 0.93
Male 2010 Primary School 22,003 633 38.84 1.00
Early Childhood Education 5,779 468 12.35 1.00
Secondary School 9,184 444 14.86 1.00
Total 36,968 1,545 23.93 1.00
2011 Primary School 22,379 544 45.33 1.00
Early Childhood Education 6,020 432 13.94 1.00
Secondary School 9,031 427 15.77 1.00
Total 37,430 14,03 26.67 1.00
Source: MoE, VEMIS, 2011.
2.4.4. Primary schools with secure tenure The Government of Vanuatu has decided through its council of Ministers to acquire land for its public services such as health, education and airports etc. The MoE annually releases the official registration list of all schools that have officially registered with the MoE. Many of these schools don’t have proper lease agreements, therefore the MoE School Land Committee (MSLC) was established in July 2010 to deal with the issue of securing title for schools and to minimise disruption to schools in the country.
Table 2-28: Primary school and type of tenure by province, 2010
Province Total schools No. of School with Land Leased % of School Land Leased
Torba 23 10 43%
Sanma 90 22 24%
Penama 64 21 33%
Malampa 88 16 18%
Shefa 81 20 25%
Tafea 79 33 42%
Total 425 122 29%
Source: MoE School Land lease records, 2012
Most of the schools with land lease are government and government assisted schools. The above table shows that only 29% of schools have a lease agreement with the government. There are still many registered schools that have land disputes and a lot of schools have no formal agreements about the use of land. One of the responsibilities of the current MSLC is to set up procedures and criteria for the school land registration and settling of school land issues. This same committee will develop a five year plan to acquired or lease all school in Vanuatu.

51 Annual Statistical Report 2010-11
Republic of Vanuatu
The MoE through the MSLC Committee will have to liaise with the Department of Lands in any matters relating to school land including disputed titles, land ownership, signing of proper lease agreements, land rent and so on.
2.5. School resources Improving the quality and relevance of curriculum, materials and assessment systems is a priority under VESS and ensuring that schools are provided with sufficient quantities of resources is an important part of achieving this goal.
2.5.1. Reading books Reading book or a reader: is a novel, a story, a book for fun, to escape (but can learn things from of course) – and then a book which the child learns to read.
Table 2-29: Reading book: student ratio, 2010-2011
School Type Year Number of reading books Enrolment Reading book: student ratio
Primary 2010 116,343 41,743 2.8
2011 102,084 42,352 2.4
Secondary 2010 27,121 18,298 1.5
2011 48,472 18,064 2.7
Source: VEMIS MoE, 2011.
In primary, the reading book: student ratio is an important indicator used to measure student’s access to reading books. The Reading Books: Student ratio in primary in still of concern in Malampa and Tafea province and raises the possibility that few schools have not properly completed the section on schools resources on their VEMIS survey forms.
In secondary schools, the reading books: student ratio is particularly high in Malampa province in 2011 (data obtained from VEMIS). This is a great opportunity for students in that particular province to improve their reading skills. It is important that MoE should consider doing the school data validation on the reading books to ensure that all secondary school have sufficient reading books for every student.

52 Annual Statistical Report 2010-11
2.5.2. Resources and equipment in primary schools Table 2-30: Additional resources and equipment in primary schools, 2010-2011
Survey Year Resource Type
Condition
Total Good Fair Poor Not Stated
2010 Communications 1.4% 0.4% 0.7% 1.3% 0.9%
Equipment 2.9% 1.0% 1.6% 2.6% 1.9%
Learning Resources 8.0% 13.6% 14.3% 2.6% 11.0%
Workshop Resources 0.3% 0.2% 0.1% 0.2% 0.2%
Laboratory Resources 0.0% 0.0% 0.0% 0.0% 0.0%
Home Ec. Resources 0.0% 0.0% 0.0% 0.0% 0.0%
Teachers' Guides 16.9% 18.3% 12.3% 19.0% 16.8%
Text Books 13.7% 19.4% 28.3% 17.1% 18.6%
Total 43.2% 53.0% 57.3% 42.7% 49.4%
2011 Communications 1.4% 0.4% 0.6% 2.3% 0.9%
Equipment 3.7% 0.6% 1.5% 4.6% 2.1%
Learning Resources 13.3% 13.0% 11.4% 2.6% 12.3%
Workshop Resources 0.0% 0.0% 0.0% 0.1% 0.0%
Laboratory Resources 0.0% 0.0% 0.0% 0.0% 0.0%
Teachers' Guides 19.9% 15.8% 8.9% 27.3% 16.8%
Text Books 18.4% 17.3% 20.3% 20.6% 18.4%
Total 56.8% 47.0% 42.7% 57.3% 50.6%
Source: VEMIS MoE, 2011.
Definitions: Communication: Schools has access to one or more forms of communication (telephone, facsimile, Internet,
radio telephone, email). Teacher guides: Teachers have access to teacher’s guides for the following subjects General, Language,
Maths, and Basic Science. Textbooks: Students have access to textbooks (Maths, General, Language, Social Science, and Basic Science). Equipment: School has access to equipment including photocopier, printer, computer, duplicator, scanner,
DVD Player and TV). Laboratory resources: School has access to science charts, chemistry equipment etc. Home Ec. Resources: School has access to appliances and supplies for home economics. Workshop resources: Schools have access to workshop tools, equipment and materials for maintenance and
repairs.

53 Annual Statistical Report 2010-11
Republic of Vanuatu
2.5.3. Text books The Student: Textbook ratio provides a measure of the resources available for students and is defined as the number of textbooks in relation to the size of the pupil population.
Figure 2-31: Primary school student: textbook ratio, 2010-2011
Source: VEMIS MoE, 2011.
Figure 2-32: Secondary school student: textbook ratio, 2010-2011
Source: VEMIS MoE, 2011.
The student: textbook ratio is defined as the average number of textbooks per student at the specific level of education in a given school year. In the MoE Minimum Quality Standard, the Standard 7 reflects the Effective Teaching and learning outcome which is “All students have access to textbooks and stationary for all subjects”. In principle, the official standard used for distribution by class is at least one text book for every student for all core subjects are used during the lesson and the text books are in good condition.
It is equally important that textbooks are distributed in adequate numbers for each of the core subjects. The above graphs show the distribution of educational textbooks by year levels and it would seem that Torba province has lots of textbooks in primary schools. A special attention need to focus the number of textbooks in primary schools in Malampa and Tafea province. At secondary level, the student: textbook ratio is lowest in Shefa province compared to other provinces.
2.2 2.3 3.4
2.4 1.5
4.5
2.6 2.3 3.0 2.5 1.9
7.9
0.0 1.0 2.0 3.0 4.0 5.0 6.0 7.0 8.0 9.0
Mal
ampa
Pena
ma
Sanm
a
Shef
a
Tafe
a
Torb
a
Mal
ampa
Pena
ma
Sanm
a
Shef
a
Tafe
a
Torb
a
2010 2011
9.2
4.1 4.5
2.5
5.9
8.0 9.0
5.0 4.2
3.0 3.4
8.7
0.0 1.0 2.0 3.0 4.0 5.0 6.0 7.0 8.0 9.0
10.0
Mal
ampa
Pena
ma
Sanm
a
Shef
a
Tafe
a
Torb
a
Mal
ampa
Pena
ma
Sanm
a
Shef
a
Tafe
a
Torb
a
2010 2011

54 Annual Statistical Report 2010-11
2.5.4. Libraries Table 2-33: Distribution (% of each item) of primary school library resources by province, 2010-2011
Year Province Computers Instructional Videos Reading Books Reference Books Video Player Total
2010 Torba 0% 1% 6% 8% 0% 6%
Sanma 7% 12% 27% 24% 0% 26%
Penama 1% 0% 10% 19% 0% 11%
Malampa 1% 0% 7% 6% 25% 7%
Shefa 91% 85% 38% 38% 63% 38%
Tafea 0% 2% 13% 5% 13% 12%
Total 100% 100% 100% 100% 100% 100%
2011 Torba 0% 0% 14% 9% 0% 14%
Sanma 13% 29% 26% 22% 0% 26%
Penama 0% 12% 10% 24% 0% 12%
Malampa 4% 14% 5% 11% 17% 6%
Shefa 74% 43% 30% 30% 67% 30%
Tafea 9% 2% 14% 5% 17% 13%
Total 100% 100% 100% 100% 100% 100% Source: VEMIS MoE, 2011.
Table 2-34: % of primary school library resources by authority, 2010-2011
Year Authority Computers Instructional
Videos Reading
Books Reference
Books Video Player Total
2010 Government of Vanuatu 67% 45% 78% 76% 75% 77%
Church (Government Assisted) 7% 37% 14% 11% 13% 14%
Private 25% 0% 7% 12% 13% 7%
Church (Not Government Assisted) 1% 17% 1% 1% 0% 1%
Community 0% 0% 0% 0% 0% 0%
Total 100% 100% 100% 100% 100% 100%
2011 Government of Vanuatu 25% 88% 80% 89% 67% 81%
Church (Government Assisted) 26% 6% 13% 3% 17% 12%
Private 45% 0% 4% 6% 17% 4%
Church (Not Government Assisted) 2% 6% 1% 3% 0% 1%
Community 2% 0% 2% 0% 0% 2%
Total Source: VEMIS MoE, 2011.

55 Annual Statistical Report 2010-11
Republic of Vanuatu
Table 2-35: % of secondary school library resources by province, 2010-2011
Survey Year Province Computers Instructional Videos Reading Books Reference Books Video Player Total
2010 Torba 0% 0% 2% 2% 0% 2%
Sanma 7% 18% 13% 3% 0% 9%
Penama 2% 0% 24% 6% 0% 18%
Malampa 2% 45% 9% 30% 0% 16%
Shefa 73% 28% 24% 18% 100% 22%
Tafea 16% 9% 29% 40% 0% 32%
Total 100% 100% 100% 100% 100% 100%
2011 Torba 0% 0% 2% 5% 0% 3%
Sanma 13% 39% 7% 2% 14% 6%
Penama 3% 18% 3% 5% 14% 3%
Malampa 3% 2% 43% 37% 14% 42%
Shefa 80% 22% 31% 6% 57% 26%
Tafea 3% 20% 15% 45% 0% 21%
Total 100% 100% 100% 100% 100% 100% Source: VEMIS MoE, 2011.
Table 2-36: % of secondary school library resources by authority, 2010-2011
Year Authority Computers Instructional
Videos Reading
Books Reference
Books Video Player Total
2010 Government of Vanuatu 47% 23% 65% 74% 100% 68%
Church (Government Assisted) 40% 77% 31% 24% 0% 29%
Private 11% 0% 2% 2% 0% 2%
Church (Not Government Assisted) 2% 0% 2% 1% 0% 1%
Total 100% 100% 100% 100% 100% 100%
2011 Government of Vanuatu 55% 69% 63% 68% 57% 64%
Church (Government Assisted) 18% 29% 15% 31% 29% 18%
Private 25% 2% 22% 0% 14% 17%
Church (Not Government Assisted) 3% 0% 1% 1% 0% 1%
Community 0% 0% 0% 0% 0% 0%
Total 100% 100% 100% 100% 100% 100% Source: VEMIS MoE, 2011.


3. Management and planning
Relevant Indicators for MoE monitoring and evaluation: Indicator 2007 2008 2009 2010 2011 % education expenditure from Government recurrent budget 26% 26% 24% 24% 26%
Unit costs for education (Vt per year)
ECE 164
Primary 48,269
Secondary 69,147
Post-secondary (VIT and VITE) 192,492
Scholarships 563,160 Source: MoE, Vanuatu Performance Assessment Framework, VEMIS, 2011, Department of Finance
3.1. Resources for education
3.1.1. Total expenditure Figure 3-1: MoE source of funds - recurrent Government budget and grants, million Vatu, 2010 - 2011
Source: MoE, Government Finance System, Budget Appropriation 2012.
Figure 3-2: MoE budget as a proportion of Vanuatu budget (recurrent expenditure), 2000 – 2012
Source: MoE, Government Finance System, Budget Appropriation 2012
3,724 3,858 3,894
1,454 1,483 1,480
-
1,000
2,000
3,000
4,000
5,000
6,000
2010 2011 2012 MoE Budget Grants
24% 26% 27% 27% 26% 24%
26%
0%
5%
10%
15%
20%
25%
30%
35%
2000
2001
2002
2003
2004
2005
2006
2007
2008
2009
2010
2011
2012

58 Annual Statistical Report 2010-11
Figure 3-3: MoE budget amount and total government budget, million Vatu (recurrent expenditure), 2000 – 2012
Source: MoE, Government Finance System, Budget Appropriation 2012. Note 2012 based on budget estimates; all other years are actual expenditure.
Figure 3-4: Total education expenditure (Government and Donor) as a percent of GDP, 2010 - 2012
Source: MoE, Government Finance System Budget Appropriation 2012.
3.1.2. Government allocation Figure 3-5: MoE recurrent expenditure: budget and actual (million Vatu)
Source: MoE, Government Finance System Budget Appropriation 2012.
1,812 1,976 2,040 2,074 1,970 1,915 2,395 3,118 3,185 3,210 3,724 3,858 3,894
7,624 7,354 7,801 7,033 7,322 8,062
8,954
12,154 12,313 13,572
15,348 15,118 14,861
-
2,000
4,000
6,000
8,000
10,000
12,000
14,000
16,000
18,000
2000 2001 2002 2003 2004 2005 2006 2007 2008 2009 2010 2011 2012
MoE Budget Government Budget
8.9% 8.7% 8.3%
0% 1% 2% 3% 4% 5% 6% 7% 8% 9%
10%
2010 2011 2012
1,8
12
1,9
54
2,0
56
2,0
69
1,9
75
1,9
16
2,3
90 3,1
56
3,2
27
3,2
59
3,6
92
3,8
29
- 500
1,000 1,500 2,000 2,500 3,000 3,500 4,000 4,500
2000
2001
2002
2003
2004
2005
2006
2007
2008
2009
2010
2011
2012
Actual Expenditure MoE Budget

59 Annual Statistical Report 2010-11
Republic of Vanuatu
3.1.3. Donor partner allocation Since 2010 the MoE has received on average 1.5 billion Vatu in funds from numerous development partners, including Australia, New Zealand, and the United Nations. A considerable proportion of this funding is earmarked for VERM activities.
Figure 3-6: VERM expenditure grouped by main activity, 2010
Source: MoE, 2012
Figure 3-7: VERM expenditure grouped by main activity, 2011
Source: MoE, 2012
100 28
6
20
24
7 0 14
2
VERM
exp
endi
ture
Ope
ratin
g gr
ant
Sala
ry, a
llow
ance
s, w
ages
, fee
s,
trav
el
Tran
spor
t & c
omm
unic
atio
ns
Mat
eria
ls, st
atio
nery
Equi
pmen
t, fu
rnitu
re
Build
ing,
repa
ir &
mai
nten
ance
Wor
ksho
ps &
trai
ning
Oth
er
100
55
8 9
10 3
0 12 4
VERM
exp
endi
ture
Ope
ratin
g gr
ant
Sala
ry, a
llow
ance
s, w
ages
, fee
s,
trav
el
Tran
spor
t & co
mm
unic
atio
ns
Mat
eria
ls, st
atio
nery
Equi
pmen
t, fu
rnitu
re
Build
ing,
repa
ir &
mai
nten
ance
Wor
ksho
ps &
trai
ning
Oth
er

60 Annual Statistical Report 2010-11
3.1.4. Unit costs of education Table 3-8: Expenditure, enrolment and expenditure per student in government funded and assisted schools, 2011
School level 2011 Actual Expenditure
Enrolment (Govt and
Govt Assisted Schools)
Expenditure per student
ECE 1,903,439 11601 164
Primary 1-6 2,042,949,095 40328 50,658
Secondary 1,249,202,527 17019 73,400
Post-Secondary 203,656,061 1,009 201,840
Scholarships 333,954,014 593 563,160 Source: Ministry of Education Department of Finance. Note * Enrolment is in Government funded/assisted schools only and grouped by school type not level.

61 Annual Statistical Report 2010-11
Republic of Vanuatu
Annex 1: 2011 Annual School Survey and VEMIS data
Relevant Indicators for MoE monitoring and evaluation: Indicator 2007 2008 2009 2010 2011 Percentage of schools returning forms
ECE Primary Secondary
82.3% 95%
92.7%
72.3% 96.7% 98.8%
79.5% 97.5% 96.6%
80.4% 96.8% 92.9%
86.6% 98.9% 93.1%
Percentage of enrolment estimated ECE Primary (Year 1 – 6) Secondary (Year 7+)
18% 5% 7%
28% 3% 1%
21% 3% 3%
20% 3% 7%
13% 1% 7%
Source: VEMIS, 2011.
Annual School Survey Process The data compiled in this Annual Statistical Report has been captured through an annual census of every early-childhood education (ECE) centre, primary and secondary school throughout Vanuatu. The Annual VEMIS School Survey is a vital source of information for planning, policy making and budgeting. The School Survey Process, which incorporates aspects of data collection, data validation and auditing, data analysis and reporting to stakeholders, has been carried out according to the steps illustrated in the following diagram:
Annex 1, Figure 1: Annual School Survey Process
The 2010 and 2011 school surveys were successful data collections, providing a wide range of essential data that will be used as a factual base for the planning, decision making and financial estimates within the MoE and for stakeholders. VEMIS can be used to facilitate the monitoring and evaluation of VERM activities and progress towards VESS and PAA targets.
PLAN• Census
Process Timeline
• Roles and Responsibilities
PREPARE
• Hard copy andelectronic survey forms
• Additional Materials DISTRIBUTE
• Forms to schools• Additional
Materialsto Schools
SURVEY• Schools Head to
complete their Survey forms
• School Head to check the SurveyForms with the Class teachers
SURVEY SUBMISSION
CENSUS DATEDate that all schools will
report on their school enrolment
• School head/principal to send their VEMIS form to the PEO
• PEOs to send the school survey formto MoE after Checking them
AUDIT• Data Entry
coverage• Data Quality
selected schools
PUBLISH
• Ad Hoc Analysis• Standard reports• Specialized studies
DESSIMINATE
• Provide VEMIS data to all stakeholders
• Reports throughout MoE• Reports to VMAC
REVIEW• Survey Process Efficiency• Survey Content and
relevance• Report Quality • Stakeholder feedback

62 Annual Statistical Report 2010-11
The annual school survey timeline starts in November of the previous year and finishes in March of the current year.
Annex 1, Figure 2: Annual School Survey Timeline (end dates for each major activity)
The VEMIS team spend considerable time ensuring that all school heads and principals have completed and submitted their VEMIS forms on time.
Annual School Survey Response Rates and Data Quality Measures In 2011, 953 registered education providers from ECE to secondary level provided the enrolment information requested in the Annual School Survey and 101 or 10% did not. Of the non-responding schools 86% or 87 were ECE centres, 10 were primary schools and 4 were secondary schools.
Schools which do not provide the completed survey form to the MoE by 30th March 2011 are considered not to have submitted their forms on time. Schools which do not provide a completed questionnaire by 30th May 2011 are estimated in VEMIS until the school survey data can be obtained.
Response rates for schools Annex 1, Table 1: Survey Return Rates by School Type and Province, 2010 – 2011
2010 2011
ECE Primary* Secondary# ECE Primary* Secondary#
Province No. sent % rec’d No. sent % rec’d No.
sent %
rec’d No.
sent %
rec’d No.
sent %
rec’d No.
sent %
rec’d
Torba 37 95% 23 100% 3 100% 36 100% 25 100% 3 100% Sanma 187 82% 91 100% 16 100% 146 90% 98 100% 15 100% Penama 62 87% 64 100% 10 100% 79 73% 63 100% 12 100% Malampa 105 74% 88 97% 16 100% 108 87% 90 99% 14 100% Shefa 90 64% 82 88% 25 80% 76 89% 83 96% 25 88% Tafea 86 95% 80 98% 14 93% 101 98% 75 100% 13 100% Total 567 81% 428 96% 84 93% 546 89% 434 99% 82 96%
Source: MoE VEMIS, 2011. *Primary schools include some schools which offer Year 7 and Year 8 but are classified as primary school. #Secondary schools include some technical training centres which offer courses from Year 11 level such as Lowanaton in Tanna.
In both 2010 and 2011 Shefa province had the worst VEMIS survey response rates of every province with the exception of ECE centres in Penama. In 2011 all registered education providers in Torba province completed VEMIS survey forms; and while there is a relatively low number of registered schools in Torba these are spread over a large area. The MoE should follow up to see how the high survey response rates in Torba could be replicated in other provinces.
Q'aires printed
Q'aires sent to PEOs
PEOs distribute q'aires to schools
PEOs/ ZCAs assist schools complete q'aires
PEOs receive completed q'aires
Q'aires returned to Vila
Data entry
Outlier editing
Imputation of non-responding schools
VEMIS database finalised
Annual statistical report produced
Nov-11 Dec-11 Jan-12 Feb-12 Mar-12 Apr-12 May-12 Jun-12 Jul-12 Aug-12 Sep-12 Oct-12 Nov-12 Dec-12 Jan-13
Annual School Survey Key Dates

63 Annual Statistical Report 2010-11
Republic of Vanuatu
Figure 0-1: Survey Return Rates for ECE Schools, 2007 – 2011
Source: MoE VEMIS, 2011
The graph of the proportion of surveys returned on time for ECE shows that there is a major concern with the timely completion of annual school survey forms by ECEs and that the Ministry of Education and the provincial preschool coordinators offices have to find ways to improve the percentage of survey returns on time. The VEMIS team work collaboratively with the provincial preschool coordinators on ECE school data collection. Ministry of Education working closely with preschool coordinators has shown positive results in terms of VEMIS school survey returns each year in terms of the overall response rate which has increased from 81% in 2010 to 89% in 2011; but the survey forms are not being received on time and considerable follow up and assistance is required.
Figure 0-2: Survey Return Rates for Primary Schools, 2007 – 2011
Source: MoE VEMIS, 2011
At primary level, the proportion of received primary VEMIS forms increased significantly to 99% in 2011; schools must complete the survey before the annual school grant is made available. Again the challenge is for primary schools to submit their completed forms in a timely manner, with only 4% sending their forms by the specified date.
86%
73%
80%
81%
89%
13%
14%
21%
10%
4%
0% 10% 20% 30% 40% 50% 60% 70% 80% 90% 100%
2007
2008
2009
2010
2011
% received on Time % Received
94%
97%
97%
96%
99%
37%
25%
25%
24%
4%
0% 10% 20% 30% 40% 50% 60% 70% 80% 90% 100%
2007
2008
2009
2010
2011
% Received on Time % Received

64 Annual Statistical Report 2010-11
88
99
96
12
1
4
0 20 40 60 80 100
2011 Actual 2011 Estimate
Figure 0-3: Survey Return Rates for Secondary Schools, 2007 – 2011
Source: MoE VEMIS, 2011
A secondary level, the proportion of received VEMIS survey forms has exceeded 90% each year. In 2011, 4% of secondary schools did not submit their VEMIS. These are mainly private schools. In response, a memo was sent by the MoE reminding these schools of their requirements of the Education Act 2001 which obliges schools to provide their school information as requested by the MoE regardless of whether the school is registered or not.
After all attempts to obtain the completed forms fail the school’s information is estimated. Estimation involves duplicating the previous year’s information in VEMIS. It is important to note that the missing information and the estimation of this in the annual school survey do not affect the results when calculating official national statistics about enrolment rates, ratios of students, teachers and materials as well as teacher characteristics in the ECE, primary and secondary parts of the education system. This is because the proportion of estimation is very low and the estimation does not have an impact on the derived indicators.
Actual: Schools that have completed and submitted their VEMIS forms for the current year in time. Estimate: Schools that have not submitted their VEMIS forms in the current year and VEMIS system is
carrying forward the school data from the previous year.
Figure 0-4: % of actual and estimated schools in VEMIS, 2010-2011
Source: MoE VEMIS, 2011
92%
98%
98%
93%
96%
19%
17%
29%
13%
1%
0% 10% 20% 30% 40% 50% 60% 70% 80% 90% 100%
2007
2008
2009
2010
2011
% Received on Time % Received
78
96
93
22
4
7
0 20 40 60 80 100
ECE
Primary
Secondary
2010 Actual 2010 Estimate

65 Annual Statistical Report 2010-11
Republic of Vanuatu
In 2010, VEMIS recorded a total of 1,071 schools in Vanuatu of which 952 submitted their VEMIS forms and 119 did not. Where a school did not complete a return estimates were entered into VEMIS. Figure 3 shows great improvement in the use of actual school data in 2011; and the rates of 2010 and 2011 are much higher than those of 2009. The proportion of actual data provided by the schools has increased for each school type in 2011 compared to 2010. The information about schools contained in this report is from 99% of primary schools providing actual data and 96% of secondary schools.
At ECE level, there is significant drop in the proportion of estimated schools in 2011 compared to 2010. The annual school survey process in VEMIS shows that there has been considerable progress on ECE school survey returns in 2011; while these might not be received in a timely manner ECEs are providing the information.
Response rates for enrolment The overall rates of estimation for enrolment decreased in 2011 to the lowest levels since VEMIS began in 2007, which also means that response rates in 2011 were the highest on record.
Annex 1, Table 2: Enrolment Response Rates by School Type and Province, 2010 – 2011
2010 2011
ECE Primary* Secondary# ECE Primary* Secondary#
Province Students % est’d Students % est’d Students %
est’d Students %
est’d Students %
est’d Students %
est’d
Torba 509 3% 1,947 0% 196 0% 564 0% 1,960 0% 242 0% Sanma 3,147 11% 9,965 0% 2,098 0% 2,842 3% 10,273 0% 2,079 0% Penama 1,096 9% 6,710 0% 1,401 0% 1,465 10% 6,795 1% 1,242 0% Malampa 1,624 12% 8,306 1% 1,206 0% 1,670 8% 8,369 2% 1,132 2% Shefa 3,125 9% 13,414 3% 4,620 4% 2,922 7% 13,955 1% 4,331 3% Tafea 1,823 1% 9,239 1% 979 1% 2,167 2% 9,005 0% 1,110 0% Total 11,324 8% 49,581 1% 10,500 2% 11,630 5% 50,357 1% 10,136 1%
Source: MoE VEMIS, 2011. % est’d is the proportion of students which were estimated of the total students expressed as a percent. *Primary schools include some schools which offer Year 7 and Year 8 but are classified as primary school. #Secondary schools include some technical training centres which offer courses from Year 11 level such as Lowanaton in Tanna.
Figure 0-5: School type and % of estimated and actual enrolment in VEMIS, 2010-2011
Source: MoE VEMIS, 2011
In 2010, 93% of school enrolment was based on returned survey forms and 7% of school enrolment was estimated. In 2011, 97% of school enrolment was actual figures and 3% of school enrolment was estimated.
92%
99%
98%
95%
99%
99%
8%
1%
2%
5%
1%
1%
0% 20% 40% 60% 80% 100%
ECE
Primary
Secondary
ECE
Primary
Secondary
2010
20
11
Actual Estimate

66 Annual Statistical Report 2010-11
Annex 1, Table 3: Enrolment by year level and age of student, 2011
Enrolment
Age ECE Year 1 Year 2 Year 3 Year 4 Year 5 Year 6 Year 7 Year 8 Year 9 Year 10 Year 11 Year 12 Year 13 Year 14 Total
3 1,496
1,496
4 2,887 2,887
5 3,690 464 9 6 4,169
6 2,500 2,491 279 4 2 2 5,278
7 747 3,264 1,560 193 12 6 5,782
8 174 1,758 2,549 1,217 207 15 12 5,932
9 56 653 1,901 2,060 1,042 178 23 5,913
10 51 201 1,036 1,735 1,862 906 244 10 6,045
11 88 411 1,155 1,717 1,732 836 188 17 6,144
12 22 98 550 1,147 1,564 1,604 942 199 5 6,131
13 7 41 177 474 973 1,411 1,414 807 107 16 5,427
14 8 16 74 177 467 839 917 1,182 664 118 3 4,465
15 7 22 68 126 378 503 879 1,258 682 111 1 4,035
16 1 3 12 21 49 118 191 380 816 1,170 496 104 2 3,363
17 1 7 15 27 38 129 232 521 675 460 62 1 2,168
18 1 1 2 6 10 19 41 71 162 332 544 240 13 1,442
19 2 3 18 44 128 272 202 34 703
20
3 4 16 90 131 95 58 397
21
3 2 2 16 48 38 20 129
22
1 14 29 38 24 106
23
5 5
Total 1,1601 8,957 7,911 7,207 6,738 6,037 5,502 4,224 3,645 3,177 2,732 1865 1,589 677 155 72,017 Source: MoE VEMIS data. The shaded cells show enrolment at the official age for the grade.

67 Annual Statistical Report 2010-11
Republic of Vanuatu
Response rates for teachers In 2011, 1,060 schools provided the teacher information requested in the Annual School Survey. Of these 7% provided partially complete information about teachers.
Annex 1, Table 4: Teacher Response Rates by School Type and Province, 2010 – 2011
2010 2011
ECE Primary* Secondary# ECE Primary* Secondary#
Province Teachers % est’d Teachers % est’d Teachers %
est’d Teachers %
est’d Teachers %
est’d Teachers %
est’d
Torba 52 0% 91 0% 0 0% 52 0% 93 0% 15 0% Sanma 214 10% 392 0% 15 3% 184 2% 377 0% 151 0% Penama 101 19% 316 0% 177 0% 108 0% 286 0% 101 0% Malampa 133 16% 366 1% 109 6% 153 8% 373 0% 102 0% Shefa 116 25% 370 0% 125 14% 108 2% 472 1% 366 16% Tafea 112 5% 322 0% 285 0% 114 0% 329 0% 96 0% Total 728 13% 1,857 0% 92 6% 719 2% 1,930 0% 831 6%
Source: MoE VEMIS, 2011. % est’d is the proportion of teachers which were estimated of the total teachers expressed as a percent (full and part time teachers included). *Primary schools include some schools which offer Year 7 and Year 8 but are classified as primary school. #Secondary schools include some technical training centres which offer courses from Year 11 level such as Lowanaton in Tanna.
Figure 0-6: School type and % of estimated and actual Number of Teachers, 2010-2011
Source: MoE VEMIS, 2011
In terms of the statistical information in VEMIS about teachers, in 2010 92% was based on returns and 8% was estimated teacher data. In 2011, 95% of teacher data was actual figures and 5% estimated teacher data.
Table 5 following shows the number of absentees on the Census Day which is 21st March each year. The section on student absenteeism was removed from the VEMIS survey form in 2010 and 2011 because the compilation of this information was delaying the completion of the survey. The number of absentees has been slowly reducing since 2007. The percentage of absentees during the Census date (21st March) in 2009 was 6%.
87%
100%
94%
98%
100%
94%
13%
0%
6%
2%
0%
6%
0% 20% 40% 60% 80% 100%
ECE
Primary
Secondary
ECE
Primary
Secondary
2011
20
10
Actual Estimate
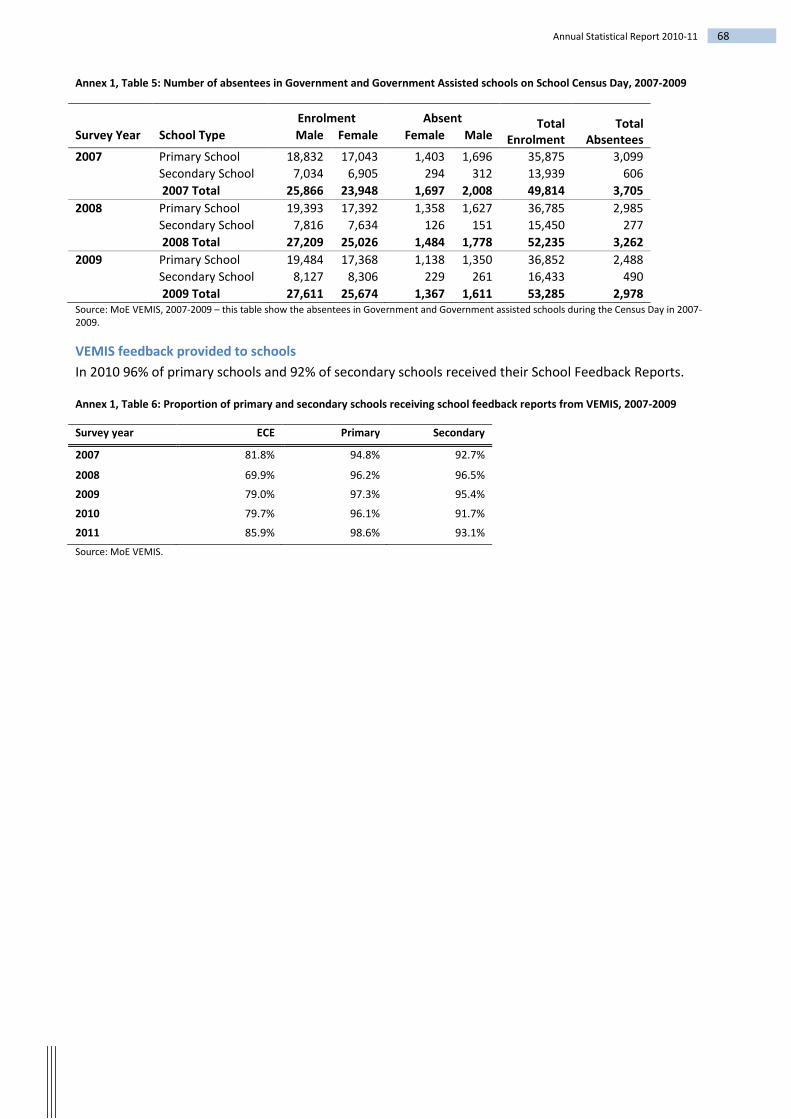
68 Annual Statistical Report 2010-11
Annex 1, Table 5: Number of absentees in Government and Government Assisted schools on School Census Day, 2007-2009
Enrolment Absent Total Enrolment
Total Absentees Survey Year School Type Male Female Female Male
2007 Primary School 18,832 17,043 1,403 1,696 35,875 3,099 Secondary School 7,034 6,905 294 312 13,939 606 2007 Total 25,866 23,948 1,697 2,008 49,814 3,705 2008 Primary School 19,393 17,392 1,358 1,627 36,785 2,985 Secondary School 7,816 7,634 126 151 15,450 277 2008 Total 27,209 25,026 1,484 1,778 52,235 3,262 2009 Primary School 19,484 17,368 1,138 1,350 36,852 2,488 Secondary School 8,127 8,306 229 261 16,433 490 2009 Total 27,611 25,674 1,367 1,611 53,285 2,978 Source: MoE VEMIS, 2007-2009 – this table show the absentees in Government and Government assisted schools during the Census Day in 2007-2009.
VEMIS feedback provided to schools In 2010 96% of primary schools and 92% of secondary schools received their School Feedback Reports.
Annex 1, Table 6: Proportion of primary and secondary schools receiving school feedback reports from VEMIS, 2007-2009
Survey year ECE Primary Secondary
2007 81.8% 94.8% 92.7%
2008 69.9% 96.2% 96.5%
2009 79.0% 97.3% 95.4%
2010 79.7% 96.1% 91.7%
2011 85.9% 98.6% 93.1% Source: MoE VEMIS.

November 2011
69 Annual Statistical Report 2010-11
Annex 2: Provincial enrolment, authority school level and name, 2010 – 2011
Province Authority Type Name Year
2010 2011 Torba Government of Vanuatu Primary Arep 71 100 Bagavegug 61 82 Ecole de Nelson 33 36 Ecole Primaire D'Arep 106 72 Losalava 158 186 Martin 49 51 Nergar 68 36 Pasalele 143 144 Robin Memorial 65 49 Sanlang 210 206 Santa Maria 104 116 Sarantar 62 57 Shelil 44 31 Shem Rolley 57 40 Tasvare 41 51 Telhei 191 168 Telvet 43 37 Vaes 41 39 Vaget 139 169 Wongyeskei 83 73 Wosok 60 48 Silva Memorial 92 71 Secondary Arep 116 128 College d'Arep 26 77 Government of Vanuatu Total 2,063 2,067 Church (Government Assisted) ECE Makebon Community 9 Primary N-T-C-U 7 Secondary Losolava Junior Secondary 54 77 Church (Government Assisted) Total 63 84 Private ECE Dolav 15 22 Doma 12 Island Rock Christian Kindy 12 17 Kamalna 13 Kerebeta 11 Leara Model Kindy 30 Lewes 15 Litaw 18 24 Namasary 11 Nemeng 12 Nergar 16 21 Nineye 17 Roul Memorial 14 Ruruw 12 Simon Esuva 14 Singerlap 15 Sonia 31 Taimaley 5 Tasvare 17 17 Telvet 10 12

70 Annual Statistical Report 2010-11
Province Authority Type Name Year
2010 2011 Vaes 12 Ventow 7 Johnter first 19 21 Mahi Kindy 4 9 Vatvaes Butiwial 9 9 Telhei Kindy 36 Nelson Kindy 12 Primary Island Rock Christian 26 24 Gnere Tuvuro 43 Private Total 206 438 Community ECE Arep Kindy 20 21 Doma 14 Kamalna 11 Kerebeta 11 Leara Model Kindy 22 Leonqe Kindy 14 13 Lewes 17 Namasary 11 Pasalele Kindy 20 14 Roul Memorial 15 Ruruw 16 Sarantar 11 Simon Esuva 14 Singerlap 19 Taimaley 4 Toutamwat Home Base 10 18 Vaes 11 Ventow 8 Wongyeskei 29 32 Sola 19 11 Atkor 6 5 Nepek 7 Robin 6 16 Vaget Kindy 16 21 Losalava Kindy 6 Santa-Maria 25 Community Total 320 193 Sanma Government of Vanuatu ECE Beytolier 7 Primary Luganville Est 200 230 Santo East 441 477 Sarakata 288 288 Dombulu 138 131 Alowaru 62 55 Avunatari 165 114 Banaviti 60 59 Kitacu 35 34 Balon 74 61 Ban Ban 252 284 Belmol 34 Butmas 52 57 Dambulu 48 27 Day Spring 68 73 St. Jacques 81 81 Ebenezer 293 257 Hog Harbour 130 112

November 2011
71 Annual Statistical Report 2010-11
Province Authority Type Name Year
2010 2011 Ian Livo 35 46 Iethvekar 88 73 Jinaure 137 103 John Noble Mackenzie 82 79 Jordan Valley 24 21 Kamewa English 453 473 Lathi 31 37 Lehilehina 27 28 Lorethiakarkar 57 45 Malao 59 63 Menevula 129 140 Merap St Augustin 54 53 Mwast 49 71 Najaraiwelu 76 Nandiutu 147 43 Nasalanvunmoli 98 124 Natawa 147 174 Navele 97 139 Naviaru 52 47 Paireve Primary 31 16 Pialulup 184 168 Piamatsina 32 29 Saletui 194 176 Sara 87 100 Selusia 95 83 Sulemauri 41 40 Taharo 30 38 Tata 212 258 Tiasia 65 71 Tiqutug 14 Vovlei 121 119 Vunabulu 33 30 Kamewa 334 357 Bernier Bay 50 61 Notre Dame de Lourde Vilvil 87 Limarua 91 110 Merei (Mamara) 196 154 Nanuhu (Randasi) 110 103 Ambakura 40 Ebenezer french 46 Secondary Santo East 288 300 Collège de Luganville 435 377 Hog Harbour 174 182 Matevulu College 403 408 Tata Secondary 180 180 Nandiutu English 60 134 Menevula Junior Secondary 75 93 Government of Vanuatu Total 7,695 7,969 Church (Government Assisted) ECE Holoholo Forestry 14 Natchara 10 16 NTM 10 Ravutia 10 Santo Christian Kindy 11 14 Tasmalum 21 13 Parker Kindy 9 Bareo NTCU 6 Noka Kindy 14 Primary Amabelau/Mati 82 107

72 Annual Statistical Report 2010-11
Province Authority Type Name Year
2010 2011 Ipayato 77 81 Lorovuilko Anglican Community 80 74 Malores 53 82 Marua 45 47 Mataloi 99 95 Namoru 130 112 Neil Thomas Christian University Luganville 33 29 Okoro/St. Pierre 132 170 Parker 18 17 Pesena/St. Joseph 39 44 Porema 19 28 Port Olry/St. Anne 233 233 Rowok/St. Joseph 103 98 Sacre Coeur de Fanafo 324 271 Sakau Primary 25 23 Santo Christian 16 9 Sarakata SDA 173 149 St. Michel Luganville 105 118 Ste Therese Luganville 509 492 Tarvalapa 26 Tasmalum 144 129 Tavumae 93 78 Tcharanavusvus 81 75 Tolomako Primaire 83 89 Valabei 28 28 Venie Mataipevu 58 61 Visio N.T.C.U 6 6 Vunakariakara 12 9 Vusfongo Junior M. 38 41 Vusiroro 56 55 St Banabas 40 75 Lemesie (lape/Paparama) 16 Antioch 27 Zion 32 Pareo NTCU 13 Secondary Aore Adventist Academy 280 312 College de St. Anne 157 164 College de St. Michel 293 288 Moli Valivu 144 146 Santo Christian 25 20 Church (Government Assisted) Total 3,918 4,032 Church (Not Government Assisted) Primary Luganville Covernant Community 17 16 Rowhani 118 109 Secondary Luganville Covernant Community College 13 2 Rowhani JSS 93 100 Church (Not Government Assisted) Total 241 227 Private ECE Urotano 19 18 Akirio 13 12 Alo 12 Ambanga 9 Amnie 6 7 Anne Marie Kindy 36 33 Araki Komuniti 8 15 Asula 11 12 Avunamalai 18 14 Avunatari 18 22

November 2011
73 Annual Statistical Report 2010-11
Province Authority Type Name Year
2010 2011 B.P. Bon 25 25 Banaviti 26 13 Kitacu 11 Balon 45 41 Ban Ban 37 54 Beniam 23 Bosahe (Barakel) 8 Buluiana 20 22 Butmas 21 10 Daudumania 15 10 De Quiros 6 7 Hokua 10 Jaranvusvus 18 18 Jardin d'enforts de Pessena 9 Jinaure 9 Joajory 8 Jorden Valley 9 15 Kaliro 17 23 Kamewa - Franis 44 44 Kamewa -Inglis 49 56 Kom'ese(Namoru) 22 21 Koroia 10 10 Lathi 6 17 Lolorai 17 13 Lorethiakarkar 4 12 Lorevulko 30 20 Malapo 19 11 Malsie 83 91 Maltape Kindy 21 27 Mango 24 23 Mariu Private 10 Marua 21 21 Matafanga 22 20 Mataloi 33 6 Maurie 17 15 Maval 14 Mbae Misio Loloran 9 24 Mikael Kindy 7 MolBoe 7 7 Najaraiwelu 14 14 Nakere 14 Nalvucai Vanua 7 7 Nandiutu 8 9 Nanuhu 12 15 Naseun 11 Nasulesule 15 Natawa Side River 19 35 Naviaru 21 23 Nokatovi 39 Nothinsi 8 21 Onne-Kara 10 10 Parisa Private Kindy 9 16 Pelmol Community Kindy 24 Pelvus 7 Petawata 5 5 Piasele 6 5 Piavot 15 16 Pipinis 21 34 Porema 4 7 Pump Station 40 37 Reveles 6 16 Rowhani 28 26
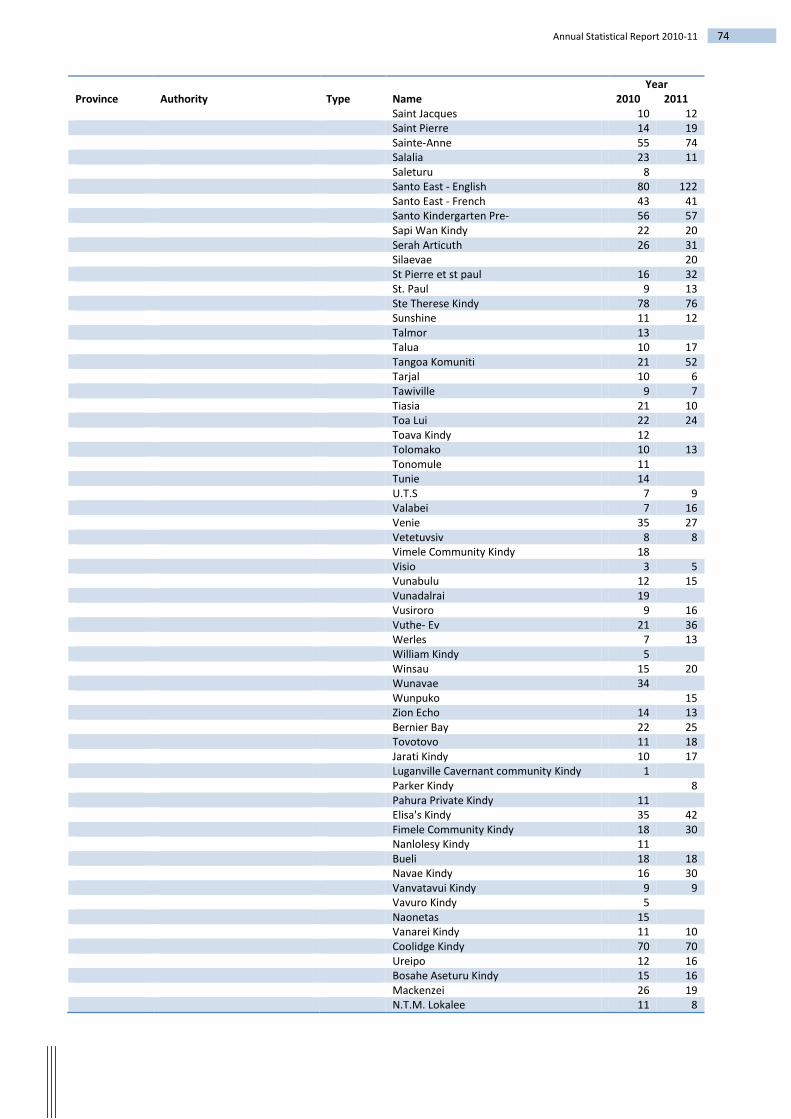
74 Annual Statistical Report 2010-11
Province Authority Type Name Year
2010 2011 Saint Jacques 10 12 Saint Pierre 14 19 Sainte-Anne 55 74 Salalia 23 11 Saleturu 8 Santo East - English 80 122 Santo East - French 43 41 Santo Kindergarten Pre- 56 57 Sapi Wan Kindy 22 20 Serah Articuth 26 31 Silaevae 20 St Pierre et st paul 16 32 St. Paul 9 13 Ste Therese Kindy 78 76 Sunshine 11 12 Talmor 13 Talua 10 17 Tangoa Komuniti 21 52 Tarjal 10 6 Tawiville 9 7 Tiasia 21 10 Toa Lui 22 24 Toava Kindy 12 Tolomako 10 13 Tonomule 11 Tunie 14 U.T.S 7 9 Valabei 7 16 Venie 35 27 Vetetuvsiv 8 8 Vimele Community Kindy 18 Visio 3 5 Vunabulu 12 15 Vunadalrai 19 Vusiroro 9 16 Vuthe- Ev 21 36 Werles 7 13 William Kindy 5 Winsau 15 20 Wunavae 34 Wunpuko 15 Zion Echo 14 13 Bernier Bay 22 25 Tovotovo 11 18 Jarati Kindy 10 17 Luganville Cavernant community Kindy 1 Parker Kindy 8 Pahura Private Kindy 11 Elisa's Kindy 35 42 Fimele Community Kindy 18 30 Nanlolesy Kindy 11 Bueli 18 18 Navae Kindy 16 30 Vanvatavui Kindy 9 9 Vavuro Kindy 5 Naonetas 15 Vanarei Kindy 11 10 Coolidge Kindy 70 70 Ureipo 12 16 Bosahe Aseturu Kindy 15 16 Mackenzei 26 19 N.T.M. Lokalee 11 8

November 2011
75 Annual Statistical Report 2010-11
Province Authority Type Name Year
2010 2011 Saint Joseph/Rowok 7 20 Bakapoda Kindy 12 Luganville adventise 16 Ravlepa Kindy 13 Tuhalai Kindy 14 Primary Belmol 37 Mataevura 9 4 Tovotovo Forestry Primary 117 38 Winsao 26 14 Secondary Bombua 63 57 Tamol-Vanua 18 Private Total 2,649 2,543 Community ECE Alowaru Kindy 19 31 Antioch Kindy 4 4 Aru Kindy 15 Baemisio Kindy 13 13 Bunuas 14 13 Dambulu 16 4 Ecole St Joseph 7 Fara Kindy 40 Foria Kindy 15 Hokua 10 Lape Pre- 3 2 Lekati 7 Merap St Augustin 10 20 Nasulesule 17 Nawalala 23 Nogugu 6 6 Nondra Tuetueri 11 Pango Private 9 Pelvus 7 Pialulup 10 Sakao 8 11 Silaevae 12 Tanoka 16 Tarvalapa 10 10 Torap Pre- 15 Vanco 14 24 Vovlei 12 12 Vunakariakara 16 11 Vunavosi 20 19 Vusfongo Model Kindy 10 10 Wailapa 10 Wunpuko 22 Vesalea Kindy 7 7 Sara Kindy 16 27 Lovenu Kindy 6 6 Pianarae Kindy 15 11 Veoa Kindy 24 Janraniko Kindy 7 Vipue Kindy 6 Taluere Kindy 18 36 Mataivura Kindy 7 7 Olmulteula Kindy 15 15 Fresh Water 5 Kerr Family 12 16 Belmol Kindy 17 13 Lolicth Kindy 6

76 Annual Statistical Report 2010-11
Province Authority Type Name Year
2010 2011 Piamatsina Kindy 10 17 Riro Kindy 4 14 Velei Kindy 23 Osten Kindy 7 6 Notre Dame de Lourde Vilvil 50 31 Primary De Quiros 31 56 Community Total 707 452 Penama Government of Vanuatu Primary Abanga 102 105 Abuanga 184 132 Aligu 74 89 Ambaebulu 151 142 Atavtabanga 212 222 Autabulu 40 61 bakanao 141 133 Bangabulu 109 74 Bwatnapni 124 137 Enkul 80 69 Gadue Garea 43 52 Gamalmaua 143 129 Gambule 168 189 Herenhala 121 139 Labultamata (Tamua) 55 45 Lesasanemal 76 67 Lini Memorial 165 165 Lolovoli 83 62 Naleleo 70 71 Nanivele 9 Naone 58 71 Naruah 75 61 Nasawa 106 96 Nduindui 176 175 Ngwalona 58 53 Pangi 193 176 PointCross 79 70 Qatuneala 136 98 Quatui 133 137 Quirutaro 81 57 Ranmawot 93 117 Ranwas 25 32 Raynold Memorial 110 139 Sarabulu 72 49 Simon 92 63 Sori Mauri 140 169 Sulua 143 140 Talai Roroi Leleo 32 35 Tanbok 132 114 Torlie 189 194 Vanmanla 65 79 Vanue Marama 89 102 Vilakalaka 60 52 Volovuhu 80 80 Vuingalato 78 94 Waisine 64 68 Walaha 121 120 Ala Memorial 155 129 Baitora 31 34 Secondary Ambaebulu 176 163

November 2011
77 Annual Statistical Report 2010-11
Province Authority Type Name Year
2010 2011 Bwatnapni Secondary 122 106 Gambule 78 79 Lini Memorial College 98 100 Vulumanu High 125 Government of Vanuatu Total 5,615 5,335 Church (Government Assisted) ECE Melsisi 33 Ubiku 37 Primary Baie-Barrier 94 105 Lalzadeth 68 89 Latano 97 109 Lolopuepue 81 75 Londar (Baie-Martelli) 74 86 Loone 92 75 Melsisi 183 177 Namaram 125 129 Nangire/St. J. Baptiste 71 53 Nataluhangele (Vatuhangele) 79 74 Rangsuksuk 105 110 Saint Henri 56 56 Tsimbwege 123 154 Ubiku 147 184 Secondary Londua 133 141 Melsisi 202 198 Navutiriki 53 Ranwadi High 370 325 St. Patrick's College 330 317 Tagaga 66 92 Penama Adventist Junior secondary 43 Church (Government Assisted) Total 2,496 2,715 Church (Not Government Assisted) ECE Natakaro 14 14 Church (Not Government Assisted) Total 14 14 Private ECE Agabe 21 22 Aligu 16 16 Atagurua 20 21 Aulu 20 26 Autabulu 16 18 Babutata 9 9 Daligao 17 Gamalmaua 31 32 Heren-Hala 13 13 Latano 32 40 Lenok 19 18 Lolkasai 52 26 Lolonqwalakesa 10 10 Lolopuepue 17 21 Lolosori 20 Lolovange 26 Lo-one 10 17 Lui 3 3 Magauwa Kindy 22 12 Nanivele 10 10 Naone 16 Ndui Ndui 9 15 Ngwalona Kindy 11

78 Annual Statistical Report 2010-11
Province Authority Type Name Year
2010 2011 Nonda 41 Panlimsi 25 30 PointCross 13 Ranbutor 7 Ranwas 17 12 Roronda 12 Saranagwelu 21 32 Susui 13 Tamua 27 27 Tarimule 36 25 Vanue-Marama 11 Vatbarai Kindy 18 38 Vatuanga 14 16 Vatuhangele 42 34 Vatukabani 20 33 Vilakalaka 12 Volovuhu 28 Walaha 17 26 Mahona 11 11 Lovatugato 13 13 Nambulu 6 6 Vatupopo 8 8 Lonfis Kindy 23 Vanmamla Model Kindy 19 Ranmawot Kindy 18 Saint Henri Kindy 21 Wali Kindy 14 Lon Gron Ske 18 Vansemakul kindy 6 Wanur Kindy 16 Londar 23 Avese Kindy 27 Rantengteng Private Kindy 10 Saint Pierre Chanel Kindy 7 Wujunmel Kindy 32 Ponra Model Kindy 11 Private Total 621 1,096 Community ECE Abanga 19 10 Daligao 12 Enkul 16 16 Halambulu 18 18 Lalzadeth 15 15 Lesasanemal 18 13 Limma Bulu 13 13 Lolovange 25 Melsisi 19 Naleleo 8 8 Naone 18 Nonda 27 PointCross 12 Ranbutor 12 Rangusoksu 30 40 Rogrere 6 6 Saratamata 17 17 Susui 7 Tambu Ala 24 30 Tavuiki 12 Ubiku 33 Vanue-Marama 17 Vilakalaka 20

November 2011
79 Annual Statistical Report 2010-11
Province Authority Type Name Year
2010 2011 Volovuhu 30 Vuiberuku 11 11 Wai Bulu 6 6 Welena 20 20 Tagui 14 17 Guguhi Community Kindy 27 Community Total 461 285 Malampa Government of Vanuatu Primary Amelvet 193 185 Aulua 202 215 Baie Caroline 78 88 Benbon 139 116 Brenwei 232 230 Bulemap 45 54 Daodobo 61 67 Fanla 59 59 Faralo 52 28 Kalwai 107 92 Kamai 106 153 Laindua 159 176 Lakatoro 148 156 Lalkoko 104 94 Lambumbu Bay 181 172 Lavalsal 52 Lehili 54 45 Leleut Primary 60 58 Leviamp 113 104 Lingarak 120 122 Liro 86 75 Lolibulo 55 52 Luvil 59 59 Luwoi 91 98 Magam 157 116 Matanvat 69 65 Mbossung 95 100 Megamone 50 51 Melworbank 67 62 Namaru 80 89 Neramb 175 189 Norsup 177 150 Pinapow 82 76 Port Vato 145 136 Ranon 106 110 Ransarie (Tembibi) 75 93 Roromai 53 57 Sanesup 120 100 Sangalai 218 219 Selusa 21 42 Senai 160 166 South West Bay 100 111 Tautu 201 171 Tisman 201 216 Topaen Community 40 Uripiv 61 75 Vanruru Primary 67 64 Vauleli 68 40 Vellow 87 84 Vinmavis 31 35 Vutekai 32 28 Wilak 26 12

80 Annual Statistical Report 2010-11
Province Authority Type Name Year
2010 2011 Wora 43 42 Wuro 107 106 Ransarie 52 47 Secondary Amelvet 33 Lakatoro 154 162 Norsup 215 229 Olal 63 64 Ranon 94 93 Rensarie 334 308 South West Bay 107 161 South Malekula 63 108 College de Lehili 34 34 Vaum JSS 111 125 Government of Vanuatu Total 6,690 6,674 Church (Government Assisted) ECE Atchin S.D.A Parker Kindy 21 21 Bonvor SDA 13 Dixon 16 9 Lonvert NTM University 9 8 Metoune 3 Notre Dame 19 25 Paamal 16 15 Saint Louise 15 25 Primary Atchin/St. Louis 94 112 Baiap Church 15 Benenaveth 34 25 Chenard 53 46 Craig Cove 36 36 Dixon 50 43 Fonteng 46 Jehovah Nissi 11 12 Lalinda 34 32 Lamap/St. Pierre Chanel 215 220 Lavalsal 64 Linbul 40 24 Malua Bay 92 Maranata 37 41 Melwe 20 Metune 57 46 Olal 154 159 Orap 114 97 Paamal 28 31 Pikayer 32 27 Rambeck 24 20 Sainte Therese de Mae 70 88 Sanesup SDA 5 Sessivi 110 116 Tobol 52 47 Unmet 216 245 Vao Ilot 294 262 Walarano/Notre Dame 317 314 Wiaru 25 22 Winn SDA Primary 26 30 Womul (Wemone) 29 39 Lonvert Primary 19 Secondary College de Lamap 58 83 Jehovah Nissi 10 8 Orap 104 97

November 2011
81 Annual Statistical Report 2010-11
Province Authority Type Name Year
2010 2011 Sessivi 103 99 Vao 130 132 Church (Government Assisted) Total 2,676 2,910 Private ECE Alma Wels 7 Amelatin 17 18 Amelvet 26 Benapo 14 12 Bulemap 8 7 Calvary 13 23 Caroline bay 17 Chenard 10 10 Endu 22 Fanla 8 8 Fanrereo 5 5 Felicy Kindy 15 18 Fonteng 7 9 Kamai 33 33 Lakatoro 41 41 Lalindah 9 L'auberge 19 17 Lavalsal 15 13 Lavi Kindy 8 9 Linbul 23 13 Lingarak 18 21 Liro Venekula 23 23 Litzlitz 13 Lolibulo 9 9 Malvakai Model Kindy 31 27 Matanvat 2 15 19 Mbossung 29 30 Metoune 7 Millip 11 17 Nal 23 25 Navai 8 23 Neramb 15 Netormalav 4 4 Norsup 34 21 Olal 19 16 Orap 22 14 Palu 6 6 Pam's Play Group (Moru) 15 20 Pao 6 5 Pikayer Kindy 8 8 Pinalum 11 26 Port Vato 29 38 Ranliwel 29 31 Ransarie Kindy 23 23 Rensari 19 Richard 15 13 Roromai 19 27 Rose de Lima 5 6 Sahuot 11 12 Sainte Patrick 11 21 Sainte Paul 28 28 Sanesup 31 31 Selusa 19 16 Sessivi 27 23 St Therese 22 21 Ste Jeanne D'arc 38 31 Tavie 4

82 Annual Statistical Report 2010-11
Province Authority Type Name Year
2010 2011 Tembibi 19 20 Tobol 15 73 Tokvanu 13 22 Toman 10 10 Travol 2 2 Uripiv 12 26 Vauleli 22 6 Velese 17 19 Vellow 13 22 Vinmavis 4 8 Vutekai 12 14 Wiaru 10 11 Willit 5 16 Winn 11 13 Womol 9 11 Wora 18 15 Vartavo 17 20 Fali craig-cove 11 7 Lulep 10 10 Sum Beam kindy 17 17 Leleut 13 13 Prekha 12 8 Luly 4 Moslim (Laindua) 25 Primary Lerawo 57 56 Malua Bay 78 Topaen Community 40 Lekan SDA 20 Private Total 1,349 1,411 Community ECE Amelvet 20 Bonvor SDA 12 Caroline bay 16 Endu 14 Faralo 14 Gallilee 17 14 Lalindah 10 Lembinween 12 24 Lonmel 45 Lutes 14 Metetwai 7 Molin 6 7 Nera 14 Neramb 34 Ranon 12 Rensari 29 Rory Komuniti 12 12 Rose de Lima 6 Saint Jacques 15 15 Sainte Rosaire 15 19 Sanesup 19 32 Tautu 28 21 Weawi 4 Wuro 11 10 Lulep Kindy 22 22 Luly 9 Moslim (Laindua) 29 Lorlow 10 Lelala 4 Lapo 11
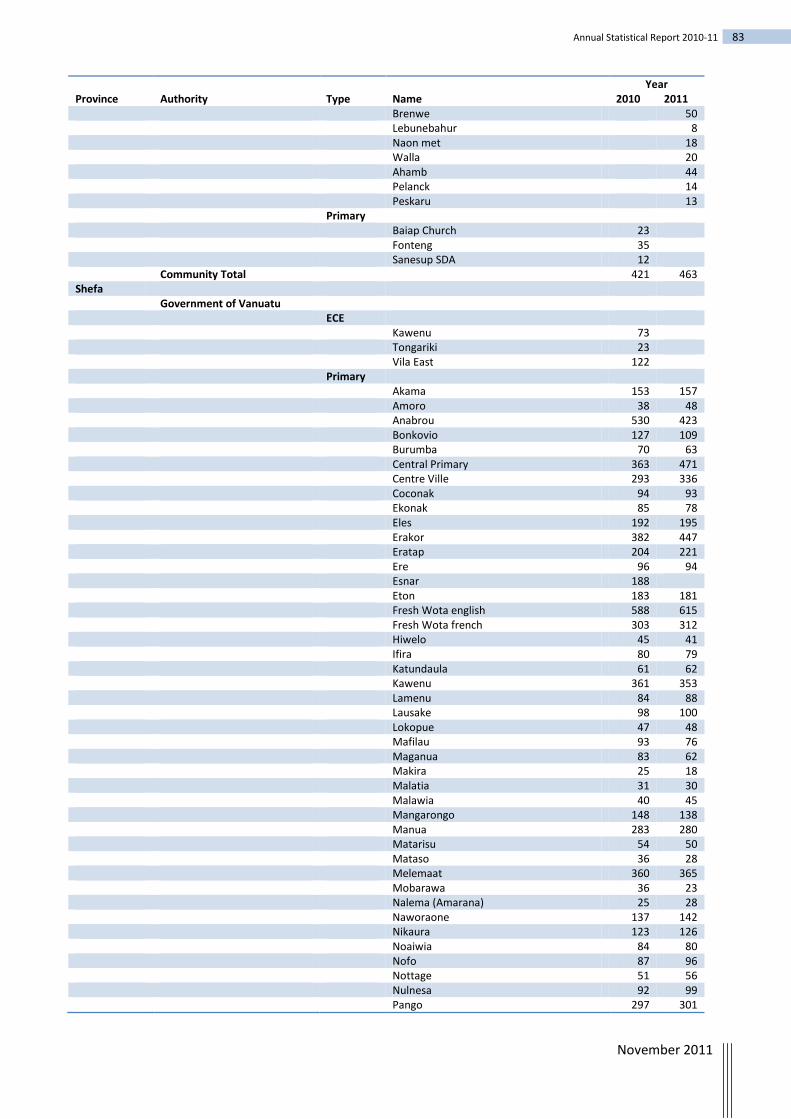
November 2011
83 Annual Statistical Report 2010-11
Province Authority Type Name Year
2010 2011 Brenwe 50 Lebunebahur 8 Naon met 18 Walla 20 Ahamb 44 Pelanck 14 Peskaru 13 Primary Baiap Church 23 Fonteng 35 Sanesup SDA 12 Community Total 421 463 Shefa Government of Vanuatu ECE Kawenu 73 Tongariki 23 Vila East 122 Primary Akama 153 157 Amoro 38 48 Anabrou 530 423 Bonkovio 127 109 Burumba 70 63 Central Primary 363 471 Centre Ville 293 336 Coconak 94 93 Ekonak 85 78 Eles 192 195 Erakor 382 447 Eratap 204 221 Ere 96 94 Esnar 188 Eton 183 181 Fresh Wota english 588 615 Fresh Wota french 303 312 Hiwelo 45 41 Ifira 80 79 Katundaula 61 62 Kawenu 361 353 Lamenu 84 88 Lausake 98 100 Lokopue 47 48 Mafilau 93 76 Maganua 83 62 Makira 25 18 Malatia 31 30 Malawia 40 45 Mangarongo 148 138 Manua 283 280 Matarisu 54 50 Mataso 36 28 Melemaat 360 365 Mobarawa 36 23 Nalema (Amarana) 25 28 Naworaone 137 142 Nikaura 123 126 Noaiwia 84 80 Nofo 87 96 Nottage 51 56 Nulnesa 92 99 Pango 297 301

84 Annual Statistical Report 2010-11
Province Authority Type Name Year
2010 2011 Roau 59 59 Sara 72 54 Senecol 30 24 Sikembo 136 137 Suango 284 297 Takara 62 61 Tangovawia 68 70 Tanoliu 80 82 Tasiriki 74 72 Vila East 655 636 Vila North 496 576 Worarana 55 56 Yevali 115 110 Ekipe 189 202 Ifira (Frn) 44 43 Itakuma 140 140 Secondary Burumba 12 63 Central Secondary 323 317 Ecole Centre Ville 222 215 Epi High 213 237 Ifira Junior Secondary 79 94 Lycée Louis Antoine de Bougainville 789 694 Malapoa College 549 602 Napangasale 136 113 Nofo 77 83 Port_Quimie 89 Vanuatu Institute of Technology 602 602 Vila North Junior Secondary 246 219 Ulei Junior Secondary 240 156 Government of Vanuatu Total 13,015 12,760 Church (Government Assisted) ECE NTM Kindy 24 Mele NTM (Zion Kindy) 50 NTCU 16 Primary Bethany christian 28 23 El Shaddai 50 50 Jehovah Jirej 30 55 Lagon II/St. Joseph 191 212 Neil Thomas Christian University 111 88 Olwie SDA Community 171 209 Ste Jeanne d'Arc Port Vila 555 677 Susana Mate 32 74 Tumaropa/Lakalaka 13 10 Vila No 2 SDA 296 220 Sea Side Community 107 148 Lonest (st Jean Marie Vianey Primaire) 105 115 Fokona SDA Primary 82 79 Mamau 96 Secondary Epauto SDA 240 282 Jehovah Jireh 18 40 NTM Christian University 109 125 Onesua Presbyterian College 335 356 Port_Quimie 92 Lycee de Montmartre 117 150 College de Montmarte 309 294 Church (Government Assisted) Total 3,015 3,369 Church (Not Government Assisted) ECE

November 2011
85 Annual Statistical Report 2010-11
Province Authority Type Name Year
2010 2011 Grace Baptist Kindy 44 Primary Grace Baptist Primary 66 95 Church (Not Government Assisted) Total 110 95 Private ECE Aim Yee 36 20 Akama 22 22 Annex Sacre Coeur 95 95 Bethany 10 7 Bongabonga 12 Bonkovio Presby 9 9 Cathedral-Sacre coeur 90 114 Central Kindy 100 143 Centre Ville 80 66 Child Care Centre 139 57 Ecole Maternelle d'Anabrou 107 107 Emua 23 27 Eratap Kindy 43 33 Esnar-Pango 30 Eton 34 35 Falimorruwo 17 14 Fokona 26 23 Freshwota 72 82 Freshwota French Kindy 39 Iasiru 17 Iraro 20 20 Kawenu 70 Linda Dwyer 47 47 Lupalea 11 12 Lykuky 28 29 Mafilau 21 19 Malvasi 12 16 Mangarisu 19 16 Marouwia 26 18 Matangi 18 21 Mele Community 71 68 Noaiwia 20 Ntaf 47 42 Nul Nessa 21 19 Olwi 31 58 Pango 48 28 Peter Pan 38 96 Sara 20 20 Senecol 12 12 Siliatae French 15 7 Sorovanga 35 30 St Josephs 36 Survival Kindy 46 57 Susana 22 22 Takara 16 22 Toatau 11 12 Tongariki 26 Utanlang 10 8 Vila East 93 Vila North 146 126 Vutivuti 21 15 Carol Private Kindy 16 Euta Kindy 9 12 Samasama Rainbow Kindy 26 35 Resilla Pre- & Childcare 39 19 Reggies Day Care 20 8

86 Annual Statistical Report 2010-11
Province Authority Type Name Year
2010 2011 Sunae Kindy 17 17 Mataso 12 10 BNJ Kindy 34 Bernie's Pre- 67 Malapau Kindy 14 Nawiana Kindy 29 19 Nalema Kindy 21 Utanlangi 16 Rongdal 16 Grace Baptise Kindy 42 Amaro 20 Primary Child Care Centre 243 258 Ecole Francaise 203 214 Peter Pan Grammar 121 102 Port Vila International 218 201 Vila City College 74 74 Port Vila Community Christian 135 Secondary Ecole Francaise 195 212 Port Vila International 103 67 Tebakor Secondary 372 153 Vila City College 136 136 Private Total 3,802 3,685 Community ECE Atulake Atae Kindy 10 Ere english 22 20 Fareavau 19 Ifira Bilingual Kindy 50 21 Kikilik kindergarten 36 Lonest 37 29 Malaliu 19 Matakitaki Kindy 12 Meriu 4 Natapau 30 Nikaura 13 13 St Josephs 34 Sunrise 22 22 Tasiriki 32 Tatura Lida k 12 17 Wahone 14 12 Onesua Kindy 12 5 Unakap Community Nguna Island 28 20 Seaside Community Kindy 72 70 Lamenu Kindy 23 26 Hiwelo Kindy 13 7 Port Vila International Kindy 61 25 Tanoliu Kindy 30 26 Mele NTM (Zion Kindy) 48 Tangovawia Kindy 17 Primary Sorovanga 149 95 Survival Community 271 415 Secondary Sorovanga Self-Support Comm. 95 107 Community Total 1,185 930 Not stated ECE Freshwota French Kindy 65 Nalema Kindy 21 Not stated Total 86

November 2011
87 Annual Statistical Report 2010-11
Province Authority Type Name Year
2010 2011 Tafea Government of Vanuatu Primary Analgauhat 125 125 Day Spring 114 134 Dillon's Bay 54 66 Dillon's Bay Primary 95 84 Eniou 132 119 Fetukai 241 230 Green Hill 205 196 Ietap 179 184 Imanaka 64 59 Iquaramanu 124 117 Irumori 88 89 Isaka 179 194 Isangel Francais 315 274 Isangel English 180 185 Ishia 117 117 Isla 73 King's Cross 108 123 Kwamera 171 176 Labongtaoua 28 41 Lamanaruan 100 96 Lamapruan 77 65 Lamkail 140 152 Lamnatou 133 122 Lapkit 73 80 Latun West 90 70 Launalang 205 170 Lenakel 170 178 Lenaken Francais 86 77 Louanuialu 41 114 Loukaru 122 101 Loukatai 160 147 Lounabil 43 43 Lounahunu 123 132 Lounapkiko 181 144 Lounipayeu 63 30 Lousula 21 26 Manuapen 84 99 Nafuti 25 Petros 91 94 Port Melou 70 53 Port Narvin 155 92 Port Patrick 27 21 Port Resolution 150 123 Tapisi 55 61 Tuhu 246 279 Umponielogi 52 82 Yapilmai 179 177 Yavenkula 208 129 Yenumakel 131 87 Lowieru 230 219 Dip Point Primary 130 128 Iwunmit English 147 128 Iwunmet Francais 34 24 Lenakel English 101 107 Secondary Collège de Tafea/ Lycee De Tafea 73 46 Ienaula 128 172 Ipota Junior High 49 74 Isangel 182 188

88 Annual Statistical Report 2010-11
Province Authority Type Name Year
2010 2011 Lenakel 265 334 Tafea College 172 155 Teruja 67 87 Ishia Secondary 87 86 Lowiepeng JS 156 Government of Vanuatu Total 7,558 7,461 Church (Government Assisted) ECE Ianawasu 21 Imaki Kindy 28 Lautapunga Kindy 30 12 Lowanatom 39 North Gate A B C Kindy 20 21 Enikis Kindy 5 Alofa Community christian 18 Primary Enkatalei 108 108 Ikakahak 92 124 Ikiti 149 148 Imafen 80 88 Imaki 109 121 Imaru 221 237 Ipekel 68 69 Itaku 41 54 Kamahau 77 48 Lamenaura 95 100 Lamlu 199 209 Lautapunga 42 49 Lenakel Community Christian 35 20 Loono 145 123 Lowanatom 149 150 North Gate Christian 75 60 Umej 57 53 Yanavateing 98 72 Entan-Vui Adventist 94 96 Alofa Primary 38 21 Lowenata SDA 47 Secondary Imaki 67 85 Kwataparen 121 175 Lenakel Community Christ. 19 15 Lowanatom 130 183 North Gate Christian 13 Church (Government Assisted) Total 2,432 2,539 Church (Not Government Assisted) ECE Arit Missionary Baptist 9 Primary Ielkis 32 Tabakau 30 Church (Not Government Assisted) Total 71 Private ECE ALM Port Narvin 28 Bethel 2 24 19 Bonkil 8 Day Sprink 16 20 Dillons Bay 39 31 Eniu 33 Enkatalei 42 25 Etukure 9 17 Fetukai 19

November 2011
89 Annual Statistical Report 2010-11
Province Authority Type Name Year
2010 2011 Hapina 6 12 Harbour View 40 Ianawasu 21 Ianmarei 12 12 Iatap 13 Ieruareng 12 16 Ikakahak 29 22 Ikurup 22 32 Imaio 44 Imaki Kindy 16 Imanaka 13 Imaru Kindy 40 40 Imoklen 14 Inapik 27 19 Isaka 27 Ishia Kindy 22 43 Isla 48 23 Iwinmit 25 21 Jamin 7 29 Kamahau 1 10 6 Karunanen Kindy 20 Laketam 19 Lamanaruan 23 Lamanuo 13 Lamkail Kindy 25 Lamlu 26 33 Lamnatou 33 13 Latun West Tanna 24 16 Launarei 36 Lawithal 24 Leaur 11 Lenaken 30 23 Lenang Komuniti 10 Letoupam 18 13 Loanialu 43 Lonaluilu 34 34 Loono 21 Lounahunu 26 Lounapayou 10 17 Loupukas Community 23 Lousula 13 Lowanatom 36 Makarah 22 23 Monuapun 24 26 Nongariri 11 Nowanagei 46 Port Resolution 16 Saint Pitres 13 8 Simeona 20 22 Tomosa 29 Tuhu 30 42 Umetch 16 Yanavateig 17 13 Yanumakel 17 22 Yapilmai 31 22 Yavenkula 34 28 Yenouhap 10 Enikis Kindy 30 Dick Comminuty Kindy 10 10 Lounakiamapen Kindy 15 Tennis Futuna Kindy 7 Tabenacle Kindy 14
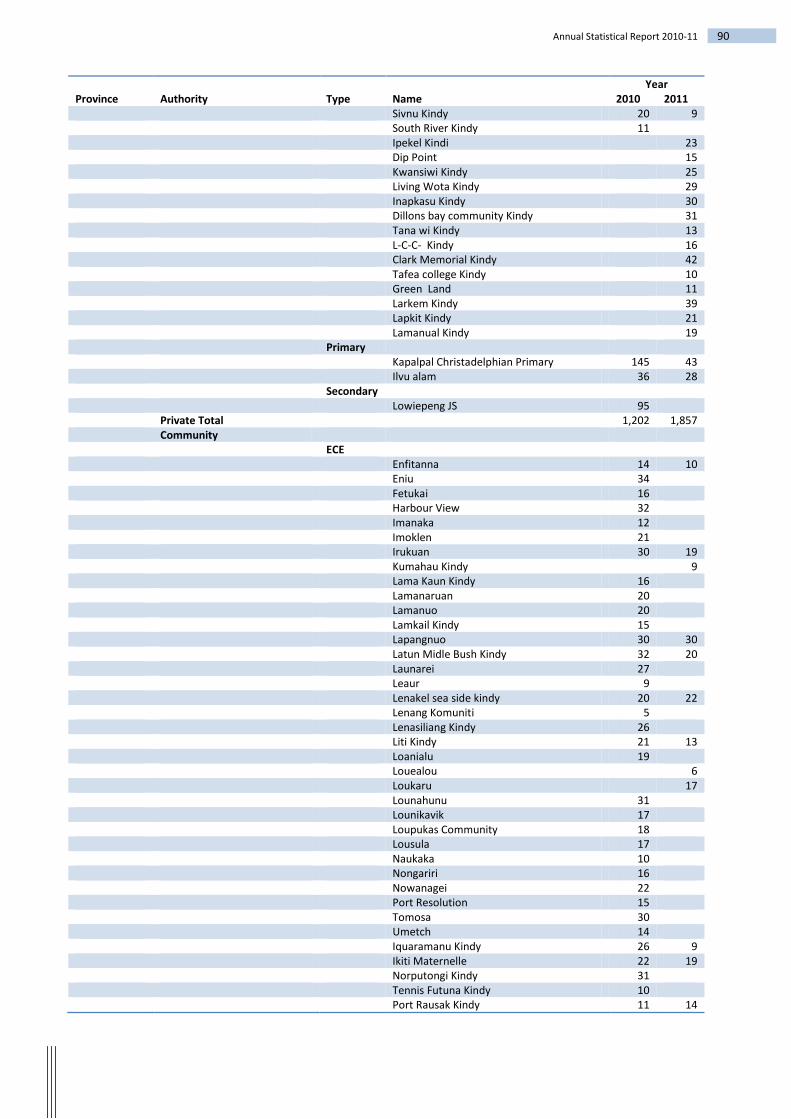
90 Annual Statistical Report 2010-11
Province Authority Type Name Year
2010 2011 Sivnu Kindy 20 9 South River Kindy 11 Ipekel Kindi 23 Dip Point 15 Kwansiwi Kindy 25 Living Wota Kindy 29 Inapkasu Kindy 30 Dillons bay community Kindy 31 Tana wi Kindy 13 L-C-C- Kindy 16 Clark Memorial Kindy 42 Tafea college Kindy 10 Green Land 11 Larkem Kindy 39 Lapkit Kindy 21 Lamanual Kindy 19 Primary Kapalpal Christadelphian Primary 145 43 Ilvu alam 36 28 Secondary Lowiepeng JS 95 Private Total 1,202 1,857 Community ECE Enfitanna 14 10 Eniu 34 Fetukai 16 Harbour View 32 Imanaka 12 Imoklen 21 Irukuan 30 19 Kumahau Kindy 9 Lama Kaun Kindy 16 Lamanaruan 20 Lamanuo 20 Lamkail Kindy 15 Lapangnuo 30 30 Latun Midle Bush Kindy 32 20 Launarei 27 Leaur 9 Lenakel sea side kindy 20 22 Lenang Komuniti 5 Lenasiliang Kindy 26 Liti Kindy 21 13 Loanialu 19 Louealou 6 Loukaru 17 Lounahunu 31 Lounikavik 17 Loupukas Community 18 Lousula 17 Naukaka 10 Nongariri 16 Nowanagei 22 Port Resolution 15 Tomosa 30 Umetch 14 Iquaramanu Kindy 26 9 Ikiti Maternelle 22 19 Norputongi Kindy 31 Tennis Futuna Kindy 10 Port Rausak Kindy 11 14

November 2011
91 Annual Statistical Report 2010-11
Province Authority Type Name Year
2010 2011 Isalkei Kindy 7 10 Imafen Kindy 40 Inapkasu Kindy 42 Community Total 758 238 Not stated ECE Norputongi Kindy 31 Lounakiamapen Kindy 20 South River Kindy 12 Not stated Total 63 Vanuatu Total 71,353 71,991


November 2011
93 Annual Statistical Report 2010-11
Abbreviations ECE Early Childhood Education /Pre-School
EFA Education for All
FBEAP Forum Basic Education Action Plan
GDP Gross Domestic Product
GER Gross Enrolment Ratio
GIR Gross Intake Rate
GoV Government of Vanuatu
GPI Gender Parity Index
JS Junior Secondary
MDG Millennium Development Goals
MoE Ministry of Education
NER Net Enrolment Ratio
NIR Net Intake Rate
PEO Provincial Education Office
PS/PRI Primary School
PSSC Pacific Senior Secondary Certificate
PTR Pupil Teacher Ratio
SS/SEC Secondary School
SWAp Sector Wide Approach
UNESCO United Nations Educational, Scientific and Cultural Organization
VEMIS Vanuatu Education Management Information System
VESAP Vanuatu Education Support Action Plan 2007 – 2009
VESS Vanuatu Education Sector Strategy 2007 – 2016
VERM Vanuatu Education Road Map
VIT Vanuatu Institute of Technology
VITE Vanuatu Institute of Teacher Education


November 2011
95 Annual Statistical Report 2010-11
Glossary Actual: Where actual data provided by the school head teacher or principal has been provided in VEMIS. See also Estimated.
Age participation rate: The percentage of enrolments at a specific level for children of a specific age, usually the official age for that level of schooling.
Basic Education Year 1 – Year 8: The MoE defines the basic cycle of education as consisting of Year 1 to Year 8.
Bi-lingual school: A school where students are divided into an English speaking stream and a French speaking stream.
Dropout rate: include definition of what is a drop out.
Dual language school: A school where students have a minimum of xx classroom hours in the English language and yyy in the French language.
ECE: the
Education Authority: the kind of entity under which the school is registered. There are four kinds: Government of Vanuatu; Church, Private and Community. Of these the schools registered under Church management are further categorised as those which receive Government funding and those which do not.
Estimate: Where VEMIS has estimated the response to a question using the previous year’s data.
GER: Total enrolment in a defined school level expressed as a percentage of the total population of children who are official age group for that level of schooling.
GIR: Total enrolment in a defined school level (for example Year 1) as a percentage of the total population of children who are of the official age group for that level of education (for example aged 6 years)
GPI: The female value for any indicator is divided by the male value to show the gender parity of the indicator with a value of 100 or very close to it indicating gender parity; a value over 100 indicating a difference in favour of females and a value less than 100 a difference in favour of males.
Junior Secondary Year 7 – Year 10: The MoE defines the junior secondary cycle of education as consisting of Year 7 to Year 10.
NER: Total enrolment of pupils of the official school age group as a percentage of the total population of children who are official age group for that level of schooling.
NIR: Total enrolment of pupils of the official age in a defined school level (for example Year 1) as a percentage of the total population of children who are of the official age group for that level of education (for example aged 6 years)

96 Annual Statistical Report 2010-11
Primary Education Year 1 – Year 6: The MoE defines the primary cycle of education as consisting of Year 1 to Year 6.
Primary School: The type of school as identified by the Head Teacher or Principal and as it is commonly known. Some primary schools, the so called ‘centre schools’ include classes up to Year 8 while others include classes to Year 6.
Promotion rate:
Province: Vanuatu is divided into six provinces which have provincial administration with some functions decentralised to the province. Three provinces contain municipal areas: the nation’s capital Port Vila is in Shefa province; Luganville municipality is in Sanma and Lenakel is in Tafea.
Repeater rate: include definition of what is a repeater.
SecondarySchool: The type of school as identified by the Head Teacher or Principal and as it is commonly known. Some secondary schools start from Year 7 (xxx schools) while others start from Year 11.
Senior Secondary Year 11 – Year 13 (14): The MoE defines the senior secondary cycle of education as consisting of Year 11 to Year 13 in English language schools and Year 11 – Year 14 in some French language schools.
Urban/Rural: The location of the school as defined by the school head teacher or principal. An urban school might in fact be outside the municipal boundary but considered to be urban.
VEMIS: The Vanuatu Education Management Information System (VEMIS) includes statistical data from 3 main data sources: the Annual School Survey, the results of Examinations and school financial information from the school cash flow statements.
Bislama: one of the three official languages of Vanuatu (the others being English and French) which is a pigeon English (with some French influence).
Basic education textbooks: These are textbooks used for the instruction of language, general science, mathematics and general studies in Year 1 to Year 6.