Annual Statistical Report
37
Annual Statistical Report 2016
Transcript of Annual Statistical Report
Annual Statistical Report
2016
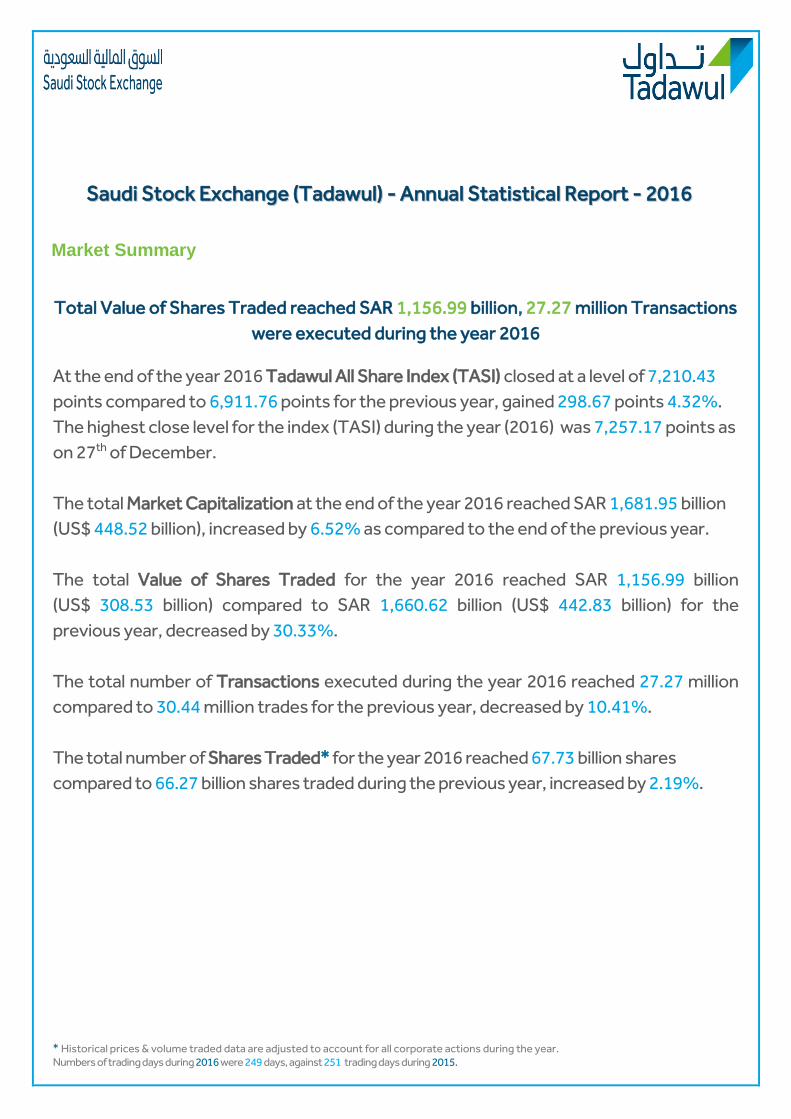
Total Value of Shares Traded reached SAR 1,156.99 billion, 27.27 million Transactions
were executed during the year 2016
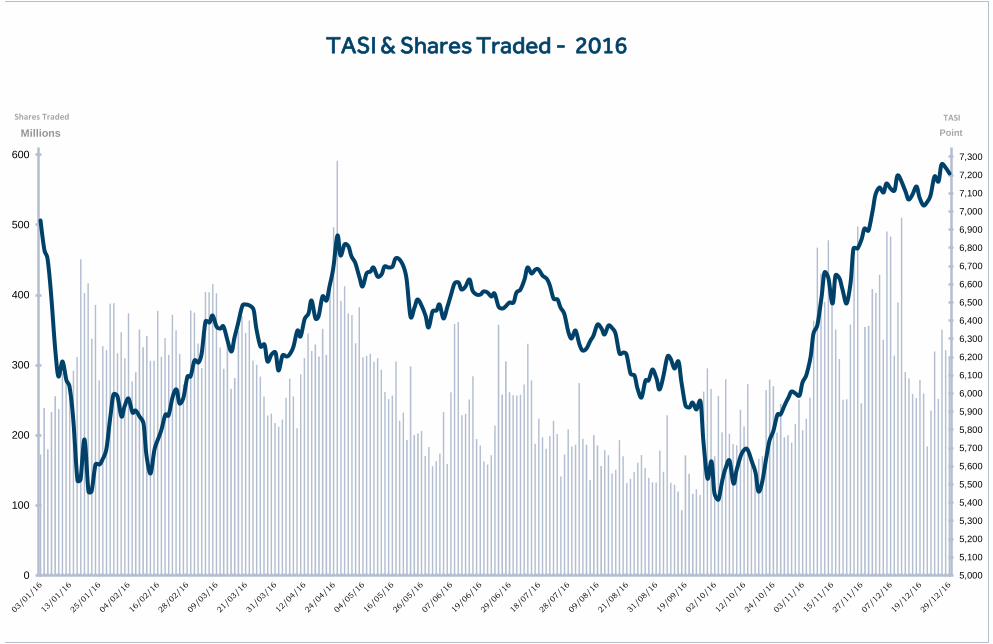
At the end of the year 2016 Tadawul All Share Index (TASI) closed at a level of 7,210.43
points compared to 6,911.76 points for the previous year, gained 298.67 points 4.32%.
The highest close level for the index (TASI) during the year (2016) was 7,257.17 points as
on 27th of December.
The total Market Capitalization at the end of the year 2016 reached SAR 1,681.95 billion
(US$ 448.52 billion), increased by 6.52% as compared to the end of the previous year.
The total Value of Shares Traded for the year 2016 reached SAR 1,156.99 billion
(US$ 308.53 billion) compared to SAR 1,660.62 billion (US$ 442.83 billion) for the
previous year, decreased by 30.33%.
The total number of Transactions executed during the year 2016 reached 27.27 million
compared to 30.44 million trades for the previous year, decreased by 10.41%.
The total number of Shares Traded* for the year 2016 reached 67.73 billion shares
compared to 66.27 billion shares traded during the previous year, increased by 2.19%.
* Historical prices & volume traded data are adjusted to account for all corporate actions during the year. Numbers of trading days during 2016 were 249 days, against 251 trading days during 2015.
SSaauuddii SSttoocckk EExxcchhaannggee ((TTaaddaawwuull)) -- AAnnnnuuaall SSttaattiissttiiccaall RReeppoorrtt -- 22001166
Market Summary
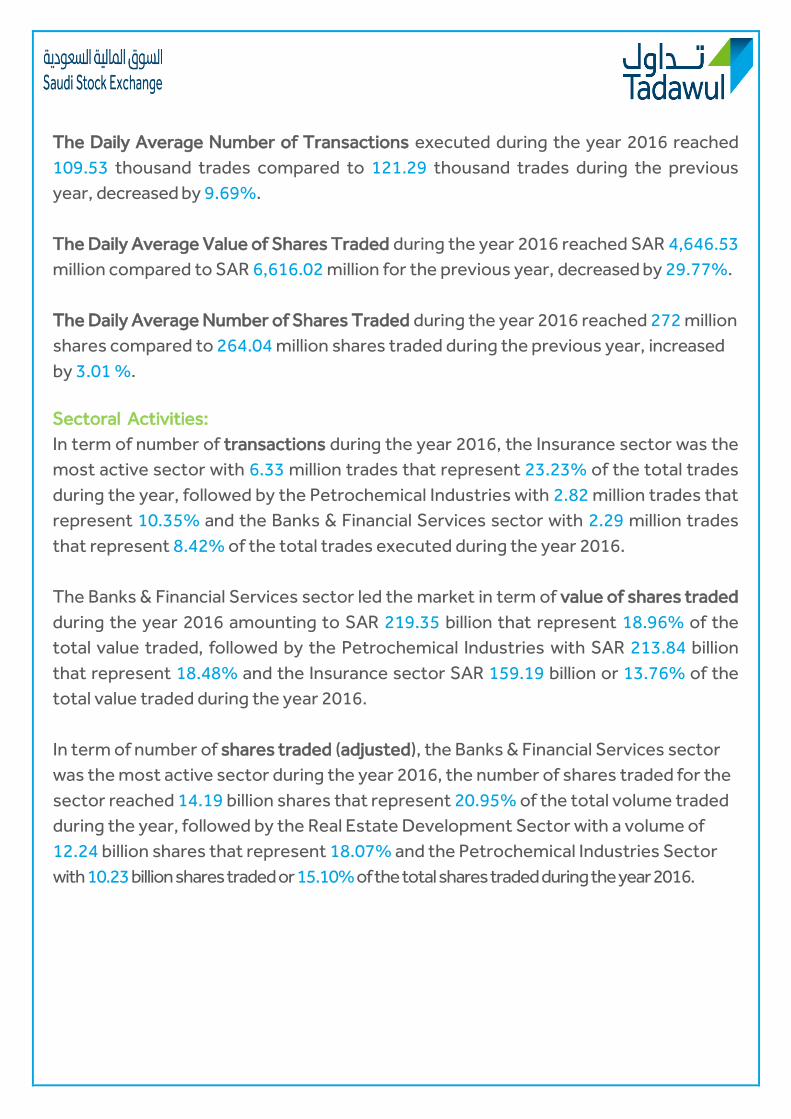
The Daily Average Number of Transactions executed during the year 2016 reached
109.53 thousand trades compared to 121.29 thousand trades during the previous
year, decreased by 9.69%.
The Daily Average Value of Shares Traded during the year 2016 reached SAR 4,646.53
million compared to SAR 6,616.02 million for the previous year, decreased by 29.77%.
The Daily Average Number of Shares Traded during the year 2016 reached 272 million
shares compared to 264.04 million shares traded during the previous year, increased
by 3.01 %.
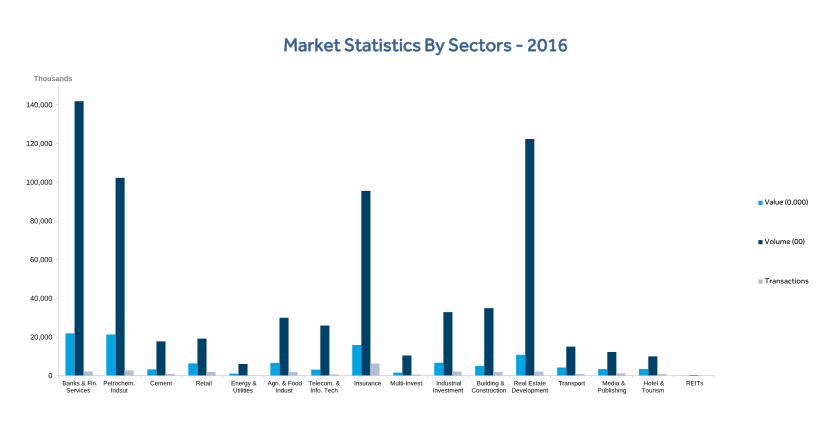
Sectoral Activities:
In term of number of transactions during the year 2016, the Insurance sector was the
most active sector with 6.33 million trades that represent 23.23% of the total trades
during the year, followed by the Petrochemical Industries with 2.82 million trades that
represent 10.35% and the Banks & Financial Services sector with 2.29 million trades
that represent 8.42% of the total trades executed during the year 2016.
The Banks & Financial Services sector led the market in term of value of shares traded
during the year 2016 amounting to SAR 219.35 billion that represent 18.96% of the
total value traded, followed by the Petrochemical Industries with SAR 213.84 billion
that represent 18.48% and the Insurance sector SAR 159.19 billion or 13.76% of the
total value traded during the year 2016.
In term of number of shares traded (adjusted), the Banks & Financial Services sector
was the most active sector during the year 2016, the number of shares traded for the
sector reached 14.19 billion shares that represent 20.95% of the total volume traded
during the year, followed by the Real Estate Development Sector with a volume of
12.24 billion shares that represent 18.07% and the Petrochemical Industries Sector
with 10.23 billion shares traded or 15.10% of the total shares traded during the year 2016.
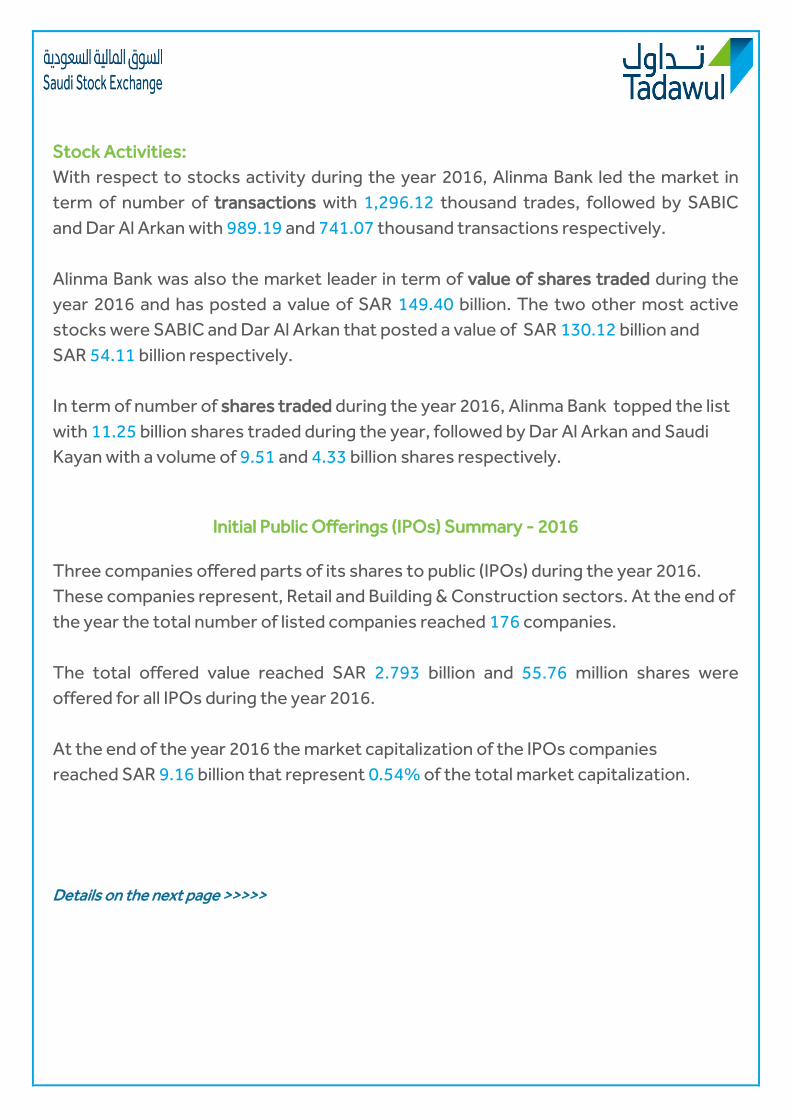
Stock Activities:
With respect to stocks activity during the year 2016, Alinma Bank led the market in
term of number of transactions with 1,296.12 thousand trades, followed by SABIC
and Dar Al Arkan with 989.19 and 741.07 thousand transactions respectively.
Alinma Bank was also the market leader in term of value of shares traded during the
year 2016 and has posted a value of SAR 149.40 billion. The two other most active
stocks were SABIC and Dar Al Arkan that posted a value of SAR 130.12 billion and
SAR 54.11 billion respectively.
In term of number of shares traded during the year 2016, Alinma Bank topped the list
with 11.25 billion shares traded during the year, followed by Dar Al Arkan and Saudi
Kayan with a volume of 9.51 and 4.33 billion shares respectively.
Initial Public Offerings (IPOs) Summary - 2016
Three companies offered parts of its shares to public (IPOs) during the year 2016.
These companies represent, Retail and Building & Construction sectors. At the end of
the year the total number of listed companies reached 176 companies.
The total offered value reached SAR 2.793 billion and 55.76 million shares were
offered for all IPOs during the year 2016.
At the end of the year 2016 the market capitalization of the IPOs companies
reached SAR 9.16 billion that represent 0.54% of the total market capitalization.
Details on the next page >>>>>
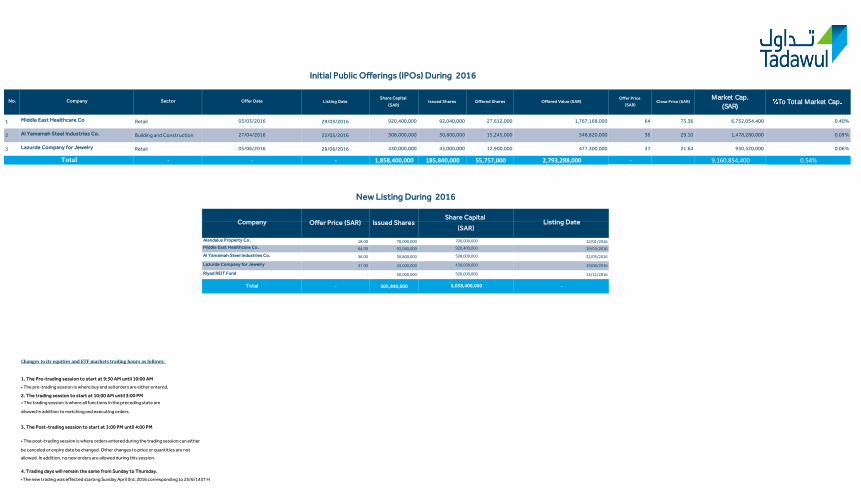
1 Middle East Healthcare Co Retail 03/03/2016 29/03/2016 920,400,000 92,040,000 27,612,000 1,767,168,000 64 73.36 6,752,054,400 0.40%
2 .Al Yamamah Steel Industries Co Building and Construction 27/04/2016 22/05/2016 508,000,000 50,800,000 15,245,000 548,820,000 36 29.10 1,478,280,000 0.09%
3 Lazurde Company for Jewelry Retail 05/06/2016 29/06/2016 430,000,000 43,000,000 12,900,000 477,300,000 37 21.64 930,520,000 0.06%
- - - 1,858,400,000 185,840,000 55,757,000 2,793,288,000 - 9,160,854,400 0.54%
.Alandalus Property Co 18.00 70,000,000 12/01/2016
.Middle East Healthcare Co 64.00 92,040,000 29/03/2016
.Al Yamamah Steel Industries Co 36.00 50,800,000 22/05/2016
Lazurde Company for Jewelry 37.00 43,000,000 29/06/2016
Riyad REIT Fund - 50,000,000 13/11/2016
Total - 305,840,000 -
4. Trading days will remain the same from Sunday to Thursday.
•The new trading was effected starting Sunday April 3rd, 2016 corresponding to 25/6/1437 H
No.
Total
500,000,000
430,000,000
508,000,000
920,400,000
700,000,000
Share Capital
(SAR)
New Listing During 2016
Company Offer Price (SAR) Issued Shares Listing Date
3,058,400,000
SectorCompany Offer Date Listing DateShare Capital
(SAR)Issued Shares Offered Shares Offered Value (SAR)
Offer Price
(SAR)
Initial Public Offerings (IPOs) During 2016
To Total Market CapMarket Cap.
(SAR)Close Price (SAR)
• The post-trading session is where orders entered during the trading session can either
be canceled or expiry date be changed. Other changes to price or quantities are not
allowed. In addition, no new orders are allowed during this session.
• The pre-trading session is where buy and sell orders are either entered,
2. The trading session to start at 10:00 AM until 3:00 PM
• The trading session is where all functions in the preceding state are
allowed in addition to matching and executing orders.
3. The Post-trading session to start at 3:00 PM until 4:00 PM
Changes to its equities and ETF markets trading hours as follows:
1. The Pre-trading session to start at 9:30 AM until 10:00 AM

MetLife AIG ANB Cooperative Insurance Co. Rights Issue (SAR 10 per share) 22/02/2016 175,000,000 350,000,000 17,500,000 35,000,000
Altayyar Travel Group Acquisition 10/03/2016 2,000,000,000 2,096,500,000 200,000,000 209,650,000
Almarai Co. Bonus -1 free share for every 3 shares held 03/04/2016 6,000,000,000 8,000,000,000 600,000,000 800,000,000
Saudi Investment Bank Bonus -1 free share for every 13 shares held 04/04/2016 6,500,000,000 7,000,000,000 650,000,000 700,000,000
National Agricultural Development Co. Bonus -1 free share for every 10 shares held 07/04/2016 770,000,000 847,000,000 77,000,000 84,700,000
BANK ALBILAD Bonus -1 free share for every 5 shares held 11/04/2016 5,000,000,000 6,000,000,000 500,000,000 600,000,000
Saudi Marketing Co. Bonus -2 free shares for every 7 shares held 26/04/2016 350,000,000 450,000,000 35,000,000 45,000,000
Alawwal Bank Bonus -1 free share for every 1 share held 02/05/2016 5,715,360,000 11,430,720,000 571,536,000 1,143,072,000
United International Transportation Co. Bonus -1 free share for every 5 shares held 05/05/2016 508,333,340 610,000,010 50,833,334 61,000,001
Abdullah A. M. Al-Khodari Sons Co. Bonus -1 free share for every 20 shares held 28/06/2016 531,250,000 557,812,500 53,125,000 55,781,250
Advanced Petrochemical Co. Bonus -1 free share for every 5 shares held 28/07/2016 1,639,950,000 1,967,940,000 163,995,000 196,794,000
Wataniya Insurance Co. Rights Issue (SAR 10 per share) 31/07/2016 100,000,000 200,000,000 10,000,000 20,000,000
Arabia Insurance Cooperative Co.Capital Reduction by 33.75% from SAR 400 million to SAR 265 million
(cancelling one share from every 2.96 shares). 02/08/2016 400,000,000 265,000,000 40,000,000 26,500,000
Takween Advanced Industries Co. Rights Issue (SAR 10 per share) 21/09/2016 350,000,000 950,000,000 35,000,000 95,000,000
Saudi Enaya Cooperative Insurance Co.Capital Reduction by 50% from SAR 400 million to SAR 200 million
(cancelling one share from every 2 shares). 18/10/2016 400,000,000 200,000,000 40,000,000 20,000,000
Saudi Transport and Investment Co. Bonus - 1 free share for every 3 shares held 21/11/2016 180,000,000 240,000,000 18,000,000 24,000,000
Company Action TypeIssued Shares
(New)
Issued Shares
(old)
Share Capital
(New) SAR
Share Capital
(Old) SAR Date
Corporate Actions During 2016
Tadawul Indices Maintenance – 1st Q 2016
The Saudi Stock Exchange (Tadawul) announces that Alandalus Property Co. has been included to
Tadawul All Share Index (TASI) and the Real Estate Development sector index as the stock close price on
Thursday 07/04/2016 (29/06/1437 H).
Tadawul Indices Maintenance – 2nd Q 2016
The following companies have been included to Tadawul Indices as the stock close prices on
Thursday 30/06/2016:
1-Middle East Healthcare Co.
2- Al Yamamah Steel Industries Co.
Tadawul Indices Maintenance – 3rd Q 2016
The Lazurde Company for Jewelry has been included to Tadawul Indices and Retail sector index as
the stock close prices on Thursday 29/09/2016. Tihama Advertising and Public Relations Co. has
been excluded from TASI and Media and Publishing sector index as the stock close price prior to its
suspension. Effective Thursday 04/08/2016.
Tadawul Indices Maintenance – 4th Q 2016
Saudi Stock Exchange (Tadawul) announces that the number of free float shares for all
companies have been revised for the 4th quarter 29/12/2016.

Banks & F. Services 219,354,500,164.06 18.96% 14,186,764,837 20.95% 2,295,481 8.42%
Petrochemical Indust. 213,839,138,474.50 18.48% 10,228,753,426 15.10% 2,822,882 10.35%
Cement 32,973,583,587.45 2.85% 1,781,622,240 2.63% 914,903 3.35%
Retail 64,244,338,040.30 5.55% 1,917,690,960 2.83% 2,020,346 7.41%
Energy & Utilities 11,564,927,319.30 1.00% 606,629,232 0.90% 241,766 0.89%
Agri. & Food Indust. 66,640,212,801.95 5.76% 2,997,187,515 4.43% 2,002,562 7.34%
Telecom. & Info. Tech. 31,761,311,705.65 2.75% 2,600,398,632 3.84% 705,716 2.59%
Insurance 159,194,914,414.85 13.76% 9,559,735,756 14.11% 6,335,228 23.23%
Multi-Investment 16,304,542,307.00 1.41% 1,042,002,246 1.54% 602,795 2.21%
Industrial Investment 67,199,617,919.95 5.81% 3,291,442,557 4.86% 2,196,884 8.05%
Building & Construction 51,114,737,747.50 4.42% 3,499,077,743 5.17% 2,014,852 7.39%
Real Estate Development 109,037,875,387.50 9.42% 12,240,878,299 18.07% 2,115,952 7.76%
Transport 42,789,400,448.40 3.70% 1,505,277,541 2.22% 893,437 3.28%
Media & Publishing 34,925,846,499.00 3.02% 1,227,833,710 1.81% 1,204,344 4.42%
Hotel & Tourism 35,596,216,405.25 3.08% 1,006,604,330 1.49% 887,819 3.26%
REITs 445,920,978.65 0.04% 37,266,539 0.06% 18,718 0.07%
Total 1,156,987,084,201.31 100.00% 67,729,165,563 100.00% 27,273,685 100.00%
Market Statistics By Sectors -2016
Sector % To MarketTransactions% To MarketShares Traded%To MarketValue Traded (SAR)
0
20,000
40,000
60,000
80,000
100,000
120,000
140,000
Banks & Fin.Services
Petrochem.Indsut
Cement Retail Energy &Utilities
Agri. & FoodIndust
Telecom. &Info. Tech
Insurance Multi-Invest. IndustrialInvestment
Building &Construction
Real EstateDevelopment
Transport Media &Publishing
Hotel &Tourism
REITs
Thousands
Value (0,000)
Volume (00)
Transactions
Market Statistics By Sectors - 2016
201520162015201620152016
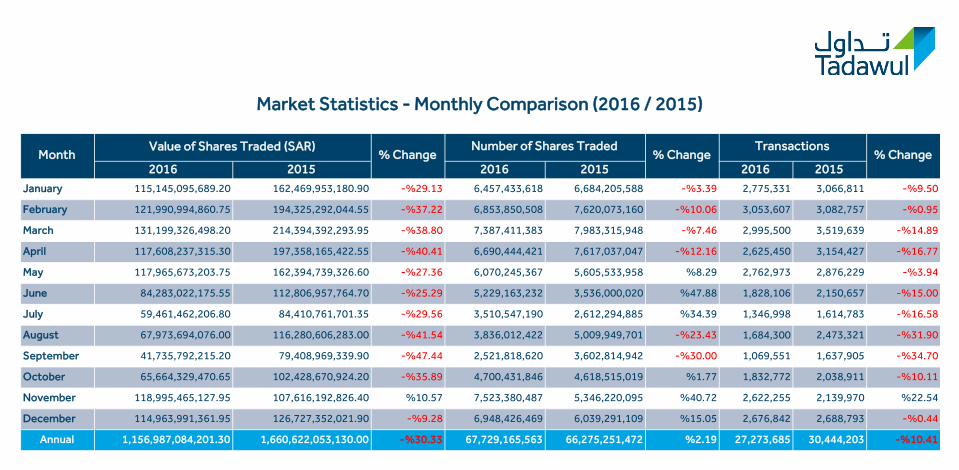
-%9.503,066,8112,775,331-%3.396,684,205,5886,457,433,618-%29.13162,469,953,180.90115,145,095,689.20January
-%0.953,082,7573,053,607-%10.067,620,073,1606,853,850,508-%37.22194,325,292,044.55121,990,994,860.75February
-%14.893,519,6392,995,500-%7.467,983,315,9487,387,411,383-%38.80214,394,392,293.95131,199,326,498.20March
-%16.773,154,4272,625,450-%12.167,617,037,0476,690,444,421-%40.41197,358,165,422.55117,608,237,315.30April
-%3.942,876,2292,762,973%8.295,605,533,9586,070,245,367-%27.36162,394,739,326.60117,965,673,203.75May
-%15.002,150,6571,828,106%47.883,536,000,0205,229,163,232-%25.29112,806,957,764.7084,283,022,175.55June
-%16.581,614,7831,346,998%34.392,612,294,8853,510,547,190-%29.5684,410,761,701.3559,461,462,206.80July
-%31.902,473,3211,684,300-%23.435,009,949,7013,836,012,422-%41.54116,280,606,283.0067,973,694,076.00August
-%34.701,637,9051,069,551-%30.003,602,814,9422,521,818,620-%47.4479,408,969,339.9041,735,792,215.20September
-%10.112,038,9111,832,772%1.774,618,515,0194,700,431,846-%35.89102,428,670,924.2065,664,329,470.65October
%22.542,139,9702,622,255%40.725,346,220,0957,523,380,487%10.57107,616,192,826.40118,995,465,127.95November
-%0.442,688,7932,676,842%15.056,039,291,1096,948,426,469-%9.28126,727,352,021.90114,963,991,361.95December
-%10.4130,444,20327,273,685%2.1966,275,251,47267,729,165,563-%30.331,660,622,053,130.001,156,987,084,201.30Annual
Market Statistics - Monthly Comparison (2016 / 2015)
Month % ChangeValue of Shares Traded (SAR) Number of Shares Traded Transactions
% Change % Change
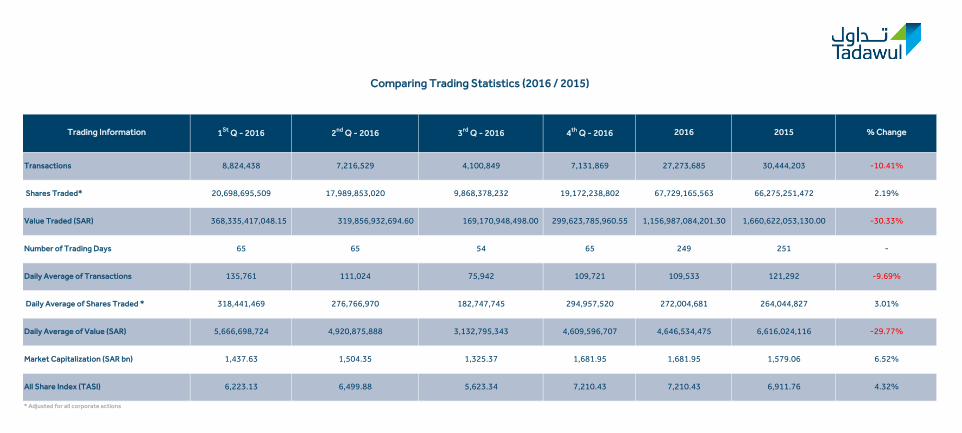
Transactions 8,824,438 7,216,529 4,100,849 7,131,869 27,273,685 30,444,203 -10.41%
Shares Traded* 20,698,695,509 17,989,853,020 9,868,378,232 19,172,238,802 67,729,165,563 66,275,251,472 2.19%
Value Traded (SAR) 368,335,417,048.15 319,856,932,694.60 169,170,948,498.00 299,623,785,960.55 1,156,987,084,201.30 1,660,622,053,130.00 -30.33%
Number of Trading Days 65 65 54 65 249 251 -
Daily Average of Transactions 135,761 111,024 75,942 109,721 109,533 121,292 -9.69%
Daily Average of Shares Traded * 318,441,469 276,766,970 182,747,745 294,957,520 272,004,681 264,044,827 3.01%
Daily Average of Value (SAR) 5,666,698,724 4,920,875,888 3,132,795,343 4,609,596,707 4,646,534,475 6,616,024,116 -29.77%
Market Capitalization (SAR bn) 1,437.63 1,504.35 1,325.37 1,681.95 1,681.95 1,579.06 6.52%
All Share Index (TASI) 6,223.13 6,499.88 5,623.34 7,210.43 7,210.43 6,911.76 4.32%
* Adjusted for all corporate actions
Comparing Trading Statistics (2016 / 2015)
Trading Information % Change201520164th Q - 20163rd Q - 20162nd Q - 20161St Q - 2016

Banks & Financial Services 15,888.08 15,586.76 1.93%
Petrochemical Industries 5,343.38 4,274.68 25.00%
Cement 4,320.45 4,542.23 -4.88%
Retail 10,229.92 12,549.95 -18.49%
Energy & Utilities 8,070.99 5,724.83 40.98%
Agriculture & Food Indust. 8,487.14 9,126.10 -7.00%
Telecom. & Information Tech. 1,591.85 1,621.15 -1.81%
Insurance 1,358.07 1,243.89 9.18%
Multi-Investment 2,763.53 3,300.14 -16.26%
Industrial Investment 6,389.46 6,427.57 -0.59%
Building & Construction 2,049.07 2,298.14 -10.84%
Real Estate Development 7,244.55 5,962.68 21.50%
Transport 7,961.73 7,782.73 2.30%
Media & Publishing 2,649.37 3,462.13 -23.48%
Hotel & Tourism 9,409.39 16,806.56 -44.01%
REITs * 5,550.00 5,000.00 11.00%
* Sector listed on 13/11/2016
Sectoral Indices
Performance of Sectoral Indices - 2016
% Change20152016

6,900
6,950
7,000
7,050
7,100
7,150
7,200
7,250
7,300
Point
Tadawul All Share Index (TASI) - December 2016
5,000
5,100
5,200
5,300
5,400
5,500
5,600
5,700
5,800
5,900
6,000
6,100
6,200
6,300
6,400
6,500
6,600
6,700
6,800
6,900
7,000
7,100
7,200
7,300
0
100
200
300
400
500
600
Millions Point
TASI & Shares Traded - 2016
Shares Traded TASI

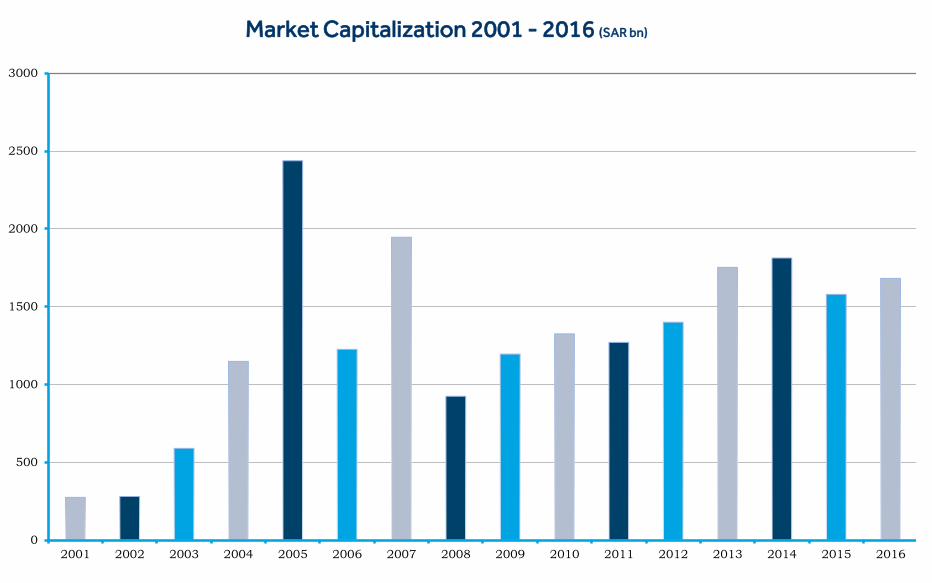
-2,430.11-274.532001
%3.622,518.08%2.26280.732002
%76.234,437.58%110.14589.932003
%84.938,206.23%94.701,148.602004
%103.6616,712.64%112.282,438.202005
-%52.537,933.29-%49.721,225.862006
%39.1411,038.66%58.771,946.352007
-%56.494,802.99-%52.50924.532008
%27.466,121.76%29.311,195.512009
%8.156,620.75%10.861,325.392010
-%3.076,417.73-%4.121,270.842011
%5.986,801.22%10.191,400.342012
%25.508,535.60%25.171,752.862013
-%2.378,333.30%3.421,812.892014
-%17.066,911.76-%12.901,579.062015
%4.327,210.43%6.521,681.952016
Market Capitalization & Tadawul All Share Index (TASI) 2001 / 2016
Year Market Capitalization
(SAR bn)% Change TASI % Change
0
500
1000
1500
2000
2500
3000
2001 2002 2003 2004 2005 2006 2007 2008 2009 2010 2011 2012 2013 2014 2015 2016
Market Capitalization 2001 - 2016 (SAR bn)
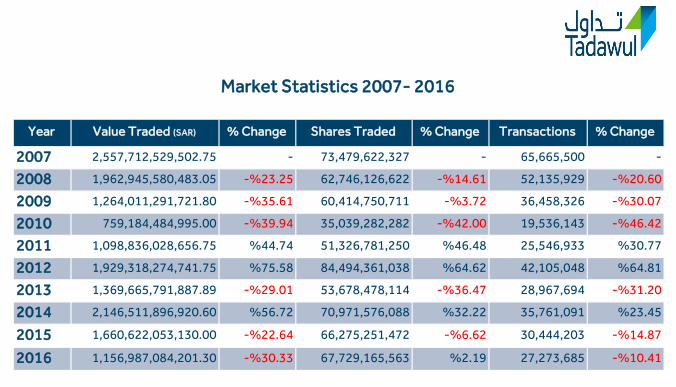
-65,665,500-73,479,622,327-2,557,712,529,502.752007
-%20.6052,135,929-%14.6162,746,126,622-%23.251,962,945,580,483.052008
-%30.0736,458,326-%3.7260,414,750,711-%35.611,264,011,291,721.802009
-%46.4219,536,143-%42.0035,039,282,282-%39.94759,184,484,995.002010
%30.7725,546,933%46.4851,326,781,250%44.741,098,836,028,656.752011
%64.8142,105,048%64.6284,494,361,038%75.581,929,318,274,741.752012
-%31.2028,967,694-%36.4753,678,478,114-%29.011,369,665,791,887.892013
%23.4535,761,091%32.2270,971,576,088%56.722,146,511,896,920.602014
-%14.8730,444,203-%6.6266,275,251,472-%22.641,660,622,053,130.002015
-%10.4127,273,685%2.1967,729,165,563-%30.331,156,987,084,201.302016
Market Statistics 2007- 2016
Year Value Traded (SAR) % Change Shares Traded % Change Transactions % Change

0
100
200
300
400
500
600
700
800
900
2007 2008 2009 2010 2011 2012 2013 2014 2015 2016
Market Statistics 2007 - 2016
Value Traded SAR (0,000) Volume (00) Transactions
Million

Walaa Insurance 22.41 10.87 106.16%
Al Rajhi Takaful 38.57 22.25 73.35%
YANSAB 54.04 32.41 66.74%
Industrialization 17.46 10.61 64.56%
Arabian Shield 40.43 26.44 52.91%
Malath Insurance 8.70 21.81 -60.11%
Al Alamiya 24.65 59.25 -58.40%
Enaya 16.21 33.22 -51.20%
ALTAYYAR 36.66 72.30 -49.29%
Takween 13.61 26.67 -48.97%
Company 2016 2015 % Change
Top Gainers
(Comparing Close Price of 2016 with 2015)
Company 20152016 % Change
Top Losers
(Comparing Close Price of 2016 with 2015)
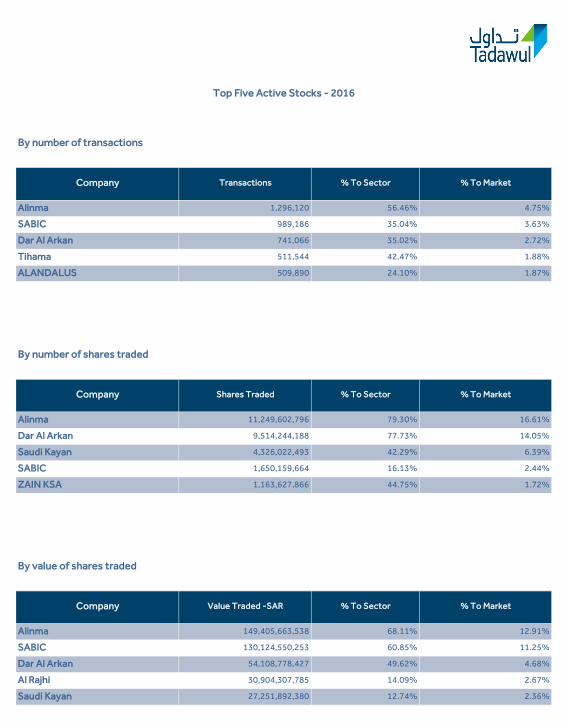
By number of transactions
Alinma 1,296,120 56.46% 4.75%
SABIC 989,186 35.04% 3.63%
Dar Al Arkan 741,066 35.02% 2.72%
Tihama 511,544 42.47% 1.88%
ALANDALUS 509,890 24.10% 1.87%
By number of shares traded
Alinma 11,249,602,796 79.30% 16.61%
Dar Al Arkan 9,514,244,188 77.73% 14.05%
Saudi Kayan 4,326,022,493 42.29% 6.39%
SABIC 1,650,159,664 16.13% 2.44%
ZAIN KSA 1,163,627,866 44.75% 1.72%
By value of shares traded
Alinma 149,405,663,538 68.11% 12.91%
SABIC 130,124,550,253 60.85% 11.25%
Dar Al Arkan 54,108,778,427 49.62% 4.68%
Al Rajhi 30,904,307,785 14.09% 2.67%
Saudi Kayan 27,251,892,380 12.74% 2.36%
Transactions
Company
Top Five Active Stocks - 2016
Company
Company % To Market% To SectorShares Traded
% To Market% To SectorValue Traded -SAR
% To Market% To Sector

Riyad 464,411,132.00 40,659,001 4,620
AlJazira 985,299,599.65 70,445,827 13,896
Saudi Investment 91,689,273.75 6,261,306 1,838
ALAWWAL 191,741,758.10 14,756,463 2,948
Saudi Fransi 275,590,911.80 10,454,364 4,608
SABB 177,424,020.45 7,277,019 2,791
Arab National 194,793,828.65 9,036,573 2,204
SAMBA 543,619,526.80 23,357,620 5,244
Al Rajhi 3,160,411,238.50 49,864,796 22,194
AL Bilad 388,511,026.45 19,247,424 11,707
Alinma 8,245,343,820.30 558,825,063 84,960
NCB 734,186,921.10 17,401,881 9,875
Total 15,453,023,057.55 827,587,337 166,885
CHEMANOL 771,929,777.40 105,667,363 21,639
Petrochem 90,715,938.15 4,479,208 4,329
SABIC 9,030,527,136.75 95,660,088 67,835
SAFCO 456,214,154.00 5,859,335 7,887
Industrialization 320,314,117.15 18,463,599 7,783
Alujain 891,542,888.60 45,120,529 29,008
Nama Chemicals 444,165,979.80 66,041,786 15,963
SIIG 276,516,048.40 14,727,685 5,274
Sahara Petrochemical 1,097,421,320.70 80,045,131 17,941
YANSAB 609,243,580.95 11,784,431 9,104
Sipchem 360,660,940.75 21,179,056 16,890
Advanced 455,698,411.70 10,157,292 7,918
Saudi Kayan 2,604,457,892.95 293,813,792 32,635
Petro Rabigh 1,085,045,090.80 91,653,477 23,023
Total 18,494,453,278.10 864,652,772 267,229
HCC 147,062,097.65 12,349,573 5,353
Najran Cement 322,731,634.80 25,800,177 9,482
City Cement 175,486,731.85 11,564,474 4,894
Northern Cement 150,105,974.80 11,708,579 4,683
UACC 294,048,763.75 16,397,703 12,416
Arab Cement 342,443,181.05 7,324,758 9,115
Yamamah Cement 233,186,633.90 10,610,388 5,954
Saudi Cement 321,783,307.25 4,635,143 3,125
Qassim Cement 218,646,882.00 3,264,103 1,808
Southern Cement 132,031,662.00 1,632,968 2,309
Yanbu Cement 306,976,081.60 7,885,840 4,826
Eastern Cement 105,204,353.90 3,164,475 2,202
Tabuk Cement 61,280,877.40 4,758,756 2,956
Jouf Cement 132,264,378.95 14,472,288 5,332
Total 2,943,252,560.90 135,569,225 74,455
A. Othaim Market 141,855,069.00 1,467,586 3,691
Mouwasat 261,478,301.75 1,793,740 2,492
Extra 359,530,711.90 13,989,854 14,474
Dallah Health 153,011,010.75 1,652,831 3,219
Care 362,812,892.25 5,564,620 8,871
Farm Superstore 290,359,823.00 9,142,307 10,735
Al Hammadi 386,343,462.60 10,005,316 9,872
SACO 105,494,341.25 1,306,183 4,968
Saudi German Hosptl 289,681,839.00 4,203,747 8,465
LAZURDE 664,402,811.65 30,926,009 24,344
SASCO 819,550,541.70 50,825,116 25,393
Thim'ar 1,125,392,265.40 32,418,008 33,884
Fitaihi Group 317,307,293.80 24,428,651 10,819
Jarir 308,249,800.25 2,598,383 5,992
Aldrees 240,305,377.00 6,047,591 7,596
AlHokair 487,093,505.50 13,197,405 17,736
Alkhaleej Trng 352,100,814.75 17,877,986 13,611
Total 6,664,969,861.55 227,445,333 206,162
Gas & Industrialization 268,886,103.70 8,550,794 8,605
Saudi Electricity 1,870,685,999.75 87,878,952 31,479
Total 2,139,572,103.45 96,429,746 40,084
Energy & Utilities
Banks & Financial Services
Petrochemical Industries
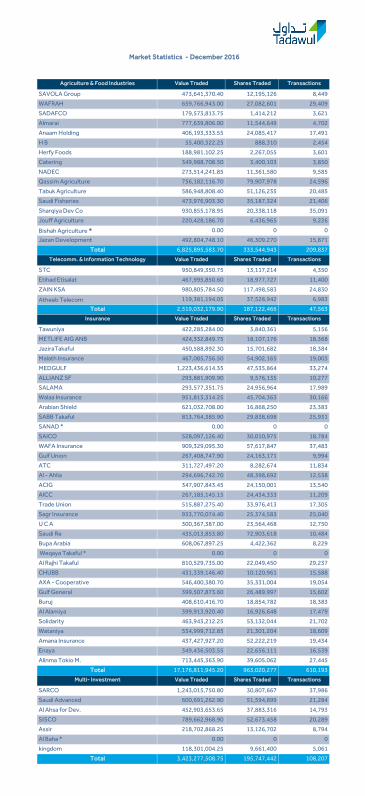
Market Statistics - December 2016
Cement
Retail
Value Traded Shares Traded Transactions
Value Traded Shares Traded Transactions
Value Traded Shares Traded Transactions
Value Traded Shares Traded Transactions
Value Traded Shares Traded Transactions
Market Statistics - December 2016
SAVOLA Group 473,641,370.40 12,195,126 8,449
WAFRAH 659,766,943.00 27,082,601 29,409
SADAFCO 179,573,813.75 1,414,212 3,621
Almarai 777,639,806.00 11,544,649 4,702
Anaam Holding 406,193,333.55 24,085,417 17,491
H B 55,400,322.25 888,310 2,454
Herfy Foods 188,981,102.25 2,267,055 3,601
Catering 349,988,708.50 3,400,103 3,850
NADEC 273,514,241.85 11,361,580 9,585
Qassim Agriculture 756,182,116.70 79,907,978 24,596
Tabuk Agriculture 586,948,808.40 51,126,235 20,485
Saudi Fisheries 473,976,903.30 35,187,324 21,406
Sharqiya Dev Co 930,855,178.95 20,338,118 35,091
Jouff Agriculture 220,428,186.70 6,436,965 9,226
Bishah Agriculture * 0.00 0 0
Jazan Development 492,804,748.10 46,309,270 15,871
Total 6,825,895,583.70 333,544,943 209,837
STC 950,849,350.75 13,117,214 4,350
Etihad Etisalat 467,995,850.60 18,977,727 11,400
ZAIN KSA 980,805,784.50 117,498,583 24,830
Atheeb Telecom 119,381,194.05 37,528,942 6,983
Total 2,519,032,179.90 187,122,466 47,563
Tawuniya 422,285,284.00 3,840,361 5,156
METLIFE AIG ANB 424,332,849.75 18,107,176 18,368
JaziraTakaful 450,588,892.30 15,701,682 18,384
Malath Insurance 467,085,756.50 54,902,165 19,003
MEDGULF 1,223,436,614.35 47,535,864 33,274
ALLIANZ SF 293,881,909.90 9,576,135 10,277
SALAMA 293,577,351.75 24,956,964 17,989
Walaa Insurance 951,813,314.25 45,704,363 30,166
Arabian Shield 621,032,708.00 16,868,250 23,383
SABB Takaful 813,764,385.90 29,838,698 25,931
SANAD * 0.00 0 0
SAICO 528,097,126.40 30,010,975 18,784
WAFA Insurance 909,329,095.30 57,617,847 37,483
Gulf Union 267,408,747.90 24,163,171 9,994
ATC 311,727,497.20 8,282,674 11,834
Al - Ahlia 294,696,742.70 48,398,692 12,538
ACIG 347,907,843.45 24,150,001 13,540
AICC 267,185,145.15 24,434,333 11,209
Trade Union 515,887,275.40 33,976,413 17,305
Sagr Insurance 933,770,074.40 25,374,583 25,040
U C A 300,367,387.00 23,564,468 12,750
Saudi Re 435,013,853.80 72,903,618 10,484
Bupa Arabia 608,067,897.25 4,422,362 8,229
Weqaya Takaful * 0.00 0 0
Al Rajhi Takaful 810,529,735.00 22,049,450 29,237
CHUBB 431,339,146.40 10,120,961 15,588
AXA - Cooperative 546,400,380.70 35,331,004 19,054
Gulf General 399,507,873.60 26,489,997 15,602
Buruj 408,610,416.70 18,854,782 18,383
Al Alamiya 399,913,920.40 16,926,648 17,479
Solidarity 463,943,212.25 53,132,044 21,702
Wataniya 534,999,712.85 21,301,204 18,609
Amana Insurance 437,427,927.20 52,222,219 19,434
Enaya 349,436,503.55 22,656,111 16,539
Alinma Tokio M. 713,445,363.90 39,605,062 27,445
Total 17,176,811,945.20 963,020,277 610,193
SARCO 1,243,015,750.80 30,807,667 37,986
Saudi Advanced 600,691,262.90 51,594,899 21,284
Al Ahsa for Dev. 452,903,653.65 37,883,316 14,793
SISCO 789,662,968.90 52,673,458 20,289
Assir 218,702,868.25 13,126,702 8,794
Al Baha * 0.00 0 0
kingdom 118,301,004.25 9,661,400 5,061
Total 3,423,277,508.75 195,747,442 108,207
Agriculture & Food Industries
Telecomm. & Information Technology
Insurance
Multi- Investment
Value Traded Shares Traded Transactions
Value Traded Shares Traded Transactions
Value Traded Shares Traded Transactions
Value Traded Shares Traded Transactions

Market Statistics - December 2016
Takween 1,175,114,415.15 86,629,699 34,106
MEPCO 522,008,176.15 31,915,809 19,689
BCI 558,229,176.95 21,627,367 18,691
MA'ADEN 1,164,373,965.00 29,652,540 19,357
Astra Indust 243,904,061.45 14,909,895 6,458
ALSorayai 348,074,971.75 34,256,885 15,454
Shaker 444,522,362.60 27,357,360 16,895
Pharmaceutical 209,881,261.10 5,468,378 5,407
Glass 223,251,199.75 11,328,147 9,370
FIPCO 490,882,632.00 13,736,487 16,118
Maadaniyah 490,068,355.70 20,351,274 18,368
Saudi Chemical 307,506,696.90 7,666,321 8,584
SPM 1,051,885,881.60 102,729,138 43,105
AlAbdullatif 239,924,414.00 15,935,835 11,143
Saudi Export 805,513,127.90 22,842,622 24,466
Total 8,275,140,698.00 446,407,757 267,211
ASLAK 148,560,912.65 5,917,389 6,475
Bawan 623,495,157.65 29,102,322 19,694
EIC 352,880,101.50 15,212,733 13,489
ALYAMAMAH STEEL 770,040,494.00 26,185,923 23,550
MMG * 0.00 0 0
SSP 168,459,285.65 9,462,107 7,013
ALKHODARI 1,065,553,043.05 84,823,242 42,989
Ceramic 222,522,153.30 6,615,771 8,464
Gypsum 311,356,963.35 24,019,666 12,701
Cables 367,049,301.80 60,389,830 15,094
Saudi Industrial 557,314,513.80 53,714,948 19,152
Amiantit 204,775,577.90 25,639,988 7,603
Pipes 434,986,951.25 25,749,058 14,696
Zamil Industrial 208,064,482.90 7,231,784 4,651
AL Babtain 574,070,174.90 22,207,557 16,330
SVCP 163,514,329.75 2,276,380 5,511
MESC 766,444,421.05 94,922,220 30,804
Red Sea 315,471,106.70 10,915,104 11,814
Total 7,254,558,971.20 504,386,022 260,030
Real Estate 227,112,220.15 9,186,009 6,698
Taiba 117,204,843.70 2,990,826 4,272
Makkah 166,474,867.75 1,806,335 4,548
Arriyadh Development 362,580,303.10 16,638,369 9,431
Emaar E .C 571,957,653.50 32,440,528 18,335
Jabal Omar 1,926,323,186.00 25,710,794 8,351
Dar Al Arkan 10,299,732,270.60 1,702,480,055 93,677
KEC 497,525,207.10 29,799,969 15,150
ALANDALUS 130,364,303.10 6,815,635 7,018
Total 14,299,274,855.00 1,827,868,520 167,480
Bahri 1,223,683,311.70 29,015,589 13,844
SGS 747,387,135.00 11,502,488 15,478
SAPTCO 1,210,607,049.75 83,586,466 27,240
Mubarrad 686,570,883.85 12,642,773 14,984
Budget Saudi 253,758,170.10 7,432,461 10,274
Total 4,122,006,550.40 144,179,777 81,820
Tihama 619,665,947.30 18,034,225 19,905
SRMG 702,370,997.50 20,875,603 28,151
SPPC 1,278,109,914.25 65,448,598 41,543
Total 2,600,146,859.05 104,358,426 89,599
ALTAYYAR 1,314,770,800.40 37,030,833 25,651
Al Hokair Group 455,983,939.90 12,657,783 16,094
Dur 350,338,935.90 15,429,333 12,441
Shams 561,318,795.80 17,041,702 21,657
Total 2,682,412,472.00 82,159,651 75,843
RIYAD REIT 90,162,877.20 7,946,775 4,244
Total 90,162,877.20 7,946,775 4,244
Market 114,963,991,361.95 6,948,426,469 2,676,842
Hotel & Tourism
REITs
* Suspended.
Industrial Investment
Building & Construction
Real Estate Development
Transport
Media and Publishing
Value Traded
Value Traded
Value Traded
Value Traded Shares Traded Transactions
Shares Traded Transactions
Value Traded Shares Traded Transactions
Shares Traded Transactions
Value Traded Shares Traded Transactions
Shares Traded Transactions
Value Traded Shares Traded Transactions
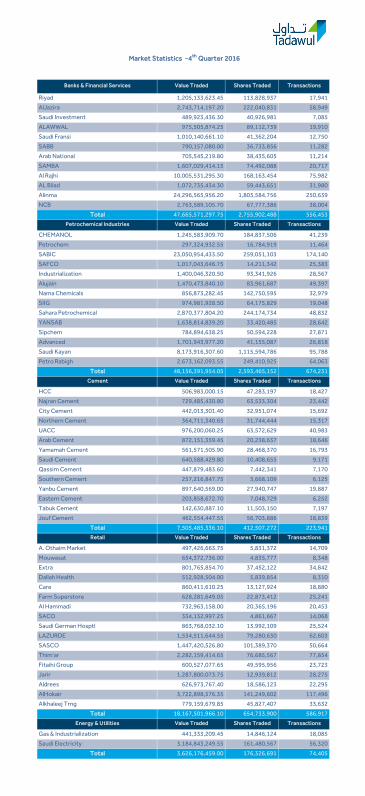
Riyad 1,205,133,623.45 113,828,937 17,941
AlJazira 2,743,714,197.20 222,040,831 58,949
Saudi Investment 489,923,436.30 40,926,981 7,085
ALAWWAL 975,505,874.25 89,112,739 19,910
Saudi Fransi 1,010,140,661.10 41,362,204 12,750
SABB 790,157,080.00 36,733,856 11,282
Arab National 705,545,219.80 38,435,605 11,214
SAMBA 1,607,029,414.15 74,492,088 20,717
Al Rajhi 10,005,531,295.30 168,163,454 75,982
AL Bilad 1,072,735,434.30 59,443,651 31,980
Alinma 24,296,565,956.20 1,803,584,756 250,639
NCB 2,763,589,105.70 67,777,386 38,004
Total 47,665,571,297.75 2,755,902,488 556,453
CHEMANOL 1,245,583,909.70 184,837,506 41,239
Petrochem 297,324,932.55 16,784,919 11,464
SABIC 23,050,954,433.50 259,051,103 174,140
SAFCO 1,017,043,646.75 14,211,342 25,383
Industrialization 1,400,046,320.50 93,341,926 28,567
Alujain 1,470,473,840.10 83,961,687 49,397
Nama Chemicals 856,873,282.45 142,750,595 32,979
SIIG 974,981,928.50 64,175,829 19,048
Sahara Petrochemical 2,870,377,804.20 244,174,734 48,832
YANSAB 1,638,814,839.20 33,420,485 28,642
Sipchem 784,894,638.25 50,594,228 27,871
Advanced 1,701,943,977.20 41,155,087 26,818
Saudi Kayan 8,173,916,307.60 1,115,594,786 95,788
Petro Rabigh 2,673,162,093.55 249,410,925 64,063
Total 48,156,391,954.05 2,593,465,152 674,231
HCC 506,983,000.15 47,283,197 18,427
Najran Cement 729,485,430.80 63,533,304 23,442
City Cement 442,013,301.40 32,951,074 15,692
Northern Cement 364,711,340.65 31,744,444 15,317
UACC 976,200,060.25 63,572,629 40,983
Arab Cement 872,151,359.45 20,238,637 18,646
Yamamah Cement 561,571,505.90 28,468,370 16,793
Saudi Cement 640,588,429.80 10,408,655 9,171
Qassim Cement 447,879,483.60 7,442,341 7,170
Southern Cement 257,216,847.75 3,668,109 6,125
Yanbu Cement 897,640,569.00 27,940,747 19,887
Eastern Cement 203,858,672.70 7,048,729 6,252
Tabuk Cement 142,630,887.10 11,503,150 7,197
Jouf Cement 462,554,447.55 56,703,886 18,839
Total 7,505,485,336.10 412,507,272 223,941
A. Othaim Market 497,426,663.75 5,831,372 14,709
Mouwasat 654,372,736.00 4,835,777 8,348
Extra 801,765,854.70 37,452,122 34,842
Dallah Health 512,928,504.00 5,839,854 8,310
Care 860,411,610.25 13,127,924 18,880
Farm Superstore 628,281,649.05 22,873,412 25,241
Al Hammadi 732,963,158.00 20,365,196 20,453
SACO 334,132,997.25 4,861,667 14,068
Saudi German Hosptl 863,768,032.10 13,992,109 25,524
LAZURDE 1,534,511,644.55 79,280,630 62,603
SASCO 1,447,420,526.80 101,389,370 50,664
Thim'ar 2,282,159,414.65 76,685,567 77,854
Fitaihi Group 600,527,077.65 49,595,956 23,723
Jarir 1,287,800,073.75 12,939,812 28,275
Aldrees 626,973,767.40 18,586,123 22,295
AlHokair 3,722,898,576.35 141,249,602 117,496
Alkhaleej Trng 779,159,679.85 45,827,407 33,632
Total 18,167,501,966.10 654,733,900 586,917
Gas & Industrialization 441,333,209.45 14,846,124 18,085
Saudi Electricity 3,184,843,249.55 161,480,567 56,320
Total 3,626,176,459.00 176,326,691 74,405
Cement
Retail
Energy & Utilities
Market Statistics -4th Quarter 2016
Banks & Financial Services
Petrochemical Industries
Value Traded Shares Traded Transactions
Value Traded Shares Traded Transactions
Value Traded Shares Traded Transactions
Value Traded Shares Traded Transactions
Value Traded Shares Traded Transactions

Market Statistics -4th Quarter 2016
SAVOLA Group 1,683,012,904.00 48,902,633 33,648
WAFRAH 1,333,019,429.10 63,672,186 63,554
SADAFCO 649,872,358.00 5,234,706 13,887
Almarai 7,223,288,877.75 116,551,542 15,756
Anaam Holding 822,937,174.25 54,663,933 40,444
H B 258,496,771.45 4,728,197 12,664
Herfy Foods 480,207,186.50 6,367,473 10,281
Catering 1,366,786,429.00 14,357,065 23,354
NADEC 759,220,716.60 34,004,338 28,182
Qassim Agriculture 1,521,926,164.65 172,810,791 54,550
Tabuk Agriculture 1,481,336,234.95 144,934,621 57,124
Saudi Fisheries 985,230,840.30 80,833,342 51,013
Sharqiya Dev Co 1,947,553,657.15 50,203,732 76,374
Jouff Agriculture 419,527,241.90 13,282,062 19,056
Bishah Agriculture * 0.00 0 0
Jazan Development 1,009,082,724.10 102,485,772 38,083
Total 21,941,498,709.70 913,032,393 537,970
STC 4,111,027,470.25 62,955,816 24,855
Etihad Etisalat 1,673,518,138.55 78,794,496 44,838
ZAIN KSA 2,783,032,584.30 352,194,608 75,998
Atheeb Telecom 418,411,000.90 133,887,316 23,217
Total 8,985,989,194.00 627,832,236 168,908
Tawuniya 1,377,120,084.50 14,339,833 17,478
METLIFE AIG ANB 719,851,985.35 33,191,399 32,962
JaziraTakaful 766,469,300.15 28,946,899 33,845
Malath Insurance 1,138,118,734.20 138,687,515 56,458
MEDGULF 1,951,668,068.90 84,503,229 64,568
ALLIANZ SF 554,858,929.40 20,853,688 24,650
SALAMA 887,639,385.75 86,288,217 48,444
Walaa Insurance 1,683,283,580.05 89,053,143 66,170
Arabian Shield 891,723,294.70 28,332,793 36,510
SABB Takaful 1,486,627,186.55 60,063,903 57,347
SANAD * 0.00 0 0
SAICO 1,385,637,536.15 91,801,525 53,421
WAFA Insurance 2,136,979,761.45 149,443,353 97,699
Gulf Union 675,725,759.50 67,479,662 29,595
ATC 595,859,616.25 17,625,235 41,675
Al - Ahlia 812,332,891.55 148,274,829 40,944
ACIG 769,707,780.70 56,227,682 36,455
AICC 794,195,300.05 81,934,368 37,138
Trade Union 1,100,562,678.30 82,655,543 48,007
Sagr Insurance 2,881,115,389.30 87,073,339 83,871
U C A 953,939,324.60 79,053,288 53,252
Saudi Re 921,015,879.70 168,045,127 24,845
Bupa Arabia 1,855,207,846.50 14,580,983 33,352
Weqaya Takaful * 0.00 0 0
Al Rajhi Takaful 1,510,082,441.60 48,679,242 61,765
CHUBB 825,162,859.75 22,188,546 38,302
AXA - Cooperative 1,069,997,200.10 76,545,076 41,623
Gulf General 984,454,039.55 72,724,797 43,337
Buruj 1,062,483,239.00 56,183,273 53,379
Al Alamiya 860,286,590.30 41,572,414 42,793
Solidarity 1,435,273,744.50 185,556,096 69,243
Wataniya 1,311,568,892.60 60,180,819 57,747
Amana Insurance 1,291,629,095.30 165,722,102 67,272
Enaya 712,752,798.25 50,882,431 39,637
Alinma Tokio M. 1,744,525,033.30 104,634,644 77,554
Total 39,147,856,247.85 2,513,324,993 1,611,338
SARCO 2,556,803,809.05 71,288,970 81,513
Saudi Advanced 928,467,605.50 87,279,012 36,349
Al Ahsa for Dev. 812,714,064.25 69,677,106 29,074
SISCO 1,267,468,791.50 89,450,153 39,188
Assir 779,855,699.35 55,149,529 32,429
Al Baha * 0.00 0 0
kingdom 250,067,946.05 21,970,914 11,399
Total 6,595,377,915.70 394,815,684 229,952
Insurance
Multi- Investment
Agriculture & Food Industries
Telecomm. & Information Technology
Value Traded Shares Traded Transactions
Value Traded Shares Traded Transactions
Value Traded Shares Traded Transactions
Value Traded Shares Traded Transactions
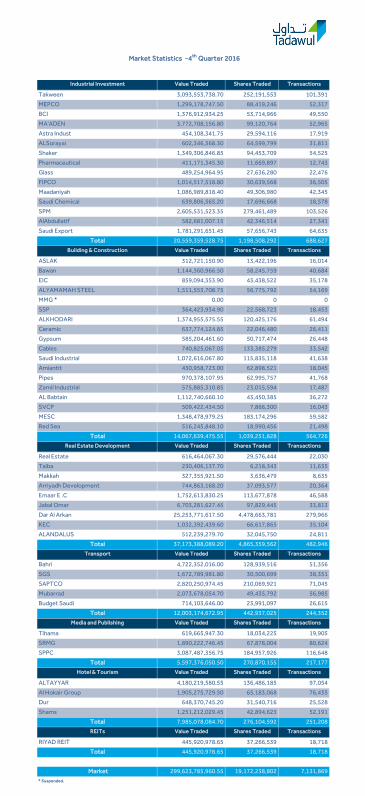
Market Statistics -4th Quarter 2016
Takween 3,093,553,738.70 252,191,553 101,391
MEPCO 1,299,178,747.50 88,419,246 52,317
BCI 1,376,912,934.25 53,714,966 49,550
MA'ADEN 3,772,708,156.80 99,120,764 52,965
Astra Indust 454,108,341.75 29,594,116 17,919
ALSorayai 602,346,368.30 64,599,799 31,811
Shaker 1,349,306,846.85 94,453,709 54,525
Pharmaceutical 411,171,345.30 11,669,897 12,743
Glass 489,254,964.95 27,636,280 22,476
FIPCO 1,014,517,518.80 30,639,568 36,505
Maadaniyah 1,086,989,818.40 49,306,980 42,345
Saudi Chemical 639,806,565.20 17,696,668 18,578
SPM 2,605,531,523.35 279,461,489 103,526
AlAbdullatif 582,681,007.15 42,346,514 27,341
Saudi Export 1,781,291,651.45 57,656,743 64,635
Total 20,559,359,528.75 1,198,508,292 688,627
ASLAK 312,721,150.90 13,422,196 16,014
Bawan 1,144,360,966.50 58,245,759 40,684
EIC 859,094,353.90 43,438,522 35,178
ALYAMAMAH STEEL 1,511,553,708.75 56,775,792 54,169
MMG * 0.00 0 0
SSP 364,423,934.90 22,568,723 18,453
ALKHODARI 1,374,955,575.55 120,425,176 61,494
Ceramic 637,774,124.85 22,046,480 26,411
Gypsum 585,204,461.60 50,717,474 26,448
Cables 740,825,067.05 133,385,279 33,542
Saudi Industrial 1,072,616,067.80 115,835,118 41,638
Amiantit 430,958,723.00 62,898,521 18,045
Pipes 970,378,107.95 62,995,757 41,768
Zamil Industrial 575,885,310.85 23,015,594 17,487
AL Babtain 1,112,740,660.10 43,450,385 36,272
SVCP 509,422,434.50 7,866,300 16,043
MESC 1,348,478,979.25 183,174,296 59,582
Red Sea 516,245,848.10 18,990,456 21,498
Total 14,067,639,475.55 1,039,251,828 564,726
Real Estate 616,464,067.30 29,576,444 22,030
Taiba 230,406,137.70 6,218,343 11,635
Makkah 327,355,921.50 3,636,479 8,635
Arriyadh Development 744,863,168.20 37,093,577 20,364
Emaar E .C 1,752,613,830.25 113,677,878 46,588
Jabal Omar 6,703,281,627.45 97,829,445 33,813
Dar Al Arkan 25,253,771,617.50 4,478,663,781 279,966
KEC 1,032,392,439.60 66,617,865 35,104
ALANDALUS 512,239,279.70 32,045,750 24,811
Total 37,173,388,089.20 4,865,359,562 482,946
Bahri 4,722,352,016.00 128,939,516 51,356
SGS 1,672,789,981.80 30,500,699 38,351
SAPTCO 2,820,250,974.45 210,069,921 71,045
Mubarrad 2,073,678,054.70 49,435,792 56,985
Budget Saudi 714,103,646.00 23,991,097 26,615
Total 12,003,174,672.95 442,937,025 244,352
Tihama 619,665,947.30 18,034,225 19,905
SRMG 1,890,222,746.45 67,878,004 80,624
SPPC 3,087,487,356.75 184,957,926 116,648
Total 5,597,376,050.50 270,870,155 217,177
ALTAYYAR 4,180,219,580.55 136,486,185 97,054
Al Hokair Group 1,905,275,729.50 65,183,068 76,435
Dur 648,370,745.20 31,540,716 25,528
Shams 1,251,212,029.45 42,894,623 52,191
Total 7,985,078,084.70 276,104,592 251,208
RIYAD REIT 445,920,978.65 37,266,539 18,718
Total 445,920,978.65 37,266,539 18,718
Market 299,623,785,960.55 19,172,238,802 7,131,869
Transport
Media and Publishing
Hotel & Tourism
REITs
* Suspended.
Value Traded
Value Traded
Industrial Investment
Building & Construction
Real Estate Development
Value Traded Shares Traded Transactions
Value Traded Shares Traded Transactions
Value Traded Shares Traded Transactions
Shares Traded Transactions
Value Traded Shares Traded Transactions
Shares Traded Transactions
Value Traded Shares Traded Transactions
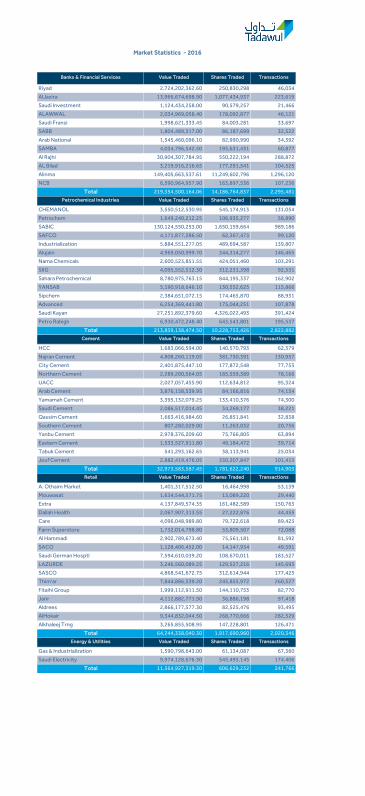
Riyad 2,724,202,362.60 250,830,298 46,034
AlJazira 13,966,674,698.90 1,077,434,937 223,619
Saudi Investment 1,124,434,258.00 90,579,257 21,466
ALAWWAL 2,034,969,058.40 178,092,877 46,121
Saudi Fransi 1,998,621,333.45 84,003,281 33,697
SABB 1,804,489,317.00 86,187,699 32,522
Arab National 1,545,460,096.10 82,990,990 34,392
SAMBA 4,034,796,542.50 195,631,431 60,877
Al Rajhi 30,904,307,784.95 550,222,194 288,872
AL Bilad 3,219,916,216.65 177,291,541 104,525
Alinma 149,405,663,537.61 11,249,602,796 1,296,120
NCB 6,590,964,957.90 163,897,536 107,236
Total 219,354,500,164.06 14,186,764,837 2,295,481
CHEMANOL 3,550,512,530.95 545,174,913 131,054
Petrochem 1,649,240,212.25 106,935,277 58,890
SABIC 130,124,550,253.00 1,650,159,664 989,186
SAFCO 4,171,877,286.50 62,367,473 99,120
Industrialization 5,884,551,277.05 489,694,587 139,807
Alujain 4,969,050,999.70 344,314,277 146,465
Nama Chemicals 2,600,523,851.55 424,051,460 103,291
SIIG 4,095,552,512.30 312,231,398 92,531
Sahara Petrochemical 8,780,975,763.15 844,195,337 162,902
YANSAB 5,190,918,646.10 130,552,625 115,866
Sipchem 2,384,651,072.15 174,465,870 88,931
Advanced 6,254,369,441.80 175,044,251 107,878
Saudi Kayan 27,251,892,379.60 4,326,022,493 391,424
Petro Rabigh 6,930,472,248.40 643,543,801 195,537
Total 213,839,138,474.50 10,228,753,426 2,822,882
HCC 1,683,066,594.00 140,570,793 62,379
Najran Cement 4,808,260,119.05 381,750,391 130,957
City Cement 2,401,875,447.10 177,872,548 77,753
Northern Cement 2,289,200,564.05 185,559,389 78,166
UACC 2,027,057,455.90 112,634,812 95,324
Arab Cement 3,876,158,539.95 84,166,816 74,154
Yamamah Cement 3,395,132,079.25 133,410,376 74,300
Saudi Cement 2,086,517,014.45 34,269,177 38,221
Qassim Cement 1,663,416,984.60 26,851,841 32,838
Southern Cement 807,282,029.00 11,263,032 20,756
Yanbu Cement 2,978,376,209.60 75,766,805 63,894
Eastern Cement 1,533,527,911.80 49,184,472 39,714
Tabuk Cement 541,293,162.65 38,113,941 25,034
Jouf Cement 2,882,419,476.05 330,207,847 101,413
Total 32,973,583,587.45 1,781,622,240 914,903
A. Othaim Market 1,401,317,512.50 16,464,998 53,139
Mouwasat 1,634,544,571.75 13,089,220 29,440
Extra 4,137,849,574.35 161,482,589 150,763
Dallah Health 2,067,907,313.55 27,222,876 44,455
Care 4,096,048,989.80 79,722,618 89,423
Farm Superstore 1,732,014,798.80 53,809,507 72,088
Al Hammadi 2,902,789,673.40 75,561,181 81,592
SACO 1,128,406,452.00 14,147,934 49,591
Saudi German Hosptl 7,594,610,039.20 108,670,011 183,527
LAZURDE 3,246,560,089.25 129,527,216 145,693
SASCO 4,868,541,672.75 312,614,944 177,425
Thim'ar 7,844,886,539.20 245,855,972 260,527
Fitaihi Group 1,999,112,911.50 144,110,753 82,770
Jarir 4,112,882,771.50 36,886,198 97,418
Aldrees 2,866,177,577.30 82,525,476 93,495
AlHokair 9,344,832,044.50 268,770,666 282,529
Alkhaleej Trng 3,265,855,508.95 147,228,801 126,471
Total 64,244,338,040.30 1,917,690,960 2,020,346
Gas & Industrialization 1,590,798,643.00 61,134,087 67,360
Saudi Electricity 9,974,128,676.30 545,495,145 174,406
Total 11,564,927,319.30 606,629,232 241,766
Shares Traded Transactions
Value Traded Shares Traded Transactions
Cement
Retail
Energy & Utilities
Market Statistics - 2016
Banks & Financial Services
Petrochemical Industries
TransactionsShares TradedValue Traded
Value Traded Shares Traded Transactions
Value Traded Shares Traded Transactions
Value Traded

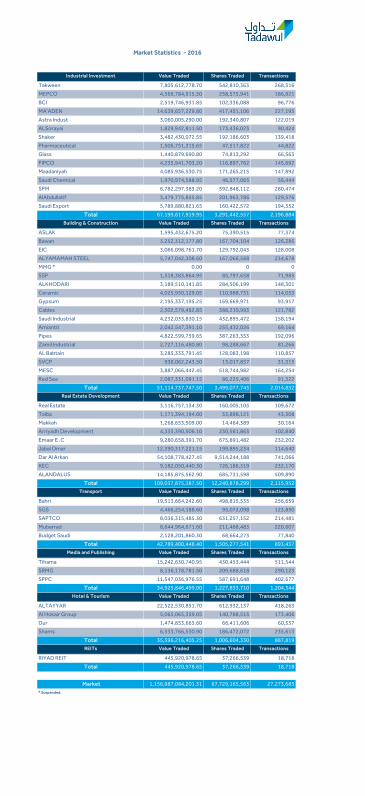
Market Statistics - 2016
SAVOLA Group 5,663,978,375.30 154,337,504 121,462
WAFRAH 4,899,489,127.10 207,662,936 205,732
SADAFCO 1,596,297,880.00 12,484,031 35,982
Almarai 11,389,172,374.50 195,094,160 84,729
Anaam Holding 3,276,573,139.00 187,231,370 155,680
H B 1,093,179,406.70 18,399,441 47,988
Herfy Foods 2,393,429,224.75 33,251,993 60,022
Catering 4,799,458,187.25 50,265,043 85,576
NADEC 4,564,601,829.90 222,922,790 165,071
Qassim Agriculture 4,830,281,147.75 490,307,361 174,417
Tabuk Agriculture 5,188,705,664.30 464,034,467 198,622
Saudi Fisheries 3,895,141,547.30 293,454,904 191,198
Sharqiya Dev Co 6,052,638,000.05 153,462,415 224,558
Jouff Agriculture 1,531,222,121.40 55,971,527 67,774
Bishah Agriculture * 0.00 0 0
Jazan Development 5,466,044,776.65 458,307,573 183,751
Total 66,640,212,801.95 2,997,187,515 2,002,562
STC 10,361,833,069.25 162,899,931 84,697
Etihad Etisalat 8,447,276,185.70 338,469,585 200,055
ZAIN KSA 9,162,859,293.40 1,163,627,866 277,393
Atheeb Telecom 3,789,343,157.30 935,401,250 143,571
Total 31,761,311,705.65 2,600,398,632 705,716
Tawuniya 3,852,102,747.25 46,162,421 74,246
METLIFE AIG ANB 5,411,257,273.55 205,868,631 192,432
JaziraTakaful 3,207,620,462.15 107,994,957 131,834
Malath Insurance 5,719,565,111.35 452,115,610 231,997
MEDGULF 8,251,972,434.90 388,710,491 282,120
ALLIANZ SF 2,193,372,586.50 65,710,347 87,959
SALAMA 4,191,028,247.55 335,740,135 187,937
Walaa Insurance 3,852,485,571.05 276,759,501 163,102
Arabian Shield 2,893,224,772.90 114,901,483 118,646
SABB Takaful 5,710,365,799.90 228,330,631 225,019
SANAD * 0.00 0 0
SAICO 5,065,998,912.60 318,100,205 199,755
WAFA Insurance 11,489,918,907.10 739,957,785 471,643
Gulf Union 2,430,418,558.55 227,355,939 112,582
ATC 2,184,624,932.55 58,117,623 105,370
Al - Ahlia 4,921,585,539.85 695,206,752 209,139
ACIG 3,374,665,284.70 234,144,296 154,702
AICC 4,106,775,272.80 331,784,459 178,471
Trade Union 3,605,869,933.15 256,348,191 153,659
Sagr Insurance 12,992,730,319.60 384,650,266 388,074
U C A 3,006,612,441.90 252,829,947 163,793
Saudi Re 3,607,571,405.30 577,627,764 110,762
Bupa Arabia 5,650,096,381.00 46,478,471 145,366
Weqaya Takaful * 0.00 0 0
Al Rajhi Takaful 5,360,854,823.80 224,752,167 215,187
CHUBB 2,551,595,136.30 62,893,779 111,853
AXA - Cooperative 4,270,194,764.05 290,732,259 170,914
Gulf General 3,289,362,106.70 216,573,311 144,305
Buruj 4,818,876,075.70 258,754,888 214,793
Al Alamiya 4,613,982,554.70 160,332,347 184,337
Solidarity 5,541,137,534.30 653,086,357 243,064
Wataniya 3,561,132,148.30 139,155,897 160,823
Amana Insurance 5,429,559,473.35 587,417,441 272,183
Enaya 3,335,852,160.55 161,927,072 173,324
Alinma Tokio M. 8,702,504,740.90 459,214,333 355,837
Total 159,194,914,414.85 9,559,735,756 6,335,228
SARCO 5,056,276,810.15 145,097,639 171,513
Saudi Advanced 2,859,025,926.00 265,131,115 112,309
Al Ahsa for Dev. 1,709,049,512.35 141,798,749 70,132
SISCO 3,384,042,994.25 248,785,951 116,422
Assir 1,676,538,829.60 103,081,738 71,888
Al Baha * 0.00 0 0
kingdom 1,619,608,234.65 138,107,054 60,531
Total 16,304,542,307.00 1,042,002,246 602,795
Value Traded Shares Traded Transactions
Value Traded Shares Traded Transactions
Value Traded Shares Traded Transactions
Value Traded Shares Traded Transactions
Multi- Investment
Agriculture & Food Industries
Telecomm. & Information Technology
Insurance
Market Statistics - 2016
Takween 7,805,612,778.70 542,810,363 268,316
MEPCO 4,569,784,915.50 258,575,941 186,921
BCI 2,519,746,931.85 102,336,088 96,776
MA'ADEN 14,639,657,229.80 417,451,106 227,195
Astra Indust 3,060,005,290.00 192,340,807 122,019
ALSorayai 1,829,942,811.50 173,436,023 90,424
Shaker 3,482,430,072.55 192,186,603 139,418
Pharmaceutical 1,506,751,315.65 47,517,822 44,822
Glass 1,440,879,690.80 74,813,292 66,563
FIPCO 4,235,941,703.20 116,897,762 145,692
Maadaniyah 4,085,936,530.75 171,265,215 147,892
Saudi Chemical 1,970,974,588.95 46,577,065 56,444
SPM 6,782,297,383.20 592,848,112 280,474
AlAbdullatif 3,479,775,855.85 201,963,786 129,576
Saudi Export 5,789,880,821.65 160,422,572 194,352
Total 67,199,617,919.95 3,291,442,557 2,196,884
ASLAK 1,595,432,675.20 75,390,515 77,374
Bawan 3,252,312,177.80 167,704,104 126,286
EIC 3,066,098,761.70 129,792,043 128,008
ALYAMAMAH STEEL 5,747,042,308.60 167,066,568 234,678
MMG * 0.00 0 0
SSP 1,518,383,864.95 85,797,658 71,985
ALKHODARI 3,189,510,141.85 284,506,199 148,301
Ceramic 4,025,950,129.05 110,988,731 114,053
Gypsum 2,195,337,195.25 169,669,971 93,917
Cables 2,502,579,462.85 388,210,993 121,782
Saudi Industrial 4,232,033,830.15 432,895,472 158,194
Amiantit 2,042,547,391.10 255,432,026 69,164
Pipes 4,822,599,759.65 387,263,353 192,096
Zamil Industrial 2,727,116,480.80 98,288,667 81,266
AL Babtain 3,285,333,791.45 128,083,198 110,857
SVCP 938,062,243.50 13,017,857 31,315
MESC 3,887,066,442.45 518,744,982 164,254
Red Sea 2,087,331,091.15 86,225,406 91,322
Total 51,114,737,747.50 3,499,077,743 2,014,852
Real Estate 3,116,757,134.30 160,005,105 109,672
Taiba 1,171,394,194.60 33,898,121 43,308
Makkah 1,268,653,509.00 14,464,389 30,164
Arriyadh Development 4,333,390,506.10 230,561,863 102,840
Emaar E .C 9,280,658,391.70 675,891,482 232,202
Jabal Omar 12,390,317,221.15 199,895,234 114,640
Dar Al Arkan 54,108,778,427.45 9,514,244,188 741,066
KEC 9,182,050,440.30 726,186,319 232,170
ALANDALUS 14,185,875,562.90 685,731,598 509,890
Total 109,037,875,387.50 12,240,878,299 2,115,952
Bahri 19,513,664,242.60 498,815,535 256,659
SGS 4,466,254,188.60 95,072,098 123,850
SAPTCO 8,036,315,485.30 631,257,152 214,481
Mubarrad 8,644,964,671.60 211,468,483 220,607
Budget Saudi 2,128,201,860.30 68,664,273 77,840
Total 42,789,400,448.40 1,505,277,541 893,437
Tihama 15,242,630,740.95 430,453,444 511,544
SRMG 8,136,178,781.50 209,688,618 290,123
SPPC 11,547,036,976.55 587,691,648 402,677
Total 34,925,846,499.00 1,227,833,710 1,204,344
ALTAYYAR 22,522,530,851.70 612,932,137 418,263
Al Hokair Group 5,065,065,359.05 140,788,515 173,406
Dur 1,474,853,663.60 66,411,606 60,537
Shams 6,533,766,530.90 186,472,072 235,613
Total 35,596,216,405.25 1,006,604,330 887,819
RIYAD REIT 445,920,978.65 37,266,539 18,718
Total 445,920,978.65 37,266,539 18,718
Market 1,156,987,084,201.31 67,729,165,563 27,273,685
Shares Traded Transactions
Value Traded Shares Traded Transactions
Shares Traded Transactions
Shares Traded Transactions
Value Traded Shares Traded Transactions
Value Traded Shares Traded Transactions
Value Traded Shares Traded Transactions
Hotel & Tourism
* Suspended.
Real Estate Development
Transport
Media and Publishing
REITs
Value Traded
Value Traded
Value Traded
Industrial Investment
Building & Construction
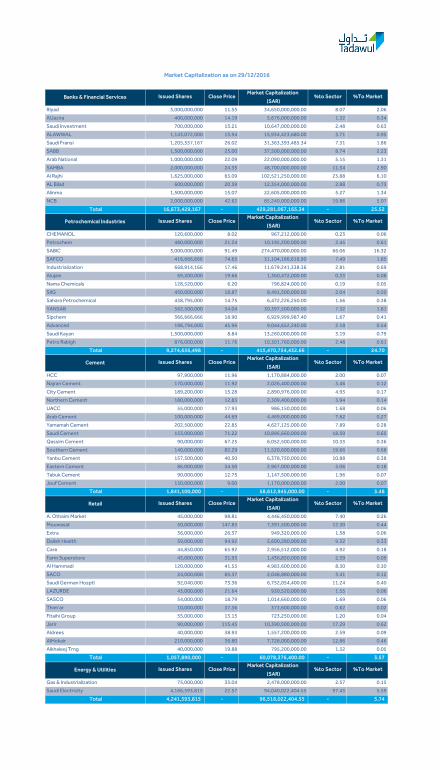
Riyad 3,000,000,000 11.55 34,650,000,000.00 8.07 2.06
AlJazira 400,000,000 14.19 5,676,000,000.00 1.32 0.34
Saudi Investment 700,000,000 15.21 10,647,000,000.00 2.48 0.63
ALAWWAL 1,143,072,000 13.94 15,934,423,680.00 3.71 0.95
Saudi Fransi 1,205,357,167 26.02 31,363,393,485.34 7.31 1.86
SABB 1,500,000,000 25.00 37,500,000,000.00 8.74 2.23
Arab National 1,000,000,000 22.09 22,090,000,000.00 5.15 1.31
SAMBA 2,000,000,000 24.35 48,700,000,000.00 11.34 2.90
Al Rajhi 1,625,000,000 63.09 102,521,250,000.00 23.88 6.10
AL Bilad 600,000,000 20.59 12,354,000,000.00 2.88 0.73
Alinma 1,500,000,000 15.07 22,605,000,000.00 5.27 1.34
NCB 2,000,000,000 42.62 85,240,000,000.00 19.86 5.07
Total 16,673,429,167 - 429,281,067,165.34 - 25.52
CHEMANOL 120,600,000 8.02 967,212,000.00 0.23 0.06
Petrochem 480,000,000 21.24 10,195,200,000.00 2.45 0.61
SABIC 3,000,000,000 91.49 274,470,000,000.00 66.06 16.32
SAFCO 416,666,666 74.65 31,104,166,616.90 7.49 1.85
Industrialization 668,914,166 17.46 11,679,241,338.36 2.81 0.69
Alujain 69,200,000 19.66 1,360,472,000.00 0.33 0.08
Nama Chemicals 128,520,000 6.20 796,824,000.00 0.19 0.05
SIIG 450,000,000 18.87 8,491,500,000.00 2.04 0.50
Sahara Petrochemical 438,795,000 14.75 6,472,226,250.00 1.56 0.38
YANSAB 562,500,000 54.04 30,397,500,000.00 7.32 1.81
Sipchem 366,666,666 18.90 6,929,999,987.40 1.67 0.41
Advanced 196,794,000 45.96 9,044,652,240.00 2.18 0.54
Saudi Kayan 1,500,000,000 8.84 13,260,000,000.00 3.19 0.79
Petro Rabigh 876,000,000 11.76 10,301,760,000.00 2.48 0.61
Total 9,274,656,498 - 415,470,754,432.66 - 24.70
HCC 97,900,000 11.96 1,170,884,000.00 2.00 0.07
Najran Cement 170,000,000 11.92 2,026,400,000.00 3.46 0.12
City Cement 189,200,000 15.28 2,890,976,000.00 4.93 0.17
Northern Cement 180,000,000 12.83 2,309,400,000.00 3.94 0.14
UACC 55,000,000 17.93 986,150,000.00 1.68 0.06
Arab Cement 100,000,000 44.69 4,469,000,000.00 7.62 0.27
Yamamah Cement 202,500,000 22.85 4,627,125,000.00 7.89 0.28
Saudi Cement 153,000,000 71.22 10,896,660,000.00 18.59 0.65
Qassim Cement 90,000,000 67.25 6,052,500,000.00 10.33 0.36
Southern Cement 140,000,000 82.29 11,520,600,000.00 19.66 0.68
Yanbu Cement 157,500,000 40.50 6,378,750,000.00 10.88 0.38
Eastern Cement 86,000,000 34.50 2,967,000,000.00 5.06 0.18
Tabuk Cement 90,000,000 12.75 1,147,500,000.00 1.96 0.07
Jouf Cement 130,000,000 9.00 1,170,000,000.00 2.00 0.07
Total 1,841,100,000 - 58,612,945,000.00 - 3.48
A. Othaim Market 45,000,000 98.81 4,446,450,000.00 7.40 0.26
Mouwasat 50,000,000 147.83 7,391,500,000.00 12.30 0.44
Extra 36,000,000 26.37 949,320,000.00 1.58 0.06
Dallah Health 59,000,000 94.92 5,600,280,000.00 9.32 0.33
Care 44,850,000 65.92 2,956,512,000.00 4.92 0.18
Farm Superstore 45,000,000 31.93 1,436,850,000.00 2.39 0.09
Al Hammadi 120,000,000 41.53 4,983,600,000.00 8.30 0.30
SACO 24,000,000 85.37 2,048,880,000.00 3.41 0.12
Saudi German Hosptl 92,040,000 73.36 6,752,054,400.00 11.24 0.40
LAZURDE 43,000,000 21.64 930,520,000.00 1.55 0.06
SASCO 54,000,000 18.79 1,014,660,000.00 1.69 0.06
Thim'ar 10,000,000 37.36 373,600,000.00 0.62 0.02
Fitaihi Group 55,000,000 13.15 723,250,000.00 1.20 0.04
Jarir 90,000,000 115.45 10,390,500,000.00 17.29 0.62
Aldrees 40,000,000 38.93 1,557,200,000.00 2.59 0.09
AlHokair 210,000,000 36.80 7,728,000,000.00 12.86 0.46
Alkhaleej Trng 40,000,000 19.88 795,200,000.00 1.32 0.05
Total 1,057,890,000 - 60,078,376,400.00 - 3.57
Gas & Industrialization 75,000,000 33.04 2,478,000,000.00 2.57 0.15
Saudi Electricity 4,166,593,815 22.57 94,040,022,404.55 97.43 5.59
Total 4,241,593,815 - 96,518,022,404.55 - 5.74
Cement
Retail
Banks & Financial Services
Petrochemical Industries
Energy & Utilities
Market Capitalization as on 29/12/2016
%To Market%to SectorMarket Capitalization
(SAR)Close PriceIssued Shares
Issued Shares Close PriceMarket Capitalization
(SAR)%to Sector %To Market
Issued Shares Close PriceMarket Capitalization
(SAR)%to Sector %To Market
Issued Shares Close PriceMarket Capitalization
(SAR)%to Sector %To Market
Issued Shares Close PriceMarket Capitalization
(SAR)%to Sector %To Market
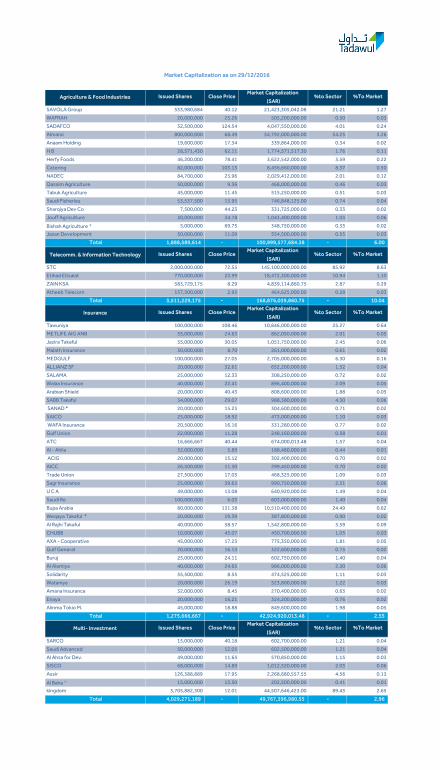
Market Capitalization as on 29/12/2016
SAVOLA Group 533,980,684 40.12 21,423,305,042.08 21.21 1.27
WAFRAH 20,000,000 25.26 505,200,000.00 0.50 0.03
SADAFCO 32,500,000 124.54 4,047,550,000.00 4.01 0.24
Almarai 800,000,000 68.49 54,792,000,000.00 54.25 3.26
Anaam Holding 19,600,000 17.34 339,864,000.00 0.34 0.02
H B 28,571,430 62.11 1,774,571,517.30 1.76 0.11
Herfy Foods 46,200,000 78.41 3,622,542,000.00 3.59 0.22
Catering 82,000,000 103.13 8,456,660,000.00 8.37 0.50
NADEC 84,700,000 23.96 2,029,412,000.00 2.01 0.12
Qassim Agriculture 50,000,000 9.36 468,000,000.00 0.46 0.03
Tabuk Agriculture 45,000,000 11.45 515,250,000.00 0.51 0.03
Saudi Fisheries 53,537,500 13.95 746,848,125.00 0.74 0.04
Sharqiya Dev Co 7,500,000 44.23 331,725,000.00 0.33 0.02
Jouff Agriculture 30,000,000 34.78 1,043,400,000.00 1.03 0.06
Bishah Agriculture * 5,000,000 69.75 348,750,000.00 0.35 0.02
Jazan Development 50,000,000 11.09 554,500,000.00 0.55 0.03
Total 1,888,589,614 - 100,999,577,684.38 - 6.00
STC 2,000,000,000 72.55 145,100,000,000.00 85.92 8.63
Etihad Etisalat 770,000,000 23.99 18,472,300,000.00 10.94 1.10
ZAIN KSA 583,729,175 8.29 4,839,114,860.75 2.87 0.29
Atheeb Telecom 157,500,000 2.95 464,625,000.00 0.28 0.03
Total 3,511,229,175 - 168,876,039,860.75 - 10.04
Tawuniya 100,000,000 108.46 10,846,000,000.00 25.27 0.64
METLIFE AIG ANB 35,000,000 24.63 862,050,000.00 2.01 0.05
Jazira Takaful 35,000,000 30.05 1,051,750,000.00 2.45 0.06
Malath Insurance 30,000,000 8.70 261,000,000.00 0.61 0.02
MEDGULF 100,000,000 27.05 2,705,000,000.00 6.30 0.16
ALLIANZ SF 20,000,000 32.61 652,200,000.00 1.52 0.04
SALAMA 25,000,000 12.33 308,250,000.00 0.72 0.02
Walaa Insurance 40,000,000 22.41 896,400,000.00 2.09 0.05
Arabian Shield 20,000,000 40.43 808,600,000.00 1.88 0.05
SABB Takaful 34,000,000 29.07 988,380,000.00 4.30 0.06
SANAD * 20,000,000 15.23 304,600,000.00 0.71 0.02
SAICO 25,000,000 18.92 473,000,000.00 1.10 0.03
WAFA Insurance 20,500,000 16.16 331,280,000.00 0.77 0.02
Gulf Union 22,000,000 11.28 248,160,000.00 0.58 0.01
ATC 16,666,667 40.44 674,000,013.48 1.57 0.04
Al - Ahlia 32,000,000 5.89 188,480,000.00 0.44 0.01
ACIG 20,000,000 15.12 302,400,000.00 0.70 0.02
AICC 26,500,000 11.30 299,450,000.00 0.70 0.02
Trade Union 27,500,000 17.03 468,325,000.00 1.09 0.03
Sagr Insurance 25,000,000 39.63 990,750,000.00 2.31 0.06
U C A 49,000,000 13.08 640,920,000.00 1.49 0.04
Saudi Re 100,000,000 6.03 603,000,000.00 1.40 0.04
Bupa Arabia 80,000,000 131.38 10,510,400,000.00 24.49 0.62
Weqaya Takaful * 20,000,000 19.39 387,800,000.00 0.90 0.02
Al Rajhi Takaful 40,000,000 38.57 1,542,800,000.00 3.59 0.09
CHUBB 10,000,000 45.07 450,700,000.00 1.05 0.03
AXA - Cooperative 45,000,000 17.23 775,350,000.00 1.81 0.05
Gulf General 20,000,000 16.13 322,600,000.00 0.75 0.02
Buruj 25,000,000 24.11 602,750,000.00 1.40 0.04
Al Alamiya 40,000,000 24.65 986,000,000.00 2.30 0.06
Solidarity 55,500,000 8.55 474,525,000.00 1.11 0.03
Wataniya 20,000,000 26.19 523,800,000.00 1.22 0.03
Amana Insurance 32,000,000 8.45 270,400,000.00 0.63 0.02
Enaya 20,000,000 16.21 324,200,000.00 0.76 0.02
Alinma Tokio M. 45,000,000 18.88 849,600,000.00 1.98 0.05
Total 1,275,666,667 - 42,924,920,013.48 - 2.55
SARCO 15,000,000 40.18 602,700,000.00 1.21 0.04
Saudi Advanced 50,000,000 12.05 602,500,000.00 1.21 0.04
Al Ahsa for Dev. 49,000,000 11.65 570,850,000.00 1.15 0.03
SISCO 68,000,000 14.89 1,012,520,000.00 2.03 0.06
Assir 126,388,889 17.95 2,268,680,557.55 4.56 0.13
Al Baha * 15,000,000 13.50 202,500,000.00 0.41 0.01
kingdom 3,705,882,300 12.01 44,507,646,423.00 89.43 2.65
Total 4,029,271,189 - 49,767,396,980.55 - 2.96
Agriculture & Food Industries
Telecomm. & Information Technology
Insurance
Multi- Investment
Issued Shares Close PriceMarket Capitalization
(SAR)%to Sector %To Market
Issued Shares Close PriceMarket Capitalization
(SAR)%to Sector %To Market
Issued Shares Close PriceMarket Capitalization
(SAR)%to Sector %To Market
Issued Shares Close PriceMarket Capitalization
(SAR)%to Sector %To Market
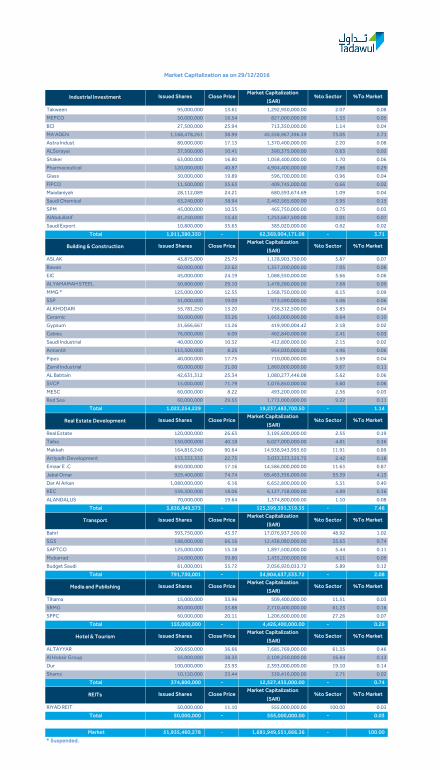
Market Capitalization as on 29/12/2016
Takween 95,000,000 13.61 1,292,950,000.00 2.07 0.08
MEPCO 50,000,000 16.54 827,000,000.00 1.33 0.05
BCI 27,500,000 25.94 713,350,000.00 1.14 0.04
MA'ADEN 1,168,478,261 38.99 45,558,967,396.39 73.05 2.71
Astra Indust 80,000,000 17.13 1,370,400,000.00 2.20 0.08
ALSorayai 37,500,000 10.41 390,375,000.00 0.63 0.02
Shaker 63,000,000 16.80 1,058,400,000.00 1.70 0.06
Pharmaceutical 120,000,000 40.87 4,904,400,000.00 7.86 0.29
Glass 30,000,000 19.89 596,700,000.00 0.96 0.04
FIPCO 11,500,000 35.63 409,745,000.00 0.66 0.02
Maadaniyah 28,112,089 24.21 680,593,674.69 1.09 0.04
Saudi Chemical 63,240,000 38.94 2,462,565,600.00 3.95 0.15
SPM 45,000,000 10.35 465,750,000.00 0.75 0.03
AlAbdullatif 81,250,000 15.43 1,253,687,500.00 2.01 0.07
Saudi Export 10,800,000 35.65 385,020,000.00 0.62 0.02
Total 1,911,380,350 - 62,369,904,171.08 - 3.71
ASLAK 43,875,000 25.73 1,128,903,750.00 5.87 0.07
Bawan 60,000,000 22.62 1,357,200,000.00 7.05 0.08
EIC 45,000,000 24.19 1,088,550,000.00 5.66 0.06
ALYAMAMAH STEEL 50,800,000 29.10 1,478,280,000.00 7.68 0.09
MMG * 125,000,000 12.55 1,568,750,000.00 8.15 0.09
SSP 51,000,000 19.09 973,590,000.00 5.06 0.06
ALKHODARI 55,781,250 13.20 736,312,500.00 3.83 0.04
Ceramic 50,000,000 33.26 1,663,000,000.00 8.64 0.10
Gypsum 31,666,667 13.26 419,900,004.42 2.18 0.02
Cables 76,000,000 6.09 462,840,000.00 2.41 0.03
Saudi Industrial 40,000,000 10.32 412,800,000.00 2.15 0.02
Amiantit 115,500,000 8.26 954,030,000.00 4.96 0.06
Pipes 40,000,000 17.75 710,000,000.00 3.69 0.04
Zamil Industrial 60,000,000 31.00 1,860,000,000.00 9.67 0.11
AL Babtain 42,631,312 25.34 1,080,277,446.08 5.62 0.06
SVCP 15,000,000 71.79 1,076,850,000.00 5.60 0.06
MESC 60,000,000 8.22 493,200,000.00 2.56 0.03
Red Sea 60,000,000 29.55 1,773,000,000.00 9.22 0.11
Total 1,022,254,229 - 19,237,483,700.50 - 1.14
Real Estate 120,000,000 26.63 3,195,600,000.00 2.55 0.19
Taiba 150,000,000 40.18 6,027,000,000.00 4.81 0.36
Makkah 164,816,240 90.64 14,938,943,993.60 11.91 0.89
Arriyadh Development 133,333,333 22.75 3,033,333,325.75 2.42 0.18
Emaar E .C 850,000,000 17.16 14,586,000,000.00 11.63 0.87
Jabal Omar 929,400,000 74.74 69,463,356,000.00 55.39 4.13
Dar Al Arkan 1,080,000,000 6.16 6,652,800,000.00 5.31 0.40
KEC 339,300,000 18.06 6,127,758,000.00 4.89 0.36
ALANDALUS 70,000,000 19.64 1,374,800,000.00 1.10 0.08
Total 3,836,849,573 - 125,399,591,319.35 - 7.46
Bahri 393,750,000 43.37 17,076,937,500.00 48.92 1.02
SGS 188,000,000 66.16 12,438,080,000.00 35.63 0.74
SAPTCO 125,000,000 15.18 1,897,500,000.00 5.44 0.11
Mubarrad 24,000,000 59.80 1,435,200,000.00 4.11 0.09
Budget Saudi 61,000,001 33.72 2,056,920,033.72 5.89 0.12
Total 791,750,001 - 34,904,637,533.72 - 2.08
Tihama 15,000,000 33.96 509,400,000.00 11.51 0.03
SRMG 80,000,000 33.88 2,710,400,000.00 61.23 0.16
SPPC 60,000,000 20.11 1,206,600,000.00 27.26 0.07
Total 155,000,000 - 4,426,400,000.00 - 0.26
ALTAYYAR 209,650,000 36.66 7,685,769,000.00 61.35 0.46
Al Hokair Group 55,000,000 38.35 2,109,250,000.00 16.84 0.13
Dur 100,000,000 23.93 2,393,000,000.00 19.10 0.14
Shams 10,150,000 33.44 339,416,000.00 2.71 0.02
Total 374,800,000 - 12,527,435,000.00 - 0.74
RIYAD REIT 50,000,000 11.10 555,000,000.00 100.00 0.03
Total 50,000,000 - 555,000,000.00 - 0.03
Market 51,935,460,278 - 1,681,949,551,666.36 - 100.00
* Suspended.
REITs
Real Estate Development
Transport
Media and Publishing
Hotel & Tourism
Industrial Investment
Building & Construction
Issued Shares Close PriceMarket Capitalization
(SAR)%to Sector %To Market
Issued Shares Close PriceMarket Capitalization
(SAR)%to Sector %To Market
Issued Shares Close PriceMarket Capitalization
(SAR)%to Sector %To Market
Issued Shares Close PriceMarket Capitalization
(SAR)%to Sector %To Market
Issued Shares Close PriceMarket Capitalization
(SAR)%to Sector %To Market
Issued Shares Close PriceMarket Capitalization
(SAR)%to Sector %To Market
Issued Shares Close PriceMarket Capitalization
(SAR)%to Sector %To Market
Riyad 11.55 12.55 0.92 1.30 8.89 3,000.00 34,650.00 37,650.00 3,899.79
AlJazira 14.19 19.77 0.72 2.20 6.46 400.00 5,676.00 7,909.00 878.46
Saudi Investment 15.21 17.71 0.86 1.40 10.88 700.00 10,647.00 12,400.00 978.76
ALAWWAL 13.94 11.44 1.22 1.54 9.03 1,143.07 15,934.42 13,080.00 1,765.38
Saudi Fransi 26.02 23.61 1.10 3.39 7.68 1,205.36 31,363.39 28,464.00 4,085.97
SABB 25.00 20.07 1.25 2.82 8.87 1,500.00 37,500.00 30,100.00 4,226.87
Arab National 22.09 22.91 0.96 2.88 7.66 1,000.00 22,090.00 22,908.00 2,883.23
SAMBA 24.35 20.51 1.19 2.57 9.46 2,000.00 48,700.00 41,029.00 5,145.84
Al Rajhi 63.09 30.64 2.06 4.94 12.77 1,625.00 102,521.25 49,783.00 8,026.97
AL Bilad 20.59 11.83 1.74 1.32 15.63 600.00 12,354.00 7,100.00 790.58
Alinma 15.07 12.47 1.21 1.00 15.09 1,500.00 22,605.00 18,700.00 1,498.24
NCB 42.62 29.31 1.45 4.58 9.31 2,000.00 85,240.00 58,615.00 9,156.91
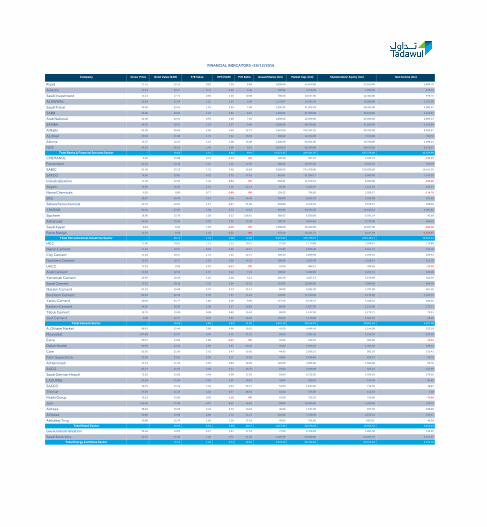
Total Banks & Financial Services Sector - 19.66 1.31 2.60 9.91 16,673.43 429,281.07 327,738.00 43,336.99
CHEMANOL 8.02 10.98 0.73 -1.12 (M) 120.60 967.21 1,324.73 -134.93
Petrochem 21.24 13.18 1.61 1.46 14.56 480.00 10,195.20 6,324.24 700.39
SABIC 91.49 53.13 1.72 5.48 16.69 3,000.00 274,470.00 159,390.00 16,441.59
SAFCO 74.65 15.81 4.72 2.75 27.16 416.67 31,104.17 6,589.00 1,145.29
Industrialization 17.46 12.05 1.45 -0.84 (M) 668.91 11,679.24 8,060.00 -558.98
Alujain 19.66 16.20 1.21 1.50 13.14 69.20 1,360.47 1,121.36 103.57
Nama Chemicals 6.20 8.00 0.77 -0.89 (M) 128.52 796.82 1,028.57 -114.78
SIIG 18.87 16.79 1.12 1.16 16.29 450.00 8,491.50 7,555.08 521.38
Sahara Petrochemical 14.75 12.61 1.17 0.47 31.06 438.80 6,472.23 5,533.27 208.38
YANSAB 54.04 27.81 1.94 3.72 14.53 562.50 30,397.50 15,643.10 2,091.82
Sipchem 18.90 15.79 1.20 0.12 158.61 366.67 6,930.00 5,791.14 43.69
Advanced 45.96 13.94 3.30 3.39 13.58 196.79 9,044.65 2,743.00 666.22
Saudi Kayan 8.84 8.56 1.03 -0.40 (M) 1,500.00 13,260.00 12,837.00 -593.06
Petro Rabigh 11.76 9.36 1.26 -1.32 (M) 876.00 10,301.76 8,197.69 -1,154.97
Total Petrochemical Industries Sector - 26.11 1.72 2.09 17.26 9,274.66 415,470.75 242,138.17 19,365.61
HCC 11.96 10.61 1.13 1.13 10.57 97.90 1,170.88 1,038.87 110.80
Najran Cement 11.92 12.07 0.99 0.96 12.37 170.00 2,026.40 2,051.41 163.78
City Cement 15.28 10.67 1.43 1.22 12.57 189.20 2,890.98 2,019.10 229.91
Northern Cement 12.83 10.77 1.19 0.90 14.32 180.00 2,309.40 1,938.14 161.28
UACC 17.93 8.92 2.01 -0.41 (M) 55.00 986.15 490.58 -22.28
Arab Cement 44.69 32.52 1.37 6.22 7.18 100.00 4,469.00 3,251.52 622.08
Yamamah Cement 22.85 18.16 1.26 2.48 9.21 202.50 4,627.13 3,676.98 502.58
Saudi Cement 71.22 20.19 3.53 5.84 12.19 153.00 10,896.66 3,089.00 894.10
Qassim Cement 67.25 19.98 3.37 5.13 13.11 90.00 6,052.50 1,797.88 461.60
Southern Cement 82.29 22.23 3.70 7.31 11.26 140.00 11,520.60 3,112.00 1,022.72
Yanbu Cement 40.50 21.77 1.86 4.09 9.90 157.50 6,378.75 3,428.32 644.62
Eastern Cement 34.50 26.90 1.28 3.17 10.89 86.00 2,967.00 2,313.00 272.51
Tabuk Cement 12.75 13.03 0.98 0.82 15.53 90.00 1,147.50 1,172.71 73.91
Jouf Cement 9.00 12.17 0.74 0.53 16.84 130.00 1,170.00 1,581.85 69.48
Total Cement Sector - 16.82 1.89 2.83 11.02 1,841.10 58,612.95 30,961.34 5,207.08
A. Othaim Market 98.81 25.44 3.88 4.96 19.92 45.00 4,446.45 1,144.90 223.19
Mouwasat 147.83 24.37 6.07 4.75 31.12 50.00 7,391.50 1,218.33 237.48
Extra 26.37 14.02 1.88 -0.45 (M) 36.00 949.32 504.80 -16.32
Dallah Health 94.92 24.76 3.83 3.87 24.52 59.00 5,600.28 1,461.02 228.44
Care 65.92 21.90 3.01 3.47 19.02 44.85 2,956.51 982.07 155.41
Farm Superstore 31.93 13.91 2.30 2.12 15.10 45.00 1,436.85 625.74 95.19
Al Hammadi 41.53 11.33 3.66 0.83 49.99 120.00 4,983.60 1,360.08 99.70
SACO 85.37 21.05 4.06 5.11 16.70 24.00 2,048.88 505.22 122.69
Saudi German Hosptl 73.36 15.82 4.64 4.09 17.93 92.04 6,752.05 1,456.36 376.56
LAZURDE 21.64 11.94 1.81 1.97 10.97 43.00 930.52 513.40 84.82
SASCO 18.79 13.19 1.42 0.35 53.77 54.00 1,014.66 712.50 18.87
Thim'ar 37.36 11.25 3.32 0.77 48.63 10.00 373.60 112.53 7.68
Fitaihi Group 13.15 13.80 0.95 -1.28 (M) 55.00 723.25 759.00 -70.60
Jarir 115.45 17.56 6.57 8.12 14.22 90.00 10,390.50 1,580.68 730.72
Aldrees 38.93 15.93 2.44 2.72 14.33 40.00 1,557.20 637.30 108.68
AlHokair 36.80 13.68 2.69 1.74 21.13 210.00 7,728.00 2,872.10 365.67
Alkhaleej Trng 19.88 12.74 1.56 1.16 17.18 40.00 795.20 509.50 46.29
Total Retail Sector - 16.03 3.54 2.66 20.13 1,057.89 60,078.38 16,955.53 2,814.45
Gas & Industrialization 33.04 14.55 2.27 1.91 17.34 75.00 2,478.00 1,091.00 142.92
Saudi Electricity 22.57 15.43 1.46 0.72 31.22 4,166.59 94,040.02 64,283.63 3,011.87
Total Energy & Utilities Sector - 15.41 1.48 0.74 30.59 4,241.59 96,518.02 65,374.63 3,154.79
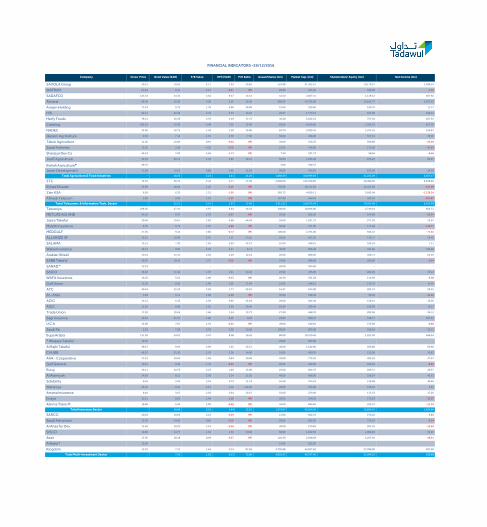
FINANCIAL INDICATORS -29/12/2016
Net Income (mn)Market Cap. (mn) Shareholders' Equity (mn)Company Close Price Book Value (SAR) P/B Value EPS (SAR) P/E Ratio Issued Shares (mn)
FINANCIAL INDICATORS -29/12/2016
Net Income (mn)Market Cap. (mn) Shareholders' Equity (mn)Company Close Price Book Value (SAR) P/B Value EPS (SAR) P/E Ratio Issued Shares (mn)
SAVOLA Group 40.12 19.05 2.11 1.93 20.83 533.98 21,423.31 10,170.37 1,028.34
WAFRAH 25.26 9.45 2.67 -0.27 (M) 20.00 505.20 189.00 -5.36
SADAFCO 124.54 34.43 3.62 9.47 13.14 32.50 4,047.55 1,119.12 307.92
Almarai 68.49 16.02 4.28 2.59 26.40 800.00 54,792.00 12,813.77 2,075.62
Anaam Holding 17.34 9.73 1.78 0.60 28.88 19.60 339.86 190.79 11.77
H B 62.11 22.29 2.79 3.73 16.67 28.57 1,774.57 637.00 106.44
Herfy Foods 78.41 16.39 4.78 4.49 17.47 46.20 3,622.54 757.18 207.35
Catering 103.13 15.92 6.48 7.65 13.49 82.00 8,456.66 1,305.53 627.05
NADEC 23.96 16.73 1.43 1.50 16.00 84.70 2,029.41 1,417.41 126.81
Qassim Agriculture 9.36 7.14 1.31 0.70 7.36 50.00 468.00 357.16 35.05
Tabuk Agriculture 11.45 12.60 0.91 -0.52 (M) 45.00 515.25 566.80 -23.49
Saudi Fisheries 13.95 3.28 4.25 -0.78 (M) 53.54 746.85 175.66 -41.83
Sharqiya Dev Co 44.23 7.82 5.66 -1.13 (M) 7.50 331.73 58.64 -8.46
Jouff Agriculture 34.78 29.11 1.19 2.85 12.21 30.00 1,043.40 873.22 85.47
Bishah Agriculture* 69.75 - - - - 5.00 348.75 - -
Jazan Development 11.09 12.63 0.88 0.49 22.63 50.00 554.50 631.45 24.50
Total Agriculture & Food Industries - 16.55 3.23 2.41 21.26 1,888.59 100,999.58 31,263.09 4,557.17
STC 72.55 29.74 2.44 4.17 17.40 2,000.00 145,100.00 59,480.09 8,338.89
Etihad Etisalat 23.99 20.04 1.20 -0.16 (M) 770.00 18,472.30 15,427.00 -121.69
Zain KSA 8.29 6.33 1.31 -1.95 (M) 583.73 4,839.11 3,695.04 -1,136.34
Atheeb Telecom 2.95 2.69 1.10 -1.07 (M) 157.50 464.63 423.35 -167.87
Total Telecomm. & Information Tech. Sector - 22.51 2.14 1.97 17.40 3,511.23 168,876.04 79,025.48 6,912.99
Tawuniya 108.46 27.31 3.97 6.64 16.34 100.00 10,846.00 2,730.53 663.71
METLIFE AIG ANB 24.63 6.97 3.53 -0.67 (M) 35.00 862.05 244.00 -23.44
Jazira Takaful 30.05 10.61 2.83 0.68 44.43 35.00 1,051.75 371.36 23.67
Malath Insurance 8.70 3.75 2.32 -4.89 (M) 30.00 261.00 112.48 -146.77
MEDGULF 27.05 9.45 2.86 -0.72 (M) 100.00 2,705.00 945.32 -71.63
ALLIANZE SF 32.61 10.99 2.97 1.32 24.65 20.00 652.20 219.77 26.46
SALAMA 12.33 7.30 1.69 0.29 42.19 25.00 308.25 182.39 7.31
Walaa Insurance 22.41 9.85 2.28 2.57 8.73 40.00 896.40 393.96 102.68
Arabian Shield 40.43 15.44 2.62 3.20 12.63 20.00 808.60 308.74 64.04
SABB Takaful 29.07 10.59 2.75 -0.02 (M) 34.00 988.38 360.06 -0.64
SANAD * 15.23 - - - - 20.00 304.60 - -
SAICO 18.92 11.32 1.67 1.81 10.46 25.00 473.00 282.96 45.24
WAFA Insurance 16.16 5.61 2.88 -0.15 (M) 20.50 331.28 114.90 -3.00
Gulf Union 11.28 6.05 1.86 0.66 17.04 22.00 248.16 133.19 14.56
ATC 40.44 12.34 3.28 1.77 22.81 16.67 674.00 205.74 29.55
Al - Ahlia 5.89 3.11 1.89 -1.30 (M) 32.00 188.48 99.48 -41.44
ACIG 15.12 6.33 2.39 0.65 23.18 20.00 302.40 126.61 13.05
AICC 11.30 8.98 1.26 0.38 29.45 26.50 299.45 238.00 10.17
Trade Union 17.03 10.26 1.66 1.24 13.73 27.50 468.33 282.06 34.12
Sagr Insurnce 39.63 21.97 1.80 8.05 4.92 25.00 990.75 549.17 201.32
U C A 13.08 7.67 1.70 -0.01 (M) 49.00 640.92 375.98 -0.60
Saudi Re 6.03 7.68 0.78 0.20 29.96 100.00 603.00 768.18 20.13
Bupa Arabia 131.38 24.01 5.47 8.08 16.26 80.00 10,510.40 1,921.05 646.54
* Weqaya Takaful 19.39 - - - - 20.00 387.80 - -
Al Rajhi Takaful 38.57 9.92 3.89 1.52 25.31 40.00 1,542.80 396.80 60.96
CHUBB 45.07 21.50 2.10 3.09 14.60 10.00 450.70 215.00 30.87
AXA - Cooperative 17.23 10.94 1.58 0.84 20.58 45.00 775.35 492.10 37.67
Gulf General 16.13 9.30 1.74 -0.43 (M) 20.00 322.60 185.93 -8.52
Buruj 24.11 10.79 2.23 1.85 13.00 25.00 602.75 269.71 46.37
Al Alamiyah 24.65 8.21 3.00 1.14 21.62 40.00 986.00 328.34 45.61
Solidarity 8.55 3.93 2.18 0.73 11.74 55.50 474.53 218.08 40.40
Wataniya 26.19 8.31 3.15 0.18 142.69 20.00 523.80 166.18 3.67
Amana Insurance 8.45 3.67 2.30 0.54 15.67 32.00 270.40 117.33 17.26
Enaya 16.21 8.83 1.84 -1.60 (M) 20.00 324.20 176.63 -32.07
Alinma Tokio M 18.88 6.50 2.90 -0.48 (M) 45.00 849.60 292.47 -21.39
Total Insurance Sector - 10.84 3.10 1.44 15.91 1,275.67 42,924.92 13,824.51 1,835.86
SARCO 40.18 18.03 2.23 -0.39 (M) 15.00 602.70 270.42 -5.83
Saudi Advanced 12.05 14.66 0.82 -0.10 (M) 50.00 602.50 733.23 -5.24
Al Ahsa for Dev. 11.65 10.23 1.14 -0.26 (M) 49.00 570.85 501.35 -12.94
SISCO 14.89 14.77 1.01 1.36 10.98 68.00 1,012.52 1,004.03 92.23
Assir 17.95 18.18 0.99 -0.37 (M) 126.39 2,268.68 2,297.30 -46.91
Al Baha * 13.50 - - - - 15.00 202.50 - -
Kingdom 12.01 7.31 1.64 0.14 87.69 3,705.88 44,507.65 27,098.00 507.58
Total Multi-Investment Sector - 7.92 1.56 0.13 75.89 4,029.27 49,767.40 31,904.33 528.88

FINANCIAL INDICATORS -29/12/2016
Net Income (mn)Market Cap. (mn) Shareholders' Equity (mn)Company Close Price Book Value (SAR) P/B Value EPS (SAR) P/E Ratio Issued Shares (mn)
Takween 13.61 5.03 2.71 -0.13 (M) 95.00 1,292.95 477.60 -12.55
MEPCO 16.54 14.59 1.13 1.99 8.32 50.00 827.00 729.63 99.40
BCI 25.94 17.06 1.52 1.76 14.70 27.50 713.35 469.12 48.53
MA'ADEN 38.99 23.69 1.65 0.32 120.12 1,168.48 45,558.97 27,683.38 379.29
Astra Indust 17.13 17.09 1.00 -0.29 (M) 80.00 1,370.40 1,367.09 -23.44
ALSorayai 10.41 10.31 1.01 -1.35 (M) 37.50 390.38 386.78 -50.53
Shaker 16.80 17.93 0.94 0.95 17.76 63.00 1,058.40 1,129.37 59.58
Pharmaceutical 40.87 22.71 1.80 1.30 31.53 120.00 4,904.40 2,725.54 155.53
Glass 19.89 18.93 1.05 1.04 19.18 30.00 596.70 567.80 31.11
FIPCO 35.63 16.87 2.11 0.78 45.56 11.50 409.75 194.06 8.99
Maadaniyah 24.21 14.74 1.64 0.85 28.42 28.11 680.59 414.30 23.95
Saudi Chemical 38.94 25.21 1.54 2.82 13.81 63.24 2,462.57 1,594.39 178.29
SPM 10.35 11.00 0.94 -1.72 (M) 45.00 465.75 494.92 -77.41
AlAbdullatif 15.43 15.33 1.01 0.49 31.20 81.25 1,253.69 1,245.20 40.19
Saudi Export 35.65 10.39 3.43 -0.41 (M) 10.80 385.02 112.25 -4.48
Total Industrial Investment Sector - 20.71 1.58 0.45 57.05 1,911.38 62,369.90 39,591.41 856.45
ASLAK 25.73 11.74 2.19 1.87 13.73 43.88 1,128.90 514.88 82.25
Bawan 22.62 13.62 1.66 2.03 11.15 60.00 1,357.20 817.10 121.73
EIC 24.19 13.74 1.76 1.04 23.22 45.00 1,088.55 618.40 46.88
ALYAMAMAH STEEL 29.10 13.43 2.17 3.59 8.12 50.80 1,478.28 682.44 182.15
MMG * 12.55 - - - - 125.00 1,568.75 - -
SSP 19.09 15.56 1.23 0.36 52.87 51.00 973.59 793.54 18.42
ALKHODARI 13.20 14.36 0.92 -1.58 (M) 55.78 736.31 801.21 -88.02
Ceramic 33.26 36.56 0.91 1.72 19.28 50.00 1,663.00 1,828.00 86.23
Gypsum 13.26 14.51 0.91 0.37 35.56 31.67 419.90 459.46 11.81
Cables 6.09 5.11 1.19 -0.55 (M) 76.00 462.84 388.41 -42.08
Saudi Industrial 10.32 9.35 1.10 -0.52 (M) 40.00 412.80 373.90 -20.76
Amiantit 8.26 12.16 0.68 -0.30 (M) 115.50 954.03 1,404.98 -34.42
Pipes 17.75 15.42 1.15 -0.43 (M) 40.00 710.00 616.77 -17.15
Zamil Industrial 31.00 31.67 0.98 3.33 9.31 60.00 1,860.00 1,900.10 199.74
AL Babtain 25.34 18.94 1.34 3.64 6.95 42.63 1,080.28 807.25 155.34
SVCP 71.79 19.07 3.77 6.19 11.60 15.00 1,076.85 286.00 92.84
MESC 8.22 7.57 1.09 0.30 27.15 60.00 493.20 454.42 18.17
Red Sea 29.55 16.60 1.78 1.72 17.16 60.00 1,773.00 995.70 103.33
Total Building & Constructuion Sector - 13.44 1.40 0.90 12.86 1,022.25 19,237.48 13,742.56 916.47
Real Estate 26.63 28.12 0.95 0.79 33.69 120.00 3,195.60 3,374.00 94.87
Taiba 40.18 24.26 1.66 1.79 22.43 150.00 6,027.00 3,638.96 268.74
Makkah 90.64 48.45 1.87 1.95 46.47 164.82 14,938.94 7,985.05 321.48
Arriyadh Development 22.75 13.89 1.64 2.31 9.83 133.33 3,033.33 1,852.61 308.59
Emaar E .C 17.16 9.98 1.72 0.15 115.74 850.00 14,586.00 8,483.04 126.02
Jabal Omar 74.74 10.85 6.89 0.63 119.55 929.40 69,463.36 10,079.85 581.06
Dar Al Arkan 6.16 16.80 0.37 0.24 25.37 1,080.00 6,652.80 18,140.22 262.24
KEC 18.06 9.22 1.96 -0.04 (M) 339.30 6,127.76 3,128.46 -12.24
ALANDALUS 19.64 13.13 1.50 1.39 14.10 70.00 1,374.80 919.02 97.50
Total Real Estate development Sector - 15.01 2.18 0.53 57.89 3,836.85 125,399.59 57,601.20 2,048.25
Bahri 43.37 24.72 1.75 5.08 8.53 393.75 17,076.94 9,733.02 2,001.42
SGS 66.16 15.68 4.22 4.01 16.50 188.00 12,438.08 2,948.00 753.99
SAPTCO 15.18 12.50 1.21 0.68 22.18 125.00 1,897.50 1,562.70 85.56
Mubarrad 59.80 12.72 4.70 1.85 32.32 24.00 1,435.20 305.30 44.41
Budget Saudi 33.72 15.79 2.14 3.10 10.89 61.00 2,056.92 963.18 188.90
Total Transport Sector - 19.59 2.25 3.88 11.35 791.75 34,904.64 15,512.20 3,074.28
Tihama 33.96 4.69 7.24 -2.19 (M) 15.00 509.40 70.33 -32.84
SRMG 33.88 10.67 3.18 -3.72 (M) 80.00 2,710.40 853.47 -297.63
SPPC 20.11 15.45 1.30 -0.62 (M) 60.00 1,206.60 926.77 -37.21
Total Media & Publishing Sector - 11.94 2.39 -2.37 - 155.00 4,426.40 1,850.56 -367.69
ALTAYYAR 36.66 25.87 1.42 4.28 8.57 209.65 7,685.77 5,423.00 896.93
Al Hokair Group 38.35 14.90 2.57 2.90 13.24 55.00 2,109.25 819.70 159.29
Dur 23.93 17.64 1.36 1.14 21.03 100.00 2,393.00 1,763.67 113.80
Shams 33.44 9.61 3.48 -0.04 (M) 10.15 339.42 97.53 -0.43
Total Hotel & Tourism Sector - 21.62 1.55 3.12 10.42 374.80 12,527.44 8,103.90 1,169.60
RIYAD REIT 11.10 10.00 1.11 - - 50.00 555.00 499.79 -
Total REITs - 10.00 1.11 - 0.00 50.00 555.00 499.79 0.00
Total Market - 18.79 1.72 1.84 15.72 51,935.46 1,681,949.55 976,086.705 95,411.18
* S uspended
M: Minus ratio due to company losses according to recent 4 quarters financial data (3rd - Q 2016 as recent for all companies).
Companies that have not announced a net income statement or have posted negative net income (recent 4 Quarters), are not included in calculating P/E ratio for sectors and the market.

Sukuk & Bonds Coupon (Annual Return) Maturity Date Par Value (SAR)Issue Size
(SAR mn)
Sadara sukuk 6 months SAIBOR + 0.95 % 15-12-2028 50,000 7,500
Sipchem Sukuk* SIBOR + 1.75% 06-07-2016 100,000 1,800
Bahri Sukuk 6 months SAIBOR + 0.80 % 30-07-2022 1,000,000 3,900
Saudi Electricity 3 SIBOR +0.95% 10-05-2030 10,000 7,000
Saudi Electricity 4 3 months SIBOR +0.7% 30-01-2024 1,000,000 4,500
SATORP Sukuk 6 Months SIBOR +0.95% 20-12-2025 93,090 3,490
* Delisted on 15/06/2016
Tradable Sukuk and Bonds in Tadawul -2016
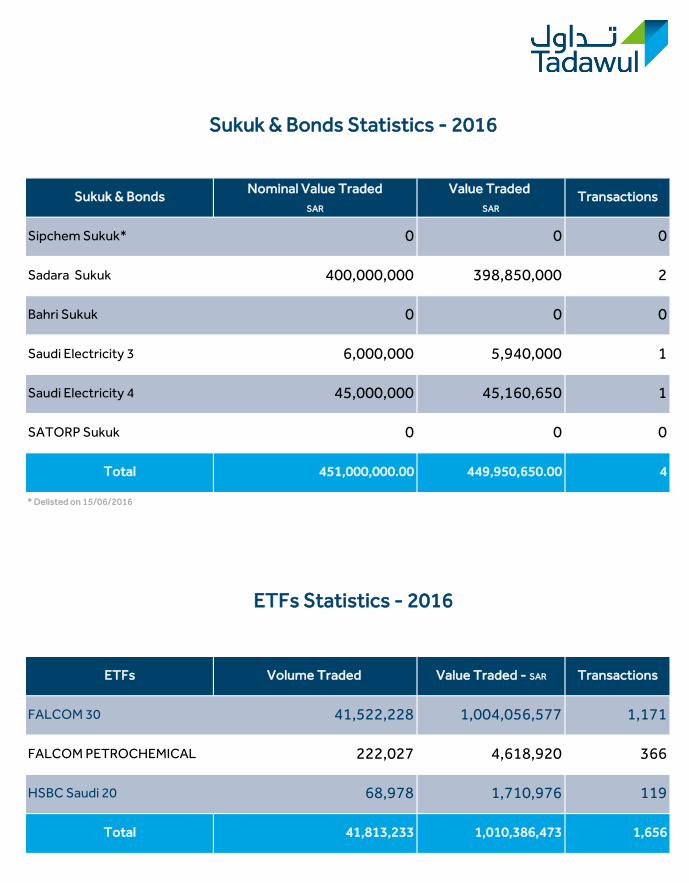
Sukuk & BondsNominal Value Traded
SAR
Value Traded
SARTransactions
Sipchem Sukuk* 0 0 0
Sadara Sukuk 400,000,000 398,850,000 2
Bahri Sukuk 0 0 0
Saudi Electricity 3 6,000,000 5,940,000 1
Saudi Electricity 4 45,000,000 45,160,650 1
SATORP Sukuk 0 0 0
Total 451,000,000.00 449,950,650.00 4
* Delisted on 15/06/2016
ETFs Volume Traded Value Traded - SAR Transactions
FALCOM 30 41,522,228 1,004,056,577 1,171
FALCOM PETROCHEMICAL 222,027 4,618,920 366
HSBC Saudi 20 68,978 1,710,976 119
Total 41,813,233 1,010,386,473 1,656
ETFs Statistics - 2016
Sukuk & Bonds Statistics - 2016