Annual Review of Salary and Benefits for International Staff, National · PDF fileAnnual...
55
October 2014 Annual Review of Salary and Benefits for International Staff, National Staff, and Administrative Staff Distribution of this document is restricted until it has been approved by the Board of Directors. Following such approval, ADB will disclose the document to the public in accordance with ADB's Public Communications Policy 2011.
Transcript of Annual Review of Salary and Benefits for International Staff, National · PDF fileAnnual...

October 2014
Annual Review of Salary and Benefits for International Staff, National Staff, and Administrative Staff
Distribution of this document is restricted until it has been approved by the Board of Directors.
Following such approval, ADB will disclose the document to the public in accordance with ADB's
Public Communications Policy 2011.

ABBREVIATIONS
ADB – Asian Development Bank CPI – consumer price index
FY – fiscal year
IAE – internal administrative expenses
MRP – market reference point
NSAS – national staff and administrative staff
SMI – supplemental merit increase
SPA – salary progression adjustment
US – United States
GLOSSARY
comparatio – The ratio of a salary to the midpoint. This is an indicator of the extent to which salaries are aligned with the midpoint.
market positioning
–
The competitive positioning of the organization within the market. For example, a market positioning at the 75th percentile indicates that the organization’s objective is to set its pay at a level above 75% of organizations in the defined market for similar jobs.
market reference point
–
The point near the middle of a salary range, around which the salary range is constructed. Its value is set close to the market value of the grade level and serves as the reference point with which average salaries are aligned.
midpoint –
The market reference point in a symmetrical salary range. The market reference point is midway between the minimum and maximum of the grade level range.
payline
–
The midpoints for consecutive grades often plotted as a line to show pay progression by grade level.
salary budget increase
–
The projected growth in the amount of salaries and other salary-related personnel actions such as promotions and confirmation increases to be paid in a year over the corresponding amount in the previous year.
salary increase
–
The percentage increase to be applied to actual salary or to the midpoints of the new salary structure.
salary range
–
The range within which the salaries of a group of staff are administered. Each grade level has its own salary range, which is defined in terms of a minimum, a midpoint, and a maximum.
salary structure – The set of salary ranges that are established for various grade levels.

salary structure increase
–
The average percentage increase in the midpoints of the salary structure from 1 year to the next.
NOTE
In this report, "$" refers to US dollars, unless otherwise stated.
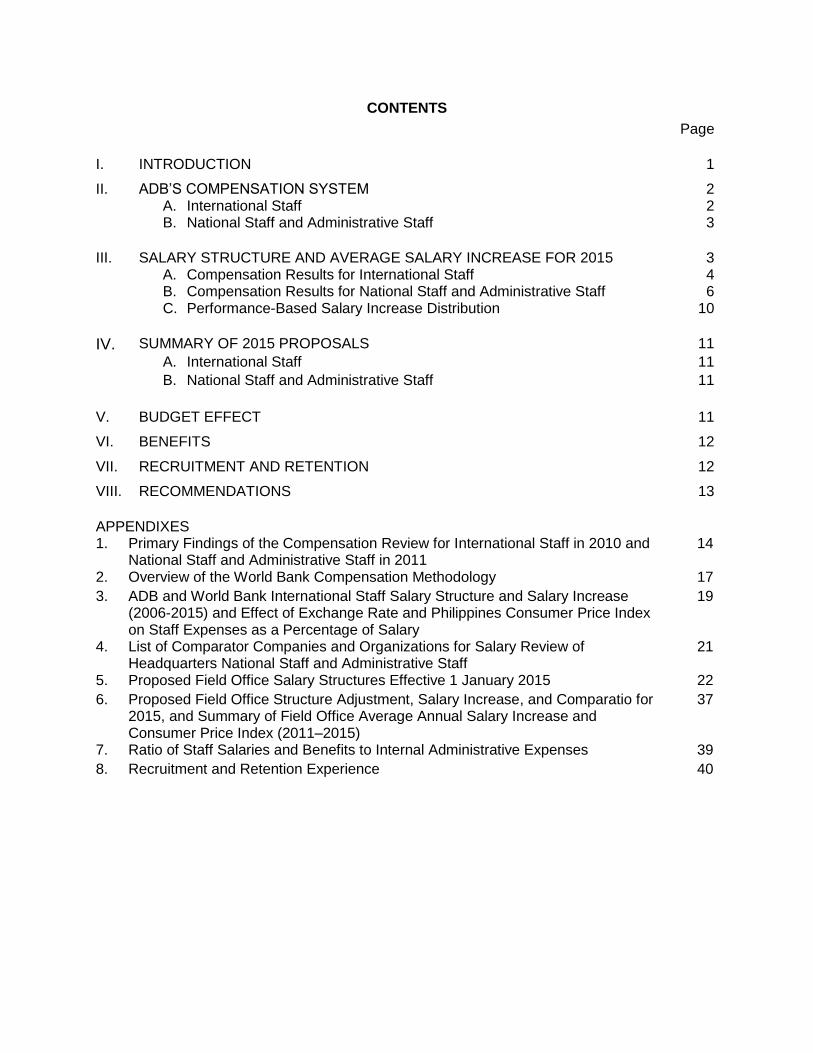
CONTENTS
Page I. INTRODUCTION 1
II. ADB’S COMPENSATION SYSTEM A. International Staff B. National Staff and Administrative Staff
2 2 3
III. SALARY STRUCTURE AND AVERAGE SALARY INCREASE FOR 2015 A. Compensation Results for International Staff B. Compensation Results for National Staff and Administrative Staff C. Performance-Based Salary Increase Distribution
3 4 6
10
IV. SUMMARY OF 2015 PROPOSALS 11
A. International Staff 11
B. National Staff and Administrative Staff 11
V. BUDGET EFFECT 11
VI. BENEFITS 12
VII. RECRUITMENT AND RETENTION 12
VIII. RECOMMENDATIONS 13
APPENDIXES 1. Primary Findings of the Compensation Review for International Staff in 2010 and
National Staff and Administrative Staff in 2011 14
2. Overview of the World Bank Compensation Methodology 17
3. ADB and World Bank International Staff Salary Structure and Salary Increase (2006-2015) and Effect of Exchange Rate and Philippines Consumer Price Index on Staff Expenses as a Percentage of Salary
19
4. List of Comparator Companies and Organizations for Salary Review of Headquarters National Staff and Administrative Staff
21
5. Proposed Field Office Salary Structures Effective 1 January 2015 22
6. Proposed Field Office Structure Adjustment, Salary Increase, and Comparatio for 2015, and Summary of Field Office Average Annual Salary Increase and Consumer Price Index (2011–2015)
37
7. Ratio of Staff Salaries and Benefits to Internal Administrative Expenses 39
8. Recruitment and Retention Experience 40

I. INTRODUCTION 1. This paper presents to the Asian Development Bank (ADB) Board of Directors the results of the annual review of salary and benefits for international staff, and national staff and administrative staff (NSAS) at headquarters and in field offices. It seeks Board approval of the 2015 salary structures and corresponding salary increase proposals for all staff. This review has been completed in accordance with the compensation system approved by the Board for international staff in November 2010 and NSAS in November 2011. The annual review is conducted to assess the competitiveness of ADB’s compensation practices with the overall strategic objective to remain an employer of choice that is able to attract and retain a very diverse workforce of the highest caliber while being fiscally prudent.1 Similar to the review papers in 2012 and 2013, this document consolidates recommendations for staff salaries for international staff and NSAS at headquarters and in 30 field offices. 2. Given the midterm review of Strategy 2020 and the total compensation review scheduled for 2015, a broader discussion will be needed about strategic staffing, workforce planning, talent management, and the right compensation system to support ADB’s business needs.2 In the meantime, the salary increase proposals contained in this paper continue to balance the results of the rules-based compensation methodology that will ensure market competitiveness and financial sustainability within ADB’s constricted overall budget resources in light of lower projected lending levels and net income, given current global market conditions. The salary increase proposed for staff has been determined by targeting a higher comparatio for international staff of 93.9% than last year’s 93.3%, and a lower combined comparatio for NSAS of 97.9% (97.0% for NSAS in headquarters and 99.7% for NSAS in field offices) than last year’s 99.0%. Management requests that the Board of Directors approve its proposal, which reflects (i) an overall modest budget impact of $5.1 million (2.2% of total payroll or 0.8% of the 2015 internal administrative expense [IAE] budget) for salary increases and (ii) $1.1 million for salary-related benefits, which in aggregate amounts to $6.2 million (2.7% of total payroll or 1.0% of the 2015 IAE). 3. An organization’s compensation system is critical to achieving its operational goals especially in an increasingly competitive recruitment environment. For the organization, the compensation system must be appropriately competitive to allow for recruitment and retention of the talent needed. For staff, compensation is the most tangible reward for performance, productivity, and proficiency. One of the principles of ADB’s Our People Strategy is to “offer competitive remuneration, benefits, and rewards aligned with the nature and objectives of the organization and with the marketplace, to complement the attractiveness of ADB’s mission and rewarding work environment.”3 ADB’s compensation system is merit-based with pay increases based on individual performance. Automatic increases and cost-of-living adjustment are not provided.
4. ADB conducted remuneration studies for international staff in 2010, for NSAS at headquarters in 2011, and for specific field offices from 2011 to 2014. The primary objective of these comprehensive reviews is to assess the overall competitiveness of ADB’s compensation package in the various markets ADB recruits from and loses talent to. These reviews included a comparison of total remuneration (salaries, allowances, and employer-provided benefits) for
1 Competitive compensation and benefits are the core of a strong employment value proposition, which includes
ADB’s compelling mission and standing in the international development community; challenging and rewarding work; a diverse workforce; an intellectually dynamic environment; and a range of experiences provided by the depth and breadth of its client base, products, and services.
2 ADB. 2008. Strategy 2020: The Long-Term Strategic Framework of the Asian Development Bank, 2008–2020.
Manila. 3 ADB. 2010. Our People Strategy. Manila.

2
international staff with six other international organizations. For NSAS, the review was based on a compensation survey of local comparators in each of their respective duty stations. Appendix 1 summarizes the primary findings of these reviews.
II. ADB’S COMPENSATION SYSTEM
5. ADB follows the same market-based compensation system for all staff. Salaries are positioned at the 75th percentile of the defined relevant market for each category of staff. The difference for international staff and NSAS lies in the market reference used for salary comparisons. The World Bank4 serves as the proxy for the global market for international staff and for local markets for field office NSAS; for headquarters NSAS, salaries are compared with those offered by 15 companies and international organizations in Manila.5 Appendix 2 provides an overview of the World Bank’s market-based compensation methodology; similar steps are taken in conducting ADB’s market-based salary survey for NSAS at headquarters. Under the market-based compensation system, salary adjustments from 1 year to the next are not directly linked to the cost-of-living or consumer price index (CPI) movements. These indexes are reflected implicitly in the market movement of salaries in the global or local market settings, which are also influenced by labor market conditions (e.g., supply versus demand for specific skills, global economic fluctuations, and domestic fiscal conditions). 6. The recommendations in the 2010 and 2011 salary and benefits review reflect the following key principles of ADB’s compensation system:
(i) remain market competitive by reflecting labor market changes to attract and retain top talent,
(ii) maintain a rules-based compensation system whereby salary increases are determined through a transparent formula-driven methodology,
(iii) remain fiscally prudent in recognition of budgetary requirements and in response to external market economic conditions, and
(iv) award differentiated salary increases according to performance. 7. The two significant changes introduced as a result of the 2011 review for NSAS were (i) Board approval of the annual compensation review of field offices; and (ii) a new formula to determine salary increases, which results in a more modest overall growth of staff salaries by setting a target comparatio at or below the payline (i.e., 100% comparatio), reflecting factors such as average time in grade, salary dilution, recruitment and retention experience, and budget impact.6 A. International Staff 8. Based on the results of the 2010 international staff comprehensive review, the Board approved a revised compensation system to guide the formulation of the salary structure increase and salary increase proposals until the next comprehensive review in 2015. 9. The main features of the new compensation system are as follows:
4 Any reference to the World Bank refers to the World Bank Group, which includes the International Bank for
Reconstruction and Development, the International Finance Corporation, and many other organizations. 5 Except for the Japan Representative Office. Market data for this office is based on the Towers Watson market
compensation data for Tokyo, which is designed to be locally competitive in accordance with ADB’s compensation policy. The World Bank’s salary structure for Japan is intended to be globally competitive since the World Bank considers its Tokyo office as a satellite office of its headquarters.
6 This feature of not using 100% comparatio as an annual target to determine the salary increase recommendation
has been in place for international staff since 2006, as a result of the 2005 comprehensive review.

3
(i) The system is market driven, and a major review of its compensation methodology is scheduled every 5 years.
(ii) In the years between broad-based market studies, the World Bank will be the principal comparator and its Washington headquarters professional staff salary survey will serve as a proxy for salary movements in the market.7 The World Bank’s market reference points (MRPs) will be the basis for setting ADB’s job level midpoints.
(iii) Based on job equivalency (Table 1), midpoints of ADB international staff levels IS1, IS3, IS5, IS7, and IS9 are anchored to the MRPs of World Bank levels E, F, G, H, and I, respectively. Midpoints for the intervening ADB levels IS2, IS4, IS6, and IS8 are interpolated to establish the new payline. The midpoint for ADB international staff level IS10 is positioned about midway between levels I and J of the World Bank.
(iv) Full parity with the market (i.e., a 100% comparatio) is targeted for international staff levels IS1–IS6 by 2015.
(v) The average salary increase rate will be set at a level higher than the average structure increase to enable salaries of staff to progress within the range.
(vi) Salary increases will be applied to the range midpoint, as they have been since 2009.
B. National Staff and Administrative Staff 10. Based on the results of the 2011 comprehensive review, the Board approved the following main features of the NSAS compensation system until the next major review in 2015:
(i) The market-based approach will be retained. (ii) At headquarters, ADB will develop its salary structure based on a customized
salary survey of comparators in Manila; for field offices, ADB will continue to base its salary structure on the salary structure of the World Bank, which conducts custom surveys periodically in all of ADB field office locations.
(iii) The market positioning for NSAS in headquarters and in field offices will be anchored at the 75th percentile of total cash (including base pay, incentive pay, and allowances plus the value of in-kind benefits not provided by ADB) in each of its duty station locations.8
(iv) Where applicable, ADB will separate the salary increase pool for NSAS to better align to their respective salary midpoints and to remain competitive in the market.
(v) The average salary increase proposal will continue to be determined based on generally achieving a desired level of parity with the market payline (the target comparatio assigned depending on circumstances that may be peculiar to headquarters or a particular field office, such as time in grade, high turnover, or new office).
(vi) Salary increases will be applied to the range midpoint, as they have been since 2009.
III. SALARY STRUCTURE AND AVERAGE SALARY INCREASE FOR 2015
11. Based on ADB’s compensation principle of ensuring competitiveness with the relevant market reference, the salary structure is adjusted based on the movement of the comparator market. The structure adjustment, average salary of staff, and a desired level of parity with the payline (i.e., the target comparatio) are inputs in determining the overall salary increase. The overall salary increase and assumed distribution of performance ratings determine the salary
7 Broad-based market studies will be conducted every 4–5 years; the next one will be in 2015.
8 Some examples of in-kind benefits are uniforms, memberships in fitness centers, transportation allowance, mobile
allowance, subsidized company products, rice, meals, beverages, and a car program.

4
increase matrix for each staff category or location.9 The salary increase given to staff members is based only on their individual performance ratings as a percentage of the midpoint of their respective grade level. Staff do not receive an automatic increase equal to the average structure increase or a minimum cost-of-living adjustment. Staff rated unsatisfactory receive no salary increase, and their salary can be lower than the minimum salary for their grade level. A. Compensation Results for International Staff 1. Structure Increase for 2015 12. The salary structure increase represents the adjustment or movement of the market payline from year to year. Since the World Bank’s MRPs are being used as the market proxy for this purpose, the structure increase is effectively the movement of the World Bank’s MRPs for the grades that are equivalent to ADB job levels, resulting in a 2.3% average salary structure increase for 2015 (Table 1).10
Table 1: International Staff Structure Increase for 2015
World Bank ADB
Grade
MRP as of
1 July 2013 ($)
MRP as of
1 July 2014 ($)
MRP Movement
(%) ADB Level
Confirmed Staff (No.)
2014 Midpoint
a
($)
2015 Midpoint
a
($)
Midpoint Movement
(%)
E 82,300 84,200 2.3 IS1 7 81,500 83,400 2.3
IS2 17 94,900 97,100 2.3
F 109,400 111,900 2.3 IS3 71 108,300 110,800 2.3
IS4 220 128,000 130,900 2.3
G 147,600 151,000 2.3 IS5 252 147,600 151,000 2.3
IS6 218 174,400 178,400 2.3
H 201,100 205,700 2.3 IS7 88 201,100 205,700 2.3
IS8 62 235,500 240,900 2.3
I 269,800 276,000 2.3 IS9 27 269,800 276,000 2.3
IS10 17 290,000 296,700 2.3
IS1–IS6 785 144,264 147,570 2.3
IS7–IS10 194 229,445 234,708 2.3
All IS Levels
979 161,144 164,837 2.3
ADB = Asian Development Bank, IS = international staff, MRP = market reference point. a Under the new ADB compensation system, international staff at levels IS1 and IS3 are anchored at 99% of the
World Bank grade levels E and F, respectively, to reflect more accurately global market positioning. ADB international staff levels IS5, IS7, and IS9 are anchored at 100% of the World Bank grade levels G, H, and I, respectively. The midpoint for ADB international staff level IS10 is positioned at the MRP of World Bank level I plus 7.5%.
Source: ADB.
2. Proposed Salary Structure
13. Table 2 shows the proposed salary structure for 2015 based on a weighted structure increase of 2.3% and the same salary range spread that has been used since 2013.
9 The four performance ratings are exceptional, satisfactory with special recommendation, satisfactory, and
unsatisfactory. 10
As in 2013 (FY2014, which ends on 30 June at the World Bank), the World Bank headquarters salary structure for
2014 (FY2015) was adjusted using published projected market pay increases resulting from the application of the indexation methodology in accordance with its multi-year review process.

5
Table 2: International Staff Salary Structure Effective 1 January 2015
ADB Level
2015 Minimum
($)
2015 Midpoint
($)
2015 Maximum
($)
Range Spread
(%)
IS1 75,800 83,400 91,000 20
IS2 84,400 97,100 109,700 30
IS3 94,300 110,800 127,300 35
IS4 111,400 130,900 150,400 35
IS5 125,800 151,000 176,100 40
IS6 148,700 178,400 208,200 40
IS7 171,400 205,700 240,000 40
IS8 200,800 240,900 281,100 40
IS9 234,900 276,000 317,100 35
IS10 263,700 296,700 329,600 25
ADB = Asian Development Bank, IS = international staff. Source: ADB.
3. Proposed Average Salary Increase
14. The compensation system allows ADB the flexibility to set the salary increase. At a minimum, it should be set higher than the structure increase to allow salaries to progress along the salary range to reward staff for proficiency and performance. This would also improve the comparatio, which projected at 92.3% for 31 December 2014 remains far below 100.0% of the market payline (represented by the salary midpoints). In setting the proposed salary increase, other factors are taken into account, such as salary budget costs for resource allocation priorities, the relativity of salary increases of comparator organizations, and budgetary considerations. 15. For international staff, the overall proposed salary increase is 4.0%. This includes (i) a structure adjustment component of 2.3%, which is the budgeted salary increase; and (ii) a budget-neutral salary increase component of 1.7%, which will be absorbed within the existing real budget envelope for 2015. The budget-neutral salary adjustment is provided to allow for salary progression along the salary range (i.e., comparatio improvement) and inclusion of an additional merit increase for high performers rated exceptional and satisfactory with special recommendation. The proposed total salary increase of 4.0% is considered reasonable for the following reasons:
(i) The World Bank staff's comparatio is at 97.1%, whereas ADB staff's comparatio after the salary increase would only be at 93.9%. Even for international staff at levels IS1–IS6, for which the compensation methodology approved by the Board in 2010 called for full parity (i.e., 100% comparatio) with the market payline by 2015, the comparatio after the proposed salary increase would only be at 95.2%. Appendix 3 (Table A3.1) shows the 10-year historical comparison of the structure adjustment and salary increase for the World Bank and ADB.
(ii) The price impact of the salary increase on the overall budget is only 2.3% of payroll or 0.6% of IAE. As a component of IAE, although there may have been slight increases during the intervening years, staff salaries have declined since 2005. Appendix 7 shows the 10-year historical ratio of staff salaries and benefits to the IAE.
(iii) The basket of goods consumed by expatriate staff as a proportion of pay has increased more quickly than salary increases because of higher inflation in Manila and the appreciation of the Philippine peso against the United States (US) dollar over the 10-year period 2005 to 2014. As illustrated in Appendix 3 (Table A3.2), the estimated local expenditure of 58% of pay in 2005 for a married staff member with two children would amount to 62% of pay in 2014 (based on the

6
salary increases awarded over this period, including promotions; the corresponding inflation rates in Manila; and the currency exchange rates).
(iv) In addition to the World Bank's salary increase of 4.0%, their Board approved about 1.3% of the World Bank’s total wage bill for performance awards (including rewards and recognition). ADB’s allocation for its rewards and recognition program is 0.1% of IAE, or $453,100.
16. For 2015, ADB is prioritizing bringing the salaries of international staff at levels IS1–IS6 closer to the market payline. Therefore, a split approach is being proposed whereby the average salary increase of 4.0% results in a differentiated increase of 4.2% for international staff levels IS1–IS6 and 3.6% for levels IS7–IS10. Table 3 shows the structure adjustment for each group, the proposed average salary increase, and the comparatio before and after the salary increase.
Table 3: International Staff Average Salary Increase and Estimated Comparatio
ADB Levels
Confirmed Staff (No.)
Structure Adjustment
(%)
Budget Neutral Salary
Increase Component
(%)
Proposed Average Salary
Increase (%)
Estimated Comparatio
before Salary
Increase (%)
Estimated Comparatio
after Salary
Increase (%)
IS1–IS6 785 2.3 1.9 4.2 91.3 95.2
IS7 –IS10 194 2.3 1.3 3.6 87.4 90.6
All IS Levels 979 2.3 1.7 4.0 90.2 93.9 ADB = Asian Development Bank, IS = international staff. Source: ADB.
B. Compensation Results for National Staff and Administrative Staff 1. Salary Structure for 2015
17. In accordance with the NSAS compensation system that follows a market-based approach, the salary structure for NSAS at headquarters and in each field office is adjusted annually based on movements in the local comparator labor market. 18. The current structure increase for headquarters NSAS is based on an annual survey of local comparators in Manila. Towers Watson conducted a quick salary survey of ADB’s comparators in Manila in the third quarter of 2014 (Appendix 4).11 Based on the results of the survey, a weighted average salary structure increase of 4.5% when compared with the 2014 midpoints is being proposed for headquarters NSAS for 2015. 19. The salary structure for field offices is linked to the World Bank resident mission in each of the duty station locations except for Japan, which is based on an independent survey conducted by Towers Watson. The World Bank salary structures are effective on 1 July, whereas ADB’s salary structures are effective the following 1 January. To recognize the 6-month lag between the effective dates, an aging factor is applied to the World Bank MRPs to determine the salary midpoints for ADB’s salary structure.12 The proposed structure adjustments
11
Customized salary surveys are conducted biennially under the compensation system for headquarters NSAS. In
the intervening year, a quick salary survey of the estimated salary increase that will be provided by comparators is used to adjust the salary structure.
12 The aging factors used are based on compensation data gathered by the Birches Group on local compensation
packages. Future trends in pay growth serve as a proxy for anticipated local labor market movement. Birches Group is an international compensation consulting firm that tracks salary developments in various locations. Where data for certain locations are not available, aging factors from reputable sources—such as the International Monetary Fund’s International Financial Statistics, the Asian Development Bank Economics and Research Department and the Reserve Bank of Australia—are used.

7
for each of the field offices are shown in Appendix 6, which results in an overall structure adjustment of all field offices of 4.4% for 2015. It should be noted that the salary structures for NSAS in all locations are based on net salaries (net of income tax) whereas in Japan, Philippines, and the US continue to reflect gross salaries.
20. Following the comprehensive review of the salary methodology for all NSAS conducted in 2011 and the reviews of a select number of locations in 2012 and 2013, a review of the remaining field offices for which Birches Group data is available—Afghanistan, Bangladesh, Georgia, Kazakhstan, Kyrgyz Republic, Nepal, Pakistan, Sri Lanka, Thailand, Turkmenistan, and Viet Nam—was conducted in 2014.13 The result of the review affirmed that ADB's weighted midpoints based on the World Bank salary structure were reasonably close to the weighted MRPs of the employers that participated in Birches Group’s independent survey. This confirms that the comparator organizations used by the World Bank in these locations are appropriate and are likely to be the same companies that ADB would select for salary comparisons. Thus, the structure movement will continue to be linked to the movement of the MRPs for the corresponding World Bank resident mission in the respective duty station location. 21. In 2014, the Kyrgyz Republic Resident Mission requested for an interim review of its salary structure given the devaluation of the Kyrgyz Republic Som to the US dollar and its effect on the prices of commodities in the Kyrgyz Republic. While devaluation of currency does not automatically cause an increase in compensation, it may be a factor in the change in the country’s CPI, which may be reflected in the local compensation data for which ADB uses the World Bank salary structure as a proxy. Following the World Bank’s change in the denomination and disbursement of salaries of staff in its country office in the Kyrgyz Republic from Kyrgyz Republic Som to US dollars, the same is being proposed for salaries of staff in the Kyrgyz Republic Resident Mission effective 1 January 2015. 2. Proposed Salary Structure
22. For headquarters NSAS, the salary midpoints from 2013 reflect base pay, the two bonus payments, and the dependency allowance component with the introduction of the new salary payment mode effective 1 July 2012.14 Table 4 shows the salary structure increase for NSAS at headquarters for 2015, which results in a weighted structure increase of 4.5%.
13
ADB subscribes to the Birches Group’s Indigo™ for access to its survey data, which includes information about
salaries, fixed allowances, variable pay, and in-kind benefits for most ADB field office locations. 14
This reflects the 2012 NSAS recommendation of discontinuing the 2-month bonus payment, which is now included
in base pay. In addition, the base pay includes an amount equal to the median dependency allowance, which was lowered following the dependency allowance buyout for parents and parents-in-law in 2011.

8
Table 4: Salary Structure Increase for National Staff and Administrative Staff at Headquarters, 2015
(Philippine pesos per year)
ADB Level Staff (No.)
2014 Midpoint
2015 Midpoint
Midpoint Movement
(%)
Administrative Staff
AS1 512,000 512,000 0.0
AS2 575,000 575,000 0.0
AS3 4 696,400 696,400 0.0
AS4 191 809,500 825,700 2.0
AS5 266 977,400 1,016,500 4.0
AS6 203 1,197,900 1,257,800 5.0
AS7 169 1,432,600 1,504,200 5.0
National Staff NS1 112 1,592,000 1,681,500 5.6
NS2 153 1,753,600 1,858,800 6.0
NS3 117 2,163,100 2,249,600 4.0
NS4 42 2,783,700 2,867,200 3.0
NS5 10 3,446,800 3,550,200 3.0
NS6 2 4,270,000 4,398,100 3.0
All AS 833 1,083,639 1,128,963 4.2
All NS 436 1,971,585 2,065,707 4.8
All 1,269 1,388,717 1,450,807 4.5
ADB = Asian Development Bank, AS = administrative staff, NS = national staff. Source: ADB.
23. Table 5 shows the proposed salary structure for NSAS at headquarters for 2015 using the same salary ranges used since 2013.
Table 5: Salary Structurea for National Staff and Administrative Staff at Headquarters
Effective 1 January 2015 (Philippine pesos per year)
ADB Level
2015 Minimum
2015 Midpoint
2015 Maximum
Range Spread
(%)
Administrative Staff
AS1 393,800 512,000 630,100 60
AS2 442,300 575,000 707,700 60
AS3 525,600 696,400 867,200 65
AS4 623,200 825,700 1,028,300 65
AS5 753,000 1,016,500 1,280,100 70
AS6 931,700 1,257,800 1,583,900 70
AS7 1,094,000 1,504,200 1,914,500 75
National Staff
NS1 1,222,900 1,681,500 2,140,100 75
NS2 1,351,900 1,858,800 2,365,800 75
NS3 1,606,900 2,249,600 2,892,400 80
NS4 2,048,000 2,867,200 3,686,400 80
NS5 2,535,900 3,550,200 4,564,600 80
NS6 3,141,500 4,398,100 5,654,700 80
ADB = Asian Development Bank, AS = administrative staff, NS = national staff. a Gross salary structure.
Source: ADB.

9
24. The proposed salary structure, effective 1 January 2015 for each ADB field office, is shown in Appendix 5; the weighted structure increase for each field office is shown in Appendix 6 (Table A6.1).
3. Average Salary Increase
25. Similar to the proposed salary increase for international staff, the average salary increase for NSAS is set higher than the structure increase to allow salaries to progress along the salary range to reward staff for proficiency and performance. For headquarters NSAS, the overall proposed salary increase is 7.6%, which includes a structure adjustment component of 4.5%, which is the budgeted salary increase and a budget-neutral salary increase component of 3.1% that will be absorbed within the existing real budget envelope for 2015. The budget-neutral salary increase component is provided to allow for salary progression along the salary range (i.e., comparatio improvement) and the inclusion of an additional merit increase for high performers rated exceptional and satisfactory with special recommendation. Table 6 shows the structure adjustment, the proposed average salary increase, and the resulting comparatio before and after the salary increase.
Table 6: Average Salary Increase and Estimated Comparatio for National Staff and
Administrative Staff at Headquarters
ADB Levels
Confirmed Staff (No.)
Structure Adjustment
(%)
Budget Neutral Salary
Increase Component
(%)
Proposed Average Salary
Increase (%)
Estimated Comparatio
before Salary
Increase (%)
Estimated Comparatio
after Salary
Increase (%)
All Levels 1,269 4.5 3.1 7.6 91.1 97.0
ADB = Asian Development Bank. Source: ADB.
26. Table 7 shows the average annual structure adjustment, nominal average annual salary increase, annual average CPI, and real annual salary increase for headquarters NSAS from 1 January 2011 to 1 January 2015.
Table 7: Summary of Average Annual Salary Increase and Consumer Price Index (2011–2015)
Year
Average Annual Structure Increase
(%)
Average Annual Salary Increase
(nominal) (%)
Average Annual CPI
a
(%)
Average Annual Salary Increase
(real) (%)
2011 3.9 7.6 3.6 4.0
2012 2.3 6.0 4.2 1.8
2013 2.9 5.0 3.0 2.0
2014 4.0 7.6 4.1 3.5
2015 4.5 7.6 4.9b 2.7
Average 3.4 6.7 3.9 2.8
CPI = consumer price index.
a Point-to-point inflation data from Republic of the Philippines National Statistics Office.
b Data as of 31 August 2014.
Source: Asian Development Bank.

10
27. For all of the field offices combined, the proposed overall salary increase is 7.0%, which includes (i) a structure adjustment component of 4.4% which is the budgeted salary increase and (ii) a budget-neutral salary increase component of 2.6%, which will be absorbed within the existing real budget envelope for 2015. The budget-neutral salary adjustment is provided to allow for salary progression along the salary range (i.e., comparatio improvement) and inclusion of an additional merit increase for high performers rated exceptional and satisfactory with special recommendation. The various currencies are converted to US dollars, based on the 31 August 2014 exchange rates. Appendix 6 (Table A6.1) shows the proposed overall average salary increase, the structure adjustment component (the budgeted salary increase), and the budget neutral-salary increase component for each field office. 28. Appendix 6 (Table A6.2) shows the average annual structure adjustment, nominal average annual salary increase, annual average CPI, and real annual salary increase for each field office from 1 January 2011 to 1 January 2015.
29. Table 8 shows the average annual structure adjustment, nominal average annual salary increase, annual average CPI, and real annual salary increase for field office NSAS from 1 January 2011 to 1 January 2015.
Table 8: Summary of Field Office Average Annual Salary Increase in Salary Currency (2011–2015)
Year
Average Annual
Structure Increase
(%)
Average Annual Salary Increase
(nominal) (%)
Average Annual CPI
a
(%)
Average Annual Salary Increase
(real) (%)
2011 7.1 11.1 7.8 3.3
2012 8.5 12.8 6.9 5.9
2013 4.0 6.5 5.7 0.8
2014 7.0 8.3 6.1 2.2
2015 4.4 7.0 4.8 2.2
Average 6.0 8.9 6.2 2.7 CPI = consumer price index.
a Data from the International Monetary Fund’s International Financial Statistics, the Asian Development Bank Economics and Research Department (for Azerbaijan, Turkmenistan, and Uzbekistan), and the Reserve Bank of Australia (for Australia).
Source: Asian Development Bank.
C. Performance-Based Salary Increase Distribution 30. Salary increases awarded in 2015 to individual staff will continue to be based on their performance and applied as a percentage of the midpoint salary of the staff member’s grade level. Individual pay increases are based entirely on individual performances. Staff do not receive an automatic increase or an automatic cost-of-living adjustment. 31. The salary increase matrixes will be linked to overall performance ratings (i.e., exceptional, satisfactory with special recommendation, satisfactory, or unsatisfactory) and will have ranges that allow flexibility for supervisors to award for relative performance. Staff rated exceptional or satisfactory with special recommendation will receive increases above the average salary increase. Staff members who are rated unsatisfactory will receive no salary increase. The allocation of the salary increase budget using the salary increase matrix will ensure that adequate funding is available to maintain a performance rating distribution of up to 10% of staff rated exceptional and up to 25% of staff rated satisfactory with special recommendation, with the remaining 65% for staff rated satisfactory.

11
32. International staff at all levels rated satisfactory will be subject to the same salary increase matrix; a higher salary increase matrix will be used for levels IS1–IS6 than for levels IS7–IS10 for staff rated satisfactory with special recommendation or exceptional. For NSAS at headquarters, the same salary increase matrix will be employed since there is no significant difference in their respective average comparatios. For NSAS in each field office, a split salary increase matrix may be warranted, depending on the difference in comparatios of national staff versus administrative staff relative to their midpoints.
IV. SUMMARY OF 2015 PROPOSALS A. International Staff 33. The salary proposal for international staff effective 1 January 2015 is an overall salary increase of 4.0%, which includes (i) a structure adjustment component of 2.3% (equal to the budgeted salary increase that results in the salary structure shown in Table 2); and (ii) a budget-neutral salary increase component of 1.7%, which is recommended to allow salary progression and merit increases for high performers. B. National Staff and Administrative Staff 34. The salary proposals for NSAS effective 1 January 2015 are as follows:
(i) for headquarters NSAS, an overall salary increase of 7.6%, which includes (i) a structure adjustment component of 4.5% (equal to the budgeted salary increase that results in the salary structure shown in Table 5); and (ii) a budget-neutral salary increase component of 3.1%, which is recommended to allow salary progression and merit increases for high performers; and
(ii) for NSAS in field offices, an overall salary increase of 7.0%, which includes (i) an average structure adjustment component of 4.4% (equal to the budgeted salary increase that results in the salary structure shown in Appendix 5); and (ii) an average budget-neutral salary increase component of 2.6%, which is recommended to allow salary progression and merit increases for high performers (Appendix 6).
V. BUDGET EFFECT
35. The increase in the salary budget is the projected growth in the amount of salaries and other salary-related personnel actions to be paid in 2015 over the corresponding figures in 2014. The overall increase in the salary budget will be used to fund increases in salaries and other salary-related personnel actions, such as confirmations, promotions, grade level alignment, and salary adjustments driven by operational requirements. The amount being requested to fund salary increases is limited to the salary structure adjustment component, which reflects market price movement. Since the proposed salary increase component in excess of the structure adjustment and other salary-related personnel actions (e.g., confirmation increase, promotion increase) will be absorbed within the existing real budget envelope for 2015, it will be budget neutral. These increases are expected to be funded through the projected salary dilution that is anticipated in 2015 (i.e., staff leaving on average have higher salaries than newly appointed staff) and prudent management of promotions. Table 9 shows the total estimated budget effect of the 2014 and 2015 salary increase proposals by staff category.
36. The proposals result in a request for new funds of $5.1 million for salary increases (0.8% of the estimated proposed 2015 budget) and $1.1 million for salary-related benefit costs (0.2% of the proposed 2015 budget). Appendix 7 shows the 10-year history (2005–2014) of the ratio of staff salaries and benefits to IAE. Based on the 2014 midyear estimate, staff salaries and

12
benefits are expected to represent about 61.1% of IAE (45.8% for international staff and 15.3% for NSAS), which is lower than the figure of 63.9% in 2013 (48.9% for international staff and 15.0% for NSAS).
Table 9: Budget Effect of Salary Increase Proposals
2015 2014
Increase ($ million) IS HQ
NSAS FO
NSAS Total IS HQ
NSAS FO
NSAS Total
Salary Increasea 3.7 1.0 0.4 5.1 3.1 1.9 1.4 6.4
Salary Increase (as % of salary)
2.3 4.5 4.4 2.2 2.0 4.0 7.0 2.9
Salary-Related Benefits
b
0.8 0.2 0.1 1.1 0.7 0.4 0.3 1.4
FO = field office, HQ = headquarters, IS = international staff, NSAS = national staff and administrative staff. a Including promotion increase, confirmation increase, and other salary-related personnel actions.
b Primarily staff retirement plan contributions (i.e., 21% for the Staff Retirement Plan and the balance of 0.43%
for insurance benefits) Source: Asian Development Bank.
VI. BENEFITS
37. No change in benefits is proposed at this time. The next total remuneration study for all ADB staff has commenced and will be completed in 2015. The technical review of the Staff Retirement Plan has been completed and will be reviewed with the other benefit plans in the context of overall potential changes to align the compensation and incentive system to support ADB’s business needs and workforce requirements.
VII. RECRUITMENT AND RETENTION
38. ADB recruits from its member countries highly qualified and experienced professionals with international exposure to join as international staff. ADB recruits highly qualified and talented NSAS for each of its field offices from nationals of the duty station country. ADB seeks to attract staff from multinational companies, the finance sector, international financial institutions, international organizations, the public sector, and the academe. 39. ADB’s recruitment and retention experience for international staff and NSAS is presented in Appendix 8. A review of the 3-year transformation period (2010–2012) showed that ADB was able to recruit and retain the required talent and skills. In line with the midterm review of Strategy 2020, the skills audit and HR audit may identify potential skills required to deliver project outputs and outcomes and make the necessary staffing adjustments. To build up the future pipeline of qualified candidates, ADB must continue to explore avenues and means for talent acquisition, including the use of social media. Candidates for some specific job families or positions (e.g., technology, risk management, treasury, finance, and private sector operations) continue to be difficult to attract or retain as demand and supply for these jobs in the global market remain very competitive. 40. For headquarters NSAS, ADB continues to be an attractive employer in Manila. However, recruitment and retention of suitably qualified and experienced NSAS continues to present a challenge in some field office locations. In some countries with well-developed employment markets, ADB tends to employ overqualified and highly experienced candidates, which can lead to job dissatisfaction later.
41. ADB expects to be able to recruit the staff needed for 2015 based on the proposed 2015 salary structures. The salary range widths at all levels provide sufficient flexibility to offer appointment salaries that take into account an individual’s qualifications and experience.

13
VIII. RECOMMENDATIONS
42. The President recommends that the Board approve for international staff the 2015 salary structure in Table 2 and an overall average salary increase of 4.0%, effective 1 January 2015, which reflects a structure adjustment component of 2.3% (equal to the budgeted salary increase) and a budget-neutral salary increase component of 1.7% to allow salary progression and merit increases for high performers. 43. The President recommends that the Board approve the following for NSAS, effective 1 January 2015:
(i) for headquarters NSAS, the 2015 salary structure as shown in Table 5 and an overall average salary increase of 7.6%, which reflects a structure adjustment component of 4.5% (equal to the budgeted salary increase) and a budget-neutral salary increase component of 3.1% to allow salary progression and merit increases for high performers; and
(ii) for field office NSAS, the 2015 salary structures as shown in Appendix 5 and an overall average salary increase of 7.0%, which reflects an average structure adjustment component of 4.4% (equal to the budgeted salary increase) and a budget-neutral average salary increase component of 2.6%. The corresponding figures for each field office are shown in Appendix 6 (Table A6.1).
44. Upon approval of the recommendations in paras. 42 and 43, the costs will be reflected in the 2015 budget proposal to be discussed and considered by the Board in December 2014.

14 Appendix 1
PRIMARY FINDINGS OF THE COMPENSATION REVIEW FOR INTERNATIONAL STAFF IN 2010 AND
NATIONAL STAFF AND ADMINISTRATIVE STAFF IN 2011
A. International Staff 1. The 2010 international staff compensation review’s primary objective was to assess the overall competitiveness of the compensation package of the Asian Development Bank (ADB) relative to various markets, both private sector and public sector salaries in Australia; France; Germany; Hong Kong, China; Japan; Singapore; and the United States. The review also included comparisons of total remuneration (salaries, allowances, and employer-funded benefit values) with six international financial institutions and other international organizations: the European Bank for Reconstruction and Development, the Inter-American Development Bank, the International Monetary Fund, the Organisation for Economic Co-operation and Development, the United Nations, and the World Bank. 2. The review noted that in accordance with the Agreement Establishing the Asian Development Bank (the Charter), 1 ADB needs an overall compensation program and, in particular, a salary system that is
(i) set at internationally competitive levels in order to recruit and retain staff of the highest caliber from as wide a geographical basis as possible, and
(ii) structured to recognize and provide strong incentives for high levels of performance throughout staff members’ careers.
3. The review’s primary findings and conclusions were as follows:
(i) Total remuneration. Total remuneration is generally competitive if the measure is the midpoint of salaries. When the comparison used actual average salaries as the basis, the competitiveness of ADB’s total remuneration dropped below the average and median values since average salaries of ADB staff are about 8% below the average midpoint salaries. This also affects salary-related benefit values. If the housing benefit is set aside, which as the consultants point out is a benefit that is a requirement unique to ADB to attract and retain staff because of location considerations, ADB’s total remuneration package falls below the average and median values, even on the basis of midpoint salaries.
(ii) Compensation. ADB’s salary midpoints are generally competitive against global markets (Asia and the Pacific, Europe, and the United States). The study has shown that for the international staff positions that ADB recruits from the market, their pay levels converge in the global and regional markets. Performance bonuses are common only in the private sector, where the amounts are a significant component of total cash compensation. Among the six comparators, only the European Bank for Reconstruction and Development and the International Finance Corporation (part of the World Bank) pay performance bonuses.
(iii) Benefits. Overall, ADB’s benefits are competitive with those offered by the six comparators, but there are variations over the four broad benefit categories: (a) security benefits (pension, insurance, sickness and disability benefits, and
separation grants);
1 ADB.1966. Agreement Establishing the Asian Development Bank. Manila.

Appendix 1 15
(b) other professional staff benefits (dependency allowance, annual leave, and statutory holidays);
(c) expatriate allowances (home country travel, education assistance, and mobility premium); and
(d) housing allowances and rental subsidies.
4. Based on the aggregate value of all four categories of benefits, ADB ranks first and is above both the median and average values. However, this is primarily because of the rental subsidy, which is provided by only one other comparator. Without the rental subsidy, ADB’s benefits package ranks fifth and falls below both the median and average. The consultants found that special factors make the provision of the rental subsidy a necessary allowance that allows ADB to address location-specific challenges. 5. The consultants also noted that ADB offers a comprehensive benefits package that is generally competitive with those of the comparators. However, many of the benefit programs operate under complex rule-based systems and are administratively burdensome to ADB. Staff members have also expressed a desire for simplification, more options, and flexibility to match their diverse personal circumstances. The review identified opportunities for making changes to individual benefits and allowances by reallocating resources within the total remuneration envelope. The recommended changes address the need to offer staff more options and some flexibility, balanced with ADB’s need to make more effective use of its budgetary resources. The proposed changes will also help streamline processes and lower administration costs. B. National Staff and Administrative Staff 6. Similar to the 2010 comprehensive review for international staff, the 2011 review’s primary objective was to assess the appropriateness of the current compensation methodology and determine the overall competitiveness of ADB’s compensation package at headquarters and in field offices for national staff and administrative staff (NSAS). The total remuneration comparison was limited to headquarters and three field offices—the People’s Republic of China, India, and Indonesia—because reliable salary data was not readily available in many duty station locations and the timeline for the completion of the review restricted the scope.
7. The review included comparisons of total remuneration (salaries and employer-provided benefit values) with the local comparator companies and the World Bank in the duty station location. The primary findings and conclusions are as follows:
(i) Total remuneration. Total remuneration, as measured by the sum of cash compensation plus the monetary value assigned to the employer-provided portion of benefits, is at par for NSAS in headquarters and in the three field offices when compared with the World Bank. This is because both organizations provide many of the same benefits to locally recruited staff as are provided to international staff, notably pension, medical insurance, and leave. However, when compared with local comparator companies, total remuneration at ADB headquarters and the three field offices is significantly higher.
(ii) Compensation. ADB’s cash compensation at headquarters is lower than the World Bank and is at par with local comparator companies. For the three field offices, it is essentially the same, as expected, since the World Bank salary structure serves as the basis for the ADB salary structure in all of its field offices with the exception of Japan.
(iii) Benefits. ADB’s benefits are competitive with those offered by the World Bank, but are particularly higher when compared to the benefits provided by local comparator companies. Compared with the World Bank, most of the benefits are

16 Appendix 1
at par; benefit values are higher for loans because of the interest subsidy and lower for life insurance.
8. The review noted that ADB offers a comprehensive benefits package that is generally above those of market comparators and at par with the World Bank. This is a result of ADB following the practice of most international financial institutions to maintain the same benefit programs and practices across locations to ensure parity among staff. The review endorsed the current practice of generally applying the same set of benefits across locations, especially since some field offices have few staff. The consultants also recommended that ADB consider “trade-offs” or reallocation of existing budgetary resources when considering changes to existing benefits or introducing new ones.
9. The review also identified opportunities to change certain benefits to unify the policy and practice for all NSAS. The recommended changes will also help streamline processes and simplify administration. ADB will continue to review benefits and allowances regularly, and will introduce cost-effective changes—primarily by reallocating existing budgetary resources—with the goal of providing staff with more options and flexibility, and simplifying administration.

Appendix 2 17
OVERVIEW OF THE WORLD BANK COMPENSATION METHODOLOGY 1. The revised compensation methodology for international staff approved by the Asian Development Bank (ADB) Board of Directors in 2010 reaffirmed the appropriateness of ADB continuing to reference the World Bank as its principal comparator. Therefore, ADB adjusts its salary structure by the same salary structure movement as the World Bank. This appendix provides an overview of the policies and procedures used under the World Bank rules-based compensation system to measure the United States (US) comparator market.1 2. Step 1: Surveying the market and selecting comparator organizations. The World Bank’s salary structure for Washington-appointed staff is referenced to the US market. The compensation system utilizes salary data from three labor market sectors in setting the salary structure: the public sector, the private general industrial sector, and the private financial sector. For the public sector, market data is gathered from the US civil service, federal agencies, and the Federal Reserve System. Multiple high-quality data sources are used to ensure adequate coverage for World Bank jobs. Data from the Hay Group are used for the industrial sector, and data from McLagan Partners and Towers Watson are used for the financial sector.2
3. Step 2: Job matching and collecting total cash compensation data. Job matching reviews are conducted to reflect changes in the World Bank jobs relative to jobs in comparator organizations. This process contributes to a better understanding of the counterpart jobs in the market. Total cash compensation, which includes base salary and annual variable pay, is used to build the salary structures. Long-term incentives that are based on multiyear results, such as stock options or performance-based incentives, are excluded.
Aggregating the Data
World Bank grade levels E to H
ADB grade levels IS1 to IS8
The data source weighting is 33% for the US public sector (US civil service 60%, Federal Reserve 40%) and 67% for the private sector (50% industrial sector, 50% financial sector).
World Bank grade level I
ADB grade levels IS9 and IS10
The data source weighting is half public sector and half private sector.
ADB = Asian Development Bank, IS = international staff, US = United States. Source: ADB.
4. Step 3: Market positioning—setting the payline and designing the structure. Once the market salary levels have been weighted and aggregated for each World Bank grade, the existing salary structure is adjusted effective July 1 to align the market reference points (MRPs) with the market grade levels based on a smoothing technique. This ensures that new MRPs are close to their respective market values, and the weighted average of the market values of the various grades and the weighted average of the MRPs are approximately equal. The competitive positioning of the World Bank is set at the 75th percentile of the market data. The MRPs determine the salary payline. To complete the structure, minimum and maximum salaries are developed from the MRPs using range spreads, which vary by grade level. 5. Step 4: Calculating the structure adjustment and overall salary increase. The structure adjustment is the increase in the weighted average of the new MRPs when compared with the previous year’s MRPs (weighted by the number of staff). For its 2015 fiscal year (FY), 1
1 Historical analyses have shown that the US market has been consistently competitive internationally. Every 3
years, the Washington salary scale is compared against the composite French and German market paylines to assess its international competitiveness.
2 The Hay Group, McLagan Partners, and Towers Watson are compensation survey consulting firms.

18 Appendix 2
July 2014–30 June 2015, the structure adjustment for the World Bank is 2.3%. The overall salary increase consists of the budgeted structure adjustment plus a non-budgeted salary increase component. The non-budgeted salary increase component has two elements: (i) the supplemental merit increase (SMI), which is provided to differentiate rewards for high performers and/or to address competitiveness issues for grades with average salaries significantly below the MRP; and (ii) the salary progression adjustment (SPA), which provides for progression within salary ranges, similar to the step increases in the public sector—except at the World Bank, where these are not automatic and are totally performance-based. The calculations of the SMI and the SPA are as follows:
(i) The SMI is determined as the salary gap of staff with performance ratings of 4 or
5 relative to their MRP in the previous year (the World Bank ratings of 4 or 5 are similar to the ADB performance ratings of satisfactory with special recommendation and exceptional). The SMI is distributed to high-performing staff across all grades. For FY2015, the SMI for the World Bank is 0.3%.
(ii) The SPA is determined as the 5-year average of the salary gap of confirmed staff (staff with more than 1 year in the same grade) relative to the MRPs over the same period. For FY2015, the SPA for the World Bank is 1.4%.
6. Step 5: Converting gross market values to net values. While labor market compensation data are collected and provided in gross terms, the resulting gross market values per grade are then netted down based on current tax tables provided by PricewaterhouseCoopers to restate them in terms comparable to the net-of-tax salaries of World Bank staff. 7. Step 6: Developing a salary increase matrix. Based on the overall salary increase and the distribution of performance ratings, the salary increase matrix is developed. The weighted average of the midpoint of the salary increase ranges for each performance rating weighted by the expected percentage of staff assigned for each rating is matched closely with the overall salary increase percentage.

ADB AND WORLD BANK INTERNATIONAL STAFF SALARY STRUCTURE AND SALARY INCREASE (2006-2015) AND EFFECT OF
EXCHANGE RATE AND PHILIPPINES CONSUMER PRICE INDEX ON STAFF EXPENSES AS A PERCENTAGE OF SALARY
Table A3.1: ADB and World Bank International Staff Salary Structure and Salary Increase (2006–2015) (%)
Calendar Year
Structure Adjustment Salary Increase Comparatio
ADB World Bank ADB World Bank ADB World Bank
2006 3.6 3.9 4.3 5.4 92.4 100.0
2007 3.5 3.5 4.4 5.0 91.7 100.0
2008 4.1 3.5 4.1 4.8 90.9 100.0
2009 4.3 3.3 5.9 5.0 91.8 100.0
2010 1.8 1.5 3.7 3.7 91.6 100.0
2011 1.7 2.4 4.3 3.7 91.5 100.0
2012 2.0 1.9 3.9 2.8 93.3 98.9
2013 1.9 1.9 3.2 3.2 93.3 98.1
2014 2.0 2.0 3.1 3.4 93.3 97.5
2015 2.3 2.3 4.0 4.0 93.9 97.1
Compounded Growth Rate 30.7 29.5 49.3 49.4
Compounded Annual Growth Rate
2.7 2.6 4.1 4.1
ADB = Asian Development Bank. Source: ADB.
Ap
pe
nd
ix 3
1
9
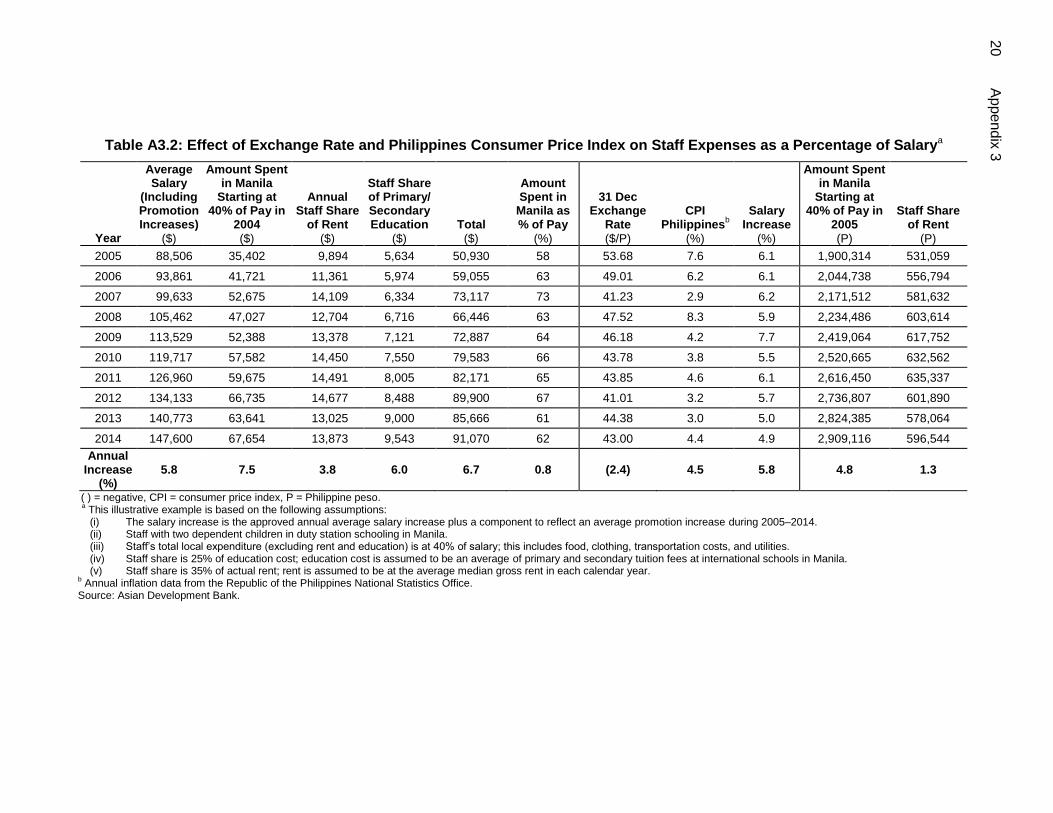
Table A3.2: Effect of Exchange Rate and Philippines Consumer Price Index on Staff Expenses as a Percentage of Salarya
Year
Average Salary
(Including Promotion Increases)
($)
Amount Spent in Manila
Starting at 40% of Pay in
2004
($)
Annual Staff Share
of Rent
($)
Staff Share of Primary/ Secondary Education
($)
Total
($)
Amount Spent in
Manila as % of Pay
(%)
31 Dec Exchange
Rate
($/P)
CPI Philippines
b
(%)
Salary Increase
(%)
Amount Spent in Manila
Starting at 40% of Pay in
2005
(P)
Staff Share of Rent
(P)
2005 88,506 35,402 9,894 5,634 50,930 58 53.68 7.6 6.1 1,900,314 531,059
2006 93,861 41,721 11,361 5,974 59,055 63 49.01 6.2 6.1 2,044,738 556,794
2007 99,633 52,675 14,109 6,334 73,117 73 41.23 2.9 6.2 2,171,512 581,632
2008 105,462 47,027 12,704 6,716 66,446 63 47.52 8.3 5.9 2,234,486 603,614
2009 113,529 52,388 13,378 7,121 72,887 64 46.18 4.2 7.7 2,419,064 617,752
2010 119,717 57,582 14,450 7,550 79,583 66 43.78 3.8 5.5 2,520,665 632,562
2011 126,960 59,675 14,491 8,005 82,171 65 43.85 4.6 6.1 2,616,450 635,337
2012 134,133 66,735 14,677 8,488 89,900 67 41.01 3.2 5.7 2,736,807 601,890
2013 140,773 63,641 13,025 9,000 85,666 61 44.38 3.0 5.0 2,824,385 578,064
2014 147,600 67,654 13,873 9,543 91,070 62 43.00 4.4 4.9 2,909,116 596,544
Annual Increase
(%) 5.8 7.5 3.8 6.0 6.7 0.8 (2.4) 4.5 5.8 4.8 1.3
( ) = negative, CPI = consumer price index, P = Philippine peso. a
This illustrative example is based on the following assumptions: (i) The salary increase is the approved annual average salary increase plus a component to reflect an average promotion increase during 2005–2014. (ii) Staff with two dependent children in duty station schooling in Manila. (iii) Staff’s total local expenditure (excluding rent and education) is at 40% of salary; this includes food, clothing, transportation costs, and utilities. (iv) Staff share is 25% of education cost; education cost is assumed to be an average of primary and secondary tuition fees at international schools in Manila. (v) Staff share is 35% of actual rent; rent is assumed to be at the average median gross rent in each calendar year.
b Annual inflation data from the Republic of the Philippines National Statistics Office.
Source: Asian Development Bank.
20
Ap
pe
nd
ix 3

Appendix 4 21
LIST OF COMPARATOR COMPANIES AND ORGANIZATIONS FOR SALARY REVIEW OF
HEADQUARTERS NATIONAL STAFF AND ADMINISTRATIVE STAFF
No. Company Name Line of
Business Headquarters
Total No. of Staff
1 Accenture, Inc. Services United States >1,000
2 Citibank, N.A. Finance United States >1,000
3 HSBC Group Finance United Kingdom >500
4 International Rice Research Institute Supranational Philippines >1,000
5 National Power Corporation Service/Utilities Philippines >1,000
6 Nestle Philippines, Inc. Consumer Switzerland >1,000
7 Petron Corporation Oil Philippines >1,000
8 Procter & Gamble, Philippines Consumer United States >1,000
9 San Miguel Corporation Consumer Philippines >1,000
10 Smart Communications, Inc. Service/Utilities Philippines/Japan >1,000
11 Sun Life Assurance Company of Canada Finance Canada >500
12 United Laboratories, Inc. Pharmaceutical Philippines >1,000
13 United States Embassy Embassy United States >1,000
14 World Bank, Manila Office Supranational International <500
15 World Health Organization Supranational International <500
> = greater than, < = less than. Source: Towers Watson’s Salary Survey Report.

22 Appendix 5
PROPOSED FIELD OFFICE SALARY STRUCTURES EFFECTIVE 1 JANUARY 2015
CENTRAL WEST ASIA
Table A5.1: Afghanistan Resident Mission
($ per year)
Level Minimum Midpoint Maximum
Range Spread (%)
Administrative Staff
AS1 10,500 13,700 16,800 60
AS2 12,100 15,700 19,400 60
AS3 13,900 18,400 22,900 65
AS4 15,500 20,600 25,600 65
AS5 18,100 24,400 30,800 70
AS6 20,000 27,000 34,000 70
AS7 25,200 34,600 44,100 75
National Staff
NS1 29,200 40,100 51,100 75
NS2 33,100 45,500 57,900 75
NS3 38,800 54,300 69,800 80
NS4 45,800 64,100 82,400 80
NS5 52,800 73,900 95,000 80
NS6 58,200 81,500 104,800 80
NS7 64,000 89,600 115,200 80
AS = administrative staff, NS = national staff. Source: Asian Development Bank.
Table A5.2: Armenia Resident Mission (AMD per year)
Level Minimum Midpoint Maximum
Range Spread (%)
Administrative Staff
AS1 4,365,000 5,675,000 6,984,000 60
AS2 4,947,000 6,431,000 7,915,000 60
AS3 5,294,000 7,014,000 8,735,000 65
AS4 5,834,000 7,730,000 9,626,000 65
AS5 6,455,000 8,714,000 10,974,000 70
AS6 7,149,000 9,651,000 12,153,000 70
AS7 8,894,000 12,229,000 15,565,000 75
National Staff
NS1 10,337,000 14,213,000 18,090,000 75
NS2 11,779,000 16,196,000 20,613,000 75
NS3 14,211,000 19,895,000 25,580,000 80
NS4 16,567,000 23,194,000 29,821,000 80
NS5 20,077,000 28,108,000 36,139,000 80
NS6 22,474,000 31,463,000 40,453,000 80
NS7 24,721,000 34,610,000 44,498,000 80
AS = administrative staff, NS = national staff. Source: Asian Development Bank.

Appendix 5 23
Table A5.3: Azerbaijan Resident Mission (AZN per year)
Level Minimum Midpoint Maximum
Range Spread (%)
Administrative Staff
AS1 13,300 17,300 21,300 60
AS2 14,200 18,500 22,700 60
AS3 15,900 21,100 26,200 65
AS4 17,600 23,300 29,000 65
AS5 19,600 26,400 33,300 70
AS6 21,600 29,200 36,700 70
AS7 25,200 34,700 44,100 75
National Staff
NS1 29,200 40,100 51,100 75
NS2 33,100 45,500 57,900 75
NS3 39,900 55,800 71,800 80
NS4 46,600 65,200 83,900 80
NS5 55,100 77,200 99,200 80
NS6 61,400 85,900 110,500 80
NS7 67,400 94,400 121,300 80
AS = administrative staff, NS = national staff. Source: Asian Development Bank.
Table A5.4: Georgia Resident Mission
(GEL per year)
Level Minimum Midpoint Maximum
Range Spread (%)
Administrative Staff
AS1 23,300 30,300 37,300 60
AS2 27,500 35,700 44,000 60
AS3 29,500 39,100 48,700 65
AS4 31,700 42,000 52,300 65
AS5 35,000 47,200 59,500 70
AS6 40,200 54,300 68,300 70
AS7 44,800 61,600 78,400 75
National Staff
NS1 50,700 69,700 88,700 75
NS2 56,500 77,700 98,900 75
NS3 70,400 98,500 126,700 80
NS4 81,400 113,900 146,500 80
NS5 102,000 142,800 183,600 80
NS6 108,600 152,100 195,500 80
NS7 119,600 167,400 215,300 80
AS = administrative staff, NS = national staff. Source: Asian Development Bank.

24 Appendix 5
Table A5.5: Kazakhstan Resident Mission (T per year)
Level Minimum Midpoint Maximum
Range Spread (%)
Administrative Staff
AS1 2,288,000 2,974,000 3,661,000 60
AS2 2,568,000 3,338,000 4,109,000 60
AS3 2,829,000 3,748,000 4,668,000 65
AS4 3,106,000 4,116,000 5,125,000 65
AS5 3,323,000 4,486,000 5,649,000 70
AS6 3,929,000 5,304,000 6,679,000 70
AS7 4,591,000 6,312,000 8,034,000 75
National Staff
NS1 5,484,000 7,541,000 9,597,000 75
NS2 6,378,000 8,770,000 11,162,000 75
NS3 8,575,000 12,005,000 15,435,000 80
NS4 10,391,000 14,547,000 18,704,000 80
NS5 12,948,000 18,127,000 23,306,000 80
NS6 15,462,000 21,647,000 27,832,000 80
NS7 17,008,000 23,811,000 30,614,000 80
AS = administrative staff, NS = national staff. Source: Asian Development Bank.
Table A5.6: Kyrgyz Republic Resident Mission
($ per year)
Level Minimum Midpoint Maximum
Range Spread (%)
Administrative Staff
AS1 8,800 11,400 14,100 60
AS2 9,200 11,900 14,700 60
AS3 9,900 13,100 16,300 65
AS4 10,800 14,300 17,800 65
AS5 11,000 14,800 18,700 70
AS6 12,400 16,700 21,100 70
AS7 14,200 19,500 24,900 75
National Staff
NS1 16,300 22,400 28,500 75
NS2 18,300 25,200 32,000 75
NS3 20,800 29,100 37,400 80
NS4 24,200 33,900 43,600 80
NS5 28,800 40,300 51,800 80
NS6 31,900 44,700 57,400 80
NS7 35,100 49,200 63,200 80
AS = administrative staff, NS = national staff. Source: Asian Development Bank.

Appendix 5 25
Table A5.7: Pakistan Resident Mission (PRs per year)
Level Minimum Midpoint Maximum
Range Spread (%)
Administrative Staff
AS1 581,000 755,000 930,000 60
AS2 732,000 952,000 1,171,000 60
AS3 725,000 960,000 1,196,000 65
AS4 915,000 1,213,000 1,510,000 65
AS5 1,274,000 1,720,000 2,166,000 70
AS6 1,503,000 2,029,000 2,555,000 70
AS7 1,892,000 2,601,000 3,311,000 75
National Staff
NS1 2,526,000 3,473,000 4,421,000 75
NS2 3,159,000 4,344,000 5,528,000 75
NS3 3,813,000 5,338,000 6,863,000 80
NS4 5,092,000 7,129,000 9,166,000 80
NS5 5,992,000 8,389,000 10,786,000 80
NS6 7,564,000 10,589,000 13,615,000 80
NS7 8,320,000 11,648,000 14,976,000 80
AS = administrative staff, NS = national staff. Source: Asian Development Bank.
Table A5.8: Tajikistan Resident Mission ($ per year)
Level Minimum Midpoint Maximum
Range Spread (%)
Administrative Staff
AS1 8,300 10,800 13,300 60
AS2 9,300 12,100 14,900 60
AS3 10,200 13,500 16,800 65
AS4 11,600 15,400 19,100 65
AS5 12,800 17,300 21,800 70
AS6 14,100 19,000 24,000 70
AS7 16,900 23,200 29,600 75
National Staff
NS1 19,000 26,100 33,300 75
NS2 21,100 29,000 36,900 75
NS3 24,300 34,000 43,700 80
NS4 27,600 38,600 49,700 80
NS5 30,400 42,600 54,700 80
NS6 33,300 46,600 59,900 80
NS7 36,600 51,300 65,900 80
AS = administrative staff, NS = national staff. Source: Asian Development Bank.

26 Appendix 5
Table A5.9: Turkmenistan Resident Mission ($ per year)
Level Minimum Midpoint Maximum
Range Spread (%)
Administrative Staff
AS1 8,300 10,800 13,300 60
AS2 10,500 13,700 16,800 60
AS3 12,200 16,100 20,100 65
AS4 13,400 17,700 22,100 65
AS5 14,500 19,600 24,700 70
AS6 15,600 21,100 26,500 70
AS7 17,600 24,200 30,800 75
National Staff
NS1 20,500 28,200 35,900 75
NS2 23,400 32,200 41,000 75
NS3 29,100 40,800 52,400 80
NS4 34,100 47,700 61,400 80
NS5 40,700 57,000 73,300 80
NS6 44,100 61,800 79,400 80
NS7 48,600 68,000 87,500 80
AS = administrative staff, NS = national staff. Source: Asian Development Bank.
Table A5.10: Uzbekistan Resident Mission ($ per year)
Level Minimum Midpoint Maximum
Range Spread (%)
Administrative Staff
AS1 7,600 9,900 12,200 60
AS2 8,300 10,800 13,300 60
AS3 9,400 12,500 15,500 65
AS4 10,300 13,700 17,000 65
AS5 11,300 15,300 19,200 70
AS6 13,200 17,800 22,400 70
AS7 15,200 20,900 26,600 75
National Staff
NS1 17,900 24,600 31,300 75
NS2 20,600 28,300 36,100 75
NS3 25,700 36,000 46,300 80
NS4 29,900 41,900 53,800 80
NS5 35,500 49,700 63,900 80
NS6 40,400 56,500 72,700 80
NS7 44,400 62,200 79,900 80
AS = administrative staff, NS = national staff. Source: Asian Development Bank.

Appendix 5 27
EAST ASIA
Table A5.11: People’s Republic of China Resident Mission (CNY per year)
Level Minimum Midpoint Maximum
Range Spread (%)
Administrative Staff
AS1 97,200 126,300 155,500 60
AS2 108,800 141,500 174,100 60
AS3 119,600 158,500 197,300 65
AS4 136,800 181,200 225,700 65
AS5 154,000 207,900 261,800 70
AS6 175,300 236,600 298,000 70
AS7 223,500 307,300 391,100 75
National Staff
NS1 258,000 354,700 451,500 75
NS2 292,400 402,000 511,700 75
NS3 389,400 545,200 700,900 80
NS4 481,200 673,700 866,200 80
NS5 608,100 851,400 1,094,600 80
NS6 681,800 954,500 1,227,200 80
NS7 750,000 1,050,000 1,350,000 80
AS = administrative staff, NS = national staff. Source: Asian Development Bank.
Table A5.12: Mongolia Resident Mission ($ per year)
Level Minimum Midpoint Maximum
Range Spread (%)
Administrative Staff
AS1 8,300 10,800 13,300 60
AS2 9,300 12,100 14,900 60
AS3 10,200 13,500 16,800 65
AS4 11,200 14,900 18,500 65
AS5 13,300 17,900 22,600 70
AS6 14,200 19,200 24,100 70
AS7 16,800 23,100 29,400 75
National Staff
NS1 19,600 26,900 34,300 75
NS2 22,300 30,600 39,000 75
NS3 27,400 38,400 49,300 80
NS4 30,900 43,300 55,600 80
NS5 42,100 58,900 75,800 80
NS6 46,500 65,100 83,700 80
NS7 51,100 71,600 92,000 80
AS = administrative staff, NS = national staff. Source: Asian Development Bank.

28 Appendix 5
PACIFIC
Table A5.13: Pacific Liaison and Coordination Office (A$ per year)
Level Minimum Midpoint Maximum
Range Spread (%)
Administrative Staff
AS1 33,000 42,900 52,800 60
AS2 36,000 46,800 57,600 60
AS3 38,000 50,300 62,700 65
AS4 41,900 55,500 69,100 65
AS5 44,600 60,200 75,800 70
AS6 48,200 65,100 81,900 70
AS7 55,100 75,700 96,400 75
National Staff
NS1 62,400 85,800 109,200 75
NS2 69,700 95,900 122,000 75
NS3 78,600 110,000 141,500 80
NS4 88,300 123,600 158,900 80
NS5 101,400 142,000 182,500 80
NS6 113,100 158,400 203,600 80
NS7 124,500 174,300 224,100 80
AS = administrative staff, NS = national staff. Source: Asian Development Bank.
Table A5.14: Pacific Subregional Office in Suva, Fiji
(F$ per year)
Level Minimum Midpoint Maximum
Range Spread (%)
Administrative Staff
AS1 16,800 21,800 26,900 60
AS2 18,800 24,400 30,100 60
AS3 20,200 26,700 33,300 65
AS4 22,500 29,800 37,100 65
AS5 24,400 33,000 41,500 70
AS6 27,000 36,500 45,900 70
AS7 31,600 43,500 55,300 75
National Staff
NS1 38,100 52,400 66,700 75
NS2 44,600 61,300 78,100 75
NS3 59,600 83,500 107,300 80
NS4 71,400 100,000 128,500 80
NS5 81,400 114,000 146,500 80
NS6 95,200 133,300 171,400 80
NS7 104,700 146,600 188,500 80
AS = administrative staff, NS = national staff. Source: Asian Development Bank.

Appendix 5 29
Table A5.15: Papua New Guinea Resident Mission (K per year)
Level Minimum Midpoint Maximum
Range Spread (%)
Administrative Staff
AS1 22,400 29,100 35,800 60
AS2 25,900 33,700 41,400 60
AS3 28,000 37,100 46,200 65
AS4 31,200 41,400 51,500 65
AS5 35,300 47,700 60,000 70
AS6 41,300 55,700 70,200 70
AS7 49,500 68,100 86,600 75
National Staff
NS1 57,700 79,400 101,000 75
NS2 66,000 90,700 115,500 75
NS3 78,800 110,300 141,800 80
NS4 97,900 137,100 176,200 80
NS5 125,400 175,600 225,700 80
NS6 131,900 184,600 237,400 80
NS7 145,000 203,000 261,000 80
AS = administrative staff, NS = national staff. Source: Asian Development Bank.
Table A5.16: Timor-Leste Resident Mission ($ per year)
Level Minimum Midpoint Maximum
Range Spread (%)
Administrative Staff
AS1 5,200 6,700 8,300 60
AS2 6,300 8,200 10,100 60
AS3 6,700 8,900 11,100 65
AS4 7,800 10,300 12,900 65
AS5 8,400 11,300 14,300 70
AS6 9,600 12,900 16,300 70
AS7 12,800 17,600 22,400 75
National Staff
NS1 14,900 20,500 26,100 75
NS2 17,100 23,500 29,900 75
NS3 21,000 29,400 37,800 80
NS4 26,100 36,500 47,000 80
NS5 35,100 49,200 63,200 80
NS6 39,400 55,100 70,900 80
NS7 43,300 60,600 77,900 80
AS = administrative staff, NS = national staff. Source: Asian Development Bank.

30 Appendix 5
SOUTH ASIA
Table A5.17: Bangladesh Resident Mission
(Tk per year)
Level Minimum Midpoint Maximum
Range Spread (%)
Administrative Staff
AS1 486,000 632,000 778,000 60
AS2 568,000 739,000 909,000 60
AS3 706,000 935,000 1,165,000 65
AS4 812,000 1,076,000 1,340,000 65
AS5 959,000 1,295,000 1,630,000 70
AS6 1,047,000 1,413,000 1,780,000 70
AS7 1,323,000 1,819,000 2,315,000 75
National Staff
NS1 1,615,000 2,221,000 2,826,000 75
NS2 1,908,000 2,623,000 3,339,000 75
NS3 2,304,000 3,226,000 4,147,000 80
NS4 3,486,000 4,880,000 6,275,000 80
NS5 4,031,000 5,644,000 7,256,000 80
NS6 5,074,000 7,103,000 9,133,000 80
NS7 5,581,000 7,814,000 10,046,000 80
AS = administrative staff, NS = national staff. Source: Asian Development Bank.
Table A5.18: Bhutan Resident Mission
(Nu per year)
Level Minimum Midpoint Maximum
Range Spread (%)
Administrative Staff
AS1 208,000 270,000 333,000 60%
AS2 238,000 309,000 381,000 60%
AS3 266,000 353,000 439,000 65%
AS4 297,000 394,000 490,000 65%
AS5 327,000 442,000 556,000 70%
AS6 356,000 480,000 605,000 70%
AS7 394,000 542,000 690,000 75%
National Staff
NS1 425,000 585,000 744,000 75%
NS2 457,000 628,000 800,000 75%
NS3 491,000 688,000 884,000 80%
NS4 524,000 733,000 943,000 80%
NS5 556,000 779,000 1,001,000 80%
NS6 594,000 831,000 1,069,000 80%
NS7 653,000 914,000 1,175,000 80%
AS = administrative staff, NS = national staff. Source: Asian Development Bank.

Appendix 5 31
Table A5.19: India Resident Mission (Rs per year)
Level Minimum Midpoint Maximum
Range Spread (%)
Administrative Staff
AS1 366,000 476,000 586,000 60
AS2 429,000 558,000 686,000 60
AS3 495,000 656,000 817,000 65
AS4 589,000 780,000 972,000 65
AS5 669,000 903,000 1,137,000 70
AS6 814,000 1,099,000 1,384,000 70
AS7 1,028,000 1,413,000 1,799,000 75
National Staff
NS1 1,234,000 1,697,000 2,160,000 75
NS2 1,441,000 1,981,000 2,522,000 75
NS3 1,778,000 2,489,000 3,200,000 80
NS4 2,719,000 3,807,000 4,894,000 80
NS5 3,733,000 5,226,000 6,719,000 80
NS6 4,611,000 6,455,000 8,300,000 80
NS7 5,071,000 7,100,000 9,128,000 80
AS = administrative staff, NS = national staff. Source: Asian Development Bank.
Table A5.20: Nepal Resident Mission
(NRs per year)
Level Minimum Midpoint Maximum
Range Spread (%)
Administrative Staff
AS1 534,000 694,000 854,000 60
AS2 636,000 827,000 1,018,000 60
AS3 675,000 894,000 1,114,000 65
AS4 807,000 1,069,000 1,332,000 65
AS5 905,000 1,222,000 1,539,000 70
AS6 1,004,000 1,355,000 1,707,000 70
AS7 1,220,000 1,678,000 2,135,000 75
National Staff
NS1 1,424,000 1,958,000 2,492,000 75
NS2 1,628,000 2,239,000 2,849,000 75
NS3 2,089,000 2,924,000 3,760,000 80
NS4 2,509,000 3,512,000 4,516,000 80
NS5 3,044,000 4,261,000 5,479,000 80
NS6 3,547,000 4,966,000 6,385,000 80
NS7 3,901,000 5,462,000 7,022,000 80
AS = administrative staff, NS = national staff. Source: Asian Development Bank.

32 Appendix 5
Table A5.21: Sri Lanka Resident Mission (SLRs per year)
Level Minimum Midpoint Maximum
Range Spread (%)
Administrative Staff
AS1 939,000 1,221,000 1,502,000 60
AS2 1,020,000 1,326,000 1,632,000 60
AS3 1,229,000 1,629,000 2,028,000 65
AS4 1,377,000 1,824,000 2,272,000 65
AS5 1,525,000 2,059,000 2,593,000 70
AS6 1,924,000 2,597,000 3,271,000 70
AS7 2,275,000 3,128,000 3,981,000 75
National Staff
NS1 2,712,000 3,729,000 4,746,000 75
NS2 3,148,000 4,329,000 5,509,000 75
NS3 3,754,000 5,256,000 6,757,000 80
NS4 4,805,000 6,727,000 8,649,000 80
NS5 6,456,000 9,039,000 11,621,000 80
NS6 8,280,000 11,592,000 14,904,000 80
NS7 9,108,000 12,751,000 16,394,000 80
AS = administrative staff, NS = national staff. Source: Asian Development Bank.
SOUTHEAST ASIA
Table A5.22: Cambodia Resident Mission ($ per year)
Level Minimum Midpoint Maximum
Range Spread (%)
Administrative Staff
AS1 7,000 9,100 11,200 60
AS2 8,200 10,600 13,100 60
AS3 8,800 11,600 14,500 65
AS4 10,200 13,500 16,800 65
AS5 10,600 14,300 18,000 70
AS6 12,400 16,800 21,100 70
AS7 16,100 22,200 28,200 75
National Staff
NS1 18,800 25,800 32,900 75
NS2 21,300 29,300 37,300 75
NS3 27,400 38,400 49,300 80
NS4 32,300 45,200 58,100 80
NS5 41,200 57,700 74,200 80
NS6 47,100 66,000 84,800 80
NS7 51,900 72,600 93,400 80
AS = administrative staff, NS = national staff. Source: Asian Development Bank.

Appendix 5 33
Table A5.23: Indonesia Resident Mission
(Rp per year)
Level Minimum Midpoint Maximum
Range Spread (%)
Administrative Staff
AS1 93,113,000 121,047,000 148,981,000 60
AS2 113,608,000 147,691,000 181,773,000 60
AS3 120,844,000 160,118,000 199,393,000 65
AS4 147,136,000 194,955,000 242,774,000 65
AS5 167,504,000 226,131,000 284,757,000 70
AS6 208,541,000 281,531,000 354,520,000 70
AS7 254,019,000 349,276,000 444,533,000 75
National Staff
NS1 307,436,000 422,724,000 538,013,000 75
NS2 360,852,000 496,171,000 631,491,000 75
NS3 518,379,000 725,730,000 933,082,000 80
NS4 645,482,000 903,675,000 1,161,868,000 80
NS5 901,895,000 1,262,653,000 1,623,411,000 80
NS6 1,027,866,000 1,439,012,000 1,850,159,000 80
NS7 1,130,652,000 1,582,913,000 2,035,174,000 80
AS = administrative staff, NS = national staff. Source: Asian Development Bank.
Table A5.24: Lao People’s Democratic Republic Resident Mission ($ per year)
Level Minimum Midpoint Maximum
Range Spread (%)
Administrative Staff
AS1 5,800 7,500 9,300 60
AS2 6,400 8,300 10,200 60
AS3 6,900 9,100 11,400 65
AS4 7,500 10,000 12,400 65
AS5 8,200 11,100 13,900 70
AS6 9,000 12,100 15,300 70
AS7 10,500 14,500 18,400 75
National Staff
NS1 12,600 17,300 22,100 75
NS2 14,600 20,100 25,600 75
NS3 20,400 28,500 36,700 80
NS4 26,000 36,400 46,800 80
NS5 36,600 51,200 65,900 80
NS6 44,500 62,300 80,100 80
NS7 48,900 68,500 88,000 80
AS = administrative staff, NS = national staff. Source: Asian Development Bank.

34 Appendix 5
Table A5.25: Myanmar Resident Mission
($ per year)
Level Minimum Midpoint Maximum
Range Spread (%)
Administrative Staff
AS1 7,000 9,100 11,200 60
AS2 8,000 10,400 12,800 60
AS3 8,800 11,700 14,500 65
AS4 9,800 13,000 16,200 65
AS5 10,900 14,700 18,500 70
AS6 12,000 16,200 20,400 70
AS7 13,500 18,500 23,600 75
National Staff
NS1 14,800 20,400 25,900 75
NS2 16,200 22,300 28,400 75
NS3 18,300 25,600 32,900 80
NS4 20,100 28,100 36,200 80
NS5 21,900 30,600 39,400 80
NS6 24,000 33,600 43,200 80
NS7 26,400 37,000 47,500 80
AS = administrative staff, NS = national staff. Source: Asian Development Bank.
Table A5.26: Thailand Resident Mission (B per year)
Level Minimum Midpoint Maximum
Range Spread (%)
Administrative Staff
AS1 279,000 363,000 446,000 60
AS2 348,000 453,000 557,000 60
AS3 406,000 538,000 670,000 65
AS4 509,000 674,000 840,000 65
AS5 607,000 820,000 1,032,000 70
AS6 762,000 1,029,000 1,295,000 70
AS7 911,000 1,252,000 1,594,000 75
National Staff
NS1 1,092,000 1,501,000 1,911,000 75
NS2 1,273,000 1,750,000 2,228,000 75
NS3 1,879,000 2,630,000 3,382,000 80
NS4 2,812,000 3,937,000 5,062,000 80
NS5 3,329,000 4,660,000 5,992,000 80
NS6 3,872,000 5,421,000 6,970,000 80
NS7 4,259,000 5,963,000 7,666,000 80
AS = administrative staff, NS = national staff. Source: Asian Development Bank.

Appendix 5 35
Table A5.27: Viet Nam Resident Mission ($ per year)
Level Minimum Midpoint Maximum
Range Spread (%)
Administrative Staff
AS1 8,700 11,300 13,900 60
AS2 9,300 12,100 14,900 60
AS3 10,700 14,200 17,700 65
AS4 12,300 16,300 20,300 65
AS5 14,200 19,200 24,100 70
AS6 16,400 22,200 27,900 70
AS7 20,800 28,600 36,400 75
National Staff
NS1 26,100 35,900 45,700 75
NS2 31,300 43,100 54,800 75
NS3 44,100 61,700 79,400 80
NS4 51,200 71,700 92,200 80
NS5 65,800 92,100 118,400 80
NS6 84,100 117,700 151,400 80
NS7 92,500 129,500 166,500 80
AS = administrative staff, NS = national staff. Source: Asian Development Bank.
REPRESENTATIVE OFFICES
Table A5.28: European Representative Office
(€ per year)
Level Minimum Midpoint Maximum
Range Spread (%)
Administrative Staff
AS4 30,600 40,600 50,500 65
AS5 32,300 43,600 54,900 70
AS6 37,300 50,400 63,400 70
AS7 40,900 56,200 71,600 75
National Staff
NS1 46,400 63,800 81,200 75
NS2 51,900 71,400 90,800 75
NS3 66,400 92,900 119,500 80
AS = administrative staff, NS = national staff. Source: Asian Development Bank.

36 Appendix 5
Table A5.29: Japan Representative Officea (¥ per year)
Level Minimum Midpoint Maximum Range
Spread (%)
Administrative Staff
AS4 4,165,000 5,519,000 6,872,000 65
AS5 4,223,000 5,701,000 7,179,000 70
AS6 4,472,000 6,037,000 7,602,000 70
AS7 5,661,000 7,784,000 9,907,000 75
National Staff
NS1 6,139,000 8,441,000 10,743,000 75
NS2 6,617,000 9,098,000 11,580,000 75
NS3 8,736,000 12,230,000 15,725,000 80
AS = administrative staff, NS = national staff. a Gross salary structure.
Source: Asian Development Bank.
Table A5.30: North American Representative Officea ($ per year)
Level Minimum Midpoint Maximum
Range Spread (%)
Administrative Staff
AS4 38,600 51,100 63,700 65
AS5 44,400 59,900 75,500 70
AS6 49,700 67,100 84,500 70
AS7 54,700 75,200 95,700 75
National Staff
NS1 64,500 88,700 112,900 75
NS2 74,300 102,200 130,000 75
NS3 98,200 137,500 176,800 80
AS = administrative staff, NS = national staff. a Gross salary structure.
Source: Asian Development Bank.

Appendix 6 37
PROPOSED FIELD OFFICE STRUCTURE ADJUSTMENT, SALARY INCREASE, AND COMPARATIO FOR 2015 AND SUMMARY OF FIELD OFFICE AVERAGE ANNUAL
SALARY INCREASE AND CONSUMER PRICE INDEX (2011–2015)
Table A6.1: Proposed Field Office Structure Adjustment, Salary Increase, and Comparatio
Regional Department/ Field Office
Location
ConfirmedStaff
(No.)
Structure Adjustment Component
(%)
Budget Neutral Salary
Increase Component
(%)
Proposed Average Salary
Increase
(%)
Estimated Comparatio
before Salary
Increase
(%)
Estimated Comparatio
after Salary
Increase
(%)
Salary Currency
Exchange Rate
a
Central West Asia
Afghanistan
15 10.7 0.1 10.8 90.7 100.6 $ 1.00
Armenia 6 7.2 1.0 8.2 90.6 98.3 AMD 410.93
Azerbaijan 5 6.4 0.1 6.5 93.3 99.4 AZN 0.78
Georgia 6 0.1 3.4 3.5 96.6 100.0 GEL 1.73
Kazakhstan 11 12.1 1.6 13.7 87.5 99.5 T 182.08
Kyrgyz Republic 9 2.8 2.4 5.2 95.5 100.5 $ 1.00
Pakistan
35 16.8 0.1 16.9 86.3 101.3 PRs 101.85
Tajikistan 14 19.5 2.4 21.9 79.4 98.0 $ 1.00
Turkmenistan 4 1.3 4.1 5.4 97.9 103.2 $ 1.00
Uzbekistan
14 0.0 3.0 3.0 98.2 101.1 $ 1.00
East Asia
PRC 49 6.3 1.5 7.8 90.6 97.6 CNY 6.14
Mongolia 15 0.0 3.2 3.2 99.9 103.1 $ 1.00
Pacific
Australia 10 0.3 1.9 2.2 102.3 104.6 A$ 1.07
Fiji 13 0.7 1.8 2.5 100.3 102.9 F$ 1.85
PNG 9 0.2 2.1 2.3 98.0 100.2 K 2.46
Timor-Leste 5 2.3 0.5 2.8 98.9 101.7 $ 1.00
South Asia
Bangladesh 45 0.9 8.5 9.4 88.6 97.0 Tk 77.60
Bhutanb 1 0.4 1.6 2.0 Nu 60.60
India 61 2.8 4.8 7.6 91.0 97.9 Rs 60.60
Nepal 36 12.0 1.8 13.8 84.2 96.0 NRs 96.84
Sri Lanka 31 7.9 2.5 10.4 86.4 96.0 SLRs 130.23
Southeast Asia
Cambodia 26 1.3 1.7 3.0 98.1 101.1 $ 1.00
Indonesia 37 0.0 2.1 2.1 99.4 101.4 Rp 11,705.00
Lao PDR 17 0.0 2.4 2.4 97.7 100.0 $ 1.00
Myanmarc 0.3 1.7 2.0 104.1 106.2 $ 1.00
Thailand 11 0.0 2.6 2.6 98.5 101.0 B 31.95
Viet Nam 37 2.9 2.9 5.8 94.5 100.0 $ 1.00
Representative Offices
Germany 3 2.2 0.1 2.3 111.1 113.6 € 0.76
Japan 3 0.9 1.1 2.0 121.7 124.1 ¥ 104.09
United States 3 2.3 3.7 6.0 86.8 92.0 $ 1.00
Total/Average 531 4.4 2.6 7.0 93.1 99.7
Lao PDR = Lao People’s Democratic Republic, PNG = Papua New Guinea, PRC = People’s Republic of China. a Data as of 31 August 2014.
b Comparatio values for staff in the Bhutan Resident Mission are not shown for purposes of confidentiality.
c Current national and administrative staff in the Myanmar Resident Mission were appointed in 2014 and will not be
entitled to the 2015 salary increase. Figures shown only reflect indicative values for the confirmation increase. Source: Asian Development Bank.

38 Appendix 6
Table A6.2: Summary of Field Office Average Annual Salary Increase and Consumer Price Indexa (2011–2015)
ADB Field Office
Location
Average Annual
Structure Increase
(%)
Average Annual Salary
Increase (nominal)
(%)
Average Annual
CPIa
(%)
Average Annual Salary
Increase (real) (%)
Uzbekistan 5.8 8.6 11.5 (2.9)
Timor-Leste 6.5 6.6 6.9 (0.3)
Australia 2.2 3.8 3.7 0.1
India 3.8 8.6 8.5 0.1
Mongolia 11.5 13.3 13.0 0.3
Germany 0.6 2.0 1.5 0.5
Afghanistan 7.4 8.4 7.6 0.8
PNG 6.2 8.3 7.5 0.8
Nepal 7.7 10.7 9.5 1.2
Indonesia
4.6 6.9 5.5 1.4
Cambodia 4.3 5.6 4.0 1.6
Fiji 2.3 5.2 3.6 1.6
Azerbaijan 5.4 8.1 6.0 2.1
United States 4.0 5.0 1.9 3.1
Japan (3.2) 4.1 0.9 3.2
Pakistan 10.5 13.4 10.0 3.4
Viet Nam 9.9 12.9 9.4 3.5
Lao PDR 7.0 9.5 5.9 3.6
Thailand 1.3 6.4 2.8 3.6
Bangladesh 7.4 11.6 7.9 3.7
Kazakhstan 7.2 9.9 6.2 3.7
Armenia 7.3 9.9 4.6 5.3
Kyrgyz Republic 6.8 9.2 3.8 5.4
Sri Lanka 7.9 11.7 5.8 5.9
Georgia 6.0 9.3 3.3 6.0
PRC 7.5 9.5 3.2 6.3
Tajikistan
11.2 13.0 5.4 7.6
Turkmenistan
6.8 14.5 5.5 9.0
Average 6.0 8.9 6.2 2.7
( ) = negative; CPI = consumer price index, Lao PDR = Lao People’s Democratic Republic, Lao PDR = Lao People’s Democratic Republic, PNG = Papua New Guinea, PRC = People’s Republic of China. a Data from the International Monetary Fund’s International Financial Statistics, the Asian
Development Bank Economics and Research Department (for PNG, Turkmenistan, and Uzbekistan), and the Reserve Bank of Australia (for Australia).
Source: Asian Development Bank.

Appendix 7 39
RATIO OF STAFF SALARIES AND BENEFITS TO INTERNAL ADMINISTRATIVE EXPENSES
(%)
IAE = Internal Administrative Expenses, IS = international staff, NSAS = national staff and administrative staff. Notes: 1. 2005–2013: actual data; 2014: midyear estimates 2. Major events in the rationalization of salaries and benefits:
For international staff: (i) Education grant: rationalization of tuition and flat rate allowance (1999–2003) (ii) Home country travel and education travel: 80% airfare (2006) (iii) Rental subsidy: fixed cost sharing at 60% Asian Development Bank and 40% staff (2006) (iv) Post-retirement group medical insurance plan: decrease in reimbursement rate and elimination of subsidy
for stop loss benefits (2006) (v) Staff Retirement Plan: new plan provisions (2006 and 2009) (vi) Rental subsidy: fixed cost sharing at 65% Asian Development Bank and 35% staff (2008) (vii) Rental subsidy: implementation of rental allowance scheme (2012) For national staff and administrative staff: (i) Dependency allowance for headquarters NSAS: 3-year buyout for parents and parents-in-law (2011) (ii) Dependency allowance for headquarters NSAS: eliminated for staff hired from 1 January 2012 (2012) (iii) Salary payment mode for headquarters NSAS: annualized salary paid over 12 months (2012) (iv) Overtime: uniform overtime rate for all administrative staff to 1.5 for weekdays and 1.7 for weekends and
holidays (2012) Source: Asian Development Bank.
2005 2006 2007 2008 2009 2010 2011 2012 2013 2014
Total 59.7 60.9 61.7 63.0 62.1 62.3 62.9 62.9 63.9 61.1
NSAS Benefits 1.9 2.4 3.0 3.7 3.4 3.1 3.5 4.3 4.6 3.4
IS Benefits 19.2 18.5 20.1 21.1 20.3 20.3 20.9 21.7 22.9 19.6
NSAS Salaries 8.3 9.4 10.0 10.4 10.3 10.6 10.9 10.7 10.4 11.9
IS Salaries 30.3 30.6 28.6 27.8 28.1 28.3 27.6 26.2 26.0 26.2
0.0
10.0
20.0
30.0
40.0
50.0
60.0
70.0
80.0
90.0
100.0
Pe
rce
nta
ge
of
IAE

40 Appendix 8
RECRUITMENT AND RETENTION EXPERIENCE A. International Staff
1. Tables A8.1–A8.6 present the recruitment and retention experience of the Asian Development Bank for international staff. The main points are as follows:
(i) Recruitment rate. The highest recruitment rate during 2005–2014 was 16.0% (in 2010). The highest recruitment percentage (20.5%) of women was also recorded in 2010 (Table A8.1). The annualized recruitment rate of 6.8% for 2014 is the lowest for the 10-year period. ADB’s newly recruited staff in 2014 have primarily come from government agencies (43.3%) and the private sector (33.3%) with the rest coming from other international organizations, from within ADB (promotions from national staff positions), and the academe (Table A8.2).
(ii) Rejection rate. The annualized rejection rate for 2014 of 16.1% is higher than the average rejection rate from 2005 to 2013 of 15.3% (Table A8.3). The average rejection rate for women was greater than that for men from January 2005 to August 2014. The main reasons for rejection of job offers were related to family or spouse employment (45.1%) and salary-related (42.8%) concerns (Table A8.4). During the first 8 months of 2014, six candidates rejected the offer primarily due to job-related concerns.
(iii) Termination rate. The staff termination annualized rate of 9.2% for 2014 is higher than the average termination rate of 8.7% during 2005–2013 (Table A8.5).
(iv) Voluntary resignation rate. The staff voluntary resignation annualized rate of 3.6% for 2014 is higher than the average termination rate of 3.2% for 2005–2013 (Table A8.5). Table A8.6 shows that in the first 8 months of 2014, 26 staff resigned voluntarily, 11 of whom for personal or family-related reasons, and 13 for other reasons (e.g., return to parent organization, department and/or division management, and job content). During the first 8 months of 2014, four of the six women international staff voluntarily resigned for family or other personal issues. Renewed efforts are being made to ensure that women are provided opportunities to gain experience to increase their competitiveness for progression and that the promotion process ensures that women are fully considered.

Appendix 8 41
Table A8.1: Recruitment of International Staff
Year
Staff as of 1 January No. of Staff Hired Recruitment Rates (%)
All Staff Women All Staff Women All Staff Women
2005 855 255 94 21 11.0 8.2
2006 883 259 70 19 7.9 7.3
2007 856 249 99 25 11.6 10.0
2008 847 248 115 22 13.6 8.9
2009 874 248 119 29 13.6 11.7
2010 927 258 148 53 16.0 20.5
2011 1,024 298 118 54 11.5 18.1
2012 1,055 332 103 54 9.8 16.3
2013 1,076 368 91 37 8.5 10.1
2014a
1,083 375 49 13 4.5 3.5 a Data as of 31 August 2014.
Source: Asian Development Bank.
Table A8.2: Recruitment Source
Recruitment Source
2008 2009 2010 2011 2012 2013 2014a
All Regional All Regional All Regional All Regional All Regional All Regional All Regional
International Organization
11 6 19 6 15 6 19 12 18 9 18 10 7 3
Private Sector
62 34 53 28 94 54 52 21 50 27 43 24 17 10
Academe 4 4 7 4 7 4 4 2 2 1 2 1 4 2
Government Agency
35 24 35 27 24 16 37 27 24 18 20 10 19 13
From ADB's National Staff
3 3 5 5 8 8 6 6 9 9 8 8 2 2
Total 115 71 119 70 148 88 118 68 103 64 91 53 49 30
ADB = Asian Development Bank. a Data as of 31 August 2014.
Source: Asian Development Bank.
Table A8.3: Rejection of Job Offers
Year
Total Offers No. of Rejections Rejection Rates (%)
All Staff Women All Staff Women All Staff Women
2005 104 23 11a 1 10.6 4.3
2006 86 25 12 5 14.0 20.0
2007 122 29 20 3 16.4 10.3
2008 131 29 20 5 15.3 17.2
2009 146 39 19 5 13.0 12.8
2010 156 54 10 3 6.4 5.6
2011 126 72 13 7 10.3 9.7
2012 119 59 11 6 9.2 10.2
2013 91 33 11 7 12.1 21.2
2014b
56 17 6 2 10.7 11.8 a
Excludes one candidate whose offer was withdrawn as the offer lapsed. b Data as of 31 August 2014.
Source: Asian Development Bank.

42 Appendix 8
Table A8.4: Reasons for Rejections of Job Offers
Reason 2005 2006 2007 2008 2009 2010 2011 2012 2013 2014a
Total
Salary-relatedb
All Staff 4 6 7 9 10 7 3 3 2 1 52
Women 1 2 0 3 4 2 3 1 0 0 16
Family reasons and spouse employment
All Staff 4 4 10 10 9 3 7 7 6 1 61
Women 0 3 2 2 1 1 3 4 4 0 20
Security and living conditions in Manila
All Staff 0 0 0 0 0 0 0 0 0 0 0
Women 0 0 0 0 0 0 0 0 0 0 0
Job-relatedc
All Staff 3 2 3 1 0 0 3 1 3 4 20
Women 0 0 1 0 0 0 1 1 3 2 8
Total All Staff 11 12 20 20 19 10 13 11 11 6 133
Women 1 5 3 5 5 3 7 6 7 2 44 a Data as of 31 August 2014.
b Includes low salary, receipt of better offer, and non-transferability of pension.
c Includes broader job requirement, job assignment preference, and higher entry-level position.
Source: Asian Development Bank.
Table A8.5: Termination Rates
Year
Voluntary Resignationsa Other Terminations Total Terminations
Staff as of 1 January
Termination Rates (%)
Termination Rates (%)
Termination Rates (%)
All Staff Women
All Staff Women
All Staff Women
All Staff Women
All Staff Women
All Staff Women
All Staff Women
2005 855 255 19 8 2.2 3.1 47 9 5.5 3.5 66 17 7.7 6.7
2006 883 259 34 14 3.9 5.4 63 16 7.1 6.2 97 30 11.0 11.6
2007 856 249 60 20 7.0 8.0 48 6 5.6 2.4 108 26 12.6 10.4
2008 847 248 38 14 4.5 5.6 50 8 5.9 3.2 88 22 10.4 8.9
2009 874 248 18 8 2.1 3.2 48 11 5.5 4.4 66 19 7.6 7.7
2010 927 258 22 3 2.4 1.2 29 10 3.1 3.9 51 13 5.5 5.0
2011 1,024 298 26 8 2.5 2.7 61 12 6.0 4.0 87 20 8.5 6.7
2012 1,055 332 28 7 2.7 2.1 54 11 5.1 3.3 82 18 7.8 5.4
2013 1,076 368 23 12 2.1 3.3 61 18 5.7 4.9 84 30 7.8 8.2
2014b 1,083 375 26 6 2.4 1.6 40 13 3.7 3.5 66 19 6.1 5.1
a The number of voluntary resignations from 2005 have been restated to exclude staff who are eligible for early
retirement benefits. b Data as of 31 August 2014.
Source: Asian Development Bank.

Appendix 8 43
Table A8.6: Reasons for Voluntary Resignationsa
Year
Personal or Family
b
Salary- or Career-Related
c
Others
d
Reasons Not Divulged by
Staff Total
Ratio of Voluntary
Resignations to Terminations
All Staff Women
All Staff Women
All Staff Women
All Staff Women
All Staff Women
All Staff Women
2005 6 5 5 2 8 1 0 0 19 8 28.8 47.1
2006 9 7 13 2 12 5 0 0 34 14 35.1 46.7
2007 19 8 22 6 19 6 0 0 60 20 55.6 76.9
2008 16 6 15 6 3 0 4 2 38 14 43.2 63.6
2009 9 4 4 2 2 0 3 2 18 8 27.3 42.1
2010 4 0 4 1 13 2 1 0 22 3 43.1 23.1
2011 7 2 5 2 13 3 1 1 26 8 29.9 40.0
2012 11 4 1 0 14 2 2 1 28 7 34.1 38.9
2013 10 6 0 0 12 6 1 0 23 12 27.4 40.0
2014e 11 4 0 0 13 2 2 0 26 6 39.4 31.6
a The number of voluntary resignations from 2005 have been restated to exclude staff who are eligible for early
retirement benefits. b Includes the situation in the Philippines, spouse employment, and/or children’s education.
c Includes better career prospects elsewhere and lack of professional opportunities.
d Includes return to parent organization, department, and/or division management and job content.
e Data as of 31 August 2014.
Source: Asian Development Bank.
B. Headquarters National Staff and Administrative Staff
2. Tables A8.7–A8.13 present the recruitment and retention experience for national staff
and administrative staff (NSAS) at headquarters. The main points are as follows:
(i) Recruitment rate. Table A8.7 provides a summary of the offers made and accepted from January 2005 to August 2014. Of the 51 offers made in the first 8 months of 2014, 44 (36 administrative staff and 8 national staff) were accepted (Table A8.8). However, the acceptance rate of 86.3% is lower than the average acceptance rate of 96.3% during 2005–2013. Moreover, the recruitment rates of 3.7% and 3.3% in 2013 and 2014, respectively, are the lowest per year since 2005. From January 2005 to August 2014, the majority of recruited NSAS came from the private sector (74.8%) and government agencies (19.7%) and the rest from international organizations and the academe, although no headquarters NSAS have been recruited from the academe since 2013 (Table A8.9).
(ii) Rejection rate. Table A8.10 shows the rejection rates from January 2005 to August 2014. The rejection rate of 13.7% during January–August 2014, which is the highest since 2006, is also considerably higher than the average rejection rate of 5.6% during 2005–2013.
(iii) Termination rate. Table A8.11 shows the termination rates from January 2005 to August 2014. The annualized termination rate of 6.5% is almost the same as the average termination rate of 6.4% during 2005–2013. However, the highest number of terminations (143) for the period was recorded in 2013, majority of which is due to early retirement (59.4%), voluntary resignation (17.5%), and normal retirement (11.9%). Terminations from January 2005 to August 2014 were mainly because of retirement, voluntary resignations, and ADB-initiated separations (Table A8.12).
(iv) Voluntary resignation rate. The annualized voluntary resignation rate of 2.4% for 2014 is higher than the average voluntary resignation rate of 1.7% during 2005–2013. Table A8.13 shows that in the first 8 months of 2014, 21 staff
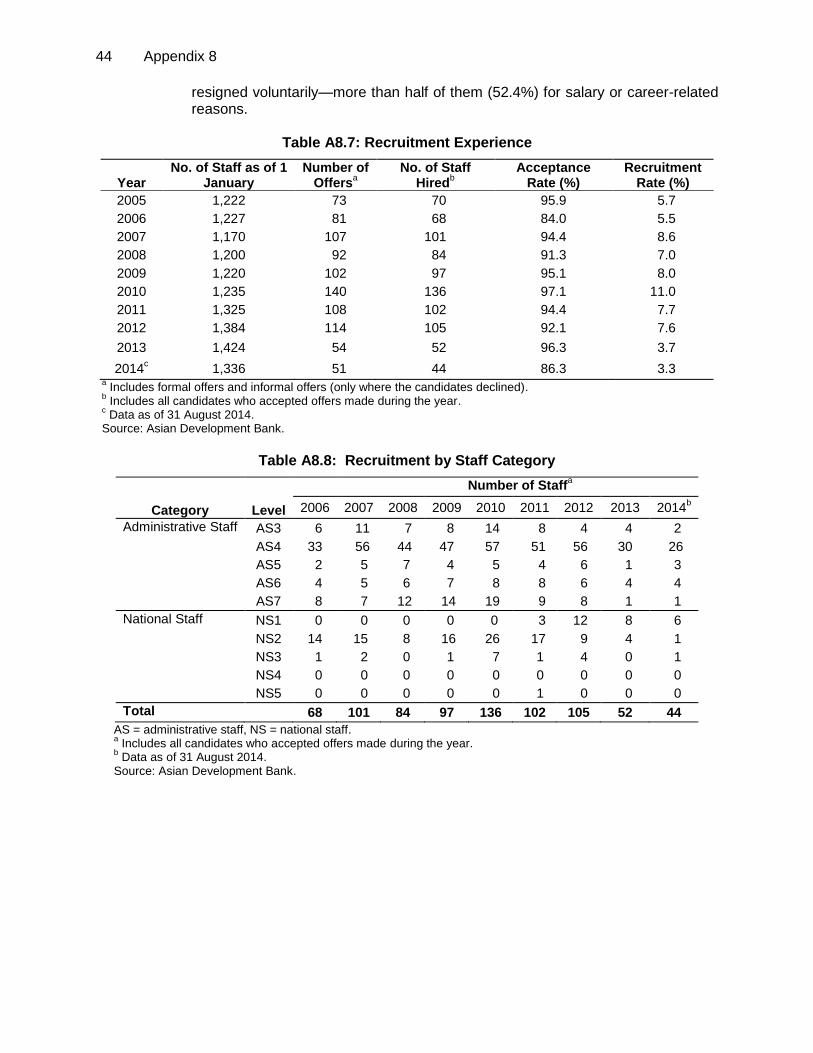
44 Appendix 8
resigned voluntarily—more than half of them (52.4%) for salary or career-related reasons.
Table A8.7: Recruitment Experience
Year No. of Staff as of 1
January Number of
Offersa
No. of Staff Hired
b
Acceptance Rate (%)
Recruitment Rate (%)
2005 1,222 73 70 95.9 5.7
2006 1,227 81 68 84.0 5.5
2007 1,170 107 101 94.4 8.6
2008 1,200 92 84 91.3 7.0
2009 1,220 102 97 95.1 8.0
2010 1,235 140 136 97.1 11.0
2011 1,325 108 102 94.4 7.7
2012 1,384 114 105 92.1 7.6
2013 1,424 54 52 96.3 3.7
2014c 1,336 51 44 86.3 3.3
a Includes formal offers and informal offers (only where the candidates declined).
b Includes all candidates who accepted offers made during the year.
c Data as of 31 August 2014.
Source: Asian Development Bank.
Table A8.8: Recruitment by Staff Category
Category Level
Number of Staffa
2006 2007 2008 2009 2010 2011 2012
2013 2014b
Administrative Staff AS3 6 11 7 8 14 8 4 4 2
AS4 33 56 44 47 57 51 56 30 26
AS5 2 5 7 4 5 4 6 1 3
AS6 4 5 6 7 8 8 6 4 4
AS7 8 7 12 14 19 9 8 1 1
National Staff NS1 0 0 0 0 0 3 12 8 6
NS2 14 15 8 16 26 17 9 4 1
NS3 1 2 0 1 7 1 4 0 1
NS4 0 0 0 0 0 0 0 0 0
NS5 0 0 0 0 0 1 0 0 0
Total 68 101 84 97 136 102 105 52 44
AS = administrative staff, NS = national staff. a Includes all candidates who accepted offers made during the year.
b Data as of 31 August 2014.
Source: Asian Development Bank.

Appendix 8 45
Table A8.9: Recruitment by Sourcea
Year
Private Sector
International Organization
Government Agencies Academe
(%) (%) (%) (%)
2005 68.5 1.4 24.7 5.5
2006 70.8 1.5 23.1 4.6
2007 74.8 2.9 18.5 3.9
2008 71.3 3.5 24.1 1.2
2009 69.8 6.3 20.8 3.1
2010 72.9 2.9 22.1 2.1
2011 78.3 5.0 15.8 0.8
2012 71.4 2.9 23.8 1.9
2013 92.3 1.9 5.8 0.0
2014b 75.0 4.5 20.5 0.0
a Includes all candidates who accepted offers made during the year.
b Data as of 31 August 2014.
Source: Asian Development Bank.
Table A8.10: Rejection of Job Offers
Year No. of Offers
No. of Rejections
Rejection Rates
(%)
2005 73 3 4.1
2006 81 13 16.0
2007 107 6 5.6
2008 92 8 8.7
2009 102 5 4.9
2010 140 4 2.9
2011 108 4 3.7
2012 114 5 4.4
2013 54 2 3.7
2014a 51 7 13.7
a Data as of 31 August 2014.
Source: Asian Development Bank.

46 Appendix 8
Table A8.11: Termination Rates
Year
No. of Staff as of 1
January
Voluntary Resignationsa Other Terminations Total Terminations
No. of Staff Rate (%) No. of Staff Rate (%) No. of Staff Rate (%)
2005 1,222 20 1.6 48 3.9 68 5.6
2006 1,227 19 1.5 103 8.4 122 9.9
2007 1,170 37 3.2 35 3.0 72 6.2
2008 1,200 25 2.1 42 3.5 67 5.6
2009 1,220 21 1.7 60 4.9 81 6.6
2010 1,235 18 1.5 32 2.6 50 4.0
2011 1,325 15 1.1 46 3.5 61 4.6
2012 1,384 17 1.2 42 3.0 59 4.3
2013 1,424 25 1.8 118 8.3 143 10.0
2014b 1,336 21 1.6 36 2.7 57 4.3
a The number of voluntary resignations from 2005 have been restated to exclude staff who are eligible to early
retirement benefits. b Data as of 31 August 2014.
Source: Asian Development Bank.

Appendix 8 47
Table A8.12: Reasons for Terminations
Termination Reasons 2005 2006 2007 2008 2009 2010 2011 2012
2013 2014
a
Voluntary resignationb 20 19 37 25 21 18 15 17 25 21
Retirement 7 18 16 25 23 21 27 25 105 33 Normal 4 14 8 13 9 9 19 17 19 2
Early 3 4 7 12 14 11 8 6 85 31 Incapacity 0 0 1 0 0 1 0 2 1 0
Fixed-term expiration 1 2 0 2 1 1 1 2 1 1
ADB-initiated separation 32 3 4 5 6 6 12 11 8 0
Misconduct 3 2 3 0 0 1 2 1 0 0
Non-confirmation 1 1 0 0 0 0 1 1 0 1
Death 1 2 0 3 0 0 1 0 1 0
Ill health 0 0 0 0 0 0 0 0 1 0
Special separation package 0 0 0 7 28 0 0 0 0 0
Enhanced separation program 0 73 12 0 0 0 0 0 0 0
Change to international staff category 3 2 0 0 2 3 2 2 2 1
Total 68 122 72 67 81 50 61 59 143 57
ADB = Asian Development Bank. a Data as of 31 August 2014.
b The number of voluntary resignations from 2005 have been restated to exclude staff who are eligible for early
retirement benefits. Source: Asian Development Bank.
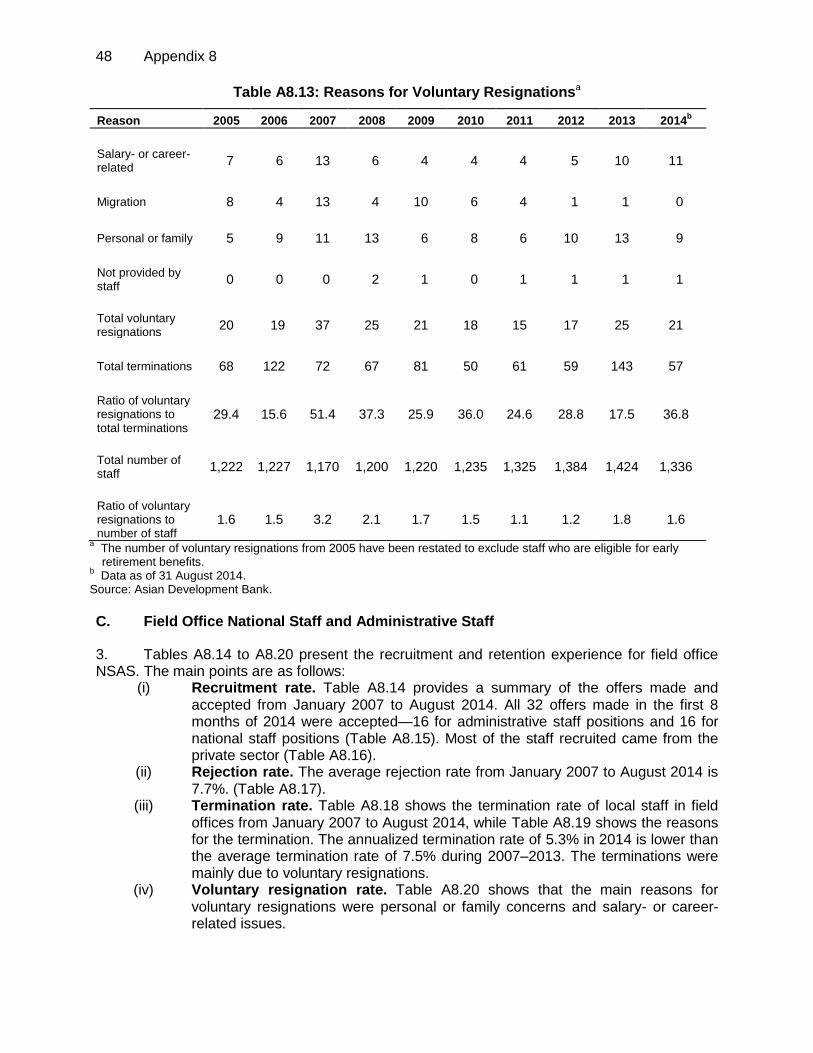
48 Appendix 8
Table A8.13: Reasons for Voluntary Resignationsa
Reason 2005 2006 2007 2008 2009 2010 2011 2012
2013 2014b
Salary- or career-related
7 6 13 6 4 4 4 5 10 11
Migration 8 4 13 4 10 6 4 1 1 0
Personal or family 5 9 11 13 6 8 6 10 13 9
Not provided by staff
0 0 0 2 1 0 1 1 1 1
Total voluntary resignations
20 19 37 25 21 18 15 17 25 21
Total terminations 68 122 72 67 81 50 61 59 143 57
Ratio of voluntary resignations to total terminations
29.4 15.6 51.4 37.3 25.9 36.0 24.6 28.8 17.5 36.8
Total number of staff
1,222 1,227 1,170 1,200 1,220 1,235 1,325 1,384 1,424 1,336
Ratio of voluntary resignations to number of staff
1.6 1.5 3.2 2.1 1.7 1.5 1.1 1.2 1.8 1.6
a The number of voluntary resignations from 2005 have been restated to exclude staff who are eligible for early
retirement benefits. b Data as of 31 August 2014.
Source: Asian Development Bank.
C. Field Office National Staff and Administrative Staff
3. Tables A8.14 to A8.20 present the recruitment and retention experience for field office NSAS. The main points are as follows:
(i) Recruitment rate. Table A8.14 provides a summary of the offers made and accepted from January 2007 to August 2014. All 32 offers made in the first 8 months of 2014 were accepted—16 for administrative staff positions and 16 for national staff positions (Table A8.15). Most of the staff recruited came from the private sector (Table A8.16).
(ii) Rejection rate. The average rejection rate from January 2007 to August 2014 is 7.7%. (Table A8.17).
(iii) Termination rate. Table A8.18 shows the termination rate of local staff in field offices from January 2007 to August 2014, while Table A8.19 shows the reasons for the termination. The annualized termination rate of 5.3% in 2014 is lower than the average termination rate of 7.5% during 2007–2013. The terminations were mainly due to voluntary resignations.
(iv) Voluntary resignation rate. Table A8.20 shows that the main reasons for voluntary resignations were personal or family concerns and salary- or career-related issues.

Appendix 8 49
Table A8.14: Recruitment Experience
Year No. of Staff as of
1 January No. of Offers
a
No. of Staff Appointments
a
Acceptance Rate (%)
Appointment Rate (%)
2007 374 62 55 88.7 14.7
2008 391 69 57 82.6 14.6
2009 406 64 58 90.6 14.3
2010 435 78 70 89.7 16.1
2011 477 86 71 82.6 14.9
2012 512 72 63 87.5 12.3
2013 545 41 37 90.2 6.8
2014b 550 32 32 100.0 5.8
a Includes local staff in the representative offices and all candidates who accepted offers made during the year.
b Data as of 31 August 2014.
Source: Asian Development Bank.
Table A8.15: Recruitment by Staff Category
Item
No. of Staffa
2007 2008 2009 2010 2011 2012
2013 2014b
Administrative Staff 29 28 36 36 46 36 18 16
National Staff 26 29 22 34 25 27 19 16
Total 55 57 58 70 71 63 37 32 a Includes all candidates who accepted offers made during the year.
b Data as of 31 August 2014.
Source: Asian Development Bank.
Table A8.16: Recruitment by Sourcea
Year
Private Sector
International Organization
Government Agencies Academe
(%) (%) (%) (%)
2007 69.1 16.4 14.6 0.0
2008 61.4 19.3 15.8 3.5
2009 62.1 10.3 27.6 0.0
2010 57.1 21.4 18.6 2.9
2011 67.6 19.7 11.3 1.4
2012 61.9 17.5 15.9 4.8
2013 64.9 18.9 16.2 0.0
2014b 84.4 6.3 6.3 3.1
a Includes all candidates who accepted offers made during the year.
b Data as of 31 August 2014.
Source: Asian Development Bank.

50 Appendix 8
Table A8.17: Rejection of Job Offers
Year No. of Offers
No. of Rejections
Rejection Rates
(%)
2007 62 7 11.3
2008 69 12 17.4
2009 64 6 9.4
2010 78 7 9.0
2011 86 10 11.6
2012 72 9 12.5
2013 41 4 9.8
2014a 32 0 0.0
a Data as of 31 August 2014.
Source: Asian Development Bank.
Table A8.18: Termination Rates
Year
No. of Staff as of 1 January
Voluntary Resignations
a
Other Terminations
Total Terminations
No. of Staff Rate (%)
No. of Staff Rate (%)
No. of Staff Rate (%)
2007 374 31 8.3 8 2.1 39 10.4
2008 391 37 9.5 5 1.3 42 10.7
2009 406 21 5.2 8 2.0 29 7.1
2010 435 14 3.2 14 3.2 28 6.4
2011 477 24 5.0 12 2.5 36 7.5
2012 512 13 2.5 17 3.3 30 5.9
2013 545 19 3.5 14 2.6 33 6.1
2014b 550 14 2.5 5 0.9 19 3.5
a The number of voluntary resignations from 2005 have been restated to exclude staff who are eligible for early
retirement benefits. b Data as of 31 August 2014.
Source: Asian Development Bank.
Table A8.19: Reasons for Terminations
Reason 2007 2008 2009 2010 2011 2012 2013 2014a
Voluntary resignation
b 31 37 21 14 24 13 19 14
Retirement 2 1 3 4 6 8 7 4
Fixed-term expiration 0 1 0 0 0 2 0 0
ADB-initiated separation 3 1 2 5 2 0 1 0
Change to international staff category 3 2 3 5 4 7 6 1
Total 39 42 29 28 36 30 33 19 a Data as of 31 August 2014.
b The number of voluntary resignations from 2005 have been restated to exclude staff who are eligible for early
retirement benefits. Source: Asian Development Bank.

Appendix 8 51
Table A8.20: Reasons for Voluntary Resignationsa
Reason 2007 2008 2009 2010 2011 2012 2013 2014b
Salary- or career-related 16 13 8 8 9 4 8 4
Migration 1 0 0 0 0 0 2 1
Personal or family 12 21 12 6 11 8 9 8
Not provided by staff 2 3 1 0 4 1 0 1
Total voluntary resignations 31 37 21 14 24 13 19 14
Total terminations 39 42 29 28 36 30 33 19
Ratio of voluntary resignations to total terminations
79.5 88.1 72.4 50.0 66.7 43.3 57.6 73.7
Total number of staff 374 391 406 435 477 512 545 550
Ratio of voluntary resignations to number of Staff 8.3 9.5 5.2 3.2 5.0 2.5 3.5 2.5
a The number of voluntary resignations from 2005 have been restated to exclude staff who are eligible for early
retirement benefits. b Data as of 31 August 2014.
Source: Asian Development Bank.