Annual Report - Oaktree Funds · Annual Report Oaktree High Yield ... The Oaktree Funds are...
40
OAKTREE FUNDS Annual Report Oaktree High Yield Bond Fund October 31, 2017
Transcript of Annual Report - Oaktree Funds · Annual Report Oaktree High Yield ... The Oaktree Funds are...

OAKTREE FUNDS
Annual ReportOaktree High Yield Bond FundOctober 31, 2017


Shareholder Letter (Unaudited) . . . . . . . . . . . . . . . . . . . . . . . . . . . . . . . . . . . . . . . . . . . . . . . . . . . . . . . 2
Schedule of Investments . . . . . . . . . . . . . . . . . . . . . . . . . . . . . . . . . . . . . . . . . . . . . . . . . . . . . . . . . . . . . 4
Financial Statements . . . . . . . . . . . . . . . . . . . . . . . . . . . . . . . . . . . . . . . . . . . . . . . . . . . . . . . . . . . . . . . . 14
Notes to the Financial Statements . . . . . . . . . . . . . . . . . . . . . . . . . . . . . . . . . . . . . . . . . . . . . . . . . . . . . . 19
Report of Independent Registered Public Accounting Firm . . . . . . . . . . . . . . . . . . . . . . . . . . . . . . . . . . 27
Expense Example (Unaudited) . . . . . . . . . . . . . . . . . . . . . . . . . . . . . . . . . . . . . . . . . . . . . . . . . . . . . . . . 28
Additional Information (Unaudited) . . . . . . . . . . . . . . . . . . . . . . . . . . . . . . . . . . . . . . . . . . . . . . . . . . . . 29
Privacy Notice (Unaudited) . . . . . . . . . . . . . . . . . . . . . . . . . . . . . . . . . . . . . . . . . . . . . . . . . . . . . . . . . . . 34
Oaktree Funds 1
Table of Contents

Oaktree Funds 2
Shareholder Letter (Unaudited)
Dear Shareholders,
Since the founding of Oaktree Capital Management, L.P. (“the Advisor”) in 1995, we have served our institutionalclients by investing in less efficient markets and alternative investments. We are defined by our six investmentphilosophies and guided by our business principles, believing excellent performance can only be achieved throughsuperior knowledge of companies and their securities, not through attempts at predicting what is in store for theeconomy, interest rates or the securities markets. On December 16, 2014, we launched Oaktree Funds, our mutualfund complex, in an effort to offer our investment strategies in a more accessible investment vehicle. In our thirdreporting period, the High Yield Bond Fund (“the Fund”) has enjoyed continued growth and scaling of theproduct.
OAKTREE HIGH YIELD BOND FUND COMMENTARY
Investors favored higher risk assets during the twelve month period ended October 31, 2017. Bolstered by aresilient U.S. economy and low interest rates around the globe, equities ranked as the top performer, with the S&P 5001 returning an impressive 23.6%.
Taking their lead from the rallying equity market, global high yield bonds also performed well, trouncinginvestment grade securities by a wide margin. Reflecting investors’ strong risk appetites, CCC-rated bondsmeaningfully outperformed their higher rated counterparts.
With investors bracing for the Federal Reserve to raise U.S. interest rates, it’s fair to consider how high yieldbonds would fare in such an environment. Thanks to their higher coupon and typically shorter maturities, theduration of high yield bonds is moderate. As a result, high yield bonds should be well positioned to outperformlonger duration investment grade bonds in a rising interest rate environment. In addition, rising interest ratesusually imply a growing economy, and a growing economy usually means improving creditworthiness and fewerdefaults.
Credit conditions in the high yield bond market were relatively sound during the reporting period, and defaults areexpected to remain relatively low in the near-term. Supporting this view is the small percentage of the markettrading at or below 70% of par (an indicator of perceived credit weakness).
The portfolio is defensively positioned, built to preserve capital in the event of a market downturn.
Thank you for investing in Oaktree Funds.
Sincerely,
John SweeneyPresident
__________1 The S&P 500 Index is a U.S. equities index based on the market capitalizations of 500 large companies having common stock listed on the NYSE or
NASDAQ. The index’s composition is determined by the S&P Dow Jones Indices.

Must be Preceded or Accompanied by a prospectus.
Past Performance does not guarantee future results.
Mutual fund investing involves risk. Principal loss is possible. The Fund will invest in foreign and emergingmarkets securities which involve political, economic and currency risks, greater volatility and differences inaccounting methods. The Fund may invest in derivatives, which involve risks different from, and in certaincases, greater than the risks presented by more traditional investments. Derivatives may involve certaincosts and risks such as liquidity, interest rate, market, credit, management and the risk that a positioncould not be closed when most advantageous. An investment in derivatives could lose more than theprincipal amount invested. The Fund will also invest in debt securities, which typically decrease in valuewhen interest rates rise. Longer-term debt securities are more sensitive to changes in interest rates and willtypically change in value more than shorter-term debt securities as interest rates fluctuate. Investments inlower-rated and non-rated securities present a greater risk of loss to principal and interest than higher-rated securities.
Credit quality weights by rating are derived from the highest bond rating as determined by Standard & Poor’s(“S&P”), Moody’s or Fitch. Bond ratings are grades given to bonds that indicate their credit quality as determinedby private independent rating services such as S&P, Moody’s and Fitch. These firms evaluate a bond issuer’sfinancial strength, or its ability to pay a bond’s principal and interest in a timely fashion. Ratings are expressed asletters ranging from ‘AAA’, which is the highest grade, to‘D’, which is the lowest grade. In limited situations whennone of the three rating agencies have issued a formal rating, the Advisor will classify the security as nonrated.
Par: The face value of a security, as distinct from its market value.
Duration:A measure of a bond’s sensitivity to interest rate changes.
The opinions expressed are those of the investment advisor, are subject to change, and forecasts made cannot beguaranteed. Fund holdings and sector allocations are subject to change and should not be consideredrecommendations to buy or sell any security. Please see the Schedule of Investments in this report for currentFund’s holdings at October 31, 2017.
You cannot invest directly in an index.
The Oaktree Funds are distributed by Quasar Distributors, LLC.
Oaktree Funds 3
Shareholder Letter (Unaudited)

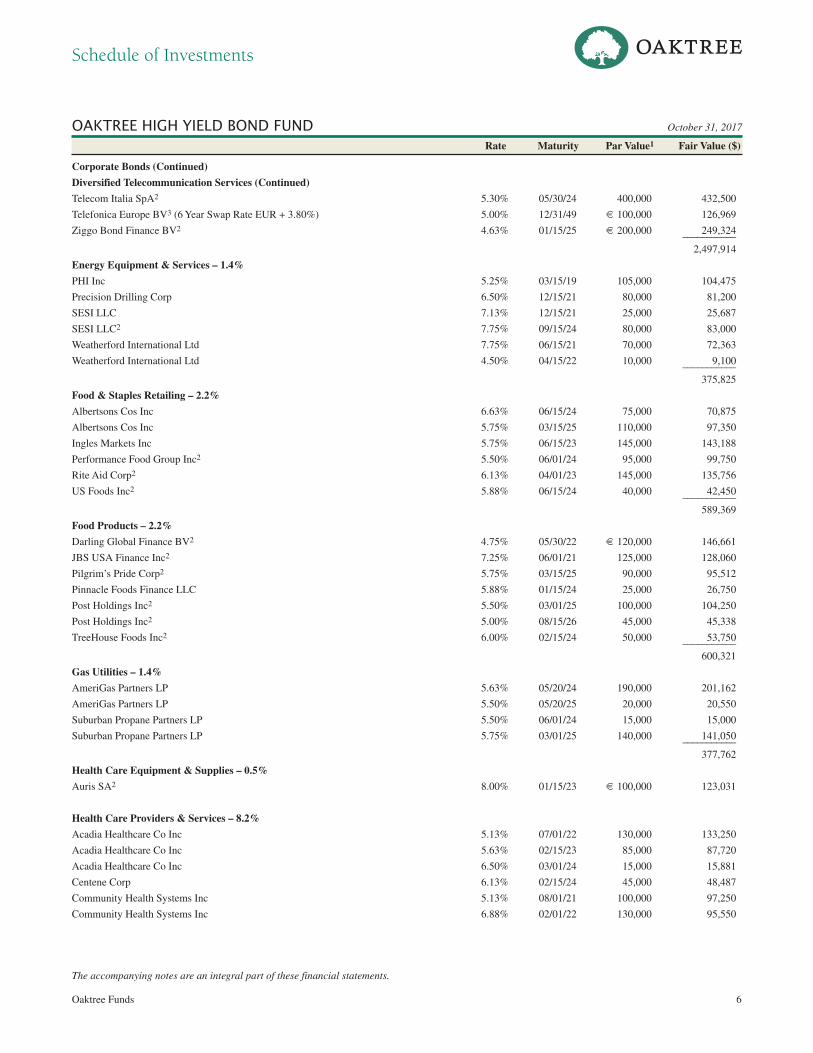
OAKTREE HIGH YIELD BOND FUND October 31, 2017
Rate Maturity Par Value1 Fair Value ($)
Corporate Bonds – 91.7%
Aerospace & Defense – 0.6%
Booz Allen Hamilton Inc2 5.13% 05/01/25 80,000 81,800
TransDigm Inc 6.50% 05/15/25 85,000 87,869 ___________
169,669
Auto Components – 0.7%
Allison Transmission Inc2 5.00% 10/01/24 20,000 20,900
Dana Financing SARL2 5.75% 04/15/25 50,000 53,125
Gates Global Co2 6.00% 07/15/22 60,000 62,025
Tenneco Inc 5.38% 12/15/24 50,000 52,687 ___________
188,737
Beverages – 0.5%
Cott Corp2 5.50% 07/01/24 € 100,000 128,379
Biotechnology – 0.6%
Grifols SA2 3.20% 05/01/25 € 130,000 154,096
Building Products – 1.3%
Masonite International Corp2 5.63% 03/15/23 80,000 84,300
Standard Industries Inc2 5.50% 02/15/23 185,000 195,637
Standard Industries Inc2 5.38% 11/15/24 65,000 68,893
USG Corp2 5.50% 03/01/25 10,000 10,763 ___________
359,593
Capital Markets – 0.4%
LHC3 PLC (PIK 9.00%)2 4.13% 08/15/24 € 100,000 120,645
Chemicals – 4.2%
Axalta Coating Systems LLC2 4.25% 08/15/24 € 115,000 144,923
Chemours Co 5.38% 05/15/27 50,000 53,500
Diamond BC BV2 5.63% 08/15/25 € 100,000 120,665
Inovyn Finance PLC2 6.25% 05/15/21 € 80,000 96,430
Kraton Polymers Capital Corp2 7.00% 04/15/25 70,000 75,950
Kronos International Inc2 3.75% 09/15/25 € 100,000 121,922
NOVA Chemicals Corp2 4.88% 06/01/24 20,000 20,425
Olin Corp 5.13% 09/15/27 60,000 63,225
Plastipak Holdings, Inc.2 6.25% 10/15/25 50,000 51,187
PSPC Escrow Corp2 6.00% 02/01/23 € 100,000 122,795
PSPC Escrow Corp 6.00% 02/01/23 € 100,000 122,795
Tronox Finance LLC2 7.50% 03/15/22 150,000 158,062 ___________
1,151,879
Commercial Services & Supplies – 2.1%
Covanta Holding Corp 6.38% 10/01/22 115,000 119,025
Covanta Holding Corp 5.88% 03/01/24 35,000 35,175
Covanta Holding Corp 5.88% 07/01/25 15,000 14,887
Iron Mountain Inc2 3.00% 01/15/25 € 100,000 118,570
Iron Mountain Inc2 4.88% 09/15/27 85,000 86,913
TMS International Corp2 7.25% 08/15/25 90,000 94,050
Oaktree Funds 4
The accompanying notes are an integral part of these financial statements.
Schedule of Investments

OAKTREE HIGH YIELD BOND FUND October 31, 2017
Rate Maturity Par Value1 Fair Value ($)
Corporate Bonds (Continued)
Commercial Services & Supplies (Continued)
Intrum Justitia AB 3.13% 07/15/24 € 100,000 119,710 ___________
588,330
Communications Equipment – 1.3%
CommScope Inc2 5.50% 06/15/24 75,000 78,375
CommScope Inc2 5.00% 03/15/27 100,000 97,625
Plantronics Inc2 5.50% 05/31/23 90,000 94,050
ViaSat Inc2 5.63% 09/15/25 95,000 96,480 ___________
366,530
Construction & Engineering – 0.3%
AECOM 5.75% 10/15/22 85,000 89,144
Construction Materials – 0.7%
Summit Materials LLC 6.13% 07/15/23 185,000 192,863
Consumer Finance – 0.6%
Ally Financial Inc 4.13% 02/13/22 10,000 10,425
Ally Financial Inc 4.63% 05/19/22 30,000 31,800
Lincoln Finance Ltd2 6.88% 04/15/21 € 100,000 123,325 ___________
165,550
Containers & Packaging – 4.2%
Ardagh Packaging Finance PLC (PIK 7.38%) 6.63% 09/15/23 € 210,000 263,669
Ardagh Packaging Finance PLC2 6.75% 05/15/24 € 125,000 163,344
Cascades Inc2 5.50% 07/15/22 125,000 129,375
Cascades Inc2 5.75% 07/15/23 55,000 58,025
Crown European Holdings SA2 2.63% 09/30/24 € 105,000 127,269
Owens-Brockway Glass Container Inc2 5.00% 01/15/22 125,000 132,656
Sealed Air Corp2 4.50% 09/15/23 € 100,000 133,860
Silgan Holdings Inc2 3.25% 03/15/25 € 120,000 145,750 ___________
1,153,948
Distributors – 0.5%
LKQ Italia Bondco SpA2 3.88% 04/01/24 € 105,000 135,640
Diversified Consumer Services – 0.5%
AA Bond Co Ltd2 5.50% 07/31/22 £ 100,000 137,101
Diversified Telecommunication Services – 9.2%
Altice Financing SA2 7.63% 02/15/25 200,000 214,250
Altice Financing SA 6.25% 02/15/25 € 100,000 128,995
CenturyLink Inc 5.80% 03/15/22 145,000 147,719
Frontier Communications Corp 7.13% 01/15/23 25,000 19,320
Frontier Communications Corp 7.63% 04/15/24 90,000 69,300
Inmarsat Finance PLC2 6.50% 10/01/24 200,000 215,875
Intelsat Jackson Holdings SA2 8.00% 02/15/24 170,000 181,475
Level 3 Financing Inc 5.13% 05/01/23 250,000 256,563
SBA Communications Corp 4.88% 09/01/24 165,000 169,950
SFR Group SA 5.63% 05/15/24 € 225,000 285,674
Oaktree Funds 5
The accompanying notes are an integral part of these financial statements.
Schedule of Investments
OAKTREE HIGH YIELD BOND FUND October 31, 2017
Rate Maturity Par Value1 Fair Value ($)
Corporate Bonds (Continued)
Diversified Telecommunication Services (Continued)
Telecom Italia SpA2 5.30% 05/30/24 400,000 432,500
Telefonica Europe BV3 (6 Year Swap Rate EUR + 3.80%) 5.00% 12/31/49 € 100,000 126,969
Ziggo Bond Finance BV2 4.63% 01/15/25 € 200,000 249,324 ___________
2,497,914
Energy Equipment & Services – 1.4%
PHI Inc 5.25% 03/15/19 105,000 104,475
Precision Drilling Corp 6.50% 12/15/21 80,000 81,200
SESI LLC 7.13% 12/15/21 25,000 25,687
SESI LLC2 7.75% 09/15/24 80,000 83,000
Weatherford International Ltd 7.75% 06/15/21 70,000 72,363
Weatherford International Ltd 4.50% 04/15/22 10,000 9,100 ___________
375,825
Food & Staples Retailing – 2.2%
Albertsons Cos Inc 6.63% 06/15/24 75,000 70,875
Albertsons Cos Inc 5.75% 03/15/25 110,000 97,350
Ingles Markets Inc 5.75% 06/15/23 145,000 143,188
Performance Food Group Inc2 5.50% 06/01/24 95,000 99,750
Rite Aid Corp2 6.13% 04/01/23 145,000 135,756
US Foods Inc2 5.88% 06/15/24 40,000 42,450 ___________
589,369
Food Products – 2.2%
Darling Global Finance BV2 4.75% 05/30/22 € 120,000 146,661
JBS USA Finance Inc2 7.25% 06/01/21 125,000 128,060
Pilgrim’s Pride Corp2 5.75% 03/15/25 90,000 95,512
Pinnacle Foods Finance LLC 5.88% 01/15/24 25,000 26,750
Post Holdings Inc2 5.50% 03/01/25 100,000 104,250
Post Holdings Inc2 5.00% 08/15/26 45,000 45,338
TreeHouse Foods Inc2 6.00% 02/15/24 50,000 53,750 ___________
600,321
Gas Utilities – 1.4%
AmeriGas Partners LP 5.63% 05/20/24 190,000 201,162
AmeriGas Partners LP 5.50% 05/20/25 20,000 20,550
Suburban Propane Partners LP 5.50% 06/01/24 15,000 15,000
Suburban Propane Partners LP 5.75% 03/01/25 140,000 141,050 ___________
377,762
Health Care Equipment & Supplies – 0.5%
Auris SA2 8.00% 01/15/23 € 100,000 123,031
Health Care Providers & Services – 8.2%
Acadia Healthcare Co Inc 5.13% 07/01/22 130,000 133,250
Acadia Healthcare Co Inc 5.63% 02/15/23 85,000 87,720
Acadia Healthcare Co Inc 6.50% 03/01/24 15,000 15,881
Centene Corp 6.13% 02/15/24 45,000 48,487
Community Health Systems Inc 5.13% 08/01/21 100,000 97,250
Community Health Systems Inc 6.88% 02/01/22 130,000 95,550
Oaktree Funds 6
The accompanying notes are an integral part of these financial statements.
Schedule of Investments

OAKTREE HIGH YIELD BOND FUND October 31, 2017
Rate Maturity Par Value1 Fair Value ($)
Corporate Bonds (Continued)
Health Care Providers & Services (Continued)
Community Health Systems Inc 6.25% 03/31/23 85,000 81,919
Constantin Investissement 3 SASU2 5.38% 04/15/25 € 100,000 120,110
DaVita Inc 5.00% 05/01/25 200,000 197,500
Envision Healthcare Corp2 5.13% 07/01/22 110,000 112,200
Envision Healthcare Corp 5.63% 07/15/22 105,000 107,231
HCA Holdings Inc 6.25% 02/15/21 335,000 360,962
HCA Holdings Inc 5.88% 05/01/23 25,000 26,844
HCA Holdings Inc 5.25% 06/15/26 35,000 37,319
HealthSouth Corp 5.75% 11/01/24 100,000 102,563
LifePoint Health Inc 5.88% 12/01/23 45,000 46,415
LifePoint Health Inc 5.38% 05/01/24 120,000 120,900
Nidda BondCo GmbH2 5.00% 09/30/25 € 100,000 119,724
Tenet Healthcare Corp 4.75% 06/01/20 145,000 149,350
Tenet Healthcare Corp2 7.50% 01/01/22 95,000 100,344
Tenet Healthcare Corp 6.75% 06/15/23 65,000 61,263 ___________
2,222,782
Health Care Technology – 0.5%
Change Healthcare Holdings Inc2 5.75% 03/01/25 130,000 133,413
Hotels, Restaurants & Leisure – 4.8%
Boyd Gaming Corp 6.38% 04/01/26 85,000 93,500
Brinker International Inc2 5.00% 10/01/24 115,000 115,287
Cedar Fair LP 5.38% 06/01/24 50,000 52,875
Cedar Fair LP2 5.38% 04/15/27 45,000 47,644
CPUK Finance Ltd 4.25% 08/28/22 £ 100,000 136,384
Eldorado Resorts Inc 6.00% 04/01/25 105,000 111,300
ESH Hospitality Inc2 5.25% 05/01/25 145,000 150,256
Golden Nugget Inc2 6.75% 10/15/24 105,000 107,100
KFC Holding Co2 5.00% 06/01/24 90,000 95,175
Scientific Games International Inc2 7.00% 01/01/22 120,000 127,200
Six Flags Entertainment Corp2 4.88% 07/31/24 135,000 139,219
Six Flags Entertainment Corp2 5.50% 04/15/27 20,000 20,925
Wynn Resorts Ltd2 5.25% 05/15/27 115,000 117,588 ___________
1,314,453
Household Durables – 0.9%
Apex Tool Group LLC2 7.00% 02/01/21 80,000 76,200
Tempur Sealy International Inc 5.63% 10/15/23 30,000 31,800
Tempur Sealy International Inc 5.50% 06/15/26 135,000 139,387 ___________
247,387
Household Products – 0.3%
Energizer Holdings Inc2 5.50% 06/15/25 80,000 84,200
Independent Power & Renewable Electricity Producers – 2.1%
AES Corp 6.00% 05/15/26 115,000 124,487
AES Corp 5.13% 09/01/27 90,000 92,610
Dynegy Inc 6.75% 11/01/19 94,000 97,642
Oaktree Funds 7
The accompanying notes are an integral part of these financial statements.
Schedule of Investments

OAKTREE HIGH YIELD BOND FUND October 31, 2017
Rate Maturity Par Value1 Fair Value ($)
Corporate Bonds (Continued)
Independent Power & Renewable Electricity Producers (Continued)
NRG Yield Operating LLC 5.00% 09/15/26 140,000 144,900
TerraForm Power Operating LLC2,5 6.38% 02/01/23 115,000 121,038 ___________
580,677
Insurance – 0.3%
HUB International Ltd2 7.88% 10/01/21 70,000 72,946
IT Services – 1.4%
First Data Corp2 7.00% 12/01/23 60,000 64,351
First Data Corp2 5.75% 01/15/24 310,000 325,500 ___________
389,851
Life Sciences Tools & Services – 1.9%
Jaguar Holding Co II2 6.38% 08/01/23 115,000 120,319
Quintiles IMS Inc2 3.50% 10/15/24 € 100,000 122,799
Synlab Bondco PLC2 6.25% 07/01/22 € 100,000 124,454
VWR Funding Inc2 4.63% 04/15/22 € 125,000 151,806 ___________
519,378
Machinery – 0.3%
TriMas Corp2 4.88% 10/15/25 80,000 81,050
Media – 7.6%
Arqiva Broadcast Finance PLC 9.50% 03/31/20 £ 100,000 140,451
CCO Holdings LLC2 5.13% 05/01/23 85,000 88,825
CCO Holdings LLC2 5.88% 04/01/24 30,000 32,025
CCO Holdings LLC2 5.00% 02/01/28 105,000 104,737
CSC Holdings Inc2 5.50% 04/15/27 140,000 144,550
DISH DBS Corp 5.88% 07/15/22 75,000 75,750
DISH DBS Corp 5.00% 03/15/23 65,000 63,050
DISH DBS Corp 7.75% 07/01/26 40,000 43,900
Sirius XM Radio Inc2 5.00% 08/01/27 65,000 65,894
Telenet Finance SCA 4.88% 07/15/27 € 100,000 129,155
Unitymedia Hessen GmbH & Co KG 5.13% 01/21/23 € 72,900 88,051
Unitymedia Hessen GmbH & Co KG 3.75% 01/15/27 € 100,000 121,700
Univision Communications Inc2 5.13% 05/15/23 176,000 178,640
UPC Holding BV 4.00% 01/15/27 € 125,000 155,443
Virgin Media Finance PLC 5.50% 09/15/24 £ 240,000 332,840
Virgin Media Finance PLC2 5.50% 01/15/25 20,000 21,075
Vue International Bidco PLC 7.88% 07/15/20 £ 100,000 136,351
WMG Acquisition Corp2 4.13% 11/01/24 € 115,000 142,559 ___________
2,064,996
Metals & Mining – 2.5%
ArcelorMittal 6.13% 06/01/25 85,000 98,470
BlueScope Steel Finance Ltd2 6.50% 05/15/21 45,000 47,137
Eldorado Gold Corp2 6.13% 12/15/20 60,000 59,700
First Quantum Minerals Ltd2 7.25% 05/15/22 65,000 68,250
Grinding Media Inc2 7.38% 12/15/23 80,000 87,200
Novelis Corp2 6.25% 08/15/24 65,000 68,738
Oaktree Funds 8
The accompanying notes are an integral part of these financial statements.
Schedule of Investments

OAKTREE HIGH YIELD BOND FUND October 31, 2017
Rate Maturity Par Value1 Fair Value ($)
Corporate Bonds (Continued)
Metals & Mining (Continued)
Novelis Corp2 5.88% 09/30/26 95,000 98,146
SunCoke Energy Partners LP2 7.50% 06/15/25 140,000 147,700 ___________
675,341
Multiline Retail – 0.3%
Neiman Marcus Group LLC2 8.00% 10/15/21 15,000 8,925
Neiman Marcus Group LLC2 (PIK 9.50%) 8.75% 10/15/21 130,937 71,361 ___________
80,286
Oil, Gas & Consumable Fuels – 8.3%
Antero Resources Corp 5.13% 12/01/22 5,000 5,162
Antero Resources Corp 5.63% 06/01/23 75,000 78,937
Ascent Resources Utica Holdings LLC2 10.00% 04/01/22 55,000 59,950
Baytex Energy Corp2 5.13% 06/01/21 65,000 61,912
Carrizo Oil & Gas Inc 6.25% 04/15/23 65,000 66,462
Cheniere Energy Corp 7.00% 06/30/24 100,000 114,625
Cheniere Energy Corp2 5.13% 06/30/27 10,000 10,337
Cheniere Energy Partners LP2 5.25% 10/01/25 110,000 113,575
Chesapeake Energy Corp2 8.00% 01/15/25 165,000 165,412
Chesapeake Energy Corp2 8.00% 06/15/27 5,000 4,869
CITGO Petroleum Corp2 6.25% 08/15/22 180,000 185,850
Denbury Resources Inc2 9.00% 05/15/21 120,000 117,900
Energy Transfer Equity LP 4.25% 03/15/23 35,000 35,700
Energy Transfer Equity LP 5.88% 01/15/24 95,000 103,550
Extraction Oil & Gas Holdings LLC2 7.88% 07/15/21 135,000 143,775
Gulfport Energy Corp 6.63% 05/01/23 90,000 92,700
Gulfport Energy Corp 6.00% 10/15/24 30,000 30,150
Laredo Petroleum Inc 5.63% 01/15/22 105,000 107,494
Natural Resource Partners LP 10.50% 03/15/22 67,000 71,523
Oasis Petroleum Inc 6.88% 03/15/22 105,000 108,413
Oasis Petroleum Inc 6.88% 01/15/23 35,000 35,963
Parsley Energy LLC2 5.63% 10/15/27 65,000 67,235
RSP Permian Inc2 5.25% 01/15/25 95,000 97,138
SM Energy Co 6.13% 11/15/22 30,000 30,300
SM Energy Co 5.00% 01/15/24 20,000 19,200
SM Energy Co 5.63% 06/01/25 20,000 19,550
SM Energy Co 6.75% 09/15/26 20,000 20,625
Southwestern Energy Co 7.50% 04/01/26 105,000 109,069
Targa Resources Partners LP 6.75% 03/15/24 105,000 113,269
Targa Resources Partners LP 5.13% 02/01/25 40,000 41,350
Ultra Petroleum Corp2 6.88% 04/15/22 20,000 20,225 ___________
2,252,220
Paper & Forest Products – 0.6%
Reynolds Group Issuer Inc 5.75% 10/15/20 45,000 45,844
Reynolds Group Issuer Inc2 5.13% 07/15/23 60,000 62,550
Reynolds Group Issuer Inc2 7.00% 07/15/24 60,000 64,163 ___________
172,557
Oaktree Funds 9
The accompanying notes are an integral part of these financial statements.
Schedule of Investments

OAKTREE HIGH YIELD BOND FUND October 31, 2017
Rate Maturity Par Value1 Fair Value ($)
Corporate Bonds (Continued)
Personal Products – 0.4%
First Quality Finance Co Inc2 4.63% 05/15/21 120,000 121,800
Pharmaceuticals – 2.8%
Catalent Pharma Solutions Inc2 4.75% 12/15/24 € 115,000 145,037
Endo Finance LLC2 5.75% 01/15/22 55,000 48,400
Endo Finance LLC2 5.38% 01/15/23 25,000 20,250
Prestige Brands Inc2 5.38% 12/15/21 150,000 154,852
Valeant Pharmaceuticals International Inc2 5.63% 12/01/21 75,000 68,719
Valeant Pharmaceuticals International Inc2 6.50% 03/15/22 20,000 21,275
Valeant Pharmaceuticals International Inc2 7.25% 07/15/22 175,000 168,875
Valeant Pharmaceuticals International Inc2 5.88% 05/15/23 115,000 97,319
Valeant Pharmaceuticals International Inc2 5.50% 11/01/25 30,000 30,712 ___________
755,439
Professional Services – 0.7%
Nielsen Finance LLC2 5.00% 04/15/22 170,000 175,504
Nielsen Finance LLC2 5.00% 02/01/25 20,000 20,750 ___________
196,254
Real Estate Management & Development – 0.5%
Kennedy-Wilson Inc 5.88% 04/01/24 135,000 140,231
Road & Rail – 0.6%
OPE KAG Finance Sub Inc2 7.88% 07/31/23 30,000 31,275
Watco Companies LLC2 6.38% 04/01/23 125,000 130,313 ___________
161,588
Software – 0.8%
Open Text Corp2 5.63% 01/15/23 125,000 131,406
Open Text Corp2 5.88% 06/01/26 30,000 32,587
SS&C Technologies Holdings Inc 5.88% 07/15/23 50,000 53,063 ___________
217,056
Specialty Retail – 2.2%
DBP Holding Corp2 7.75% 10/15/20 160,000 86,400
Goeasy Ltd2 7.88% 11/01/22 75,000 77,156
Group 1 Automotive Inc2 5.25% 12/15/23 25,000 25,875
Party City Holdings Inc2 6.13% 08/15/23 155,000 161,587
PetSmart Inc2 7.13% 03/15/23 100,000 76,500
PetSmart Inc2 5.88% 06/01/25 60,000 52,500
PetSmart Inc2 8.88% 06/01/25 40,000 31,600
Rent-A-Center Inc 4.75% 05/01/21 105,000 97,388 ___________
609,006
Textiles, Apparel & Luxury Goods – 1.0%
Hanesbrands Finance SCA2 3.50% 06/15/24 € 120,000 151,515
Levi Strauss & Co 3.38% 03/15/27 € 100,000 122,848 ___________
274,363
Oaktree Funds 10
The accompanying notes are an integral part of these financial statements.
Schedule of Investments
OAKTREE HIGH YIELD BOND FUND October 31, 2017
Rate Maturity Par Value1 Fair Value ($)
Corporate Bonds (Continued)
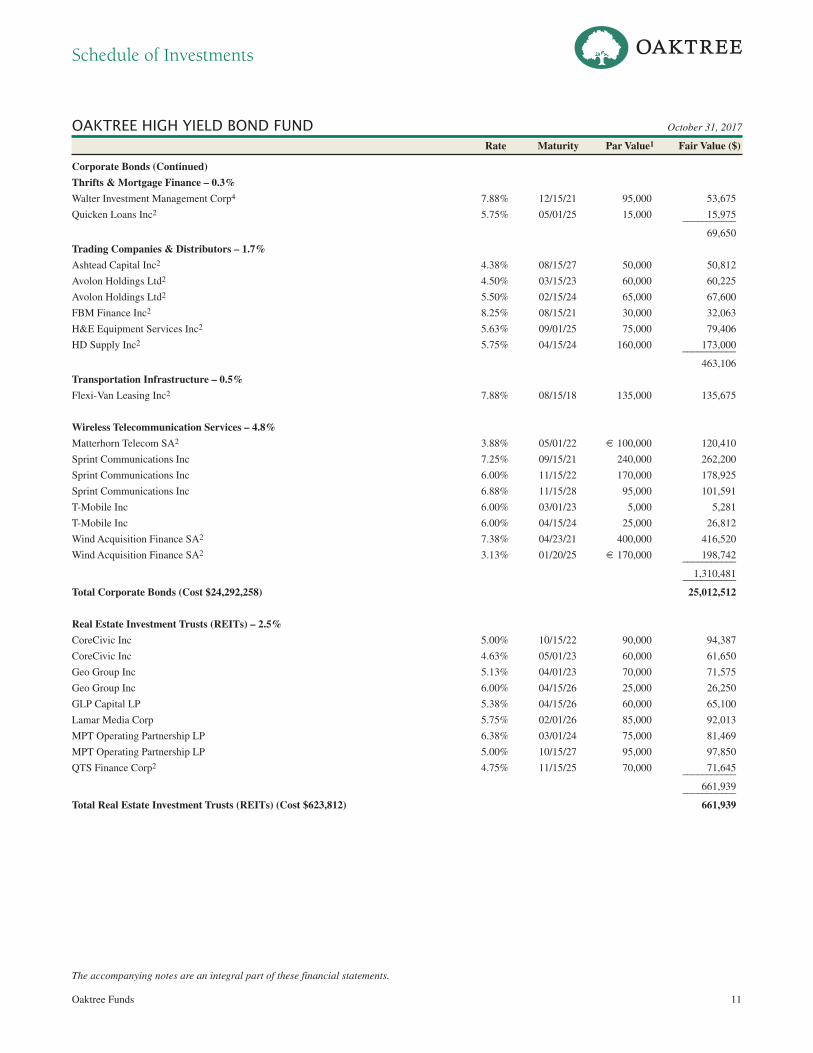
Thrifts & Mortgage Finance – 0.3%
Walter Investment Management Corp4 7.88% 12/15/21 95,000 53,675
Quicken Loans Inc2 5.75% 05/01/25 15,000 15,975 ___________
69,650
Trading Companies & Distributors – 1.7%
Ashtead Capital Inc2 4.38% 08/15/27 50,000 50,812
Avolon Holdings Ltd2 4.50% 03/15/23 60,000 60,225
Avolon Holdings Ltd2 5.50% 02/15/24 65,000 67,600
FBM Finance Inc2 8.25% 08/15/21 30,000 32,063
H&E Equipment Services Inc2 5.63% 09/01/25 75,000 79,406
HD Supply Inc2 5.75% 04/15/24 160,000 173,000 ___________
463,106
Transportation Infrastructure – 0.5%
Flexi-Van Leasing Inc2 7.88% 08/15/18 135,000 135,675
Wireless Telecommunication Services – 4.8%
Matterhorn Telecom SA2 3.88% 05/01/22 € 100,000 120,410
Sprint Communications Inc 7.25% 09/15/21 240,000 262,200
Sprint Communications Inc 6.00% 11/15/22 170,000 178,925
Sprint Communications Inc 6.88% 11/15/28 95,000 101,591
T-Mobile Inc 6.00% 03/01/23 5,000 5,281
T-Mobile Inc 6.00% 04/15/24 25,000 26,812
Wind Acquisition Finance SA2 7.38% 04/23/21 400,000 416,520
Wind Acquisition Finance SA2 3.13% 01/20/25 € 170,000 198,742 ___________
1,310,481 ___________
Total Corporate Bonds (Cost $24,292,258) 25,012,512
Real Estate Investment Trusts (REITs) – 2.5%
CoreCivic Inc 5.00% 10/15/22 90,000 94,387
CoreCivic Inc 4.63% 05/01/23 60,000 61,650
Geo Group Inc 5.13% 04/01/23 70,000 71,575
Geo Group Inc 6.00% 04/15/26 25,000 26,250
GLP Capital LP 5.38% 04/15/26 60,000 65,100
Lamar Media Corp 5.75% 02/01/26 85,000 92,013
MPT Operating Partnership LP 6.38% 03/01/24 75,000 81,469
MPT Operating Partnership LP 5.00% 10/15/27 95,000 97,850
QTS Finance Corp2 4.75% 11/15/25 70,000 71,645 ___________
661,939 ___________
Total Real Estate Investment Trusts (REITs) (Cost $623,812) 661,939
Oaktree Funds 11
The accompanying notes are an integral part of these financial statements.
Schedule of Investments

OAKTREE HIGH YIELD BOND FUND October 31, 2017
Rate Maturity Par Value1 Fair Value ($)
Bank Loans – 0.3%
Diversified Telecommunication Services – 0.1%
CenturyLink Inc, Guaranteed Senior Secured 1st Lien Term Loan, Tranche B3
(1 Month LIBOR USD + 0.00%) 2.75% 01/31/25 15,000 14,836
Household Durables – 0.2%
Serta Simmons Bedding LLC, Secured 2nd Lien Term Loan3
(3 Month LIBOR USD + 8.00%) 9.31% 10/21/24 67,239 64,196 ___________
Total Bank Loans (Cost $81,758) 79,032
Common Stocks – 0.1% Shares ______
Oil, Gas & Consumable Fuels – 0.1%
Ultra Petroleum Corp4 3,548 28,179 ___________
Total Common Stocks (Cost $55,781) 28,179 ___________
Total Investments – 94.6% (Cost $25,053,609) 25,781,662
Other Assets in Excess of Liabilities – 5.4% 1,468,272 ___________
Net Assets – 100.0% $27,249,934
1 Unless otherwise noted, amount is in U.S. Dollars. 2 Security exempt from registration under Rule 144A of the Securities Act of 1933. These securities may be resold in transactions exempt from
registration to qualified institutional investors. At October 31, 2017, the value of these securities amounted to $15,141,793 or 55.6% of net assets. 3 Variable rate security. Rate disclosed as of October 31, 2017. 4 Non-income producing security. 5 Step bond; the interest rate shown is the rate in effect as of October 31, 2017. PIK A payment-in-kind security in which the issuer may make interest or dividend payments in cash or additional securities. These additional securities
generally have the same terms as the original holdings. PLC Public Limited Company € Euro £ British Pound
Oaktree Funds 12
The accompanying notes are an integral part of these financial statements.
Schedule of Investments

OAKTREE HIGH YIELD BOND FUNDForward Currency Contracts October 31, 2017
Unrealized Settlement Currency Currency AppreciationCounterparty Date Sold Purchased (Depreciation)
Bank of New York Mellon 11/6/17 € 4,867,751 $5,737,667 $65,714
Bank of New York Mellon 11/6/17 £ 664,687 $ 882,598 $ (353)
$65,361
€ Euro £ British Pound
Country Breakdown % of Net Assets
United States 71.3%
United Kingdom 4.6%
Italy 3.8%
Luxembourg 3.1%
Canada 2.6%
Germany 2.1%
Spain 1.5%
France 1.5%
Netherlands 1.4%
Ireland 1.1%
Switzerland 1.0%
Sweden 0.4%
Australia 0.2%
Other Assets in Excess of Liabilities 5.4%
100.0%
Oaktree Funds 13
The accompanying notes are an integral part of these financial statements.
Schedule of Investments

Statement of Assets and Liabilities October 31, 2017
Oaktree High Yield Bond Fund
Assets Investments, at fair value1 $25,781,662 Cash 1,089,156 Interest receivable 355,141 Receivable for securities sold 350,903 Foreign currency, at fair value2 189,324 Receivable for fees waived 72,573 Unrealized appreciation on forward currency contracts 65,714 Prepaid expenses 16,611
Total assets $27,921,084
Liabilities Payable for securities purchased $ 357,849 Accrued professional expenses 158,125 Accrued trustees expenses 56,785 Accrued custodian expenses 43,750 Accrued fund administration and accounting expenses 33,463 Accrued transfer agent expenses 9,978 Accrued other expenses 5,396 Accrued shareholder reporting expenses 3,959 Accrued distribution expenses 1,492 Unrealized depreciation on forward currency contracts 353
Total liabilities 671,150
Net Assets $27,249,934
Components of Net AssetsPaid-in capital $26,501,831Undistributed (accumulated) net investment income (loss) 22,882Accumulated net realized gain (loss) (66,975)Net unrealized appreciation (depreciation) 792,196
Net Assets $27,249,934
1 Investments, at cost $25,053,6092 Foreign currency, at cost 192,107
Computation of Net Asset ValueInstitutional Class Net assets $25,918,615 Shares issued and outstanding (unlimited shares authorized, no par value) 2,507,730
Net asset value per share $ 10.34
Advisor Class Net assets $ 1,331,319 Shares issued and outstanding (unlimited shares authorized, no par value) 128,848
Net asset value per share $ 10.33
Oaktree Funds 14
The accompanying notes are an integral part of these financial statements.
Financial Statements

Statement of Operations Year Ended October 31, 2017
Oaktree High Yield Bond Fund
Investment Income Interest $1,496,002
Total investment income $1,496,002
Expenses Professional expenses $ 299,691 Trustees expenses 203,493 Investment advisory expenses 159,391 Fund administration and accounting expenses 124,741 Custodian expenses 82,436 Insurance expenses 66,267 Other expenses 46,003 Registration expenses 39,381 Transfer agent expenses 37,266 Shareholder reporting expenses 4,310 Distribution expenses 2,900
Total expenses 1,065,879 Less fees waived/expenses reimbursed (810,610)
Total expenses after fees waived/expenses reimbursed 255,269
Net Investment Income (Loss) $1,240,733
Realized and Unrealized Gain (Loss)Net Realized Gain (Loss) from: Investments and foreign currency transactions $ 267,773 Forward currency contracts (239,007)
28,766
Net Change in Unrealized Appreciation (Depreciation) on: Investments and foreign currency transactions 689,585 Forward currency contracts (64,442)
625,143
Net Realized and Unrealized Gain (Loss) 653,909
Net Increase (Decrease) in Net Assets Resulting from Operations $1,894,642
Oaktree Funds 15
The accompanying notes are an integral part of these financial statements.
Financial Statements

Statements of Changes in Net Assets
Oaktree High Yield Bond Fund _________________________________________ Year Ended Year Ended October 31, 2017 October 31, 2016
OperationsNet investment income (loss) $ 1,240,733 $ 1,234,538Net realized gain (loss) 28,766 (237,814)Net change in unrealized appreciation (depreciation) 625,143 944,854
Net increase (decrease) in net assets resulting from operations 1,894,642 1,941,578
Distributions to ShareholdersFrom net investment income Institutional Class (1,053,992) (1,490,374) Advisor Class (44,863) (63,890)From net realized gain Institutional Class — (55,926) Advisor Class — (2,478)
Decrease in net assets resulting from distributions to shareholders (1,098,855) (1,612,668)
Capital Share Transactions Institutional Class 205,448 1,000,000 Advisor Class 170,743 (36,909)
Net increase (decrease) in net assets resulting from capital share transactions 376,191 963,091
Net AssetsTotal increase (decrease) in net assets 1,171,978 1,292,001Beginning of year 26,077,956 24,785,955
End of year $27,249,934 $26,077,956
Undistributed (accumulated) net investment income (loss) $ 22,882 $ 135,624
Transactions in capital shares were as follows:
Institutional Class Shares Shares sold 19,808 102,459
Shares issued in reinvestment of distributions 541 —
Shares redeemed — —
Net increase (decrease) 20,349 102,459Advisor Class Shares sold 16,224 11,616 Shares issued in reinvestment of distributions 402 489 Shares redeemed (2) (15,581)
Net increase (decrease) 16,624 (3,476)
Total net increase (decrease) 36,973 98,983
Institutional Class Amount Shares sold $ 200,000 $ 1,000,000
Shares issued in reinvestment of distributions 5,448 —
Shares redeemed — —
Net increase (decrease) 205,448 1,000,000Advisor Class Shares sold 166,720 111,958 Shares issued in reinvestment of distributions 4,038 4,685 Shares redeemed (15) (153,552)
Net increase (decrease) 170,743 (36,909)
Total net increase (decrease) $ 376,191 $ 963,091
Oaktree Funds 16
The accompanying notes are an integral part of these financial statements.
Financial Statements

Financial Highlights
Oaktree High Yield Bond Fund _________________________________ Year Ended Year Ended Period Ended October 31, 2017 October 31, 2016 October 31, 2015 _________________________________ Institutional Institutional Institutional
Per Share Operating Performance Net asset value, beginning of period $10.03 $ 9.91 $10.001
Net investment income (loss)2 0.48 0.48 0.42 Net realized and unrealized gain (loss) 0.25 0.27 (0.13)
Net increase (decrease) from investment operations 0.73 0.75 0.29 Distributions from net investment income (0.42) (0.61) (0.38) Distributions from net realized gain — (0.02) —
Total distributions (0.42) (0.63) (0.38)
Net asset value, end of period $10.34 $10.03 $ 9.91
Total Return Total investment return based on net asset value 7.48% 8.15% 2.85%3
Ratios to Average Net Assets Expenses, after fees waived/expenses reimbursed 0.95% 0.95% 0.95%4
Expenses, before fees waived/expenses reimbursed 3.97% 3.97% 3.89%4
Net investment income (loss) 4.69% 5.04% 4.73%4
Supplemental Data Net assets, end of period (000's) $25,919 $24,952 $23,639 Portfolio turnover rate 47% 51% 46%3
1 Commencement of operations on December 16, 2014.2 Based on average shares outstanding.3 Not annualized.4 Annualized.
Oaktree Funds 17
The accompanying notes are an integral part of these financial statements.
Financial Statements

Financial Highlights
Oaktree High Yield Bond Fund _________________________________ Year Ended Year Ended Period Ended October 31, 2017 October 31, 2016 October 31, 2015 _________________________________ Advisor Advisor Advisor
Per Share Operating Performance Net asset value, beginning of period $10.03 $ 9.91 $10.001
Net investment income (loss)2 0.45 0.46 0.40 Net realized and unrealized gain (loss) 0.25 0.27 (0.13)
Net increase (decrease) from investment operations 0.70 0.73 0.27 Distributions from net investment income (0.40) (0.59) (0.36) Distributions from net realized gain — (0.02) —
Total distributions (0.40) (0.61) (0.36)
Net asset value, end of period $10.33 $10.03 $ 9.91
Total Return Total investment return based on net asset value 7.13% 7.89% 2.65%3
Ratios to Average Net Assets Expenses, after fees waived/expenses reimbursed 1.20% 1.20% 1.20%4
Expenses, before fees waived/expenses reimbursed 4.22% 4.23% 4.14%4
Net investment income (loss) 4.44% 4.79% 4.48%4
Supplemental Data Net assets, end of period (000's) $1,331 $1,126 $1,147 Portfolio turnover rate 47% 51% 46%3
1 Commencement of operations on December 16, 2014.2 Based on average shares outstanding.3 Not annualized.4 Annualized.
Oaktree Funds 18
The accompanying notes are an integral part of these financial statements.
Financial Statements

1. Organization
The Oaktree High Yield Bond Fund (“High Yield Fund”) or (the “Fund”) is a series of shares of beneficial interestof Oaktree Funds (the “Trust”), which is registered under the Investment Company Act of 1940 as an open-endedmanagement investment company.
The Fund’s commencement of operations date and investment objective is as follows:
Fund Commencement of Operations Investment Objective
High Yield Fund December 16, 2014 Provide current income and capital appreciation.
The Fund is an investment company and accordingly follows the investment company accounting and reportingguidance of the Financial Accounting Standards Board (“FASB”) Accounting Standards Codification Topic 946“Financial Services — Investment Companies.”
2. Summary of Significant Accounting Policies
The financial statements have been prepared in conformity with accounting principles generally accepted in theUnited States of America (“GAAP”). The following is a summary of significant accounting policies consistentlyfollowed by the Fund in the preparation of its financial statements.
Use of Estimates
The preparation of the financial statements in accordance with GAAP requires management to make estimatesand assumptions that affect the reported amounts of assets and liabilities at the date of the financial statements, aswell as the reported amounts of income and expenses during the year then ended. Actual results could differ fromthese estimates.
Security Valuation
GAAP establishes a hierarchal disclosure framework that prioritizes the inputs used in measuring financialinstruments at fair value into three levels based on their market observability. Market price observability is affectedby a number of factors, such as the type of instrument and the characteristics specific to the instrument. Financialinstruments with readily available quoted prices from an active market or for which fair value can be measuredbased on actively quoted prices generally will have a higher degree of market price observability and a lesser degreeof judgment inherent in measuring fair value. These inputs are summarized in the three broad levels listed below:
• Level 1: Quoted unadjusted prices for identical instruments in active markets to which the Fund has access atthe date of measurement.
• Level 2: Quoted prices for similar instruments in active markets, quoted prices for identical or similarinstruments in markets that are not active, and model derived valuations in which all significant inputs aredirectly or indirectly observable.
• Level 3: Valuations for which one or more significant inputs are unobservable. These inputs reflect the Fund’sassessment of the assumptions that market participants use to value the investment based on the best availableinformation.
Inputs that are used in determining fair value of an investment may include price information, credit data, volatilitystatistics, and other factors. These inputs can be either observable or unobservable. The availability of observableinputs can vary between investments, and is affected by various factors such as the type of investment, and thevolume and level of activity for that investment or similar investments in the marketplace. The inputs will beconsidered by the pricing committee, along with any other relevant factors in the calculation of an investment’s fairvalue. The Fund uses prices and inputs that are current at the measurement date, which may include periods of market
Oaktree Funds 19
Notes to the Financial StatementsOctober 31, 2017

dislocations. During these periods, the availability of prices and inputs may be reduced for many investments. Thiscondition could cause an investment to be reclassified between the various levels within the hierarchy.
The Fund accounts for the transfer of assets into or out of each fair-value hierarchy level at the beginning of thereporting period. There were no transfers between levels during the year.
All equity securities traded on a national securities exchange, except those listed on the NASDAQ GlobalMarket®, NASDAQ Global Select Market®, and the NASDAQ Capital Market® exchanges (collectively,“NASDAQ”), are valued at the last reported sale price on the exchange on which the security is principally traded.Securities traded on NASDAQ will be valued at the NASDAQ Official Closing Price (“NOCP”). If, on a particularday, an exchange-traded or NASDAQ security does not trade, then the security will be valued at the mean betweenthe most recent quoted bid and asked prices.
Foreign debt securities are priced in their local currencies at the close of their primary exchange or market, or at thevaluation time, whichever is earlier. Foreign securities, currencies, and other assets denominated in foreigncurrencies are then translated into U.S. dollars at the exchange rate on the valuation date of such currencies againstthe U.S. dollar, as provided by a pricing service. All assets denominated in foreign currencies will be converted intoU.S. dollars using the applicable currency exchange rates at the close of the New York Stock Exchange.
Debt securities are valued in accordance with prices supplied by an approved pricing service. Pricing services mayuse various valuation methodologies, including but not limited to: a) the mean between the bid and asked prices;b) matrix pricing; c) other analytical pricing models; and d) market transactions and dealer quotations.
Restricted securities include securities that have not been registered under the Securities Act of 1933, as amended,and securities that are subject to restrictions on resale. The Fund may invest in restricted securities that areconsistent with the Fund’s investment objective and investment strategies. In some cases, the issuer of restrictedsecurities has agreed to register such securities for resale, at the issuer’s expense either upon demand by the Fundor in connection with another registered offering of the securities.
Forward currency contracts are valued at the mean between the bid and asked prices. Quotations are availablefrom a pricing service for regularly scheduled settlement dates.
The Board of Trustees (the “Board”) has delegated certain functions to the pricing committee with respect to thevaluation of the Fund’s holdings. The pricing committee is comprised of employees of Oaktree CapitalManagement, L.P. (“Oaktree” or the “Adviser”). The Board has directed the pricing committee to monitor pricingand valuation matters. The pricing committee determines the fair value of holdings for which price quotations arenot readily available or are deemed unreliable, or for which an approved valuation method is inappropriate. AtOctober 31, 2017, the Fund did not hold any securities fair valued by the Board.
The following is a summary of the fair valuations according to the inputs used to value the Fund’s investments atOctober 31, 2017:
High Yield Fund Level 1 Level 2 Level 3 Total
AssetsCorporate Bonds $ — $25,012,512 $ — $25,012,512Real Estate Investment Trusts (REITs) — 661,939 — 661,939Bank Loans — 79,032 — 79,032Common Stock 28,179 — — 28,179
Total1 $ 28,179 $25,753,483 $ — $25,781,662
Forward Currency Contracts $ — $ 65,714 $ — $ 65,714
Total Assets $ — $ 65,714 $ — $ 65,714
LiabilitiesForward Currency Contracts $ — $ 353 $ — $ 353
Total Liabilities $ — $ 353 $ — $ 353
1 See the Schedule of Investments for further disaggregation of investment categories.
Oaktree Funds 20
Notes to the Financial StatementsOctober 31, 2017

Foreign Currency
Values of investments denominated in foreign currencies are converted into U.S. dollars using a spot market rateof exchange on the day of valuation. Purchases and sales of investments and dividend and interest income aretranslated to U.S. dollars using a spot market rate of exchange prevailing on the respective dates of suchtransactions. The portion of security gains or losses resulting from changes in foreign exchange rates is includedwith net realized and unrealized gain or loss from investments and foreign currency transactions, as appropriate,for both financial reporting and tax purposes.
Investment Transactions
Investment transactions are recorded on the trade date. Interest income, including amortization and accretion ofpremiums and discounts on debt securities, is recognized on the accrual basis. Income, expenses, and realized andunrealized gains and losses are allocated daily to each class based on its relative net assets. Realized gains andlosses are reported on an identified cost basis.
Allocation of Expenses
Expenses directly related to a Fund or its classes are charged to that Fund or the applicable class. Expenses areallocated daily to each class based on its relative net assets or other appropriate methods.
Distributions to Shareholders
Distributions paid by the Fund are recorded on the ex-dividend date. The character and timing of distributions isdetermined in accordance with federal income tax regulations, which may differ from GAAP. In addition, on anannual basis, the Fund may distribute additional capital gains in the latest calendar quarter, if necessary, to meetminimum distribution requirements and thus avoid being subject to excise taxes.
Indemnifications
Under the Fund’s organizational documents, officers and trustees are indemnified against certain liabilities arisingout of the performance of their duties to the Fund. In addition, in the normal course of business, the Fund mayenter into contracts that provide general indemnification to other parties. The Fund’s maximum exposure underthese arrangements is unknown as this would involve future claims that may be made against the Fund that havenot yet occurred, and may not occur. However, the Fund has not had prior claims or losses pursuant to thesecontracts and expects the risk of loss to be remote.
3. Derivative Financial Instruments
Forward Currency Contracts
The Fund entered into forward currency contracts as an economic hedge against either specific transactions orportfolio instruments or to obtain exposure to, or hedge exposure away from, foreign currencies. A forwardcurrency contract is an agreement between two parties to buy and sell a currency at a set exchange rate on a futuredate. Forward currency contracts, when used by the Fund, help manage the overall exposure to the currencies, inwhich the Fund has an unrealized gain or loss. When the contract is closed, the Fund records a realized gain orloss equal to the difference between the value at the time it was opened and the value at the time it was closed.The use of forward currency contracts involves the risk that the value of a forward currency contract changesunfavorably due to movements in the value of the referenced foreign currencies.
Oaktree Funds 21
Notes to the Financial StatementsOctober 31, 2017

For the year ended October 31, 2017, the average monthly notional balances of outstanding derivative financialinstruments were as follows:
Average Notional Balance High Yield Fund
Forward Currency Contracts $6,196,998
The effect of derivative instruments on the statement of assets and liabilities at October 31, 2017, was as follows:
High Yield Fund________________________________________________ Unrealized appreciation on Unrealized depreciation on forward currency contracts forward currency contracts
Forward Currency Contracts $65,714 $(353)
The effect of derivative financial instruments on the statement of operations for the year ended October 31, 2017,was as follows:
High Yield Fund________________________________________________ Net Realized Net Change in Unrealized Gain (Loss) Appreciation (Depreciation)
Forward Currency Contracts $(239,007) $(64,442)
In connection with derivative activities, the Fund generally enters into agreements subject to enforceable masternetting arrangements that allow the Fund to offset derivative assets and liabilities in the same currency by specificderivative type or, in the event of default by the counterparty, to offset derivative assets and liabilities with thesame counterparty. While these derivative instruments are eligible to be offset in accordance with applicableaccounting guidance, the Fund has elected to present derivative assets and liabilities based on gross fair value inthe statement of assets and liabilities.
At October 31, 2017, the Fund held the following derivative instruments that were subject to offsetting on thestatement of assets and liabilities:
High Yield BondAssets:
Gross Amounts Not Offset in the Statement of Assets and Liabilities _____________________ Gross Amounts Net Amounts Gross Offset in the Presented in the Amounts of Statement of Statement of Recognized Assets and Assets and Financial Cash Collateral Description Assets Liabilities Liabilities Instruments Received Net Amount
Forward Currency Contracts $65,714 $ — $65,714 $(353) $ — $65,361
Liabilities:
Gross Amounts Not Offset in the Statement of Assets and Liabilities _____________________ Gross Amounts Net Amounts Gross Offset in the Presented in the Amounts of Statement of Statement of Recognized Assets and Assets and Financial Cash Collateral Description Liabilities Liabilities Liabilities Instruments Pledged Net Amount
Forward Currency Contracts $353 $ — $353 $(353) $ — $ —
Oaktree Funds 22
Notes to the Financial StatementsOctober 31, 2017

4. Investment Advisory Fees, Fee Waivers and Distribution Fees
The Adviser serves as investment adviser to the Fund pursuant to an investment management agreement (the“Investment Management Agreement”) with the Trust, on behalf of the Fund. As the Fund’s investment adviser,Oaktree provides certain management and investment advisory services for the Fund, including managing theinvestment of the Fund’s assets on a discretionary basis. Under the Investment Management Agreement, the Fundpays the Adviser a monthly fee at an annual rate of the Fund’s average daily net assets (the “Management Fee”) asshown in the chart below.
The Adviser has contractually agreed to limit the Fund’s ordinary operating expenses so that its ratio of suchexpenses to average net assets will not exceed the following ratios (the “Expense Caps”). For the purposes of theexpense limitation agreement between the Adviser and the Fund, “ordinary operating expenses” excludes acquiredfund fees and expenses, interest, taxes, organizational expenses, brokerage commissions, other investment-relatedcosts, and non-routine or extraordinary expenses. The Fund’s expense limitation is expected to apply until at leastFebruary 2018.
Annual Expense Cap __________________________Fund Annual Management Fee Institutional Advisor
High Yield Fund 0.60% 0.95% 1.20%
Any fee waivers made by Oaktree with respect to the Fund are subject to recoupment from the Fund within threeyears after the date of which such fees were waived or expenses reimbursed, provided that such recoupment doesnot cause any class of the Fund to exceed the applicable contractual expense limitation that was in effect at thetime the fees were waived or expenses reimbursed and is not to exceed the Fund’s current Expense Caps. AtOctober 31, 2017, the Adviser is eligible to recoup the following fees:
Fund Recoupment Amount Expiring October 31, 2020 2019 2018
High Yield Fund $810,610 $740,636 $652,244
The Adviser has not recouped any amount for the year ending October 31, 2017 and does not have any amountoutstanding to recoup at October 31, 2017.
Advisor Class shares of the Fund make payments under a distribution plan (the “Distribution Plan”) adoptedpursuant to Rule 12b-1 under the 1940 Act. Pursuant to the Distribution Plan, the Fund compensates the Fund’sdistributor for distribution and related services at an annual rate equal to 0.25% of the average daily net assets ofthe Fund attributable to its Advisor Class shares. The fees may be used to pay the Fund’s distributor fordistribution services and sales support services provided in connection with Advisor Class shares and are disclosedin the statement of operations. No distribution or servicing fees are paid by the Institutional Class shares.
5. Purchases And Sales
For the year ended October 31, 2017, purchases and sales of investments, excluding short-term securities, were asfollows:
Fund Purchases Sales
High Yield Fund $12,299,058 $11,932,952
6. Income Tax Information
The Fund intends to qualify as a “regulated investment company” under Subchapter M of the Internal RevenueCode of 1986, as amended, and to distribute substantially all of its taxable income to its shareholders. Therefore,no federal income tax provision is required.
Oaktree Funds 23
Notes to the Financial StatementsOctober 31, 2017
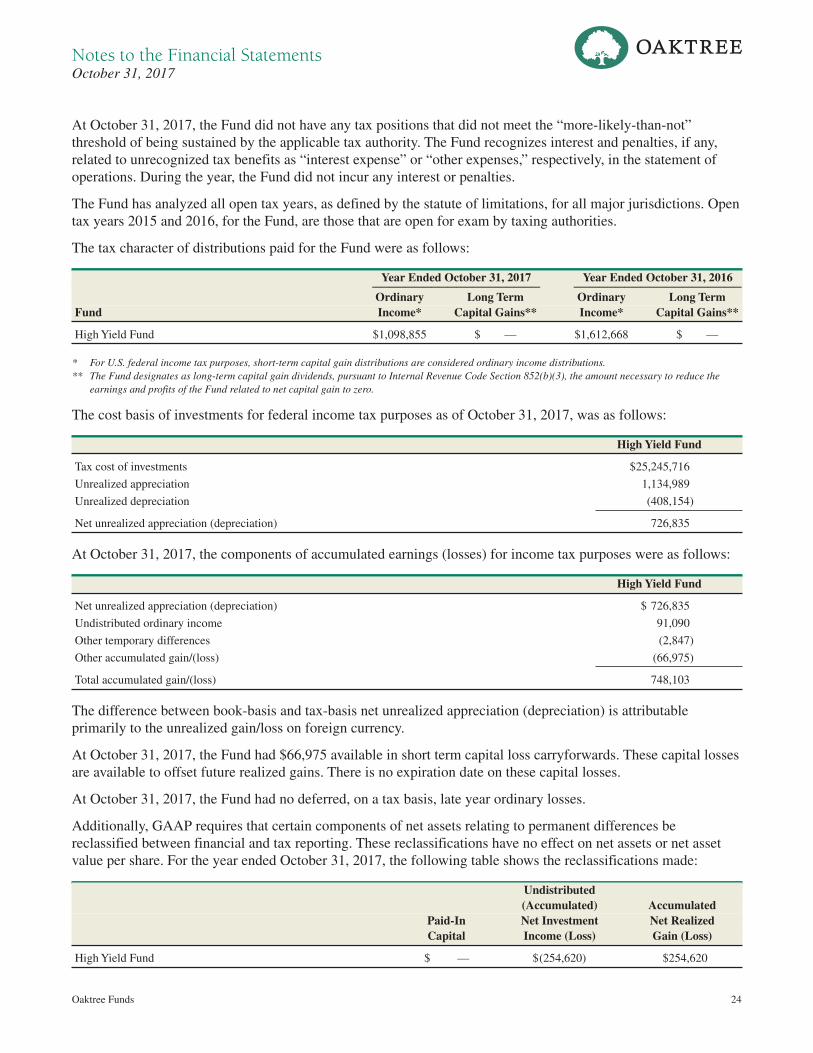
At October 31, 2017, the Fund did not have any tax positions that did not meet the “more-likely-than-not”threshold of being sustained by the applicable tax authority. The Fund recognizes interest and penalties, if any,related to unrecognized tax benefits as “interest expense” or “other expenses,” respectively, in the statement ofoperations. During the year, the Fund did not incur any interest or penalties.
The Fund has analyzed all open tax years, as defined by the statute of limitations, for all major jurisdictions. Opentax years 2015 and 2016, for the Fund, are those that are open for exam by taxing authorities.
The tax character of distributions paid for the Fund were as follows:
Year Ended October 31, 2017 Year Ended October 31, 2016 ____________________ ____________________ Ordinary Long Term Ordinary Long Term Fund Income* Capital Gains** Income* Capital Gains**
High Yield Fund $1,098,855 $ — $1,612,668 $ —
* For U.S. federal income tax purposes, short-term capital gain distributions are considered ordinary income distributions.** The Fund designates as long-term capital gain dividends, pursuant to Internal Revenue Code Section 852(b)(3), the amount necessary to reduce the
earnings and profits of the Fund related to net capital gain to zero.
The cost basis of investments for federal income tax purposes as of October 31, 2017, was as follows:
High Yield Fund
Tax cost of investments $25,245,716
Unrealized appreciation 1,134,989
Unrealized depreciation (408,154)
Net unrealized appreciation (depreciation) 726,835
At October 31, 2017, the components of accumulated earnings (losses) for income tax purposes were as follows:
High Yield Fund
Net unrealized appreciation (depreciation) $ 726,835
Undistributed ordinary income 91,090
Other temporary differences (2,847)
Other accumulated gain/(loss) (66,975)
Total accumulated gain/(loss) 748,103
The difference between book-basis and tax-basis net unrealized appreciation (depreciation) is attributableprimarily to the unrealized gain/loss on foreign currency.
At October 31, 2017, the Fund had $66,975 available in short term capital loss carryforwards. These capital lossesare available to offset future realized gains. There is no expiration date on these capital losses.
At October 31, 2017, the Fund had no deferred, on a tax basis, late year ordinary losses.
Additionally, GAAP requires that certain components of net assets relating to permanent differences bereclassified between financial and tax reporting. These reclassifications have no effect on net assets or net assetvalue per share. For the year ended October 31, 2017, the following table shows the reclassifications made:
Undistributed (Accumulated) Accumulated Paid-In Net Investment Net Realized Capital Income (Loss) Gain (Loss)
High Yield Fund $ — $(254,620) $254,620
Oaktree Funds 24
Notes to the Financial StatementsOctober 31, 2017

7. Principal Risks
Credit Risk. Debt obligations, such as bonds and bank loans, and derivatives involving a counterparty, are subjectto credit risk. This is the risk that the issuer or guarantor of a debt security or the counterparty to a derivativescontract will be unable or unwilling to make timely principal, interest or settlement payments, or otherwise honorits obligations. A debt obligation may decline in price if market participants become concerned regarding thecreditworthiness or credit rating of the issuer, regardless of whether the issuer has defaulted.
Derivatives Risk. Derivatives are financial contracts whose value depends on, or is derived from, the value of anunderlying asset, reference rate or index. The Fund typically uses derivatives as part of a strategy designed toreduce exposure to other risks, such as currency risk. The Fund’s use of derivative instruments involves risksdifferent from, or possibly greater than, the risks associated with investing directly in securities and othertraditional investments. Derivatives are subject to a number of risks described elsewhere in the prospectus, such asliquidity risk, market risk and credit risk. Also, suitable derivative transactions may not be available in allcircumstances and there can be no assurance that the Fund will engage in these transactions to reduce exposure toother risks when that would be beneficial. The following is a list of certain derivatives in which the Fund intendsto invest and the principal risks associated with each of them:
Forward Foreign Currency Exchange Contracts – Forward foreign currency exchange transactions are over-the counter contracts to purchase or sell a specified amount of a specified currency or multinational currencyunit at a price and future date set at the time of the contract. Forward foreign currency exchange contracts donot eliminate fluctuations in the value of non-U.S. dollar denominated securities but rather allow the Fund toestablish a fixed rate of exchange for a future point in time. This strategy can have the effect of reducingreturns and minimizing opportunities for gain. Forward contracts are not regulated by the Commodity FuturesTrading Commission (the “CFTC”) and therefore, the Fund will not receive any benefit of CFTC regulationwhen trading forwards.
Foreign Currency Risk.A significant portion of the Fund’s investments may be denominated in currencies otherthan the U.S. dollar. Changes in the rates of exchange between the U.S. dollar and other currencies will have aneffect, which could be adverse, on the performance of the Fund.
High Yield Bond Risk. High yield bonds are subject to greater risk of loss of principal and interest than higher-rated securities and are generally considered to be predominantly speculative with respect to the issuer’s capacity topay interest and repay principal. They are also generally considered to be subject to greater risk than securities withhigher ratings in the case of deterioration of general economic conditions. Because investors generally perceive thatthere are greater risks associated with high yield bonds, the yields and prices of such securities may be more volatilethan those for higher-rated securities. The market for high yield bonds is thinner, often less liquid, and less activethan that for higher-rated securities, which can adversely affect the prices at which these securities can be sold andmay make it difficult to sell such securities. The value of high yield bonds tends to be very volatile due to suchfactors as specific corporate developments, interest rate sensitivity, less secondary market activity, and negativeperceptions of high yield bonds and the junk bond markets generally, particularly in times of market stress.
Interest Rate Risk. The value of fixed income securities may decline because of increases in interest rates. Thevalue of a fixed income security with greater duration will be more sensitive to changes in interest rates than asimilar security with less duration. Recently, interest rates in the United States have been at or near historic lows,which may increase the Fund’s exposure to risks associated with rising interest rates. Rising interest rates couldhave unpredictable effects on the markets and may expose fixed income and related markets to heightenedvolatility. For fixed income securities, an increase in interest rates may lead to increased redemptions andincreased portfolio turnover, which could reduce liquidity for certain Fund investments, adversely affect values,and increase the Fund’s costs. If dealer capacity in fixed income markets is insufficient for market conditions, itmay further inhibit liquidity and increase volatility in the fixed income markets.
Oaktree Funds 25
Notes to the Financial StatementsOctober 31, 2017
8. Recent Accounting Pronouncements
In October 2016, the U.S. Securities and Exchange Commission adopted new rules and amended existing rules(together, “final rules”) intended to modernize the reporting and disclosure of information by registeredinvestment companies. In part, the final rules amend Regulation S-X and require standardized, enhanceddisclosure about derivatives in investment company financial statements, as well as other amendments. Theupdates to Regulation S-X were effective August 1, 2017 and would result in additional disclosure relating to thepresentation of derivatives and certain other financial instruments, if held. These updates have been incorporatedin the Fund’s financial statements and have no impact on the Fund’s net assets or results of operations.
9. Subsequent Events
Management has evaluated the impact of all subsequent events on the Fund through the date the financialstatements were issued and has determined that there were no subsequent events requiring adjusting or additionaldisclosure in the financial statements.
Oaktree Funds 26
Notes to the Financial StatementsOctober 31, 2017

The Board of Trustees and Shareholders of Oaktree Funds
We have audited the accompanying statement of assets and liabilities, including the schedule of investments, ofOaktree High Yield Bond Fund (the one series comprising Oaktree Funds) (the Fund) as of October 31, 2017, andthe related statements of operations for the year then ended, the statements of changes in net assets for each of thetwo years in the period then ended and the financial highlights for each of the periods indicated therein. Thesefinancial statements and financial highlights are the responsibility of the Fund’s management. Our responsibilityis to express an opinion on these financial statements and financial highlights based on our audits.
We conducted our audits in accordance with the standards of the Public Company Accounting Oversight Board(United States). Those standards require that we plan and perform the audit to obtain reasonable assurance aboutwhether the financial statements and financial highlights are free of material misstatement. We were not engaged toperform an audit of the Fund’s internal control over financial reporting. Our audit included consideration of internalcontrol over financial reporting as a basis for designing audit procedures that are appropriate in the circumstances,but not for the purpose of expressing an opinion on the effectiveness of the Fund’s internal control over financialreporting. Accordingly, we express no such opinion. An audit also includes examining, on a test basis, evidencesupporting the amounts and disclosures in the financial statements and financial highlights, assessing the accountingprinciples used and significant estimates made by management, and evaluating the overall financial statementpresentation. Our procedures included confirmation of securities owned as of October 31, 2017, by correspondencewith the custodian, agent banks and brokers or by other appropriate auditing procedures where replies from agentbanks and brokers were not received. We believe that our audits provide a reasonable basis for our opinion.
In our opinion, the financial statements and financial highlights referred to above present fairly, in all materialrespects, the financial position of Oaktree High Yield Bond Fund (the one series comprising Oaktree Funds) atOctober 31, 2017, the results of its operations for the year then ended, the changes in its net assets for each of thetwo years in the period then ended and the financial highlights for each of the periods indicated therein inconformity with U.S. generally accepted accounting principles.
Minneapolis, MinnesotaDecember 20, 2017
Oaktree Funds 27
Report of Independent Registered Public Accounting Firm

As a shareholder of a fund, you incur two types of costs: (1) transaction costs; and (2) ongoing costs, includinginvestment advisory expenses; distribution and/or service fees; and other fund expenses. This example is intendedto help you understand your ongoing costs (in dollars) of investing in a fund and to compare these costs with theongoing costs of investing in other mutual funds. The example is based on a hypothetical investment of $1,000invested on May 1, 2017 and held through October 31, 2017.
The expense examples provide information about actual account values based on actual returns and expenses. Youmay use the information, together with the amount you invested, to estimate the expenses that you paid over theperiod. Simply divide your account value by $1,000 (e.g., an $8,600 account value dividend by $1,000 = 8.6), andthen multiply the result by the number under the heading entitled “Expenses paid during period” to estimate theexpenses you paid on your account during this period.
The expense examples also provide information about hypothetical account values and hypothetical expensesbased on the Fund’s actual expense ratio and an assumed rate of return of 5% per year before expenses, which isnot the Fund’s actual return. The hypothetical account values and expenses may not be used to estimate the actualending account balance or expenses you paid for the period. You may use this information to compare the ongoingcosts of investing in the Fund and other funds. To do so, compare this 5% hypothetical example with the 5%hypothetical examples that appear in the shareholder reports of the other funds.
Please note that the expenses shown in the table are meant to highlight your ongoing costs only and do not reflectany transactional expenses, if any. Therefore, the hypothetical information in the table is useful in comparingongoing costs only, and will not help you determine the relative total costs of owning different funds. In addition,if these transactional costs were included, your costs would have been higher.
Actual Hypothetical (5% return before expenses) ________________________ ________________________ Annualized Beginning Ending Expenses Beginning Ending Expenses Expense Account Account Value Paid During Account Account Value Paid During Ratio Value October 31, 2017 Period1 Value October 31, 2017 Period1
Oaktree High Yield Bond Fund
Institutional Class 0.95% $1,000 $1,032 $4.86 $1,000 $1,020 $4.84
Advisor Class 1.20% $1,000 $1,029 $6.14 $1,000 $1,019 $6.11
1 Expenses Paid During Period are equal to the net annualized expense ratio for the class, multiplied by the average account value over the period,multiplied by 184/365 (to reflect the one-half year period). Expenses reflect amounts net of fees waived by the Adviser.
Oaktree Funds 28
Expense Example (Unaudited)October 31, 2017

Number of Portfolios Principal in Fund OtherName, Position Term of Office Occupation Complex4 DirectorshipsYear of Birth with the and Length of During Past Overseen Held Duringand Address2 Trust Time Served3 Five Years by Trustees Past Five Years
Independent Trustees of the Trust1
Robin A. Ferracone Trustee Since 2014 Chief Executive Officer, Farient 1 American Realty(1953) Advisors LLC (executive Capital Daily Net compensation consulting) Asset Value Trust (since 2012); American Real Estate Income Fund (since 2013)
R. Gregory Morgan Trustee Since 2014 Senior Vice President and 1 None(1954) Secretary, Massachusetts Institute of Technology; Vice President and General Counsel, Massachusetts Institute of Technology.
Randolph W. Trustee Since 2014 Professor of Finance, 1 Health Westerfield The University of Management (1941) Southern California Associates (2000-2013)
Interested Trustee of the Trust
John Frank5 Chairman of Since 2014 Vice Chairman, Oaktree 1 Oaktree Capital (1956) the Board Capital Management, L.P. Group, LLC
Officers of the Trust
John Sweeney President Since 2014 Managing Director, Oaktree N/A N/A(1972) Capital Management, L.P.
Kimberly Larin Chief Since 2016 Managing Director, Oaktree N/A N/A(1968) Compliance Capital Management, L.P. Officer Prior to joining Oaktree in 2002, Ms. Larin spent six years at Western Asset Management Company as a Compliance Officer.
Martin Boskovich Secretary Since 2014 Managing Director, Oaktree N/A N/A(1971) Capital Management, L.P.
Mary Gallegly Assistant Since 2016 Vice President, Legal, Oaktree N/A N/A(1980) Secretary Capital Management, L.P. Prior to joining Oaktree in 2014, Ms. Gallegly spent almost seven years at O’Melveny & Myers LLP as a corporate finance attorney.
Oaktree Funds 29
Additional Information (Unaudited)October 31, 2017

Number of Portfolios Principal in Fund OtherName, Position Term of Office Occupation Complex4 DirectorshipsYear of Birth with the and Length of During Past Overseen Held Duringand Address2 Trust Time Served3 Five Years by Trustees Past Five Years
Susan Gentile Chief Since 2014 Chief Accounting Officer, Oaktree N/A N/A(1967) Financial Capital Management, L.P. Officer Chief Accounting Officer, Clorox, Inc. (manufacturer and marketer of bleach and other consumer packaged goods).
John Edwards Treasurer Since 2014 Managing Director, Oaktree N/A N/A(1965) Capital Management, L.P.
1 The Trustees of the Trust who are not “interested persons” of the Trust as defined under the 1940 Act (“Independent Trustees”).2 Unless otherwise noted, the address for each of the Fund’s Trustees is c/o Oaktree Capital Management, L.P., 333 South Grand Ave., 28th Floor, Los
Angeles, CA 90071.3 Each Trustee and Officer serves until his or her respective successor has been duly elected and qualified.4 The Trust is comprised of one series, the Oaktree High Yield Bond Fund.5 Mr. Frank is deemed an “interested person” of the Trust due to his position of Vice Chairman with Oaktree Capital Management, L.P.
The Statement of Additional Information (“SAI”) includes additional information about the Fund’s Trustees and isavailable without charge, upon request, by calling 1-855-OAK-FUND. Furthermore, you can obtain the SAI byaccessing the Securities and Exchange Commission’s (the “SEC”) website at http://www.sec.gov or by accessingthe Fund’s website at http://www.oaktreefunds-us.com.
Oaktree Funds 30
Additional Information (Unaudited)October 31, 2017

Information About Proxy Voting
Information about how the Fund voted proxies relating to portfolio securities held during the most recent twelvemonth period ended June 30th is available no later than the following August 31st without charge, upon request,by calling 855-OAK-FUND and on the SEC website at http://www.sec.gov.
A description of the Fund’s proxy voting policies and procedures is available (i) without charge, upon request, bycalling 855-OAK-FUND and (ii) on the SEC website at http://www.sec.gov.
Information About Portfolio Holdings
The Fund intends to disclose its portfolio holdings on a quarterly basis by posting the Annual, Semi-Annual andForm N-Q regulatory filings on the SEC website at http://www.sec.gov. The Fund files its complete schedule ofportfolio holdings with the SEC for the first and third quarters of each fiscal year on Form N-Q. You can alsoreview and obtain copies of the Form N-Q at the SEC’s Public Reference Room in Washington, DC (informationon the operation of Public Reference Room may be obtained by calling 1-800-SEC-0330).
Householding—Important Notice Regarding Delivery of Shareholder Documents
In an effort to conserve resources, the Fund intends to reduce the number of duplicate Annual and Semi AnnualReports you receive by sending only one copy of each to addresses where we reasonably believe two or moreaccounts are from the same family. If you would like to discontinue householding of your accounts, please calltoll-free 855-OAK-FUND to request individual copies of these documents. We will begin sending individualcopies thirty days after receiving your request to stop householding.
Oaktree Funds 31
Additional Information (Unaudited)October 31, 2017

Oaktree Funds 32
Additional Information (Unaudited)October 31, 2017
Oaktree High Yield Bond FundValue of a $1,000,000 Investment
Institutional Class1
Total Returns1 At October 31, 2017 Annualized ___________________________ Since Inception 1 Year 12/16/14
Oaktree High Yield Bond Fund – Institutional Class 7.48% 6.41%
Oaktree High Yield Bond Fund – Advisor Class 7.13% 6.13%
BofA Merrill Lynch Developed Markets High Yield Constrained Index 9.24% 7.70%
1 Performance data quoted represents past performance; past performance does not guarantee future results. The investment return andprincipal value of an investment will fluctuate so that an investor’s shares, when redeemed, may be worth more or less than their originalcost. Current performance of the fund may be lower or higher than the performance quoted. The returns shown do not reflect taxes ashareholder would pay on distributions or redemptions. Performance data current to the most recent month end may be obtained bycalling (855) OAK-FUND. Short term performance, in particular, is not a good indication of the fund’s future performance, and aninvestment should not be made based solely on returns.
2 Performance of other classes will be greater or less than the line shown based on the differences in fees paid by shareholders investing inthe different classes.
3 The BofA Merrill Lynch Developed Markets High Yield Constrained Index contains all securities in the BofA Merrill Lynch Global HighYield index from developed markets countries but caps issuer exposure at 2%. Developed markets is defined as an FX-G10 member, aWestern European nation, or a territory of the U.S. or a Western European nation. The index tracks the performance of USD, CAD, GBPand EUR denominated below investment grade corporate debt publicly issued in the major domestic or Eurobond markets. Qualifyingsecurities must have a below investment grade rating (based on an average of Moody’s, S&P and Fitch). It is not possible to investdirectly into an index and the index does not reflect fees and expenses.
HH
H
H
H
H
H
H
HH
H
H
H
BB
B
B
B
B
B
B
BB
B
B
B
$950,000
$1,000,000
$1,050,000
$1,100,000
$1,150,000
$1,200,000
$1,250,000
H Oaktree High Yield Bond Fund (Institutional)2B BofA Merrill Lynch Developed Markets High Yield Constrained Index3
10/31/1712/16/14 01/31/16 04/30/16 07/31/1610/31/1501/31/15 04/30/15 07/31/15
$1,195,586
$1,237,739
01/31/17 04/30/17 07/31/1710/31/16

Tax Information
For the fiscal year ended October 31, 2017, certain dividends paid by the Fund may be subject to a maximum taxrate of 15%, as provided for by the Jobs and Growth Tax Relief Reconciliation Act of 2003. The percentage ofdividends declared from ordinary income designated as qualified dividend income was as follows:
High Yield Fund 0.00%
For corporate shareholders, the percent of ordinary income distributions qualifying for the corporate dividendsreceived deduction for the fiscal year ended October 31, 2017 was as follows:
High Yield Fund 0.00%
The percentage of taxable ordinary income distributions that are designated as short-term capital gain distributionsunder Internal Revenue Section 871(k)(2)(C) for the Fund was as follows:
High Yield Fund 0.00%
Foreign Shareholders: The percent of ordinary income distributions designated as interest related dividends forthe fiscal year ended October 31, 2017 was as follows:
High Yield Fund 94.37%
Oaktree Funds 33
Additional Information (Unaudited)October 31, 2017

Oaktree Funds (the “Trust”, and each series of the Trust, a “Fund”) is committed to maintaining the privacy of itsformer, current and prospective investors. Investors provide the Trust important personal and financial informationand protecting and safeguarding this information is a very high priority of the Trust.
In connection with offering shares of the Fund to current and potential investors, the Trust obtains nonpublicpersonal information about its investors. This information may include an investor’s name, address, e-mailaddress, social security number, account number, financial situation, transaction history and other personal orfinancial information.
The Trust may collect nonpublic personal information about investors from the following sources:
• Information received on applications, forms, questionnaires, websites, agreements or other similar documentsprepared in the course of establishing an investor relationship.
• Information about an investor’s transactions with the Trust, the Trust’s affiliates or others.
The Trust does not disclose any nonpublic personal information about its investors or former investors, except tothe Trust’s affiliates, including the investment adviser, and to non-affiliated parties as permitted by law, includingto process transactions (such as when it is necessary in the course of processing share purchases and redemptionsor otherwise administering the Trust), and then subject to customary confidentiality, or to respond to regulatoryinquiries, inspections, examinations, court orders and legal investigations. Non-affiliated parties of the Trustinclude accountants, attorneys, transfer agents, custodians, broker-dealers and companies providing the Trust withadministrative services. The Trust may use investors’ nonpublic personal information for marketing purposes.
Federal law gives investors the right to limit sharing of their nonpublic personal information to instancesnecessary for the Trust’s affiliates’ everyday business purposes, including activities such as Trust affiliates (i) sharing information about an investor’s creditworthiness with respect to the Fair Credit Reporting Act, (ii) using an investor’s nonpublic information to market to the investor, and (iii) sharing investors’ nonpublicinformation in order for non-affiliates to market to investors. State laws may give investors additional rights tolimit sharing.
The Trust restricts access to nonpublic personal information about investors to those personnel, agents or otherparties who need to know the information to provide products or services to investors. The Trust maintainssecurity measures, including physical, electronic and procedural safeguards that comply with federal law to guardinvestors’ nonpublic personal information. These measures include computer safeguards and secured files andoffices.
When an investor is no longer a shareholder of the Fund, the Trust continues to share investor’s information asdescribed in this notice.
If an investor has any concerns about this notice and the processing of an investor’s nonpublic personalinformation, please contact the Trust at 1-855-OAK-FUND (or 1-855-625-3863).
Oaktree Funds 34
Privacy Notice (Unaudited)October 31, 2017

(This Page Intentionally Left Blank.)


Investment Adviser:Oaktree Capital Management, L.P.333 South Grand Avenue28th FloorLos Angeles, CA 90071
Contact Information:www.oaktreefunds-us.com855-OAK-FUND
Independent Registered Public Accounting Firm:Ernst & Young LLP220 South Sixth StreetSuite 1400Minneapolis, MN 55402
Legal Counsel:Willkie Farr & Gallagher LLP787 Seventh AvenueNew York, NY 10019-6099
Distributor:Quasar Distributors, LLC777 East Wisconsin AvenueMilwaukee, WI 53202
Administrator, Fund Accountant and Transfer Agent:U.S. Bancorp Fund Services, LLCP.O. Box 701Milwaukee, WI 53201
Custodian:Bank of New York MellonOne Wall StreetNew York, NY 10286