Annual Report 2015 - Smartgroup...
77
Annual Report 2015
Transcript of Annual Report 2015 - Smartgroup...

Annual Report 2015
Annual Report 2015
Smartgroup Corporation Ltd
24 February 2016
ASX Market Announcements Office ASX Limited 20 Bridge Street Sydney, NSW, Australia, 2000
Smartgroup Corporation Ltd – Results for announcement to the market
In accordance with the Listing Rules, Smartgroup Corporation Ltd encloses for immediate release the following information:
1. Appendix 4E, and2. Smartgroup Corporation Ltd Annual Report 2015.Smartgroup Corporation Ltd will conduct a briefing on the results from 9.00am (Sydney time) on 25 February 2016.
Amanda Morgan General Counsel and Joint Company Secretary
Market release
Annual Report 2015
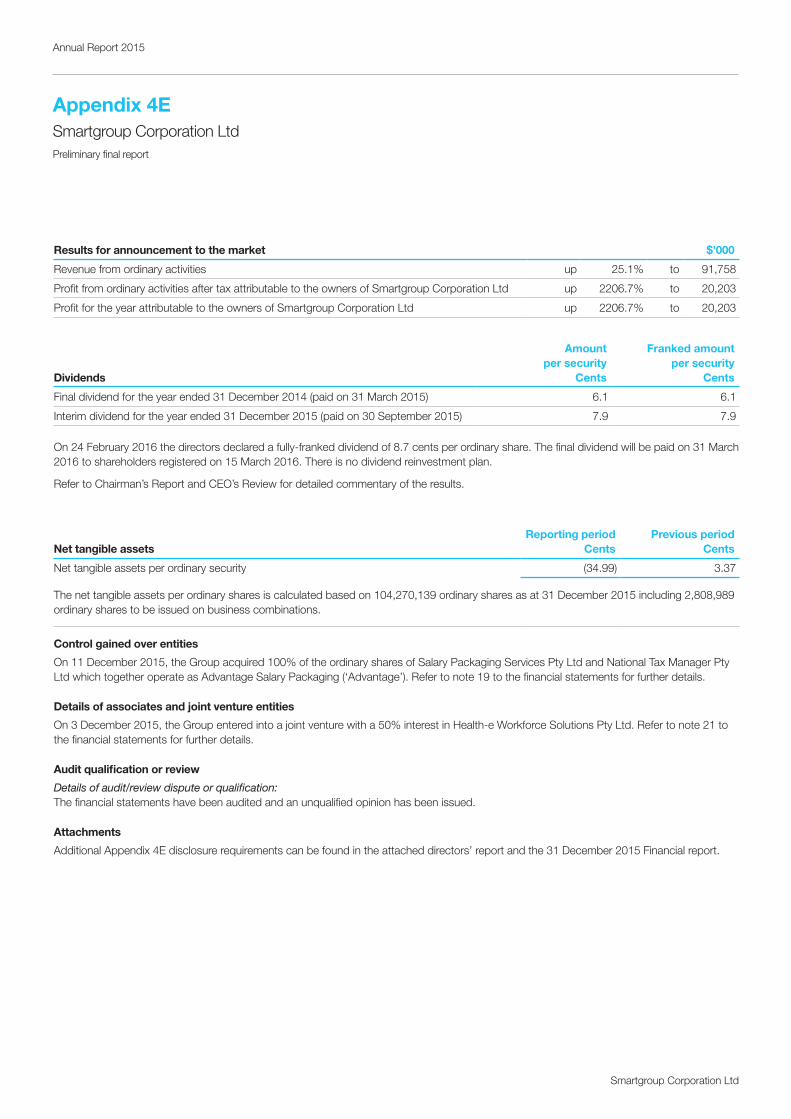
Results for announcement to the market $’000
Revenue from ordinary activities up 25.1% to 91,758
Profit from ordinary activities after tax attributable to the owners of Smartgroup Corporation Ltd up 2206.7% to 20,203
Profit for the year attributable to the owners of Smartgroup Corporation Ltd up 2206.7% to 20,203
Dividends
Amount per security
Cents
Franked amount per security
Cents
Final dividend for the year ended 31 December 2014 (paid on 31 March 2015) 6.1 6.1
Interim dividend for the year ended 31 December 2015 (paid on 30 September 2015) 7.9 7.9
On 24 February 2016 the directors declared a fully-franked dividend of 8.7 cents per ordinary share. The final dividend will be paid on 31 March 2016 to shareholders registered on 15 March 2016. There is no dividend reinvestment plan.
Refer to Chairman’s Report and CEO’s Review for detailed commentary of the results.
Net tangible assetsReporting period
CentsPrevious period
Cents
Net tangible assets per ordinary security (34.99) 3.37
The net tangible assets per ordinary shares is calculated based on 104,270,139 ordinary shares as at 31 December 2015 including 2,808,989 ordinary shares to be issued on business combinations.
Control gained over entities
On 11 December 2015, the Group acquired 100% of the ordinary shares of Salary Packaging Services Pty Ltd and National Tax Manager Pty Ltd which together operate as Advantage Salary Packaging (‘Advantage’). Refer to note 19 to the financial statements for further details.
Details of associates and joint venture entities
On 3 December 2015, the Group entered into a joint venture with a 50% interest in Health-e Workforce Solutions Pty Ltd. Refer to note 21 to the financial statements for further details.
Audit qualification or review
Details of audit/review dispute or qualification: The financial statements have been audited and an unqualified opinion has been issued.
Attachments
Additional Appendix 4E disclosure requirements can be found in the attached directors’ report and the 31 December 2015 Financial report.
Appendix 4ESmartgroup Corporation LtdPreliminary final report
Smartgroup Corporation Ltd
Annual Report 2015
Smartgroup Corporation Ltd
31 December 2015
ABN 48 126 266 831
About us . . . . . . . . . . . . . . . . . . . . . . . . . . . . . . .2
From our Chairman . . . . . . . . . . . . . . . . . . . . . . . . .3
CEO’s review . . . . . . . . . . . . . . . . . . . . . . . . . . . . .4
Performance highlights . . . . . . . . . . . . . . . . . . . . . . . .6
Our clients . . . . . . . . . . . . . . . . . . . . . . . . . . . . . .8
Our partners . . . . . . . . . . . . . . . . . . . . . . . . . . . . .9
Industry leading innovation . . . . . . . . . . . . . . . . . . . . . 10
Staff engagement . . . . . . . . . . . . . . . . . . . . . . . . . 12
Financial report . . . . . . . . . . . . . . . . . . . . . . . . . . . 14
Shareholder information . . . . . . . . . . . . . . . . . . . . . . 71
Corporate directory . . . . . . . . . . . . . . . . . . . . . . . . 73
Annual report 2015
Smartgroup Corporation Ltd | 2
Annual Report 2015
About us
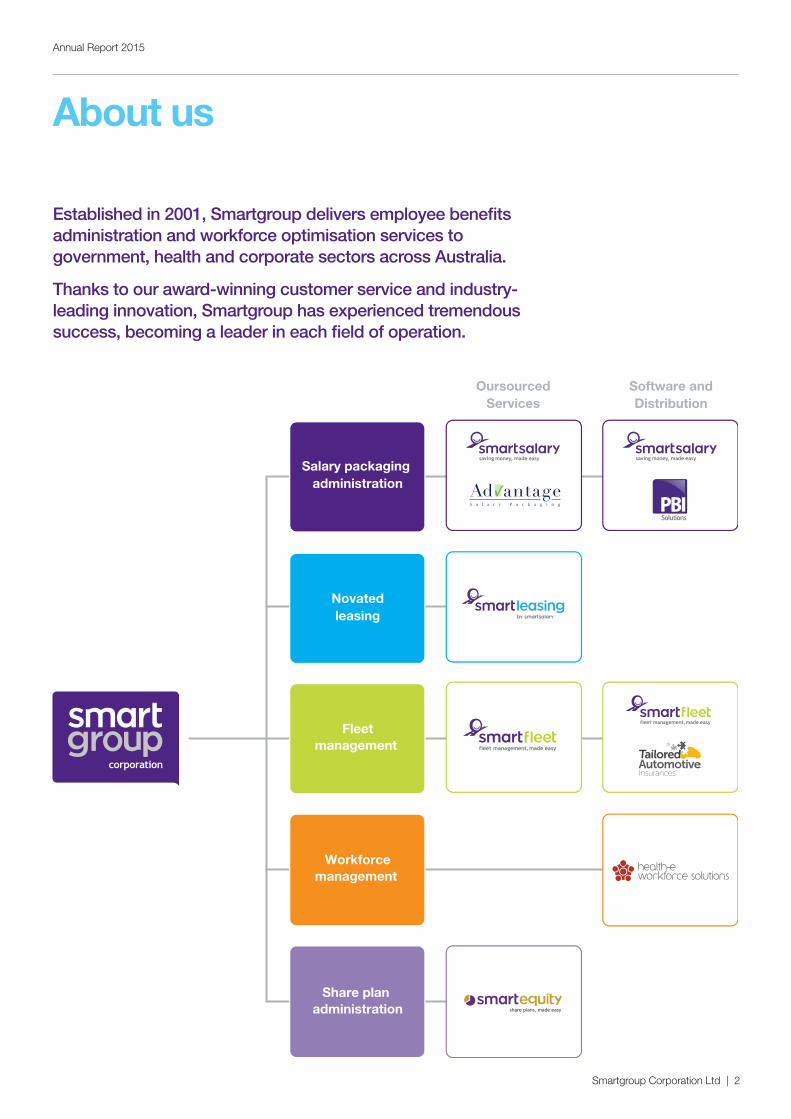
Established in 2001, Smartgroup delivers employee benefits administration and workforce optimisation services to government, health and corporate sectors across Australia.
Thanks to our award-winning customer service and industry-leading innovation, Smartgroup has experienced tremendous success, becoming a leader in each field of operation.
Outsourced services Software & distribution
Fleetmanagement
Workforcemanagement
Salary packaging administration
Share plan administration
Novatedleasing
OursourcedServices
Software andDistribution
Smartgroup Corporation Ltd | 3
Annual Report 2015
From our Chairman
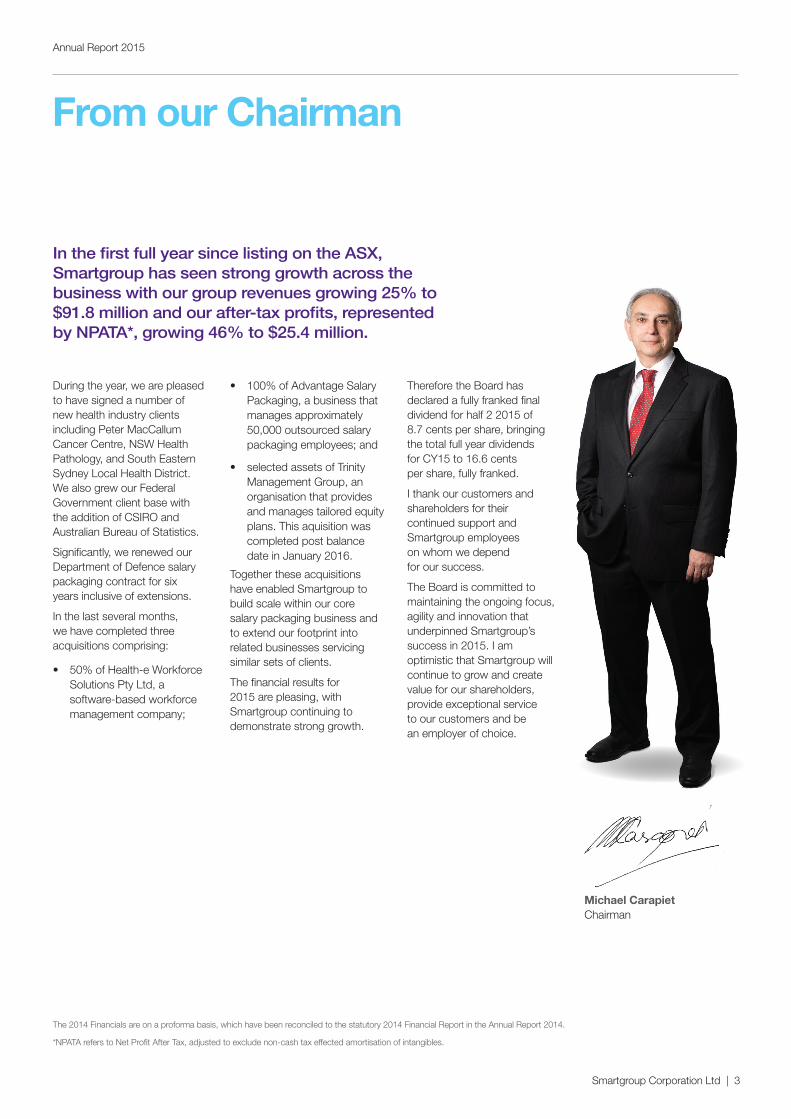
In the first full year since listing on the ASX, Smartgroup has seen strong growth across the business with our group revenues growing 25% to $91.8 million and our after-tax profits, represented by NPATA*, growing 46% to $25.4 million.
During the year, we are pleased to have signed a number of new health industry clients including Peter MacCallum Cancer Centre, NSW Health Pathology, and South Eastern Sydney Local Health District. We also grew our Federal Government client base with the addition of CSIRO and Australian Bureau of Statistics.
Significantly, we renewed our Department of Defence salary packaging contract for six years inclusive of extensions.
In the last several months, we have completed three acquisitions comprising:
• 50% of Health-e Workforce Solutions Pty Ltd, a software-based workforce management company;
• 100% of Advantage Salary Packaging, a business that manages approximately 50,000 outsourced salary packaging employees; and
• selected assets of Trinity Management Group, an organisation that provides and manages tailored equity plans. This aquisition was completed post balance date in January 2016.
Together these acquisitions have enabled Smartgroup to build scale within our core salary packaging business and to extend our footprint into related businesses servicing similar sets of clients.
The financial results for 2015 are pleasing, with Smartgroup continuing to demonstrate strong growth.
Therefore the Board has declared a fully franked final dividend for half 2 2015 of 8.7 cents per share, bringing the total full year dividends for CY15 to 16.6 cents per share, fully franked.
I thank our customers and shareholders for their continued support and Smartgroup employees on whom we depend for our success.
The Board is committed to maintaining the ongoing focus, agility and innovation that underpinned Smartgroup’s success in 2015. I am optimistic that Smartgroup will continue to grow and create value for our shareholders, provide exceptional service to our customers and be an employer of choice.
Michael Carapiet Chairman
The 2014 Financials are on a proforma basis, which have been reconciled to the statutory 2014 Financial Report in the Annual Report 2014.
*NPATA refers to Net Profit After Tax, adjusted to exclude non-cash tax effected amortisation of intangibles.
Smartgroup Corporation Ltd | 4
Annual Report 2015
CEO’s reviewFor the year ended 31 December 2015
In 2015, Smartgroup continued to grow our business organically and improve the service we provide to our valued customers. We also continued to diversify the business through complementary acquisitions. Each of the brands continues to hit new highs, as outlined below.
Smartsalary
Smartsalary experienced great success in renewing important contracts and winning client tenders.
In June, we renewed our exclusive contract with Department of Defence with extension options until 2021.
Also, we successfully implemented contracts for NSW Health Pathology, Peter MacCallum Cancer Centre and South Eastern Sydney Local Health District.
Smartleasing
A key focus for Smartleasing in 2015 was to elevate the profile of the brand, which led to the signing of six-time V8 Supercar Champion, Jamie Whincup as our Brand Ambassador. This has been a rewarding partnership, and we’ve renewed our contract with Jamie for 2016.
For our Smartleasing customers, we delivered a substantial upgrade to our online capabilities, giving them greater flexibility to self-manage their accounts.
This focus on customer service also helped Smartleasing successfully renew its valued contract with Eastern Health for a further two years.
Smartfleet
Smartfleet continually looks for opportunities to position itself as a provider of choice, and the development of Smartfleet Maintenance Online was one such initiative. Launched in December 2015, Smartfleet Maintenance Online has already demonstrated its capacity to deliver efficiencies to fleet managers and their ever-tightening budgets.
Our focus on consistently achieving excellent results for our fleet clients led to the renewal of our partnerships such as with Church of Christ Care. We also welcomed several new clients to the Smartfleet family, including Department of Education and Training, Disability Services Australia and Auspat Land Survey.
Acquisitions
Smartgroup completed two acquisitions in 2015, and a further acquisition post balance date in 2016. In December we completed the 50% acquisition of Health-e Workforce Solutions (HWS), whose proprietary software supports effective workforce management within the health care sector and, among other things, reduces the reliance on expensive agency staff, thereby delivering high-quality and cost-effective care.
Also in December, we completed the acquisition of Advantage Salary Packaging (‘Advantage’), a Melbourne-based organisation that operates exclusively within the Public Benevolent Institutions (PBI) sector, servicing 350 employers and managing 50,000 salary packages. Along with being a good cultural fit, Advantage is a well-run business that will expand Smartgroup’s outsourced salary packaging offering to small and medium-sized PBIs.
As at 31 December 2015, Smartsalary and Advantage combined service:
• c 182,500 employee customers
• c 34,000 managed novated car leases.
Post balance date, in January 2016, Smartgroup completed the acquisition of selected assets of Trinity Management Group (TMG) to extend its remuneration services into equity plan administration. TMG provides and manages tailored equity plans on behalf of approximately 50 corporate clients. The business now trades as Smartequity Pty Ltd, a 100% owned subsidiary of Smartgroup.
I am particularly pleased to be working with all three founders of the acquired businesses. Smartgroup is well placed to assist them to continue to grow through our focus on customers and operating efficiencies.
Operations highlights
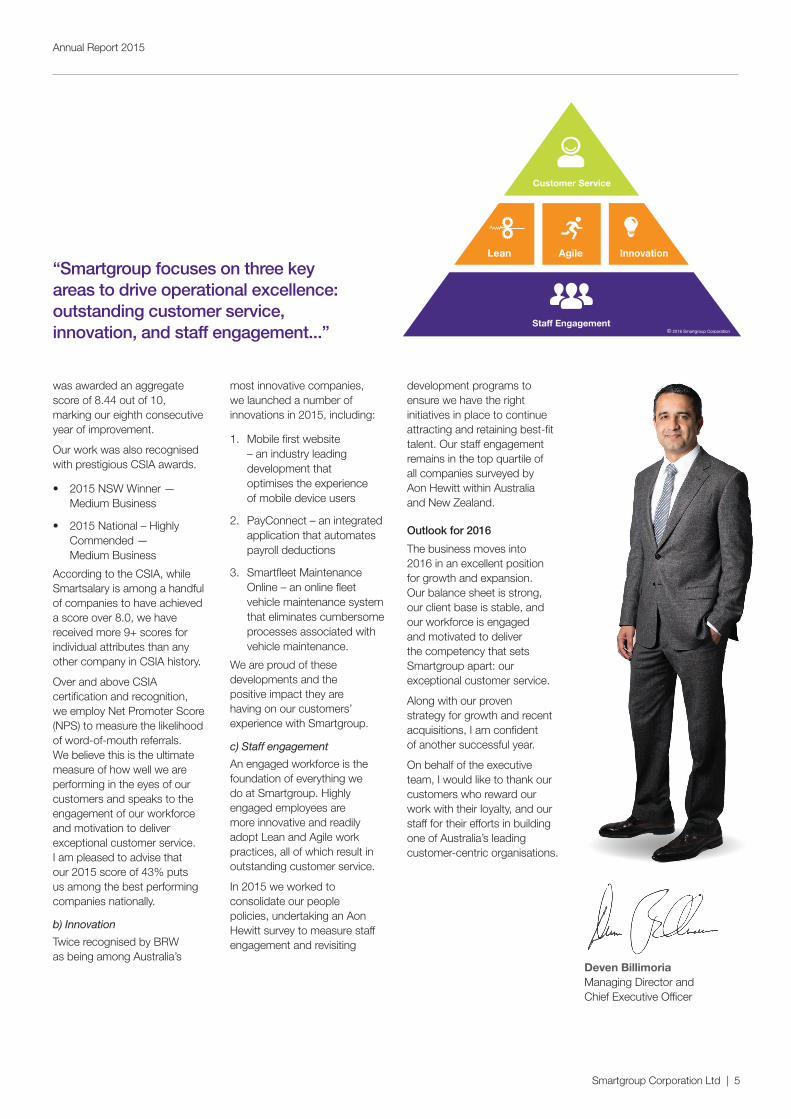
Smartgroup focuses on three key areas to drive operational excellence: outstanding customer service, innovation, and staff engagement. I am pleased to report that 2015 was a year of development and success in all three areas.
a) Outstanding customer service
Smartsalary has been accredited by the Customer Service Institute of Australia (CSIA) since 2008, and we have worked successfully to improve our score year after year. In October 2015, Smartsalary
In our second annual report to Smartgroup Shareholders, I am pleased to announce another year of record revenue and profit.
Smartgroup Corporation Ltd | 5
Annual Report 2015
was awarded an aggregate score of 8.44 out of 10, marking our eighth consecutive year of improvement.
Our work was also recognised with prestigious CSIA awards.
• 2015 NSW Winner — Medium Business
• 2015 National – Highly Commended — Medium Business
According to the CSIA, while Smartsalary is among a handful of companies to have achieved a score over 8.0, we have received more 9+ scores for individual attributes than any other company in CSIA history.
Over and above CSIA certification and recognition, we employ Net Promoter Score (NPS) to measure the likelihood of word-of-mouth referrals. We believe this is the ultimate measure of how well we are performing in the eyes of our customers and speaks to the engagement of our workforce and motivation to deliver exceptional customer service. I am pleased to advise that our 2015 score of 43% puts us among the best performing companies nationally.
b) Innovation
Twice recognised by BRW as being among Australia’s
most innovative companies, we launched a number of innovations in 2015, including:
1. Mobile first website – an industry leading development that optimises the experience of mobile device users
2. PayConnect – an integrated application that automates payroll deductions
3. Smartfleet Maintenance Online – an online fleet vehicle maintenance system that eliminates cumbersome processes associated with vehicle maintenance.
We are proud of these developments and the positive impact they are having on our customers’ experience with Smartgroup.
c) Staff engagement
An engaged workforce is the foundation of everything we do at Smartgroup. Highly engaged employees are more innovative and readily adopt Lean and Agile work practices, all of which result in outstanding customer service.
In 2015 we worked to consolidate our people policies, undertaking an Aon Hewitt survey to measure staff engagement and revisiting
development programs to ensure we have the right initiatives in place to continue attracting and retaining best-fit talent. Our staff engagement remains in the top quartile of all companies surveyed by Aon Hewitt within Australia and New Zealand.
Outlook for 2016
The business moves into 2016 in an excellent position for growth and expansion. Our balance sheet is strong, our client base is stable, and our workforce is engaged and motivated to deliver the competency that sets Smartgroup apart: our exceptional customer service.
Along with our proven strategy for growth and recent acquisitions, I am confident of another successful year.
On behalf of the executive team, I would like to thank our customers who reward our work with their loyalty, and our staff for their efforts in building one of Australia’s leading customer-centric organisations.
Deven Billimoria Managing Director and Chief Executive Officer
“Smartgroup focuses on three key areas to drive operational excellence: outstanding customer service, innovation, and staff engagement...”
AgileLean Innovation
Customer Service
© 2016 Smartgroup Corporation
Staff Engagement
Smartgroup Corporation Ltd | 6
Annual Report 2015
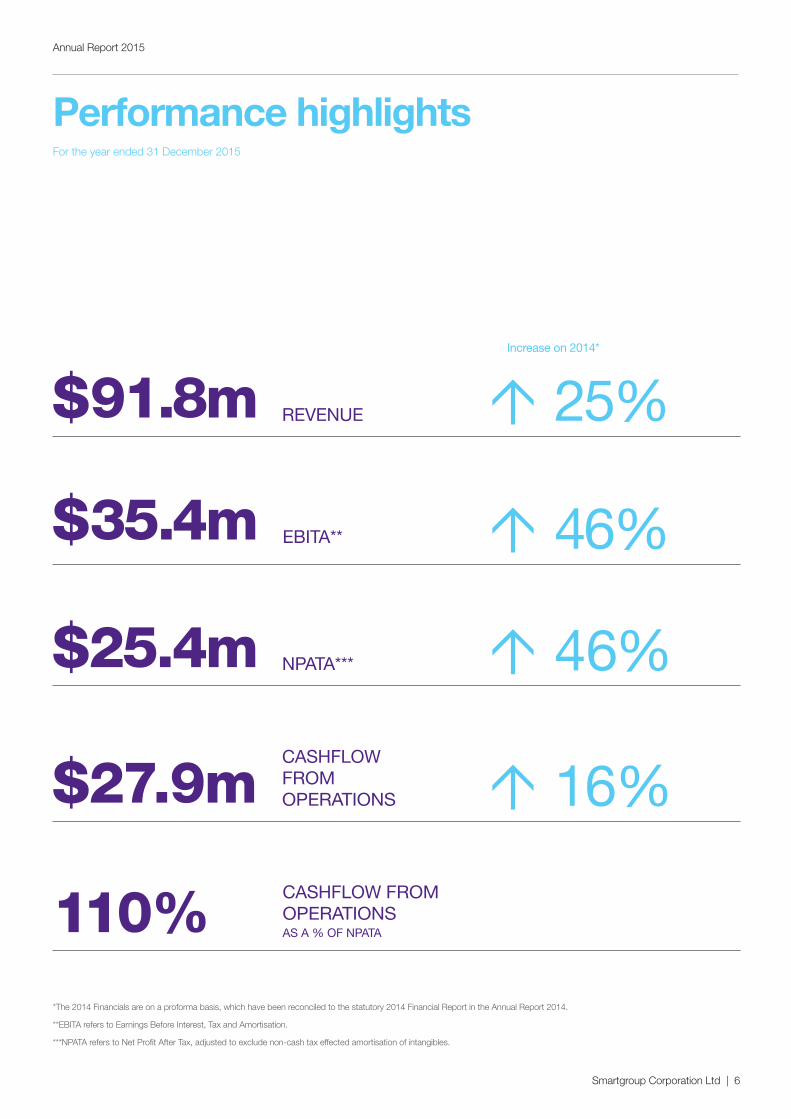
Performance highlights
Increase on 2014*
REVENUE$91.8m 25%
EBITA**$35.4m 46%
CASHFLOW FROM OPERATIONS AS A % OF NPATA110%
CASHFLOW FROM OPERATIONS$27.9m 16%
NPATA***$25.4m 46%
*The 2014 Financials are on a proforma basis, which have been reconciled to the statutory 2014 Financial Report in the Annual Report 2014.
**EBITA refers to Earnings Before Interest, Tax and Amortisation.
***NPATA refers to Net Profit After Tax, adjusted to exclude non-cash tax effected amortisation of intangibles.
For the year ended 31 December 2015

Smartgroup Corporation Ltd | 7
Annual Report 2015
54%GROWTH IN 2015
182,500 CUSTOMER PACKAGES
10%GROWTH IN 2015
34,000 NOVATED LEASES UNDER MANAGEMENT
Performance highlights

Smartgroup Corporation Ltd | 8
Annual Report 2015
Our clients
AgileLean Innovation
Customer Service
© 2016 Smartgroup Corporation
Staff Engagement
Dennis O’Keeffe
CFO – Peter MacCallum Cancer Centre
“Following a decision to move to an outsourced solution provider and a subsequent competitive tender, Smartsalary was appointed to provide salary packaging services to the approximate 2,600 Peter Mac staff early in 2015.
It’s testament to the cooperation between Peter Mac and Smartsalary that the new service provision is now well established, and we have seen an increase in the number of staff availing of benefits and a significant uplift in staff entering novated leasing arrangements for motor vehicles.
Smartsalary’s account management team meet regularly with Peter Mac and review KPI’s and assess opportunities to increase the usage of this important benefit for our staff.”
Annette Bathgate
Salary Packaging Transition Manager – South Eastern Sydney Local Health District
“Since transitioning in August 2015, Smartsalary has established an excellent working relationship with South Eastern Sydney Local Health District (SESLHD).
Smartsalary makes salary packaging easier for SESLHD by having field sales consultants based at each of the major facilities. The Smartsalary staff are proactive and professional in their approach and happy to take on board ideas and suggestions from SESLHD. The sales team is well supported by head office who consistently ensures that business processes are streamlined to maintain efficiency.
Staff across the District are much more aware of the benefits of salary packaging through the on-going marketing efforts of the field sales team. Salary packaging has been demystified and the processing of applications has been made easier with staff enjoying the benefits of being reimbursed in a shorter turnaround time. Overall the staff feedback has been very positive.”
Troy Allen
Assistant Director – Pay & Administration Branch, Department of Defence
“Defence has worked with Smartgroup for around 15 years. Smartgroup has demonstrated its expertise in providing for Defence’s unique overseas deployment and related tax requirements.
Smartgroup provides outstanding customer service to our employees and deed manager, responding to enquiries quickly and in a highly professional manner. I would recommend Smartgroup to any large organisation wishing to offer the suite of salary packaging services to their staff.”
Kelly Macri,
People & Performance Coordinator – Karrikins Group
“We have been partnering with Smartleasing for approximately six months and just rolled out novated leasing. We want to offer competitive employee benefits to our current and potential employees, and with increasing living expenses in capital cities, novated leasing provides a smart and simple way to purchase a vehicle which is a key requirement for many of our roles.
Feedback from our employees about Smartleasing has been very positive; in particular the ease of the application process, well set out information and the friendliness of the team.
We would definitely recommend Smartleasing to other organisations. From the time of initial implementation, the Smartleasing team has been very helpful and responsive to our business needs.”
Building partnerships with our clients supports them in achieving their goals while allowing us to continuously improving our products and services.
Smartgroup Corporation Ltd | 9
Annual Report 2015
Our partners
For Smartgroup, our partners are an extension of our culture, our values and vision.
In 2015, we looked to consolidate longstanding relationships and align our business with new community and corporate partners, beginning with the appointment of our first brand ambassador.
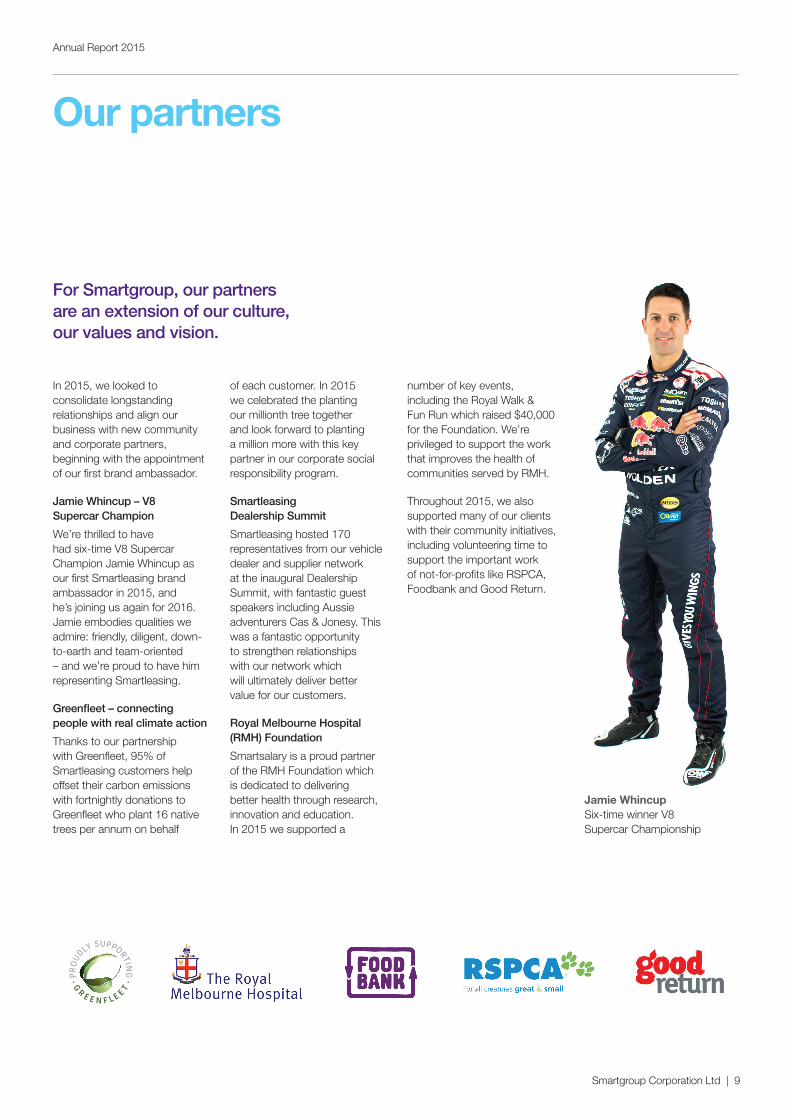
Jamie Whincup – V8 Supercar Champion
We’re thrilled to have had six-time V8 Supercar Champion Jamie Whincup as our first Smartleasing brand ambassador in 2015, and he’s joining us again for 2016. Jamie embodies qualities we admire: friendly, diligent, down-to-earth and team-oriented – and we’re proud to have him representing Smartleasing.
Greenfleet – connecting people with real climate action
Thanks to our partnership with Greenfleet, 95% of Smartleasing customers help offset their carbon emissions with fortnightly donations to Greenfleet who plant 16 native trees per annum on behalf
of each customer. In 2015 we celebrated the planting our millionth tree together and look forward to planting a million more with this key partner in our corporate social responsibility program.
Smartleasing Dealership Summit
Smartleasing hosted 170 representatives from our vehicle dealer and supplier network at the inaugural Dealership Summit, with fantastic guest speakers including Aussie adventurers Cas & Jonesy. This was a fantastic opportunity to strengthen relationships with our network which will ultimately deliver better value for our customers.
Royal Melbourne Hospital (RMH) Foundation
Smartsalary is a proud partner of the RMH Foundation which is dedicated to delivering better health through research, innovation and education. In 2015 we supported a
number of key events, including the Royal Walk & Fun Run which raised $40,000 for the Foundation. We’re privileged to support the work that improves the health of communities served by RMH.
Throughout 2015, we also supported many of our clients with their community initiatives, including volunteering time to support the important work of not-for-profits like RSPCA, Foodbank and Good Return.
Jamie Whincup Six-time winner V8 Supercar Championship
Smartgroup Corporation Ltd | 10
Annual Report 2015
Industry leading innovation
As one of Australia’s most innovative companies, we create, adapt and adopt technologies that make it easier for our customers to do business with us.
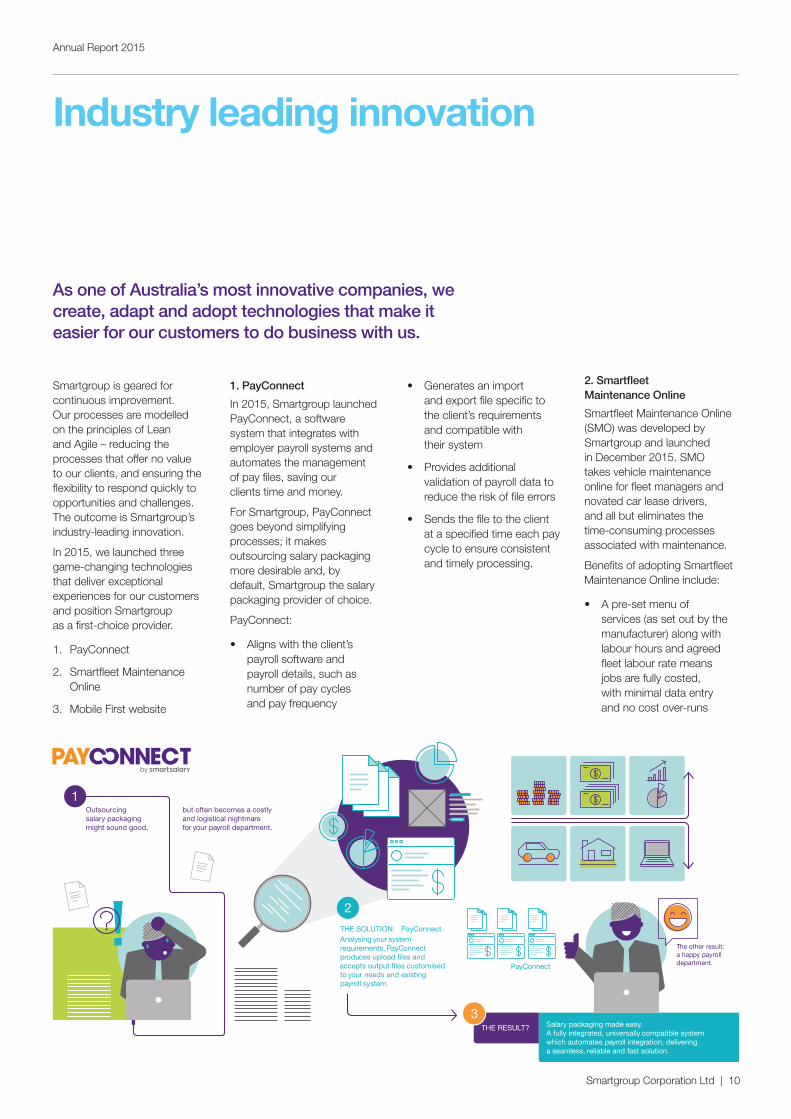
The other result:a happy payrolldepartment.
Salary packaging made easy.A fully integrated, universally compatible system which automates payroll integration, delivering a seamless, reliable and fast solution.
THE RESULT?
Outsourcingsalary packagingmight sound good,
but often becomes a costlyand logistical nightmarefor your payroll department.
1
THE SOLUTION: PayConnect.Analysing your system requirements, PayConnect produces upload files and accepts output files customised to your needs and existing payroll system.
2
3
PayConnect
Smartgroup is geared for continuous improvement. Our processes are modelled on the principles of Lean and Agile – reducing the processes that offer no value to our clients, and ensuring the flexibility to respond quickly to opportunities and challenges. The outcome is Smartgroup’s industry-leading innovation.
In 2015, we launched three game-changing technologies that deliver exceptional experiences for our customers and position Smartgroup as a first-choice provider.
1. PayConnect
2. Smartfleet Maintenance Online
3. Mobile First website
1. PayConnect
In 2015, Smartgroup launched PayConnect, a software system that integrates with employer payroll systems and automates the management of pay files, saving our clients time and money.
For Smartgroup, PayConnect goes beyond simplifying processes; it makes outsourcing salary packaging more desirable and, by default, Smartgroup the salary packaging provider of choice.
PayConnect:
• Aligns with the client’s payroll software and payroll details, such as number of pay cycles and pay frequency
• Generates an import and export file specific to the client’s requirements and compatible with their system
• Provides additional validation of payroll data to reduce the risk of file errors
• Sends the file to the client at a specified time each pay cycle to ensure consistent and timely processing.
2. Smartfleet Maintenance Online
Smartfleet Maintenance Online (SMO) was developed by Smartgroup and launched in December 2015. SMO takes vehicle maintenance online for fleet managers and novated car lease drivers, and all but eliminates the time-consuming processes associated with maintenance.
Benefits of adopting Smartfleet Maintenance Online include:
• A pre-set menu of services (as set out by the manufacturer) along with labour hours and agreed fleet labour rate means jobs are fully costed, with minimal data entry and no cost over-runs
Smartgroup Corporation Ltd | 11
Annual Report 2015
• Log book display, allowing merchants to review vehicle service history
• Service variation management which allows variation to standards while capturing notes and images, and offers an online chat facility for fast query resolution
• Automatic generation of Recipient Created Tax Invoice (RCTI) for processing and record keeping.
Importantly, Smartfleet Maintenance Online minimises financial risk for employers and reduces downtime for drivers of leased vehicles.
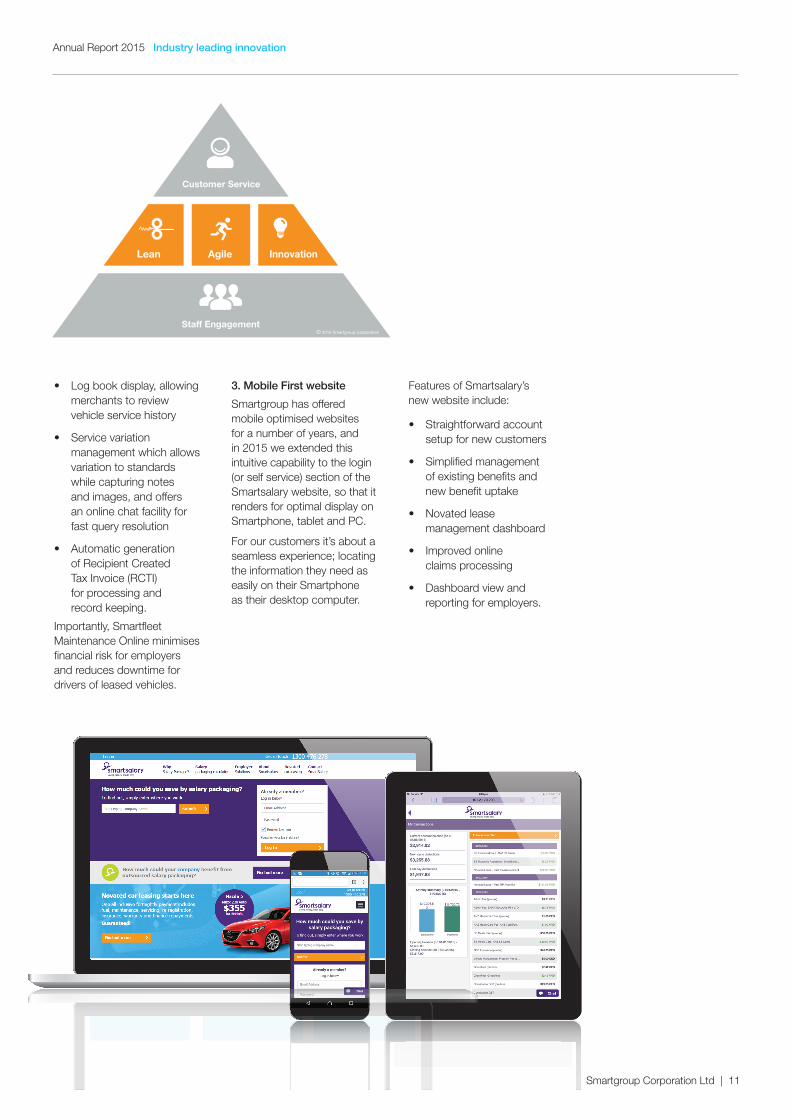
3. Mobile First website
Smartgroup has offered mobile optimised websites for a number of years, and in 2015 we extended this intuitive capability to the login (or self service) section of the Smartsalary website, so that it renders for optimal display on Smartphone, tablet and PC.
For our customers it’s about a seamless experience; locating the information they need as easily on their Smartphone as their desktop computer.
Features of Smartsalary’s new website include:
• Straightforward account setup for new customers
• Simplified management of existing benefits and new benefit uptake
• Novated lease management dashboard
• Improved online claims processing
• Dashboard view and reporting for employers.
AgileLean Innovation
Customer Service
© 2016 Smartgroup Corporation
Staff Engagement
Industry leading innovation
Smartgroup Corporation Ltd | 12
Annual Report 2015
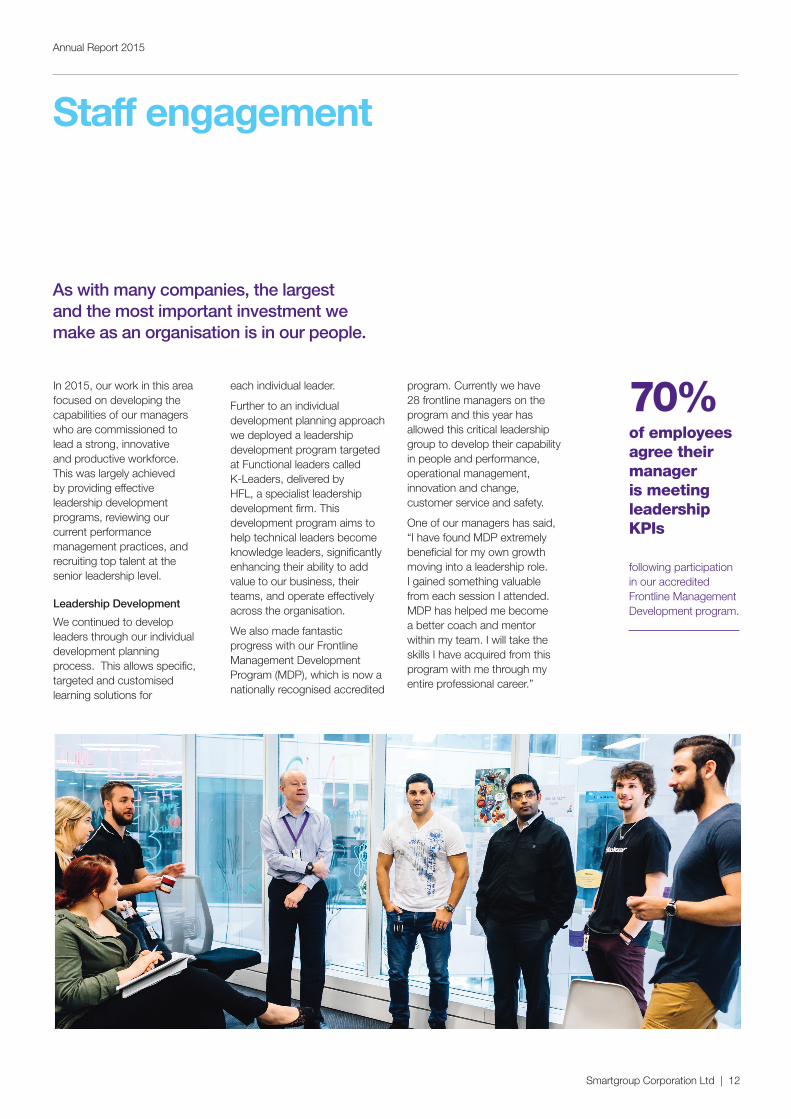
Staff engagement
As with many companies, the largest and the most important investment we make as an organisation is in our people.
In 2015, our work in this area focused on developing the capabilities of our managers who are commissioned to lead a strong, innovative and productive workforce. This was largely achieved by providing effective leadership development programs, reviewing our current performance management practices, and recruiting top talent at the senior leadership level.
Leadership Development
We continued to develop leaders through our individual development planning process. This allows specific, targeted and customised learning solutions for
each individual leader.
Further to an individual development planning approach we deployed a leadership development program targeted at Functional leaders called K-Leaders, delivered by HFL, a specialist leadership development firm. This development program aims to help technical leaders become knowledge leaders, significantly enhancing their ability to add value to our business, their teams, and operate effectively across the organisation.
We also made fantastic progress with our Frontline Management Development Program (MDP), which is now a nationally recognised accredited
program. Currently we have 28 frontline managers on the program and this year has allowed this critical leadership group to develop their capability in people and performance, operational management, innovation and change, customer service and safety.
One of our managers has said, “I have found MDP extremely beneficial for my own growth moving into a leadership role. I gained something valuable from each session I attended. MDP has helped me become a better coach and mentor within my team. I will take the skills I have acquired from this program with me through my entire professional career.”
70%of employees agree their manager is meeting leadership KPIs
following participation in our accredited Frontline Management Development program.
Smartgroup Corporation Ltd | 13
Annual Report 2015
Performance Management
Year on year we look at building on and improving our existing processes. This year we introduced a set of six key People KPIs for every manager with people management responsibilities. This ensured clarity and consistency in our approach to core people management responsibilities. The aforementioned Frontline Management Development Program assists in the development of skills in delivering on these key people KPIs. A survey conducted to test the implementation of these KPIs showed great results, with
70% of people either agreeing or strongly agreeing that their manager is performing well in delivering on these KPIs.
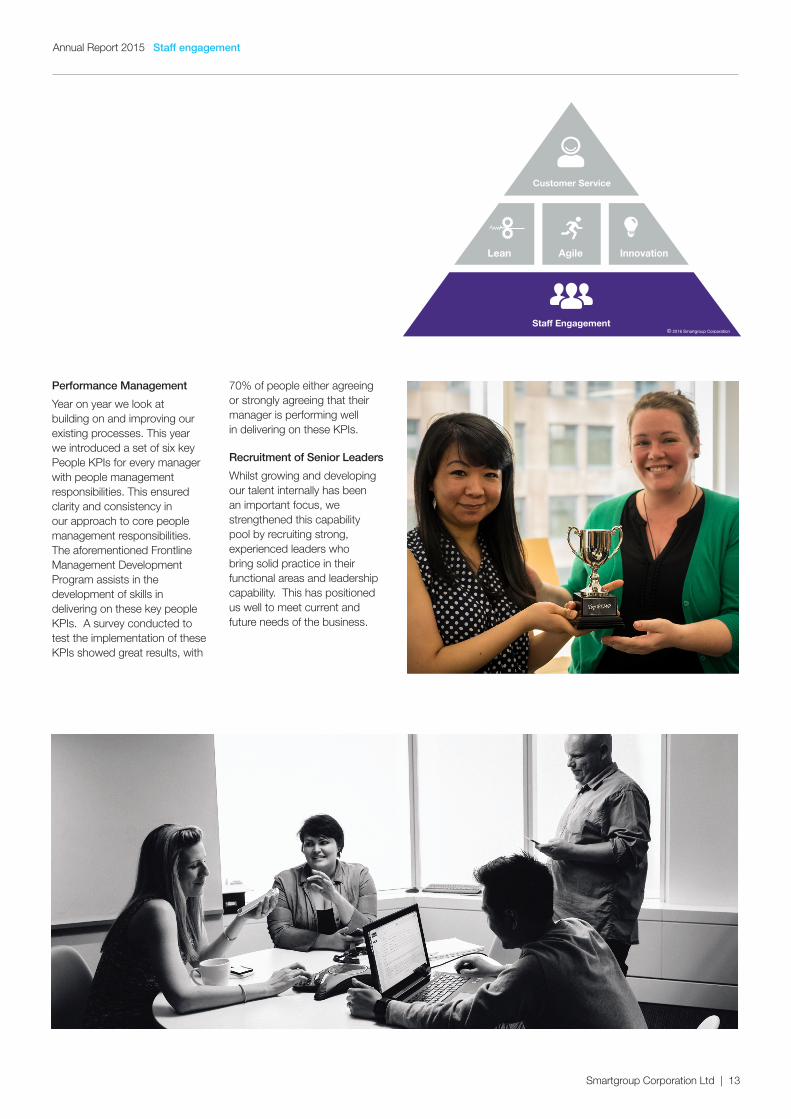
Recruitment of Senior Leaders
Whilst growing and developing our talent internally has been an important focus, we strengthened this capability pool by recruiting strong, experienced leaders who bring solid practice in their functional areas and leadership capability. This has positioned us well to meet current and future needs of the business.
AgileLean Innovation
Customer Service
© 2016 Smartgroup Corporation
Staff Engagement
Staff engagement
Smartgroup Corporation Ltd | 14
Sub Section StartSubheading here
Annual Report 2015
Financial report 2015
Smartgroup Corporation Ltd
31 December 2015
ABN 48 126 266 831
Smartgroup Corporation Ltd | 15
Annual Report 2015
Directors’ reportFor the year ended 31 December 2015
Principal activities
During the financial year the principal activities of the Group consisted of outsourced administration, primarily salary packaging, software, distribution and group services and fleet management services. The provision of salary packaging services involves the Group holding funds in a fiduciary capacity.
Dividends
Dividends paid during the financial year were as follows: Consolidated
2015 $’000
2014 $’000
Final dividend for the year ended 31 December 2014 of 6.1 cents (2014: nil cents) per ordinary share 6,189 –
Interim dividend for the year ended 31 December 2015 of 7.9 cents (2014: nil cents) per ordinary share 8,192 –
14,381 –
On 24 February 2016 the directors declared a fully-franked final dividend of 8.7 cents per ordinary share. The final dividend will be paid on 31 March 2016 to shareholders registered on 15 March 2016 resulting in total distribution of $9,023,000. The financial effect of dividends declared after the reporting date are not reflected in the 31 December 2015 financial statements and will be recognised in subsequent financial reports.
Review of operations
The profit for the Group after providing for income tax amounted to $20,203,000 (31 December 2014: loss of $959,000).
Refer to Chairman’s Report and CEO’s Review for further commentary on the results.
Business objectives and cash use
Smartgroup Corporation Ltd has used cash and cash equivalents held in growing the business through contract wins and stronger salary packaging uptake, retiring outstanding debt and pay dividends to its shareholders. Smartgroup has also used a combination of its cash, debt and equity in acquiring shares and assets in three businesses.
Significant changes in the state of affairs
On 3 December 2015, the Group entered into a joint venture with a 50% interest in Health-e Workforce Solutions Pty Ltd for an investment value of $6,000,000.
On 11 December 2015, the Group acquired 100% interest in Salary Packaging Solutions Pty Ltd and National Tax Manager Pty Ltd which together operate as Advantage Salary Packing (‘Advantage’) for a total consideration of $58,543,000.
There were no other significant changes in the state of affairs of the Group during the financial year.
Matters subsequent to the end of the financial year
On 29 January 2016, the Group completed an agreement with Trinity Management Group (‘TMG’) to acquire selected assets of TMG for an initial payment of $1,700,000 with a further payment to be made in 36 months based on a multiple based on the increment of EBIT (Earnings
The directors present their report, together with the financial statements, on the consolidated entity (referred to hereafter as the ‘Group’) consisting of Smartgroup Corporation Ltd (referred to hereafter as the ‘Company’ or ‘parent entity’) and the entities it controlled at the end of, or during, the year ended 31 December 2015.
Directors
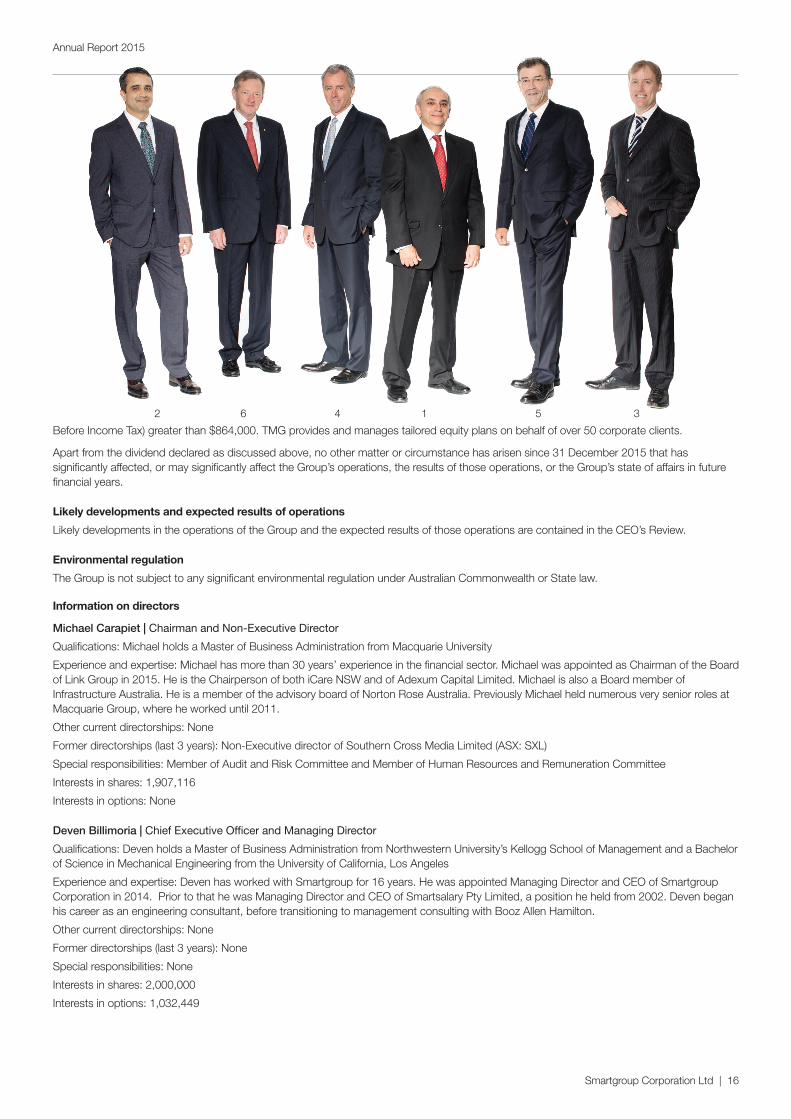
The following persons were directors of Smartgroup Corporation Ltd during the whole of the financial year and up to the date of this report, unless otherwise stated:
1. Michael Carapiet2. Deven Billimoria3. John Prendiville4. Gavin Bell5. Andrew Bolam6. Ian Watt (appointed 1 July 2015)
Smartgroup Corporation Ltd | 16
Annual Report 2015
Before Income Tax) greater than $864,000. TMG provides and manages tailored equity plans on behalf of over 50 corporate clients.
Apart from the dividend declared as discussed above, no other matter or circumstance has arisen since 31 December 2015 that has significantly affected, or may significantly affect the Group’s operations, the results of those operations, or the Group’s state of affairs in future financial years.
Likely developments and expected results of operations
Likely developments in the operations of the Group and the expected results of those operations are contained in the CEO’s Review.
Environmental regulation
The Group is not subject to any significant environmental regulation under Australian Commonwealth or State law.
Information on directors
Michael Carapiet | Chairman and Non-Executive Director
Qualifications: Michael holds a Master of Business Administration from Macquarie University
Experience and expertise: Michael has more than 30 years’ experience in the financial sector. Michael was appointed as Chairman of the Board of Link Group in 2015. He is the Chairperson of both iCare NSW and of Adexum Capital Limited. Michael is also a Board member of Infrastructure Australia. He is a member of the advisory board of Norton Rose Australia. Previously Michael held numerous very senior roles at Macquarie Group, where he worked until 2011.
Other current directorships: None
Former directorships (last 3 years): Non-Executive director of Southern Cross Media Limited (ASX: SXL)
Special responsibilities: Member of Audit and Risk Committee and Member of Human Resources and Remuneration Committee
Interests in shares: 1,907,116
Interests in options: None
Deven Billimoria | Chief Executive Officer and Managing Director
Qualifications: Deven holds a Master of Business Administration from Northwestern University’s Kellogg School of Management and a Bachelor of Science in Mechanical Engineering from the University of California, Los Angeles
Experience and expertise: Deven has worked with Smartgroup for 16 years. He was appointed Managing Director and CEO of Smartgroup Corporation in 2014. Prior to that he was Managing Director and CEO of Smartsalary Pty Limited, a position he held from 2002. Deven began his career as an engineering consultant, before transitioning to management consulting with Booz Allen Hamilton.
Other current directorships: None
Former directorships (last 3 years): None
Special responsibilities: None
Interests in shares: 2,000,000
Interests in options: 1,032,449
2 6 4 1 5 3
Smartgroup Corporation Ltd | 17
Annual Report 2015
John Prendiville | Non-Executive Director
Qualifications: John holds a Bachelor of Science (Hons in Astrophysics) and Master of Business Administration from the University of Western Australia and the Institute for International Finance in Japan, respectively.
Experience and expertise: John is currently a Director of the University of Notre Dame (and member of the University’s Audit and Finance Committee) and Chairman elect of the privately-owned Global Advanced Metals Limited (and member of the company’s Audit and Finance Committee). John was previously a director of the private vocational education provider, AVANA Group Pty Ltd. After a 20 year tenure, John retired from Macquarie Group Limited in 2011 having held various senior roles at the Bank, including as Head of a Global Industry sector and finally as Chairman of Macquarie Capital (Australia) Limited.
Other current directorships: None
Former directorships (last 3 years): Chairman of Kina Petroleum Limited (ASX: KPL)
Special responsibilities: Chairman of Audit and Risk Committee and Member of Human Resources and Remuneration Committee
Interests in shares: 846,476
Interests in options: None
Gavin Bell | Non-Executive Director
Qualifications: Gavin holds a Bachelor of Laws from the University of Sydney and Master of Business Administration (Executive) from the Australian Graduate School of Management.
Experience and expertise: Gavin is a director of IVE Group Limited. He is also a member of iCare NSW. Gavin was Managing Partner and Chief Executive Officer of law firm Herbert Smith Freehills (formerly Freehills), a position he held since 2005. He retired from these positions in 2014.
Other current directorships: None
Former directorships (last 3 years): None
Special responsibilities: Chairman of Human Resources and Remuneration Committee and Member of Audit and Risk Committee
Interests in shares: 72,708
Interests in options: None
Andrew Bolam | Non-Executive Director
Qualifications: Andrew holds a Bachelor of Commerce from the University of Tasmania and is a Certified Practicing Accountant (CPA).
Experience and expertise: Andrew has more than 20 years of experience in financial and general management. He is currently the Chief Financial Officer of Fetch TV Pty Ltd. Previously he was the Chief Financial Officer of Usaha Tegas, a private investment holding company based in Malaysia. He was also Commercial Director of Bumi Armada Berhad, an associate of Usaha Tegas group. Andrew was the Chief Financial Officer of Astro All Asia Networks plc (the then holding company of MEASAT Broadcast Network Systems Sdn Bhd which launched the Astro Pay-TV services) shortly following its launch in late 1996.
Other current directorships: None
Former directorships (last 3 years): None
Special responsibilities: Member of Audit and Risk Committee and Member of Human Resources and Remuneration Committee
Interests in shares: 155,000
Interests in options: None
Ian Watt AO | Non-Executive Director
Qualifications: Ian holds a Bachelor of Commerce from the University of Melbourne and a Masters of Economics and Ph D in Economics from La Trobe University. He has also completed the Advanced Management Program at Harvard Business School.
Experience and expertise: Ian has worked for nearly 20 years at very senior levels of the Australian public service. His most recent appointment was as Secretary of the Department of Prime Minister and Cabinet and head of the Australian Public Service, a position he held from 2011 to 2014. Prior to that he was Secretary of the Departments of Defence, Finance, and Communications, Information Technology and the Arts between 2001 and 2011. Before that he was Deputy Secretary of the Department of the Prime Minister and Cabinet. Ian is currently the Chair of the National Innovation and Science Agenda Implementation Committee, and of the International Centre for Democratic Partnerships. Ian is on the boards of Citigroup Pty Ltd, the Grattan Institute (University of Melbourne) and O’Connell Street Associates Pty Ltd, and is a member of the Australian National Audit Office Audit Committee. Ian is also a member of Male Champions of Change.
Other current directorships: None
Former directorships (last 3 years): None
Special responsibilities: Member of Audit and Risk Committee
Interests in shares: 10,000
‘Other current directorships’ quoted above are current directorships for listed entities only and excludes directorships of all other types of entities, unless otherwise stated.
‘Former directorships (last 3 years’) quoted above are directorships held in the last 3 years for listed entities only and excludes directorships of all other types of entities, unless otherwise stated.
Smartgroup Corporation Ltd | 18
Annual Report 2015
Company secretaries
Timothy Looi | Chief Financial Officer and Joint Company Secretary
Timothy joined the Group in 2009 and is responsible for the finance and corporate development functions. Tim previously worked for Aristocrat Leisure Limited in various senior management roles and prior to that for PricewaterhouseCoopers in Sydney and London. Tim holds a Bachelor of Economics from The University of Sydney and is a member of Chartered Accountants Australia and New Zealand.
Amanda Morgan | General Counsel and Joint Company Secretary
Amanda was appointed as General Counsel and Company Secretary in June 2014. Amanda previously worked for IRESS Limited as General Counsel and prior to that for King & Wood Mallesons as a Senior Associate. Prior to that she worked at Minter Ellison. Amanda holds a Bachelor of Laws and Bachelor of Commerce from the University of Melbourne, a Graduate Diploma of Applied Finance from Securities Institute of Australia, and a Certificate of Governance Practice from the Governance Institute of Australia.
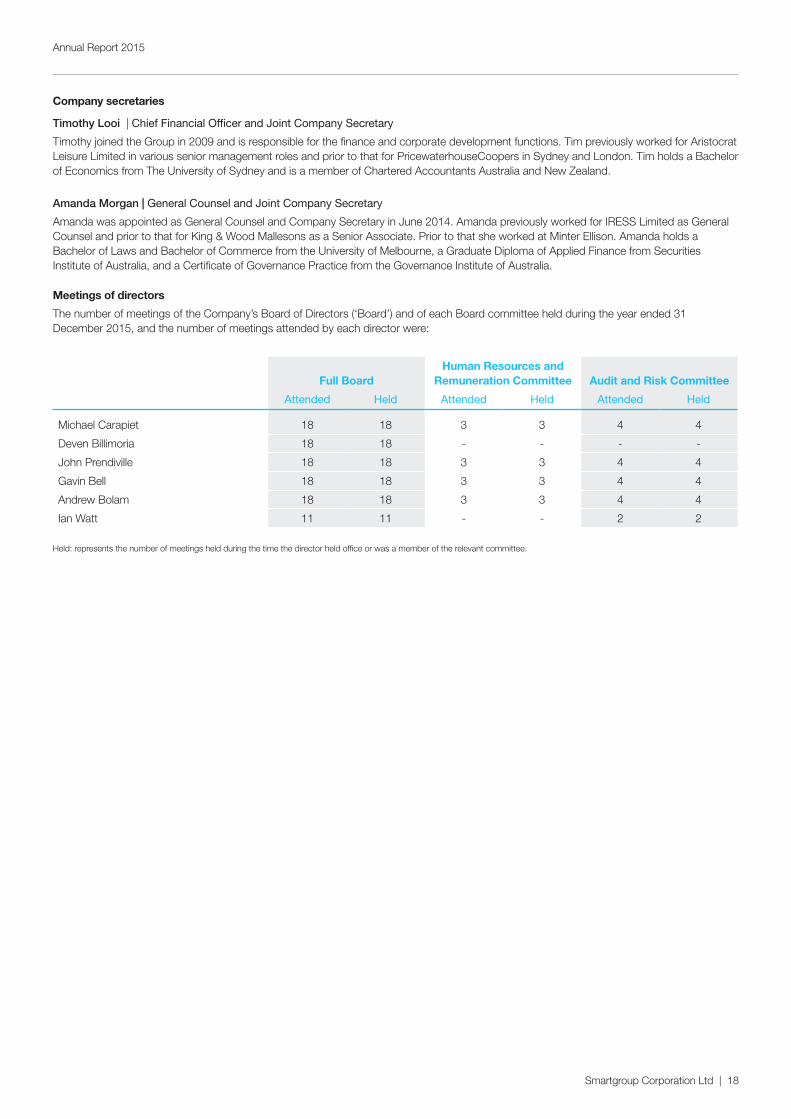
Meetings of directors
The number of meetings of the Company’s Board of Directors (‘Board’) and of each Board committee held during the year ended 31 December 2015, and the number of meetings attended by each director were:
Full BoardHuman Resources and
Remuneration Committee Audit and Risk Committee
Attended Held Attended Held Attended Held
Michael Carapiet 18 18 3 3 4 4
Deven Billimoria 18 18 - - - -
John Prendiville 18 18 3 3 4 4
Gavin Bell 18 18 3 3 4 4
Andrew Bolam 18 18 3 3 4 4
Ian Watt 11 11 - - 2 2
Held: represents the number of meetings held during the time the director held office or was a member of the relevant committee.
Smartgroup Corporation Ltd | 19
Annual Report 2015
The remuneration report, which has been audited, describes the remuneration arrangements for the Key Management Personnel (‘KMP’) of the Group, in accordance with the requirements of the Corporations Act 2001 and its regulations.
Introduction
The Remuneration Report is designed to provide shareholders with an understanding of Smartgroup’s remuneration policies, and the link between the Group’s remuneration philosophy, and strategy. The Remuneration Report specifically focuses on the Smartgroup remuneration arrangements for 2015.
The Group’s remuneration policies and practices are designed to align the interests of staff and shareholders while attracting and retaining staff members who are critical to the organisation’s growth and success. The objective of the Group’s executive reward framework is to ensure that reward for performance is competitive and appropriate for the results delivered. The framework aligns executive reward with the achievement of strategic objectives and the creation of value for shareholders. Its design conforms to market practice for delivery of reward.
At the Annual General Meeting (‘AGM’) held in April 2015, the remuneration framework received strong support from shareholders, with a very strong majority vote in favour of the resolution to adopt the 2014 Remuneration Report.
The Remuneration Report is set out under the following main headings:
• Principles used to determine the nature and amount of remuneration,
• Details of remuneration,
• Service agreements,
• Share-based compensation, and
• Additional disclosures relating to KMP.
Principles used to determine the nature and amount of remuneration
The objective of the Group’s executive reward framework is to ensure that reward for performance is competitive and appropriate for the results delivered. The Board ensures that executive reward satisfies the following key criteria for good governance practices:
• Competitiveness and reasonableness,
• Acceptability to shareholders,
• Performance linkage / alignment of executive compensation, and
• Transparency.
The performance of the Group depends on the quality of its directors and executives. The aim of the remuneration strategy is to attract, motivate and retain high performing and high quality personnel. The strategy also aims to encourage management to strive for superior performance by rewarding the achievement of targets which are challenging, clearly understood, and within the control of individuals to achieve through their own actions.
The Company has a Human Resources and Remuneration Committee (‘HRRC’), whose role is to assist the Board in fulfilling its corporate governance responsibilities and to review and make recommendations in relation to the remuneration arrangements for its directors and executives. The HRRC must have at least three members, a majority of whom must be independent non-executive directors.
The HRRC has structured an executive remuneration framework that is market-competitive and complementary to the reward strategy of the Group. The Group considers that its remuneration framework is the culmination of a thorough and considered review process over the last four years. At the time of the IPO in 2014, the Board sought advice as to appropriate remuneration packages for the executives.
Alignment to shareholders’ interests:
The remuneration strategy:
• focuses on sustained growth meeting Earnings Before Interest, Taxation and Amortisation (‘EBITA’) and net profit after tax, adjusted to exclude the non-cash tax effected amortisation of intangibles (‘NPATA’) as set by the Board, as well as focusing the executive on key non-financial drivers of value, and
• is intended to attract and retain high calibre executives.
Remuneration report (audited)
Smartgroup Corporation Ltd | 20
Annual Report 2015
Alignment to executives’ interests:
The remuneration strategy:
• Rewards capability and experience,
• Reflects competitive reward for contribution to growth in shareholder wealth, and
• Provides a clear structure for earning rewards.
In accordance with best practice corporate governance, the structure of non-executive directors’ and executives’ remuneration is separate.
A. Non-executive directors remuneration
Fees and payments to non-executive directors reflect the demands which are made on, and the responsibilities of, these directors. The Board decides the total amount paid to each non-executive director as remuneration for their services as a director. The total amount of fees paid to all directors for their services (excluding, for these purposes, the salary of any executive director) must not exceed in aggregate in any financial year the amount fixed by the Company in general meeting. The aggregate annual remuneration for non-executive directors was fixed in 2014 at $1,000,000. The fees paid are $200,000 per annum for the chairman and $90,000 per annum for each non-executive director. In addition to the above, the chairpersons of the Audit and Risk Committee and Human Resources and Remuneration Committee respectively are paid $20,000 annually for the services provided to each of those committees. Each member of a committee (other than the chairperson) is paid $10,000 annually for the services provided to that committee.
In addition to the fees, in each case superannuation contribution and Goods and Services Tax, if any, are paid. There are no retirement benefit schemes for non-executive directors, other than statutory superannuation contributions. Any change to that aggregate annual sum needs to be approved by shareholders. The aggregate sum includes any special and additional remuneration for special exertions and additional services performed by a director as determined appropriate by the Board. Directors may be paid additional or substituted remuneration if they, at the request of the Board, and for the purpose of the Company, perform any additional or special duties.
No change has been made to the non-executive directors’ remuneration since the listing of the company in July 2014.
B. Executive remuneration
The Group aims to reward executives with a level and mix of remuneration based on their position and responsibility, which has both fixed and variable components.
The executive remuneration and reward framework has four components:
• Current base pay and non-monetary benefits,
• Short-term performance incentives,
• Long-term performance incentives, and
• Other statutory entitlements remuneration such as superannuation and long service leave.
The combination of these comprises the executive’s total remuneration.
a) Fixed remunerationFixed remuneration, consisting of base salary, superannuation and non-monetary benefits, is reviewed annually by the HRRC, based on individual and business unit performance, the overall performance of the Group and comparable market remuneration. As noted above, the Board sought advice in 2014 as to appropriate fixed remuneration for executives.
b) Short term incentive plan (STIP)The CEO and the KMP are eligible to participate in the STIP in a manner determined by the Board from time to time. The STIP puts a proportion of the remuneration “at risk” subject to meeting specific pre-determined performance measures linked to corporate objectives and subject to Board approval. This aligns employee interests with the Group’s financial performance, as well as the Group’s organisational values. As with fixed remuneration, the Board and the HRRC rely on comparative data from companies of a similar size. In addition, data from competitor companies has been considered, to ensure that the STIP remains competitive and attractive, to incentivise the executive team to stay and strive for exceptional performance.
Participants in the STIP have a target cash payment which is set every year as a percentage of their total fixed annual remuneration. In 2015 it was subject to a maximum target of 60% for the CEO and 30% for each other member of the executive management team (‘EMT’). The EMT are all the KMP of the Company (other than the directors).
Payments under the STIP in any given year depend on the achievement of a range of financial and non-financial key performance indicators and objectives (‘KPIs’) as approved by the Board on an annual basis. These KPIs are tested annually after the end of the relevant year. The 2015 STIP provided for financial and non-financial KPIs to be weighted at 60% and 40% respectively.
Smartgroup Corporation Ltd | 21
Annual Report 2015
Financial KPI:
The financial KPI is required to be met by all members of the KMP. The financial KPI under the 2015 STIP required the Group to meet the NPATA target set by the Board for 2015. The financial performance of the Group was very strong and NPATA was well in excess of the target set by the Board. Accordingly this KPI was satisfied.
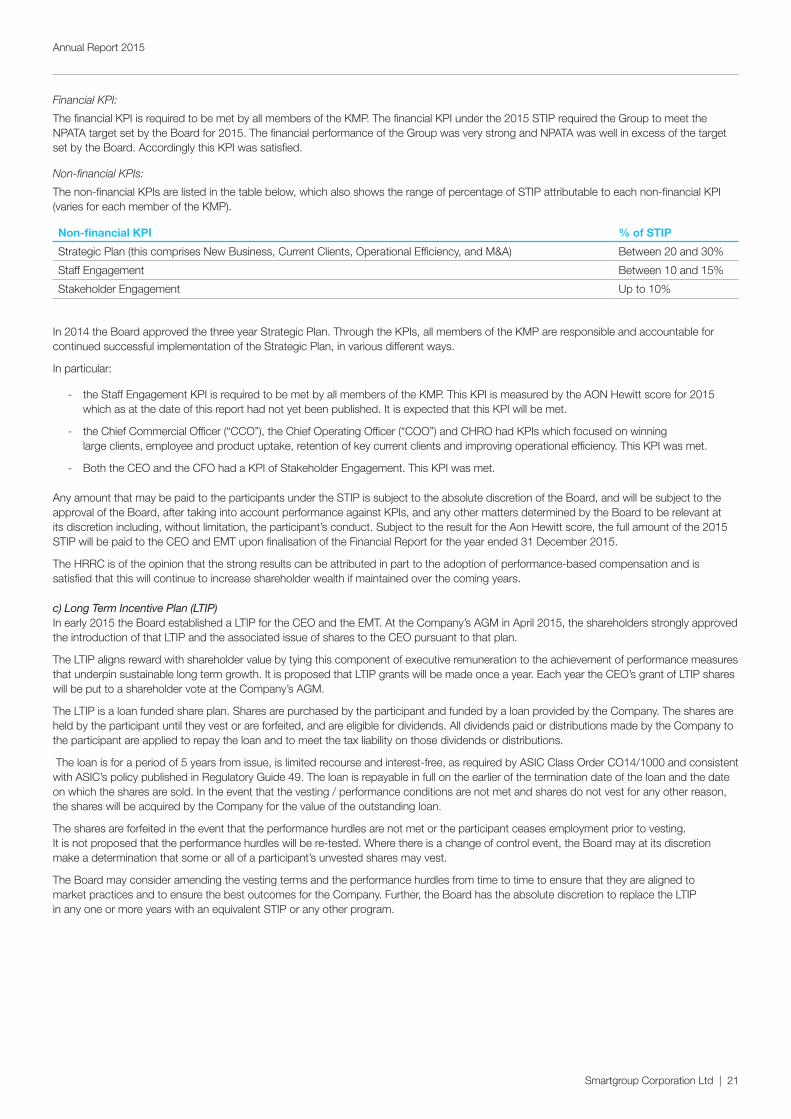
Non-financial KPIs:
The non-financial KPIs are listed in the table below, which also shows the range of percentage of STIP attributable to each non-financial KPI (varies for each member of the KMP).
Non-financial KPI % of STIP
Strategic Plan (this comprises New Business, Current Clients, Operational Efficiency, and M&A) Between 20 and 30%
Staff Engagement Between 10 and 15%
Stakeholder Engagement Up to 10%
In 2014 the Board approved the three year Strategic Plan. Through the KPIs, all members of the KMP are responsible and accountable for continued successful implementation of the Strategic Plan, in various different ways.
In particular:
- the Staff Engagement KPI is required to be met by all members of the KMP. This KPI is measured by the AON Hewitt score for 2015 which as at the date of this report had not yet been published. It is expected that this KPI will be met.
- the Chief Commercial Officer (“CCO”), the Chief Operating Officer (“COO”) and CHRO had KPIs which focused on winning large clients, employee and product uptake, retention of key current clients and improving operational efficiency. This KPI was met.
- Both the CEO and the CFO had a KPI of Stakeholder Engagement. This KPI was met.
Any amount that may be paid to the participants under the STIP is subject to the absolute discretion of the Board, and will be subject to the approval of the Board, after taking into account performance against KPIs, and any other matters determined by the Board to be relevant at its discretion including, without limitation, the participant’s conduct. Subject to the result for the Aon Hewitt score, the full amount of the 2015 STIP will be paid to the CEO and EMT upon finalisation of the Financial Report for the year ended 31 December 2015.
The HRRC is of the opinion that the strong results can be attributed in part to the adoption of performance-based compensation and is satisfied that this will continue to increase shareholder wealth if maintained over the coming years.
c) Long Term Incentive Plan (LTIP)In early 2015 the Board established a LTIP for the CEO and the EMT. At the Company’s AGM in April 2015, the shareholders strongly approved the introduction of that LTIP and the associated issue of shares to the CEO pursuant to that plan.
The LTIP aligns reward with shareholder value by tying this component of executive remuneration to the achievement of performance measures that underpin sustainable long term growth. It is proposed that LTIP grants will be made once a year. Each year the CEO’s grant of LTIP shares will be put to a shareholder vote at the Company’s AGM.
The LTIP is a loan funded share plan. Shares are purchased by the participant and funded by a loan provided by the Company. The shares are held by the participant until they vest or are forfeited, and are eligible for dividends. All dividends paid or distributions made by the Company to the participant are applied to repay the loan and to meet the tax liability on those dividends or distributions.
The loan is for a period of 5 years from issue, is limited recourse and interest-free, as required by ASIC Class Order CO14/1000 and consistent with ASIC’s policy published in Regulatory Guide 49. The loan is repayable in full on the earlier of the termination date of the loan and the date on which the shares are sold. In the event that the vesting / performance conditions are not met and shares do not vest for any other reason, the shares will be acquired by the Company for the value of the outstanding loan.
The shares are forfeited in the event that the performance hurdles are not met or the participant ceases employment prior to vesting. It is not proposed that the performance hurdles will be re-tested. Where there is a change of control event, the Board may at its discretion make a determination that some or all of a participant’s unvested shares may vest.
The Board may consider amending the vesting terms and the performance hurdles from time to time to ensure that they are aligned to market practices and to ensure the best outcomes for the Company. Further, the Board has the absolute discretion to replace the LTIP in any one or more years with an equivalent STIP or any other program.
Smartgroup Corporation Ltd | 22
Annual Report 2015
2015 grant under the LTIP
The number of shares granted is based on a target percentage of the relevant executive’s fixed remuneration. For 2015, the LTIP grant to the CEO and the EMT was targeted at 60% and 30% of fixed remuneration respectively, as determined by an independent valuation.
Under the 2015 LTIP grant, the EMT and the CEO purchased shares at $1.60 and $1.65 respectively, being the price which was the higher of the IPO issue price of $1.60 and the market value on the date of issue. (“Market value” was the 20 day volume weighted average price of shares up to and including the trading day immediately prior to the date of issue.) Under the 2015 LTIP grant, there were two applicable vesting periods. Accordingly, 50% of the shares will vest on 1 January 2017, with the remaining 50% vesting on 1 January 2018. The vesting of the shares is subject to two performance hurdles, being an earnings growth hurdle (based on NPATA per share) and a total shareholder return hurdle, explained below.
It should be noted that because the 2015 LTIP grant occurred in first year of the plan, and because the LTIP was introduced not long after the IPO, it had various features that will not appear in future grants. In particular, it is expected that for future grants the vesting period will be a minimum of three years. A dual vesting period was chosen in 2015 to deal with the fact that there was no LTIP in place at the time of the IPO, and the Board considered that it was fair and reasonable for 50% of the LTIP shares to vest after 2 years.
The hurdles are described below in relation to the 2015 grant, and were explained to shareholders in the 2015 Notice of Annual General Meeting and subsequently approved by shareholders. It is envisaged that each year the LTIP grant will have an EPS and TSR hurdle. However, there are features of the 2015 grant hurdles that occur in 2015 only, which are explained below. In particular, in order to ensure that the EPS hurdle remains sufficiently demanding, it is likely to be higher in the future.
The purchase price for the 2015 LTIP grant was set relative to the IPO price as a base. The purchase price will be reviewed for future grants.
As noted above, the Board may change any aspect of the LTIP in the future.
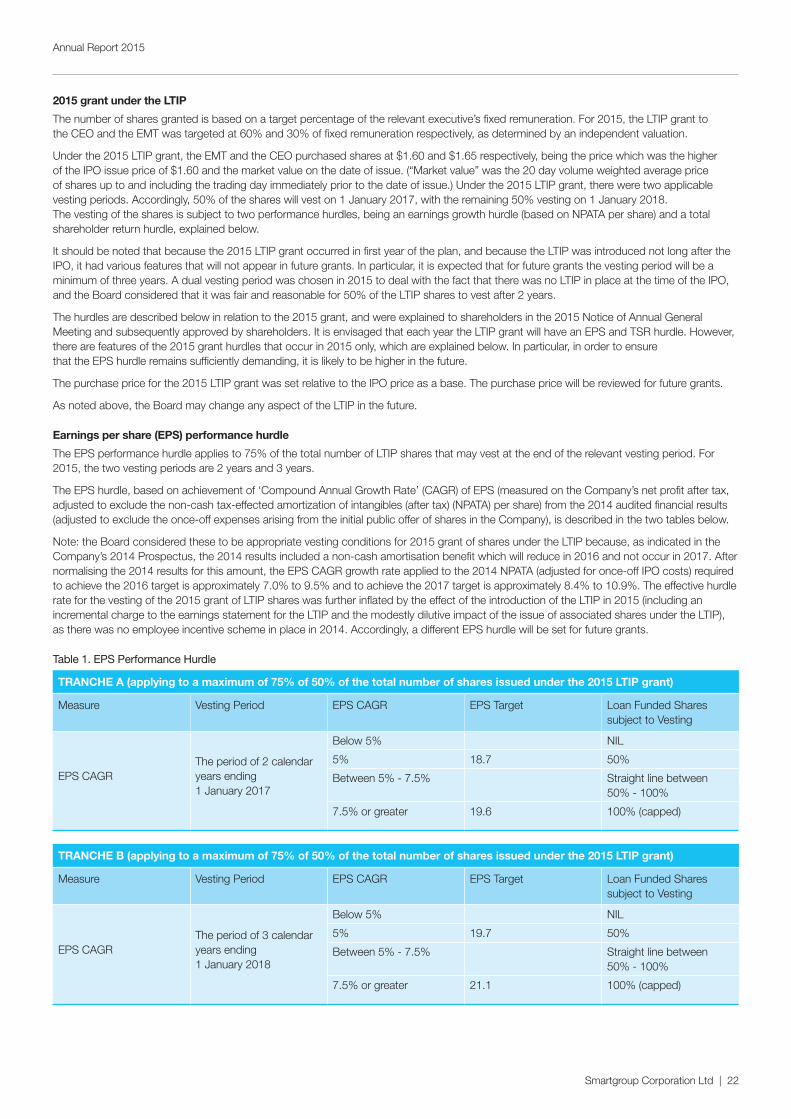
Earnings per share (EPS) performance hurdle
The EPS performance hurdle applies to 75% of the total number of LTIP shares that may vest at the end of the relevant vesting period. For 2015, the two vesting periods are 2 years and 3 years.
The EPS hurdle, based on achievement of ‘Compound Annual Growth Rate’ (CAGR) of EPS (measured on the Company’s net profit after tax, adjusted to exclude the non-cash tax-effected amortization of intangibles (after tax) (NPATA) per share) from the 2014 audited financial results (adjusted to exclude the once-off expenses arising from the initial public offer of shares in the Company), is described in the two tables below.
Note: the Board considered these to be appropriate vesting conditions for 2015 grant of shares under the LTIP because, as indicated in the Company’s 2014 Prospectus, the 2014 results included a non-cash amortisation benefit which will reduce in 2016 and not occur in 2017. After normalising the 2014 results for this amount, the EPS CAGR growth rate applied to the 2014 NPATA (adjusted for once-off IPO costs) required to achieve the 2016 target is approximately 7.0% to 9.5% and to achieve the 2017 target is approximately 8.4% to 10.9%. The effective hurdle rate for the vesting of the 2015 grant of LTIP shares was further inflated by the effect of the introduction of the LTIP in 2015 (including an incremental charge to the earnings statement for the LTIP and the modestly dilutive impact of the issue of associated shares under the LTIP), as there was no employee incentive scheme in place in 2014. Accordingly, a different EPS hurdle will be set for future grants.
Table 1. EPS Performance Hurdle
TRANCHE A (applying to a maximum of 75% of 50% of the total number of shares issued under the 2015 LTIP grant)
Measure Vesting Period EPS CAGR EPS Target Loan Funded Shares subject to Vesting
EPS CAGRThe period of 2 calendar years ending 1 January 2017
Below 5% NIL
5% 18.7 50%
Between 5% - 7.5% Straight line between 50% - 100%
7.5% or greater 19.6 100% (capped)
TRANCHE B (applying to a maximum of 75% of 50% of the total number of shares issued under the 2015 LTIP grant)
Measure Vesting Period EPS CAGR EPS Target Loan Funded Shares subject to Vesting
EPS CAGRThe period of 3 calendar years ending 1 January 2018
Below 5% NIL
5% 19.7 50%
Between 5% - 7.5% Straight line between 50% - 100%
7.5% or greater 21.1 100% (capped)
Smartgroup Corporation Ltd | 23
Annual Report 2015
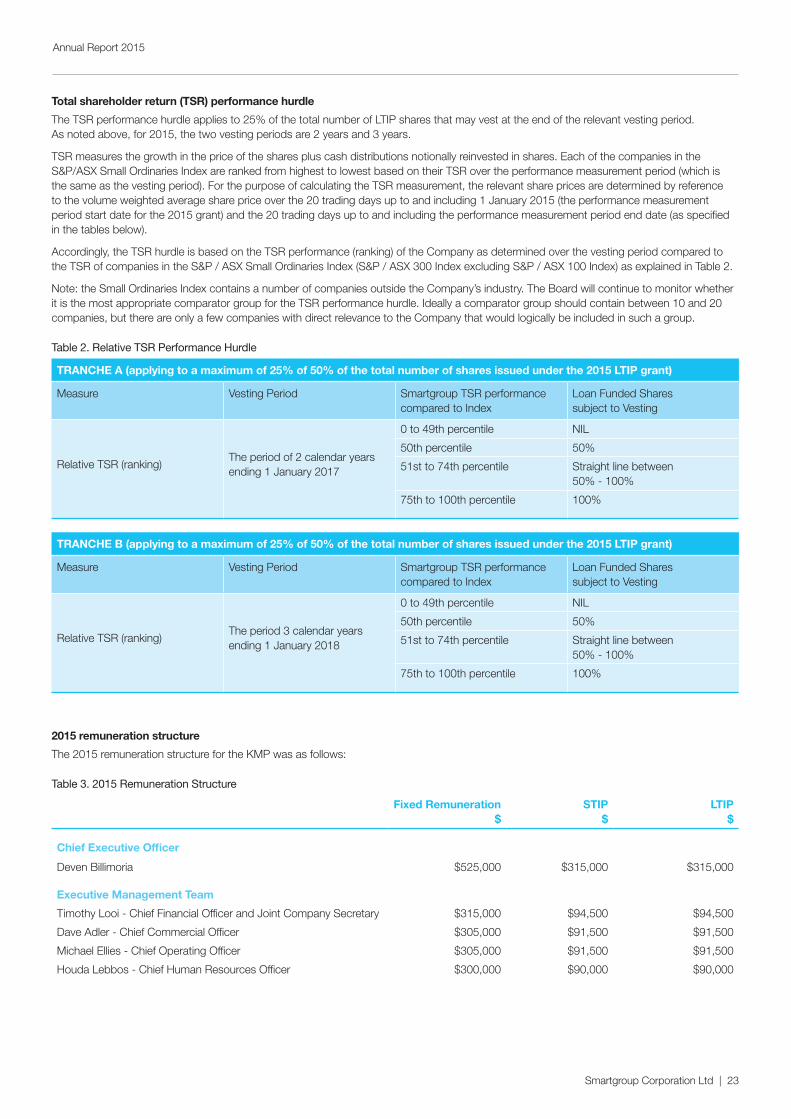
Total shareholder return (TSR) performance hurdle
The TSR performance hurdle applies to 25% of the total number of LTIP shares that may vest at the end of the relevant vesting period. As noted above, for 2015, the two vesting periods are 2 years and 3 years.
TSR measures the growth in the price of the shares plus cash distributions notionally reinvested in shares. Each of the companies in the S&P/ASX Small Ordinaries Index are ranked from highest to lowest based on their TSR over the performance measurement period (which is the same as the vesting period). For the purpose of calculating the TSR measurement, the relevant share prices are determined by reference to the volume weighted average share price over the 20 trading days up to and including 1 January 2015 (the performance measurement period start date for the 2015 grant) and the 20 trading days up to and including the performance measurement period end date (as specified in the tables below).
Accordingly, the TSR hurdle is based on the TSR performance (ranking) of the Company as determined over the vesting period compared to the TSR of companies in the S&P / ASX Small Ordinaries Index (S&P / ASX 300 Index excluding S&P / ASX 100 Index) as explained in Table 2.
Note: the Small Ordinaries Index contains a number of companies outside the Company’s industry. The Board will continue to monitor whether it is the most appropriate comparator group for the TSR performance hurdle. Ideally a comparator group should contain between 10 and 20 companies, but there are only a few companies with direct relevance to the Company that would logically be included in such a group.
Table 2. Relative TSR Performance Hurdle
TRANCHE A (applying to a maximum of 25% of 50% of the total number of shares issued under the 2015 LTIP grant)
Measure Vesting Period Smartgroup TSR performance compared to Index
Loan Funded Shares subject to Vesting
Relative TSR (ranking)The period of 2 calendar years ending 1 January 2017
0 to 49th percentile NIL
50th percentile 50%
51st to 74th percentile Straight line between 50% - 100%
75th to 100th percentile 100%
TRANCHE B (applying to a maximum of 25% of 50% of the total number of shares issued under the 2015 LTIP grant)
Measure Vesting Period Smartgroup TSR performance compared to Index
Loan Funded Shares subject to Vesting
Relative TSR (ranking)The period 3 calendar years ending 1 January 2018
0 to 49th percentile NIL
50th percentile 50%
51st to 74th percentile Straight line between 50% - 100%
75th to 100th percentile 100%
2015 remuneration structure
The 2015 remuneration structure for the KMP was as follows:
Table 3. 2015 Remuneration Structure
Fixed Remuneration $
STIP $
LTIP $
Chief Executive Officer
Deven Billimoria $525,000 $315,000 $315,000
Executive Management Team
Timothy Looi - Chief Financial Officer and Joint Company Secretary $315,000 $94,500 $94,500
Dave Adler - Chief Commercial Officer $305,000 $91,500 $91,500
Michael Ellies - Chief Operating Officer $305,000 $91,500 $91,500
Houda Lebbos - Chief Human Resources Officer $300,000 $90,000 $90,000
Smartgroup Corporation Ltd | 24
Annual Report 2015
Use of remuneration consultants
As noted in last year’s Annual Report, in 2014 the Group engaged Towers Watson Australia Pty Ltd (Towers Watson’), remuneration consultants. One of the engagements was to provide advice on the implementation of the LTIP, and that continued into 2015. Towers Watson was paid a total of $68,200 for these services during the year ended 31 December 2015.
That engagement was arranged and supervised directly by the Chair of the HRRC. Recommendations and advice were discussed directly with the Chair and/or the Board. Towers Watson has provided a formal declaration confirming that their recommendations were made free from any undue influence by members of the KMP.
As a consequence of the above, the Board is satisfied that the recommendations by Towers Watson were made free from any undue influence by any member of the KMP.
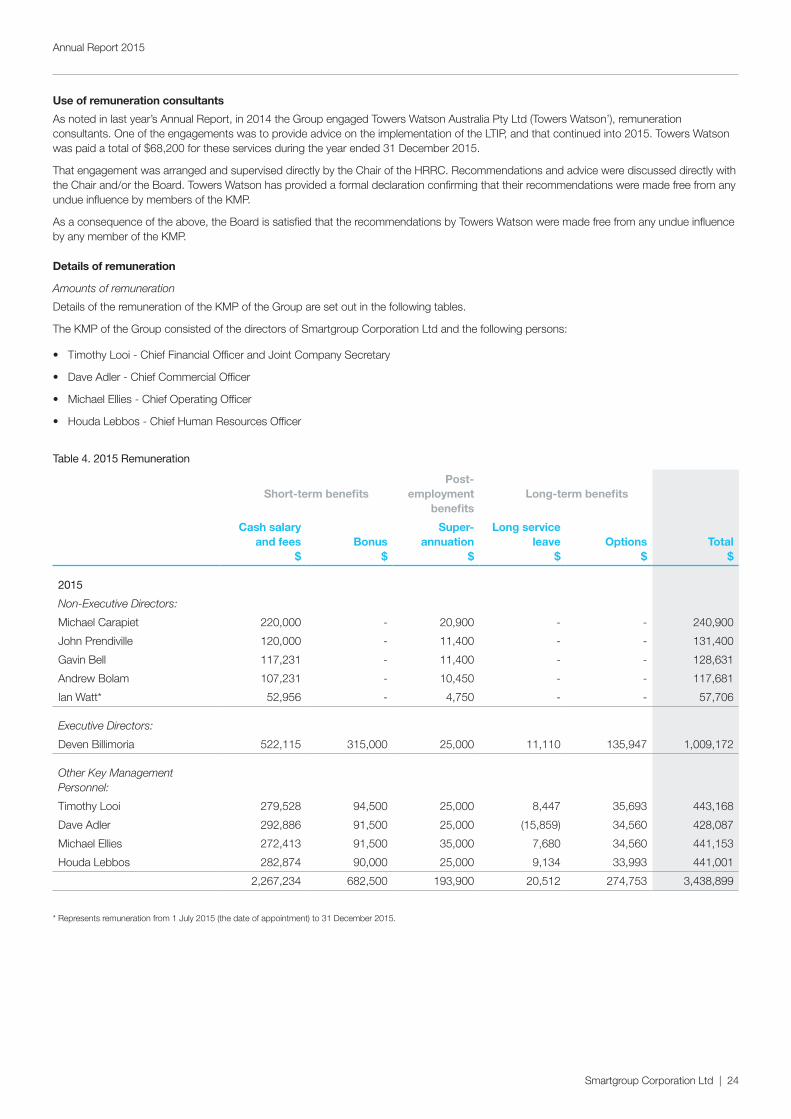
Details of remuneration
Amounts of remuneration
Details of the remuneration of the KMP of the Group are set out in the following tables.
The KMP of the Group consisted of the directors of Smartgroup Corporation Ltd and the following persons:
• Timothy Looi - Chief Financial Officer and Joint Company Secretary
• Dave Adler - Chief Commercial Officer
• Michael Ellies - Chief Operating Officer
• Houda Lebbos - Chief Human Resources Officer
Table 4. 2015 Remuneration
Short-term benefitsPost-
employment benefits
Long-term benefits
Cash salary and fees
$Bonus
$
Super-annuation
$
Long service leave
$Options
$Total
$
2015
Non-Executive Directors:
Michael Carapiet 220,000 - 20,900 - - 240,900
John Prendiville 120,000 - 11,400 - - 131,400
Gavin Bell 117,231 - 11,400 - - 128,631
Andrew Bolam 107,231 - 10,450 - - 117,681
Ian Watt* 52,956 - 4,750 - - 57,706
Executive Directors:
Deven Billimoria 522,115 315,000 25,000 11,110 135,947 1,009,172
Other Key Management Personnel:
Timothy Looi 279,528 94,500 25,000 8,447 35,693 443,168
Dave Adler 292,886 91,500 25,000 (15,859) 34,560 428,087
Michael Ellies 272,413 91,500 35,000 7,680 34,560 441,153
Houda Lebbos 282,874 90,000 25,000 9,134 33,993 441,001
2,267,234 682,500 193,900 20,512 274,753 3,438,899
* Represents remuneration from 1 July 2015 (the date of appointment) to 31 December 2015.
Smartgroup Corporation Ltd | 25
Annual Report 2015
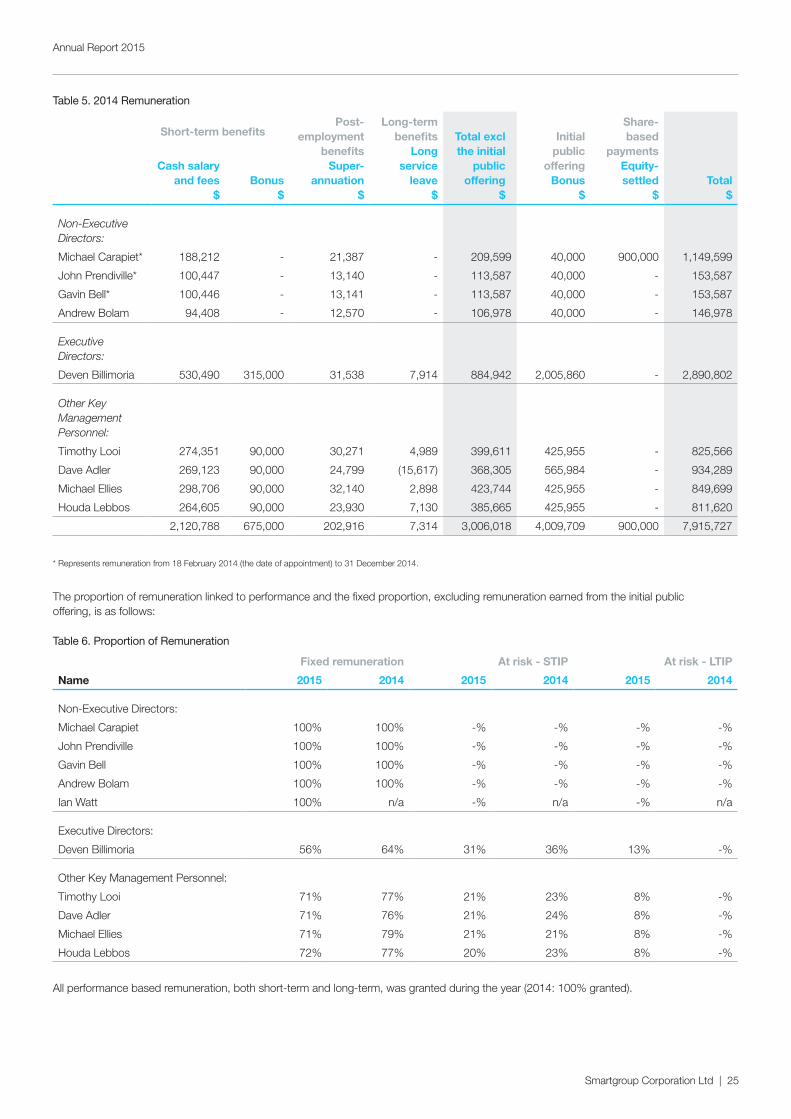
Table 5. 2014 Remuneration
Short-term benefitsPost-
employment benefits
Super-annuation
$
Long-term benefits
Long service
leave $
Total excl the initial
public offering
$
Initial public
offering Bonus
$
Share-based
payments Equity- settled
$Total
$
Cash salary and fees
$Bonus
$
Non-Executive Directors:
Michael Carapiet* 188,212 - 21,387 - 209,599 40,000 900,000 1,149,599
John Prendiville* 100,447 - 13,140 - 113,587 40,000 - 153,587
Gavin Bell* 100,446 - 13,141 - 113,587 40,000 - 153,587
Andrew Bolam 94,408 - 12,570 - 106,978 40,000 - 146,978
Executive Directors:
Deven Billimoria 530,490 315,000 31,538 7,914 884,942 2,005,860 - 2,890,802
Other Key Management Personnel:
Timothy Looi 274,351 90,000 30,271 4,989 399,611 425,955 - 825,566
Dave Adler 269,123 90,000 24,799 (15,617) 368,305 565,984 - 934,289
Michael Ellies 298,706 90,000 32,140 2,898 423,744 425,955 - 849,699
Houda Lebbos 264,605 90,000 23,930 7,130 385,665 425,955 - 811,620
2,120,788 675,000 202,916 7,314 3,006,018 4,009,709 900,000 7,915,727
* Represents remuneration from 18 February 2014 (the date of appointment) to 31 December 2014.
The proportion of remuneration linked to performance and the fixed proportion, excluding remuneration earned from the initial public offering, is as follows:
Table 6. Proportion of Remuneration
Fixed remuneration At risk - STIP At risk - LTIP
Name 2015 2014 2015 2014 2015 2014
Non-Executive Directors:
Michael Carapiet 100% 100% -% -% -% -%
John Prendiville 100% 100% -% -% -% -%
Gavin Bell 100% 100% -% -% -% -%
Andrew Bolam 100% 100% -% -% -% -%
Ian Watt 100% n/a -% n/a -% n/a
Executive Directors:
Deven Billimoria 56% 64% 31% 36% 13% -%
Other Key Management Personnel:
Timothy Looi 71% 77% 21% 23% 8% -%
Dave Adler 71% 76% 21% 24% 8% -%
Michael Ellies 71% 79% 21% 21% 8% -%
Houda Lebbos 72% 77% 20% 23% 8% -%
All performance based remuneration, both short-term and long-term, was granted during the year (2014: 100% granted).
Smartgroup Corporation Ltd | 26
Annual Report 2015
Service agreements
Non-executive directors
Non-executive directors do not have fixed term contracts with the Company. On appointment to the Board, all non-executive directors enter into a service agreement with the Company in the form of a letter of appointment. The letter summarises the Board policies and terms, including compensation.
Remuneration and other terms of employment for the executive director are formalised in service agreements. Details of these agreements are as follows:
Name: Deven Billimoria
Title: Chief Executive Officer
Agreement commenced: 1 June 2014
Term of agreement: Open ended
Details: Deven Billimoria is entitled to:
• Receive fixed annual remuneration of $540,750 inclusive of superannuation contributions, and
• Participate in the STIP with target participation under the STIP capped at a maximum of 60% of his fixed annual remuneration. Payments under the STIP in any given year depend on the achievement of a range of financial and non-financial KPIs as approved by the Board on an annual basis.
• The employment contract may be terminated by either party giving 12 months written notice or in the case of the Group by payment in lieu of notice. The Group may terminate the employment contract immediately and without payment for notice or payment in lieu of notice in the event of serious misconduct or other specified circumstances. There is no entitlement to termination payments in the event of termination. Non-compete provisions upon termination of employment exist for a period of 12 months from the date of termination of employment, as determined by the Board (in its sole discretion), depending on the circumstances of termination. The enforceability of the restraint clause is subject to all usual legal requirements.
Other key management personnel
Other EMT have employment agreements setting out the terms and conditions of their employment. The agreements are not of a fixed duration. These agreements provide for:
• Total compensation inclusive of a base salary and superannuation contribution,
• Eligibility to participate in the STIP, with target participation in the STIP capped at a maximum of 30% of total fixed annual remuneration,
• Termination by either party giving three months written notice, or in the case of the Group, payment in lieu of notice,
• Immediate termination by the Group without payment in lieu of notice in the event of serious misconduct or other specific circumstances,
• Key management personnel have no entitlement to termination payments in the event of termination, and
• Non-compete provisions upon termination of employment for a maximum of six months from the date of termination of employment, as determined by the Board (in its sole discretion), depending on the circumstances of termination. The enforceability of the restraint clause is subject to all usual legal requirements.

Smartgroup Corporation Ltd | 27
Annual Report 2015
Share-based compensation
Bonus shares and cash offers
Details of shares issued to directors and other KMP as part of compensation during the year ended 31 December 2015 are set out below:
Table 7. Bonus Shares and Cash Offers
2015 Nil
2014Name Date Shares Issue price $
Michael Carapiet 2 July 2014 562,500 $1.60 900,000
Deven Billimoria 2 July 2014 626,831 $1.60 1,002,930
Timothy Looi 2 July 2014 133,111 $1.60 212,978
Dave Adler 2 July 2014 176,870 $1.60 282,992
Michael Ellies 2 July 2014 133,111 $1.60 212,978
Houda Lebbos 2 July 2014 133,111 $1.60 212,978
LTIP or Loan Funded Share Plan
As described above, the Board established an LTIP for the CEO and the EMT. The securities issued under the LTIP are not options. However, the terms of the LTIP are such that the benefits to participants are similar to the benefits that would be received had the participant been granted options – that is, the participant benefits from the increase in the market price over the purchase price of the share. Accordingly, the Company provides a summary below of the terms of the LTIP for the purposes of compliance with the Corporations Act in relation to the disclosure of details of options granted during 2015.
The terms and conditions of each grant of Loan Funded Shares (LFS) under the LTIP offer affecting remuneration in the current or a future reporting period are disclosed in Table 1 and Table 2
Table 8. Terms and Conditions of the LFS
Issue date of LFS*
Vesting period
Exercise date
Expiry date
Number of shares
granted under LTIP
Price of shares
granted under LTIP
Value of option at
grant date
Perfor- mance
achieved
% Vested at 31
December 2015
25 February 2015
2 calendar years to
1 January 2017
1 January 2017
31 December 2019
602,263 $1.60 $0.3050 To be determined
n/a
25 February 2015
3 calendar years to
1 January 2018
1 January 2018
31 December 2019
602,262 $1.60 $0.3052 To be determined
n/a
27 April 2015
2 calendar years to
1 January 2017
1 January 2017
31 December 2019
516,225 $1.65 $0.3988 To be determined
n/a
27 April 2015
3 calendar years to
1 January 2018
1 January 2018
31 December 2019
516,224 $1.65 $0.4015 To be determined
n/a
Refer to Table 1 and 2 for details of the performance hurdles applicable to the Loan Funded Shares.
There were no vested options as at 31 December 2014.
Smartgroup Corporation Ltd | 28
Annual Report 2015
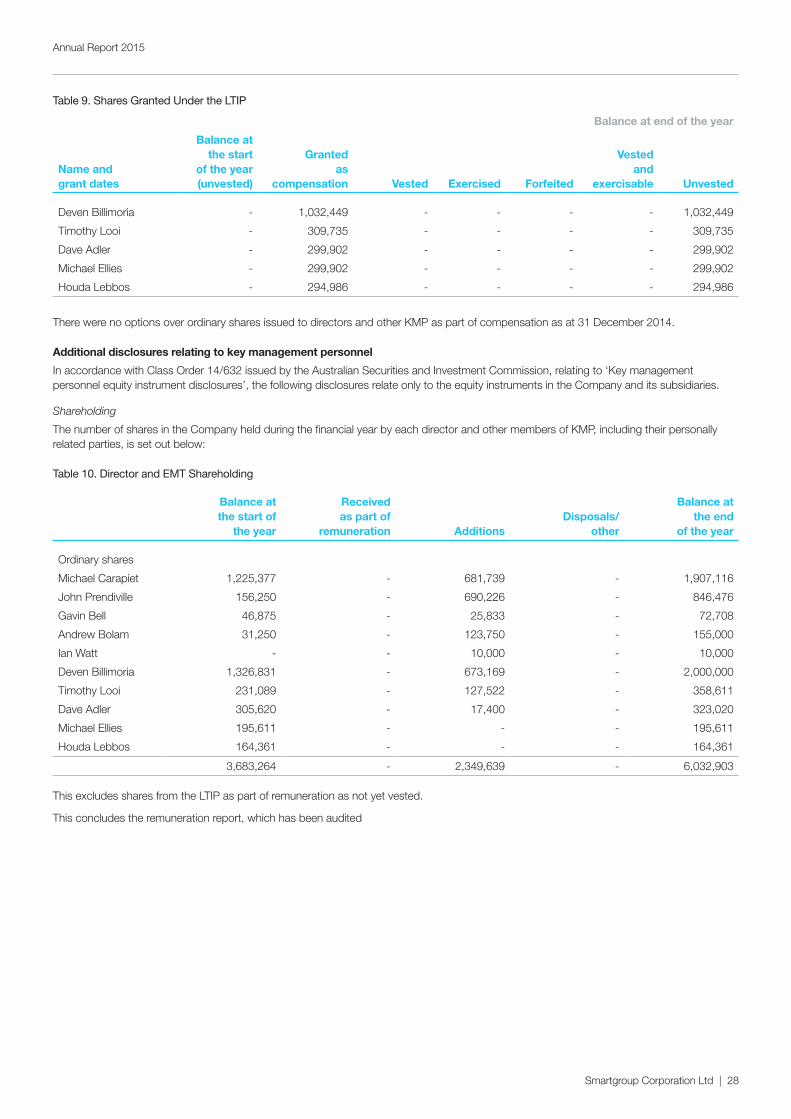
Table 9. Shares Granted Under the LTIP
Balance at end of the year
Name and grant dates
Balance at the start
of the year (unvested)
Granted as
compensation Vested Exercised Forfeited
Vested and
exercisable Unvested
Deven Billimoria - 1,032,449 - - - - 1,032,449
Timothy Looi - 309,735 - - - - 309,735
Dave Adler - 299,902 - - - - 299,902
Michael Ellies - 299,902 - - - - 299,902
Houda Lebbos - 294,986 - - - - 294,986
There were no options over ordinary shares issued to directors and other KMP as part of compensation as at 31 December 2014.
Additional disclosures relating to key management personnel
In accordance with Class Order 14/632 issued by the Australian Securities and Investment Commission, relating to ‘Key management personnel equity instrument disclosures’, the following disclosures relate only to the equity instruments in the Company and its subsidiaries.
Shareholding
The number of shares in the Company held during the financial year by each director and other members of KMP, including their personally related parties, is set out below:
Table 10. Director and EMT Shareholding
Balance at the start of
the year
Received as part of
remuneration AdditionsDisposals/
other
Balance at the end
of the year
Ordinary shares
Michael Carapiet 1,225,377 - 681,739 - 1,907,116
John Prendiville 156,250 - 690,226 - 846,476
Gavin Bell 46,875 - 25,833 - 72,708
Andrew Bolam 31,250 - 123,750 - 155,000
Ian Watt - - 10,000 - 10,000
Deven Billimoria 1,326,831 - 673,169 - 2,000,000
Timothy Looi 231,089 - 127,522 - 358,611
Dave Adler 305,620 - 17,400 - 323,020
Michael Ellies 195,611 - - - 195,611
Houda Lebbos 164,361 - - - 164,361
3,683,264 - 2,349,639 - 6,032,903
This excludes shares from the LTIP as part of remuneration as not yet vested.
This concludes the remuneration report, which has been audited
Smartgroup Corporation Ltd | 29
Annual Report 2015
Shares under option
There were 2,236,974 shares issued to employees under Loan Funded Share Plan (‘LTIP’). The LTIP shares are legally held by the employees, however they cannot deal in the shares until the vesting conditions are satisfied and the loan is fully repaid. These have been treated as options in accordance with AASB 2 ‘Share-based Payment’ issued by Australian Accounting Standards Board.
Shares issued on the exercise of options
There were no ordinary shares of Smartgroup Corporation Ltd issued on the exercise of options during the year ended 31 December 2015 and up to the date of this report.
Indemnity and insurance of officers
The Company has indemnified the directors and executives of the Company for costs incurred, in their capacity as a director or executive, for which they may be held personally liable, except where there is a lack of good faith. During the financial year, the Group paid a premium in respect of a contract to insure the directors and executives of the Company against a liability to the extent permitted by the Corporations Act 2001. The contract of insurance prohibits disclosure of the nature of the liability and the amount of the premium.
Indemnity and insurance of auditor
The Company has not, during or since the end of the year, indemnified or agreed to indemnify the auditor of the Company or any related entity against a liability incurred by the auditor. During the year, the Company has not paid a premium in respect of a contract to insure the auditor of the Company or any related entity.
Proceedings on behalf of the Company
No person has applied to the Court under section 237 of the Corporations Act 2001 for leave to bring proceedings on behalf of the Company, or to intervene in any proceedings to which the Company is a party for the purpose of taking responsibility on behalf of the Company for all or part of those proceedings.
Non-audit services
Details of the amounts paid or payable to the auditor for non-audit services provided during the financial year by the auditor are outlined in note 34 to the financial statements.
The directors are satisfied that the provision of non-audit services during the financial year, by the auditor (or by another person or firm on the auditor’s behalf), is compatible with the general standard of independence for auditors imposed by the Corporations Act 2001.
The directors are of the opinion that the services as disclosed in note 34 to the financial statements do not compromise the external auditor’s independence requirements of the Corporations Act 2001 for the following reasons:
• all non-audit services have been reviewed and approved to ensure that they do not impact the integrity and objectivity of the auditor; and
• none of the services undermine the general principles relating to auditor independence as set out in APES 110 Code of Ethics for Professional Accountants issued by the Accounting Professional and Ethical Standards Board, including reviewing or auditing the auditor’s own work, acting in a management or decision-making capacity for the Company, acting as advocate for the Company or jointly sharing economic risks and rewards.
Officers of the Company who are former partners of PricewaterhouseCoopers
There are no officers of the Company who are former partners of PricewaterhouseCoopers.
Rounding of amounts
The Company is of a kind referred to in Class Order 98/100, issued by the Australian Securities and Investments Commission, relating to ‘rounding-off’. Amounts in this report have been rounded off in accordance with that Class Order to the nearest thousand dollars, or in certain cases, the nearest dollar.
Auditor’s independence declaration
A copy of the auditor’s independence declaration as required under section 307C of the Corporations Act 2001 is set out on the following page.
Auditor
PricewaterhouseCoopers continues in office in accordance with section 327 of the Corporations Act 2001.
This report is made in accordance with a resolution of directors, pursuant to section 298(2)(a) of the Corporations Act 2001.
On behalf of the directors,
Michael Carapiet Chairman 24 February 2016, Sydney
Smartgroup Corporation Ltd | 30
Annual Report 2015
PricewaterhouseCoopers, ABN 52 780 433 757 Darling Park Tower 2, 201 Sussex Street, GPO BOX 2650, SYDNEY NSW 1171 T: +61 2 8266 0000, F: +61 2 8266 9999, www.pwc.com.au Liability limited by a scheme approved under Professional Standards Legislation.
Auditor’s Independence Declaration
As lead auditor for the audit of Smartgroup Corporation Ltd for the year ended 31 December 2015, I declare that to the best of my knowledge and belief, there have been:
a) no contraventions of the auditor independence requirements of the Corporations Act 2001 in relation to the audit; and
b) no contraventions of any applicable code of professional conduct in relation to the audit.
This declaration is in respect of Smartgroup Corporation Ltd and the entities it controlled during the period.
Scott Walsh
Sydney Partner PricewaterhouseCoopers
24 February 2016
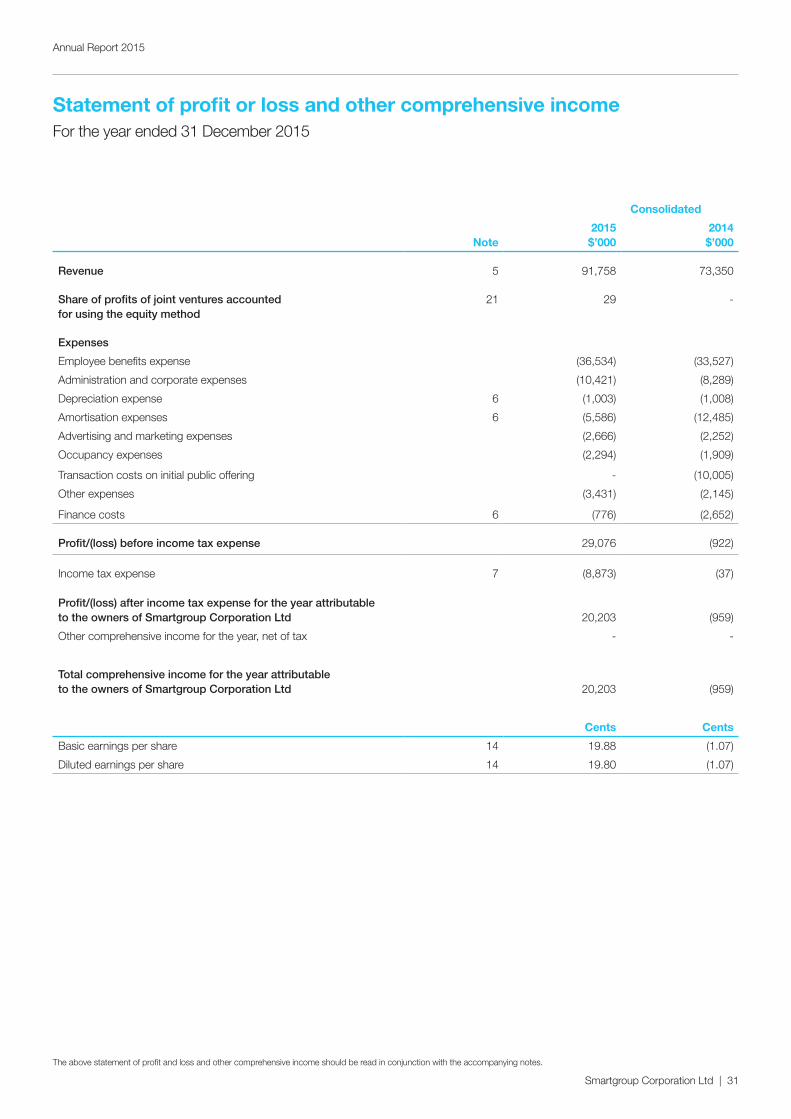
Smartgroup Corporation Ltd | 31
Annual Report 2015
Statement of profit or loss and other comprehensive incomeFor the year ended 31 December 2015
Consolidated
Note2015 $’000
2014 $’000
Revenue 5 91,758 73,350
Share of profits of joint ventures accounted for using the equity method
21 29 -
Expenses
Employee benefits expense (36,534) (33,527)
Administration and corporate expenses (10,421) (8,289)
Depreciation expense 6 (1,003) (1,008)
Amortisation expenses 6 (5,586) (12,485)
Advertising and marketing expenses (2,666) (2,252)
Occupancy expenses (2,294) (1,909)
Transaction costs on initial public offering - (10,005)
Other expenses (3,431) (2,145)
Finance costs 6 (776) (2,652)
Profit/(loss) before income tax expense 29,076 (922)
Income tax expense 7 (8,873) (37)
Profit/(loss) after income tax expense for the year attributable to the owners of Smartgroup Corporation Ltd 20,203 (959)
Other comprehensive income for the year, net of tax - -
Total comprehensive income for the year attributable to the owners of Smartgroup Corporation Ltd 20,203 (959)
Cents Cents
Basic earnings per share 14 19.88 (1.07)
Diluted earnings per share 14 19.80 (1.07)
The above statement of profit and loss and other comprehensive income should be read in conjunction with the accompanying notes.
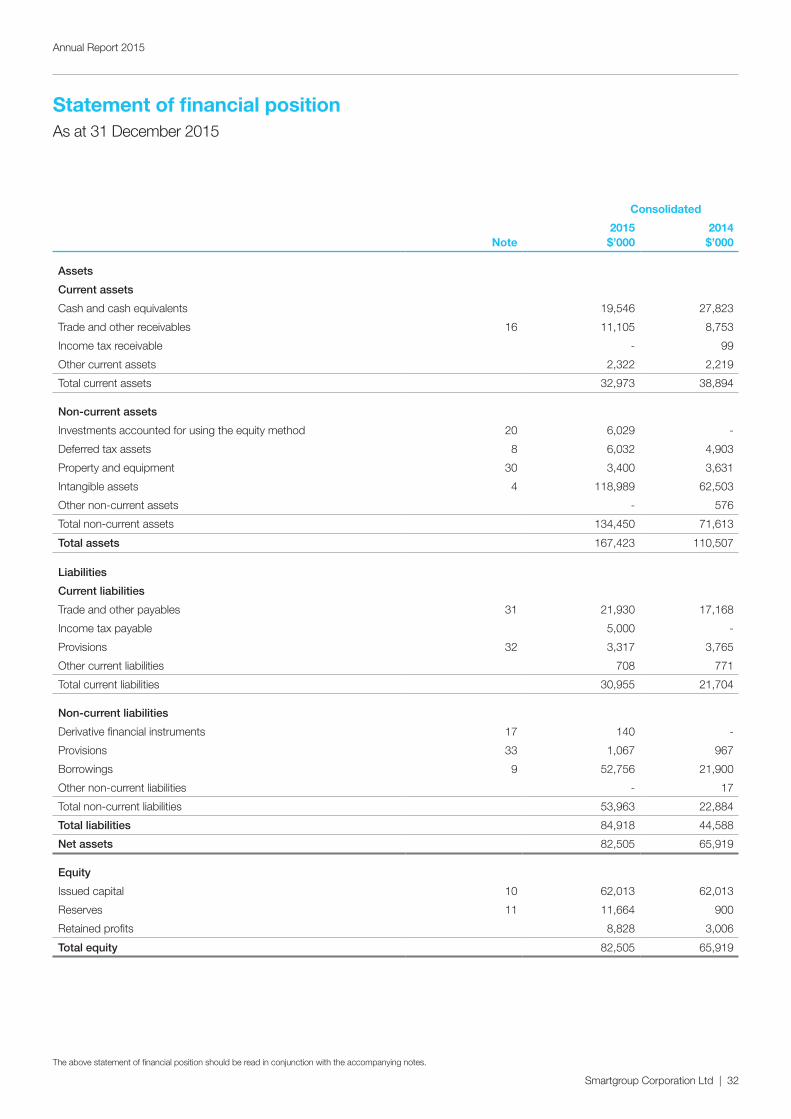
Smartgroup Corporation Ltd | 32
Annual Report 2015
Statement of financial position As at 31 December 2015
Consolidated
Note2015 $’000
2014 $’000
Assets
Current assets
Cash and cash equivalents 19,546 27,823
Trade and other receivables 16 11,105 8,753
Income tax receivable - 99
Other current assets 2,322 2,219
Total current assets 32,973 38,894
Non-current assets
Investments accounted for using the equity method 20 6,029 -
Deferred tax assets 8 6,032 4,903
Property and equipment 30 3,400 3,631
Intangible assets 4 118,989 62,503
Other non-current assets - 576
Total non-current assets 134,450 71,613
Total assets 167,423 110,507
Liabilities
Current liabilities
Trade and other payables 31 21,930 17,168
Income tax payable 5,000 -
Provisions 32 3,317 3,765
Other current liabilities 708 771
Total current liabilities 30,955 21,704
Non-current liabilities
Derivative financial instruments 17 140 -
Provisions 33 1,067 967
Borrowings 9 52,756 21,900
Other non-current liabilities - 17
Total non-current liabilities 53,963 22,884
Total liabilities 84,918 44,588
Net assets 82,505 65,919
Equity
Issued capital 10 62,013 62,013
Reserves 11 11,664 900
Retained profits 8,828 3,006
Total equity 82,505 65,919
The above statement of financial position should be read in conjunction with the accompanying notes.
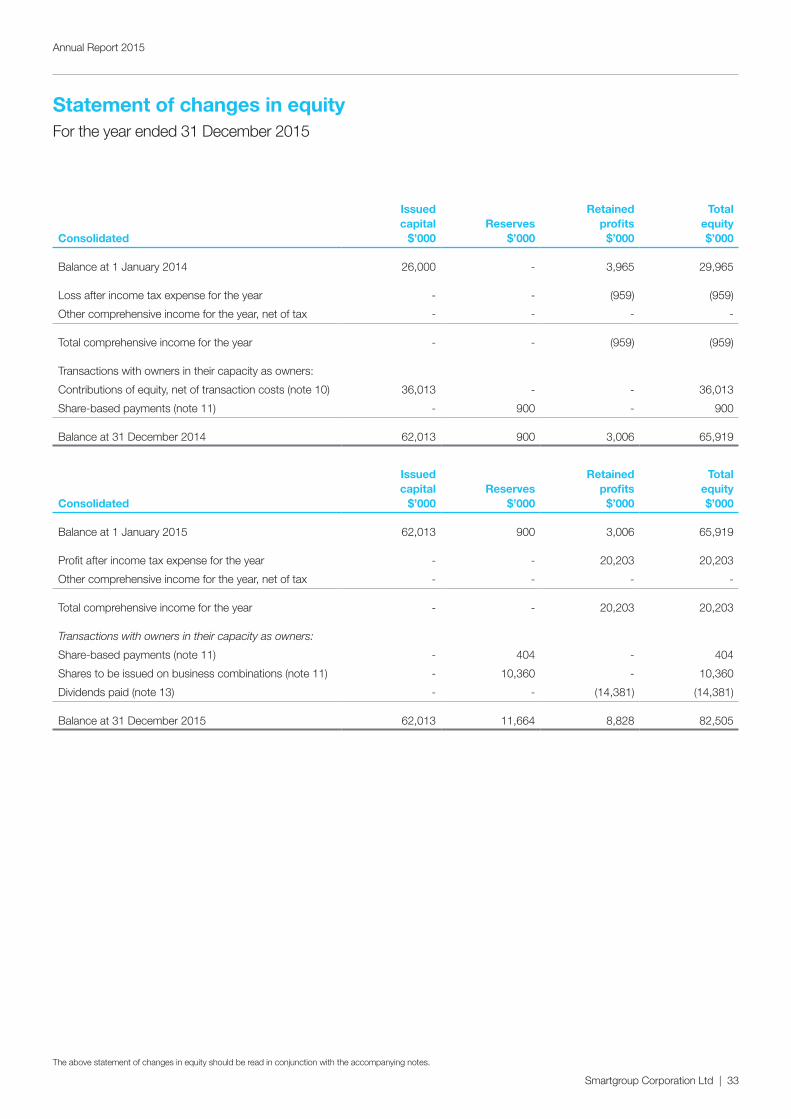
Smartgroup Corporation Ltd | 33
Annual Report 2015
Statement of changes in equity For the year ended 31 December 2015
Consolidated
Issued capital
$’000Reserves
$’000
Retained profits
$’000
Total equity $’000
Balance at 1 January 2014 26,000 - 3,965 29,965
Loss after income tax expense for the year - - (959) (959)
Other comprehensive income for the year, net of tax - - - -
Total comprehensive income for the year - - (959) (959)
Transactions with owners in their capacity as owners:
Contributions of equity, net of transaction costs (note 10) 36,013 - - 36,013
Share-based payments (note 11) - 900 - 900
Balance at 31 December 2014 62,013 900 3,006 65,919
Consolidated
Issued capital
$’000Reserves
$’000
Retained profits
$’000
Total equity $’000
Balance at 1 January 2015 62,013 900 3,006 65,919
Profit after income tax expense for the year - - 20,203 20,203
Other comprehensive income for the year, net of tax - - - -
Total comprehensive income for the year - - 20,203 20,203
Transactions with owners in their capacity as owners:
Share-based payments (note 11) - 404 - 404
Shares to be issued on business combinations (note 11) - 10,360 - 10,360
Dividends paid (note 13) - - (14,381) (14,381)
Balance at 31 December 2015 62,013 11,664 8,828 82,505
The above statement of changes in equity should be read in conjunction with the accompanying notes.
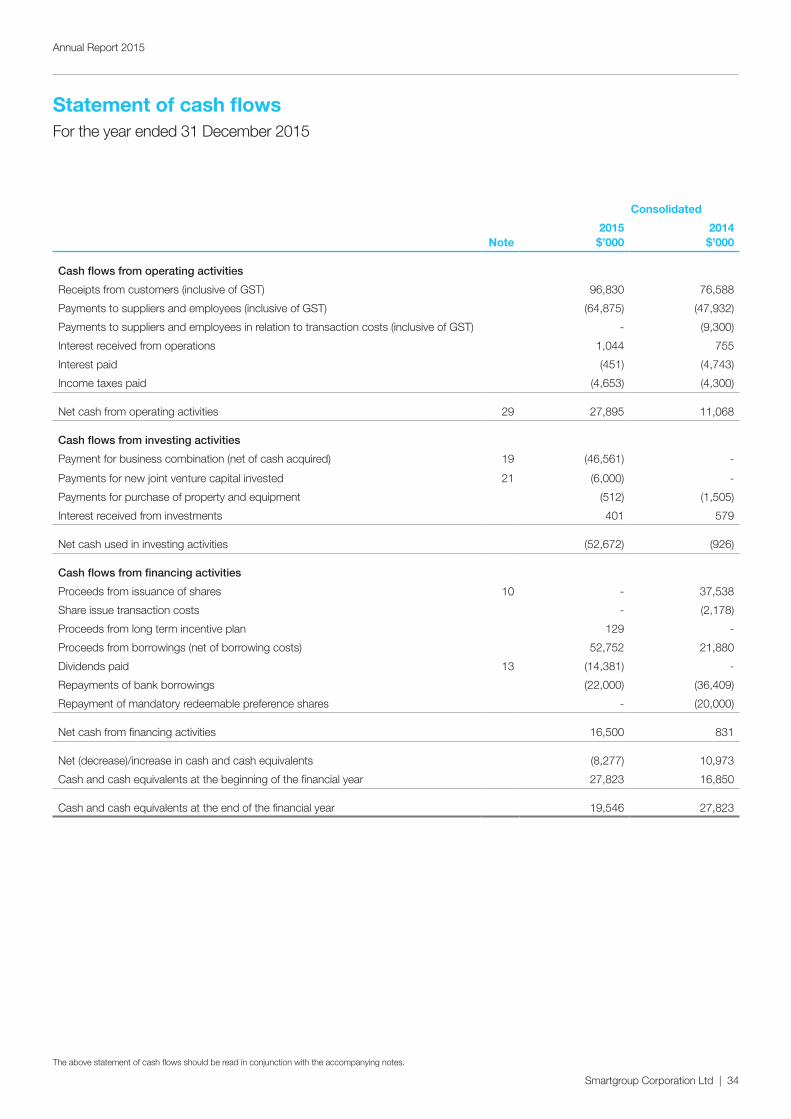
Smartgroup Corporation Ltd | 34
Annual Report 2015
Statement of cash flowsFor the year ended 31 December 2015
Consolidated
Note2015 $’000
2014 $’000
Cash flows from operating activities
Receipts from customers (inclusive of GST) 96,830 76,588
Payments to suppliers and employees (inclusive of GST) (64,875) (47,932)
Payments to suppliers and employees in relation to transaction costs (inclusive of GST) - (9,300)
Interest received from operations 1,044 755
Interest paid (451) (4,743)
Income taxes paid (4,653) (4,300)
Net cash from operating activities 29 27,895 11,068
Cash flows from investing activities
Payment for business combination (net of cash acquired) 19 (46,561) -
Payments for new joint venture capital invested 21 (6,000) -
Payments for purchase of property and equipment (512) (1,505)
Interest received from investments 401 579
Net cash used in investing activities (52,672) (926)
Cash flows from financing activities
Proceeds from issuance of shares 10 - 37,538
Share issue transaction costs - (2,178)
Proceeds from long term incentive plan 129 -
Proceeds from borrowings (net of borrowing costs) 52,752 21,880
Dividends paid 13 (14,381) -
Repayments of bank borrowings (22,000) (36,409)
Repayment of mandatory redeemable preference shares - (20,000)
Net cash from financing activities 16,500 831
Net (decrease)/increase in cash and cash equivalents (8,277) 10,973
Cash and cash equivalents at the beginning of the financial year 27,823 16,850
Cash and cash equivalents at the end of the financial year 19,546 27,823
The above statement of cash flows should be read in conjunction with the accompanying notes.

Smartgroup Corporation Ltd | 35
Annual Report 2015
Notes to the financial statements31 December 2015
Key numbers Capital Risk GroupUnrecognised
itemsOther items
1. Significant accounting policies
9. Non-current liabilities - borrowings
15. Financial instruments
19. Business combinations
26. Contingent liabilities
29. Reconciliation of profit/(loss) after income tax to net cash from operating activities
2. Critical accounting judgements, estimates and assumptions
10. Equity - issued capital
16. Current assets - trade and other receivables
20. Non current assets – investments accounted for using the equity method
27. Commitments 30. Non-current assets - Property and equipment
3. Operating segments
11. Equity - reserves
17. Non-current liabilities - derivative financial instruments
21. Interests in joint ventures
28. Events after the reporting period
31. Current liabilities - trade and other payables
4. Non-current assets - intangible assets
12. Share-based payments
18. Fair value measurement
22. Related party transactions
32. Current liabilities - provisions
5. Revenue 13. Equity - dividends
23. Parent entity information
33. Non-current liabilities - provisions
6. Expenses 14. Earnings per share
24. Interests in subsidiaries
34. Remuneration of auditors
7. Income tax expense 25. Key management personnel disclosures
35. Other accounting policies
8. Non-current assets - deferred tax assets
Notes to the financial statementsAnnual Report 2015
Smartgroup Corporation Ltd | 36
Note 1. Significant accounting policies
The principal accounting policies adopted in the preparation of the financial statements are set out either in the respective notes or below. These policies have been consistently applied to all the years presented, unless otherwise stated. Some expenses have been reclassified in nature in the Statement of profit or loss and comprehensive income, including the comparatives, to enhance comparability. There has been no impact to Earnings before interest, tax and amortisation or Profit after tax.
New, revised or amending Accounting Standards and Interpretations adopted
The Group has adopted all of the new, revised or amending Accounting Standards and Interpretations issued by the Australian Accounting Standards Board (‘AASB’) that are mandatory for the current reporting period. The adoption of these Accounting Standards and Interpretations did not have any significant impact on the financial performance or position of the Group for the financial year ended 31 December 2015.
Any new, revised or amending Accounting Standards or Interpretations that are not yet mandatory have not been early adopted.
Basis of preparation
These general purpose financial statements have been prepared in accordance with Australian Accounting Standards and Interpretations issued by the Australian Accounting Standards Board (‘AASB’) and the Corporations Act 2001, as appropriate for for-profit oriented entities. These financial statements also comply with International Financial Reporting Standards as issued by the International Accounting Standards Board (‘IASB’).
Historical cost convention
The financial statements have been prepared under the historical cost convention, except for, where applicable, the revaluation of financial assets and liabilities (including derivative instruments) at fair value through profit or loss.
Critical accounting estimates
The preparation of the financial statements requires the use of certain critical accounting estimates. It also requires management to exercise its judgement in the process of applying the Group’s accounting policies. The areas involving a higher degree of judgement or complexity, or areas where assumptions and estimates are significant to the financial statements, are disclosed in note 2.
Parent entity information
In accordance with the Corporations Act 2001, these financial statements present the results of the Group only. Supplementary information about the parent entity is disclosed in note 23.
Rounding of amounts
The Company is of a kind referred to in Class Order 98/100, issued by the Australian Securities and Investments Commission, relating to ‘rounding-off’. Amounts in this report have been rounded off in accordance with that Class Order to the nearest thousand dollars, or in certain cases, the nearest dollar.
Note 2. Critical accounting judgements, estimates and assumptions
The preparation of the financial statements requires management to make judgements, estimates and assumptions that affect the reported amounts in the financial statements. Management continually evaluates its judgements and estimates in relation to assets, liabilities, contingent liabilities, revenue and expenses. Management bases its judgements, estimates and assumptions on historical experience and on other various factors, including expectations of future events, management believes to be reasonable under the circumstances. The resulting accounting judgements and estimates will seldom equal the related actual results. The judgements, estimates and assumptions that have a significant risk of causing a material adjustment to the carrying amounts of assets and liabilities (refer to the respective notes) within the next financial year are discussed below.
Estimation of useful lives of assets
The Group determines the estimated useful lives and related depreciation and amortisation charges for its property and equipment and finite life intangible assets. The depreciation and amortisation charge will increase where the useful lives are less than previously estimated lives.
Goodwill and other indefinite life intangible assets
The Group tests annually, or more frequently if events or changes in circumstances indicate impairment, whether goodwill and other indefinite life intangible assets have suffered any impairment, in accordance with the accounting policy stated in note 4 and note 35. The recoverable amounts of cash-generating units have been determined based on value-in-use calculations. These calculations require the use of assumptions, including estimated discount rates based on the current cost of capital and growth rates of the estimated future cash flows.
Income tax
The Group is subject to income taxes in the jurisdictions in which it operates. Significant judgement is required in determining the provision for income tax. There are many transactions and calculations undertaken during the ordinary course of business for which the ultimate tax determination is uncertain. The Group recognises liabilities for anticipated tax audit issues based on the Group’s current understanding of the tax law. Where the final tax outcome of these matters is different from the carrying amounts, such differences will impact the current and deferred tax provisions in the period in which such determination is made.
Notes to the financial statementsAnnual Report 2015
Smartgroup Corporation Ltd | 37
Note 2. Critical accounting judgements, estimates and assumptions (continued)
Recovery of deferred tax assets
Deferred tax assets are recognised for deductible temporary differences only if the Group considers it is probable that future taxable amounts will be available to utilise those temporary differences and losses.
Employee benefits provision
The liability for employee benefits expected to be settled more than 12 months from the reporting date are recognised and measured at the present value of the estimated future cash flows to be made in respect of all employees at the reporting date. In determining the present value of the liability, estimates of attrition rates and pay increases through promotion and inflation have been taken into account.
Operations provision
The Group exercises judgement in measuring and recognising provisions relating to customer and supplier disputes. Judgement is necessary in assessing the likelihood that a claim will arise, and to quantify the possible range of financial settlement. Because of the inherent uncertainty in this evaluation process, actual losses may be different from the originally estimated provision.
Business combinations
As discussed in note 19, business combinations are initially accounted for on a provisional basis. The fair value of assets acquired, liabilities and contingent liabilities assumed are initially estimated by the Group taking into consideration all available information at the reporting date. Fair value adjustments on the finalisation of the business combination accounting is retrospective, where applicable, to the period the combination occurred and may have an impact on the assets and liabilities, depreciation and amortisation reported.
Note 3. Operating segments
Identification of reportable operating segments
The Group has identified its segments based on the internal reports that are reviewed and used by the Chief Executive Officer and Chief Financial Officer (who are identified as the Chief Operating Decision Makers (‘CODM’)) in assessing performance and in determining the allocation of resources. There is no aggregation of operating segments.
The CODM reviews EBITA (earnings before interest, tax and amortisation). The accounting policies adopted for internal reporting to the CODM are consistent with those adopted in the financial statements.
The information reported to the CODM is on at least a monthly basis. The Group implemented a new operating structure to reflect its expansion into software and distribution and utilise its expertise in procurement in the final quarter of 2015 and expects to report under the new operating segments in 2016. As a result, segments for the year ended 31 December 2015 are presented on both the existing basis and new basis of segmentation for 2016.
Types of products and services
The principal products and services of the operating segments in 2016 are as follows:
Outsourced administration This part of the business provides outsourced salary packaging services, which includes novated leasing and the marketing of salary packaging debit cards.
Vehicle services This part of the business provides end-to-end fleet management services.
Software, distribution and group services (‘SDGS’)
This part of the business provides salary packaging software solutions, distribution of vehicle insurances and workforce management software to the healthcare industry.
The principal products and services of the operating segments in 2015 are as follows:
Salary packaging This part of the business provides outsourced salary packaging services, which includes novated leasing, salary packaging software solutions and the marketing of salary packaging debit cards.
Fleet management This part of the business provides end-to-end fleet management services, and distribution of vehicle insurances.
Intersegment transactions
Intersegment transactions were made at market rates. Intersegment transactions are eliminated on consolidation.
Intersegment receivables, payables and loans
Intersegment loans are initially recognised at the consideration received. Intersegment loans receivable and loans payable that earn or incur non-market interest are not adjusted to fair value based on market interest rates. Intersegment loans are eliminated on consolidation.
Major customers
Revenue from two customers amounted to $24,165,000 (2014: $19,535,000).
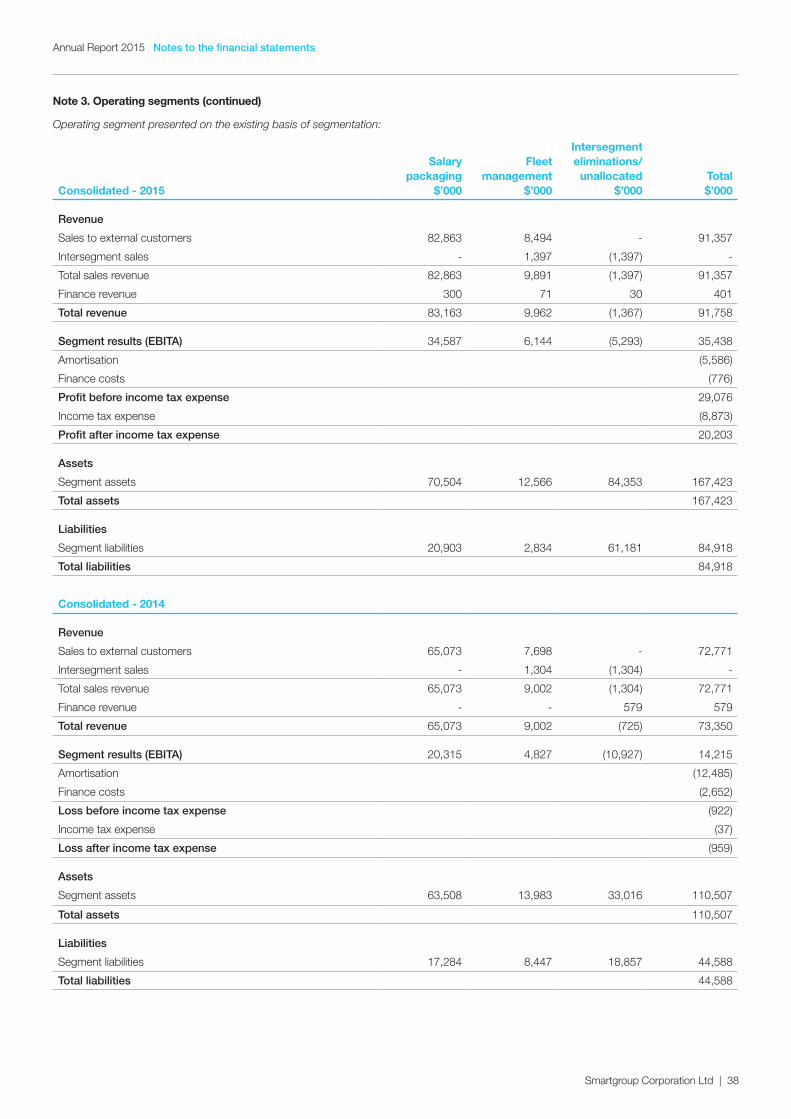
Notes to the financial statementsAnnual Report 2015
Smartgroup Corporation Ltd | 38
Note 3. Operating segments (continued)
Operating segment presented on the existing basis of segmentation:
Consolidated - 2015
Salary packaging
$’000
Fleet management
$’000
Intersegment eliminations/
unallocated $’000
Total $’000
Revenue
Sales to external customers 82,863 8,494 - 91,357
Intersegment sales - 1,397 (1,397) -
Total sales revenue 82,863 9,891 (1,397) 91,357
Finance revenue 300 71 30 401
Total revenue 83,163 9,962 (1,367) 91,758
Segment results (EBITA) 34,587 6,144 (5,293) 35,438
Amortisation (5,586)
Finance costs (776)
Profit before income tax expense 29,076
Income tax expense (8,873)
Profit after income tax expense 20,203
Assets
Segment assets 70,504 12,566 84,353 167,423
Total assets 167,423
Liabilities
Segment liabilities 20,903 2,834 61,181 84,918
Total liabilities 84,918
Consolidated - 2014
Revenue
Sales to external customers 65,073 7,698 - 72,771
Intersegment sales - 1,304 (1,304) -
Total sales revenue 65,073 9,002 (1,304) 72,771
Finance revenue - - 579 579
Total revenue 65,073 9,002 (725) 73,350
Segment results (EBITA) 20,315 4,827 (10,927) 14,215
Amortisation (12,485)
Finance costs (2,652)
Loss before income tax expense (922)
Income tax expense (37)
Loss after income tax expense (959)
Assets
Segment assets 63,508 13,983 33,016 110,507
Total assets 110,507
Liabilities
Segment liabilities 17,284 8,447 18,857 44,588
Total liabilities 44,588
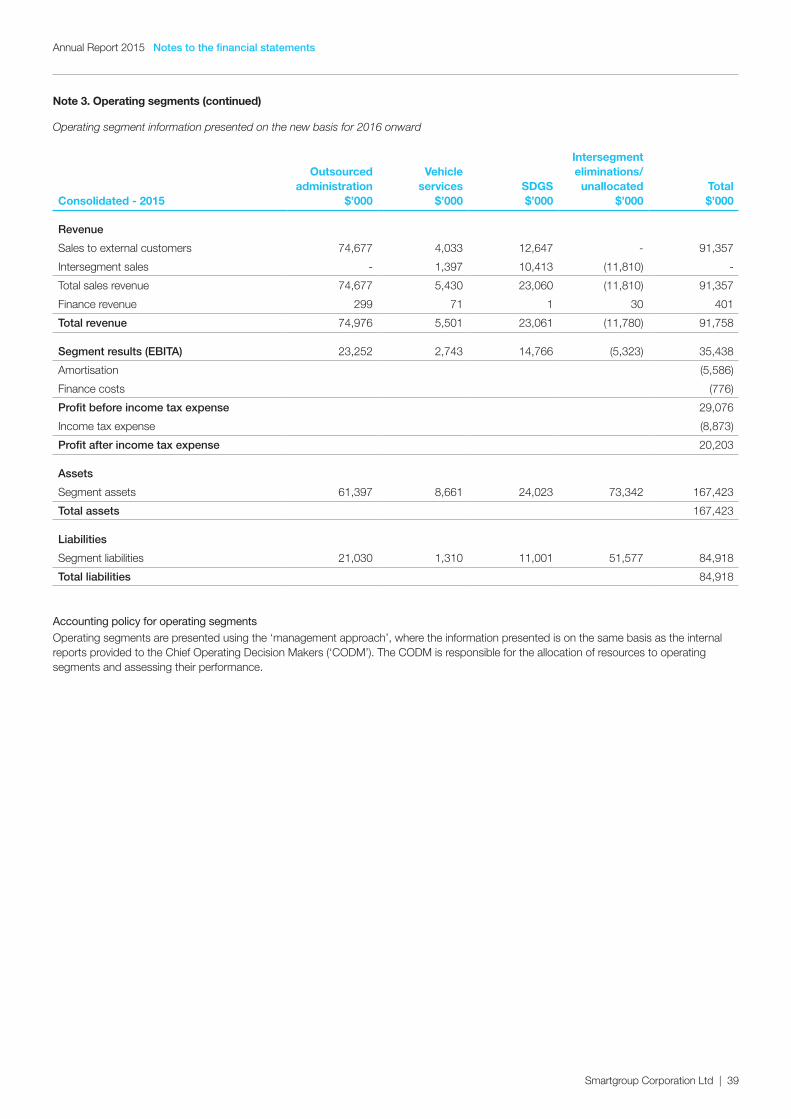
Notes to the financial statementsAnnual Report 2015
Smartgroup Corporation Ltd | 39
Note 3. Operating segments (continued)
Operating segment information presented on the new basis for 2016 onward
Consolidated - 2015
Outsourced administration
$’000
Vehicle services
$’000 SDGS
$’000
Intersegment eliminations/
unallocated $’000
Total $’000
Revenue
Sales to external customers 74,677 4,033 12,647 - 91,357
Intersegment sales - 1,397 10,413 (11,810) -
Total sales revenue 74,677 5,430 23,060 (11,810) 91,357
Finance revenue 299 71 1 30 401
Total revenue 74,976 5,501 23,061 (11,780) 91,758
Segment results (EBITA) 23,252 2,743 14,766 (5,323) 35,438
Amortisation (5,586)
Finance costs (776)
Profit before income tax expense 29,076
Income tax expense (8,873)
Profit after income tax expense 20,203
Assets
Segment assets 61,397 8,661 24,023 73,342 167,423
Total assets 167,423
Liabilities
Segment liabilities 21,030 1,310 11,001 51,577 84,918
Total liabilities 84,918
Accounting policy for operating segments
Operating segments are presented using the ‘management approach’, where the information presented is on the same basis as the internal reports provided to the Chief Operating Decision Makers (‘CODM’). The CODM is responsible for the allocation of resources to operating segments and assessing their performance.
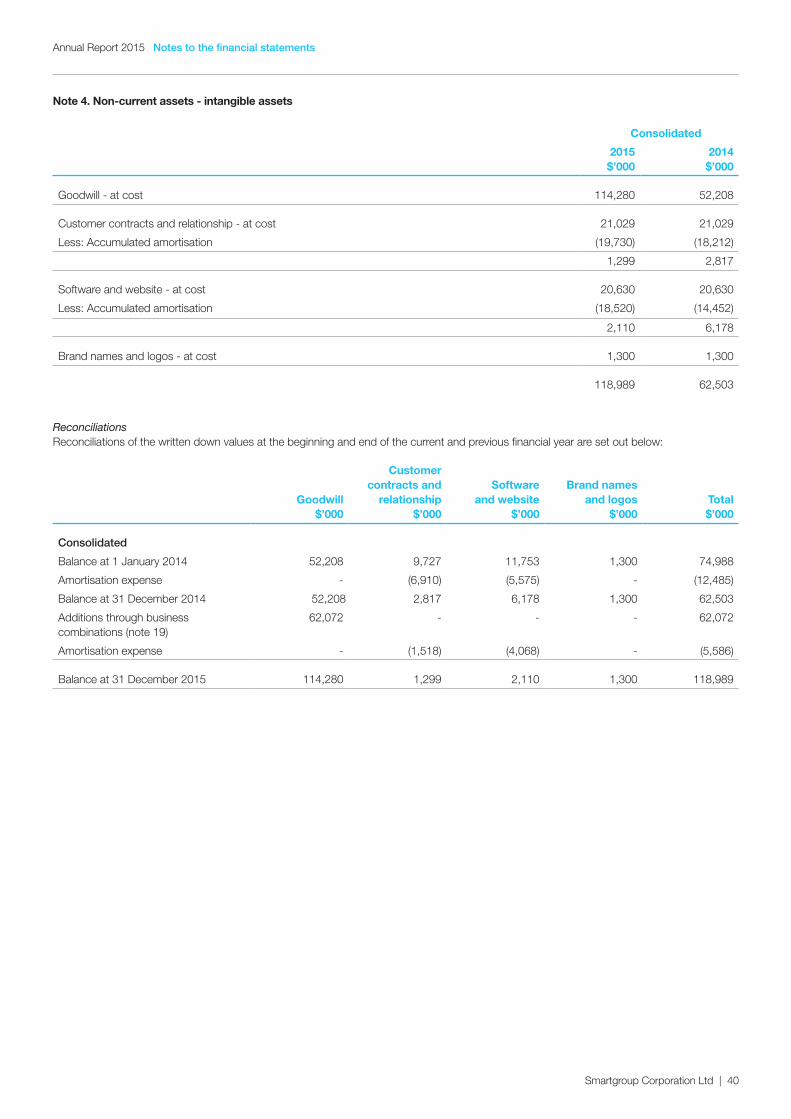
Notes to the financial statementsAnnual Report 2015
Smartgroup Corporation Ltd | 40
Note 4. Non-current assets - intangible assets
Consolidated
2015 $’000
2014 $’000
Goodwill - at cost 114,280 52,208
Customer contracts and relationship - at cost 21,029 21,029
Less: Accumulated amortisation (19,730) (18,212)
1,299 2,817
Software and website - at cost 20,630 20,630
Less: Accumulated amortisation (18,520) (14,452)
2,110 6,178
Brand names and logos - at cost 1,300 1,300
118,989 62,503
ReconciliationsReconciliations of the written down values at the beginning and end of the current and previous financial year are set out below:
Goodwill $’000
Customer contracts and
relationship $’000
Software and website
$’000
Brand names and logos
$’000Total $’000
Consolidated
Balance at 1 January 2014 52,208 9,727 11,753 1,300 74,988
Amortisation expense - (6,910) (5,575) - (12,485)
Balance at 31 December 2014 52,208 2,817 6,178 1,300 62,503
Additions through business combinations (note 19)
62,072 - - - 62,072
Amortisation expense - (1,518) (4,068) - (5,586)
Balance at 31 December 2015 114,280 1,299 2,110 1,300 118,989
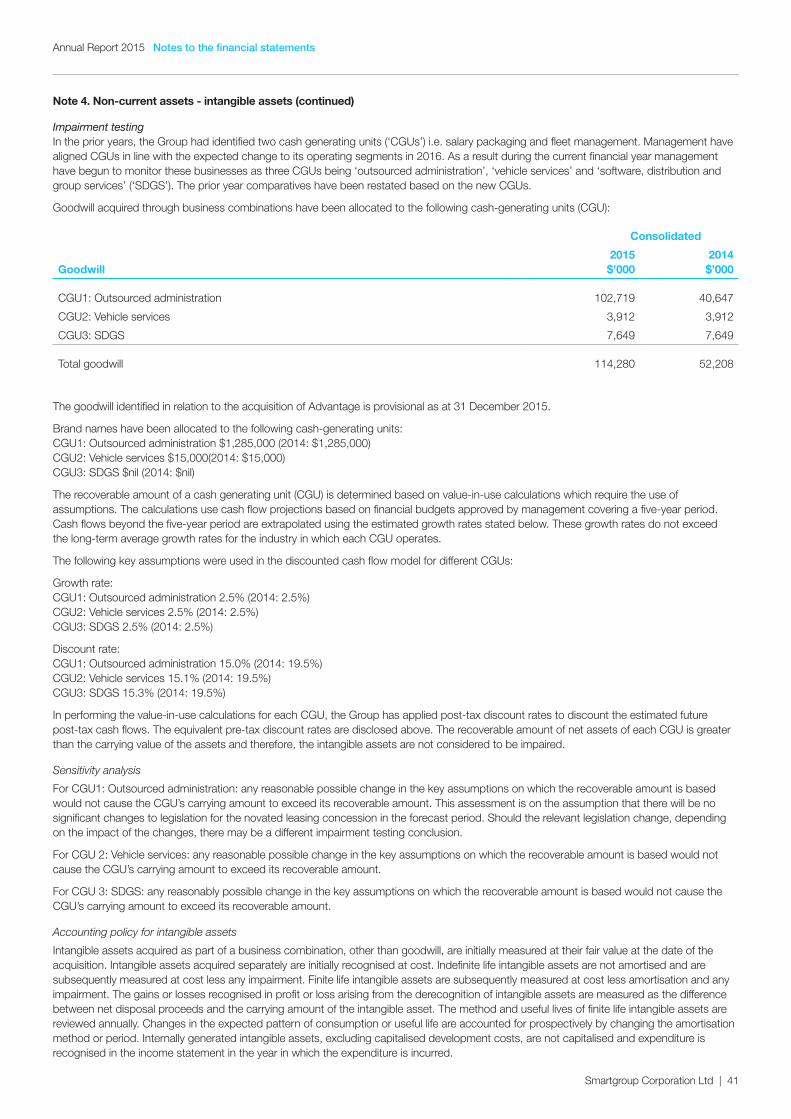
Notes to the financial statementsAnnual Report 2015
Smartgroup Corporation Ltd | 41
Note 4. Non-current assets - intangible assets (continued)
Impairment testing In the prior years, the Group had identified two cash generating units (‘CGUs’) i.e. salary packaging and fleet management. Management have aligned CGUs in line with the expected change to its operating segments in 2016. As a result during the current financial year management have begun to monitor these businesses as three CGUs being ‘outsourced administration’, ‘vehicle services’ and ‘software, distribution and group services’ (‘SDGS’). The prior year comparatives have been restated based on the new CGUs.
Goodwill acquired through business combinations have been allocated to the following cash-generating units (CGU):
Consolidated
Goodwill2015 $’000
2014 $’000
CGU1: Outsourced administration 102,719 40,647
CGU2: Vehicle services 3,912 3,912
CGU3: SDGS 7,649 7,649
Total goodwill 114,280 52,208
The goodwill identified in relation to the acquisition of Advantage is provisional as at 31 December 2015.
Brand names have been allocated to the following cash-generating units: CGU1: Outsourced administration $1,285,000 (2014: $1,285,000) CGU2: Vehicle services $15,000(2014: $15,000) CGU3: SDGS $nil (2014: $nil)
The recoverable amount of a cash generating unit (CGU) is determined based on value-in-use calculations which require the use of assumptions. The calculations use cash flow projections based on financial budgets approved by management covering a five-year period. Cash flows beyond the five-year period are extrapolated using the estimated growth rates stated below. These growth rates do not exceed the long-term average growth rates for the industry in which each CGU operates.
The following key assumptions were used in the discounted cash flow model for different CGUs:
Growth rate: CGU1: Outsourced administration 2.5% (2014: 2.5%) CGU2: Vehicle services 2.5% (2014: 2.5%) CGU3: SDGS 2.5% (2014: 2.5%)
Discount rate: CGU1: Outsourced administration 15.0% (2014: 19.5%) CGU2: Vehicle services 15.1% (2014: 19.5%) CGU3: SDGS 15.3% (2014: 19.5%)
In performing the value-in-use calculations for each CGU, the Group has applied post-tax discount rates to discount the estimated future post-tax cash flows. The equivalent pre-tax discount rates are disclosed above. The recoverable amount of net assets of each CGU is greater than the carrying value of the assets and therefore, the intangible assets are not considered to be impaired.
Sensitivity analysis
For CGU1: Outsourced administration: any reasonable possible change in the key assumptions on which the recoverable amount is based would not cause the CGU’s carrying amount to exceed its recoverable amount. This assessment is on the assumption that there will be no significant changes to legislation for the novated leasing concession in the forecast period. Should the relevant legislation change, depending on the impact of the changes, there may be a different impairment testing conclusion.
For CGU 2: Vehicle services: any reasonable possible change in the key assumptions on which the recoverable amount is based would not cause the CGU’s carrying amount to exceed its recoverable amount.
For CGU 3: SDGS: any reasonably possible change in the key assumptions on which the recoverable amount is based would not cause the CGU’s carrying amount to exceed its recoverable amount.
Accounting policy for intangible assets
Intangible assets acquired as part of a business combination, other than goodwill, are initially measured at their fair value at the date of the acquisition. Intangible assets acquired separately are initially recognised at cost. Indefinite life intangible assets are not amortised and are subsequently measured at cost less any impairment. Finite life intangible assets are subsequently measured at cost less amortisation and any impairment. The gains or losses recognised in profit or loss arising from the derecognition of intangible assets are measured as the difference between net disposal proceeds and the carrying amount of the intangible asset. The method and useful lives of finite life intangible assets are reviewed annually. Changes in the expected pattern of consumption or useful life are accounted for prospectively by changing the amortisation method or period. Internally generated intangible assets, excluding capitalised development costs, are not capitalised and expenditure is recognised in the income statement in the year in which the expenditure is incurred.
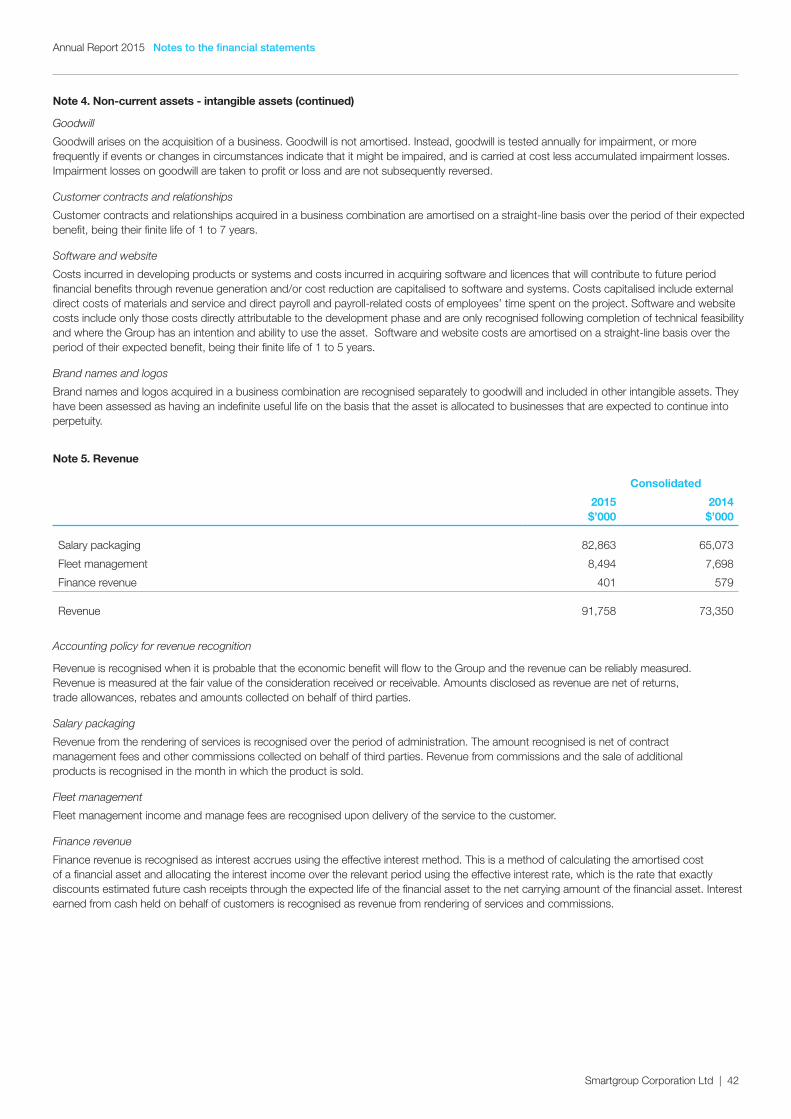
Notes to the financial statementsAnnual Report 2015
Smartgroup Corporation Ltd | 42
Note 4. Non-current assets - intangible assets (continued)
Goodwill
Goodwill arises on the acquisition of a business. Goodwill is not amortised. Instead, goodwill is tested annually for impairment, or more frequently if events or changes in circumstances indicate that it might be impaired, and is carried at cost less accumulated impairment losses. Impairment losses on goodwill are taken to profit or loss and are not subsequently reversed.
Customer contracts and relationships
Customer contracts and relationships acquired in a business combination are amortised on a straight-line basis over the period of their expected benefit, being their finite life of 1 to 7 years.
Software and website
Costs incurred in developing products or systems and costs incurred in acquiring software and licences that will contribute to future period financial benefits through revenue generation and/or cost reduction are capitalised to software and systems. Costs capitalised include external direct costs of materials and service and direct payroll and payroll-related costs of employees’ time spent on the project. Software and website costs include only those costs directly attributable to the development phase and are only recognised following completion of technical feasibility and where the Group has an intention and ability to use the asset. Software and website costs are amortised on a straight-line basis over the period of their expected benefit, being their finite life of 1 to 5 years.
Brand names and logos
Brand names and logos acquired in a business combination are recognised separately to goodwill and included in other intangible assets. They have been assessed as having an indefinite useful life on the basis that the asset is allocated to businesses that are expected to continue into perpetuity.
Note 5. Revenue
Consolidated
2015 $’000
2014 $’000
Salary packaging 82,863 65,073
Fleet management 8,494 7,698
Finance revenue 401 579
Revenue 91,758 73,350
Accounting policy for revenue recognition
Revenue is recognised when it is probable that the economic benefit will flow to the Group and the revenue can be reliably measured. Revenue is measured at the fair value of the consideration received or receivable. Amounts disclosed as revenue are net of returns, trade allowances, rebates and amounts collected on behalf of third parties.
Salary packaging
Revenue from the rendering of services is recognised over the period of administration. The amount recognised is net of contract management fees and other commissions collected on behalf of third parties. Revenue from commissions and the sale of additional products is recognised in the month in which the product is sold.
Fleet management
Fleet management income and manage fees are recognised upon delivery of the service to the customer.
Finance revenue
Finance revenue is recognised as interest accrues using the effective interest method. This is a method of calculating the amortised cost of a financial asset and allocating the interest income over the relevant period using the effective interest rate, which is the rate that exactly discounts estimated future cash receipts through the expected life of the financial asset to the net carrying amount of the financial asset. Interest earned from cash held on behalf of customers is recognised as revenue from rendering of services and commissions.
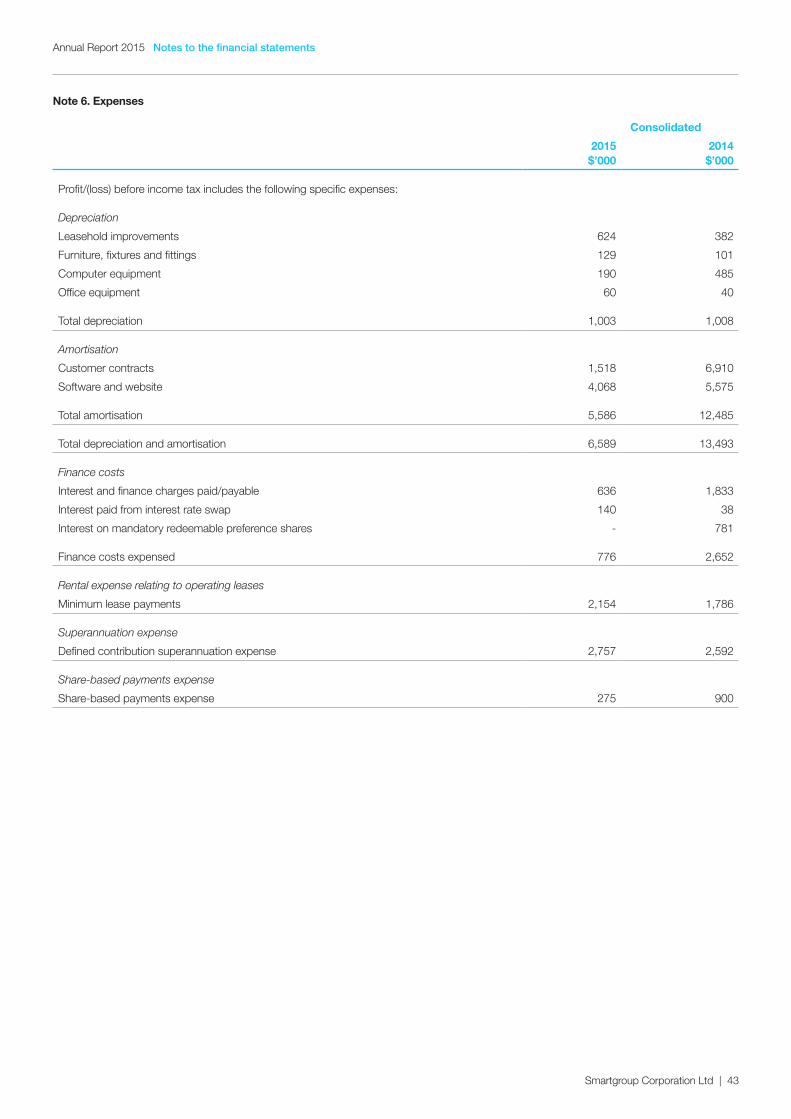
Notes to the financial statementsAnnual Report 2015
Smartgroup Corporation Ltd | 43
Note 6. Expenses
Consolidated
2015 $’000
2014 $’000
Profit/(loss) before income tax includes the following specific expenses:
Depreciation
Leasehold improvements 624 382
Furniture, fixtures and fittings 129 101
Computer equipment 190 485
Office equipment 60 40
Total depreciation 1,003 1,008
Amortisation
Customer contracts 1,518 6,910
Software and website 4,068 5,575
Total amortisation 5,586 12,485
Total depreciation and amortisation 6,589 13,493
Finance costs
Interest and finance charges paid/payable 636 1,833
Interest paid from interest rate swap 140 38
Interest on mandatory redeemable preference shares - 781
Finance costs expensed 776 2,652
Rental expense relating to operating leases
Minimum lease payments 2,154 1,786
Superannuation expense
Defined contribution superannuation expense 2,757 2,592
Share-based payments expense
Share-based payments expense 275 900
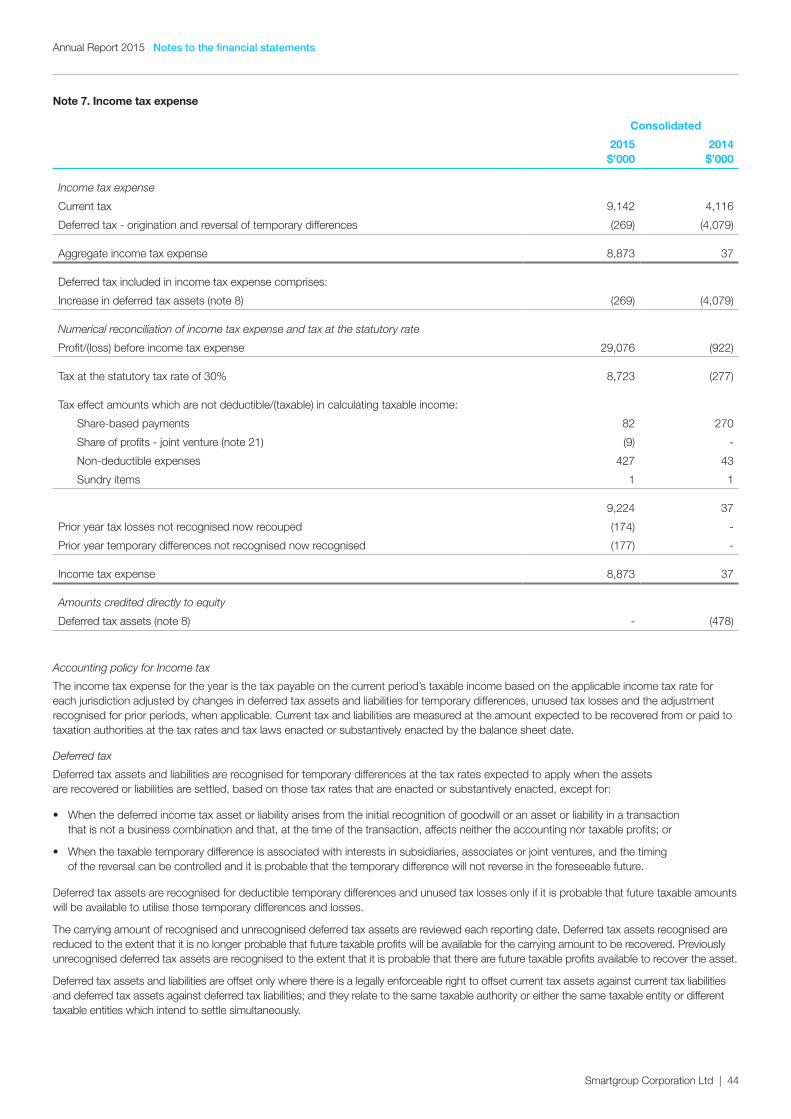
Notes to the financial statementsAnnual Report 2015
Smartgroup Corporation Ltd | 44
Note 7. Income tax expense
Consolidated
2015 $’000
2014 $’000
Income tax expense
Current tax 9,142 4,116
Deferred tax - origination and reversal of temporary differences (269) (4,079)
Aggregate income tax expense 8,873 37
Deferred tax included in income tax expense comprises:
Increase in deferred tax assets (note 8) (269) (4,079)
Numerical reconciliation of income tax expense and tax at the statutory rate
Profit/(loss) before income tax expense 29,076 (922)
Tax at the statutory tax rate of 30% 8,723 (277)
Tax effect amounts which are not deductible/(taxable) in calculating taxable income:
Share-based payments 82 270
Share of profits - joint venture (note 21) (9) -
Non-deductible expenses 427 43
Sundry items 1 1
9,224 37
Prior year tax losses not recognised now recouped (174) -
Prior year temporary differences not recognised now recognised (177) -
Income tax expense 8,873 37
Amounts credited directly to equity
Deferred tax assets (note 8) - (478)
Accounting policy for Income tax
The income tax expense for the year is the tax payable on the current period’s taxable income based on the applicable income tax rate for each jurisdiction adjusted by changes in deferred tax assets and liabilities for temporary differences, unused tax losses and the adjustment recognised for prior periods, when applicable. Current tax and liabilities are measured at the amount expected to be recovered from or paid to taxation authorities at the tax rates and tax laws enacted or substantively enacted by the balance sheet date.
Deferred tax
Deferred tax assets and liabilities are recognised for temporary differences at the tax rates expected to apply when the assets are recovered or liabilities are settled, based on those tax rates that are enacted or substantively enacted, except for:
• When the deferred income tax asset or liability arises from the initial recognition of goodwill or an asset or liability in a transaction that is not a business combination and that, at the time of the transaction, affects neither the accounting nor taxable profits; or
• When the taxable temporary difference is associated with interests in subsidiaries, associates or joint ventures, and the timing of the reversal can be controlled and it is probable that the temporary difference will not reverse in the foreseeable future.
Deferred tax assets are recognised for deductible temporary differences and unused tax losses only if it is probable that future taxable amounts will be available to utilise those temporary differences and losses.
The carrying amount of recognised and unrecognised deferred tax assets are reviewed each reporting date. Deferred tax assets recognised are reduced to the extent that it is no longer probable that future taxable profits will be available for the carrying amount to be recovered. Previously unrecognised deferred tax assets are recognised to the extent that it is probable that there are future taxable profits available to recover the asset.
Deferred tax assets and liabilities are offset only where there is a legally enforceable right to offset current tax assets against current tax liabilities and deferred tax assets against deferred tax liabilities; and they relate to the same taxable authority or either the same taxable entity or different taxable entities which intend to settle simultaneously.
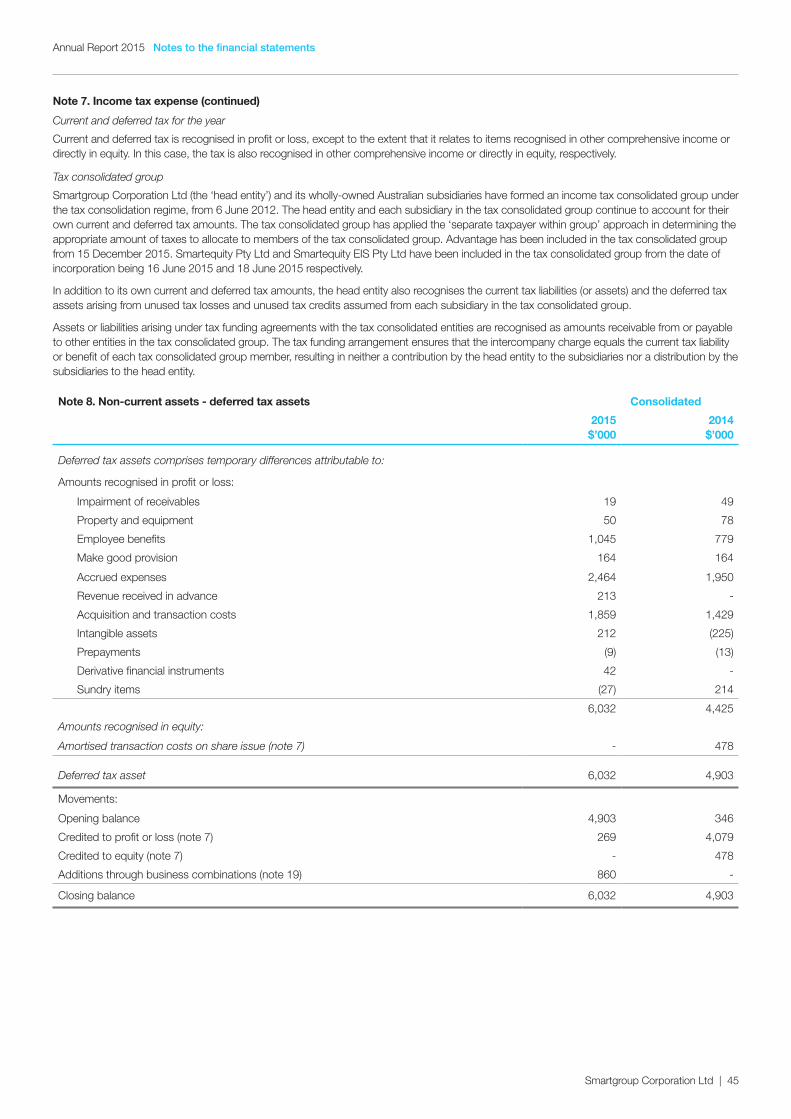
Notes to the financial statementsAnnual Report 2015
Smartgroup Corporation Ltd | 45
Note 7. Income tax expense (continued)
Current and deferred tax for the year
Current and deferred tax is recognised in profit or loss, except to the extent that it relates to items recognised in other comprehensive income or directly in equity. In this case, the tax is also recognised in other comprehensive income or directly in equity, respectively.
Tax consolidated group
Smartgroup Corporation Ltd (the ‘head entity’) and its wholly-owned Australian subsidiaries have formed an income tax consolidated group under the tax consolidation regime, from 6 June 2012. The head entity and each subsidiary in the tax consolidated group continue to account for their own current and deferred tax amounts. The tax consolidated group has applied the ‘separate taxpayer within group’ approach in determining the appropriate amount of taxes to allocate to members of the tax consolidated group. Advantage has been included in the tax consolidated group from 15 December 2015. Smartequity Pty Ltd and Smartequity EIS Pty Ltd have been included in the tax consolidated group from the date of incorporation being 16 June 2015 and 18 June 2015 respectively.
In addition to its own current and deferred tax amounts, the head entity also recognises the current tax liabilities (or assets) and the deferred tax assets arising from unused tax losses and unused tax credits assumed from each subsidiary in the tax consolidated group.
Assets or liabilities arising under tax funding agreements with the tax consolidated entities are recognised as amounts receivable from or payable to other entities in the tax consolidated group. The tax funding arrangement ensures that the intercompany charge equals the current tax liability or benefit of each tax consolidated group member, resulting in neither a contribution by the head entity to the subsidiaries nor a distribution by the subsidiaries to the head entity.
Note 8. Non-current assets - deferred tax assets Consolidated
2015 $’000
2014 $’000
Deferred tax assets comprises temporary differences attributable to:
Amounts recognised in profit or loss:
Impairment of receivables 19 49
Property and equipment 50 78
Employee benefits 1,045 779
Make good provision 164 164
Accrued expenses 2,464 1,950
Revenue received in advance 213 -
Acquisition and transaction costs 1,859 1,429
Intangible assets 212 (225)
Prepayments (9) (13)
Derivative financial instruments 42 -
Sundry items (27) 214
6,032 4,425
Amounts recognised in equity:
Amortised transaction costs on share issue (note 7) - 478
Deferred tax asset 6,032 4,903
Movements:
Opening balance 4,903 346
Credited to profit or loss (note 7) 269 4,079
Credited to equity (note 7) - 478
Additions through business combinations (note 19) 860 -
Closing balance 6,032 4,903
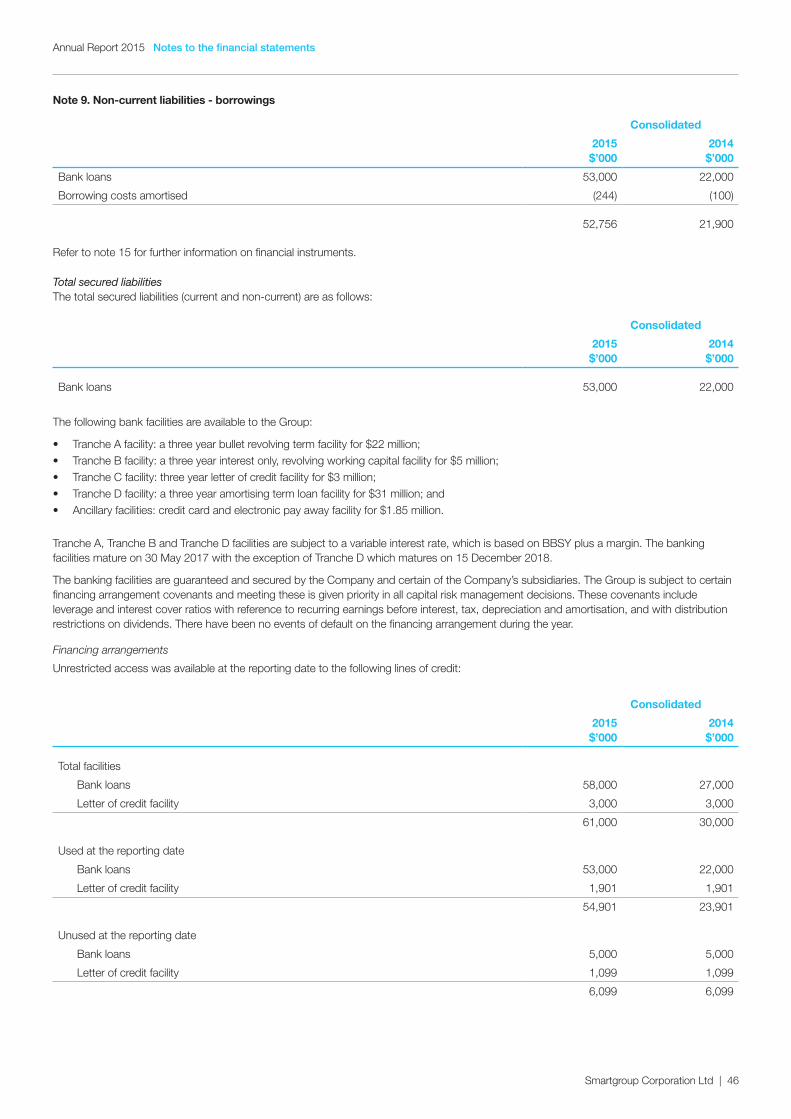
Notes to the financial statementsAnnual Report 2015
Smartgroup Corporation Ltd | 46
Note 9. Non-current liabilities - borrowings
Consolidated
2015 $’000
2014 $’000
Bank loans 53,000 22,000
Borrowing costs amortised (244) (100)
52,756 21,900
Refer to note 15 for further information on financial instruments.
Total secured liabilitiesThe total secured liabilities (current and non-current) are as follows:
Consolidated
2015 $’000
2014 $’000
Bank loans 53,000 22,000
The following bank facilities are available to the Group:
• Tranche A facility: a three year bullet revolving term facility for $22 million; • Tranche B facility: a three year interest only, revolving working capital facility for $5 million; • Tranche C facility: three year letter of credit facility for $3 million; • Tranche D facility: a three year amortising term loan facility for $31 million; and • Ancillary facilities: credit card and electronic pay away facility for $1.85 million. Tranche A, Tranche B and Tranche D facilities are subject to a variable interest rate, which is based on BBSY plus a margin. The banking facilities mature on 30 May 2017 with the exception of Tranche D which matures on 15 December 2018.
The banking facilities are guaranteed and secured by the Company and certain of the Company’s subsidiaries. The Group is subject to certain financing arrangement covenants and meeting these is given priority in all capital risk management decisions. These covenants include leverage and interest cover ratios with reference to recurring earnings before interest, tax, depreciation and amortisation, and with distribution restrictions on dividends. There have been no events of default on the financing arrangement during the year.
Financing arrangements
Unrestricted access was available at the reporting date to the following lines of credit:
Consolidated
2015 $’000
2014 $’000
Total facilities
Bank loans 58,000 27,000
Letter of credit facility 3,000 3,000
61,000 30,000
Used at the reporting date
Bank loans 53,000 22,000
Letter of credit facility 1,901 1,901
54,901 23,901
Unused at the reporting date
Bank loans 5,000 5,000
Letter of credit facility 1,099 1,099
6,099 6,099
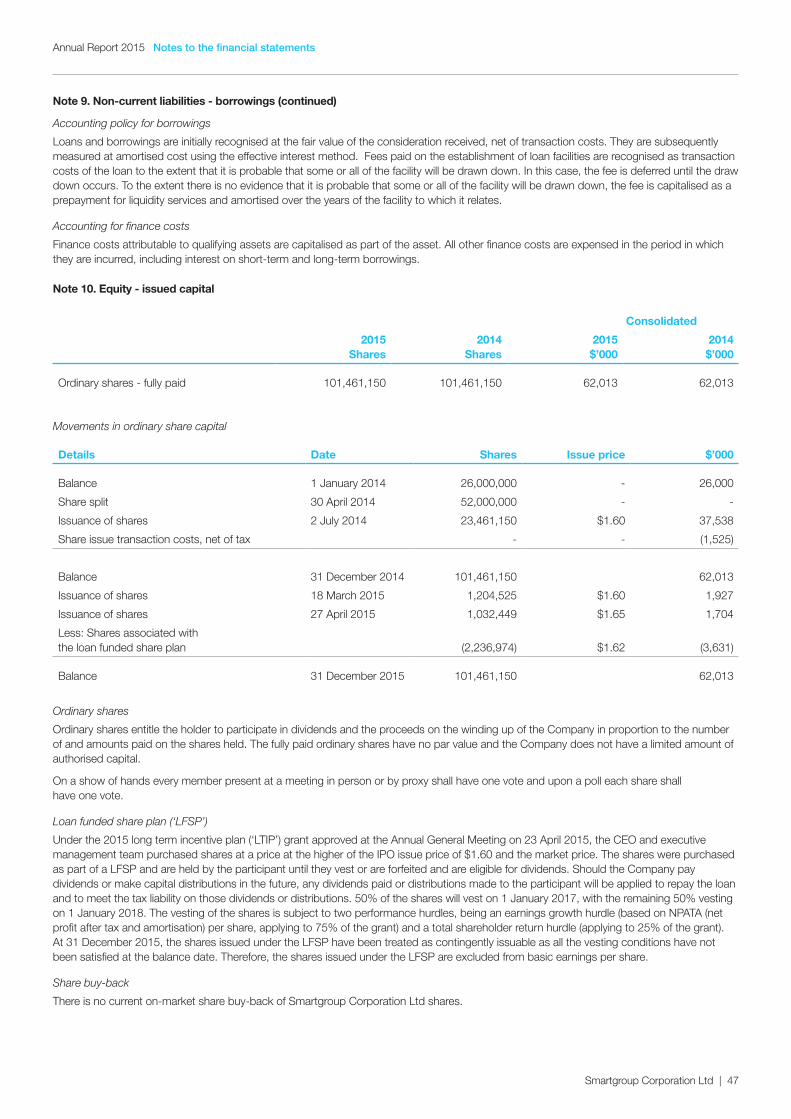
Notes to the financial statementsAnnual Report 2015
Smartgroup Corporation Ltd | 47
Note 9. Non-current liabilities - borrowings (continued)
Accounting policy for borrowings
Loans and borrowings are initially recognised at the fair value of the consideration received, net of transaction costs. They are subsequently measured at amortised cost using the effective interest method. Fees paid on the establishment of loan facilities are recognised as transaction costs of the loan to the extent that it is probable that some or all of the facility will be drawn down. In this case, the fee is deferred until the draw down occurs. To the extent there is no evidence that it is probable that some or all of the facility will be drawn down, the fee is capitalised as a prepayment for liquidity services and amortised over the years of the facility to which it relates.
Accounting for finance costs
Finance costs attributable to qualifying assets are capitalised as part of the asset. All other finance costs are expensed in the period in which they are incurred, including interest on short-term and long-term borrowings.
Note 10. Equity - issued capital
Consolidated
2015 Shares
2014 Shares
2015 $’000
2014 $’000
Ordinary shares - fully paid 101,461,150 101,461,150 62,013 62,013
Movements in ordinary share capital
Details Date Shares Issue price $’000
Balance 1 January 2014 26,000,000 - 26,000
Share split 30 April 2014 52,000,000 - -
Issuance of shares 2 July 2014 23,461,150 $1.60 37,538
Share issue transaction costs, net of tax - - (1,525)
Balance 31 December 2014 101,461,150 62,013
Issuance of shares 18 March 2015 1,204,525 $1.60 1,927
Issuance of shares 27 April 2015 1,032,449 $1.65 1,704
Less: Shares associated with the loan funded share plan (2,236,974) $1.62 (3,631)
Balance 31 December 2015 101,461,150 62,013
Ordinary shares
Ordinary shares entitle the holder to participate in dividends and the proceeds on the winding up of the Company in proportion to the number of and amounts paid on the shares held. The fully paid ordinary shares have no par value and the Company does not have a limited amount of authorised capital.
On a show of hands every member present at a meeting in person or by proxy shall have one vote and upon a poll each share shall have one vote.
Loan funded share plan (‘LFSP’)
Under the 2015 long term incentive plan (‘LTIP’) grant approved at the Annual General Meeting on 23 April 2015, the CEO and executive management team purchased shares at a price at the higher of the IPO issue price of $1.60 and the market price. The shares were purchased as part of a LFSP and are held by the participant until they vest or are forfeited and are eligible for dividends. Should the Company pay dividends or make capital distributions in the future, any dividends paid or distributions made to the participant will be applied to repay the loan and to meet the tax liability on those dividends or distributions. 50% of the shares will vest on 1 January 2017, with the remaining 50% vesting on 1 January 2018. The vesting of the shares is subject to two performance hurdles, being an earnings growth hurdle (based on NPATA (net profit after tax and amortisation) per share, applying to 75% of the grant) and a total shareholder return hurdle (applying to 25% of the grant). At 31 December 2015, the shares issued under the LFSP have been treated as contingently issuable as all the vesting conditions have not been satisfied at the balance date. Therefore, the shares issued under the LFSP are excluded from basic earnings per share.
Share buy-back
There is no current on-market share buy-back of Smartgroup Corporation Ltd shares.
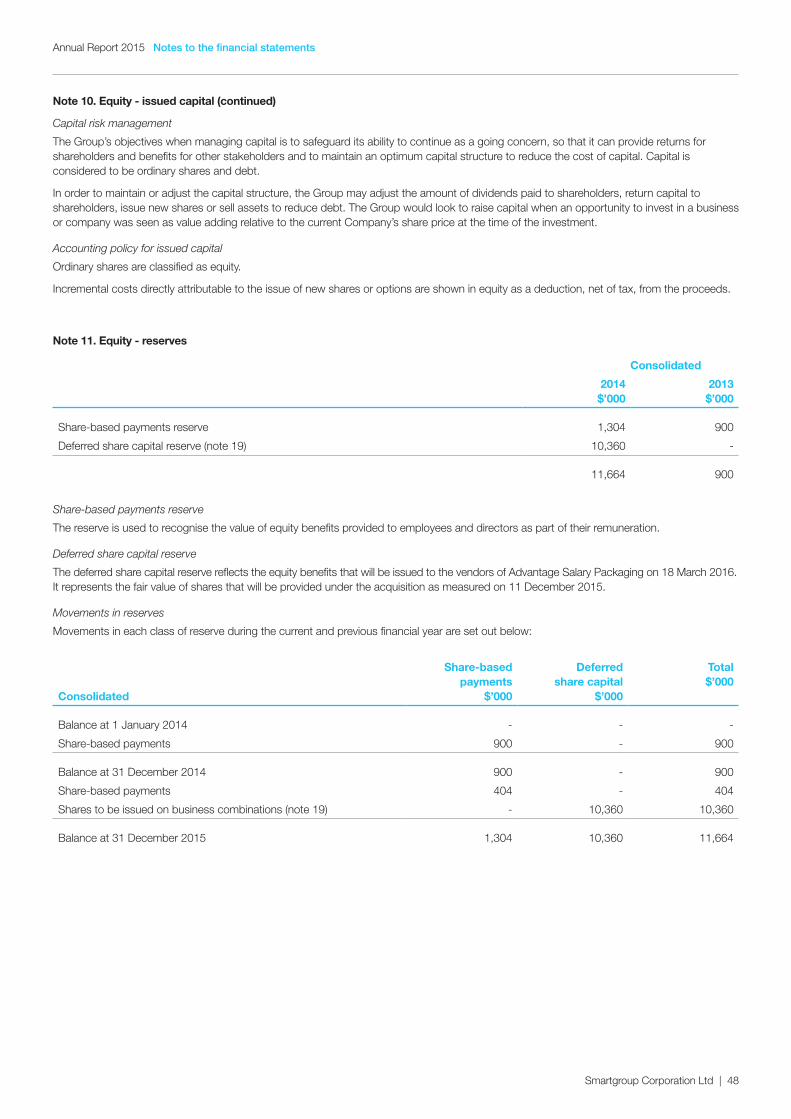
Notes to the financial statementsAnnual Report 2015
Smartgroup Corporation Ltd | 48
Note 10. Equity - issued capital (continued)
Capital risk management
The Group’s objectives when managing capital is to safeguard its ability to continue as a going concern, so that it can provide returns for shareholders and benefits for other stakeholders and to maintain an optimum capital structure to reduce the cost of capital. Capital is considered to be ordinary shares and debt.
In order to maintain or adjust the capital structure, the Group may adjust the amount of dividends paid to shareholders, return capital to shareholders, issue new shares or sell assets to reduce debt. The Group would look to raise capital when an opportunity to invest in a business or company was seen as value adding relative to the current Company’s share price at the time of the investment.
Accounting policy for issued capital
Ordinary shares are classified as equity.
Incremental costs directly attributable to the issue of new shares or options are shown in equity as a deduction, net of tax, from the proceeds.
Note 11. Equity - reserves
Consolidated
2014 $’000
2013 $’000
Share-based payments reserve 1,304 900
Deferred share capital reserve (note 19) 10,360 -
11,664 900
Share-based payments reserve
The reserve is used to recognise the value of equity benefits provided to employees and directors as part of their remuneration.
Deferred share capital reserve
The deferred share capital reserve reflects the equity benefits that will be issued to the vendors of Advantage Salary Packaging on 18 March 2016. It represents the fair value of shares that will be provided under the acquisition as measured on 11 December 2015.
Movements in reserves
Movements in each class of reserve during the current and previous financial year are set out below:
Consolidated
Share-based payments
$’000
Deferred share capital
$’000
Total $’000
Balance at 1 January 2014 - - -
Share-based payments 900 - 900
Balance at 31 December 2014 900 - 900
Share-based payments 404 - 404
Shares to be issued on business combinations (note 19) - 10,360 10,360
Balance at 31 December 2015 1,304 10,360 11,664
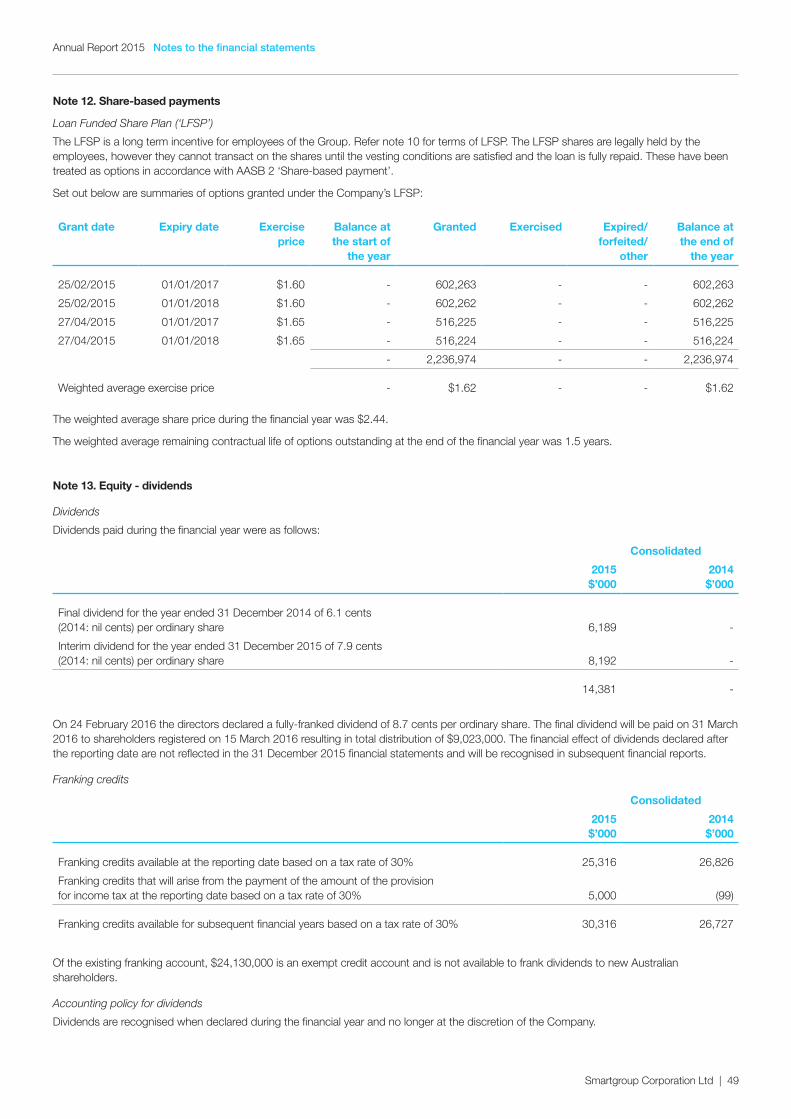
Notes to the financial statementsAnnual Report 2015
Smartgroup Corporation Ltd | 49
Note 12. Share-based payments
Loan Funded Share Plan (‘LFSP’)
The LFSP is a long term incentive for employees of the Group. Refer note 10 for terms of LFSP. The LFSP shares are legally held by the employees, however they cannot transact on the shares until the vesting conditions are satisfied and the loan is fully repaid. These have been treated as options in accordance with AASB 2 ‘Share-based payment’.
Set out below are summaries of options granted under the Company’s LFSP:
Grant date Expiry date Exercise price
Balance at the start of
the year
Granted Exercised Expired/ forfeited/
other
Balance at the end of
the year
25/02/2015 01/01/2017 $1.60 - 602,263 - - 602,263
25/02/2015 01/01/2018 $1.60 - 602,262 - - 602,262
27/04/2015 01/01/2017 $1.65 - 516,225 - - 516,225
27/04/2015 01/01/2018 $1.65 - 516,224 - - 516,224
- 2,236,974 - - 2,236,974
Weighted average exercise price - $1.62 - - $1.62
The weighted average share price during the financial year was $2.44.
The weighted average remaining contractual life of options outstanding at the end of the financial year was 1.5 years.
Note 13. Equity - dividends
Dividends
Dividends paid during the financial year were as follows:
Consolidated
2015 $’000
2014 $’000
Final dividend for the year ended 31 December 2014 of 6.1 cents (2014: nil cents) per ordinary share 6,189 -
Interim dividend for the year ended 31 December 2015 of 7.9 cents (2014: nil cents) per ordinary share 8,192 -
14,381 -
On 24 February 2016 the directors declared a fully-franked dividend of 8.7 cents per ordinary share. The final dividend will be paid on 31 March 2016 to shareholders registered on 15 March 2016 resulting in total distribution of $9,023,000. The financial effect of dividends declared after the reporting date are not reflected in the 31 December 2015 financial statements and will be recognised in subsequent financial reports.
Franking credits
Consolidated
2015 $’000
2014 $’000
Franking credits available at the reporting date based on a tax rate of 30% 25,316 26,826
Franking credits that will arise from the payment of the amount of the provision for income tax at the reporting date based on a tax rate of 30% 5,000 (99)
Franking credits available for subsequent financial years based on a tax rate of 30% 30,316 26,727
Of the existing franking account, $24,130,000 is an exempt credit account and is not available to frank dividends to new Australian shareholders.
Accounting policy for dividends
Dividends are recognised when declared during the financial year and no longer at the discretion of the Company.
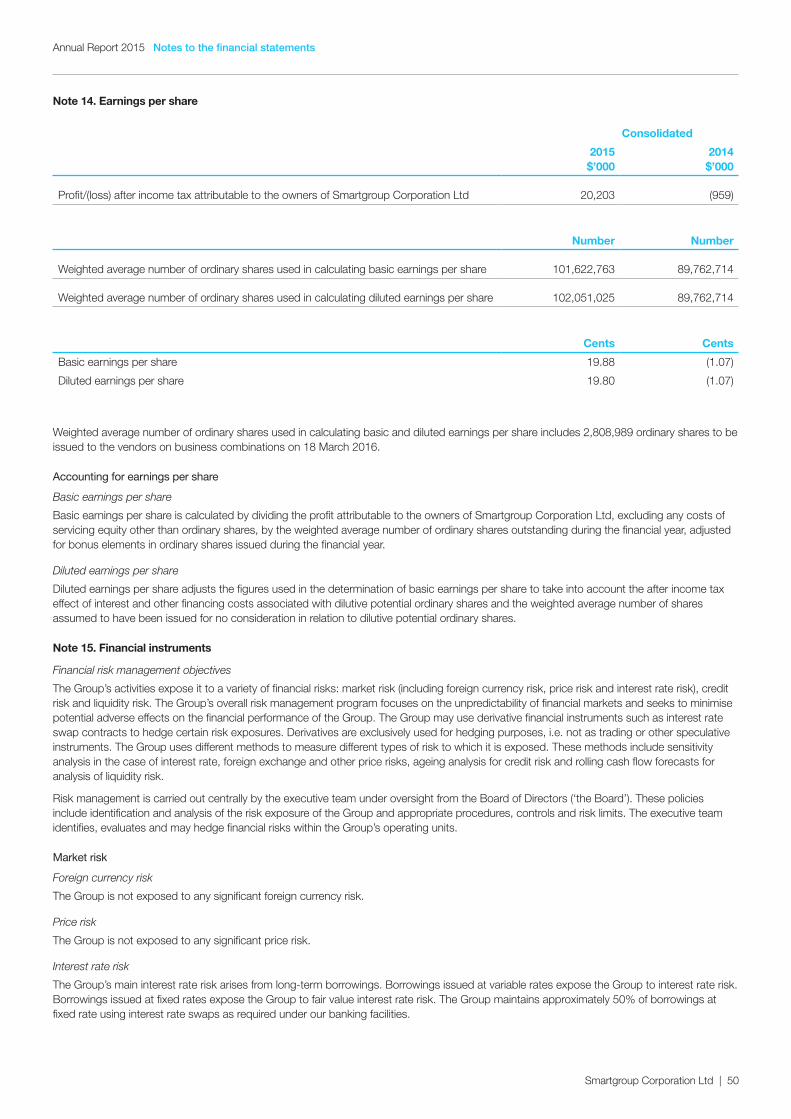
Notes to the financial statementsAnnual Report 2015
Smartgroup Corporation Ltd | 50
Note 14. Earnings per share
Consolidated
2015 $’000
2014 $’000
Profit/(loss) after income tax attributable to the owners of Smartgroup Corporation Ltd 20,203 (959)
Number Number
Weighted average number of ordinary shares used in calculating basic earnings per share 101,622,763 89,762,714
Weighted average number of ordinary shares used in calculating diluted earnings per share 102,051,025 89,762,714
Cents Cents
Basic earnings per share 19.88 (1.07)
Diluted earnings per share 19.80 (1.07)
Weighted average number of ordinary shares used in calculating basic and diluted earnings per share includes 2,808,989 ordinary shares to be issued to the vendors on business combinations on 18 March 2016.
Accounting for earnings per share
Basic earnings per share
Basic earnings per share is calculated by dividing the profit attributable to the owners of Smartgroup Corporation Ltd, excluding any costs of servicing equity other than ordinary shares, by the weighted average number of ordinary shares outstanding during the financial year, adjusted for bonus elements in ordinary shares issued during the financial year.
Diluted earnings per share
Diluted earnings per share adjusts the figures used in the determination of basic earnings per share to take into account the after income tax effect of interest and other financing costs associated with dilutive potential ordinary shares and the weighted average number of shares assumed to have been issued for no consideration in relation to dilutive potential ordinary shares.
Note 15. Financial instruments
Financial risk management objectives
The Group’s activities expose it to a variety of financial risks: market risk (including foreign currency risk, price risk and interest rate risk), credit risk and liquidity risk. The Group’s overall risk management program focuses on the unpredictability of financial markets and seeks to minimise potential adverse effects on the financial performance of the Group. The Group may use derivative financial instruments such as interest rate swap contracts to hedge certain risk exposures. Derivatives are exclusively used for hedging purposes, i.e. not as trading or other speculative instruments. The Group uses different methods to measure different types of risk to which it is exposed. These methods include sensitivity analysis in the case of interest rate, foreign exchange and other price risks, ageing analysis for credit risk and rolling cash flow forecasts for analysis of liquidity risk.
Risk management is carried out centrally by the executive team under oversight from the Board of Directors (‘the Board’). These policies include identification and analysis of the risk exposure of the Group and appropriate procedures, controls and risk limits. The executive team identifies, evaluates and may hedge financial risks within the Group’s operating units.
Market risk
Foreign currency risk
The Group is not exposed to any significant foreign currency risk.
Price risk
The Group is not exposed to any significant price risk.
Interest rate risk
The Group’s main interest rate risk arises from long-term borrowings. Borrowings issued at variable rates expose the Group to interest rate risk. Borrowings issued at fixed rates expose the Group to fair value interest rate risk. The Group maintains approximately 50% of borrowings at fixed rate using interest rate swaps as required under our banking facilities.
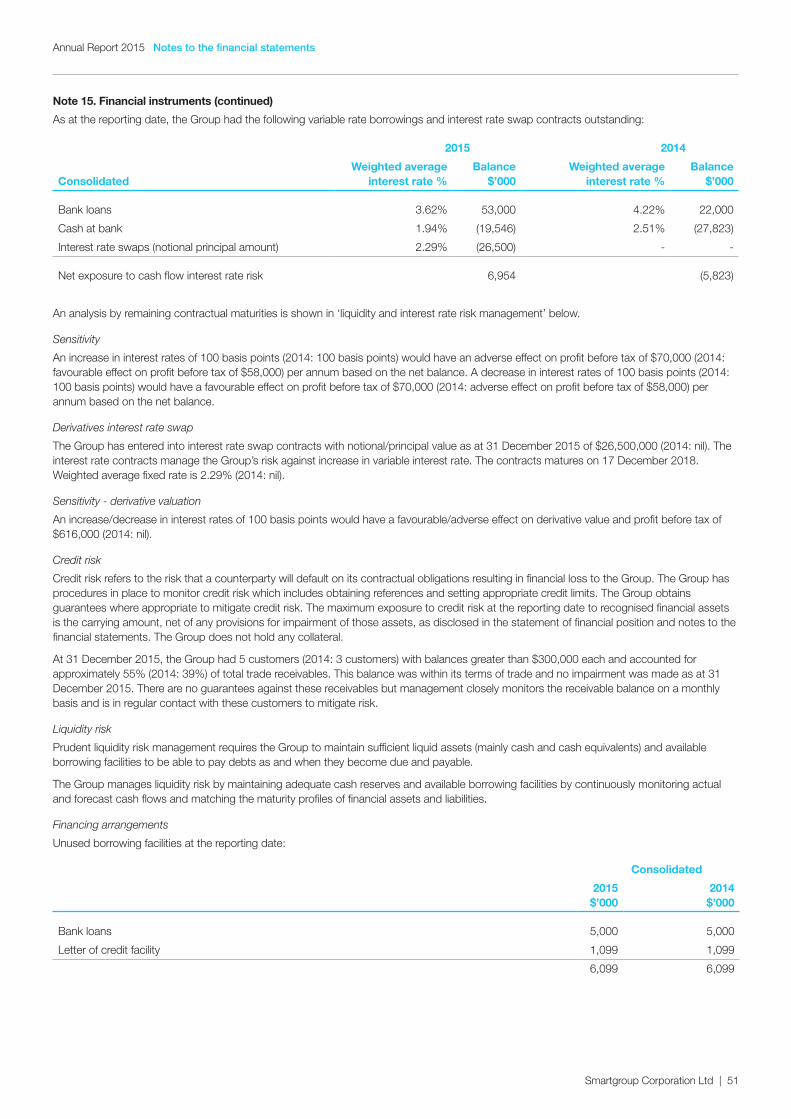
Notes to the financial statementsAnnual Report 2015
Smartgroup Corporation Ltd | 51
Note 15. Financial instruments (continued)
As at the reporting date, the Group had the following variable rate borrowings and interest rate swap contracts outstanding:
2015 2014
ConsolidatedWeighted average
interest rate % Balance
$’000Weighted average
interest rate %Balance
$’000
Bank loans 3.62% 53,000 4.22% 22,000
Cash at bank 1.94% (19,546) 2.51% (27,823)
Interest rate swaps (notional principal amount) 2.29% (26,500) - -
Net exposure to cash flow interest rate risk 6,954 (5,823)
An analysis by remaining contractual maturities is shown in ‘liquidity and interest rate risk management’ below.
Sensitivity
An increase in interest rates of 100 basis points (2014: 100 basis points) would have an adverse effect on profit before tax of $70,000 (2014: favourable effect on profit before tax of $58,000) per annum based on the net balance. A decrease in interest rates of 100 basis points (2014: 100 basis points) would have a favourable effect on profit before tax of $70,000 (2014: adverse effect on profit before tax of $58,000) per annum based on the net balance.
Derivatives interest rate swap
The Group has entered into interest rate swap contracts with notional/principal value as at 31 December 2015 of $26,500,000 (2014: nil). The interest rate contracts manage the Group’s risk against increase in variable interest rate. The contracts matures on 17 December 2018. Weighted average fixed rate is 2.29% (2014: nil).
Sensitivity - derivative valuation
An increase/decrease in interest rates of 100 basis points would have a favourable/adverse effect on derivative value and profit before tax of $616,000 (2014: nil).
Credit risk
Credit risk refers to the risk that a counterparty will default on its contractual obligations resulting in financial loss to the Group. The Group has procedures in place to monitor credit risk which includes obtaining references and setting appropriate credit limits. The Group obtains guarantees where appropriate to mitigate credit risk. The maximum exposure to credit risk at the reporting date to recognised financial assets is the carrying amount, net of any provisions for impairment of those assets, as disclosed in the statement of financial position and notes to the financial statements. The Group does not hold any collateral.
At 31 December 2015, the Group had 5 customers (2014: 3 customers) with balances greater than $300,000 each and accounted for approximately 55% (2014: 39%) of total trade receivables. This balance was within its terms of trade and no impairment was made as at 31 December 2015. There are no guarantees against these receivables but management closely monitors the receivable balance on a monthly basis and is in regular contact with these customers to mitigate risk.
Liquidity risk
Prudent liquidity risk management requires the Group to maintain sufficient liquid assets (mainly cash and cash equivalents) and available borrowing facilities to be able to pay debts as and when they become due and payable.
The Group manages liquidity risk by maintaining adequate cash reserves and available borrowing facilities by continuously monitoring actual and forecast cash flows and matching the maturity profiles of financial assets and liabilities.
Financing arrangements
Unused borrowing facilities at the reporting date:
Consolidated
2015 $’000
2014 $’000
Bank loans 5,000 5,000
Letter of credit facility 1,099 1,099
6,099 6,099
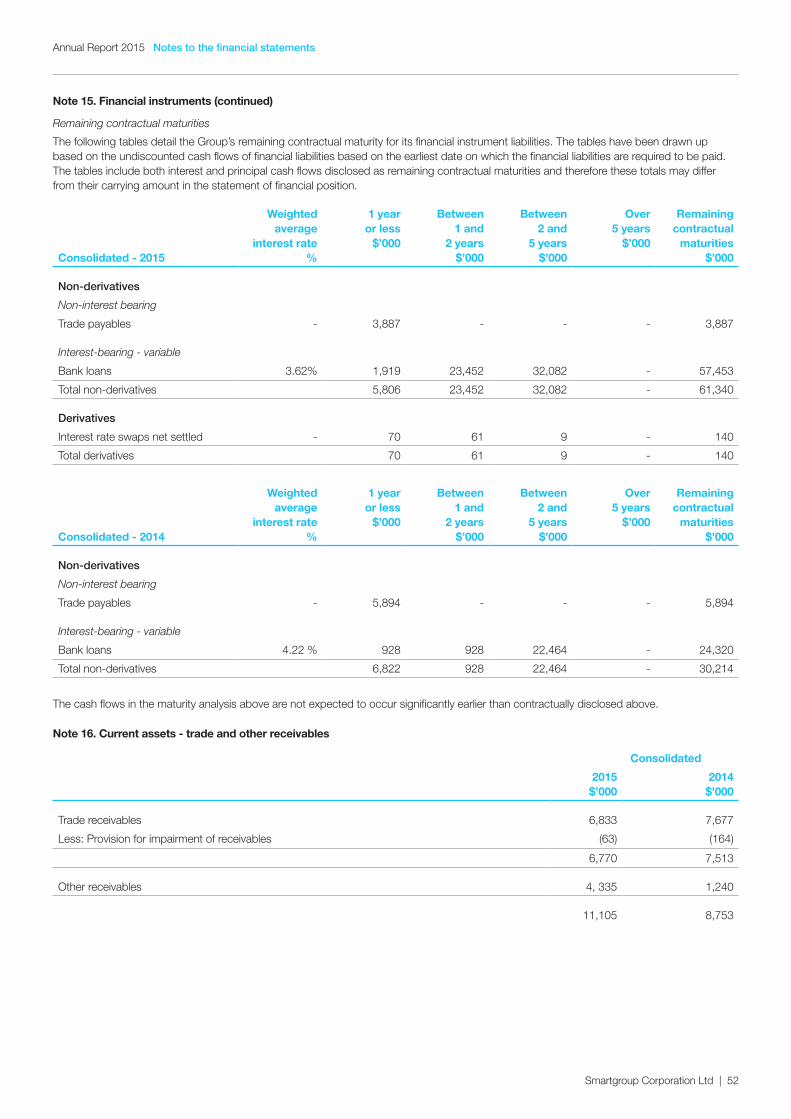
Notes to the financial statementsAnnual Report 2015
Smartgroup Corporation Ltd | 52
Note 15. Financial instruments (continued)
Remaining contractual maturities
The following tables detail the Group’s remaining contractual maturity for its financial instrument liabilities. The tables have been drawn up based on the undiscounted cash flows of financial liabilities based on the earliest date on which the financial liabilities are required to be paid. The tables include both interest and principal cash flows disclosed as remaining contractual maturities and therefore these totals may differ from their carrying amount in the statement of financial position.
Consolidated - 2015
Weighted average
interest rate %
1 year or less
$’000
Between 1 and
2 years $’000
Between 2 and
5 years $’000
Over 5 years
$’000
Remaining contractual
maturities $’000
Non-derivatives
Non-interest bearing
Trade payables - 3,887 - - - 3,887
Interest-bearing - variable
Bank loans 3.62% 1,919 23,452 32,082 - 57,453
Total non-derivatives 5,806 23,452 32,082 - 61,340
Derivatives
Interest rate swaps net settled - 70 61 9 - 140
Total derivatives 70 61 9 - 140
Consolidated - 2014
Weighted average
interest rate %
1 year or less
$’000
Between 1 and
2 years $’000
Between 2 and
5 years $’000
Over 5 years
$’000
Remaining contractual
maturities $’000
Non-derivatives
Non-interest bearing
Trade payables - 5,894 - - - 5,894
Interest-bearing - variable
Bank loans 4.22 % 928 928 22,464 - 24,320
Total non-derivatives 6,822 928 22,464 - 30,214
The cash flows in the maturity analysis above are not expected to occur significantly earlier than contractually disclosed above.
Note 16. Current assets - trade and other receivables
Consolidated
2015 $’000
2014 $’000
Trade receivables 6,833 7,677
Less: Provision for impairment of receivables (63) (164)
6,770 7,513
Other receivables 4, 335 1,240
11,105 8,753
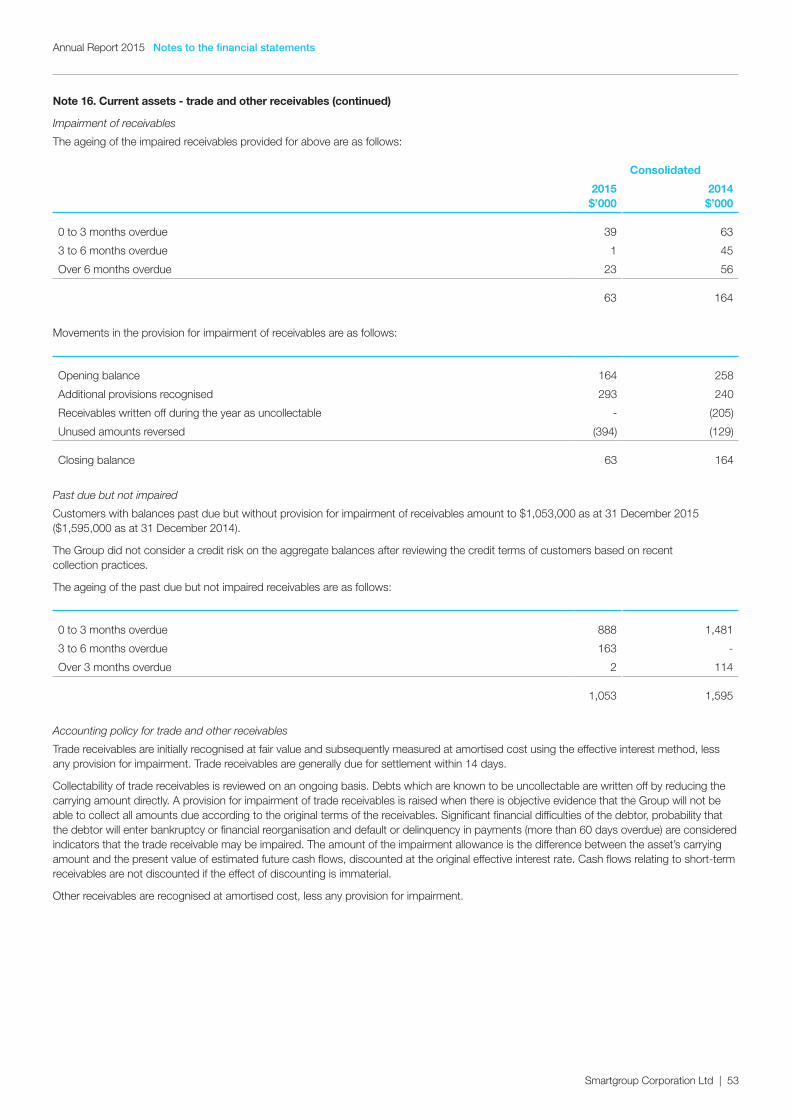
Notes to the financial statementsAnnual Report 2015
Smartgroup Corporation Ltd | 53
Note 16. Current assets - trade and other receivables (continued)
Impairment of receivables
The ageing of the impaired receivables provided for above are as follows:
Consolidated
2015 $’000
2014 $’000
0 to 3 months overdue 39 63
3 to 6 months overdue 1 45
Over 6 months overdue 23 56
63 164
Movements in the provision for impairment of receivables are as follows:
Opening balance 164 258
Additional provisions recognised 293 240
Receivables written off during the year as uncollectable - (205)
Unused amounts reversed (394) (129)
Closing balance 63 164
Past due but not impaired
Customers with balances past due but without provision for impairment of receivables amount to $1,053,000 as at 31 December 2015 ($1,595,000 as at 31 December 2014).
The Group did not consider a credit risk on the aggregate balances after reviewing the credit terms of customers based on recent collection practices.
The ageing of the past due but not impaired receivables are as follows:
0 to 3 months overdue 888 1,481
3 to 6 months overdue 163 -
Over 3 months overdue 2 114
1,053 1,595
Accounting policy for trade and other receivables
Trade receivables are initially recognised at fair value and subsequently measured at amortised cost using the effective interest method, less any provision for impairment. Trade receivables are generally due for settlement within 14 days.
Collectability of trade receivables is reviewed on an ongoing basis. Debts which are known to be uncollectable are written off by reducing the carrying amount directly. A provision for impairment of trade receivables is raised when there is objective evidence that the Group will not be able to collect all amounts due according to the original terms of the receivables. Significant financial difficulties of the debtor, probability that the debtor will enter bankruptcy or financial reorganisation and default or delinquency in payments (more than 60 days overdue) are considered indicators that the trade receivable may be impaired. The amount of the impairment allowance is the difference between the asset’s carrying amount and the present value of estimated future cash flows, discounted at the original effective interest rate. Cash flows relating to short-term receivables are not discounted if the effect of discounting is immaterial.
Other receivables are recognised at amortised cost, less any provision for impairment.
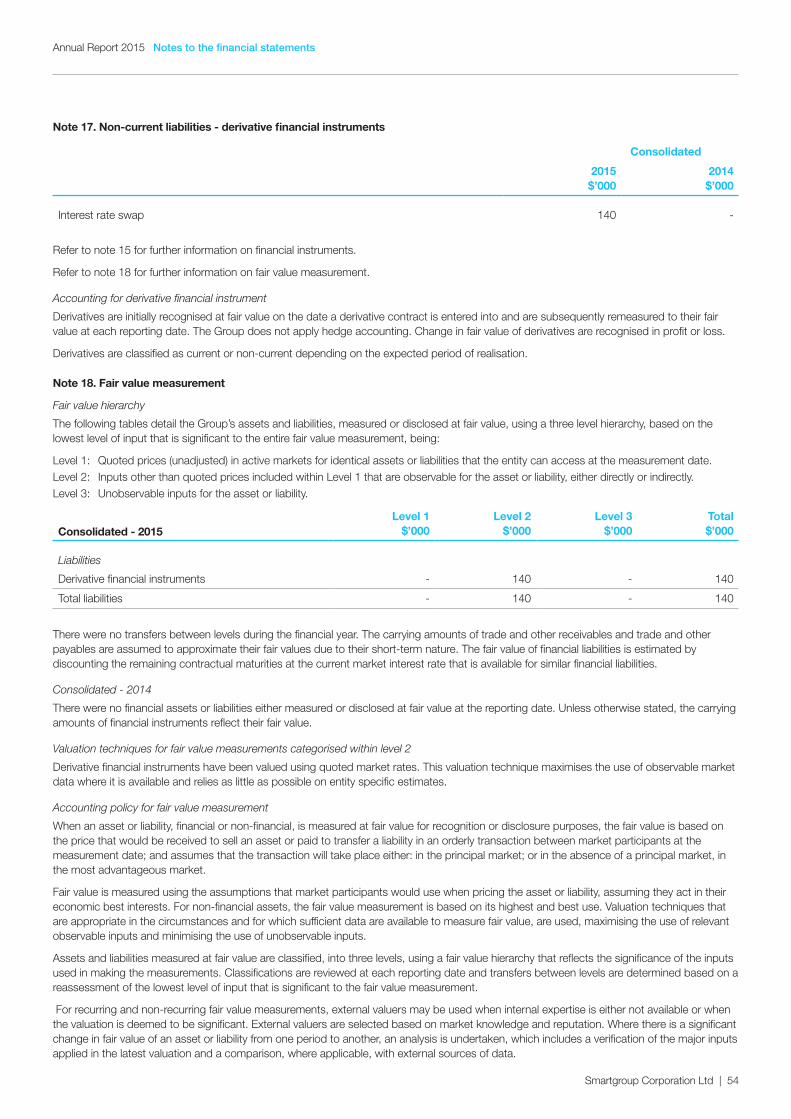
Notes to the financial statementsAnnual Report 2015
Smartgroup Corporation Ltd | 54
Note 17. Non-current liabilities - derivative financial instruments
Consolidated
2015 $’000
2014 $’000
Interest rate swap 140 -
Refer to note 15 for further information on financial instruments.
Refer to note 18 for further information on fair value measurement.
Accounting for derivative financial instrument
Derivatives are initially recognised at fair value on the date a derivative contract is entered into and are subsequently remeasured to their fair value at each reporting date. The Group does not apply hedge accounting. Change in fair value of derivatives are recognised in profit or loss.
Derivatives are classified as current or non-current depending on the expected period of realisation.
Note 18. Fair value measurement
Fair value hierarchy
The following tables detail the Group’s assets and liabilities, measured or disclosed at fair value, using a three level hierarchy, based on the lowest level of input that is significant to the entire fair value measurement, being:
Level 1: Quoted prices (unadjusted) in active markets for identical assets or liabilities that the entity can access at the measurement date.Level 2: Inputs other than quoted prices included within Level 1 that are observable for the asset or liability, either directly or indirectly.Level 3: Unobservable inputs for the asset or liability.
Consolidated - 2015Level 1
$’000Level 2
$’000Level 3
$’000Total $’000
Liabilities
Derivative financial instruments - 140 - 140
Total liabilities - 140 - 140
There were no transfers between levels during the financial year. The carrying amounts of trade and other receivables and trade and other payables are assumed to approximate their fair values due to their short-term nature. The fair value of financial liabilities is estimated by discounting the remaining contractual maturities at the current market interest rate that is available for similar financial liabilities.
Consolidated - 2014
There were no financial assets or liabilities either measured or disclosed at fair value at the reporting date. Unless otherwise stated, the carrying amounts of financial instruments reflect their fair value.
Valuation techniques for fair value measurements categorised within level 2
Derivative financial instruments have been valued using quoted market rates. This valuation technique maximises the use of observable market data where it is available and relies as little as possible on entity specific estimates.
Accounting policy for fair value measurement
When an asset or liability, financial or non-financial, is measured at fair value for recognition or disclosure purposes, the fair value is based on the price that would be received to sell an asset or paid to transfer a liability in an orderly transaction between market participants at the measurement date; and assumes that the transaction will take place either: in the principal market; or in the absence of a principal market, in the most advantageous market.
Fair value is measured using the assumptions that market participants would use when pricing the asset or liability, assuming they act in their economic best interests. For non-financial assets, the fair value measurement is based on its highest and best use. Valuation techniques that are appropriate in the circumstances and for which sufficient data are available to measure fair value, are used, maximising the use of relevant observable inputs and minimising the use of unobservable inputs.
Assets and liabilities measured at fair value are classified, into three levels, using a fair value hierarchy that reflects the significance of the inputs used in making the measurements. Classifications are reviewed at each reporting date and transfers between levels are determined based on a reassessment of the lowest level of input that is significant to the fair value measurement.
For recurring and non-recurring fair value measurements, external valuers may be used when internal expertise is either not available or when the valuation is deemed to be significant. External valuers are selected based on market knowledge and reputation. Where there is a significant change in fair value of an asset or liability from one period to another, an analysis is undertaken, which includes a verification of the major inputs applied in the latest valuation and a comparison, where applicable, with external sources of data.
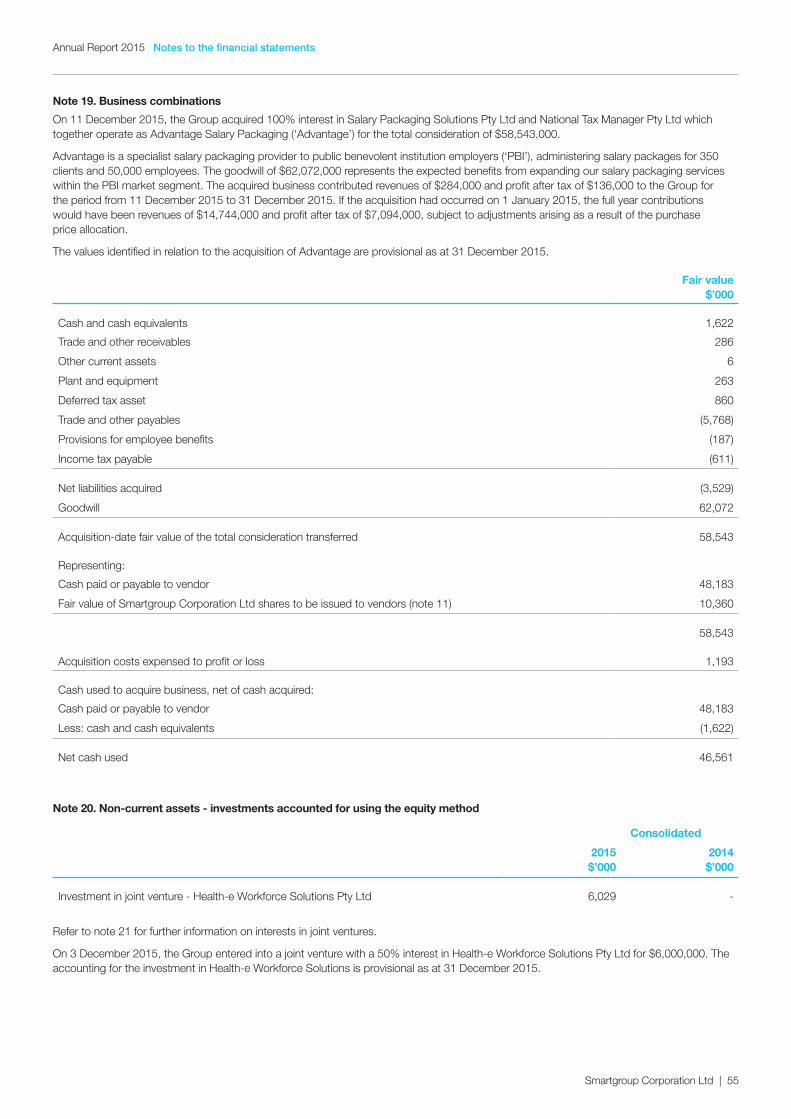
Notes to the financial statementsAnnual Report 2015
Smartgroup Corporation Ltd | 55
Note 19. Business combinations
On 11 December 2015, the Group acquired 100% interest in Salary Packaging Solutions Pty Ltd and National Tax Manager Pty Ltd which together operate as Advantage Salary Packaging (‘Advantage’) for the total consideration of $58,543,000.
Advantage is a specialist salary packaging provider to public benevolent institution employers (‘PBI’), administering salary packages for 350 clients and 50,000 employees. The goodwill of $62,072,000 represents the expected benefits from expanding our salary packaging services within the PBI market segment. The acquired business contributed revenues of $284,000 and profit after tax of $136,000 to the Group for the period from 11 December 2015 to 31 December 2015. If the acquisition had occurred on 1 January 2015, the full year contributions would have been revenues of $14,744,000 and profit after tax of $7,094,000, subject to adjustments arising as a result of the purchase price allocation.
The values identified in relation to the acquisition of Advantage are provisional as at 31 December 2015.
Fair value $’000
Cash and cash equivalents 1,622
Trade and other receivables 286
Other current assets 6
Plant and equipment 263
Deferred tax asset 860
Trade and other payables (5,768)
Provisions for employee benefits (187)
Income tax payable (611)
Net liabilities acquired (3,529)
Goodwill 62,072
Acquisition-date fair value of the total consideration transferred 58,543
Representing:
Cash paid or payable to vendor 48,183
Fair value of Smartgroup Corporation Ltd shares to be issued to vendors (note 11) 10,360
58,543
Acquisition costs expensed to profit or loss 1,193
Cash used to acquire business, net of cash acquired:
Cash paid or payable to vendor 48,183
Less: cash and cash equivalents (1,622)
Net cash used 46,561
Note 20. Non-current assets - investments accounted for using the equity method
Consolidated
2015 $’000
2014 $’000
Investment in joint venture - Health-e Workforce Solutions Pty Ltd 6,029 -
Refer to note 21 for further information on interests in joint ventures.
On 3 December 2015, the Group entered into a joint venture with a 50% interest in Health-e Workforce Solutions Pty Ltd for $6,000,000. The accounting for the investment in Health-e Workforce Solutions is provisional as at 31 December 2015.
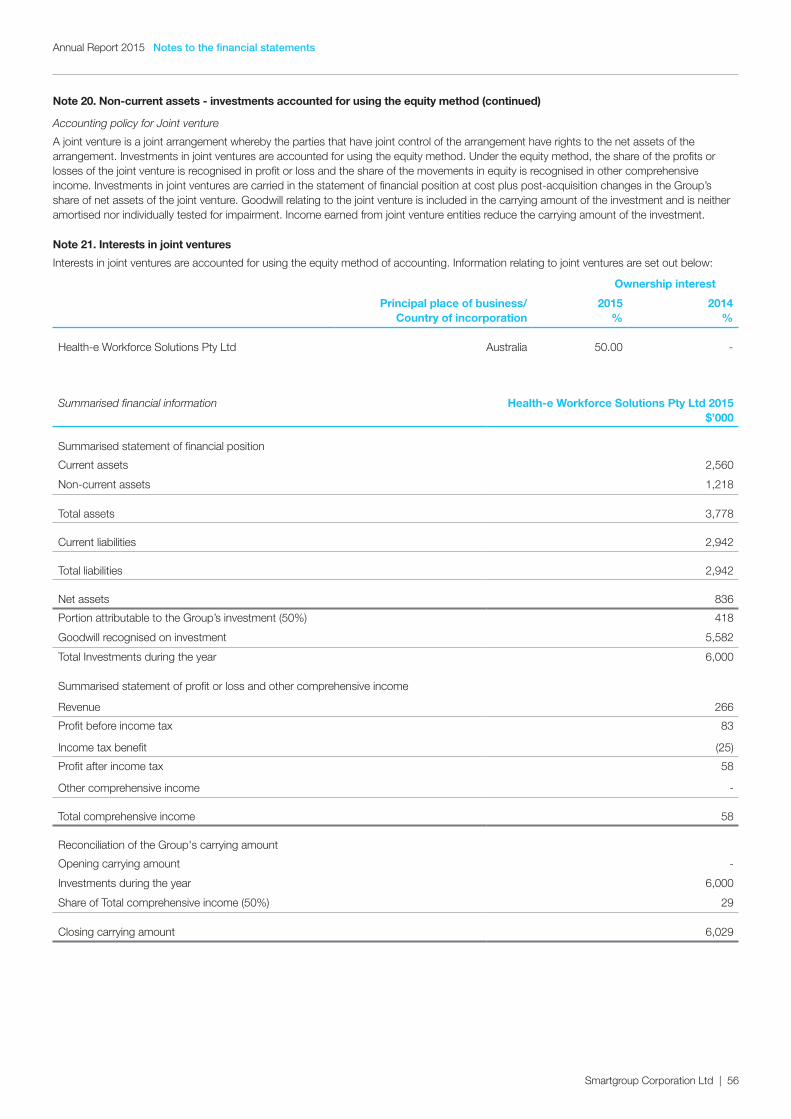
Notes to the financial statementsAnnual Report 2015
Smartgroup Corporation Ltd | 56
Note 20. Non-current assets - investments accounted for using the equity method (continued)
Accounting policy for Joint venture
A joint venture is a joint arrangement whereby the parties that have joint control of the arrangement have rights to the net assets of the arrangement. Investments in joint ventures are accounted for using the equity method. Under the equity method, the share of the profits or losses of the joint venture is recognised in profit or loss and the share of the movements in equity is recognised in other comprehensive income. Investments in joint ventures are carried in the statement of financial position at cost plus post-acquisition changes in the Group’s share of net assets of the joint venture. Goodwill relating to the joint venture is included in the carrying amount of the investment and is neither amortised nor individually tested for impairment. Income earned from joint venture entities reduce the carrying amount of the investment.
Note 21. Interests in joint ventures
Interests in joint ventures are accounted for using the equity method of accounting. Information relating to joint ventures are set out below:
Ownership interest
Principal place of business/Country of incorporation
2015 %
2014 %
Health-e Workforce Solutions Pty Ltd Australia 50.00 -
Summarised financial information Health-e Workforce Solutions Pty Ltd 2015 $’000
Summarised statement of financial position
Current assets 2,560
Non-current assets 1,218
Total assets 3,778
Current liabilities 2,942
Total liabilities 2,942
Net assets 836
Portion attributable to the Group’s investment (50%) 418
Goodwill recognised on investment 5,582
Total Investments during the year 6,000
Summarised statement of profit or loss and other comprehensive income
Revenue 266
Profit before income tax 83
Income tax benefit (25)
Profit after income tax 58
Other comprehensive income -
Total comprehensive income 58
Reconciliation of the Group's carrying amount
Opening carrying amount -
Investments during the year 6,000
Share of Total comprehensive income (50%) 29
Closing carrying amount 6,029
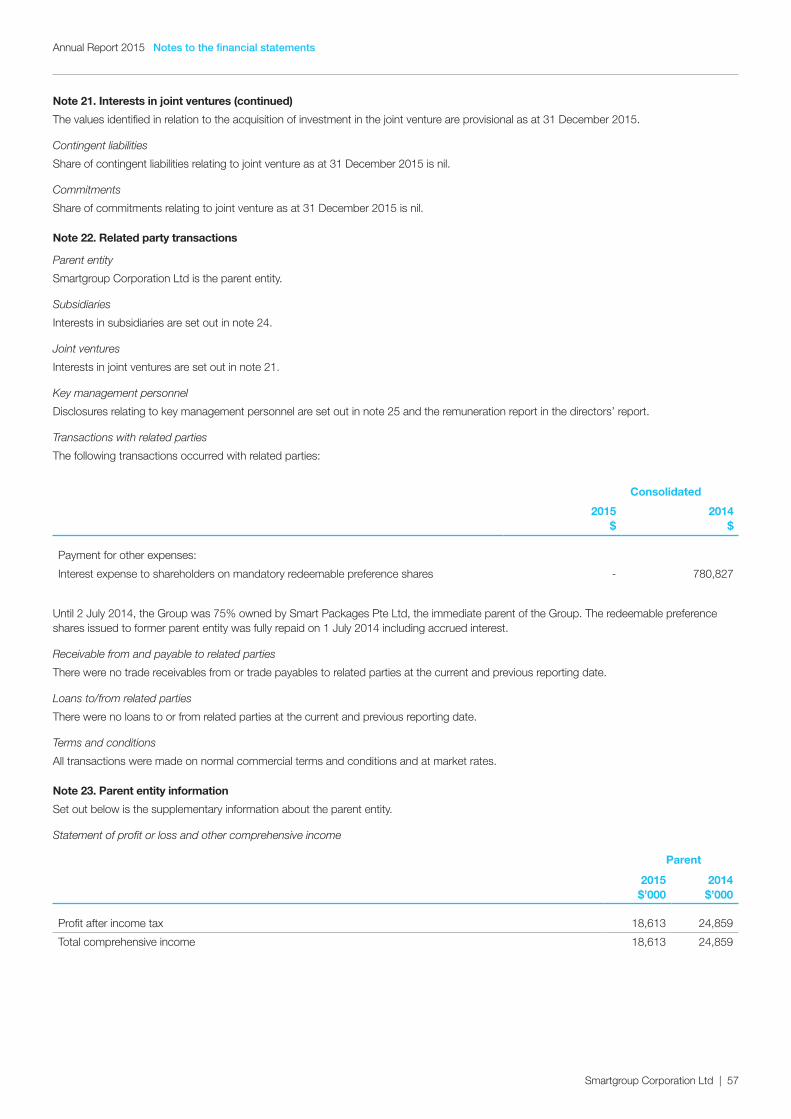
Notes to the financial statementsAnnual Report 2015
Smartgroup Corporation Ltd | 57
Note 21. Interests in joint ventures (continued)
The values identified in relation to the acquisition of investment in the joint venture are provisional as at 31 December 2015.
Contingent liabilities
Share of contingent liabilities relating to joint venture as at 31 December 2015 is nil.
Commitments
Share of commitments relating to joint venture as at 31 December 2015 is nil.
Note 22. Related party transactions
Parent entity
Smartgroup Corporation Ltd is the parent entity.
Subsidiaries
Interests in subsidiaries are set out in note 24.
Joint ventures
Interests in joint ventures are set out in note 21.
Key management personnel
Disclosures relating to key management personnel are set out in note 25 and the remuneration report in the directors’ report.
Transactions with related parties
The following transactions occurred with related parties:
Consolidated
2015 $
2014 $
Payment for other expenses:
Interest expense to shareholders on mandatory redeemable preference shares - 780,827
Until 2 July 2014, the Group was 75% owned by Smart Packages Pte Ltd, the immediate parent of the Group. The redeemable preference shares issued to former parent entity was fully repaid on 1 July 2014 including accrued interest.
Receivable from and payable to related parties
There were no trade receivables from or trade payables to related parties at the current and previous reporting date.
Loans to/from related parties
There were no loans to or from related parties at the current and previous reporting date.
Terms and conditions
All transactions were made on normal commercial terms and conditions and at market rates.
Note 23. Parent entity information
Set out below is the supplementary information about the parent entity.
Statement of profit or loss and other comprehensive income
Parent
2015 $’000
2014 $’000
Profit after income tax 18,613 24,859
Total comprehensive income 18,613 24,859
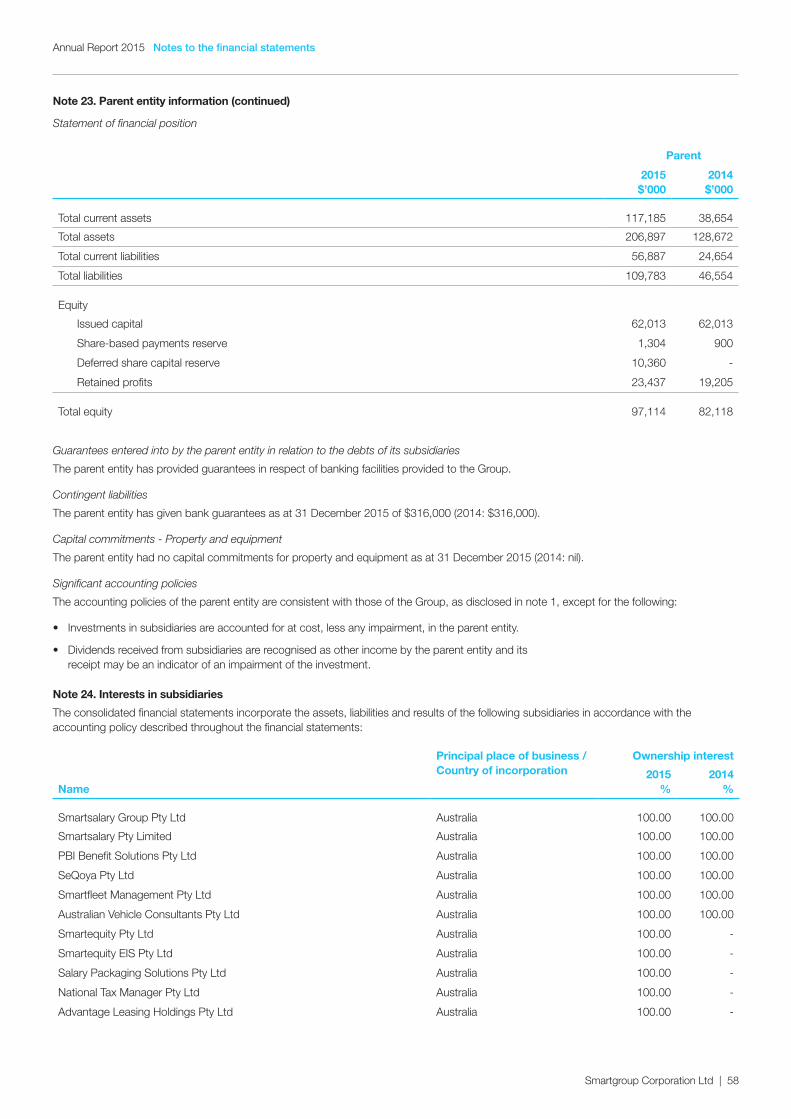
Notes to the financial statementsAnnual Report 2015
Smartgroup Corporation Ltd | 58
Note 23. Parent entity information (continued)
Statement of financial position
Parent
2015 $’000
2014 $’000
Total current assets 117,185 38,654
Total assets 206,897 128,672
Total current liabilities 56,887 24,654
Total liabilities 109,783 46,554
Equity
Issued capital 62,013 62,013
Share-based payments reserve 1,304 900
Deferred share capital reserve 10,360 -
Retained profits 23,437 19,205
Total equity 97,114 82,118
Guarantees entered into by the parent entity in relation to the debts of its subsidiaries
The parent entity has provided guarantees in respect of banking facilities provided to the Group.
Contingent liabilities
The parent entity has given bank guarantees as at 31 December 2015 of $316,000 (2014: $316,000).
Capital commitments - Property and equipment
The parent entity had no capital commitments for property and equipment as at 31 December 2015 (2014: nil).
Significant accounting policies
The accounting policies of the parent entity are consistent with those of the Group, as disclosed in note 1, except for the following:
• Investments in subsidiaries are accounted for at cost, less any impairment, in the parent entity.
• Dividends received from subsidiaries are recognised as other income by the parent entity and its receipt may be an indicator of an impairment of the investment.
Note 24. Interests in subsidiaries
The consolidated financial statements incorporate the assets, liabilities and results of the following subsidiaries in accordance with the accounting policy described throughout the financial statements:
Principal place of business / Country of incorporation
Ownership interest
Name2015
%2014
%
Smartsalary Group Pty Ltd Australia 100.00 100.00
Smartsalary Pty Limited Australia 100.00 100.00
PBI Benefit Solutions Pty Ltd Australia 100.00 100.00
SeQoya Pty Ltd Australia 100.00 100.00
Smartfleet Management Pty Ltd Australia 100.00 100.00
Australian Vehicle Consultants Pty Ltd Australia 100.00 100.00
Smartequity Pty Ltd Australia 100.00 -
Smartequity EIS Pty Ltd Australia 100.00 -
Salary Packaging Solutions Pty Ltd Australia 100.00 -
National Tax Manager Pty Ltd Australia 100.00 -
Advantage Leasing Holdings Pty Ltd Australia 100.00 -
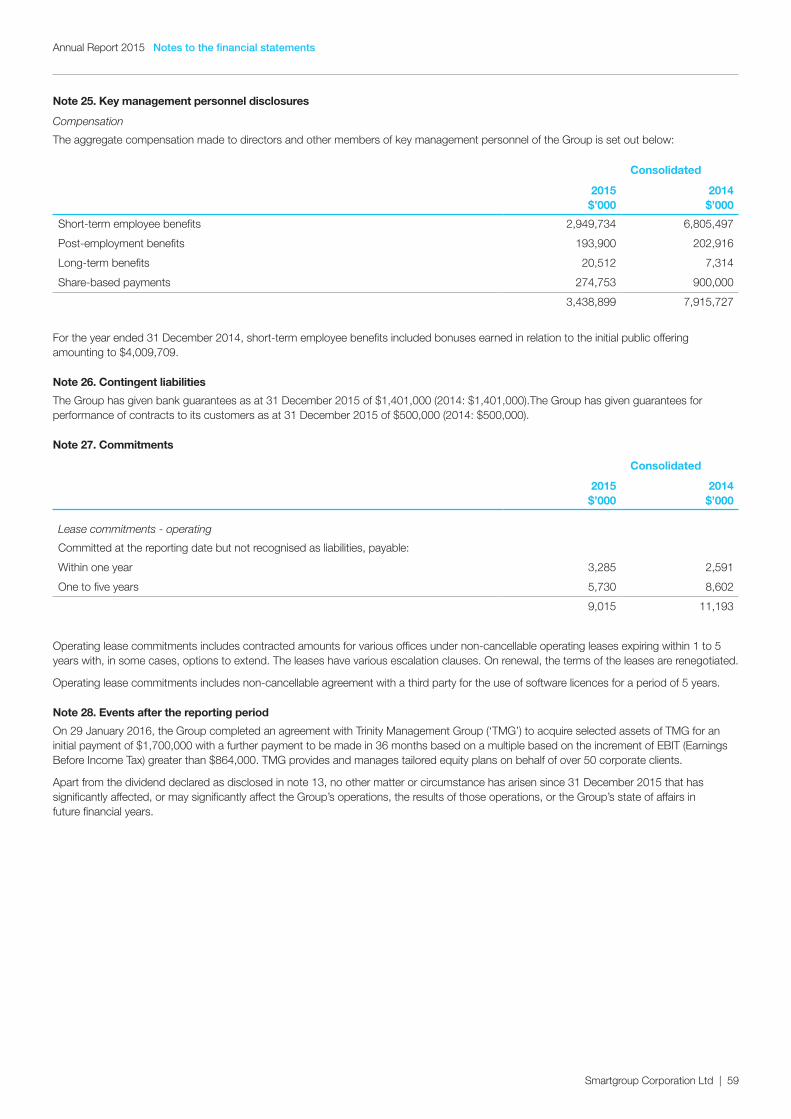
Notes to the financial statementsAnnual Report 2015
Smartgroup Corporation Ltd | 59
Note 25. Key management personnel disclosures
Compensation
The aggregate compensation made to directors and other members of key management personnel of the Group is set out below:
Consolidated
2015 $’000
2014 $’000
Short-term employee benefits 2,949,734 6,805,497
Post-employment benefits 193,900 202,916
Long-term benefits 20,512 7,314
Share-based payments 274,753 900,000
3,438,899 7,915,727
For the year ended 31 December 2014, short-term employee benefits included bonuses earned in relation to the initial public offering amounting to $4,009,709.
Note 26. Contingent liabilities
The Group has given bank guarantees as at 31 December 2015 of $1,401,000 (2014: $1,401,000).The Group has given guarantees for performance of contracts to its customers as at 31 December 2015 of $500,000 (2014: $500,000).
Note 27. Commitments
Consolidated
2015 $’000
2014 $’000
Lease commitments - operating
Committed at the reporting date but not recognised as liabilities, payable:
Within one year 3,285 2,591
One to five years 5,730 8,602
9,015 11,193
Operating lease commitments includes contracted amounts for various offices under non-cancellable operating leases expiring within 1 to 5 years with, in some cases, options to extend. The leases have various escalation clauses. On renewal, the terms of the leases are renegotiated.
Operating lease commitments includes non-cancellable agreement with a third party for the use of software licences for a period of 5 years.
Note 28. Events after the reporting period
On 29 January 2016, the Group completed an agreement with Trinity Management Group (‘TMG’) to acquire selected assets of TMG for an initial payment of $1,700,000 with a further payment to be made in 36 months based on a multiple based on the increment of EBIT (Earnings Before Income Tax) greater than $864,000. TMG provides and manages tailored equity plans on behalf of over 50 corporate clients.
Apart from the dividend declared as disclosed in note 13, no other matter or circumstance has arisen since 31 December 2015 that has significantly affected, or may significantly affect the Group’s operations, the results of those operations, or the Group’s state of affairs in future financial years.
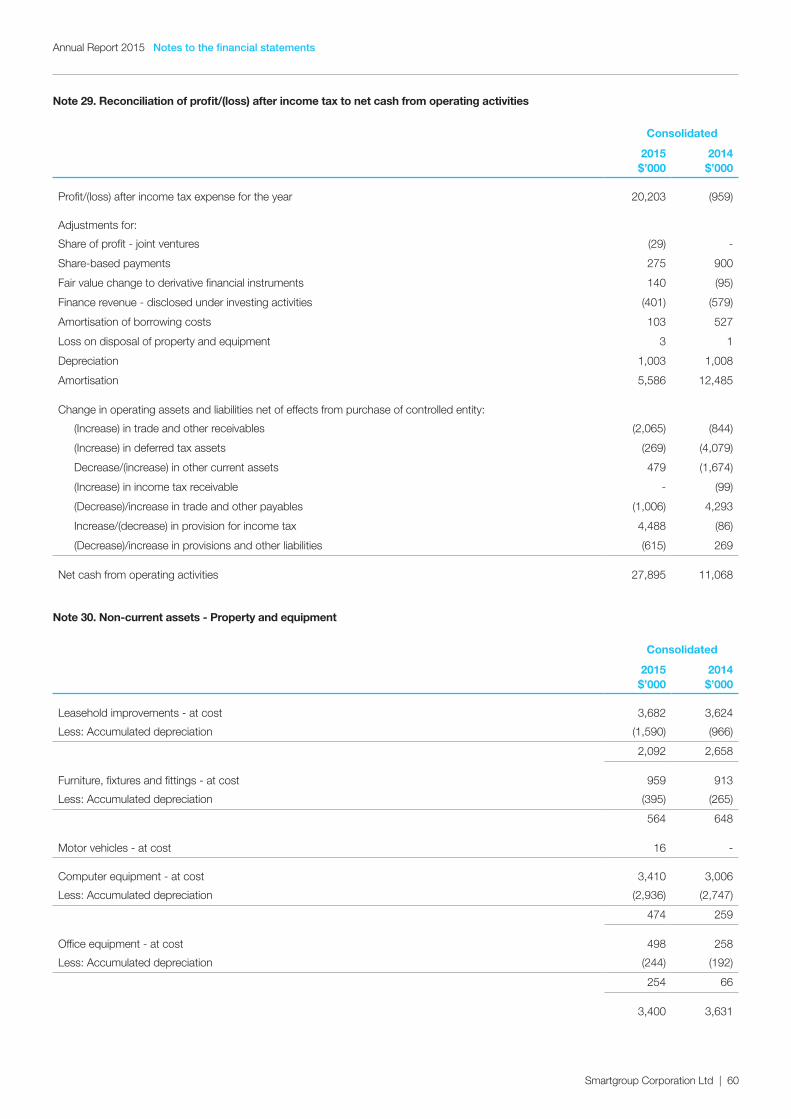
Notes to the financial statementsAnnual Report 2015
Smartgroup Corporation Ltd | 60
Note 29. Reconciliation of profit/(loss) after income tax to net cash from operating activities
Consolidated
2015 $’000
2014 $’000
Profit/(loss) after income tax expense for the year 20,203 (959)
Adjustments for:
Share of profit - joint ventures (29) -
Share-based payments 275 900
Fair value change to derivative financial instruments 140 (95)
Finance revenue - disclosed under investing activities (401) (579)
Amortisation of borrowing costs 103 527
Loss on disposal of property and equipment 3 1
Depreciation 1,003 1,008
Amortisation 5,586 12,485
Change in operating assets and liabilities net of effects from purchase of controlled entity:
(Increase) in trade and other receivables (2,065) (844)
(Increase) in deferred tax assets (269) (4,079)
Decrease/(increase) in other current assets 479 (1,674)
(Increase) in income tax receivable - (99)
(Decrease)/increase in trade and other payables (1,006) 4,293
Increase/(decrease) in provision for income tax 4,488 (86)
(Decrease)/increase in provisions and other liabilities (615) 269
Net cash from operating activities 27,895 11,068
Note 30. Non-current assets - Property and equipment
Consolidated
2015 $’000
2014 $’000
Leasehold improvements - at cost 3,682 3,624
Less: Accumulated depreciation (1,590) (966)
2,092 2,658
Furniture, fixtures and fittings - at cost 959 913
Less: Accumulated depreciation (395) (265)
564 648
Motor vehicles - at cost 16 -
Computer equipment - at cost 3,410 3,006
Less: Accumulated depreciation (2,936) (2,747)
474 259
Office equipment - at cost 498 258
Less: Accumulated depreciation (244) (192)
254 66
3,400 3,631
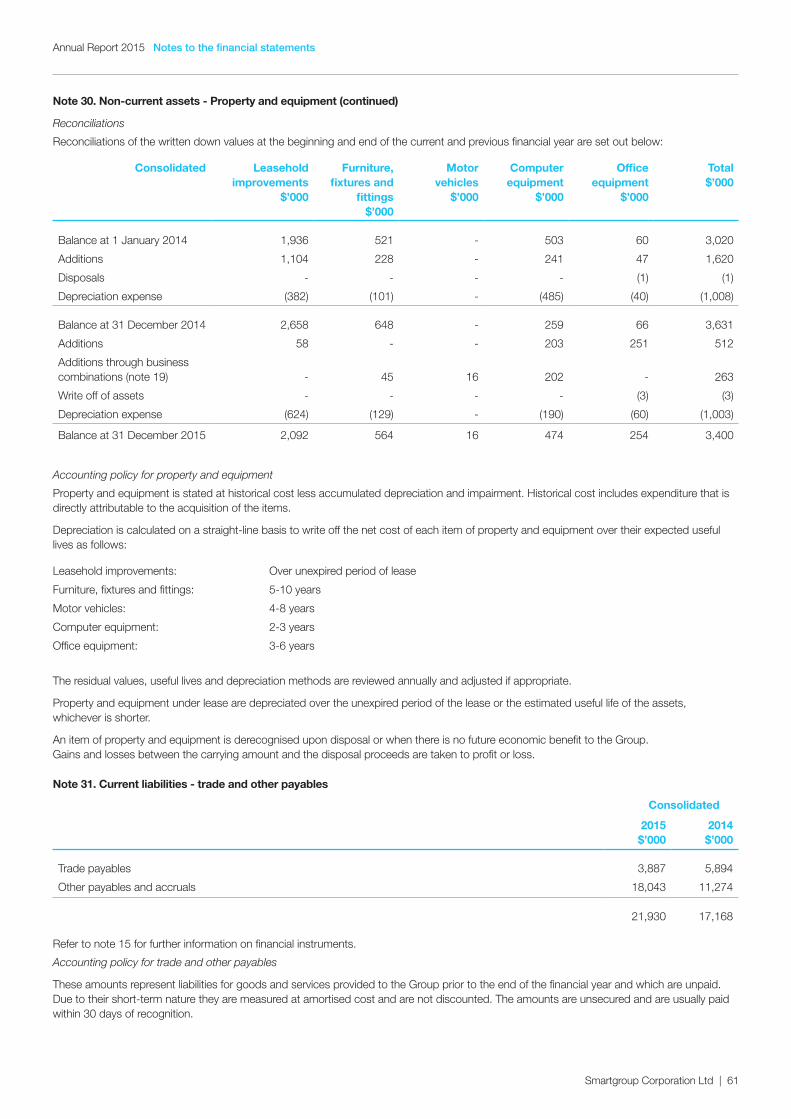
Notes to the financial statementsAnnual Report 2015
Smartgroup Corporation Ltd | 61
Note 30. Non-current assets - Property and equipment (continued)
Reconciliations
Reconciliations of the written down values at the beginning and end of the current and previous financial year are set out below:
Consolidated Leasehold improvements
$’000
Furniture, fixtures and
fittings $’000
Motor vehicles
$’000
Computer equipment
$’000
Office equipment
$’000
Total $’000
Balance at 1 January 2014 1,936 521 - 503 60 3,020
Additions 1,104 228 - 241 47 1,620
Disposals - - - - (1) (1)
Depreciation expense (382) (101) - (485) (40) (1,008)
Balance at 31 December 2014 2,658 648 - 259 66 3,631
Additions 58 - - 203 251 512
Additions through business combinations (note 19) - 45 16 202 - 263
Write off of assets - - - - (3) (3)
Depreciation expense (624) (129) - (190) (60) (1,003)
Balance at 31 December 2015 2,092 564 16 474 254 3,400
Accounting policy for property and equipment
Property and equipment is stated at historical cost less accumulated depreciation and impairment. Historical cost includes expenditure that is directly attributable to the acquisition of the items.
Depreciation is calculated on a straight-line basis to write off the net cost of each item of property and equipment over their expected useful lives as follows:
Leasehold improvements: Over unexpired period of lease
Furniture, fixtures and fittings: 5-10 years
Motor vehicles: 4-8 years
Computer equipment: 2-3 years
Office equipment: 3-6 years
The residual values, useful lives and depreciation methods are reviewed annually and adjusted if appropriate.
Property and equipment under lease are depreciated over the unexpired period of the lease or the estimated useful life of the assets, whichever is shorter.
An item of property and equipment is derecognised upon disposal or when there is no future economic benefit to the Group. Gains and losses between the carrying amount and the disposal proceeds are taken to profit or loss.
Note 31. Current liabilities - trade and other payables
Consolidated
2015 $’000
2014 $’000
Trade payables 3,887 5,894
Other payables and accruals 18,043 11,274
21,930 17,168
Refer to note 15 for further information on financial instruments.
Accounting policy for trade and other payables
These amounts represent liabilities for goods and services provided to the Group prior to the end of the financial year and which are unpaid. Due to their short-term nature they are measured at amortised cost and are not discounted. The amounts are unsecured and are usually paid within 30 days of recognition.
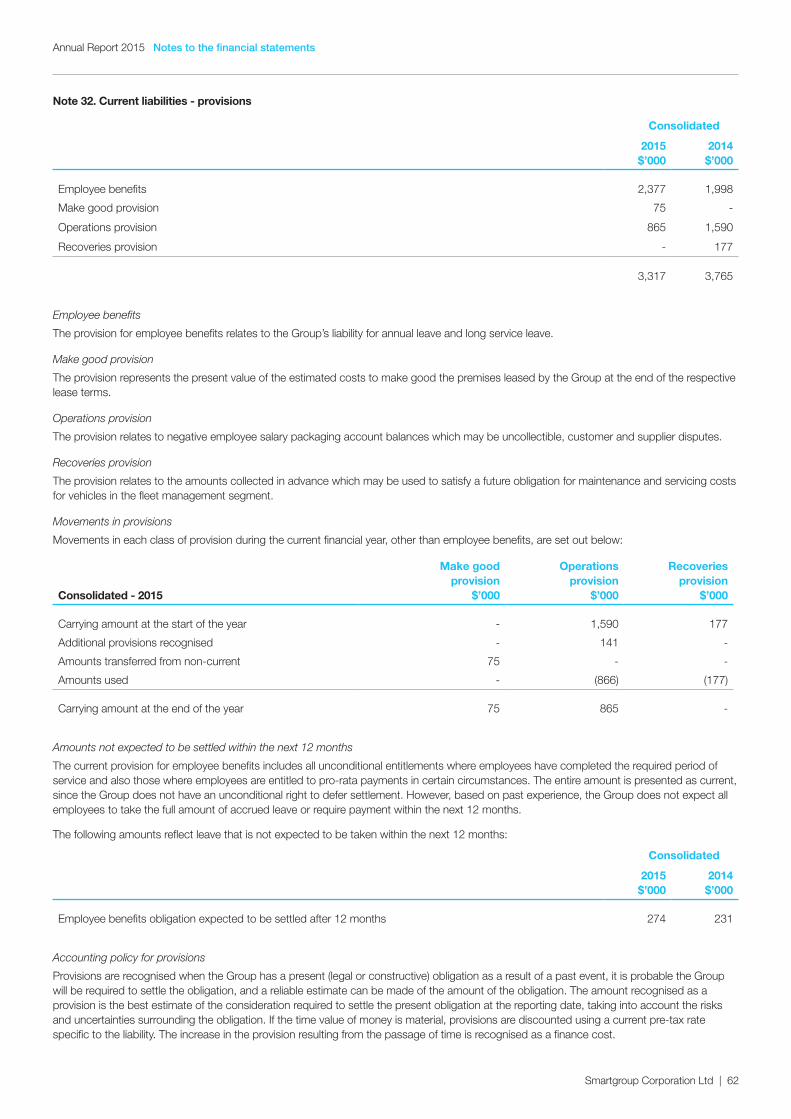
Notes to the financial statementsAnnual Report 2015
Smartgroup Corporation Ltd | 62
Note 32. Current liabilities - provisions
Consolidated
2015 $’000
2014 $’000
Employee benefits 2,377 1,998
Make good provision 75 -
Operations provision 865 1,590
Recoveries provision - 177
3,317 3,765
Employee benefits
The provision for employee benefits relates to the Group’s liability for annual leave and long service leave.
Make good provision
The provision represents the present value of the estimated costs to make good the premises leased by the Group at the end of the respective lease terms.
Operations provision
The provision relates to negative employee salary packaging account balances which may be uncollectible, customer and supplier disputes.
Recoveries provision
The provision relates to the amounts collected in advance which may be used to satisfy a future obligation for maintenance and servicing costs for vehicles in the fleet management segment.
Movements in provisions
Movements in each class of provision during the current financial year, other than employee benefits, are set out below:
Consolidated - 2015
Make good provision
$’000
Operations provision
$’000
Recoveries provision
$’000
Carrying amount at the start of the year - 1,590 177
Additional provisions recognised - 141 -
Amounts transferred from non-current 75 - -
Amounts used - (866) (177)
Carrying amount at the end of the year 75 865 -
Amounts not expected to be settled within the next 12 months
The current provision for employee benefits includes all unconditional entitlements where employees have completed the required period of service and also those where employees are entitled to pro-rata payments in certain circumstances. The entire amount is presented as current, since the Group does not have an unconditional right to defer settlement. However, based on past experience, the Group does not expect all employees to take the full amount of accrued leave or require payment within the next 12 months.
The following amounts reflect leave that is not expected to be taken within the next 12 months:
Consolidated
2015 $’000
2014 $’000
Employee benefits obligation expected to be settled after 12 months 274 231
Accounting policy for provisions
Provisions are recognised when the Group has a present (legal or constructive) obligation as a result of a past event, it is probable the Group will be required to settle the obligation, and a reliable estimate can be made of the amount of the obligation. The amount recognised as a provision is the best estimate of the consideration required to settle the present obligation at the reporting date, taking into account the risks and uncertainties surrounding the obligation. If the time value of money is material, provisions are discounted using a current pre-tax rate specific to the liability. The increase in the provision resulting from the passage of time is recognised as a finance cost.
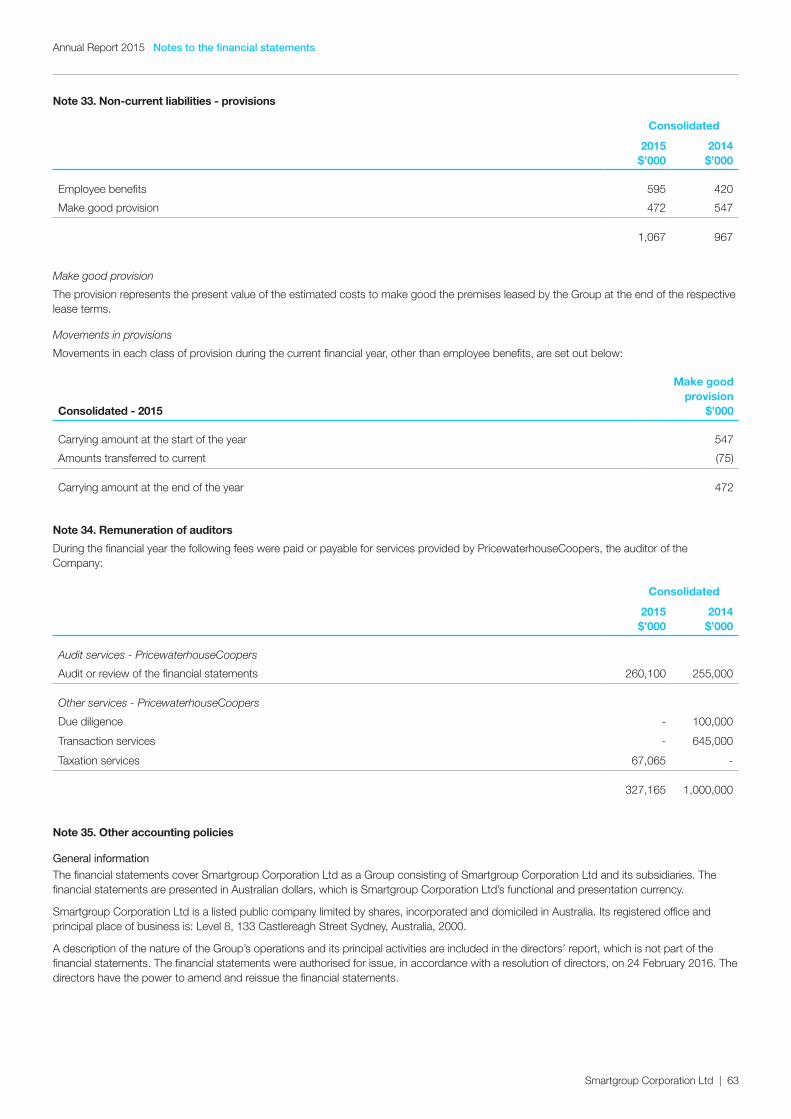
Notes to the financial statementsAnnual Report 2015
Smartgroup Corporation Ltd | 63
Note 33. Non-current liabilities - provisions
Consolidated
2015 $’000
2014 $’000
Employee benefits 595 420
Make good provision 472 547
1,067 967
Make good provision
The provision represents the present value of the estimated costs to make good the premises leased by the Group at the end of the respective lease terms.
Movements in provisions
Movements in each class of provision during the current financial year, other than employee benefits, are set out below:
Consolidated - 2015
Make good provision
$’000
Carrying amount at the start of the year 547
Amounts transferred to current (75)
Carrying amount at the end of the year 472
Note 34. Remuneration of auditors
During the financial year the following fees were paid or payable for services provided by PricewaterhouseCoopers, the auditor of the Company:
Consolidated
2015 $’000
2014 $’000
Audit services - PricewaterhouseCoopers
Audit or review of the financial statements 260,100 255,000
Other services - PricewaterhouseCoopers
Due diligence - 100,000
Transaction services - 645,000
Taxation services 67,065 -
327,165 1,000,000
Note 35. Other accounting policies
General information
The financial statements cover Smartgroup Corporation Ltd as a Group consisting of Smartgroup Corporation Ltd and its subsidiaries. The financial statements are presented in Australian dollars, which is Smartgroup Corporation Ltd’s functional and presentation currency.
Smartgroup Corporation Ltd is a listed public company limited by shares, incorporated and domiciled in Australia. Its registered office and principal place of business is: Level 8, 133 Castlereagh Street Sydney, Australia, 2000.
A description of the nature of the Group’s operations and its principal activities are included in the directors’ report, which is not part of the financial statements. The financial statements were authorised for issue, in accordance with a resolution of directors, on 24 February 2016. The directors have the power to amend and reissue the financial statements.
Notes to the financial statementsAnnual Report 2015
Smartgroup Corporation Ltd | 64
Note 35. Other accounting policies (continued)
Principles of consolidation
The consolidated financial statements incorporate the assets and liabilities of all subsidiaries of Smartgroup Corporation Ltd (‘Company’ or ‘parent entity’) as at 31 December 2015 and the results of all subsidiaries for the year then ended. Smartgroup Corporation Ltd and its subsidiaries together are referred to in these financial statements as the ‘Group’.
Subsidiaries are all those entities over which the Group has control. The Group controls an entity when the Group is exposed to, or has rights to, variable returns from its involvement with the entity and has the ability to affect those returns through its power to direct the activities of the entity. Subsidiaries are fully consolidated from the date on which control is transferred to the Group. They are de-consolidated from the date that control ceases.
Intercompany transactions, balances and unrealised gains on transactions between entities in the Group are eliminated. Unrealised losses are also eliminated unless the transaction provides evidence of the impairment of the asset transferred. Accounting policies of subsidiaries have been changed where necessary to ensure consistency with the policies adopted by the Group.
The acquisition of subsidiaries is accounted for using the acquisition method of accounting. A change in ownership interest, without the loss of control, is accounted for as an equity transaction, where the difference between the consideration transferred and the book value of the share of the non-controlling interest acquired is recognised directly in equity attributable to the parent.
Where the Group loses control over a subsidiary, it derecognises the assets including goodwill, liabilities and non-controlling interest in the subsidiary together with any cumulative translation differences recognised in equity. The Group recognises the fair value of the consideration received and the fair value of any investment retained together with any gain or loss in profit or loss.
Current and non-current classification
Assets and liabilities are presented in the statement of financial position based on current and non-current classification.
An asset is current when: it is expected to be realised or intended to be sold or consumed in normal operating cycle; it is held primarily for the purpose of trading; it is expected to be realised within 12 months after the reporting period; or the asset is cash or cash equivalent unless restricted from being exchanged or used to settle a liability for at least 12 months after the reporting period. All other assets are classified as non-current.
A liability is current when: it is expected to be settled in normal operating cycle; it is held primarily for the purpose of trading; it is due to be settled within 12 months after the reporting period; or there is no unconditional right to defer the settlement of the liability for at least 12 months after the reporting period. All other liabilities are classified as non-current.
Deferred tax assets and liabilities are always classified as non-current.
Cash and cash equivalents
Cash and cash equivalents includes cash on hand, deposits held at call with financial institutions, other short-term, highly liquid investments with original maturities of three months or less that are readily convertible to known amounts of cash and which are subject to an insignificant risk of changes in value.
Leases
The determination of whether an arrangement is or contains a lease is based on the substance of the arrangement and requires an assessment of whether the fulfilment of the arrangement is dependent on the use of a specific asset or assets and the arrangement conveys a right to use the asset.
A distinction is made between finance leases, which effectively transfer from the lessor to the lessee substantially all the risks and benefits incidental to ownership of leased assets, and operating leases, under which the lessor effectively retains substantially all such risks and benefits.
The Group does not have any finance leases. Operating lease payments, net of any incentives received from the lessor, are charged to profit or loss on a straight-line basis over the term of the lease.
Impairment of non-financial assets
Goodwill and other intangible assets that have an indefinite useful life are not subject to amortisation and are tested annually for impairment, or more frequently if events or changes in circumstances indicate that they might be impaired. Other non-financial assets are reviewed for impairment whenever events or changes in circumstances indicate that the carrying amount may not be recoverable. An impairment loss is recognised for the amount by which the asset’s carrying amount exceeds its recoverable amount.
Recoverable amount is the higher of an asset’s fair value less costs of disposal and value-in-use. The value-in-use is the present value of the estimated future cash flows relating to the asset using a pre-tax discount rate specific to the asset or cash-generating unit to which the asset belongs. Assets that do not have independent cash flows are grouped together to form a cash-generating unit.
Notes to the financial statementsAnnual Report 2015
Smartgroup Corporation Ltd | 65
Note 35. Other accounting policies (continued)
Employee benefits
Short-term employee benefits
Liabilities for wages and salaries, including non-monetary benefits, annual leave and long service leave expected to be settled within 12 months of the reporting date are recognised in current liabilities in respect of employees’ services up to the reporting date and are measured at the amounts expected to be paid when the liabilities are settled.
Other long-term employee benefits
The liability for long term employee benefits is measured as the present value of expected future payments to be made in respect of services provided by employees up to the reporting date using the projected unit credit method. Consideration is given to expected future wage and salary levels, experience of employee departures and periods of service. Expected future payments are discounted using market yields at the reporting date on corporate bonds with terms to maturity and currency that match, as closely as possible, the estimated future cash outflows.
Defined contribution superannuation expense
Contributions to defined contribution superannuation plans are expensed in the period in which they are incurred.
Share-based payments
Equity-settled and cash-settled share-based compensation benefits are provided to employees.
Equity-settled transactions are awards of shares, or options over shares, that are provided to employees in exchange for the rendering of services. Cash-settled transactions are awards of cash for the exchange of services, where the amount of cash is determined by reference to the share price.
The cost of equity-settled transactions are measured at fair value on grant date. Fair value is independently determined using either the Binomial or Black-Scholes option pricing model that takes into account the exercise price, the term of the option, the impact of dilution, the share price at grant date and expected price volatility of the underlying share, the expected dividend yield and the risk free interest rate for the term of the option, together with non-vesting conditions that do not determine whether the Group receives the services that entitle the employees to receive payment. No account is taken of any other vesting conditions.
The cost of equity-settled transactions are recognised as an expense with a corresponding increase in equity over the vesting period. The cumulative charge to profit or loss is calculated based on the grant date fair value of the award, the best estimate of the number of awards that are likely to vest and the expired portion of the vesting period. The amount recognised in profit or loss for the period is the cumulative amount calculated at each reporting date less amounts already recognised in previous periods. The cost of cash-settled transactions is initially, and at each reporting date until vested, determined by applying either the Binomial or Black-Scholes option pricing model, taking into consideration the terms and conditions on which the award was granted. The cumulative charge to profit or loss until settlement of the liability is calculated as follows:
• during the vesting period, the liability at each reporting date is the fair value of the award at that date multiplied by the expired portion of the vesting period.
• from the end of the vesting period until settlement of the award, the liability is the full fair value of the liability at the reporting date.
All changes in the liability are recognised in profit or loss. The ultimate cost of cash-settled transactions is the cash paid to settle the liability.
Market conditions are taken into consideration in determining fair value. Therefore any awards subject to market conditions are considered to vest irrespective of whether or not that market condition has been met, provided all other conditions are satisfied.
If equity-settled awards are modified, as a minimum an expense is recognised as if the modification has not been made. An additional expense is recognised, over the remaining vesting period, for any modification that increases the total fair value of the share-based compensation benefit as at the date of modification.
If the non-vesting condition is within the control of the Group or employee, the failure to satisfy the condition is treated as a cancellation. If the condition is not within the control of the Group or employee and is not satisfied during the vesting period, any remaining expense for the award is recognised over the remaining vesting period, unless the award is forfeited.
If equity-settled awards are cancelled, it is treated as if it has vested on the date of cancellation, and any remaining expense is recognised immediately. If a new replacement award is substituted for the cancelled award, the cancelled and new award is treated as if they were a modification.
Notes to the financial statementsAnnual Report 2015
Smartgroup Corporation Ltd | 66
Note 35. Other accounting policies (continued)
Business combinations
The acquisition method of accounting is used to account for business combinations regardless of whether equity instruments or other assets are acquired.
The consideration transferred is the sum of the acquisition-date fair values of the assets transferred, equity instruments issued or liabilities incurred by the acquirer to former owners of the acquiree and the amount of any non-controlling interest in the acquiree. For each business combination, the non-controlling interest in the acquiree is measured at either fair value or at the proportionate share of the acquiree’s identifiable net assets. All acquisition costs are expensed as incurred to profit or loss.
On the acquisition of a business, the Group assesses the financial assets acquired and liabilities assumed for appropriate classification and designation in accordance with the contractual terms, economic conditions, the Group’s operating or accounting policies and other pertinent conditions in existence at the acquisition-date.
Where the business combination is achieved in stages, the Group remeasures its previously held equity interest in the acquiree at the acquisition-date fair value and the difference between the fair value and the previous carrying amount is recognised in profit or loss.
Contingent consideration to be transferred by the acquirer is recognised at the acquisition-date fair value. Subsequent changes in the fair value of contingent consideration classified as an asset or liability is recognised in profit or loss. Contingent consideration classified as equity is not remeasured and its subsequent settlement is accounted for within equity.
The difference between the acquisition-date fair value of assets acquired, liabilities assumed and any non-controlling interest in the acquiree and the fair value of the consideration transferred and the fair value of any pre-existing investment in the acquiree is recognised as goodwill. If the consideration transferred and the pre-existing fair value is less than the fair value of the identifiable net assets acquired, being a bargain purchase to the acquirer, the difference is recognised as a gain directly in profit or loss by the acquirer on the acquisition-date, but only after a reassessment of the identification and measurement of the net assets acquired, the non-controlling interest in the acquiree, if any, the consideration transferred and the acquirer’s previously held equity interest in the acquirer.
Business combinations are initially accounted for on a provisional basis. The acquirer retrospectively adjusts the provisional amounts recognised and also recognises additional assets or liabilities during the measurement period, based on new information obtained about the facts and circumstances that existed at the acquisition-date. The measurement period ends on either the earlier of (i) 12 months from the date of the acquisition or (ii) when the acquirer receives all the information possible to determine fair value.
Goods and Services Tax (‘GST’) and other similar taxes
Revenues, expenses and assets are recognised net of the amount of associated GST, unless the GST incurred is not recoverable from the tax authority. In this case it is recognised as part of the cost of the acquisition of the asset or as part of the expense.
Receivables and payables are stated inclusive of the amount of GST receivable or payable. The net amount of GST recoverable from, or payable to, the tax authority is included in other receivables or other payables in the statement of financial position.
Cash flows are presented on a gross basis. The GST components of cash flows arising from investing or financing activities which are recoverable from, or payable to the tax authority, are presented as operating cash flows.
Commitments and contingencies are disclosed net of the amount of GST recoverable from, or payable to, the tax authority.
New Accounting Standards and Interpretations not yet mandatory or early adopted
Australian Accounting Standards and Interpretations that have recently been issued or amended but are not yet mandatory, have not been early adopted by the Group for the annual reporting period ended 31 December 2015. The Group’s assessment of the impact of these new or amended Accounting Standards and Interpretations, most relevant to the Group, are set out below.
AASB 9 Financial Instruments
This standard is applicable to annual reporting periods beginning on or after 1 January 2018. The standard replaces all previous versions of AASB 9 and completes the project to replace IAS 39 ‘Financial Instruments: Recognition and Measurement’. AASB 9 introduces new classification and measurement models for financial assets. New hedge accounting requirements are intended to more closely align the accounting treatment with the risk management activities of the entity. New impairment requirements will use an ‘expected credit loss’ (‘ECL’) model to recognise an allowance.
The Group expects to adopt this standard from 1 January 2018 but the impact of its adoption is not expected to be material.

Notes to the financial statementsAnnual Report 2015
Smartgroup Corporation Ltd | 67
Note 35. Other accounting policies (continued)
AASB 15 Revenue from Contracts with Customers
This standard is applicable to annual reporting periods beginning on or after 1 January 2018. The standard provides a single standard for revenue recognition. The core principle of the standard is that an entity will recognise revenue to depict the transfer of promised goods or services to customers in an amount that reflects the consideration to which the entity expects to be entitled in exchange for those goods or services.
The Group expects to adopt this standard from 1 January 2018 but the impact of its adoption is not expected to be material.
Smartgroup Corporation Ltd | 68
Annual Report 2015
Directors’ declaration
In the directors’ opinion:
• the attached financial statements and notes comply with the Corporations Act 2001, the Accounting Standards, the Corporations Regulations 2001 and other mandatory professional reporting requirements;
• the attached financial statements and notes comply with International Financial Reporting Standards as issued by the International Accounting Standards Board as described in note 1 to the financial statements;
• the attached financial statements and notes give a true and fair view of the Group’s financial position as at 31 December 2015 and of its performance for the financial year ended on that date; and
• there are reasonable grounds to believe that the Company will be able to pay its debts as and when they become due and payable.
The directors have been given the declarations required by section 295A of the Corporations Act 2001.
Signed in accordance with a resolution of directors made pursuant to section 295(5)(a) of the Corporations Act 2001.
On behalf of the directors
Michael Carapiet
Chairman
24 February 2016 Sydney
Smartgroup Corporation Ltd | 69
Annual Report 2015
PricewaterhouseCoopers, ABN 52 780 433 757 Darling Park Tower 2, 201 Sussex Street, GPO BOX 2650, SYDNEY NSW 1171 T: +61 2 8266 0000, F: +61 2 8266 9999, www.pwc.com.au Liability limited by a scheme approved under Professional Standards Legislation.
Independent auditor’s report to the members of Smartgroup Corporation Ltd
Report on the financial report We have audited the accompanying financial report of Smartgroup Corporation Ltd (the company), which comprises the statement of financial position as at 31 December 2015, the statement of profit or loss and other comprehensive income, statement of changes in equity and statement of cash flows for the year ended on that date, a summary of significant accounting policies, other explanatory notes and the directors’ declaration for Smartgroup Corporation Ltd (the consolidated entity). The consolidated entity comprises the company and the entities it controlled at year’s end or from time to time during the financial year.
Directors' responsibility for the financial report The directors of the company are responsible for the preparation of the financial report that gives a true and fair view in accordance with Australian Accounting Standards and the Corporations Act 2001 and for such internal control as the directors determine is necessary to enable the preparation of the financial report that is free from material misstatement, whether due to fraud or error. In Note 1, the directors also state, in accordance with Accounting Standard AASB 101 Presentation of Financial Statements, that the financial statements comply with International Financial Reporting Standards.
Auditor’s responsibility Our responsibility is to express an opinion on the financial report based on our audit. We conducted our audit in accordance with Australian Auditing Standards. Those standards require that we comply with relevant ethical requirements relating to audit engagements and plan and perform the audit to obtain reasonable assurance whether the financial report is free from material misstatement.
An audit involves performing procedures to obtain audit evidence about the amounts and disclosures in the financial report. The procedures selected depend on the auditor’s judgement, including the assessment of the risks of material misstatement of the financial report, whether due to fraud or error. In making those risk assessments, the auditor considers internal control relevant to the consolidated entity’s preparation and fair presentation of the financial report in order to design audit procedures that are appropriate in the circumstances, but not for the purpose of expressing an opinion on the effectiveness of the entity’s internal control. An audit also includes evaluating the appropriateness of accounting policies used and the reasonableness of accounting estimates made by the directors, as well as evaluating the overall presentation of the financial report.
We believe that the audit evidence we have obtained is sufficient and appropriate to provide a basis for our audit opinion.
Independence In conducting our audit, we have complied with the independence requirements of the Corporations Act 2001.
Smartgroup Corporation Ltd | 70
Annual Report 2015
Auditor’s opinion In our opinion:
(a) the financial report of Smartgroup Corporation Ltd is in accordance with the Corporations Act 2001, including:
(i) giving a true and fair view of the consolidated entity's financial position as at 31 December 2015 and of its performance for the year ended on that date; and
(ii) complying with Australian Accounting Standards (including the Australian Accounting Interpretations) and the Corporations Regulations 2001.
(b) the financial report and notes also comply with International Financial Reporting Standards as disclosed in Note 1.
Report on the Remuneration Report We have audited the remuneration report included in pages 19 to 28 of the directors’ report for the year ended 31 December 2015. The directors of the company are responsible for the preparation and presentation of the remuneration report in accordance with section 300A of the Corporations Act 2001. Our responsibility is to express an opinion on the remuneration report, based on our audit conducted in accordance with Australian Auditing Standards.
Auditor’s opinion In our opinion, the remuneration report of Smartgroup Corporation Ltd for the year ended 31 December 2015 complies with section 300A of the Corporations Act 2001.
PricewaterhouseCoopers
Scott Walsh
Sydney Partner 24 February 2016
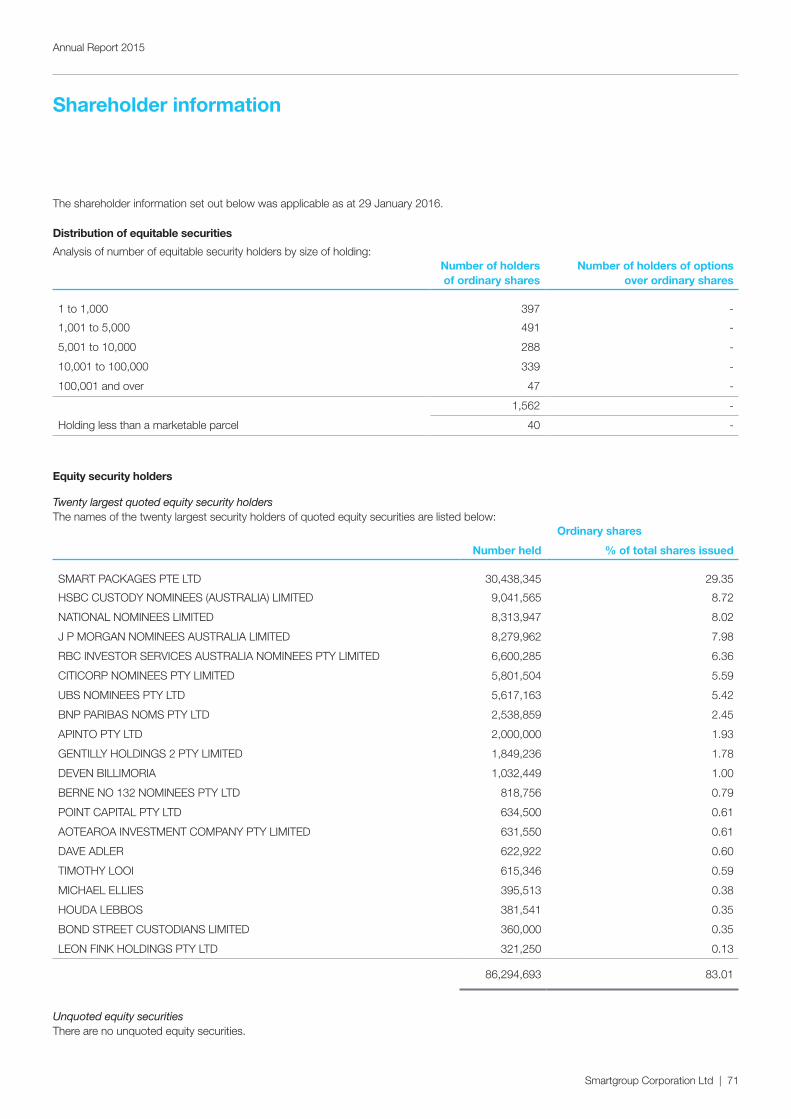
Smartgroup Corporation Ltd | 71
Annual Report 2015
Shareholder information
The shareholder information set out below was applicable as at 29 January 2016.
Distribution of equitable securities
Analysis of number of equitable security holders by size of holding:Number of holders of ordinary shares
Number of holders of options over ordinary shares
1 to 1,000 397 -
1,001 to 5,000 491 -
5,001 to 10,000 288 -
10,001 to 100,000 339 -
100,001 and over 47 -
1,562 -
Holding less than a marketable parcel 40 -
Equity security holders
Twenty largest quoted equity security holdersThe names of the twenty largest security holders of quoted equity securities are listed below:
Ordinary shares
Number held % of total shares issued
SMART PACKAGES PTE LTD 30,438,345 29.35
HSBC CUSTODY NOMINEES (AUSTRALIA) LIMITED 9,041,565 8.72
NATIONAL NOMINEES LIMITED 8,313,947 8.02
J P MORGAN NOMINEES AUSTRALIA LIMITED 8,279,962 7.98
RBC INVESTOR SERVICES AUSTRALIA NOMINEES PTY LIMITED 6,600,285 6.36
CITICORP NOMINEES PTY LIMITED 5,801,504 5.59
UBS NOMINEES PTY LTD 5,617,163 5.42
BNP PARIBAS NOMS PTY LTD 2,538,859 2.45
APINTO PTY LTD 2,000,000 1.93
GENTILLY HOLDINGS 2 PTY LIMITED 1,849,236 1.78
DEVEN BILLIMORIA 1,032,449 1.00
BERNE NO 132 NOMINEES PTY LTD 818,756 0.79
POINT CAPITAL PTY LTD 634,500 0.61
AOTEAROA INVESTMENT COMPANY PTY LIMITED 631,550 0.61
DAVE ADLER 622,922 0.60
TIMOTHY LOOI 615,346 0.59
MICHAEL ELLIES 395,513 0.38
HOUDA LEBBOS 381,541 0.35
BOND STREET CUSTODIANS LIMITED 360,000 0.35
LEON FINK HOLDINGS PTY LTD 321,250 0.13
86,294,693 83.01
Unquoted equity securitiesThere are no unquoted equity securities.
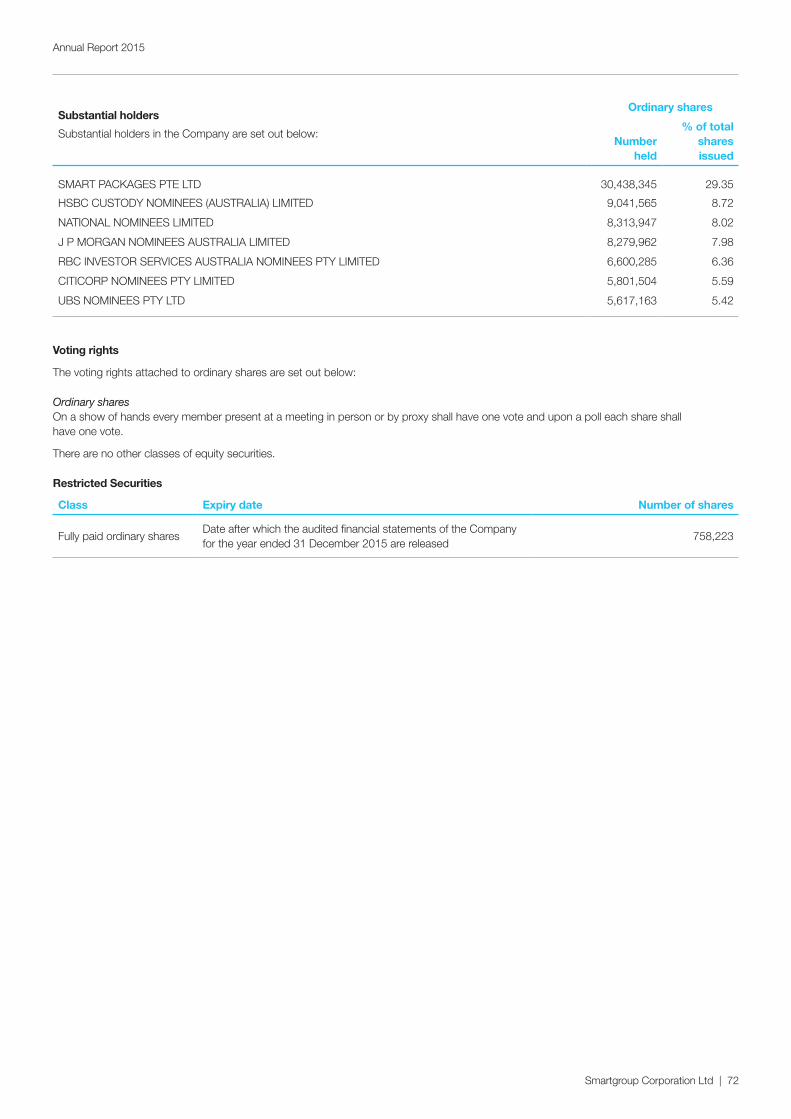
Smartgroup Corporation Ltd | 72
Annual Report 2015
Substantial holders
Substantial holders in the Company are set out below:
Ordinary shares
Number held
% of total shares issued
SMART PACKAGES PTE LTD 30,438,345 29.35
HSBC CUSTODY NOMINEES (AUSTRALIA) LIMITED 9,041,565 8.72
NATIONAL NOMINEES LIMITED 8,313,947 8.02
J P MORGAN NOMINEES AUSTRALIA LIMITED 8,279,962 7.98
RBC INVESTOR SERVICES AUSTRALIA NOMINEES PTY LIMITED 6,600,285 6.36
CITICORP NOMINEES PTY LIMITED 5,801,504 5.59
UBS NOMINEES PTY LTD 5,617,163 5.42
Voting rights
The voting rights attached to ordinary shares are set out below:
Ordinary sharesOn a show of hands every member present at a meeting in person or by proxy shall have one vote and upon a poll each share shall have one vote.
There are no other classes of equity securities.
Restricted Securities
Class Expiry date Number of shares
Fully paid ordinary sharesDate after which the audited financial statements of the Company for the year ended 31 December 2015 are released
758,223
Smartgroup Corporation Ltd | 73
Annual Report 2015
Corporate directory
Directors Michael Carapiet/Deven BillimoriaJohn PrendivilleGavin BellAndrew BolamIan Watt
Company secretaries
Timothy LooiAmanda Morgan
Notice of annual general meeting
The details of the annual general meeting of Smartgroup Corporation Ltd are:
11am on 5 May 2016 Please refer to the website for further details.
Registered office and principal place of business
Smartgroup Corporation Ltd Level 8, 133 Castlereagh Street Sydney, NSW, Australia, 2000 Tel: 1300 476 278
Share register LINK Market Services Limited Level 12, 680 George Street, Sydney, NSW, Australia, 2000 Tel: 1300 554 474
Auditor PricewaterhouseCoopers Darling Park Tower 2 201 Sussex Street Sydney, NSW, Australia, 2000
Solicitors Minter Ellison Lawyers Level 23, 525 Collins Street Melbourne, VIC, Australia, 3000 Tel: 03 8608 2000
Bankers Australia and New Zealand Banking Group Limited 242 Pitt Street Sydney, NSW, Australia, 2000
Stock exchange listing
Smartgroup Corporation Limited shares are listed on the Australian Securities Exchange (ASX code: SIQ)
Website www.smartgroup.com.au
Corporate Governance Statement
Found at: http://ir.smartgroup.com.au/Investors/?page=Corporate-Governance
Smartgroup Corporation LtdNational Head Offi ceLevel 8, 133 Castlereagh StreetSydney NSW 2000
smartgroup.com.au