Smartgroup Corporation Ltdir.smartgroup.com.au/FormBuilder/_Resource/_module/w6TkQfNeUU2... ·...
88
Smartgroup Corporation Ltd ABN 48 126 266 831 Annual Report 2014
Transcript of Smartgroup Corporation Ltdir.smartgroup.com.au/FormBuilder/_Resource/_module/w6TkQfNeUU2... ·...
Smartgroup Corporation LtdABN 48 126 266 831
Annual Report 2014
Market Release
25 February 2015
ASX Market Announcements Office ASX Limited 20 Bridge Street Sydney, NSW, Australia, 2000
Smartgroup Corporation Ltd – Results for announcement to the market
In accordance with the Listing Rules, Smartgroup Corporation Ltd encloses for immediate release the following information:
1. Appendix 4E, and2. Smartgroup Corporation Ltd Annual Report 2014.Smartgroup Corporation Ltd will conduct an analyst briefing on the results from 9.00am (Sydney time) on 26 February 2015.
Amanda Morgan General Counsel and Company Secretary
Market Release
Appendix 4E
Appendix 4ESmartgroup Corporation LtdFor the year ended 31 December 2014
ABN 48 126 266 831
Results for announcement to the market $’000
Revenue from ordinary activities up 17.5% to 73,350
Loss from ordinary activities after tax attributable to the owners of Smartgroup Corporation Ltd down 132.3% to (959)
Loss for the year attributable to the owners of Smartgroup Corporation Ltd down 132.3% to (959) The loss for the Group after providing for income tax amounted to $959,000 (31 December 2013: profit of $2,972,000). Refer to the CEO’s Review of Operations for detailed commentary of the results.
Net tangible assets 2014
2013
Net tangible assets per ordinary security, cents per share 3.37 (57.72)
The net tangible assets per ordinary shares is calculated based on 101,461,150 ordinary shares on issue as at 31 December 2014 and 78,000,000 ordinary shares that would have been in existence had the share split occurred as at 31 December 2013.
Dividends
Current periodOn 25 February 2015 the directors declared a fully-franked dividend of 6.1 cents per ordinary share. The final dividend will be paid on 31 March 2015 to shareholders registered on 13 March 2015 resulting in total distribution of $6,189,131.
Previous periodThere were no dividends paid, recommended or declared during the previous financial period.
Dividend reinvestment plansThere is no dividend reinvestment plan.
Audit qualification or review
The financial statements have been audited and an unqualified opinion has been issued.
Attachments
Additional Appendix 4E disclosure requirements can be found in the attached directors’ report and the 31 December 2014 financial statements and accompanying notes.
Annual ReportSmartgroup Corporation Ltd (formerly known as Smartgroup Investments Ltd)
31 December 2014
ABN 48 126 266 831
Contents
From our Chairman 1
Our performance summary 2014 2
CEO’s Review of Operations 5
Our business 8
Our clients 12
Our customers 14
Our people strategy success 15
Our community 17
What makes Smartgroup different? 19
Corporate governance statement 21
Financial report 26
Smartgroup Corporation Ltd | 1
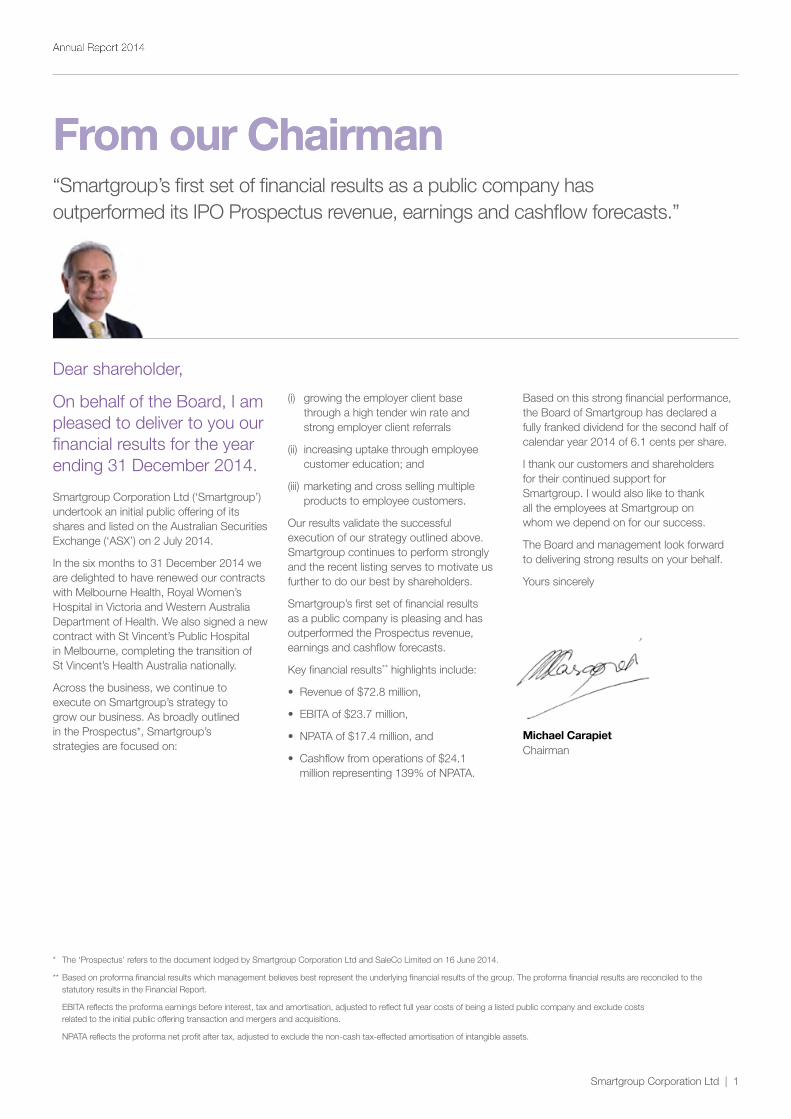
Dear shareholder,
On behalf of the Board, I am pleased to deliver to you our financial results for the year ending 31 December 2014.
Smartgroup Corporation Ltd (‘Smartgroup’) undertook an initial public offering of its shares and listed on the Australian Securities Exchange (‘ASX’) on 2 July 2014.
In the six months to 31 December 2014 we are delighted to have renewed our contracts with Melbourne Health, Royal Women’s Hospital in Victoria and Western Australia Department of Health. We also signed a new contract with St Vincent’s Public Hospital in Melbourne, completing the transition of St Vincent’s Health Australia nationally.
Across the business, we continue to execute on Smartgroup’s strategy to grow our business. As broadly outlined in the Prospectus*, Smartgroup’s strategies are focused on:
From our Chairman“Smartgroup’s first set of financial results as a public company has outperformed its IPO Prospectus revenue, earnings and cashflow forecasts.”
From our Chairman
(i) growing the employer client base through a high tender win rate and strong employer client referrals
(ii) increasing uptake through employee customer education; and
(iii) marketing and cross selling multiple products to employee customers.
Our results validate the successful execution of our strategy outlined above. Smartgroup continues to perform strongly and the recent listing serves to motivate us further to do our best by shareholders.
Smartgroup’s first set of financial results as a public company is pleasing and has outperformed the Prospectus revenue, earnings and cashflow forecasts.
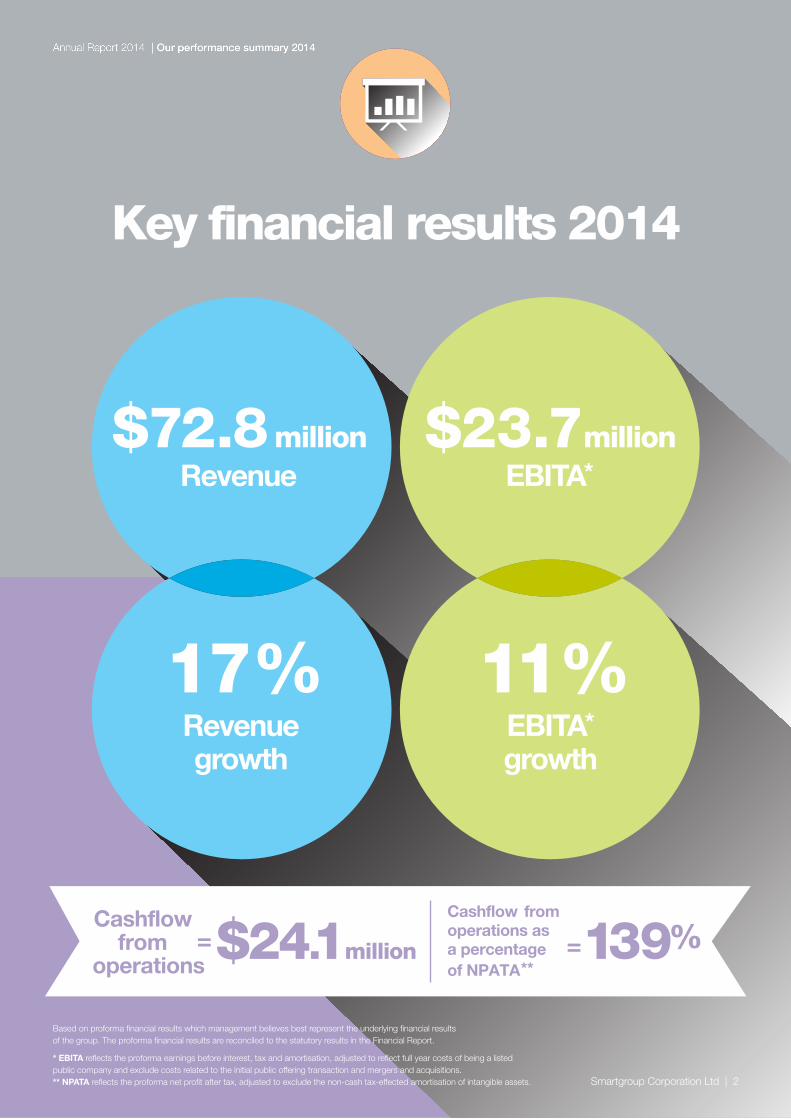
Key financial results** highlights include:
• Revenue of $72.8 million,
• EBITA of $23.7 million,
• NPATA of $17.4 million, and
• Cashflow from operations of $24.1 million representing 139% of NPATA.
Based on this strong financial performance, the Board of Smartgroup has declared a fully franked dividend for the second half of calendar year 2014 of 6.1 cents per share.
I thank our customers and shareholders for their continued support for Smartgroup. I would also like to thank all the employees at Smartgroup on whom we depend on for our success.
The Board and management look forward to delivering strong results on your behalf.
Yours sincerely
Michael CarapietChairman
* The ‘Prospectus’ refers to the document lodged by Smartgroup Corporation Ltd and SaleCo Limited on 16 June 2014.
** Based on proforma financial results which management believes best represent the underlying financial results of the group. The proforma financial results are reconciled to the statutory results in the Financial Report.
EBITA reflects the proforma earnings before interest, tax and amortisation, adjusted to reflect full year costs of being a listed public company and exclude costs related to the initial public offering transaction and mergers and acquisitions.
NPATA reflects the proforma net profit after tax, adjusted to exclude the non-cash tax-effected amortisation of intangible assets.
Key financial results 2014
Revenue$72.8 million
Revenuegrowth
17%
EBITA*$23.7million
EBITA*
growth
11%
$24.1 million Cashflow
from operations
Cashflow from operations as a percentageof NPATA**
= 139%=
Based on proforma financial results which management believes best represent the underlying financial results of the group. The proforma financial results are reconciled to the statutory results in the Financial Report.
* EBITA reflects the proforma earnings before interest, tax and amortisation, adjusted to reflect full year costs of being a listed public company and exclude costs related to the initial public offering transaction and mergers and acquisitions. ** NPATA reflects the proforma net profit after tax, adjusted to exclude the non-cash tax-effected amortisation of intangible assets. Smartgroup Corporation Ltd | 2
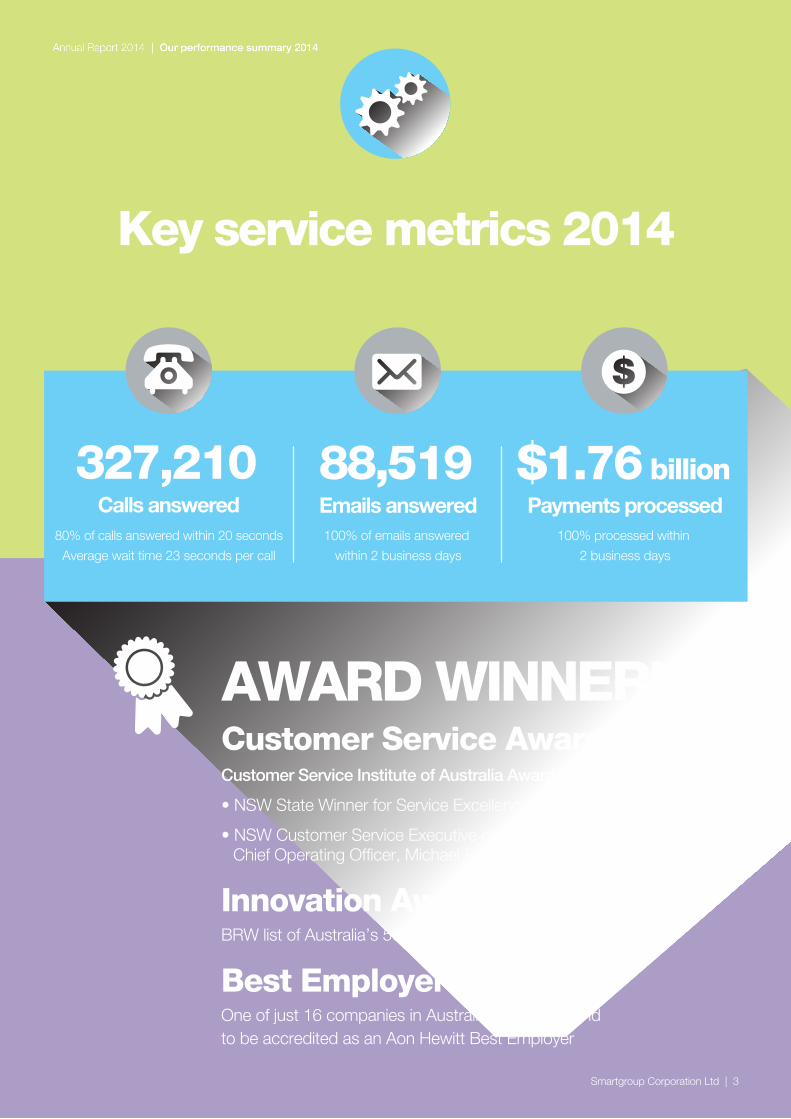
Key service metrics 2014
Calls answered80% of calls answered within 20 seconds
Average wait time 23 seconds per call
327,210Emails answered100% of emails answered
within 2 business days
88,519Payments processed
100% processed within
2 business days
$1.76 billion
Customer Service AwardsCustomer Service Institute of Australia Award 2014
• NSW State Winner for Service Excellence
• NSW Customer Service Executive of the Year: Chief Operating Officer, Michael Ellies
Innovation AwardBRW list of Australia’s 50 Most Innovative Companies
Best EmployerOne of just 16 companies in Australia & New Zealand to be accredited as an Aon Hewitt Best Employer
AWARD WINNER!
Smartgroup Corporation Ltd | 3
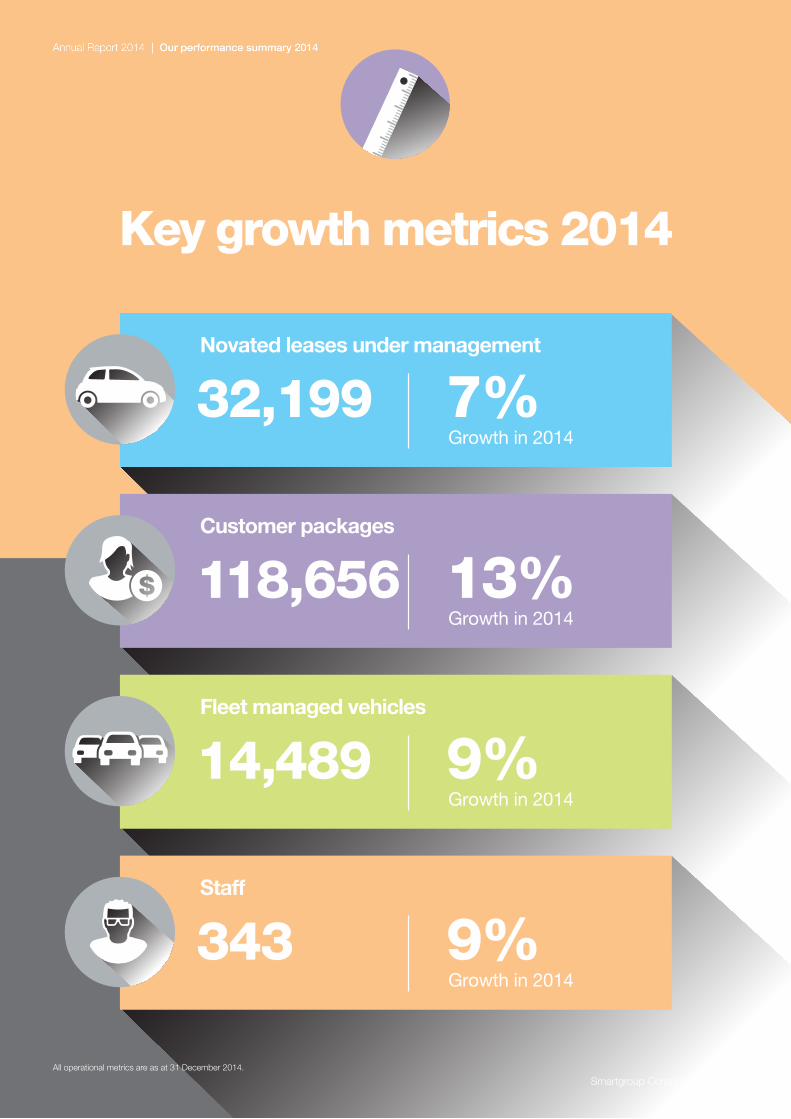
Key growth metrics 2014
Novated leases under management
32,199Growth in 20147%
Customer packages
118,656Growth in 201413%
Fleet managed vehicles
14,489Growth in 20149%
Staff
343Growth in 20149%
All operational metrics are as at 31 December 2014.
Smartgroup Corporation Ltd | 4
Smartgroup Corporation Ltd | 5
Dear shareholder,
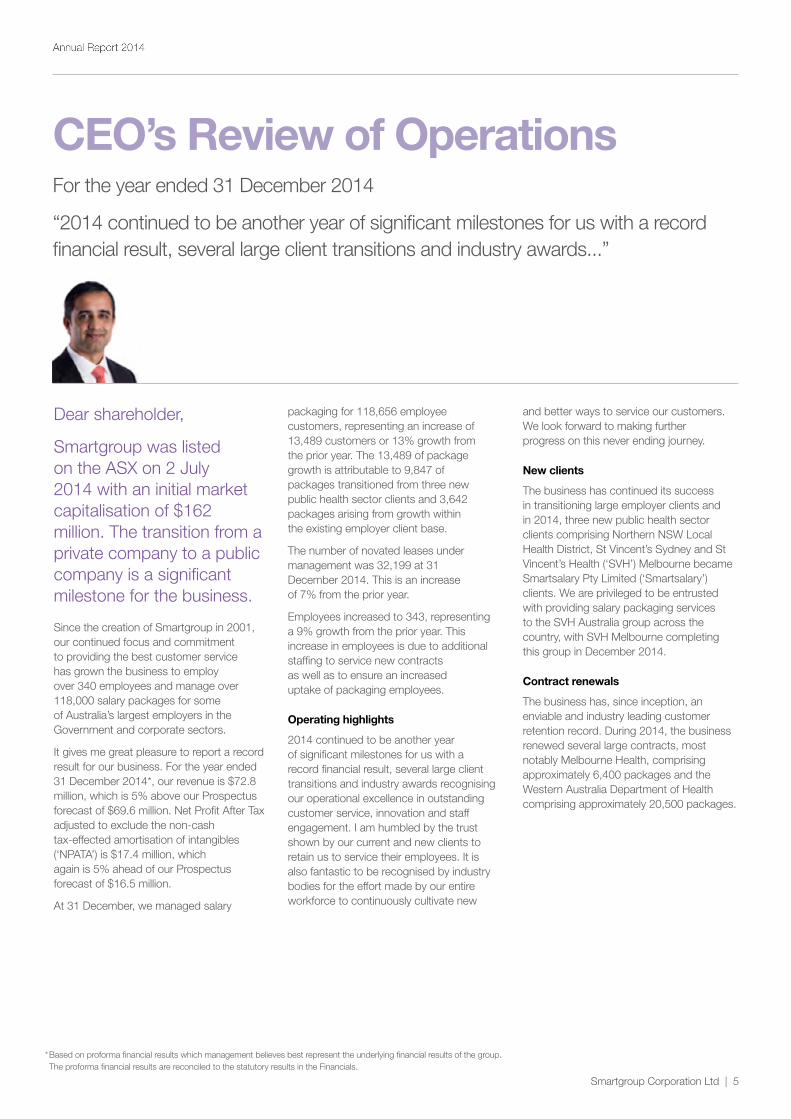
Smartgroup was listed on the ASX on 2 July 2014 with an initial market capitalisation of $162 million. The transition from a private company to a public company is a significant milestone for the business.
Since the creation of Smartgroup in 2001, our continued focus and commitment to providing the best customer service has grown the business to employ over 340 employees and manage over 118,000 salary packages for some of Australia’s largest employers in the Government and corporate sectors.
It gives me great pleasure to report a record result for our business. For the year ended 31 December 2014*, our revenue is $72.8 million, which is 5% above our Prospectus forecast of $69.6 million. Net Profit After Tax adjusted to exclude the non-cash tax-effected amortisation of intangibles (‘NPATA’) is $17.4 million, which again is 5% ahead of our Prospectus forecast of $16.5 million.
At 31 December, we managed salary
CEO’s Review of OperationsFor the year ended 31 December 2014
“2014 continued to be another year of significant milestones for us with a record financial result, several large client transitions and industry awards...”
packaging for 118,656 employee customers, representing an increase of 13,489 customers or 13% growth from the prior year. The 13,489 of package growth is attributable to 9,847 of packages transitioned from three new public health sector clients and 3,642 packages arising from growth within the existing employer client base.
The number of novated leases under management was 32,199 at 31 December 2014. This is an increase of 7% from the prior year.
Employees increased to 343, representing a 9% growth from the prior year. This increase in employees is due to additional staffing to service new contracts as well as to ensure an increased uptake of packaging employees.
Operating highlights
2014 continued to be another year of significant milestones for us with a record financial result, several large client transitions and industry awards recognising our operational excellence in outstanding customer service, innovation and staff engagement. I am humbled by the trust shown by our current and new clients to retain us to service their employees. It is also fantastic to be recognised by industry bodies for the effort made by our entire workforce to continuously cultivate new
and better ways to service our customers. We look forward to making further progress on this never ending journey.
New clients
The business has continued its success in transitioning large employer clients and in 2014, three new public health sector clients comprising Northern NSW Local Health District, St Vincent’s Sydney and St Vincent’s Health (‘SVH’) Melbourne became Smartsalary Pty Limited (‘Smartsalary’) clients. We are privileged to be entrusted with providing salary packaging services to the SVH Australia group across the country, with SVH Melbourne completing this group in December 2014.
Contract renewals
The business has, since inception, an enviable and industry leading customer retention record. During 2014, the business renewed several large contracts, most notably Melbourne Health, comprising approximately 6,400 packages and the Western Australia Department of Health comprising approximately 20,500 packages.
* Based on proforma financial results which management believes best represent the underlying financial results of the group. The proforma financial results are reconciled to the statutory results in the Financials.
Smartgroup Corporation Ltd | 6
Operations
Smartgroup focuses on three key areas to drive operational excellence – outstanding customer service, innovation and staff engagement.
a) Outstanding customer service
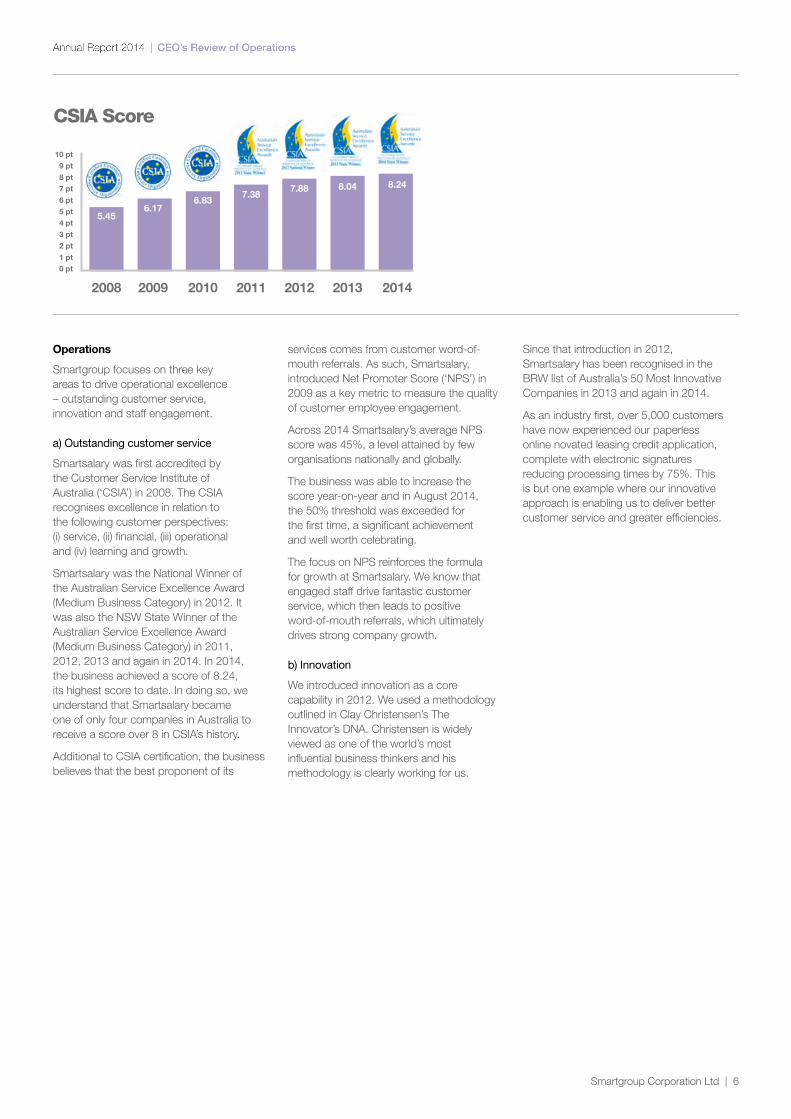
Smartsalary was first accredited by the Customer Service Institute of Australia (‘CSIA’) in 2008. The CSIA recognises excellence in relation to the following customer perspectives: (i) service, (ii) financial, (iii) operational and (iv) learning and growth.
Smartsalary was the National Winner of the Australian Service Excellence Award (Medium Business Category) in 2012. It was also the NSW State Winner of the Australian Service Excellence Award (Medium Business Category) in 2011, 2012, 2013 and again in 2014. In 2014, the business achieved a score of 8.24, its highest score to date. In doing so, we understand that Smartsalary became one of only four companies in Australia to receive a score over 8 in CSIA’s history.
Additional to CSIA certification, the business believes that the best proponent of its
services comes from customer word-of-mouth referrals. As such, Smartsalary, introduced Net Promoter Score (‘NPS’) in 2009 as a key metric to measure the quality of customer employee engagement.
Across 2014 Smartsalary’s average NPS score was 45%, a level attained by few organisations nationally and globally.
The business was able to increase the score year-on-year and in August 2014, the 50% threshold was exceeded for the first time, a significant achievement and well worth celebrating.
The focus on NPS reinforces the formula for growth at Smartsalary. We know that engaged staff drive fantastic customer service, which then leads to positive word-of-mouth referrals, which ultimately drives strong company growth.
b) Innovation
We introduced innovation as a core capability in 2012. We used a methodology outlined in Clay Christensen’s The Innovator’s DNA. Christensen is widely viewed as one of the world’s most influential business thinkers and his methodology is clearly working for us.
Since that introduction in 2012, Smartsalary has been recognised in the BRW list of Australia’s 50 Most Innovative Companies in 2013 and again in 2014.
As an industry first, over 5,000 customers have now experienced our paperless online novated leasing credit application, complete with electronic signatures reducing processing times by 75%. This is but one example where our innovative approach is enabling us to deliver better customer service and greater efficiencies.
CSIA Score
2008 20102009 2011 2012 20142013
0 pt1 pt
3 pt2 pt
4 pt5 pt6 pt7 pt8 pt9 pt
10 pt
5.45
6.836.17
7.387.88 8.248.04
Net Promoter Score
20102009 2011 2012 201420130%
20%
40%
60%
Smartgroup Corporation Ltd | 7
c) Staff engagement
An engaged workforce is the foundation of everything we do at Smartgroup. Highly engaged employees tend to be more innovative and embrace lean and agile work practices, all of which result in outstanding customer service.
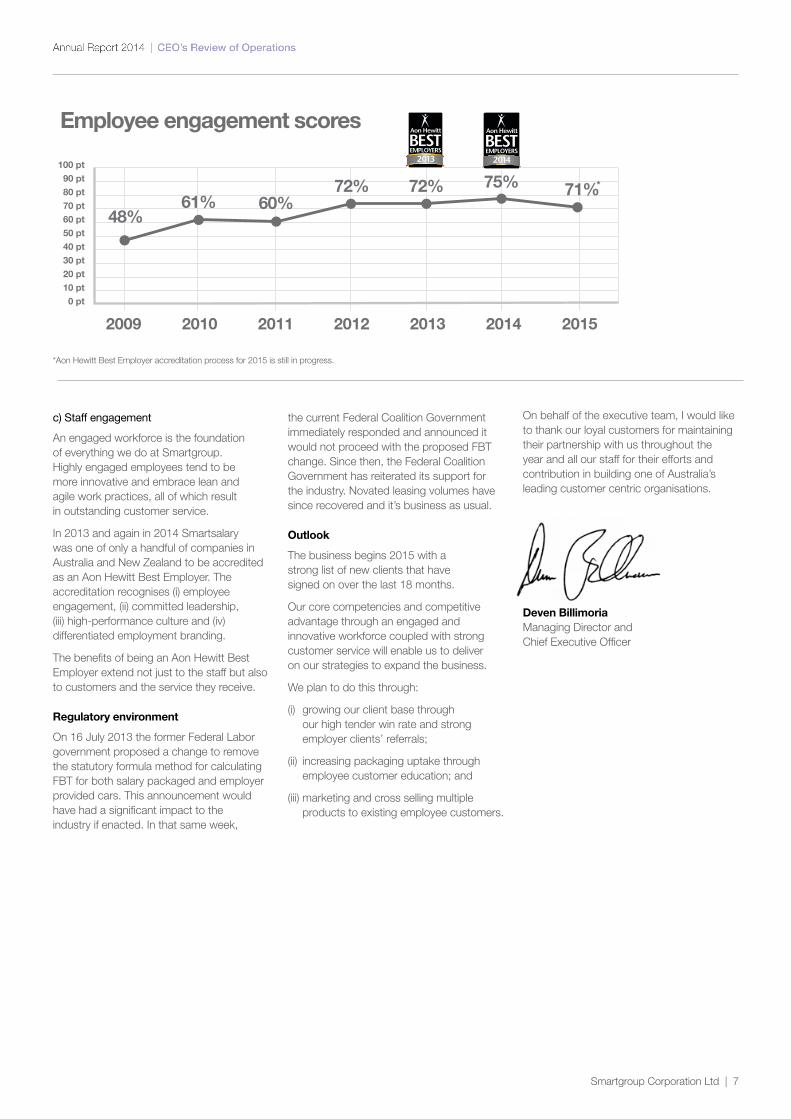
In 2013 and again in 2014 Smartsalary was one of only a handful of companies in Australia and New Zealand to be accredited as an Aon Hewitt Best Employer. The accreditation recognises (i) employee engagement, (ii) committed leadership, (iii) high-performance culture and (iv) differentiated employment branding.
The benefits of being an Aon Hewitt Best Employer extend not just to the staff but also to customers and the service they receive.
Regulatory environment
On 16 July 2013 the former Federal Labor government proposed a change to remove the statutory formula method for calculating FBT for both salary packaged and employer provided cars. This announcement would have had a significant impact to the industry if enacted. In that same week,
the current Federal Coalition Government immediately responded and announced it would not proceed with the proposed FBT change. Since then, the Federal Coalition Government has reiterated its support for the industry. Novated leasing volumes have since recovered and it’s business as usual.
Outlook
The business begins 2015 with a strong list of new clients that have signed on over the last 18 months.
Our core competencies and competitive advantage through an engaged and innovative workforce coupled with strong customer service will enable us to deliver on our strategies to expand the business.
We plan to do this through:
(i) growing our client base through our high tender win rate and strong employer clients’ referrals;
(ii) increasing packaging uptake through employee customer education; and
(iii) marketing and cross selling multiple products to existing employee customers.
On behalf of the executive team, I would like to thank our loyal customers for maintaining their partnership with us throughout the year and all our staff for their efforts and contribution in building one of Australia’s leading customer centric organisations.
Deven Billimoria Managing Director and Chief Executive Officer
*Aon Hewitt Best Employer accreditation process for 2015 is still in progress.
Employee engagement scores
20102009 2011 2012 2014 20152013
0 pt10 pt
30 pt20 pt
40 pt50 pt60 pt70 pt80 pt90 pt
100 pt
61%48%
60%72% 72% 75% 71%*
Smartgroup Corporation Ltd | 8
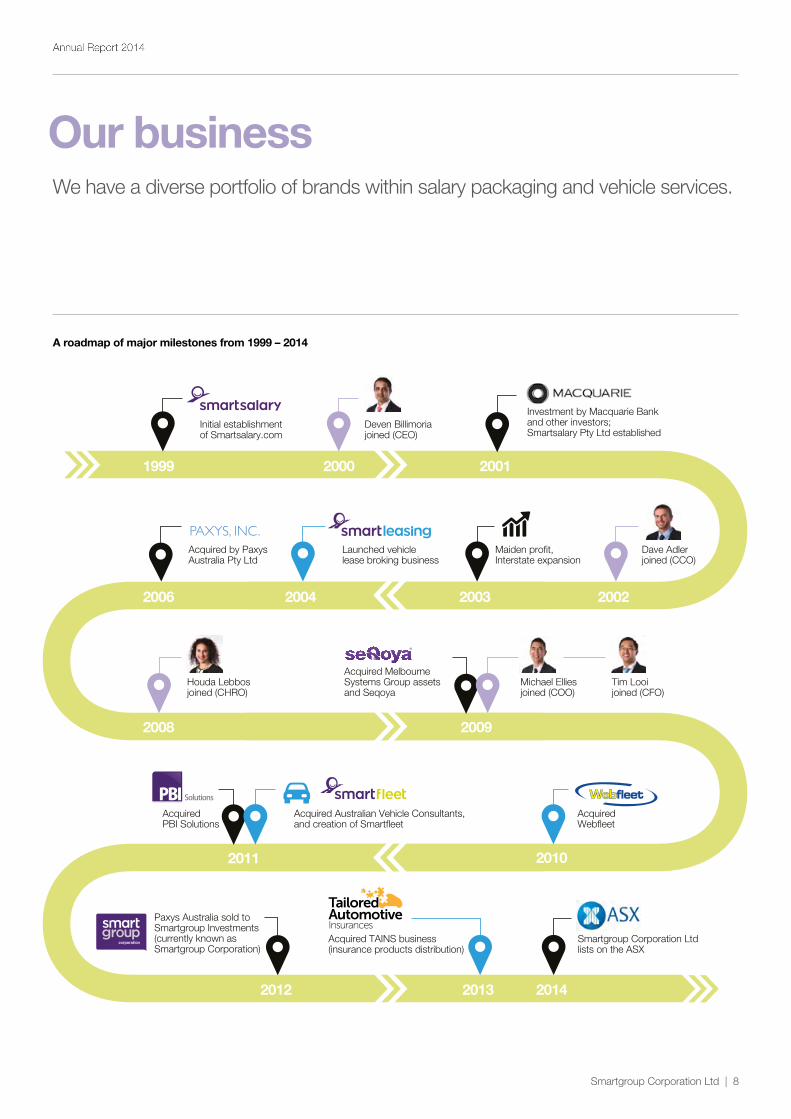
A roadmap of major milestones from 1999 – 2014
2012
Paxys Australia sold to Smartgroup Investments(currently known as Smartgroup Corporation)
Acquired TAINS business (insurance products distribution)
2013
Initial establishment of Smartsalary.com
1999
Investment by Macquarie Bank and other investors; Smartsalary Pty Ltd established
2001
Maiden profit, Interstate expansion
20032004
Launched vehiclelease broking business
Acquired by Paxys Australia Pty Ltd
2006
Acquired PBI Solutions
2011
Acquired Australian Vehicle Consultants,and creation of Smartfleet
2014
Smartgroup Corporation Ltdlists on the ASX
2002
Dave Adler joined (CCO)
2000
Deven Billimoria joined (CEO)
2008
Houda Lebbosjoined (CHRO)
Acquired MelbourneSystems Group assets and Seqoya
2009
Michael Elliesjoined (COO)
Tim Looi joined (CFO)
2010
Acquired Webfleet
Our business We have a diverse portfolio of brands within salary packaging and vehicle services.
Smartgroup Corporation Ltd | 9
Corporate history
The current Smartgroup business was created in 2001 when Macquarie Bank and other investors formed a new business and acquired the assets of the Smartsalary.com entity which had been previously established in 1999. Following this, the business became a focused outsourced salary packaging company within the health, not-for-profit, State and Federal Government departments and corporate sectors nationwide.
In 2006, Smartsalary Pty Limited became a 100% owned subsidiary of Paxys Australia Pty Ltd (now known as Smartsalary Group Pty Ltd), an Australian company owned by Paxys Inc, a company listed on the Philippines Stock Exchange with investments in the business process outsourcing industry. Under the ownership of Paxys
Australia Pty Ltd, Smartsalary Pty Limited executed a number of strategic acquisitions which saw the business expand its presence in the Australian salary packaging administration and novated leasing industry.
In 2012, Paxys Australia Pty Ltd was sold to Smartgroup Investments Pty Ltd, a wholly owned subsidiary of Smart Packages Pte Ltd, an indirect subsidiary of Usaha Tegas (a private investment holding company based in Malaysia).
Today, Smartgroup consists of a group of businesses offering salary packaging and vehicle services to employers and their employees in Australia.
Smartgroup listed on the ASX on 2 July 2014, opening a new chapter in the history of the organisation.
Overview of Smartgroup
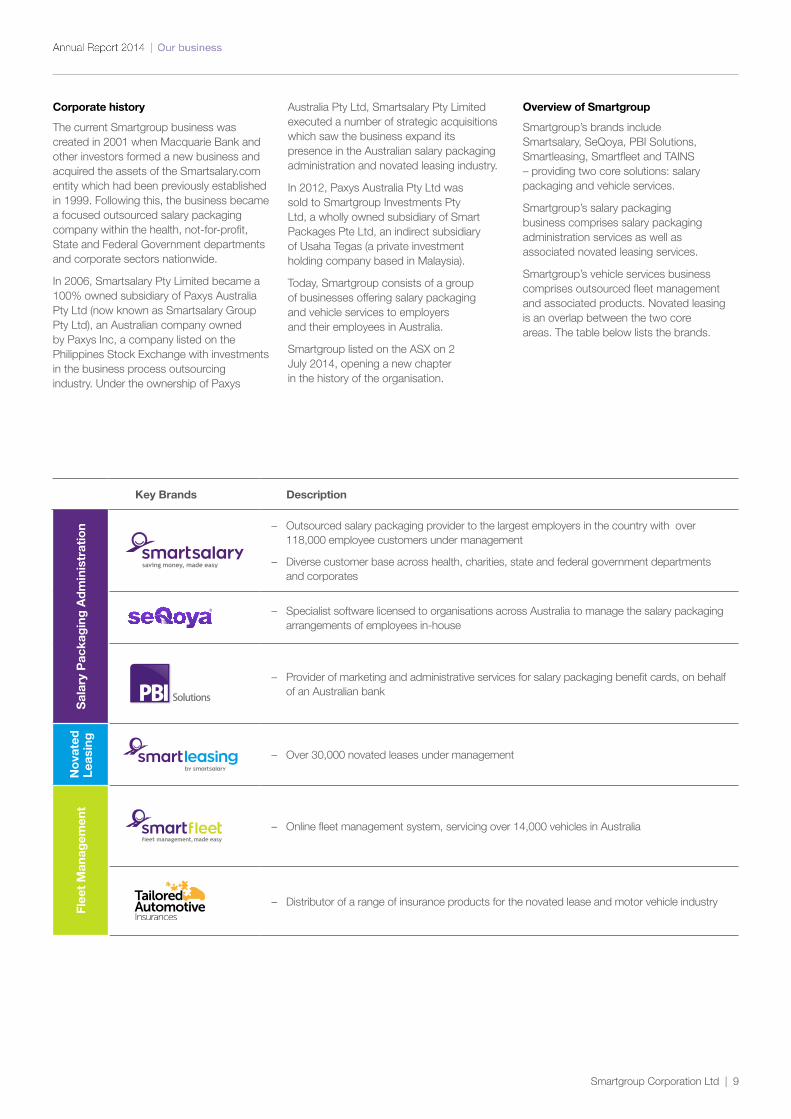
Smartgroup’s brands include Smartsalary, SeQoya, PBI Solutions, Smartleasing, Smartfleet and TAINS – providing two core solutions: salary packaging and vehicle services.
Smartgroup’s salary packaging business comprises salary packaging administration services as well as associated novated leasing services.
Smartgroup’s vehicle services business comprises outsourced fleet management and associated products. Novated leasing is an overlap between the two core areas. The table below lists the brands.
Key Brands Description
Sal
ary
Pac
kag
ing
Ad
min
istr
atio
n – Outsourced salary packaging provider to the largest employers in the country with over 118,000 employee customers under management
– Diverse customer base across health, charities, state and federal government departments and corporates
– Specialist software licensed to organisations across Australia to manage the salary packaging arrangements of employees in-house
– Provider of marketing and administrative services for salary packaging benefit cards, on behalf of an Australian bank
No
vate
d
Le
asin
g
– Over 30,000 novated leases under management
Flee
t M
anag
emen
t
– Online fleet management system, servicing over 14,000 vehicles in Australia
– Distributor of a range of insurance products for the novated lease and motor vehicle industry
Smartgroup Corporation Ltd | 10Smartgroup Corporation Ltd | 10
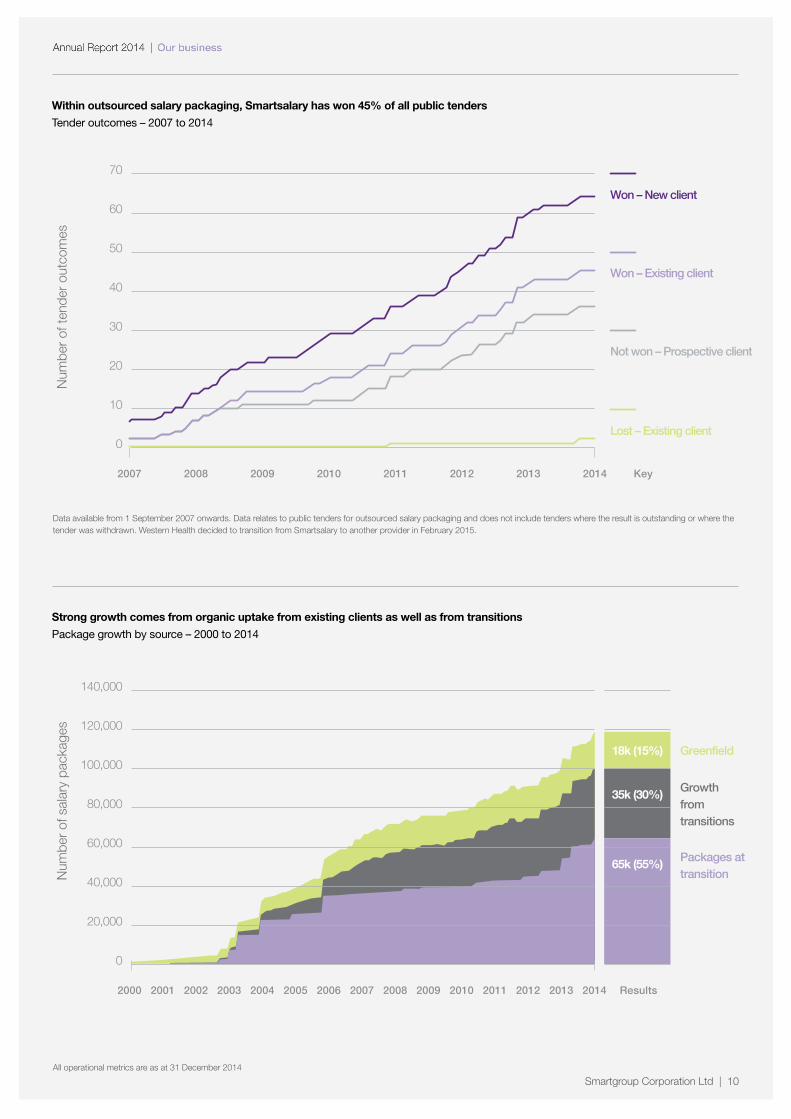
Within outsourced salary packaging, Smartsalary has won 45% of all public tenders
Tender outcomes – 2007 to 2014
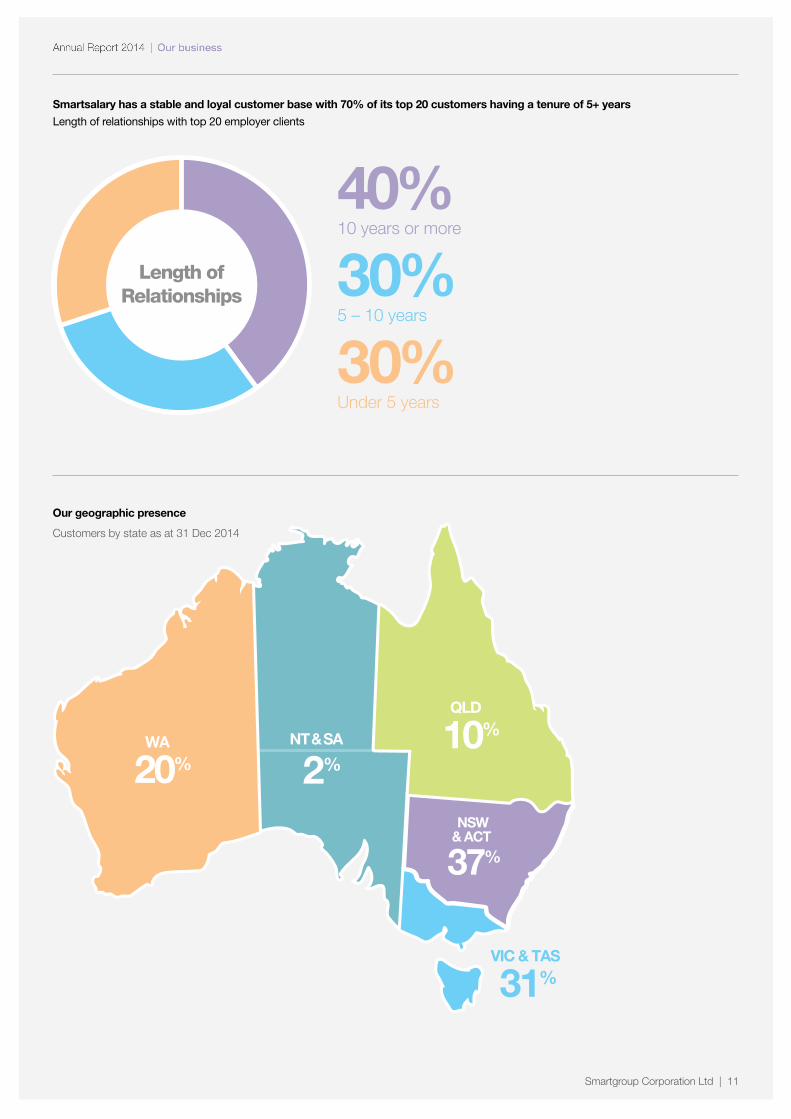
VIC & TAS
31%
QLD
10%WA
20%
NSW& ACT
37%
NT & SA
2%
Num
ber
of s
alar
y pa
ckag
esN
umbe
r of
tend
er o
utco
mes
18k (15%) Greenfield
35k (30%) Growthfromtransitions
65k (55%) Packages attransition
2010 2012 2013 2014 Results20112005 2007 2008 200920062000 2002 2003 20042001
20,000
40,000
0
60,000
80,000
100,000
120,000
140,000
2010 2012 Key201120092007
10
20
0
30
40
50
60
70
Not won – Prospective client
Won – Existing client
Lost – Existing client
20142013
Won – New client
2008
Data available from 1 September 2007 onwards. Data relates to public tenders for outsourced salary packaging and does not include tenders where the result is outstanding or where the tender was withdrawn. Western Health decided to transition from Smartsalary to another provider in February 2015.
VIC & TAS
31%
QLD
10%WA
20%
NSW& ACT
37%
NT & SA
2%
Num
ber
of s
alar
y pa
ckag
esN
umbe
r of
tend
er o
utco
mes
18k (15%) Greenfield
35k (30%) Growthfromtransitions
65k (55%) Packages attransition
2010 2012 2013 2014 Results20112005 2007 2008 200920062000 2002 2003 20042001
20,000
40,000
0
60,000
80,000
100,000
120,000
140,000
2010 2012 Key201120092007
10
20
0
30
40
50
60
70
Not won – Prospective client
Won – Existing client
Lost – Existing client
20142013
Won – New client
2008
Strong growth comes from organic uptake from existing clients as well as from transitions
Package growth by source – 2000 to 2014
All operational metrics are as at 31 December 2014
Smartgroup Corporation Ltd | 11
SmartsalaryRevenue
TenderOutcomes
2007 – 2013
Length ofRelationships
02008 2009 2010 2011 2012 2013
10
20
30
40
50
60
70
40%10 years or more
30%5 – 10 years
30%Under 5 years
Smartsalary has a stable and loyal customer base with 70% of its top 20 customers having a tenure of 5+ years
Length of relationships with top 20 employer clients
VIC & TAS
31%
QLD
10%WA
20%
NSW& ACT
37%
NT & SA
2%
Num
ber
of s
alar
y pa
ckag
esN
umbe
r of
tend
er o
utco
mes
18k (15%) Greenfield
35k (30%) Growthfromtransitions
65k (55%) Packages attransition
2010 2012 2013 2014 Results20112005 2007 2008 200920062000 2002 2003 20042001
20,000
40,000
0
60,000
80,000
100,000
120,000
140,000
2010 2012 Key201120092007
10
20
0
30
40
50
60
70
Not won – Prospective client
Won – Existing client
Lost – Existing client
20142013
Won – New client
2008
Our geographic presence
Customers by state as at 31 Dec 2014
Smartgroup Corporation Ltd | 12
Our clientsThe relationships we foster with clients goes beyond that of client and vendor. We form partnerships that ensure we are helping them reach their strategic goals. By working together, we are able to continuously improve our products and services.
“For over a decade Melbourne Health and Smartsalary have worked together to deliver their suite of salary packaging benefits to our organisation and during that time we have seen a 134% increase in staff uptake of these benefits.
Smartsalary’s innovative approach to service delivery has saved both my team and our employees time, effort and money, offering improved, simpler export systems and Smartphone apps to name just a couple of initiatives. Smartsalary provides us with a level of confidence and customer service second to none”.
Maurice Davoli | Deputy Director of HR, Melbourne Health
“I knew from the start that our experience with Smartsalary was going to be good – what could have been a complex transition to their services ended up being a seamless experience. They were accommodating and transparent, and ensured I was kept informed every step of the way. That focus on open and honest communication has continued throughout our partnership, and is something I personally value very highly. Looking in at their culture of innovation and customer service, I can wholeheartedly say I trust Smartsalary to deliver the best possible services to the staff at St Vincent’s Health Australia”.
Lynne Fishwick | Director of Planning and Service Development, Private Hospital Division St Vincent’s Health Australia
“At Eastern Health we have combined SeQoya salary packaging software with the Smartleasing program to achieve system efficiencies.
SeQoya integrates the management of both employee fringe benefits and novated leases, giving consistent and manageable processes for not only our employees but also for Eastern Health as well. As a result, we’ve seen over a 200% increase in the adoption of novated leasing benefits by our staff.
I would highly recommend the integrated model of SeQoya salary packaging software with the Smartleasing offering plugged into the model”.
Belinda Couch | Associate Program Director – Employee Benefits, Eastern Health
Smartgroup Corporation Ltd | 13
“Smartfleet has been our fleet solution provider since 2008. We’ve really been partners in developing and co-creating solutions. Using the Smartfleet system, we collect and analyse data on every aspect of the fleet vehicles including fuel use, kilometres travelled and maintenance. Automated analysis and a suite of reports from the system enables the fleet management team to monitor and manage the vehicles which in the long term will reduce the financial risk, ensure legislative compliance and reduce the risk of driver incidents.
Smartfleet employees display a level of professionalism and customer orientation that helps our team focus on our end customers in turn”.
Mark Stephens | Category Manager - Capital Equipment, Fleet Operations Manager, UnitingCare Queensland
“Smartsalary have been providing salary packaging and novated leasing services to our employees since 2003. Their digital channels and ability to self serve make it easy for our employees to educate themselves on these benefits. As a result, these services have played an integral part of our employee benefits strategy. Our partnership has been one of collaboration and the open communications with my team is something I highly value in this partnership”.
Adam James | Group General Manager, Remuneration and Benefits John Holland Group
Smartgroup Corporation Ltd | 14
Our customers
* The average engagement score is the absolute interactions per the total number of fans for the year ended 31 December 2014. ** Source: “Finding the right engagement rate for your page in 2014”, socialbakers.
Nicholas B
“The claim process is very simple... help is only a phone call away too... I’m on my second Holden Cruze SriV... Smartsalary guided me through the paperwork… the most effective way of owning a new vehicle! Thank you.”
Karl C
“I’m now on my second Smartleasing car. The concept is brilliant. Will be going for a 3rd soon.”
Jill M
“I just love my little Swift from Smartleasing! Easy convenient and hassle free! My services and insurances and rego all included! Wouldn’t do it any other way.”
Alysha N
“I always get excellent, efficient and timely customer service which truly makes a huge difference... and importantly, there is a great variety to package so I make huge savings each year. Thank you!!”
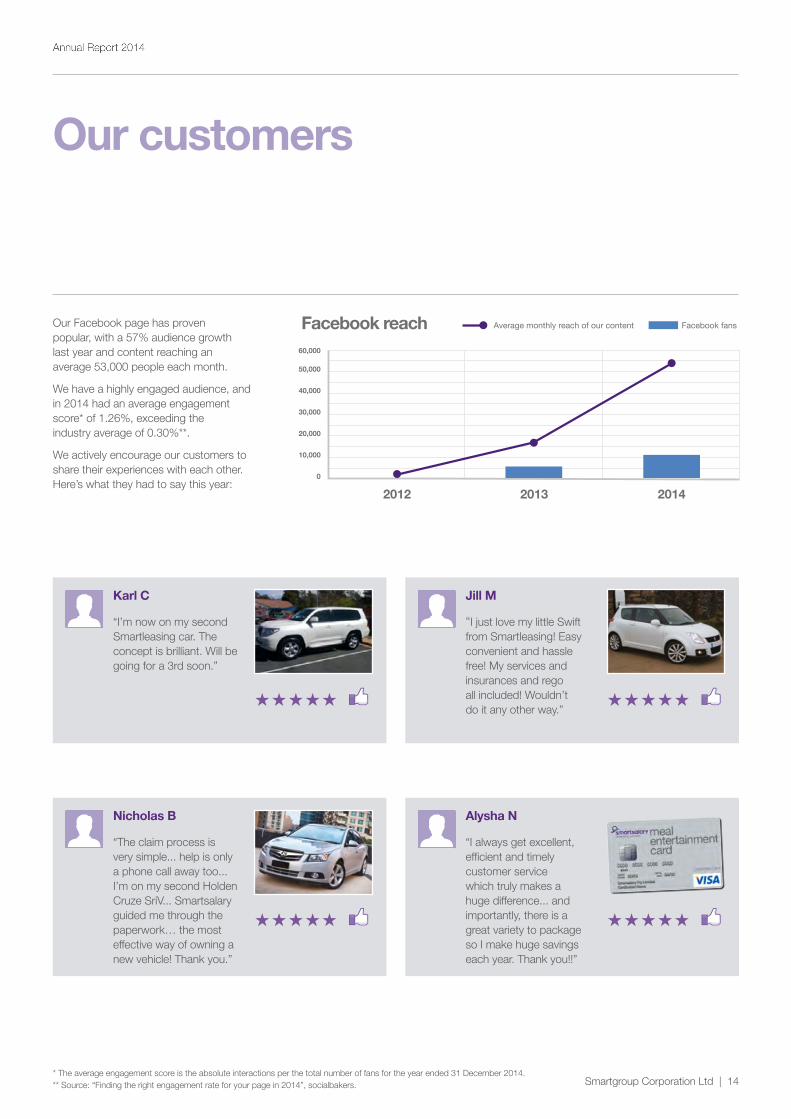
Our Facebook page has proven popular, with a 57% audience growth last year and content reaching an average 53,000 people each month.
We have a highly engaged audience, and in 2014 had an average engagement score* of 1.26%, exceeding the industry average of 0.30%**.
We actively encourage our customers to share their experiences with each other. Here’s what they had to say this year:
Facebook reach
2012 2013 2014
0
10,000
20,000
30,000
40,000
50,000
60,000
Average monthly reach of our content Facebook fans
Smartgroup Corporation Ltd | 15
People represent the single largest investment Smartgroup makes every year and is one of the core reasons behind its success.
With a workforce today of over 340 employees across Australia, driving staff engagement and a high performance culture are foundational to the Smartgroup People Strategy.
At Smartgroup we believe that creating an exceptional work environment is essential to achieving our business strategy. Specifically, it is essential that the company provides employees with the most rewarding and satisfying work environment whereby team members are able to reach their optimum level of performance and engagement. This will ultimately lead to higher levels of productivity, discretionary effort and value-add to the customer and overall business performance.
This thinking is by no way ground breaking or novel in its approach. Studies by leading research companies show that engaged employees are more productive.
They are more profitable, more customer-focused, safer and less likely to leave. The best performing companies know that an employee engagement improvement strategy linked to the achievement of corporate goals will help them win in the marketplace.
Building a high performance work culture
Building and creating a high performance work environment and workforce allows us to
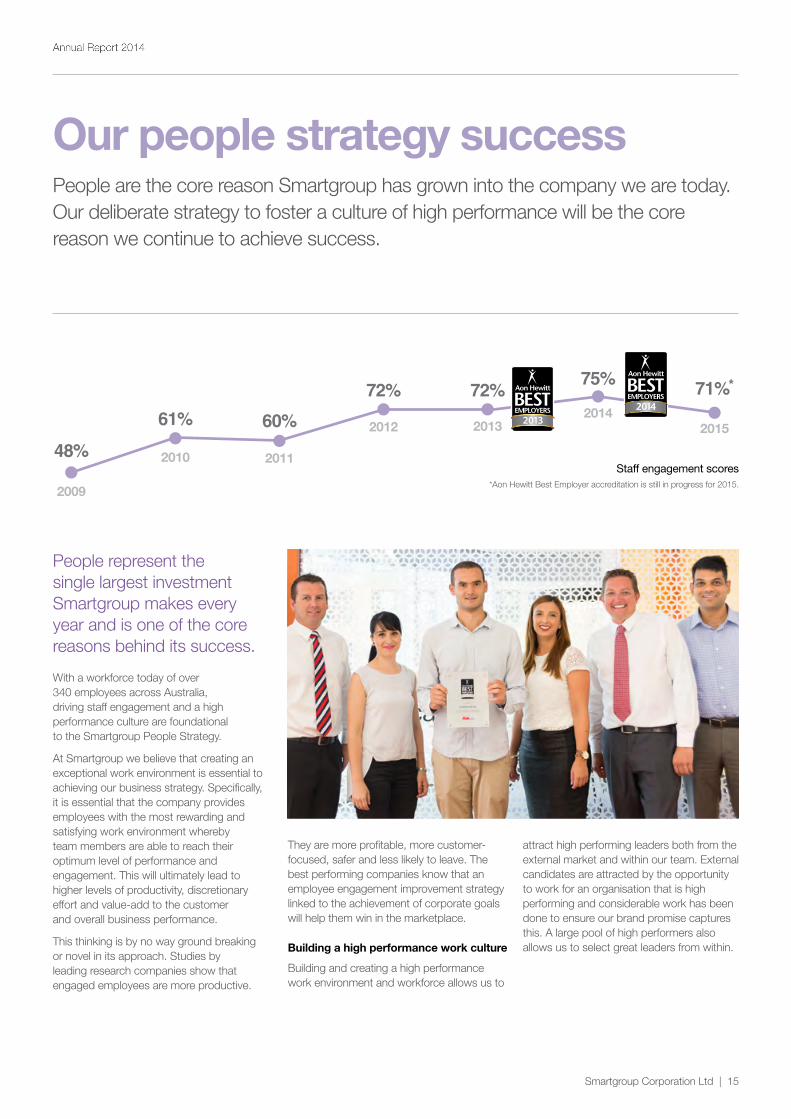
Our people strategy successPeople are the core reason Smartgroup has grown into the company we are today. Our deliberate strategy to foster a culture of high performance will be the core reason we continue to achieve success.
48%
2009
61%
2010
60%
2011
72%
2012
72%
2013
75%
2014
71%*
2015
Staff engagement scores*Aon Hewitt Best Employer accreditation is still in progress for 2015.
attract high performing leaders both from the external market and within our team. External candidates are attracted by the opportunity to work for an organisation that is high performing and considerable work has been done to ensure our brand promise captures this. A large pool of high performers also allows us to select great leaders from within.
Smartgroup Corporation Ltd | 16
Our annual people plan is based on progressing our maturity levels within the engagement matrix. We recognise that we will move through each stage at varying speed and degree and the plan for each
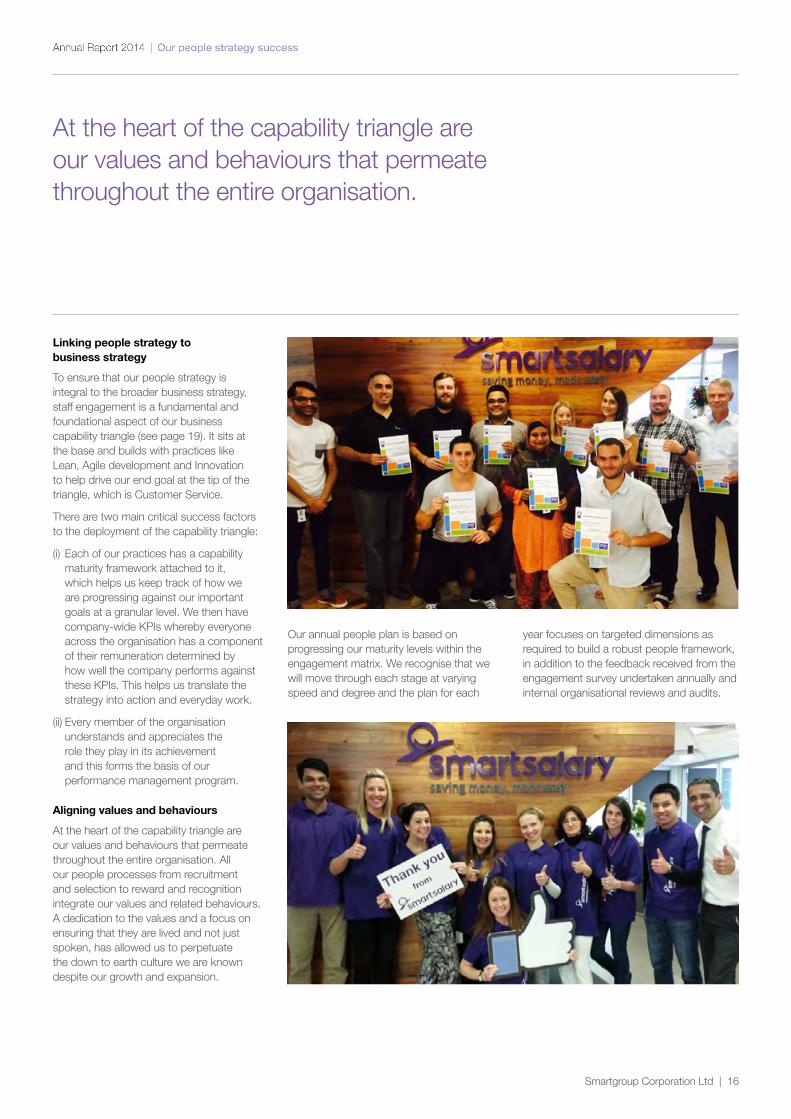
Linking people strategy to business strategy
To ensure that our people strategy is integral to the broader business strategy, staff engagement is a fundamental and foundational aspect of our business capability triangle (see page 19). It sits at the base and builds with practices like Lean, Agile development and Innovation to help drive our end goal at the tip of the triangle, which is Customer Service.
There are two main critical success factors to the deployment of the capability triangle:
(i) Each of our practices has a capability maturity framework attached to it, which helps us keep track of how we are progressing against our important goals at a granular level. We then have company-wide KPIs whereby everyone across the organisation has a component of their remuneration determined by how well the company performs against these KPIs. This helps us translate the strategy into action and everyday work.
(ii) Every member of the organisation understands and appreciates the role they play in its achievement and this forms the basis of our performance management program.
Aligning values and behaviours
At the heart of the capability triangle are our values and behaviours that permeate throughout the entire organisation. All our people processes from recruitment and selection to reward and recognition integrate our values and related behaviours. A dedication to the values and a focus on ensuring that they are lived and not just spoken, has allowed us to perpetuate the down to earth culture we are known despite our growth and expansion.
At the heart of the capability triangle are our values and behaviours that permeate throughout the entire organisation.
year focuses on targeted dimensions as required to build a robust people framework, in addition to the feedback received from the engagement survey undertaken annually and internal organisational reviews and audits.
Smartgroup Corporation Ltd | 17
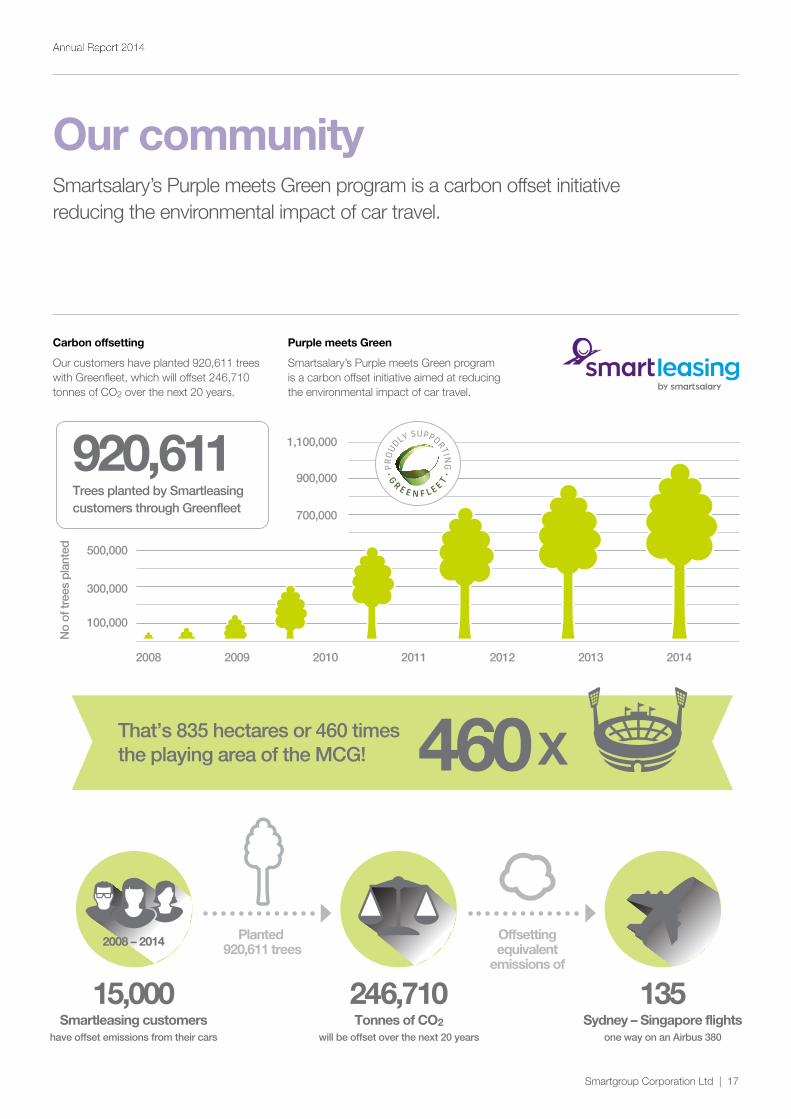
Our communitySmartsalary’s Purple meets Green program is a carbon offset initiative reducing the environmental impact of car travel.
100,000
500,000
No o
f tre
es p
lant
ed
700,000
300,000
900,000
1,100,000
2008 2009 2010 2011 2012 2013 2014
920,611 Trees planted by Smartleasing customers through Greenfleet
135Sydney – Singapore flights
one way on an Airbus 380
246,710Tonnes of CO2
will be offset over the next 20 years
Planted 920,611 trees
15,000Smartleasing customers
have offset emissions from their cars
2008 – 2014 Offsettingequivalent
emissions of
That’s 835 hectares or 460 times the playing area of the MCG! 460 X
Purple meets Green
Smartsalary’s Purple meets Green program is a carbon offset initiative aimed at reducing the environmental impact of car travel.
Carbon offsetting
Our customers have planted 920,611 trees with Greenfleet, which will offset 246,710 tonnes of CO2 over the next 20 years.
Smartgroup Corporation Ltd | 18
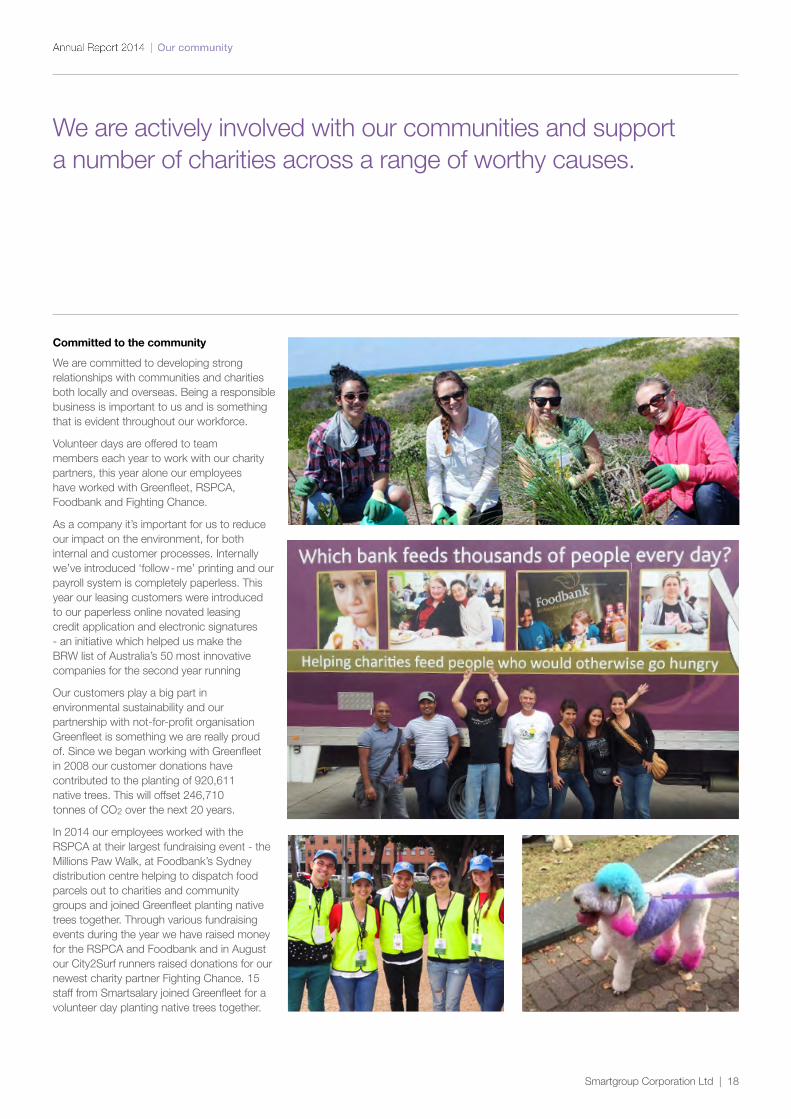
Committed to the community
We are committed to developing strong relationships with communities and charities both locally and overseas. Being a responsible business is important to us and is something that is evident throughout our workforce.
Volunteer days are offered to team members each year to work with our charity partners, this year alone our employees have worked with Greenfleet, RSPCA, Foodbank and Fighting Chance.
As a company it’s important for us to reduce our impact on the environment, for both internal and customer processes. Internally we’ve introduced ‘follow - me’ printing and our payroll system is completely paperless. This year our leasing customers were introduced to our paperless online novated leasing credit application and electronic signatures - an initiative which helped us make the BRW list of Australia’s 50 most innovative companies for the second year running
Our customers play a big part in environmental sustainability and our partnership with not-for-profit organisation Greenfleet is something we are really proud of. Since we began working with Greenfleet in 2008 our customer donations have contributed to the planting of 920,611 native trees. This will offset 246,710 tonnes of CO2 over the next 20 years.
In 2014 our employees worked with the RSPCA at their largest fundraising event - the Millions Paw Walk, at Foodbank’s Sydney distribution centre helping to dispatch food parcels out to charities and community groups and joined Greenfleet planting native trees together. Through various fundraising events during the year we have raised money for the RSPCA and Foodbank and in August our City2Surf runners raised donations for our newest charity partner Fighting Chance. 15 staff from Smartsalary joined Greenfleet for a volunteer day planting native trees together.
We are actively involved with our communities and support a number of charities across a range of worthy causes.
Smartgroup Corporation Ltd | 19
AgileLean Innovation
Customer Service
© 2014 Smartsalary Pty Ltd
Staff Engagement
2014
State
2011
State
2012
National
2013
State
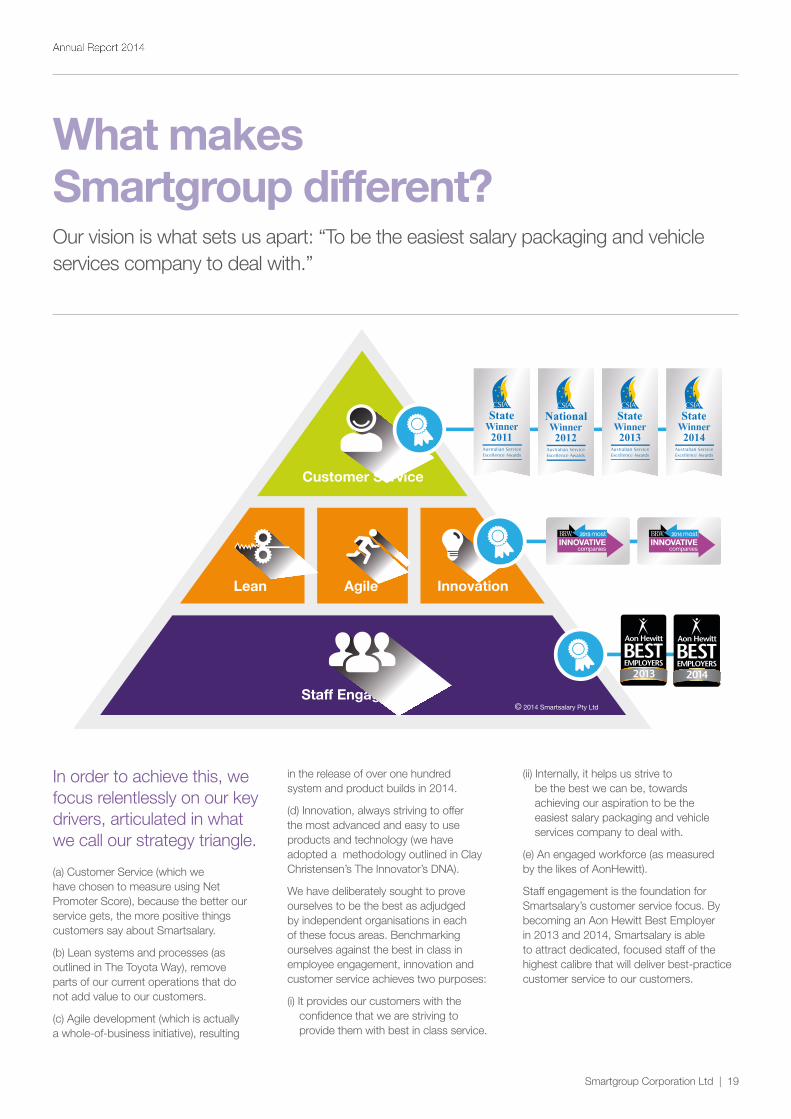
What makes Smartgroup different?Our vision is what sets us apart: “To be the easiest salary packaging and vehicle services company to deal with.”
in the release of over one hundred system and product builds in 2014.
(d) Innovation, always striving to offer the most advanced and easy to use products and technology (we have adopted a methodology outlined in Clay Christensen’s The Innovator’s DNA).
We have deliberately sought to prove ourselves to be the best as adjudged by independent organisations in each of these focus areas. Benchmarking ourselves against the best in class in employee engagement, innovation and customer service achieves two purposes:
(i) It provides our customers with the confidence that we are striving to provide them with best in class service.
(ii) Internally, it helps us strive to be the best we can be, towards achieving our aspiration to be the easiest salary packaging and vehicle services company to deal with.
(e) An engaged workforce (as measured by the likes of AonHewitt).
Staff engagement is the foundation for Smartsalary’s customer service focus. By becoming an Aon Hewitt Best Employer in 2013 and 2014, Smartsalary is able to attract dedicated, focused staff of the highest calibre that will deliver best-practice customer service to our customers.
In order to achieve this, we focus relentlessly on our key drivers, articulated in what we call our strategy triangle.
(a) Customer Service (which we have chosen to measure using Net Promoter Score), because the better our service gets, the more positive things customers say about Smartsalary.
(b) Lean systems and processes (as outlined in The Toyota Way), remove parts of our current operations that do not add value to our customers.
(c) Agile development (which is actually a whole-of-business initiative), resulting
Smartgroup Corporation Ltd | 20
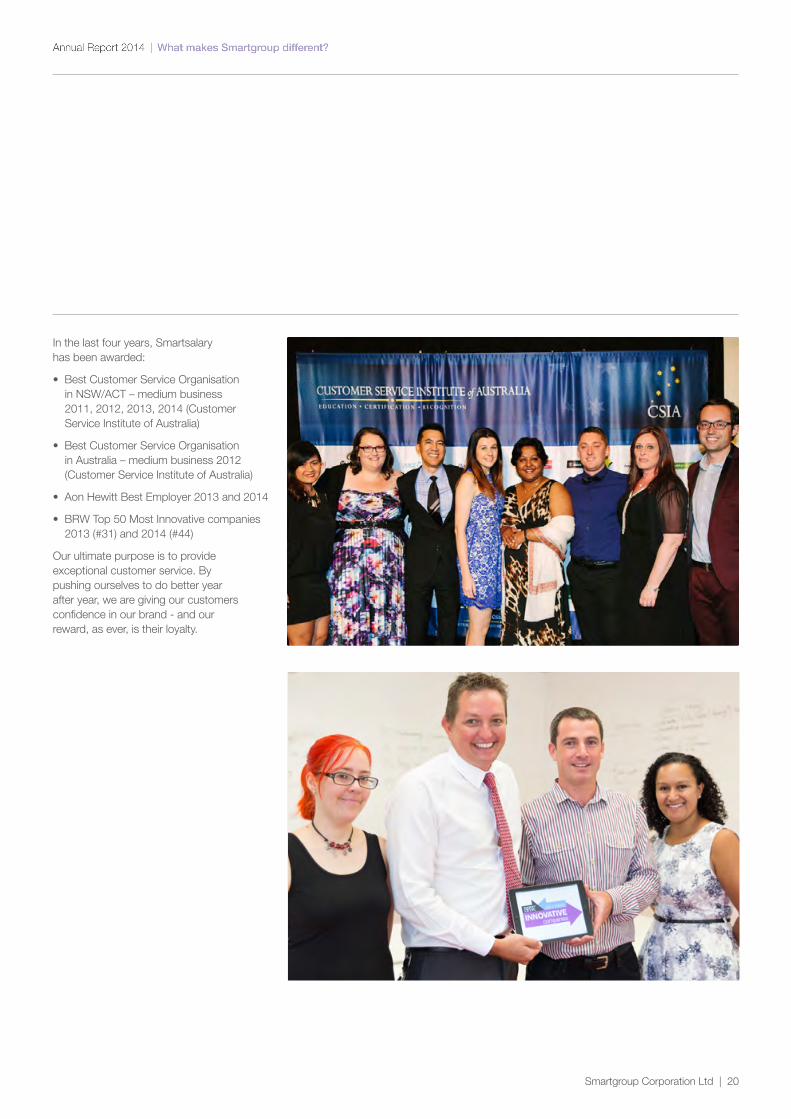
In the last four years, Smartsalary has been awarded:
• Best Customer Service Organisation in NSW/ACT – medium business 2011, 2012, 2013, 2014 (Customer Service Institute of Australia)
• Best Customer Service Organisation in Australia – medium business 2012 (Customer Service Institute of Australia)
• Aon Hewitt Best Employer 2013 and 2014
• BRW Top 50 Most Innovative companies 2013 (#31) and 2014 (#44)
Our ultimate purpose is to provide exceptional customer service. By pushing ourselves to do better year after year, we are giving our customers confidence in our brand - and our reward, as ever, is their loyalty.
Smartgroup Corporation Ltd | 21
Corporate governance statement
The Board of Directors (‘Board’) of Smartgroup Corporation Ltd (‘Company’) is committed to achieving the highest standards of corporate governance. Upon the Company’s listing in July 2014, the Board adopted a corporate governance framework comprising principles and policies that the Board considers fundamental to the Company’s continued growth and success.
This framework is designed to promote responsible management and assists the Board to discharge its corporate governance responsibilities on behalf of the Company’s shareholders.
Copies or summaries of the charters under which the Board and its Committees operate, the Company’s policies and other relevant information referred to in this Statement are available on the Company’s website at http://ir.smartgroup.com.au/Investors/.
The Company has followed the recommendations set out in the ASX Corporate Governance Council’s Corporate Governance Principles and Recommendations (2nd edition) (’ASX Recommendations’) from the date of listing in July 2014 to 31 December 2014.
The 3rd edition of the ASX Recommendations will apply to the Company from its financial year beginning 1 January 2015. The Company will therefore report against the recommendations of the ASX Recommendations (3rd edition) either in its 2015 Annual Report or via a link to its website, in accordance with the revised ASX requirements. Unless otherwise stated, the commentary in this Statement is in relation to the ASX Recommendations (2nd edition).
This Statement is structured and numbered in the order of the Principles set out in the ASX Recommendations.
PRINCIPLE 1 – LAY SOLID FOUNDATIONS FOR MANAGEMENT AND OVERSIGHT
Role of Board and management
The Board has ultimate responsibility for setting strategy and policy regarding the business and affairs of the Company and its subsidiaries for the benefit of shareholders after having considered regulatory matters and other ethical expectations and obligations.
The Board operates in accordance with the principles laid out in its Board Charter to provide a framework for its effective operation. As set out in the Board Charter, the Board’s role and responsibilities include (in summary):
• Direction and objectives: approving the Company’s corporate strategy, budgets and targets;
• Compliance: monitoring compliance with all laws, regulations and accounting standards;
• Performance and remuneration: appointing, evaluating, rewarding or removing senior management; monitoring performance; establishing all remuneration-related arrangements; and reviewing succession planning;
• Risk management: reviewing, ratifying and monitoring management’s framework and systems of risk management, internal controls and compliance; and
• Ethical: promoting ethical and responsible decision-making, including establishing, maintaining and monitoring compliance and implementation of appropriate codes of conduct and other significant corporate policies.
The Board delegates to the Chief Executive Officer (‘CEO’) the authority to manage and control the day-to-day affairs of the Company within levels or limits of authority specified by the Board. Subject to the terms of its delegation, the CEO has authority to sub-delegate to other Key Management Personnel (‘KMP’)
The CEO and KMP team have responsibility for the development and execution of the Company’s strategy and for the day-to-day management of the Company. Ultimate approval of the Company’s strategy and oversight of the Company rests with the Board.
Management performance evaluation
As part of the Board’s oversight of the executive management, the Human Resources and Remuneration Committee monitors and evaluates their performance. All the executives are subject to annual performance reviews. Those reviews involve the executive being assessed against agreed strategic goals, company-wide management goals and individual goals.
Performance evaluations were conducted in the final quarter of the calendar year in accordance with the above process.
Smartgroup Corporation Ltd | 22
PRINCIPLE 2 – STRUCTURE THE BOARD TO ADD VALUE
Composition of the Board
In accordance with its Charter, the Board consists of a majority of non-executive, independent directors.
The Board currently has five directors, one of whom is an executive director (the Managing Director and CEO). The remaining directors, including the chairman of the Board, are non-executive directors.
In terms of the mix of skills and diversity which the Board is looking to achieve, the key objective, as provided in the Board Charter, is to have directors with an appropriate range of skills, experience and expertise and an understanding of and competence to deal with current and emerging issues of the business.
Independence
In its Charter, the Board has adopted the definition of independence set out in the ASX Recommendations. Broadly speaking, a director is considered independent by the Company if the director is a non-executive director who is not a member of management, and is free of any business or other relationship that could materially interfere with the exercise of their unfettered and independent judgement or could reasonably be perceived to do so.
The Board considers that Michael Carapiet (chairman of the Board), Gavin Bell and John Prendiville are independent when assessed in accordance with the criteria in the ASX Recommendations. As Managing Director and CEO of the Company, Deven Billimoria is not considered to be independent, nor is Andrew Bolam because of his connections with associates of the Company’s largest shareholder, Smart Packages Pte Ltd.
Subject to consultation with the chairman, directors may have access in appropriate circumstances to independent professional advice at the Company’s expense in order to assist them in carrying out their Board duties.
The Board will continually assess whether each non-executive director is independent. The directors are required to provide all information to the Board which may be relevant to this assessment.
The roles of Chairman and Managing Director and CEO are separate, and the Board Charter sets out the responsibilities of each office. The roles of Chairman and CEO are not exercised by the same individual.
The directors currently in office were appointed on the following dates:
Name Appointment Date
Michael Carapiet 18 February 2014
Deven Billimoria 13 March 2014
John Prendiville 18 February 2014
Gavin Bell 18 February 2014
Andrew Bolam 6 January 2012
Further details on each director can be found in the directors’ report under the heading ‘Our directors’.
Board Committees
To assist the Board in meeting its responsibilities, the Board currently has the following two Committees:
• the Audit and Risk Committee (‘ARC’)
• the Human Resources and Remuneration Committee (‘HRRC’) (effectively a Nominations Committee).
Each of the Committees has its own Charter which establishes the Committee’s terms of reference and operating procedures.
Details of the ARC are set out under the heading ‘Principle 4: Safeguard integrity in financial reporting’.
All of the non-executive directors are members of both the Audit and Risk Committee, chaired by John Prendiville, and the Human Resources and Remuneration Committee, chaired by Gavin Bell.
Human Resources and Remuneration Committee
The Human Resources and Remuneration Committee (‘HRRC’) has a Charter approved by the Board. A copy of the Charter is available on the Company’s website. The HRRC currently consists of all the directors (and so it has a majority of independent non-executive directors) and is chaired by an independent director, Gavin Bell.
Under its Charter, the HRRC assists and advises the Board on director selection, recommendation and appointment practices; director performance evaluation processes and criteria; Board composition; and succession planning for the Board and executives. This is to ensure that the Board is of a size and composition conducive to making appropriate decisions, with the benefit of a variety of perspectives and skills and in the best interests of the Company as a whole.
The HRRC reviews and makes recommendations to the Board on matters relating to the size and composition of the Board. The HRRC assesses the appropriate mix of skills, experience, expertise and diversity required on the Board and the extent to which such skills are represented on the Board. As part of this process, the Company has developed a Board skills matrix, which assists in identifying any “gaps” in the skills and experiences of the directors on the Board.
As and when necessary, the HRRC will implement a process to identify suitable candidates, which may include a search being undertaken by an appropriate third party. The HRRC will evaluate prospective candidates and make recommendations to the Board for the appointment of new Board members. When the Board considers that a suitable candidate has been found, that person is appointed by the Board and, in accordance with the Company’s constitution, must stand for re-election by shareholders at the next annual general meeting (‘AGM’).
The HRRC meets as frequently as required to undertake its role effectively. The HRRC will review its performance from time to time.
The attendance of the members of the HRRC at each meeting held during the year ended 31 December 2014 can be found in the directors’ report under the heading ‘Meetings of directors’.
Board performance evaluations
The Board intends to undertake annual performance evaluations, commencing in 2015. A performance evaluation was not undertaken in 2014, because all except one of the directors were only appointed part way through the year.
The process for the review of the Board’s performance will be overseen by the chairman of the Board.
Director induction, training and continuous education
The HRRC is responsible for developing and reviewing induction procedures for any new appointees to the Board to enable them to discharge their duties effectively, and to increase their knowledge about the Company and the industry within which the Company operates.
In 2015, the Committee will ensure that continuous education measures are put in place to increase directors’ skills and knowledge and keep directors up to date with new developments.
Smartgroup Corporation Ltd | 23
PRINCIPLE 3 – PROMOTE ETHICAL AND RESPONSIBLE DECISION-MAKING
The Company is committed to and strives to act honestly and with integrity in all its dealings.
The Company has adopted a Code of Conduct which sets out core values and commitments. The Code applies to all directors of the Company, as well as all officers, employees, contractors, consultants, other persons that act on behalf of the Company, and associates of the Company. The Code is set out on the Company’s website. Company employees undertake training in relation to the policy.
Further, the Company has an Ethics policy, a summary of which is also on the Company’s website.
Diversity Policy
The Company has in place a Diversity Policy, also set out on the Company’s website. The Company has a very broad and diverse employee base, in terms of gender, age, race and culture, and has done so for many years. The diversity of the staff is a matter of pride for the Company and the Board believes that it contributes to levels of employee satisfaction and feelings of inclusion in the workplace.
The Company has a Diversity Manager (a position held by the Chief Human Resources Manager, Houda Lebbos). In summary, the Diversity Manager is responsible for:
• promoting diversity as an important strategic and cultural factor to achieve business objectives across the Company;
• proposing measurable diversity objectives to the Board to achieve gender diversity, identifying ways in which achievement is to be measured and reporting to the Board on progress;
• providing information to the Board about the proportion of women in the Company and women in senior executive positions; and
• identifying programs and initiatives designed to achieve greater gender diversity on the Board and in senior management.
These initiatives have been informally in place before the Company’s listing on ASX in July 2014. Since that date, the initiatives have been developed further and formalised, in particular to assist in reporting to the Board on progress. The Diversity Manager reports to the Board regularly on the above matters and is in the process of developing formal programs to
address gender equality. These programs will formalise and build on current practices.
The Board will:
• together with senior management, review ways to promote a culture supportive of diversity;
• review and approve measurable objectives for achieving diversity, including gender diversity across and at various levels of, the Company;
• annually assess these objectives and the progress in achieving them; and
• review and monitor the effectiveness of this policy, including in relation to Board diversity.
As at 31 December 2014, approximately 46% of the aggregate employment base of the Company were women. This figure comprises 1 executive (out of a group of 5) and 159 staff (out of a total of 343).
The Board was formed in the first half of 2014 and currently all Board members are men. The Board is considering candidates for membership and gender is a material factor being taken into account in that process.
Trading Policy
The Board has adopted a Trading Policy which regulates dealings in the Company’s shares (available on the Company’s website). The policy aims to ensure that the Company’s directors, employees, advisors, auditors and consultants are aware of the legal restrictions on trading in securities while a person is in possession of inside information. Subject to the restriction that persons may not deal in any securities when they are in possession of price-sensitive information, directors and employees may generally only buy or sell the Company’s shares during “trading windows”, being the periods immediately following the release of the Company’s half-year and full year results and the AGM.
PRINCIPLE 4 – SAFEGUARD INTEGRITY IN FINANCIAL REPORTING
Audit and Risk Committee
The Audit and Risk Committee (‘ARC’) has a Charter approved by the Board. A copy of the Charter is available on the Company’s website.
Further details on qualifications of each ARC member can be found in the directors’ report under the heading ‘Information on directors’. Members of the ARC are financially literate.
In summary, the ARC assists the Board in its review of financial reporting principles and policies, controls and procedures, internal control and risk management and internal audit. It also assists the Board in its review of the accuracy and adequacy of the Company’s financial statements and the external audit.
The ARC also liaises with the Company’s external auditors, reviews the scope of their activities, their remuneration and independence, and advises the Board on their appointment and removal.
The ARC has the authority to:
• require management or others to attend meetings and to provide any information or advice that the ARC requires;
• access the Company’s documents and records;
• obtain the advice of special or independent counsel, accountants or other experts, without seeking approval of the Board or management; and
• access management and internal and external auditors.
The ARC meets as frequently as required to undertake its role effectively. The ARC will review its performance from time to time.
The attendance of the members of the ARC at each meeting held during the year ended 31 December 2014 can be found in the directors’ report under the heading ‘Meetings of directors’.
In November 2014 the Company appointed an Internal Audit and Risk Manager to assist the ARC and the Board in the management and control of risk. He manages the internal audit function.
The Internal Audit and Risk Manager and the external auditors, the Managing Director and CEO and the Chief Financial Officer (‘CFO’) are invited at various times to attend ARC meetings.
Smartgroup Corporation Ltd | 24
PRINCIPLE 5 – MAKE TIMELY AND BALANCED DISCLOSURE
The Company is subject to continuous disclosure obligations under the ASX Listing Rules and Corporations Act 2001. Subject to some limited exceptions, under the continuous disclosure requirements, the Company must immediately notify the market, through ASX, of any information which a reasonable person would expect to have a material effect on the price or value of the Company’s shares.
To achieve these objectives and satisfy the regulatory requirements, the Board has adopted a Disclosure and Communications Policy. A copy of the Policy is available on the Company’s website. The Company also has Disclosure and Materiality Guidelines. These guidelines explain to staff the regulatory background to market disclosure, and help staff to identify what kinds of information require disclosure to the ASX so that all relevant information in the Company is brought to the attention of the Disclosure Committee (see further below).
The Policy aims to ensure the proper and timely disclosure of information to shareholders and provides that the Company will:
• comply with the continuous disclosure obligations imposed by law;
• ensure that company announcements are presented in a factual, clear and balanced way;
• ensure that all shareholders have equal and timely access to material information concerning the Company; and
• communicate effectively with shareholders and make it easy for them to participate in general meetings.
The Company has established a Disclosure Committee, the members of which are the General Counsel, the Managing Director and CEO and the CFO. Their role is to keep the Board informed as to what matters may require announcement to the ASX, provide draft announcements to the Board for review and release those announcements.
The Company has appointed the company secretary as the person responsible for communication with ASX in relation to listing rule matters and also for the general administration of the Disclosure and Communications Policy.
PRINCIPLE 6 – RESPECT THE RIGHTS OF SHAREHOLDERS
The Company is committed to giving all shareholders comprehensive, timely and equal access to information about its activities so as to enable shareholders to make informed investment decisions and effectively exercise their rights as shareholders.
One of the Company’s key communication tools is its website. The Company has a dedicated investor section of its website (http://ir.smartgroup.com.au/Investors/). The investor section of the Company’s website includes information about the Company relevant to shareholders, including:
• all announcements lodged with the ASX, including annual and half-year financial results;
• the Board and Committee Charters, the Company’s constitution, and the corporate governance policies (or a summary of them);
• the Company’s Annual Report;
• information about the Company’s AGM (including the notice of meeting);
• financial information about the Company; and
• copies of slide packs and recordings of half-year and annual briefing presentations of results.
The Company provides an online email enquiry service to assist shareholders with any queries.
The Company will continue to review its methods by which it communicates with shareholders so as to ensure that it can make the best use of new technologies to enhance shareholder communication.
PRINCIPLE 7 – RECOGNISE AND MANAGE RISK
Risk oversight and management
The Company recognises risk management as an integral part of good corporate governance and fundamental in achieving its strategic and operational objectives.
The Board is responsible for identifying and assessing internal and external risks that may affect the business. The Board is responsible for approving the Company’s risk management strategy and policies including the overall internal control framework.
The Board has delegated coordination of risk oversight to the ARC. The ARC’s risk management responsibilities are to:
• prepare and maintain a risk profile which describes the risks facing the business;
• ensure that the Company has an effective risk management system;
• ensure that there are internal processes for determining and managing risk; and
• examine and evaluate the effectiveness of the internal control system with management and internal and external auditors and make any necessary improvements.
The task of undertaking and assessing risk management and internal control effectiveness are delegated to management through the Managing Director and CEO, the CFO and the General Counsel. Management reports to the Board on the Company’s key risks and the extent to which it believes that these risks are being adequately managed.
Risk management framework
The Company has a Risk Management Policy in place which is available on the Company’s website.
The Company has a risk management framework in place to identify, assess, manage and report risks on a consistent and reliable basis and to accord with the tolerance levels for risks set by the Board.
The risk management framework requires each business function to manage the risks associated with its activities. Accountability for risk management is structured as follows:
• Business Management – management within each business function is responsible for managing the risks for their business. This includes identifying and assessing the risks they face, determining and implementing an approach to the management of these risks, and using risk management outcomes and considerations as part of their day-to-day business decision-making processes;
• A Risk Management Committee has been established, the chair of which is the Internal Audit and Risk Manager. This Committee is responsible for adopting and reviewing the risk management framework, maintaining the evolving integrated risk profile and overseeing business management’s risk management activities. The Committee reports to the KMP which in turn reports to the Board. On some matters it reports directly to the ARC;
Smartgroup Corporation Ltd | 25
• The Internal Audit and Risk Manager – in relation to risk management, this function provides risk management expertise and oversight for business management’s risk management activities. This function provides specialist input to the development of policies and procedures for risk management and ensures they are used as part of the day-to-day management of the business. Internal Audit and Risk is the custodian of the risk management framework and monitors compliance with the framework, and the associated risk management policies and procedures; and
• Internal Audit and Risk – as the Company’s internal audit function, it provides independent assurance to key stakeholders regarding the adequacy and effectiveness of the Company’s system of internal controls and risk management procedures. The function is responsible for reviewing the risk management framework and business management practices for risk management and internal controls.
CEO and CFO declaration and assurance
In accordance with the ASX Recommendations, for the financial year ended 31 December 2014, the Board received written assurance from the Managing Director and CEO and the CFO that the declaration provided by them in accordance with section 295A of the Corporations Act is founded on a sound system of risk management and internal control and that the system is operating effectively in all material respects in relation to the reporting of financial risks.
PRINCIPLE 8 – REMUNERATE FAIRLY AND RESPONSIBLY
The Board and the HRRC is primarily responsible for the oversight of the Company’s remuneration framework and policies. Details of the Company’s remuneration framework are set out in the remuneration report, contained within the directors’ report. As explained earlier under Principle 2, the HRRC is formed under a Charter approved by the Board, a copy of which is available on the Company’s website.
The Company’s policy is to remunerate non-executive directors by way of fees and payments which may be in the form of cash, non-cash benefits and superannuation benefits. The Company’s broad policy in relation to the level of non-executive directors’ fees and payments are consistent with the market and enables the Company to attract and retain directors of an appropriate skill level and calibre.
Under the Company’s constitution the maximum remuneration payable by the Company for the services of non-executive directors in total must not exceed the amount approved by shareholders in general meeting. Prior to the date of admission of the Company to the Official List of ASX, this amount was fixed by Smart Packages Pte Ltd (the existing shareholder at the time of admission and listing) at $1,000,000 per annum.
Details of these remuneration of non-executive directors, executive directors and other KMP can be found in the directors’ report under the ‘Remuneration Report’ section, which has been audited.
Annual Report 2014
Section startSubheading here
Smartgroup Corporation Ltd | 26
Financial Report
Contents
Reconciliation of statutory results to proforma results 27
Director’s report 29
Auditor’s independence declaration 42
Statement of profit or loss and other comprehensive income 43
Statement of financial position 44
Statement of changes in equity 45
Statement of cash flows 46
Notes to the financial statements 47
Directors’ declaration 78
Independent auditor’s report 79
Shareholder information 81
Corporate directory 83
Smartgroup Corporation Pty Ltd (formerly known as Smartgroup Investments Ltd)
31 December 2014
ABN 48 126 266 831
Smartgroup Corporation Ltd | 27
Annual Report 2014
Reconciliation of statutory results to proforma resultsFor the year ended 31 December 2014
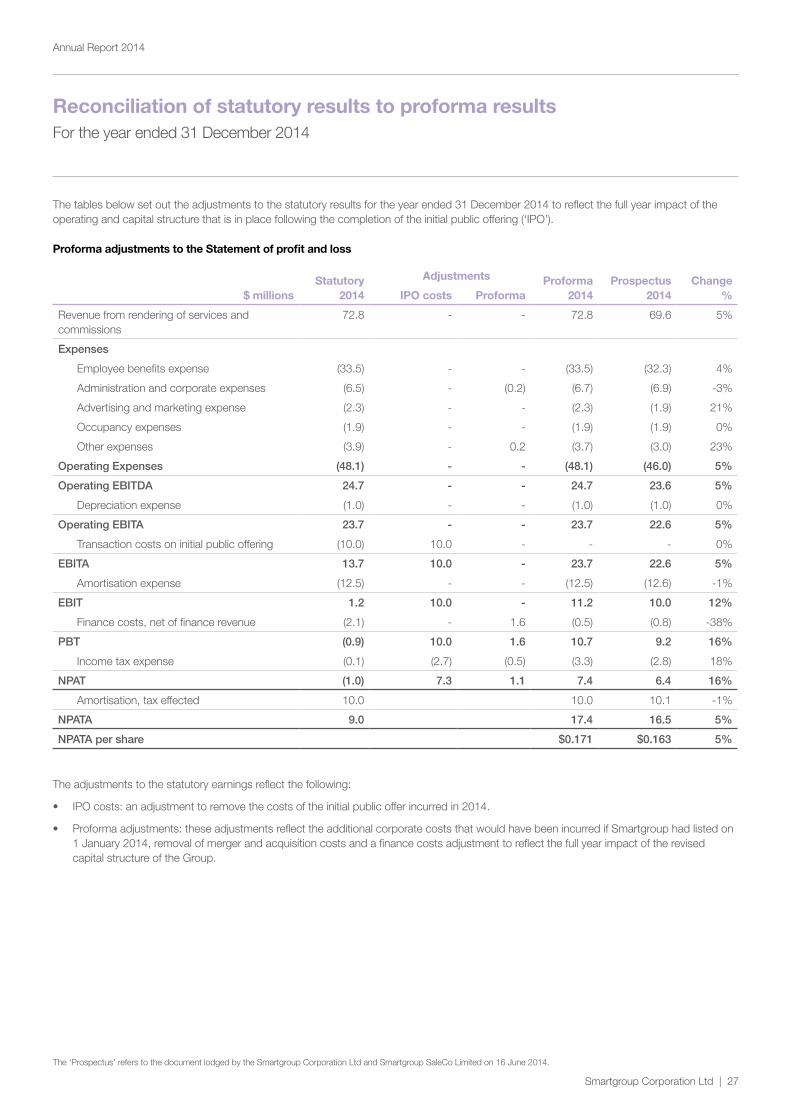
The tables below set out the adjustments to the statutory results for the year ended 31 December 2014 to reflect the full year impact of the operating and capital structure that is in place following the completion of the initial public offering (‘IPO’).
Proforma adjustments to the Statement of profit and loss
$ millions Statutory
2014
Adjustments Proforma 2014
Prospectus 2014
Change % IPO costs Proforma
Revenue from rendering of services and commissions
72.8 - - 72.8 69.6 5%
Expenses
Employee benefits expense (33.5) - - (33.5) (32.3) 4%
Administration and corporate expenses (6.5) - (0.2) (6.7) (6.9) -3%
Advertising and marketing expense (2.3) - - (2.3) (1.9) 21%
Occupancy expenses (1.9) - - (1.9) (1.9) 0%
Other expenses (3.9) - 0.2 (3.7) (3.0) 23%
Operating Expenses (48.1) - - (48.1) (46.0) 5%
Operating EBITDA 24.7 - - 24.7 23.6 5%
Depreciation expense (1.0) - - (1.0) (1.0) 0%
Operating EBITA 23.7 - - 23.7 22.6 5%
Transaction costs on initial public offering (10.0) 10.0 - - - 0%
EBITA 13.7 10.0 - 23.7 22.6 5%
Amortisation expense (12.5) - - (12.5) (12.6) -1%
EBIT 1.2 10.0 - 11.2 10.0 12%
Finance costs, net of finance revenue (2.1) - 1.6 (0.5) (0.8) -38%
PBT (0.9) 10.0 1.6 10.7 9.2 16%
Income tax expense (0.1) (2.7) (0.5) (3.3) (2.8) 18%
NPAT (1.0) 7.3 1.1 7.4 6.4 16%
Amortisation, tax effected 10.0 10.0 10.1 -1%
NPATA 9.0 17.4 16.5 5%
NPATA per share $0.171 $0.163 5%
The adjustments to the statutory earnings reflect the following:
• IPO costs: an adjustment to remove the costs of the initial public offer incurred in 2014.
• Proforma adjustments: these adjustments reflect the additional corporate costs that would have been incurred if Smartgroup had listed on 1 January 2014, removal of merger and acquisition costs and a finance costs adjustment to reflect the full year impact of the revised capital structure of the Group.
The ‘Prospectus’ refers to the document lodged by the Smartgroup Corporation Ltd and Smartgroup SaleCo Limited on 16 June 2014.
Smartgroup Corporation Ltd | 28
Annual Report 2014 |
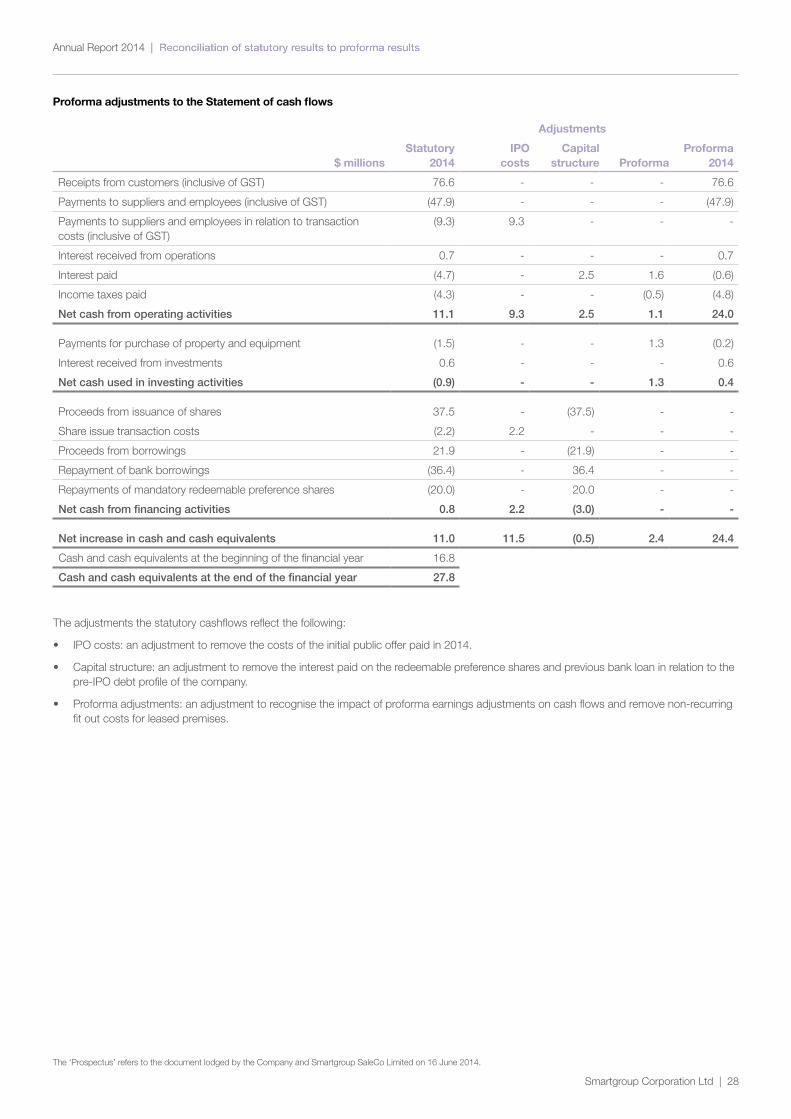
Proforma adjustments to the Statement of cash flows
$ millions Statutory
2014
Adjustments
Proforma 2014
IPO costs
Capital structure Proforma
Receipts from customers (inclusive of GST) 76.6 - - - 76.6
Payments to suppliers and employees (inclusive of GST) (47.9) - - - (47.9)
Payments to suppliers and employees in relation to transaction costs (inclusive of GST)
(9.3) 9.3 - - -
Interest received from operations 0.7 - - - 0.7
Interest paid (4.7) - 2.5 1.6 (0.6)
Income taxes paid (4.3) - - (0.5) (4.8)
Net cash from operating activities 11.1 9.3 2.5 1.1 24.0
Payments for purchase of property and equipment (1.5) - - 1.3 (0.2)
Interest received from investments 0.6 - - - 0.6
Net cash used in investing activities (0.9) - - 1.3 0.4
Proceeds from issuance of shares 37.5 - (37.5) - -
Share issue transaction costs (2.2) 2.2 - - -
Proceeds from borrowings 21.9 - (21.9) - -
Repayment of bank borrowings (36.4) - 36.4 - -
Repayments of mandatory redeemable preference shares (20.0) - 20.0 - -
Net cash from financing activities 0.8 2.2 (3.0) - -
Net increase in cash and cash equivalents 11.0 11.5 (0.5) 2.4 24.4
Cash and cash equivalents at the beginning of the financial year 16.8
Cash and cash equivalents at the end of the financial year 27.8
The adjustments the statutory cashflows reflect the following:
• IPO costs: an adjustment to remove the costs of the initial public offer paid in 2014.
• Capital structure: an adjustment to remove the interest paid on the redeemable preference shares and previous bank loan in relation to the pre-IPO debt profile of the company.
• Proforma adjustments: an adjustment to recognise the impact of proforma earnings adjustments on cash flows and remove non-recurring fit out costs for leased premises.
The ‘Prospectus’ refers to the document lodged by the Company and Smartgroup SaleCo Limited on 16 June 2014.
Smartgroup Corporation Ltd | 29
Annual Report 2014
Director’s reportSmartgroup Corporation Ltd – 31 December 2014
The directors present their report, together with the financial statements, on the consolidated entity (referred to hereafter as the ‘Group’) consisting of Smartgroup Corporation Ltd (referred to hereafter as the ‘Company’ or ‘parent entity’) and the entities it controlled at the end of, or during, the year ended 31 December 2014.
Directors
The following persons were directors of Smartgroup Corporation Ltd during the whole of the financial year and up to the date of this report, unless otherwise stated.
Michael Carapiet appointed 18 February 2014
Deven Billimoria appointed 13 March 2014
John Prendiville appointed 18 February 2014
Gavin Bell appointed 18 February 2014
Andrew Bolam
Tarcisio Medalla resigned 18 February 2014
Lim Ghee Keong resigned 18 February 2014
Jeremy Paul Abson resigned 18 February 2014
Maureen Toh Siew Guat resigned 18 February 2014
Principal activities
During the financial year the principal activities of the Group consisted of salary packaging administration and fleet management services.
Dividends
On 25 February 2015 the directors declared a fully-franked dividend of 6.1 cents per ordinary share. The dividend will be paid on 31 March 2015 to shareholders registered on 13 March 2015, resulting in total distribution of $6,189,131. The financial effect of dividends declared after the reporting date are not reflected in the 31 December 2014 financial statements and will be recognised in subsequent financial reports.
Review of operations
The loss for the Group after providing for income tax amounted to $959,000 (31 December 2013: profit of $2,972,000). Refer to CEO’s Review of Operations for further commentary on the resultss.
Significant changes in the state of affairs
Smartgroup Corporation Ltd was admitted to the Official List of Australian Securities Exchange Limited (‘ASX’) on 2 July 2014 with the ASX code: SIQ.
Share capitalAs set out in the Prospectus, as part of the capital restructure and listing of the Company, $37.5 million additional share capital was raised in the Initial Public Offering (‘IPO’) and a further 23,461,150 ordinary shares were issued on 2 July 2014. The ‘Prospectus’ refers to the document lodged by the Company and Smartgroup SaleCo Limited on 16 June 2014.
Repayment of Mandatory redeemable preference shares (MRPS)As explained in the Prospectus, $20.7 million of funds raised in the IPO was used to repay MRPS including accrued interest.
Establish new debt facility and repayment of existing facilityAs explained in the Prospectus, the Group established a new debt facility, drawing down gross debt of $22.0 million and repaid its existing debt of $36.4 million during the year.
There were no other significant changes in the state of affairs of the Group during the financial year.
Matters subsequent to the end of the financial year
Apart from the dividend declared as discussed above, no other matter or circumstance has arisen since 31 December 2014 that has significantly affected, or may significantly affect the Group’s operations, the results of those operations, or the Group’s state of affairs in future financial years.
Likely developments and expected results of operations
Likely developments in the operations of the Group and the expected results of those operations are contained in the CEO’s Review of Operations.
Smartgroup Corporation Ltd | 30
Our Directors
Michael Carapiet | Chairman and Non-Executive Director
Date of appointment to the Board
18 February 2014
Qualifications
Michael holds a Master of Business Administration from Macquarie University.
Experience and expertise
Michael has more than 30 years’ experience in the financial sector. He retired from Macquarie Group in 2011, where he held a number of senior roles. Michael is the Chairperson of SAS Trustee Corporation (NSW State Super), the Chairperson of Safety, Return to Work and Support Board (which includes the WorkCover Authority of NSW, the Motor Accidents Authority and Lifetime Care and Support) and Chairperson of Adexum Capital Limited. Michael is also a Board member of Infrastructure Australia and the Clean Energy Finance Corporation. He is a member of the advisory board of Norton Rose Australia.
Other current directorships
Nil
Former directorships of listed companies (last 3 years)
Non-Executive director of Southern Cross Media Limited (ASX: SXL)
Special responsibilities
Member of Audit and Risk Committee and Member of Human Resources and Remuneration Committee
Interests in shares
1,225,377
Interests in options
None
Deven Billimoria | Chief Executive Officer and Managing Director
Date of appointment to the Board
13 March 2014
Qualifications
Deven holds a Master of Business Administration from Northwestern University’s Kellogg School of Management and a Bachelor of Science in Mechanical Engineering from the University of California, Los Angeles.
Experience and expertise
Deven has been with Smartgroup since 2000. He was appointed Managing Director and Chief Executive Officer (‘CEO’) of Smartsalary Pty Limited in 2001. In 2002 he was appointed CEO of Smartgroup, and in March 2014 he was appointed Managing Director. Deven began his career as an engineering consultant, before transitioning to management consulting with Booz Allen Hamilton.
Other current directorships
Nil
Former directorships (last 3 years)
Nil
Special responsibilities
Nil
Interests in shares
1,326,831
Interests in options
None
Annual Report 2014 |
Smartgroup Corporation Ltd | 31
Annual Report 2014 |
John Prendiville | Non-Executive Director
Date of appointment to the Board
18 February 2014
Qualifications
John holds a Bachelor of Science (Hons in Astrophysics) and Master of Business Administration from The University of Western Australia and the Institute for International Finance in Japan, respectively.
Experience and expertise
John was Chairman of Macquarie Capital (Australia) Limited, the investment banking unit of Macquarie Bank Ltd and, prior to that, was Global Industry Group Head within Macquarie Capital having been with Macquarie for 20 years from 1991 to 2011. John was recently a major shareholder and Non-Executive director at AVANA Group Pty Ltd. He is also Chairman elect of the privately owned Global Advanced Metals Limited, a business operating in the industrial minerals space.
Other current directorships
Nil
Former directorships (last 3 years)
Chairman of Kina Petroleum Limited (ASX: KPL)
Special responsibilities
Chairman of Audit and Risk Committee and Member of Human Resources and Remuneration Committee
Interests in shares
156,250
Interests in options
None
Gavin Bell | Non-Executive Director
Date of appointment to the Board
18 February 2014
Qualifications
Gavin holds a Bachelor of Laws from The University of Sydney and Master of Business Administration (Executive) from the Australian Graduate School of Management.
Experience and expertise
Gavin is a member of the Safety, Return to Work and Support Board and a director of Australian Indigenous Minority Supplier Council Limited. Gavin was Managing Partner and Chief Executive Officer of law firm Herbert Smith Freehills (formerly Freehills), a role he held since 2005. He retired from these roles on 30 April 2014.
Other current directorships
Nil
Former directorships (last 3 years)
Nil
Special responsibilities
Chairman of Human Resources and Remuneration Committee and Member of Audit and Risk Committee
Interests in shares
46,875
Interests in options
None
Andrew Bolam | Non-Executive Director
Date of appointment to the Board
6 January 2012
Qualifications
Andrew holds a Bachelor of Commerce from the University of Tasmania and is a Certified Practising Accountant.
Experience and expertise
Andrew has more than 20 years of experience in financial and general management. He was the Chief Financial Officer of Astro All Asia Networks plc (the then holding company of MEASAT Broadcast Network Systems Sdn Bhd which launched the Astro Pay-TV services) shortly following its launch in late 1996. Following this, he served as the Chief Financial Officer of Usaha Tegas, a private investment holding company based in Malaysia. He was later Commercial Director of Bumi Armada Berhad, an associate of Usaha Tegas group.
Other current directorships
Nil
Former directorships (last 3 years)
Nil
Special responsibilities
Member of Audit and Risk Committee and Member of Human Resources and Remuneration Committee
Interests in shares
31,250
Interests in options
None
Smartgroup Corporation Ltd | 32
Annual Report 2014 |
Ghee Keong Lim | Non-Executive Director
Date of appointment to the Board
14 June 2012
Date of resignation from the Board
18 February 2014
Qualifications
Ghee Keong has a Bachelor of Business Administration degree, majoring in Finance, from the University of Hawaii at Manoa, USA.
Experience and expertise
Ghee Keong has more than 20 years of experience in treasury and credit management. He is currently the Chief Operating Officer of UTSB and serves on the Boards of several other companies in which Usaha Tegas Sdn Bhd Group has interests, such as Maxis Berhad
(listed on Bursa Malaysia Securities Berhad), Tanjong Public Limited Company, Astro Malaysia Holdings Berhad (listed on Bursa Malaysia Securities Berhad) in which he is an alternate director and Bond Pricing Agency Malaysia Sdn Bhd, a bond pricing agency registered with the Securities Commission Malaysia. He is also a director of Paxys Inc. (listed on the Philippines Stock Exchange) and Yu Cai Foundation.
Special responsibilities
Nil
Interests in shares
None
Interests in options
None
Jeremy Paul Abson | Non-Executive Director
Date of appointment to the Board
6 January 2012
Date of resignation from the Board
18 February 2014
Qualifications
Jeremy holds a Bachelor of Science degree from Manchester University, UK and is a member of the Institute of Chartered Accountants in England and Wales.
Experience and expertise
Jeremy has more than 20 years of experience in financial and general management. Prior to joining the Usaha Tegas Sdn Bhd Group in 2005, he was the Chief Financial Officer of Samara Group Limited and a Partner of PricewaterhouseCoopers, Australia. He was the Chief
Operating Officer of Usaha Tegas Sdn Bhd Group which has significant interests in the telecommunications, media, marine logistics and real estate and other sectors including Maxis Berhad, Bumi Armada Berhad, both listed on the Bursa Malaysia Securities Berhad, Tanjong Capital Sdn Bhd Group and Astro Holdings Sdn Bhd Group until 2014.
Special responsibilities
Nil
Interests in shares
None
Interests in options
None
Tarcisio Medalla | Non-Executive Director
Date of appointment to the Board
14 June 2012
Date of resignation from the Board
18 February 2014
Qualifications
Tarcisio graduated from De La Salle University, Manila, Philippines with a Bachelor of Science, majoring in Accounting. He attended the Advanced Management Program (AMP) at Harvard Business School. He is a Certified Public Accountant.
Experience and expertise
Tarcisio has been a director for the last 3 years of the following companies listed with the Philippine Stock Exchange; Paxys, Inc., a holding company with investments in the Business Process Outsourcing
industry, and Pacific Online Systems Corp., a company engaged in the development, design and management of online computer systems for the Philippine gaming industry.
He is also currently the Chairman and President of Paxys, Inc. His expertise is in formulating corporate strategy and general business management. He also has significant work experience involving project development, financial planning, and fund management.
Special responsibilities
Nil
Interests in shares
None
Interests in options
None
Smartgroup Corporation Ltd | 33
Annual Report 2014 |
Maureen Toh Siew Guat | Non-Executive Director
Date of appointment to the Board
14 June 2012
Date of resignation from the Board
18 February 2014
Qualifications
Maureen holds a Bachelor of Law from University Malaya, Malaysia and a Master of Law from Harvard Law School, USA.
Experience and expertise
Maureen has more than 20 years of legal experience, primarily in corporate, commercial and banking matters and equity/capital markets, including experience with law firms in Kuala Lumpur and Singapore. Currently she is the Group General Counsel of Usaha Tegas Sdn Bhd, a Malaysian based investment holding company which has significant interests in companies operating across
diverse industries including the following companies which are listed on Bursa Malaysia Securities Berhad, Maxis Berhad, Bumi Armada Berhad and Astro Malaysia Holdings Berhad. She is also a director of Bumi Armada Berhad and MEASAT Satellite Systems Sdn Bhd, a regional satellite operator.
Special responsibilities
Nil
Interests in shares
None
Interests in options
None
‘Former directorships (last 3 years)’ quoted above are directorships held in the last 3 years for listed entities only and excludes directorships of all other types of entities, unless otherwise stated.
‘Other current directorships’ quoted above are current directorships for listed entities only and excludes directorships of all other types of entities, unless otherwise stated.
Company secretaries
Chief Financial Officer and Joint Company Secretary
Timothy Looi joined the Group in 2009 and is responsible for the finance and corporate development functions. Tim previously worked for Aristocrat Leisure Limited in various senior management roles and prior to that for PricewaterhouseCoopers in Sydney and London. Tim holds a Bachelor of Economics from the University of Sydney and is a member of the Institute of Chartered Accountants in Australia.
General Counsel and Joint Company Secretary
Amanda Morgan was appointed as General Counsel and Company Secretary on 26 June 2014. Amanda previously worked for IRESS Limited as General counsel and prior to that for King & Wood Mallesons as a Senior Associate. Prior to that she worked at Minter Ellison. Amanda holds a Bachelor of Laws and Bachelor of Commerce from the University of Melbourne and a Graduate Diploma of Applied Finance from the Securities Institute of Australia. She is enrolled in the Certificate of Governance Practice at the Governance Institute of Australia.
Meetings of directorsThe number of meetings of the Company’s Board of Directors (‘the Board’) and of each Board Committee held during the year ended 31 December 2014, and the number of meetings attended by each director were:
Full BoardHuman Resources and
Remuneration Committee Audit and Risk Committee
Attended Held Attended Held Attended Held
Michael Carapiet 17 17 2 2 3 3
Deven Billimoria 15 15 - - - -
John Prendiville 14 17 2 2 3 3
Gavin Bell 16 17 2 2 3 3
Andrew Bolam 18 18 2 2 3 3
Tarcisio Medalla 1 1 - - - -
Lim Ghee Keong 1 1 - - - -
Jeremy Paul Abson 1 1 - - - -
Maureen Toh Siew Guat 1 1 - - - -
Held: represents the number of meetings held during the time the director held office or was a member of the relevant committee.
Smartgroup Corporation Ltd | 34
Annual Report 2014 |
Remuneration Report (audited)
The Remuneration Report, which has been audited, describes the Key Management Personnel (‘KMP’) remuneration arrangement for the Group, in accordance with the requirements of the Corporations Act 2001 and its regulations.
Introduction
The Remuneration Report is designed to provide shareholders with an understanding of Smartgroup’s remuneration policies, and the link between the Group’s remuneration philosophy and strategy. The Remuneration Report specifically focuses on the Smartgroup remuneration arrangements for 2014.
The Company listed on the ASX on 2 July 2014. Accordingly, 2014 remuneration includes amounts paid both before and after listing and consequent upon the listing of the Company. Where appropriate, an explanation of the remuneration arrangements applying after the listing of the Company, excluding remuneration related to the initial public offering, has been included. The 2014 remuneration was consistent with the arrangements detailed in the Prospectus.
The Group’s remuneration policies and practices are designed to align the interests of staff and shareholders while attracting and retaining staff members who are critical to the organisation’s growth and success. The objective of the Group’s executive reward framework is to ensure reward for performance is competitive and appropriate for the results delivered. The framework aligns executive reward with the achievement of strategic objectives and the creation of value for shareholders, and conforms to market practice for delivery of reward.
The Remuneration Report is set out under the following main headings:
• Principles used to determine the nature and amount of remuneration,• Details of remuneration,• Service agreements,• Share-based compensation, and• Additional disclosures relating to KMP.
Principles used to determine the nature and amount of remuneration
The objective of the Group’s executive reward framework is to ensure reward for performance is competitive and appropriate for the results delivered. The Board of Directors (‘the Board’) ensures that executive reward satisfies the following key criteria for good reward governance practices:
• Competitiveness and reasonableness.• Acceptability to shareholders.• Performance linkage / alignment of executive compensation, and• Transparency.
The performance of the Group depends on the quality of its directors and executives. The remuneration philosophy is to attract, motivate and retain high performing and high quality personnel.
In 2014, the Company established the Human Resources and Remuneration Committee, whose role is to assist the Board in fulfilling its corporate governance responsibilities and to review and make recommendations in relation to the remuneration arrangements for its directors and executives. The Human Resources and Remuneration Committee must have at least three members, a majority of whom must be independent non-executive directors.
In consultation with Towers Watson Australia Pty Ltd as external remuneration consultant (refer to the section ‘Use of remuneration consultants’ below), the Human Resources and Remuneration Committee has structured an executive remuneration framework that is market-competitive and complementary to the reward strategy of the Group.
Alignment to shareholders’ interests:
The remuneration strategy:
• Focuses on sustained growth meeting earnings before interest, taxation and amortisation (‘EBITA’) and net profit after tax, adjusted to exclude the non-cash tax effected amortisation of intangibles (‘NPATA’) as set out in the Prospectus, as well as focusing the executive on key non-financial drivers of value, and
• Is intended to attract and retain high calibre executives.
Alignment to program participants’ interests:
The remuneration strategy:
• Rewards capability and experience,• Reflects competitive reward for contribution to growth in shareholder wealth, and• Provides a clear structure for earning rewards.
In accordance with best practice corporate governance, the structure of non-executive directors and executive remuneration is separate.
Smartgroup Corporation Ltd | 35
Annual Report 2014 |
Non-executive directors remuneration
Fees and payments to non-executive directors reflect the demands which are made on, and the responsibilities of, these directors. The Board decides the total amount paid to each non-executive director as remuneration for their services as a director. The total amount of fees paid to all directors for their services (excluding, for these purposes, the salary of any executive director) must not exceed in aggregate in any financial year the amount fixed by the Company in a general meeting.
Prior to the listing of the Company, its shareholder Smart Packages Pte Ltd set the aggregate remuneration at $1,000,000. The fees paid are $200,000 per annum for the chairman and $90,000 per annum for each non-executive director. In addition to the above, the chairpersons of the Audit and Risk Committee and Human Resources and Remuneration Committee respectively are paid $20,000 annually for the services provided to each of those committees. Each member of a standing committee (other than the chairperson) is paid $10,000 annually for the services provided to that committee. Each non-executive director was also paid an IPO fee of $40,000 in 2014 to reflect the additional services required to support the company in the IPO process.
In addition to the fees, in each case superannuation contribution and Goods and Services Tax, if any, are paid. There are no retirement benefit schemes for non-executive directors, other than statutory superannuation contributions.
Any change to that aggregate annual sum needs to be approved by shareholders. The aggregate sum includes any special and additional remuneration for special exertions and additional services performed by a director as determined appropriate by the Board. Directors may be paid additional or substituted remuneration if they, at the request of the Board, and for the purpose of the Company, perform any additional or special duties.
Executive remuneration
The Group aims to reward executives with a level and mix of remuneration based on their position and responsibility, which has both fixed and variable components.
The executive remuneration and reward framework has three components:
• Current base pay and non-monetary benefits,• Short-term performance incentives, and• Other statutory entitlements remuneration such as superannuation and long service leave.
The combination of these comprises the executive’s total remuneration, excluding remuneration related to the initial public offering.
Fixed remuneration
Fixed remuneration, consisting of base salary, superannuation and non-monetary benefits, is reviewed annually by the Human Resources and Remuneration Committee, based on individual and business unit performance, the overall performance of the Group and comparable market remuneration.
Executives may receive their fixed remuneration in the form of cash or other fringe benefits (for example motor vehicle benefits) where it does not create any additional costs to the Group and provides additional value to the executive.
Short Term Incentive Plan (‘STIP’)
The CEO and the KMP are eligible to participate in the STIP in a manner determined by the Board from time to time. Participants in the STIP have a target cash payment which is set every year as a percentage of their total fixed annual remuneration, currently subject to a maximum target of 60% for the CEO and 30% for each other executive management team (‘EMT’).
Payments under the STIP in any given year depend on the achievement of a range of financial and non-financial key performance indicators and objectives (‘KPIs’) as approved by the Board on an annual basis. The 2014 STIP provided for financial and non-financial KPIs weighted 60% and 40% respectively.
Long Term Incentive Plan (‘LTIP’)
The Group did not have a long term incentive plan in 2014. As contemplated by the Prospectus (section 6.3.3.2), in early 2015 the Board established a LTIP for the CEO and the EMT.
The LTIP is a loan funded share plan. Shares are purchased by the participant and funded by a loan provided by the Company. The shares are held by the participant until they vest or are forfeited and are eligible for dividends. Should the Company pay dividends or make capital distributions in the future, any dividends paid or distributions made to the participant will be applied to repay the loan and to meet the tax liability on those dividends or distributions.
The loan is for a period of 5 years from issue, is limited recourse and interest free. The loan is repayable in full on the earlier of the termination date of the loan or when the shares are sold. In the event that the vesting / performance conditions are not met and shares do not vest for any other reason, the shares will be acquired by the Company for the value of the outstanding loan.
The shares are forfeited in the event that the performance hurdles are not met or the participant ceases employment prior to vesting. Where there is a change of control event, the Board may at its discretion make a determination that some or all of a participant’s unvested shares may vest.
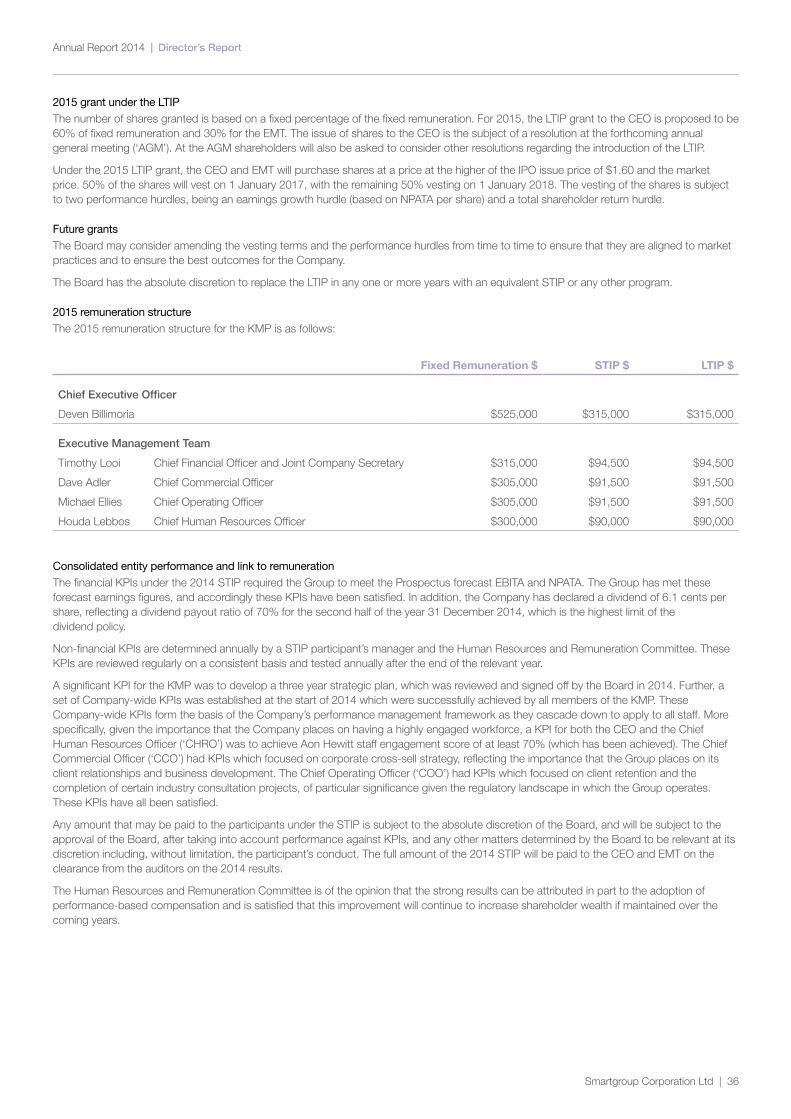
Smartgroup Corporation Ltd | 36
Annual Report 2014 |
2015 grant under the LTIP
The number of shares granted is based on a fixed percentage of the fixed remuneration. For 2015, the LTIP grant to the CEO is proposed to be 60% of fixed remuneration and 30% for the EMT. The issue of shares to the CEO is the subject of a resolution at the forthcoming annual general meeting (‘AGM’). At the AGM shareholders will also be asked to consider other resolutions regarding the introduction of the LTIP.
Under the 2015 LTIP grant, the CEO and EMT will purchase shares at a price at the higher of the IPO issue price of $1.60 and the market price. 50% of the shares will vest on 1 January 2017, with the remaining 50% vesting on 1 January 2018. The vesting of the shares is subject to two performance hurdles, being an earnings growth hurdle (based on NPATA per share) and a total shareholder return hurdle.
Future grants
The Board may consider amending the vesting terms and the performance hurdles from time to time to ensure that they are aligned to market practices and to ensure the best outcomes for the Company.
The Board has the absolute discretion to replace the LTIP in any one or more years with an equivalent STIP or any other program.
2015 remuneration structure
The 2015 remuneration structure for the KMP is as follows:
Fixed Remuneration $ STIP $ LTIP $
Chief Executive Officer
Deven Billimoria $525,000 $315,000 $315,000
Executive Management Team
Timothy Looi Chief Financial Officer and Joint Company Secretary $315,000 $94,500 $94,500
Dave Adler Chief Commercial Officer $305,000 $91,500 $91,500
Michael Ellies Chief Operating Officer $305,000 $91,500 $91,500
Houda Lebbos Chief Human Resources Officer $300,000 $90,000 $90,000
Consolidated entity performance and link to remuneration
The financial KPIs under the 2014 STIP required the Group to meet the Prospectus forecast EBITA and NPATA. The Group has met these forecast earnings figures, and accordingly these KPIs have been satisfied. In addition, the Company has declared a dividend of 6.1 cents per share, reflecting a dividend payout ratio of 70% for the second half of the year 31 December 2014, which is the highest limit of the dividend policy.
Non-financial KPIs are determined annually by a STIP participant’s manager and the Human Resources and Remuneration Committee. These KPIs are reviewed regularly on a consistent basis and tested annually after the end of the relevant year.
A significant KPI for the KMP was to develop a three year strategic plan, which was reviewed and signed off by the Board in 2014. Further, a set of Company-wide KPIs was established at the start of 2014 which were successfully achieved by all members of the KMP. These Company-wide KPIs form the basis of the Company’s performance management framework as they cascade down to apply to all staff. More specifically, given the importance that the Company places on having a highly engaged workforce, a KPI for both the CEO and the Chief Human Resources Officer (‘CHRO’) was to achieve Aon Hewitt staff engagement score of at least 70% (which has been achieved). The Chief Commercial Officer (‘CCO’) had KPIs which focused on corporate cross-sell strategy, reflecting the importance that the Group places on its client relationships and business development. The Chief Operating Officer (‘COO’) had KPIs which focused on client retention and the completion of certain industry consultation projects, of particular significance given the regulatory landscape in which the Group operates. These KPIs have all been satisfied.
Any amount that may be paid to the participants under the STIP is subject to the absolute discretion of the Board, and will be subject to the approval of the Board, after taking into account performance against KPIs, and any other matters determined by the Board to be relevant at its discretion including, without limitation, the participant’s conduct. The full amount of the 2014 STIP will be paid to the CEO and EMT on the clearance from the auditors on the 2014 results.
The Human Resources and Remuneration Committee is of the opinion that the strong results can be attributed in part to the adoption of performance-based compensation and is satisfied that this improvement will continue to increase shareholder wealth if maintained over the coming years.
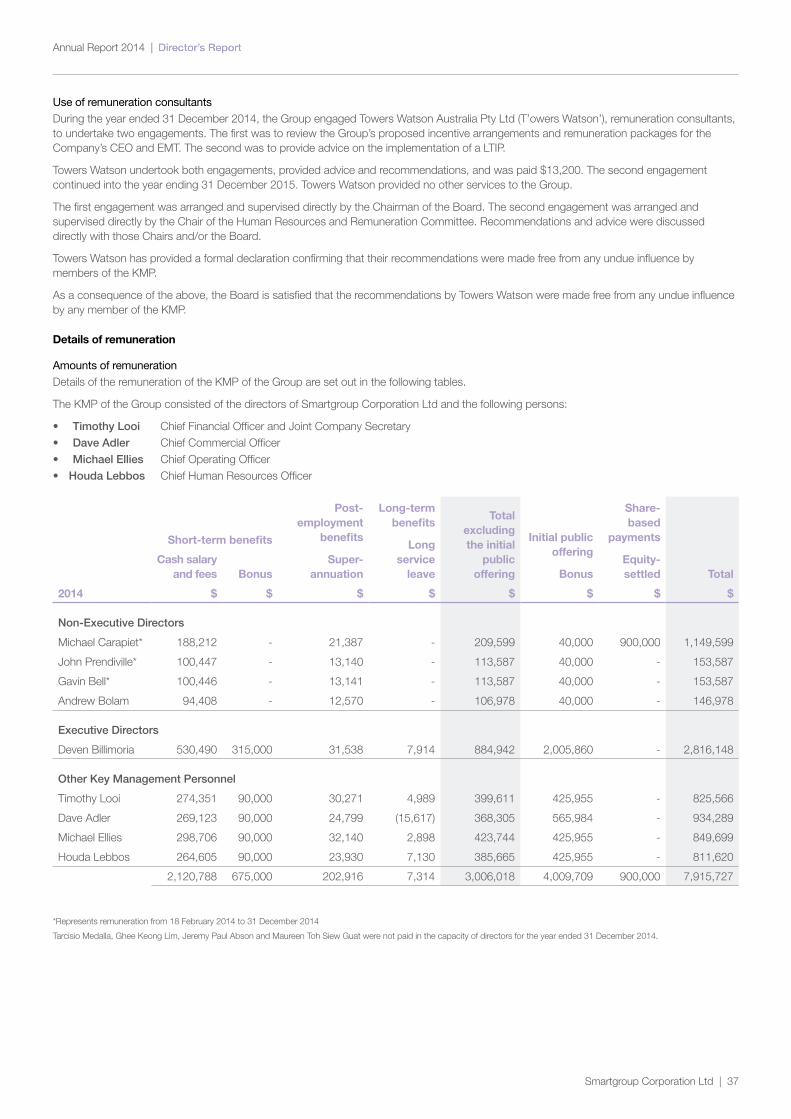
Smartgroup Corporation Ltd | 37
Annual Report 2014 |
Use of remuneration consultants
During the year ended 31 December 2014, the Group engaged Towers Watson Australia Pty Ltd (T’owers Watson’), remuneration consultants, to undertake two engagements. The first was to review the Group’s proposed incentive arrangements and remuneration packages for the Company’s CEO and EMT. The second was to provide advice on the implementation of a LTIP.
Towers Watson undertook both engagements, provided advice and recommendations, and was paid $13,200. The second engagement continued into the year ending 31 December 2015. Towers Watson provided no other services to the Group.
The first engagement was arranged and supervised directly by the Chairman of the Board. The second engagement was arranged and supervised directly by the Chair of the Human Resources and Remuneration Committee. Recommendations and advice were discussed directly with those Chairs and/or the Board.
Towers Watson has provided a formal declaration confirming that their recommendations were made free from any undue influence by members of the KMP.
As a consequence of the above, the Board is satisfied that the recommendations by Towers Watson were made free from any undue influence by any member of the KMP.
Details of remuneration
Amounts of remuneration
Details of the remuneration of the KMP of the Group are set out in the following tables.
The KMP of the Group consisted of the directors of Smartgroup Corporation Ltd and the following persons:
• Timothy Looi Chief Financial Officer and Joint Company Secretary• Dave Adler Chief Commercial Officer• Michael Ellies Chief Operating Officer• Houda Lebbos Chief Human Resources Officer
Post-employment
benefits
Super-annuation
Long-term benefits
Long service
leave
Total excluding the initial
public offering
Initial public offering
Bonus
Share-based
payments
Equity- settled Total
Short-term benefits
Cash salary and fees Bonus
2014 $ $ $ $ $ $ $ $
Non-Executive Directors
Michael Carapiet* 188,212 - 21,387 - 209,599 40,000 900,000 1,149,599
John Prendiville* 100,447 - 13,140 - 113,587 40,000 - 153,587
Gavin Bell* 100,446 - 13,141 - 113,587 40,000 - 153,587
Andrew Bolam 94,408 - 12,570 - 106,978 40,000 - 146,978
Executive Directors
Deven Billimoria 530,490 315,000 31,538 7,914 884,942 2,005,860 - 2,816,148
Other Key Management Personnel
Timothy Looi 274,351 90,000 30,271 4,989 399,611 425,955 - 825,566
Dave Adler 269,123 90,000 24,799 (15,617) 368,305 565,984 - 934,289
Michael Ellies 298,706 90,000 32,140 2,898 423,744 425,955 - 849,699
Houda Lebbos 264,605 90,000 23,930 7,130 385,665 425,955 - 811,620
2,120,788 675,000 202,916 7,314 3,006,018 4,009,709 900,000 7,915,727
*Represents remuneration from 18 February 2014 to 31 December 2014
Tarcisio Medalla, Ghee Keong Lim, Jeremy Paul Abson and Maureen Toh Siew Guat were not paid in the capacity of directors for the year ended 31 December 2014.
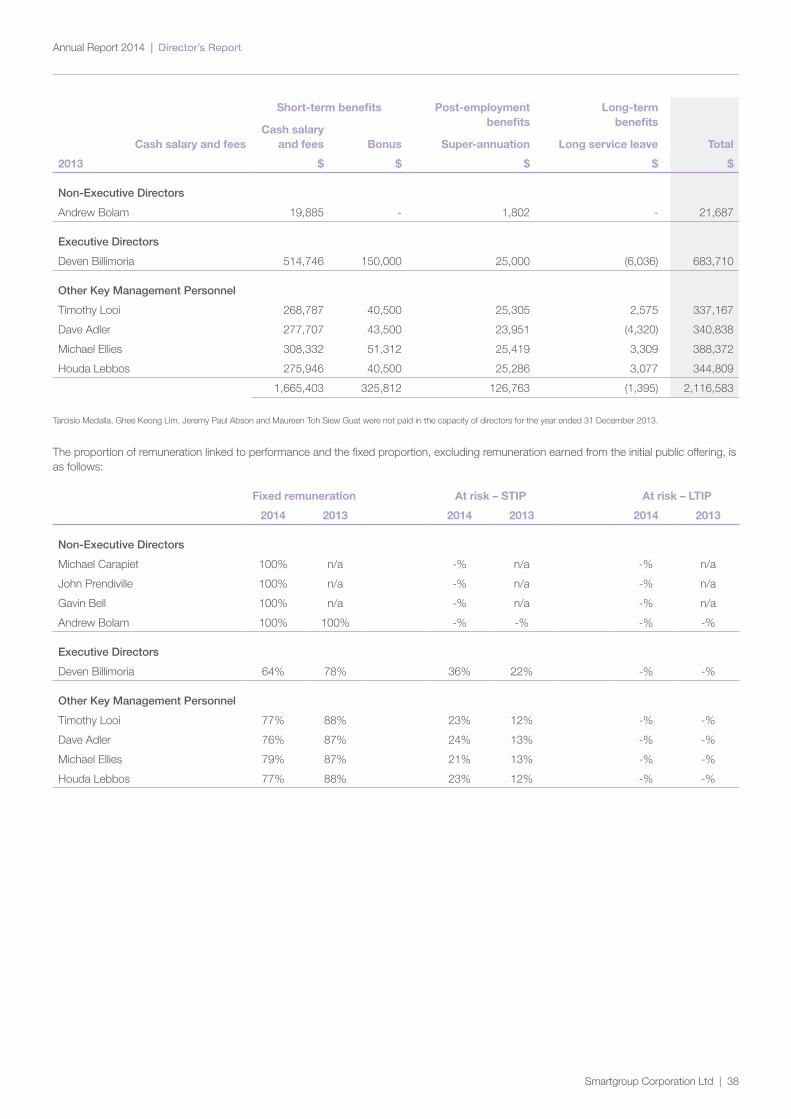
Smartgroup Corporation Ltd | 38
Annual Report 2014 |
Short-term benefits Post-employment benefits
Super-annuation
Long-term benefits
Long service leave TotalCash salary and feesCash salary
and fees Bonus
2013 $ $ $ $ $
Non-Executive Directors
Andrew Bolam 19,885 - 1,802 - 21,687
Executive Directors
Deven Billimoria 514,746 150,000 25,000 (6,036) 683,710
Other Key Management Personnel
Timothy Looi 268,787 40,500 25,305 2,575 337,167
Dave Adler 277,707 43,500 23,951 (4,320) 340,838
Michael Ellies 308,332 51,312 25,419 3,309 388,372
Houda Lebbos 275,946 40,500 25,286 3,077 344,809
1,665,403 325,812 126,763 (1,395) 2,116,583
Tarcisio Medalla, Ghee Keong Lim, Jeremy Paul Abson and Maureen Toh Siew Guat were not paid in the capacity of directors for the year ended 31 December 2013.
The proportion of remuneration linked to performance and the fixed proportion, excluding remuneration earned from the initial public offering, is as follows:
Fixed remuneration At risk – STIP At risk – LTIP
2014 2013 2014 2013 2014 2013
Non-Executive Directors
Michael Carapiet 100% n/a -% n/a -% n/a
John Prendiville 100% n/a -% n/a -% n/a
Gavin Bell 100% n/a -% n/a -% n/a
Andrew Bolam 100% 100% -% -% -% -%
Executive Directors
Deven Billimoria 64% 78% 36% 22% -% -%
Other Key Management Personnel
Timothy Looi 77% 88% 23% 12% -% -%
Dave Adler 76% 87% 24% 13% -% -%
Michael Ellies 79% 87% 21% 13% -% -%
Houda Lebbos 77% 88% 23% 12% -% -%
Smartgroup Corporation Ltd | 39
Annual Report 2014 |
Service agreements
Non-executive directorsNon-executive directors do not have fixed term contracts with the Company. On appointment to the Board, all non-executive directors enter into a service agreement with the Company in the form of a letter of appointment. The letter summarises the Board policies and terms, including compensation.
Remuneration and other terms of employment for the executive director are formalised in service agreements. Details of these agreements are as follows:
Deven Billimoria | Chief Executive Officer
Agreement commenced
1 June 2014
Term of agreement
Open ended
Details
Deven is entitled to:
• Receive fixed annual remuneration of $525,000 inclusive of superannuation contributions, and• Participate in the STIP with target participation under the STIP capped at a maximum of 60% of his fixed annual remuneration. Payments
under the STIP in any given year depend on the achievement of a range of financial and non-financial KPIs as approved by the Board on an annual basis.
The employment contract may be terminated by either party giving 12 months written notice or in the case of the Group by payment in lieu of notice. The Group may terminate the employment contract immediately and without payment for notice or payment in lieu of notice in the event of serious misconduct or other specified circumstances. There is no entitlement to termination payments in the event of termination. Non-compete provisions upon termination of employment exist for a period of 12 months from the date of termination of employment, as determined by the Board (in its sole discretion), depending on the circumstances of termination. The enforceability of the restraint clause is subject to all usual legal requirements.
Other key management personnel
Other EMT have employment agreements setting out the terms and conditions of their employment. The agreements are not of a fixed duration.
These agreements provide for:
• Total compensation inclusive of a base salary and superannuation contribution,• Eligibility to participate in the STIP, with target participation in the STIP capped at a maximum of 30% of total fixed annual remuneration,• Termination by either party giving three months written notice, or in the case of the Group, payment in lieu of notice,• Immediate termination by the Group without payment in lieu of notice in the event of serious misconduct or other specific circumstances,• Key management personnel have no entitlement to termination payments in the event of termination, and• Non-compete provisions upon termination of employment for a maximum of six months from the date of termination of employment, as
determined by the Board (in its sole discretion), depending on the circumstances of termination. The enforceability of the restraint clause is subject to all usual legal requirements.
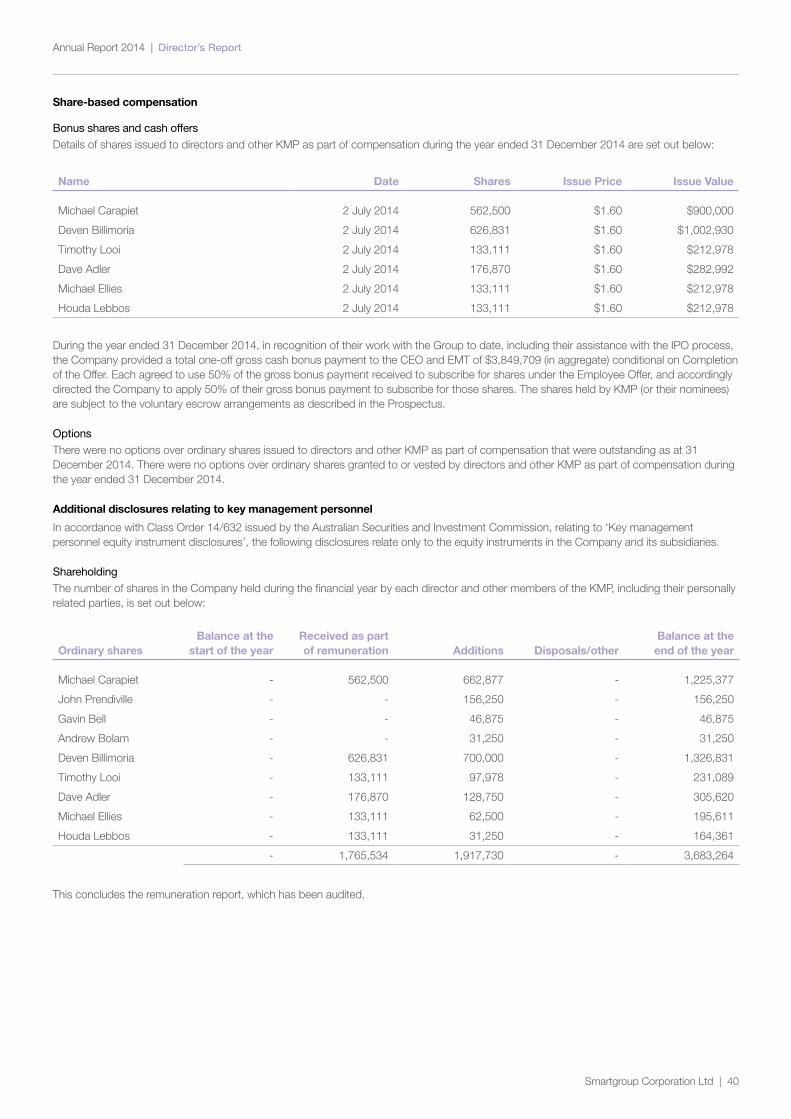
Smartgroup Corporation Ltd | 40
Annual Report 2014 |
Share-based compensation
Bonus shares and cash offers
Details of shares issued to directors and other KMP as part of compensation during the year ended 31 December 2014 are set out below:
Name Date Shares Issue Price Issue Value
Michael Carapiet 2 July 2014 562,500 $1.60 $900,000
Deven Billimoria 2 July 2014 626,831 $1.60 $1,002,930
Timothy Looi 2 July 2014 133,111 $1.60 $212,978
Dave Adler 2 July 2014 176,870 $1.60 $282,992
Michael Ellies 2 July 2014 133,111 $1.60 $212,978
Houda Lebbos 2 July 2014 133,111 $1.60 $212,978
During the year ended 31 December 2014, in recognition of their work with the Group to date, including their assistance with the IPO process, the Company provided a total one-off gross cash bonus payment to the CEO and EMT of $3,849,709 (in aggregate) conditional on Completion of the Offer. Each agreed to use 50% of the gross bonus payment received to subscribe for shares under the Employee Offer, and accordingly directed the Company to apply 50% of their gross bonus payment to subscribe for those shares. The shares held by KMP (or their nominees) are subject to the voluntary escrow arrangements as described in the Prospectus.
Options
There were no options over ordinary shares issued to directors and other KMP as part of compensation that were outstanding as at 31 December 2014. There were no options over ordinary shares granted to or vested by directors and other KMP as part of compensation during the year ended 31 December 2014.
Additional disclosures relating to key management personnel
In accordance with Class Order 14/632 issued by the Australian Securities and Investment Commission, relating to ‘Key management personnel equity instrument disclosures’, the following disclosures relate only to the equity instruments in the Company and its subsidiaries.
Shareholding
The number of shares in the Company held during the financial year by each director and other members of the KMP, including their personally related parties, is set out below:
Ordinary sharesBalance at the
start of the yearReceived as part of remuneration Additions Disposals/other
Balance at the end of the year
Michael Carapiet - 562,500 662,877 - 1,225,377
John Prendiville - - 156,250 - 156,250
Gavin Bell - - 46,875 - 46,875
Andrew Bolam - - 31,250 - 31,250
Deven Billimoria - 626,831 700,000 - 1,326,831
Timothy Looi - 133,111 97,978 - 231,089
Dave Adler - 176,870 128,750 - 305,620
Michael Ellies - 133,111 62,500 - 195,611
Houda Lebbos - 133,111 31,250 - 164,361
- 1,765,534 1,917,730 - 3,683,264
This concludes the remuneration report, which has been audited.
Smartgroup Corporation Ltd | 41
Annual Report 2014 |
Shares under option
There were no unissued ordinary shares of Smartgroup Corporation Ltd under option outstanding at the date of this report.
Shares issued on the exercise of options
There were no ordinary shares of Smartgroup Corporation Ltd issued on the exercise of options during the year ended 31 December 2014 and up to the date of this report.
Indemnity and insurance of officers
The Company has indemnified the directors and executives of the Company for costs incurred, in their capacity as a director or executive, for which they may be held personally liable, except where there is a lack of good faith. During the financial year, the Group paid a premium of $72,179 (2013: $9,992) in respect of a contract to insure the directors and executives of the Company against a liability to the extent permitted by the Corporations Act 2001.
Indemnity and insurance of auditor
The Company has not, during or since the end of the year, indemnified or agreed to indemnify the auditor of the Company or any related entity against a liability incurred by the auditor. During the year, the Company has not paid a premium in respect of a contract to insure the auditor of the Company or any related entity.
Proceedings on behalf of the Company
No person has applied to the Court under section 237 of the Corporations Act 2001 for leave to bring proceedings on behalf of the Company, or to intervene in any proceedings to which the Company is a party for the purpose of taking responsibility on behalf of the Company for all or part of those proceedings.
Non-audit services
Details of the amounts paid or payable to the auditor for non-audit services provided during the year by the auditor are outlined in note 33 to the financial statements.
The directors are satisfied that the provision of non-audit services during the year, by the auditor (or by another person or firm on the auditor’s behalf), is compatible with the general standard of independence for auditors imposed by the Corporations Act 2001.
The directors are of the opinion that the services as disclosed in note 33 to the financial statements do not compromise the external auditor’s independence requirements of the Corporations Act 2001 for the following reasons:
• all non-audit services have been reviewed and approved to ensure that they do not impact the integrity and objectivity of the auditor, and• none of the services undermine the general principles relating to auditor independence as set out in APES 110 Code of Ethics for
Professional Accountants issued by the Accounting Professional and Ethical Standards Board, including reviewing or auditing the auditor’s own work, acting in a management or decision-making capacity for the Company, acting as advocate for the Company or jointly sharing economic risks and rewards.
Officers of the Company who are former audit partners of PricewaterhouseCoopers
There are no officers of the Company who are former audit partners of PricewaterhouseCoopers.
Rounding of amounts
The Company is of a kind referred to in Class Order 98/100, issued by the Australian Securities and Investments Commission, relating to ‘rounding-off’. Amounts in this report have been rounded off in accordance with that Class Order to the nearest thousand dollars, or in certain cases, the nearest dollar.
Auditor’s independence declaration
A copy of the auditor’s independence declaration as required under section 307C of the Corporations Act 2001 is set out on the following page.
Auditor
PricewaterhouseCoopers continues in office in accordance with section 327 of the Corporations Act 2001.
This report is made in accordance with a resolution of directors, pursuant to section 298(2)(a) of the Corporations Act 2001. On behalf of the directors
Michael Carapiet Chairman
25 February 2015, Sydney
Smartgroup Corporation Ltd | 42
Annual Report 2014 |
PricewaterhouseCoopers, ABN 52 780 433 757 Darling Park Tower 2, 201 Sussex Street, GPO BOX 2650, SYDNEY NSW 1171 T: +61 2 8266 0000, F: +61 2 8266 9999, www.pwc.com.au Liability limited by a scheme approved under Professional Standards Legislation.
Auditor’s Independence Declaration
As lead auditor for the audit of Smartgroup Corporation Ltd for the year ended 31 December 2014, I declare that to the best of my knowledge and belief, there have been:
a) no contraventions of the auditor independence requirements of the Corporations Act 2001 in relation to the audit; and
b) no contraventions of any applicable code of professional conduct in relation to the audit.
This declaration is in respect of Smartgroup Corporation Ltd and the entities it controlled during the period.
Scott Walsh Sydney Partner PricewaterhouseCoopers
25 February 2015
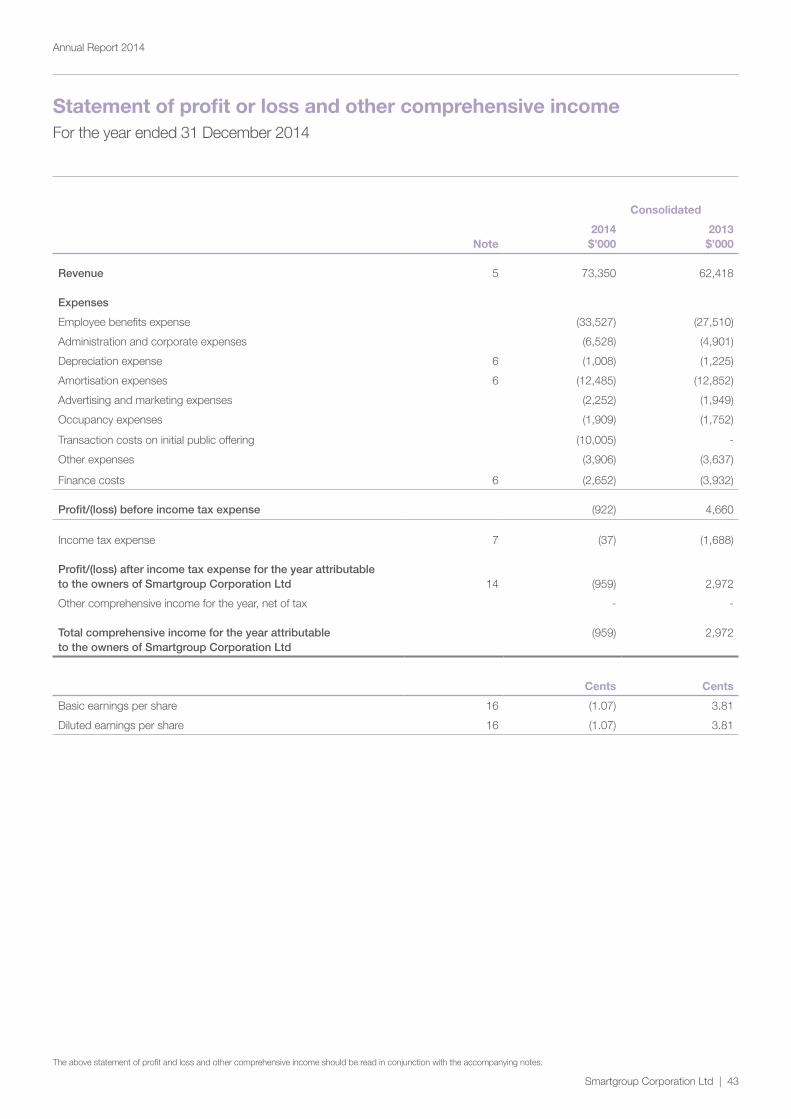
Smartgroup Corporation Ltd | 43
Annual Report 2014
Statement of profit or loss and other comprehensive incomeFor the year ended 31 December 2014
Consolidated
Note2014 $’000
2013 $’000
Revenue 5 73,350 62,418
Expenses
Employee benefits expense (33,527) (27,510)
Administration and corporate expenses (6,528) (4,901)
Depreciation expense 6 (1,008) (1,225)
Amortisation expenses 6 (12,485) (12,852)
Advertising and marketing expenses (2,252) (1,949)
Occupancy expenses (1,909) (1,752)
Transaction costs on initial public offering (10,005) -
Other expenses (3,906) (3,637)
Finance costs 6 (2,652) (3,932)
Profit/(loss) before income tax expense (922) 4,660
Income tax expense 7 (37) (1,688)
Profit/(loss) after income tax expense for the year attributable to the owners of Smartgroup Corporation Ltd 14 (959) 2,972
Other comprehensive income for the year, net of tax - -
Total comprehensive income for the year attributable to the owners of Smartgroup Corporation Ltd
(959) 2,972
Cents Cents
Basic earnings per share 16 (1.07) 3.81
Diluted earnings per share 16 (1.07) 3.81
The above statement of profit and loss and other comprehensive income should be read in conjunction with the accompanying notes.
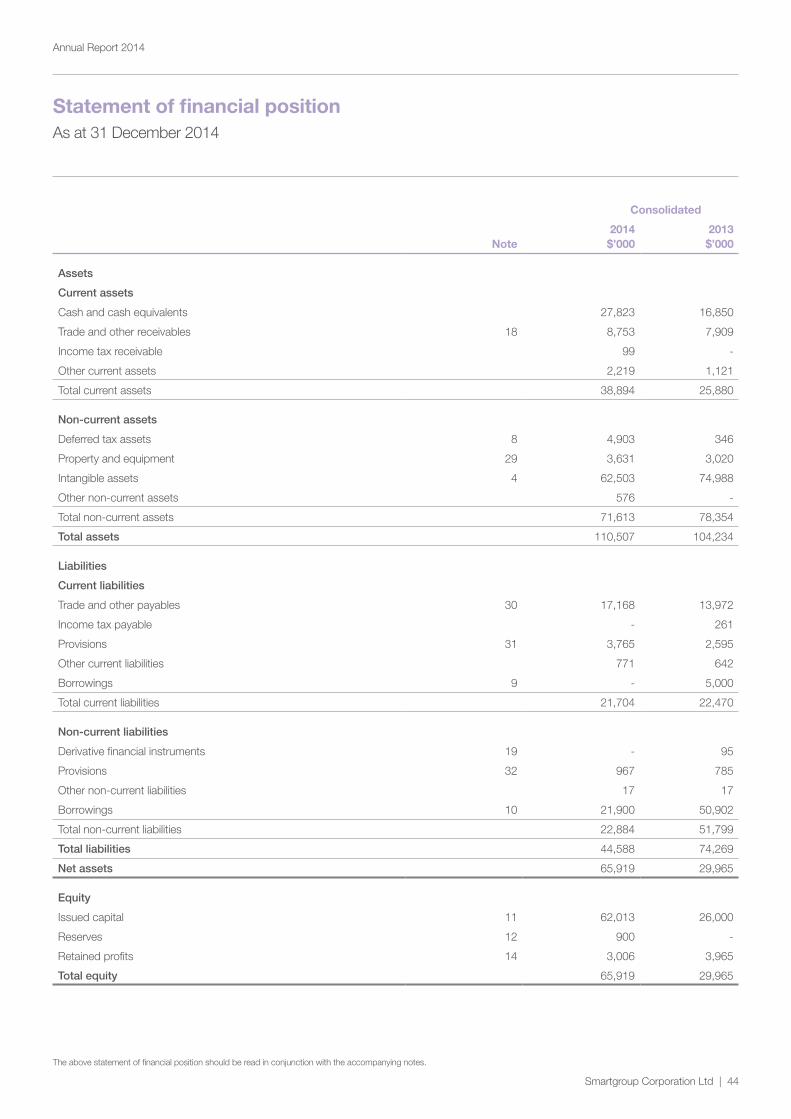
Smartgroup Corporation Ltd | 44
Annual Report 2014
Statement of financial position As at 31 December 2014
Consolidated
Note2014 $’000
2013 $’000
Assets
Current assets
Cash and cash equivalents 27,823 16,850
Trade and other receivables 18 8,753 7,909
Income tax receivable 99 -
Other current assets 2,219 1,121
Total current assets 38,894 25,880
Non-current assets
Deferred tax assets 8 4,903 346
Property and equipment 29 3,631 3,020
Intangible assets 4 62,503 74,988
Other non-current assets 576 -
Total non-current assets 71,613 78,354
Total assets 110,507 104,234
Liabilities
Current liabilities
Trade and other payables 30 17,168 13,972
Income tax payable - 261
Provisions 31 3,765 2,595
Other current liabilities 771 642
Borrowings 9 - 5,000
Total current liabilities 21,704 22,470
Non-current liabilities
Derivative financial instruments 19 - 95
Provisions 32 967 785
Other non-current liabilities 17 17
Borrowings 10 21,900 50,902
Total non-current liabilities 22,884 51,799
Total liabilities 44,588 74,269
Net assets 65,919 29,965
Equity
Issued capital 11 62,013 26,000
Reserves 12 900 -
Retained profits 14 3,006 3,965
Total equity 65,919 29,965
The above statement of financial position should be read in conjunction with the accompanying notes.
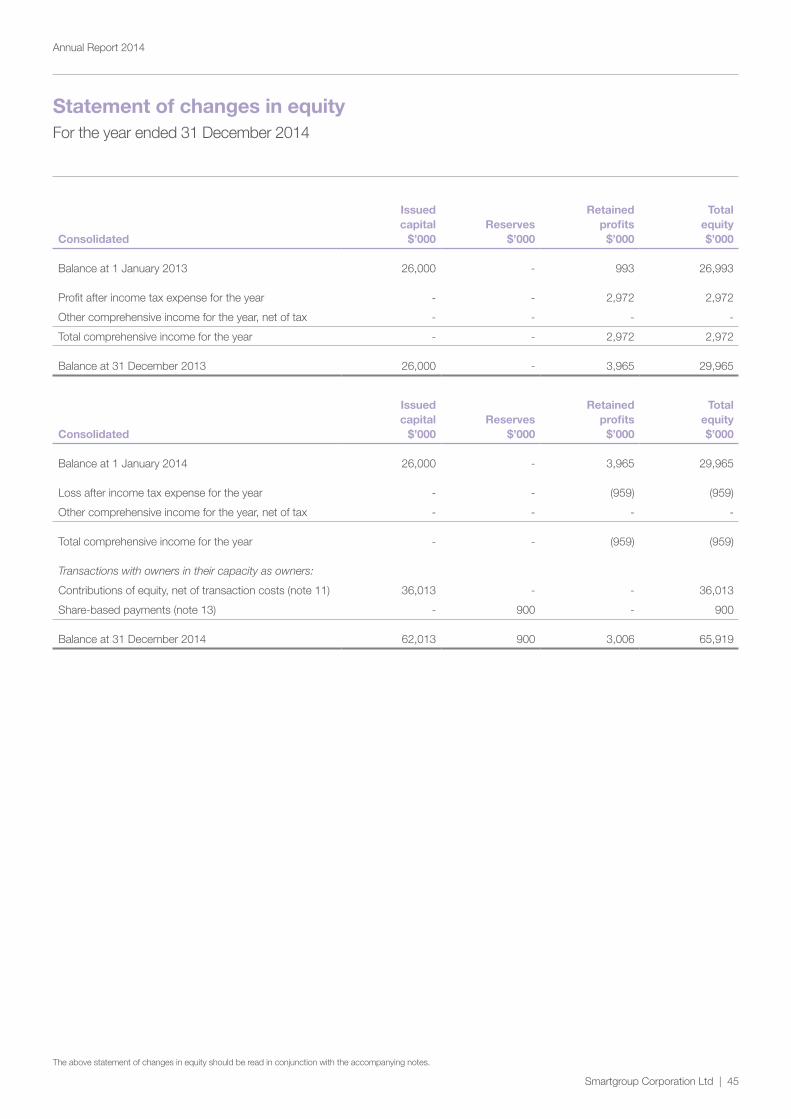
Smartgroup Corporation Ltd | 45
Annual Report 2014
Statement of changes in equity For the year ended 31 December 2014
Consolidated
Issued capital
$’000Reserves
$’000
Retained profits
$’000
Total equity $’000
Balance at 1 January 2013 26,000 - 993 26,993
Profit after income tax expense for the year - - 2,972 2,972
Other comprehensive income for the year, net of tax - - - -
Total comprehensive income for the year - - 2,972 2,972
Balance at 31 December 2013 26,000 - 3,965 29,965
Consolidated
Issued capital
$’000Reserves
$’000
Retained profits
$’000
Total equity $’000
Balance at 1 January 2014 26,000 - 3,965 29,965
Loss after income tax expense for the year - - (959) (959)
Other comprehensive income for the year, net of tax - - - -
Total comprehensive income for the year - - (959) (959)
Transactions with owners in their capacity as owners:
Contributions of equity, net of transaction costs (note 11) 36,013 - - 36,013
Share-based payments (note 13) - 900 - 900
Balance at 31 December 2014 62,013 900 3,006 65,919
The above statement of changes in equity should be read in conjunction with the accompanying notes.
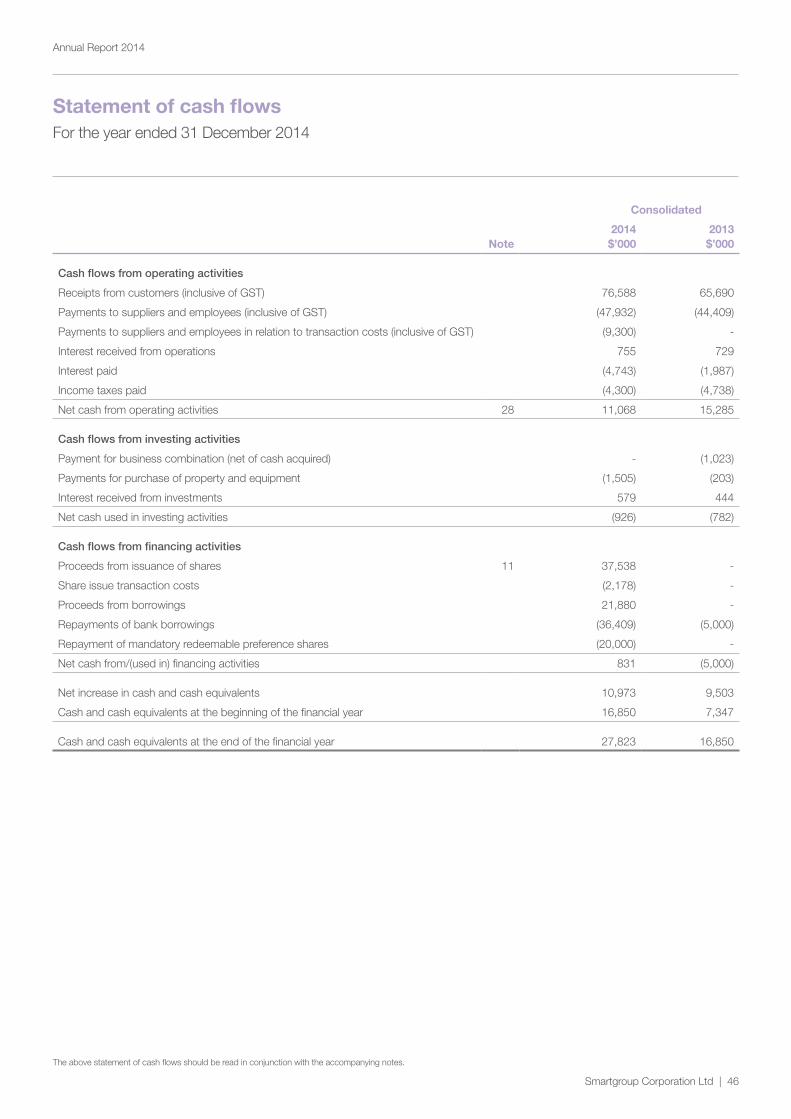
Smartgroup Corporation Ltd | 46
Annual Report 2014
Statement of cash flowsFor the year ended 31 December 2014
Consolidated
Note2014 $’000
2013 $’000
Cash flows from operating activities
Receipts from customers (inclusive of GST) 76,588 65,690
Payments to suppliers and employees (inclusive of GST) (47,932) (44,409)
Payments to suppliers and employees in relation to transaction costs (inclusive of GST) (9,300) -
Interest received from operations 755 729
Interest paid (4,743) (1,987)
Income taxes paid (4,300) (4,738)
Net cash from operating activities 28 11,068 15,285
Cash flows from investing activities
Payment for business combination (net of cash acquired) - (1,023)
Payments for purchase of property and equipment (1,505) (203)
Interest received from investments 579 444
Net cash used in investing activities (926) (782)
Cash flows from financing activities
Proceeds from issuance of shares 11 37,538 -
Share issue transaction costs (2,178) -
Proceeds from borrowings 21,880 -
Repayments of bank borrowings (36,409) (5,000)
Repayment of mandatory redeemable preference shares (20,000) -
Net cash from/(used in) financing activities 831 (5,000)
Net increase in cash and cash equivalents 10,973 9,503
Cash and cash equivalents at the beginning of the financial year 16,850 7,347
Cash and cash equivalents at the end of the financial year 27,823 16,850
The above statement of cash flows should be read in conjunction with the accompanying notes.
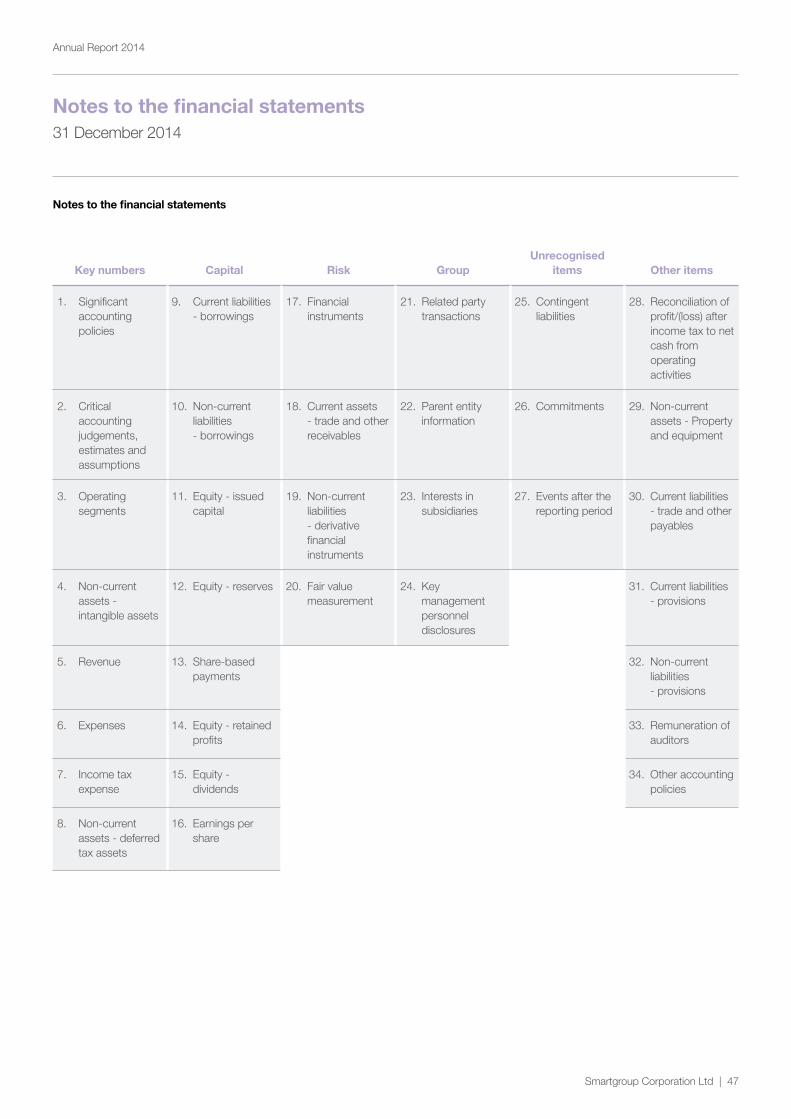
Smartgroup Corporation Ltd | 47
Annual Report 2014
Notes to the financial statements31 December 2014
Notes to the financial statements
Key numbers Capital Risk GroupUnrecognised
items Other items
1. Significant accounting policies
9. Current liabilities - borrowings
17. Financial instruments
21. Related party transactions
25. Contingent liabilities
28. Reconciliation of profit/(loss) after income tax to net cash from operating activities
2. Critical accounting judgements, estimates and assumptions
10. Non-current liabilities - borrowings
18. Current assets - trade and other receivables
22. Parent entity information
26. Commitments 29. Non-current assets - Property and equipment
3. Operating segments
11. Equity - issued capital
19. Non-current liabilities - derivative financial instruments
23. Interests in subsidiaries
27. Events after the reporting period
30. Current liabilities - trade and other payables
4. Non-current assets - intangible assets
12. Equity - reserves 20. Fair value measurement
24. Key management personnel disclosures
31. Current liabilities - provisions
5. Revenue 13. Share-based payments
32. Non-current liabilities - provisions
6. Expenses 14. Equity - retained profits
33. Remuneration of auditors
7. Income tax expense
15. Equity - dividends
34. Other accounting policies
8. Non-current assets - deferred tax assets
16. Earnings per share
Notes to the financial statementsAnnual Report 2014 |
Smartgroup Corporation Ltd | 48
Note 1. Significant accounting policies
The principal accounting policies adopted in the preparation of the financial statements are set out below. These policies have been consistently applied to all the years presented, unless otherwise stated.
New, revised or amending Accounting Standards and Interpretations adopted
The Group has adopted all of the new, revised or amending Accounting Standards and Interpretations issued by the Australian Accounting Standards Board (‘AASB’) that are mandatory for the current reporting period. The adoption of these Accounting Standards and Interpretations did not have any significant impact on the financial performance or position of the Group for the year ending 31 December 2014.
Any new, revised or amending Accounting Standards or Interpretations that are not yet mandatory have not been early adopted.
Basis of preparation
These general purpose financial statements have been prepared in accordance with Australian Accounting Standards and Interpretations issued by the Australian Accounting Standards Board (‘AASB’) and the Corporations Act 2001, as appropriate for for-profit oriented entities. These financial statements also comply with International Financial Reporting Standards as issued by the International Accounting Standards Board (‘IASB’).
Smartgroup Corporation Ltd was admitted to the ASX official list effective 2 July 2014 following the issue of 23,461,150 ordinary shares at $1.60 each pursuant to a Prospectus and Initial Public Offer (‘IPO’) document dated 16 June 2014. The IPO was undertaken using the existing group structure and no corporate reorganisation took place. As such, the financial report is a continuation of the existing Group and no fair value adjustments were required to be reflected in these financial statements. In the event that the transactions contemplated by the Initial Public Offering had been required to be recorded at fair value, the net assets of the Group would be equal to the initial market capitalisation of $162 million.
Historical cost conventionThe financial statements have been prepared under the historical cost convention, except for, where applicable, the revaluation of financial assets and liabilities (including derivative instruments) at fair value through profit or loss.
Critical accounting estimatesThe preparation of the financial statements requires the use of certain critical accounting estimates. It also requires management to exercise its judgement in the process of applying the Group’s accounting policies. The areas involving a higher degree of judgement or complexity, or areas where assumptions and estimates are significant to the financial statements, are disclosed in note 2.
Parent entity information
In accordance with the Corporations Act 2001, these financial statements present the results of the Group only. Supplementary information about the parent entity is disclosed in note 22.
Rounding of amounts
The Company is of a kind referred to in Class Order 98/100, issued by the Australian Securities and Investments Commission, relating to ‘rounding-off’. Amounts in this report have been rounded off in accordance with that Class Order to the nearest thousand dollars, or in certain cases, the nearest dollar.
Note 2. Critical accounting judgements, estimates and assumptions
The preparation of the financial statements requires management to make judgements, estimates and assumptions that affect the reported amounts in the financial statements. Management continually evaluates its judgements and estimates in relation to assets, liabilities, contingent liabilities, revenue and expenses. Management bases its judgements, estimates and assumptions on historical experience and on other various factors, including expectations of future events, management believes to be reasonable under the circumstances. The resulting accounting judgements and estimates will seldom equal the related actual results. The judgements, estimates and assumptions that have a significant risk of causing a material adjustment to the carrying amounts of assets and liabilities (refer to the respective notes) within the next year are discussed below.
Estimation of useful lives of assetsThe Group determines the estimated useful lives and related depreciation and amortisation charges for its property and equipment and finite life intangible assets. The depreciation and amortisation charge will increase where the useful lives are less than previously estimated lives.
Goodwill and other indefinite life intangible assetsThe Group tests annually, or more frequently if events or changes in circumstances indicate impairment, whether goodwill and other indefinite life intangible assets have suffered any impairment, in accordance with the accounting policy stated in note 4 and note 34. The recoverable amounts of cash-generating units have been determined based on value-in-use calculations. These calculations require the use of assumptions, including estimated discount rates based on the current cost of capital and growth rates of the estimated future cash flows.
Notes to the financial statementsAnnual Report 2014 |
Smartgroup Corporation Ltd | 49
Note 2. Critical accounting judgements, estimates and assumptions (continued)
Income taxThe Group is subject to income taxes in the jurisdictions in which it operates. Significant judgement is required in determining the provision for income tax. There are many transactions and calculations undertaken during the ordinary course of business for which the ultimate tax determination is uncertain. The Group recognises liabilities for anticipated tax audit issues based on the Group’s current understanding of the tax law. Where the final tax outcome of these matters is different from the carrying amounts, such differences will impact the current and deferred tax provisions in the period in which such determination is made.
Recovery of deferred tax assetsDeferred tax assets are recognised for deductible temporary differences only if the Group considers it is probable that future taxable amounts will be available to utilise those temporary differences and losses.
Employee benefits provisionThe liability for employee benefits expected to be settled more than 12 months from the reporting date are recognised and measured at the present value of the estimated future cash flows to be made in respect of all employees at the reporting date. In determining the present value of the liability, estimates of attrition rates and pay increases through promotion and inflation have been taken into account.
Operations provisionThe Group exercises judgement in measuring and recognising provisions relating to customer and supplier disputes. Judgement is necessary in assessing the likelihood that a claim will arise, and to quantify the possible range of financial settlement. Because of the inherent uncertainty in this evaluation process, actual losses may be different from the originally estimated provision.
Note 3. Operating segments
Identification of reportable operating segmentsThe Group is organised into two operating segments: salary packaging and fleet management. These operating segments are based on the internal reports that are reviewed and used by the Chief Executive Officer and Chief Financial Officer (who are identified as the Chief Operating Decision Makers (‘CODM’)) in assessing performance and in determining the allocation of resources. There is no aggregation of operating segments.
The CODM reviews earnings before interest, tax and amortisation (‘EBITA’). The accounting policies adopted for internal reporting to the CODM are consistent with those adopted in the financial statements. The information reported to the CODM is on at least a monthly basis.
Types of products and servicesThe principal products and services of each of these operating segments are as follows:
Salary packaging This part of the business provides outsourced salary packaging services, novated leasing financing and management, salary packaging software solutions, and the marketing of salary packaging debit cards.
Fleet management This part of the business provides end-to-end fleet management services and distribution of vehicle insurances.
Intersegment transactionsIntersegment transactions were made at market rates. Intersegment transactions are eliminated on consolidation.
Intersegment receivables, payables and loansIntersegment loans are initially recognised at the consideration received. Intersegment loans receivable and loans payable that earn or incur non-market interest are not adjusted to fair value based on market interest rates. Intersegment loans are eliminated on consolidation.
Major customersRevenue from two customers amounted to $19,535,000 (2013: $18,660,000) arising from salary packaging and fleet management services.
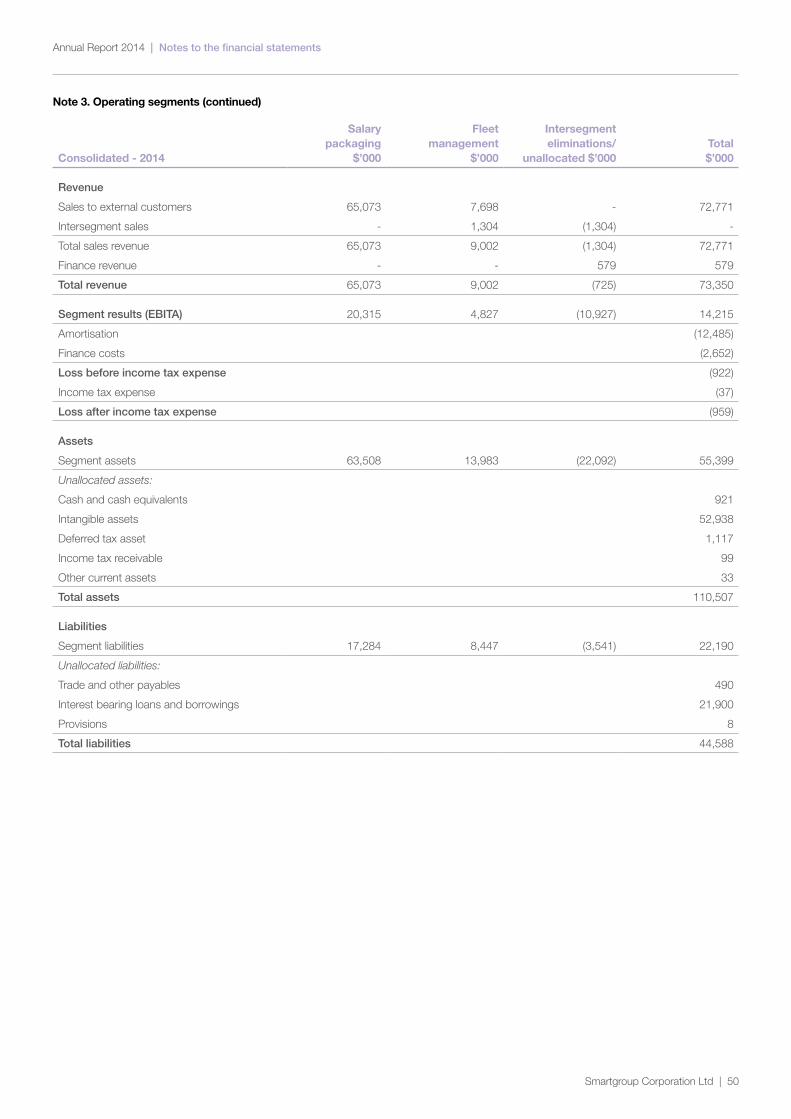
Notes to the financial statementsAnnual Report 2014 |
Smartgroup Corporation Ltd | 50
Note 3. Operating segments (continued)
Consolidated - 2014
Salary packaging
$’000
Fleet management
$’000
Intersegment eliminations/
unallocated $’000Total $’000
Revenue
Sales to external customers 65,073 7,698 - 72,771
Intersegment sales - 1,304 (1,304) -
Total sales revenue 65,073 9,002 (1,304) 72,771
Finance revenue - - 579 579
Total revenue 65,073 9,002 (725) 73,350
Segment results (EBITA) 20,315 4,827 (10,927) 14,215
Amortisation (12,485)
Finance costs (2,652)
Loss before income tax expense (922)
Income tax expense (37)
Loss after income tax expense (959)
Assets
Segment assets 63,508 13,983 (22,092) 55,399
Unallocated assets:
Cash and cash equivalents 921
Intangible assets 52,938
Deferred tax asset 1,117
Income tax receivable 99
Other current assets 33
Total assets 110,507
Liabilities
Segment liabilities 17,284 8,447 (3,541) 22,190
Unallocated liabilities:
Trade and other payables 490
Interest bearing loans and borrowings 21,900
Provisions 8
Total liabilities 44,588
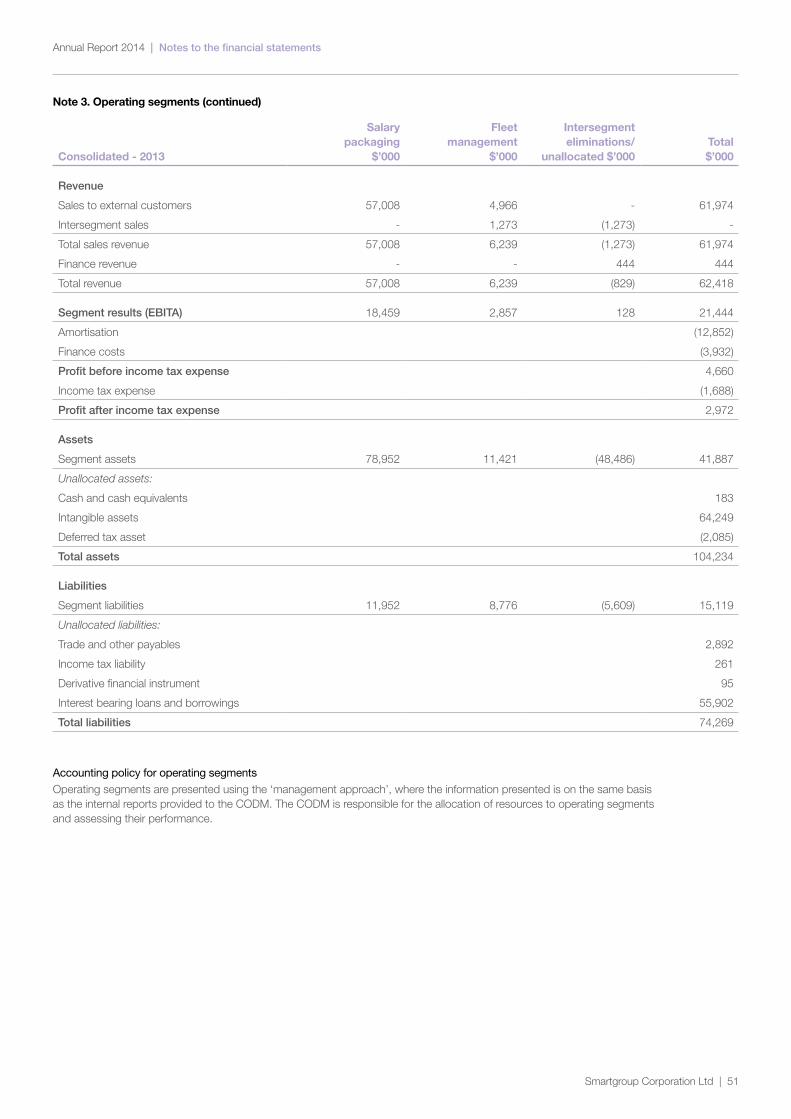
Notes to the financial statementsAnnual Report 2014 |
Smartgroup Corporation Ltd | 51
Note 3. Operating segments (continued)
Consolidated - 2013
Salary packaging
$’000
Fleet management
$’000
Intersegment eliminations/
unallocated $’000Total $’000
Revenue
Sales to external customers 57,008 4,966 - 61,974
Intersegment sales - 1,273 (1,273) -
Total sales revenue 57,008 6,239 (1,273) 61,974
Finance revenue - - 444 444
Total revenue 57,008 6,239 (829) 62,418
Segment results (EBITA) 18,459 2,857 128 21,444
Amortisation (12,852)
Finance costs (3,932)
Profit before income tax expense 4,660
Income tax expense (1,688)
Profit after income tax expense 2,972
Assets
Segment assets 78,952 11,421 (48,486) 41,887
Unallocated assets:
Cash and cash equivalents 183
Intangible assets 64,249
Deferred tax asset (2,085)
Total assets 104,234
Liabilities
Segment liabilities 11,952 8,776 (5,609) 15,119
Unallocated liabilities:
Trade and other payables 2,892
Income tax liability 261
Derivative financial instrument 95
Interest bearing loans and borrowings 55,902
Total liabilities 74,269
Accounting policy for operating segments
Operating segments are presented using the ‘management approach’, where the information presented is on the same basis as the internal reports provided to the CODM. The CODM is responsible for the allocation of resources to operating segments and assessing their performance.
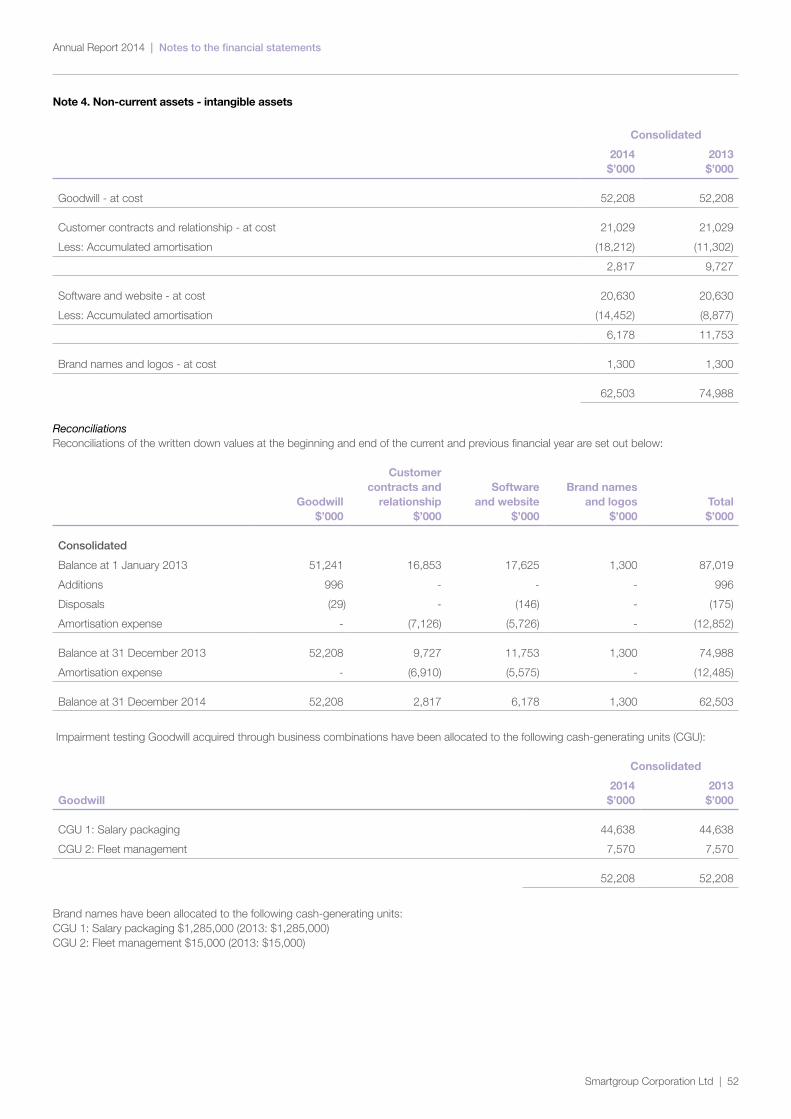
Notes to the financial statementsAnnual Report 2014 |
Smartgroup Corporation Ltd | 52
Note 4. Non-current assets - intangible assets
Consolidated
2014 $’000
2013 $’000
Goodwill - at cost 52,208 52,208
Customer contracts and relationship - at cost 21,029 21,029
Less: Accumulated amortisation (18,212) (11,302)
2,817 9,727
Software and website - at cost 20,630 20,630
Less: Accumulated amortisation (14,452) (8,877)
6,178 11,753
Brand names and logos - at cost 1,300 1,300
62,503 74,988
ReconciliationsReconciliations of the written down values at the beginning and end of the current and previous financial year are set out below:
Goodwill $’000
Customer contracts and
relationship $’000
Software and website
$’000
Brand names and logos
$’000Total $’000
Consolidated
Balance at 1 January 2013 51,241 16,853 17,625 1,300 87,019
Additions 996 - - - 996
Disposals (29) - (146) - (175)
Amortisation expense - (7,126) (5,726) - (12,852)
Balance at 31 December 2013 52,208 9,727 11,753 1,300 74,988
Amortisation expense - (6,910) (5,575) - (12,485)
Balance at 31 December 2014 52,208 2,817 6,178 1,300 62,503
Impairment testing Goodwill acquired through business combinations have been allocated to the following cash-generating units (CGU):
Consolidated
Goodwill2014 $’000
2013 $’000
CGU 1: Salary packaging 44,638 44,638
CGU 2: Fleet management 7,570 7,570
52,208 52,208
Brand names have been allocated to the following cash-generating units: CGU 1: Salary packaging $1,285,000 (2013: $1,285,000) CGU 2: Fleet management $15,000 (2013: $15,000)
Notes to the financial statementsAnnual Report 2014 |
Smartgroup Corporation Ltd | 53
Note 4. Non-current assets - intangible assets (continued)
The recoverable amount of a cash generating unit (‘CGU’) is determined based on value-in-use calculations which require the use of assumptions. The calculations use cash flow projections based on financial budgets approved by management covering a five-year period. Cash flows beyond the five-year period are extrapolated using the estimated growth rates stated below. These growth rates do not exceed the long-term average growth rates for the industry in which each CGU operates.
The following key assumptions were used in the discounted cash flow model for different CGUs:
Growth rate: CGU 1: Salary packaging 2.5% (2013: 2.5%) CGU 2: Fleet management 2.5% (2013: 2.5%)
Discount rate: CGU 1: Salary packaging 19.48% (2013: 19.22%) CGU 2: Fleet management 19.48% (2013: 19.40%)
In performing the value-in-use calculations for each CGU, the Group has applied post-tax discount rates to discount the estimated future post-tax cash flows. The equivalent pre-tax discount rates are disclosed above. The recoverable amount of net assets of each CGU is greater than the carrying value of the assets and therefore, the intangible assets are not considered to be impaired.
Sensitivity analysis For CGU 1 Salary packaging: any change in the key assumptions on which the recoverable amount is based would not cause the CGU’s carrying amount to exceed its recoverable amount. This assessment is on the assumption that there will be no significant changes to legislation for the novated leasing concession in the forecast period. Should the relevant legislation change, depending on the impact of the changes, there may be a different impairment testing conclusion.
For CGU 2 Fleet management: any change in the key assumptions on which the recoverable amount is based would not cause the CGU’s carrying amount to exceed its recoverable amount.
Accounting for intangible assets
Intangible assets acquired as part of a business combination, other than goodwill, are initially measured at their fair value at the date of the acquisition. Intangible assets acquired separately are initially recognised at cost. Indefinite life intangible assets are not amortised and are subsequently measured at cost less any impairment. Finite life intangible assets are subsequently measured at cost less amortisation and any impairment. The gains or losses recognised in profit or loss arising from the derecognition of intangible assets are measured as the difference between net disposal proceeds and the carrying amount of the intangible asset. The method and useful lives of finite life intangible assets are reviewed annually. Changes in the expected pattern of consumption or useful life are accounted for prospectively by changing the amortisation method or period.
Internally generated intangible assets, excluding capitalised development costs, are not capitalised and expenditure is recognised in the income statement in the year in which the expenditure is incurred.
Goodwill Goodwill arises on the acquisition of a business. Goodwill is not amortised. Instead, goodwill is tested annually for impairment, or more frequently if events or changes in circumstances indicate that it might be impaired, and is carried at cost less accumulated impairment losses. Impairment losses on goodwill are taken to profit or loss and are not subsequently reversed.
Customer contracts and relationships Customer contracts and relationships acquired in a business combination are amortised on a straight-line basis over the period of their expected benefit, being their finite life of 1 to 7 years.
Software and website Costs incurred in developing products or systems and costs incurred in acquiring software and licences that will contribute to future period financial benefits through revenue generation and/or cost reduction are capitalised to software and systems. Costs capitalised include external direct costs of materials and service and direct payroll and payroll-related costs of employees’ time spent on the project.
Software and website costs include only those costs directly attributable to the development phase and are only recognised following completion of technical feasibility and where the Group has an intention and ability to use the asset.
Software and website costs are amortised on a straight-line basis over the period of their expected benefit, being their finite life of 1 to 5 years.
Brand names and logos Brand names and logos acquired in a business combination are recognised separately to goodwill and included in other intangible assets. They have been assessed as having an indefinite useful life on the basis that the asset is allocated to businesses that are expected to continue into perpetuity.
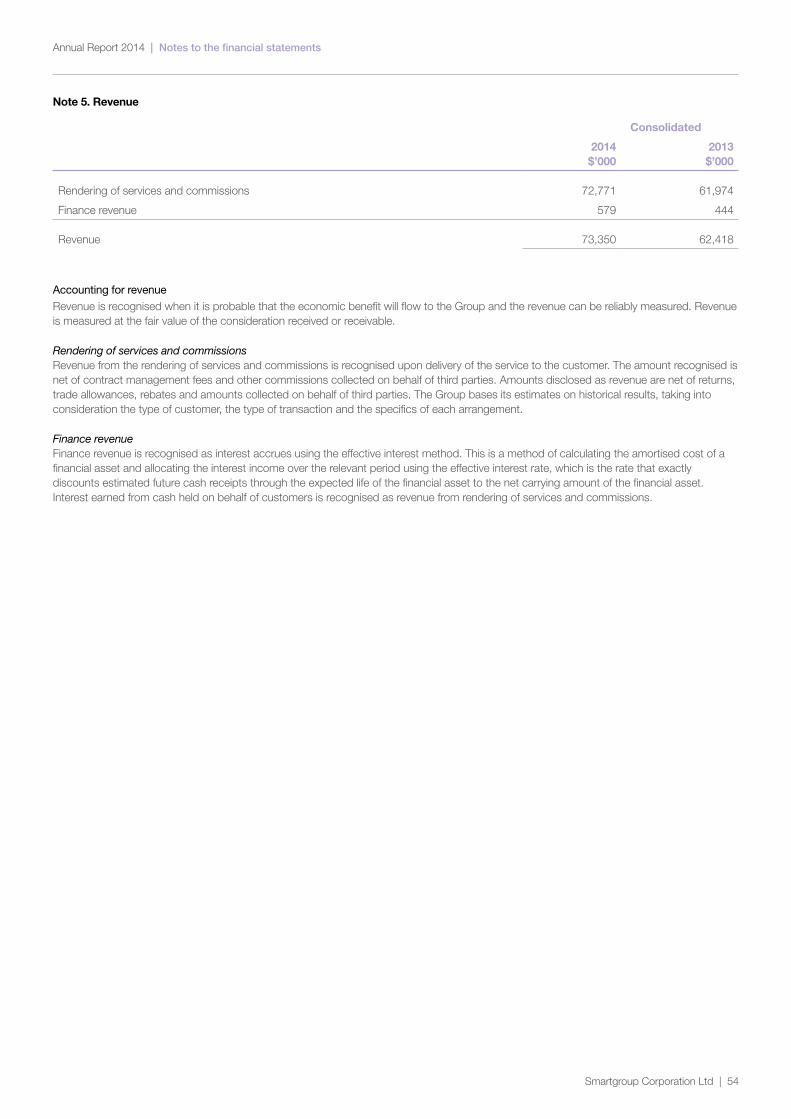
Notes to the financial statementsAnnual Report 2014 |
Smartgroup Corporation Ltd | 54
Note 5. Revenue
Consolidated
2014 $’000
2013 $’000
Rendering of services and commissions 72,771 61,974
Finance revenue 579 444
Revenue 73,350 62,418
Accounting for revenue
Revenue is recognised when it is probable that the economic benefit will flow to the Group and the revenue can be reliably measured. Revenue is measured at the fair value of the consideration received or receivable.
Rendering of services and commissions Revenue from the rendering of services and commissions is recognised upon delivery of the service to the customer. The amount recognised is net of contract management fees and other commissions collected on behalf of third parties. Amounts disclosed as revenue are net of returns, trade allowances, rebates and amounts collected on behalf of third parties. The Group bases its estimates on historical results, taking into consideration the type of customer, the type of transaction and the specifics of each arrangement.
Finance revenue Finance revenue is recognised as interest accrues using the effective interest method. This is a method of calculating the amortised cost of a financial asset and allocating the interest income over the relevant period using the effective interest rate, which is the rate that exactly discounts estimated future cash receipts through the expected life of the financial asset to the net carrying amount of the financial asset. Interest earned from cash held on behalf of customers is recognised as revenue from rendering of services and commissions.
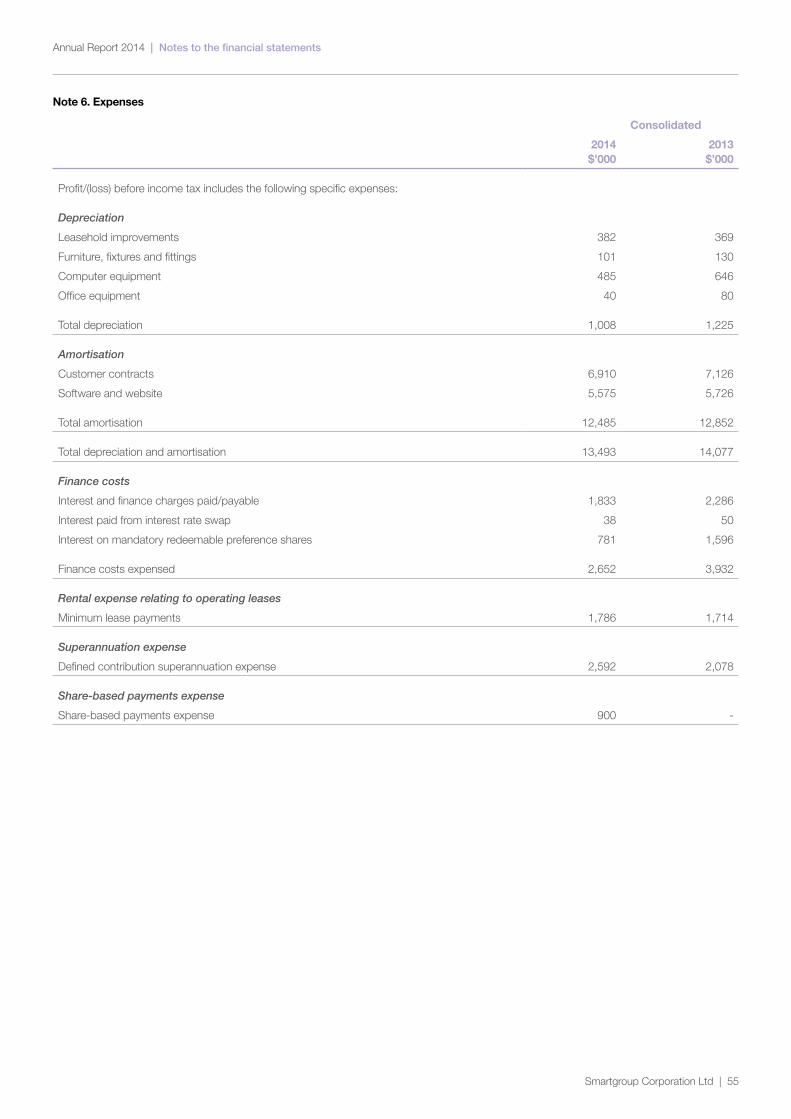
Notes to the financial statementsAnnual Report 2014 |
Smartgroup Corporation Ltd | 55
Note 6. Expenses
Consolidated
2014 $’000
2013 $’000
Profit/(loss) before income tax includes the following specific expenses:
Depreciation
Leasehold improvements 382 369
Furniture, fixtures and fittings 101 130
Computer equipment 485 646
Office equipment 40 80
Total depreciation 1,008 1,225
Amortisation
Customer contracts 6,910 7,126
Software and website 5,575 5,726
Total amortisation 12,485 12,852
Total depreciation and amortisation 13,493 14,077
Finance costs
Interest and finance charges paid/payable 1,833 2,286
Interest paid from interest rate swap 38 50
Interest on mandatory redeemable preference shares 781 1,596
Finance costs expensed 2,652 3,932
Rental expense relating to operating leases
Minimum lease payments 1,786 1,714
Superannuation expense
Defined contribution superannuation expense 2,592 2,078
Share-based payments expense
Share-based payments expense 900 -
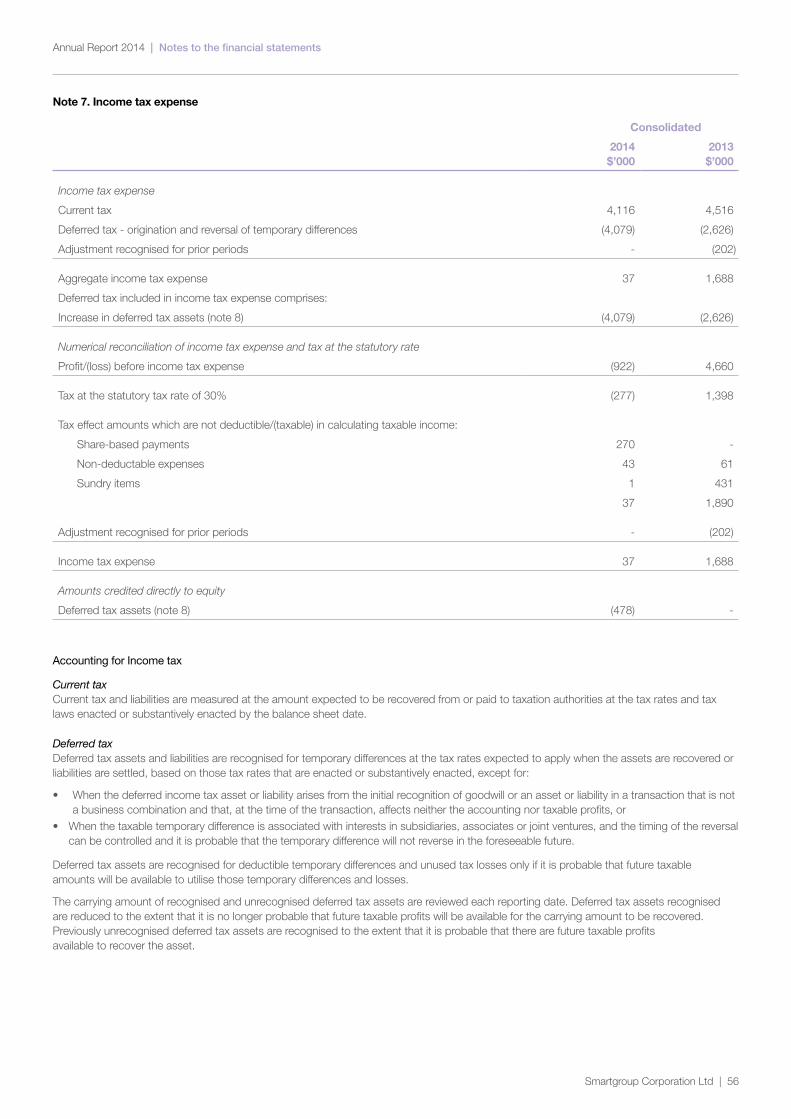
Notes to the financial statementsAnnual Report 2014 |
Smartgroup Corporation Ltd | 56
Note 7. Income tax expense
Consolidated
2014 $’000
2013 $’000
Income tax expense
Current tax 4,116 4,516
Deferred tax - origination and reversal of temporary differences (4,079) (2,626)
Adjustment recognised for prior periods - (202)
Aggregate income tax expense 37 1,688
Deferred tax included in income tax expense comprises:
Increase in deferred tax assets (note 8) (4,079) (2,626)
Numerical reconciliation of income tax expense and tax at the statutory rate
Profit/(loss) before income tax expense (922) 4,660
Tax at the statutory tax rate of 30% (277) 1,398
Tax effect amounts which are not deductible/(taxable) in calculating taxable income:
Share-based payments 270 -
Non-deductable expenses 43 61
Sundry items 1 431
37 1,890
Adjustment recognised for prior periods - (202)
Income tax expense 37 1,688
Amounts credited directly to equity
Deferred tax assets (note 8) (478) -
Accounting for Income tax
Current tax Current tax and liabilities are measured at the amount expected to be recovered from or paid to taxation authorities at the tax rates and tax laws enacted or substantively enacted by the balance sheet date.
Deferred tax Deferred tax assets and liabilities are recognised for temporary differences at the tax rates expected to apply when the assets are recovered or liabilities are settled, based on those tax rates that are enacted or substantively enacted, except for:
• When the deferred income tax asset or liability arises from the initial recognition of goodwill or an asset or liability in a transaction that is not a business combination and that, at the time of the transaction, affects neither the accounting nor taxable profits, or
• When the taxable temporary difference is associated with interests in subsidiaries, associates or joint ventures, and the timing of the reversal can be controlled and it is probable that the temporary difference will not reverse in the foreseeable future.
Deferred tax assets are recognised for deductible temporary differences and unused tax losses only if it is probable that future taxable amounts will be available to utilise those temporary differences and losses.
The carrying amount of recognised and unrecognised deferred tax assets are reviewed each reporting date. Deferred tax assets recognised are reduced to the extent that it is no longer probable that future taxable profits will be available for the carrying amount to be recovered. Previously unrecognised deferred tax assets are recognised to the extent that it is probable that there are future taxable profits available to recover the asset.
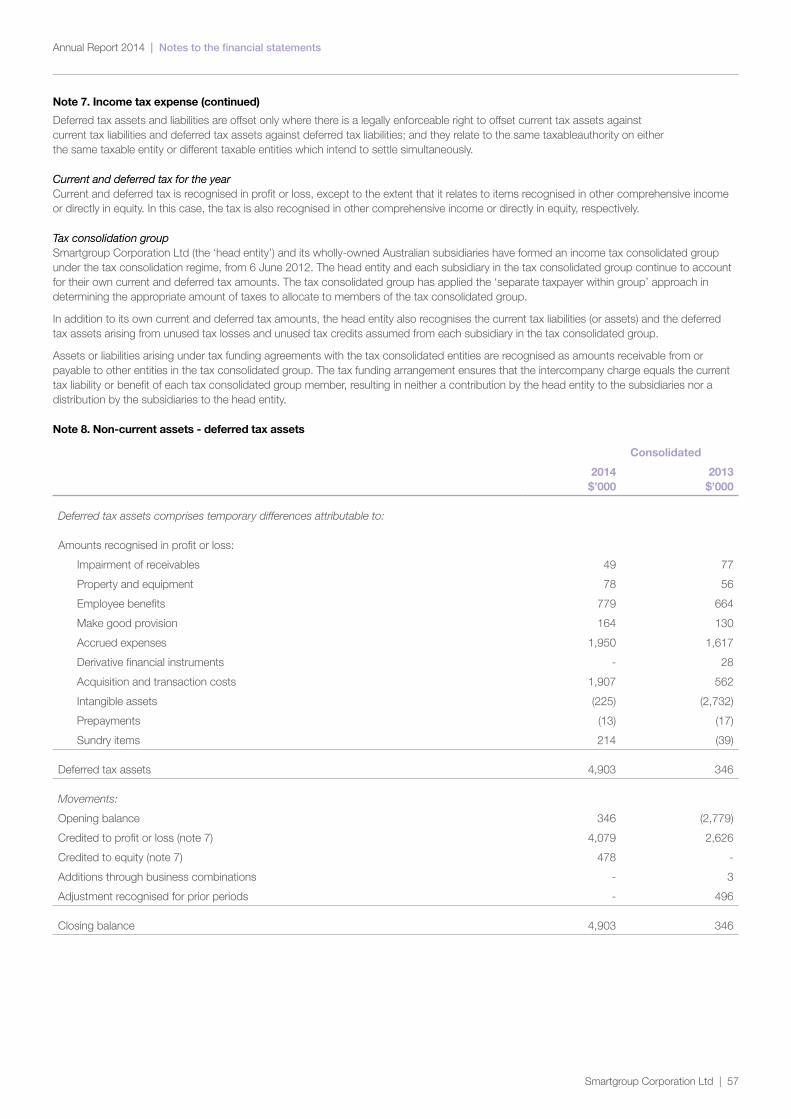
Notes to the financial statementsAnnual Report 2014 |
Smartgroup Corporation Ltd | 57
Note 7. Income tax expense (continued)
Deferred tax assets and liabilities are offset only where there is a legally enforceable right to offset current tax assets against current tax liabilities and deferred tax assets against deferred tax liabilities; and they relate to the same taxableauthority on either the same taxable entity or different taxable entities which intend to settle simultaneously.
Current and deferred tax for the year Current and deferred tax is recognised in profit or loss, except to the extent that it relates to items recognised in other comprehensive income or directly in equity. In this case, the tax is also recognised in other comprehensive income or directly in equity, respectively.
Tax consolidation group Smartgroup Corporation Ltd (the ‘head entity’) and its wholly-owned Australian subsidiaries have formed an income tax consolidated group under the tax consolidation regime, from 6 June 2012. The head entity and each subsidiary in the tax consolidated group continue to account for their own current and deferred tax amounts. The tax consolidated group has applied the ‘separate taxpayer within group’ approach in determining the appropriate amount of taxes to allocate to members of the tax consolidated group.
In addition to its own current and deferred tax amounts, the head entity also recognises the current tax liabilities (or assets) and the deferred tax assets arising from unused tax losses and unused tax credits assumed from each subsidiary in the tax consolidated group.
Assets or liabilities arising under tax funding agreements with the tax consolidated entities are recognised as amounts receivable from or payable to other entities in the tax consolidated group. The tax funding arrangement ensures that the intercompany charge equals the current tax liability or benefit of each tax consolidated group member, resulting in neither a contribution by the head entity to the subsidiaries nor a distribution by the subsidiaries to the head entity.
Note 8. Non-current assets - deferred tax assets
Consolidated
2014 $’000
2013 $’000
Deferred tax assets comprises temporary differences attributable to:
Amounts recognised in profit or loss:
Impairment of receivables 49 77
Property and equipment 78 56
Employee benefits 779 664
Make good provision 164 130
Accrued expenses 1,950 1,617
Derivative financial instruments - 28
Acquisition and transaction costs 1,907 562
Intangible assets (225) (2,732)
Prepayments (13) (17)
Sundry items 214 (39)
Deferred tax assets 4,903 346
Movements:
Opening balance 346 (2,779)
Credited to profit or loss (note 7) 4,079 2,626
Credited to equity (note 7) 478 -
Additions through business combinations - 3
Adjustment recognised for prior periods - 496
Closing balance 4,903 346
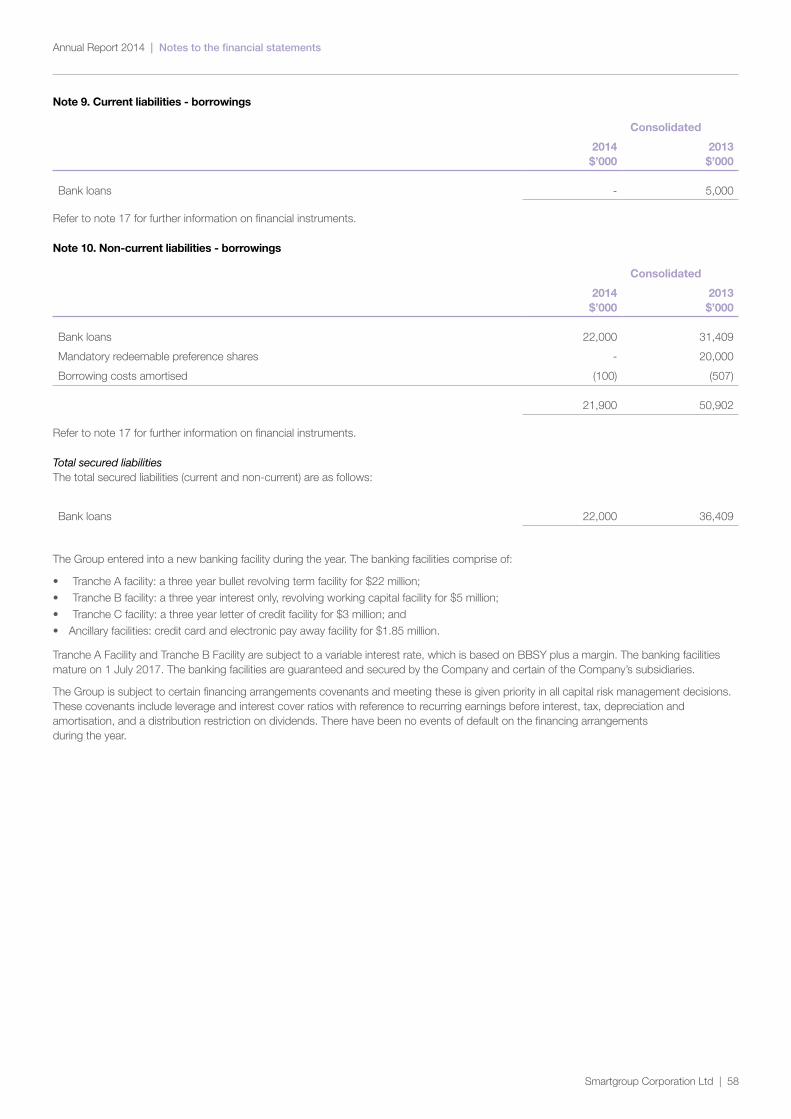
Notes to the financial statementsAnnual Report 2014 |
Smartgroup Corporation Ltd | 58
Note 9. Current liabilities - borrowings
Consolidated
2014 $’000
2013 $’000
Bank loans - 5,000
Refer to note 17 for further information on financial instruments.
Note 10. Non-current liabilities - borrowings
Consolidated
2014 $’000
2013 $’000
Bank loans 22,000 31,409
Mandatory redeemable preference shares - 20,000
Borrowing costs amortised (100) (507)
21,900 50,902
Refer to note 17 for further information on financial instruments.
Total secured liabilitiesThe total secured liabilities (current and non-current) are as follows:
Bank loans 22,000 36,409
The Group entered into a new banking facility during the year. The banking facilities comprise of:
• Tranche A facility: a three year bullet revolving term facility for $22 million; • Tranche B facility: a three year interest only, revolving working capital facility for $5 million; • Tranche C facility: a three year letter of credit facility for $3 million; and • Ancillary facilities: credit card and electronic pay away facility for $1.85 million.
Tranche A Facility and Tranche B Facility are subject to a variable interest rate, which is based on BBSY plus a margin. The banking facilities mature on 1 July 2017. The banking facilities are guaranteed and secured by the Company and certain of the Company’s subsidiaries.
The Group is subject to certain financing arrangements covenants and meeting these is given priority in all capital risk management decisions. These covenants include leverage and interest cover ratios with reference to recurring earnings before interest, tax, depreciation and amortisation, and a distribution restriction on dividends. There have been no events of default on the financing arrangements during the year.
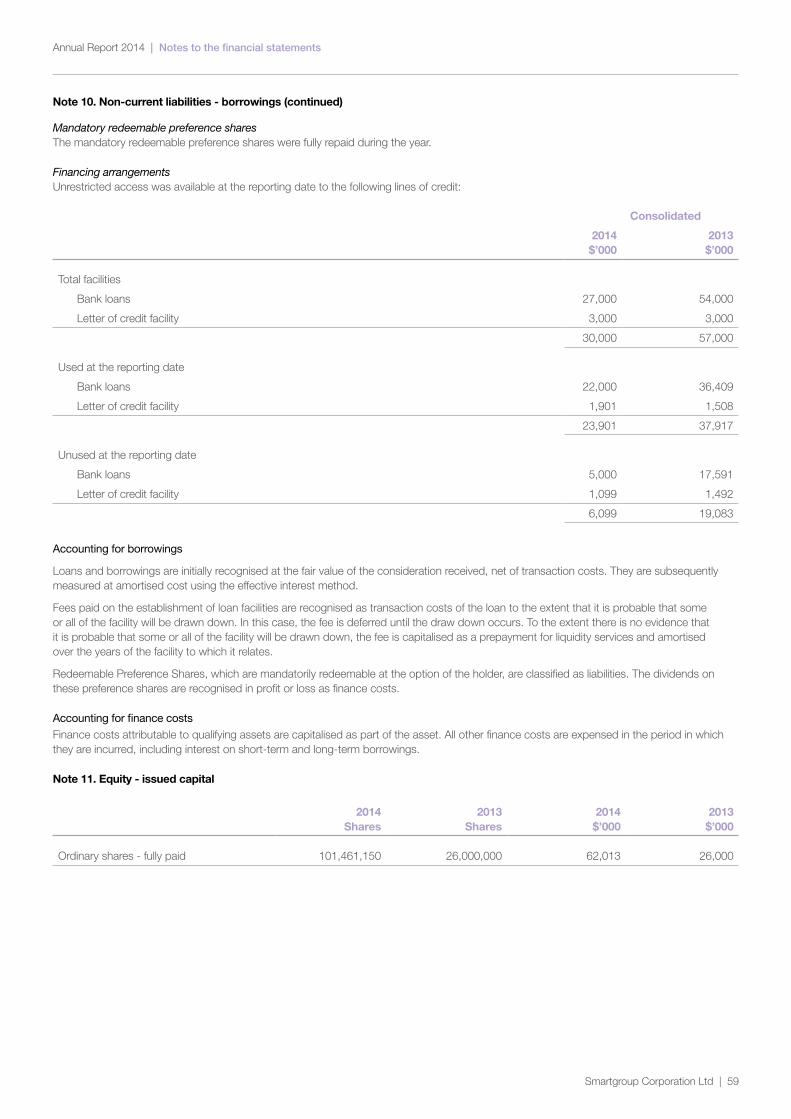
Notes to the financial statementsAnnual Report 2014 |
Smartgroup Corporation Ltd | 59
Note 10. Non-current liabilities - borrowings (continued)
Mandatory redeemable preference shares The mandatory redeemable preference shares were fully repaid during the year.
Financing arrangementsUnrestricted access was available at the reporting date to the following lines of credit:
Consolidated
2014 $’000
2013 $’000
Total facilities
Bank loans 27,000 54,000
Letter of credit facility 3,000 3,000
30,000 57,000
Used at the reporting date
Bank loans 22,000 36,409
Letter of credit facility 1,901 1,508
23,901 37,917
Unused at the reporting date
Bank loans 5,000 17,591
Letter of credit facility 1,099 1,492
6,099 19,083
Accounting for borrowings
Loans and borrowings are initially recognised at the fair value of the consideration received, net of transaction costs. They are subsequently measured at amortised cost using the effective interest method.
Fees paid on the establishment of loan facilities are recognised as transaction costs of the loan to the extent that it is probable that some or all of the facility will be drawn down. In this case, the fee is deferred until the draw down occurs. To the extent there is no evidence that it is probable that some or all of the facility will be drawn down, the fee is capitalised as a prepayment for liquidity services and amortised over the years of the facility to which it relates.
Redeemable Preference Shares, which are mandatorily redeemable at the option of the holder, are classified as liabilities. The dividends on these preference shares are recognised in profit or loss as finance costs.
Accounting for finance costs
Finance costs attributable to qualifying assets are capitalised as part of the asset. All other finance costs are expensed in the period in which they are incurred, including interest on short-term and long-term borrowings.
Note 11. Equity - issued capital
2014 Shares
2013 Shares
2014 $’000
2013 $’000
Ordinary shares - fully paid 101,461,150 26,000,000 62,013 26,000
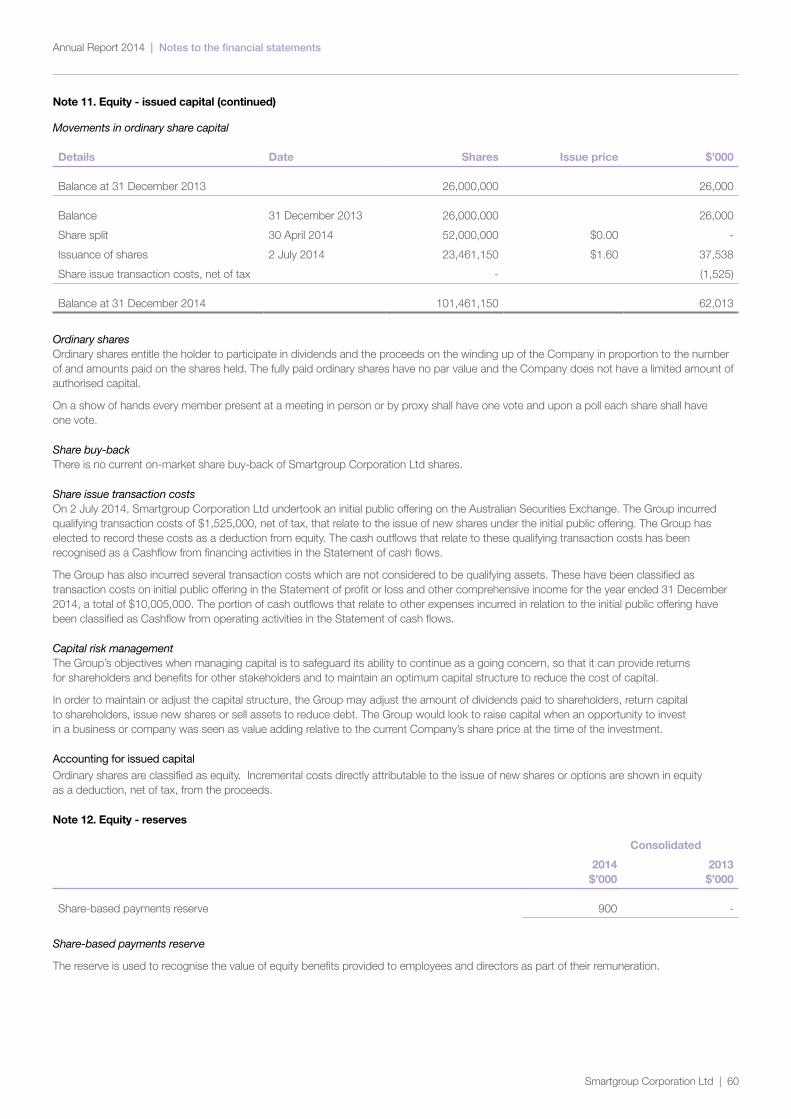
Notes to the financial statementsAnnual Report 2014 |
Smartgroup Corporation Ltd | 60
Note 11. Equity - issued capital (continued)
Movements in ordinary share capital
Details Date Shares Issue price $’000
Balance at 31 December 2013 26,000,000 26,000
Balance 31 December 2013 26,000,000 26,000
Share split 30 April 2014 52,000,000 $0.00 -
Issuance of shares 2 July 2014 23,461,150 $1.60 37,538
Share issue transaction costs, net of tax - (1,525)
Balance at 31 December 2014 101,461,150 62,013
Ordinary sharesOrdinary shares entitle the holder to participate in dividends and the proceeds on the winding up of the Company in proportion to the number of and amounts paid on the shares held. The fully paid ordinary shares have no par value and the Company does not have a limited amount of authorised capital.
On a show of hands every member present at a meeting in person or by proxy shall have one vote and upon a poll each share shall have one vote.
Share buy-backThere is no current on-market share buy-back of Smartgroup Corporation Ltd shares.
Share issue transaction costsOn 2 July 2014, Smartgroup Corporation Ltd undertook an initial public offering on the Australian Securities Exchange. The Group incurred qualifying transaction costs of $1,525,000, net of tax, that relate to the issue of new shares under the initial public offering. The Group has elected to record these costs as a deduction from equity. The cash outflows that relate to these qualifying transaction costs has been recognised as a Cashflow from financing activities in the Statement of cash flows.
The Group has also incurred several transaction costs which are not considered to be qualifying assets. These have been classified as transaction costs on initial public offering in the Statement of profit or loss and other comprehensive income for the year ended 31 December 2014, a total of $10,005,000. The portion of cash outflows that relate to other expenses incurred in relation to the initial public offering have been classified as Cashflow from operating activities in the Statement of cash flows.
Capital risk managementThe Group’s objectives when managing capital is to safeguard its ability to continue as a going concern, so that it can provide returns for shareholders and benefits for other stakeholders and to maintain an optimum capital structure to reduce the cost of capital.
In order to maintain or adjust the capital structure, the Group may adjust the amount of dividends paid to shareholders, return capital to shareholders, issue new shares or sell assets to reduce debt. The Group would look to raise capital when an opportunity to invest in a business or company was seen as value adding relative to the current Company’s share price at the time of the investment.
Accounting for issued capital
Ordinary shares are classified as equity. Incremental costs directly attributable to the issue of new shares or options are shown in equity as a deduction, net of tax, from the proceeds.
Note 12. Equity - reserves
Consolidated
2014 $’000
2013 $’000
Share-based payments reserve 900 -
Share-based payments reserve
The reserve is used to recognise the value of equity benefits provided to employees and directors as part of their remuneration.
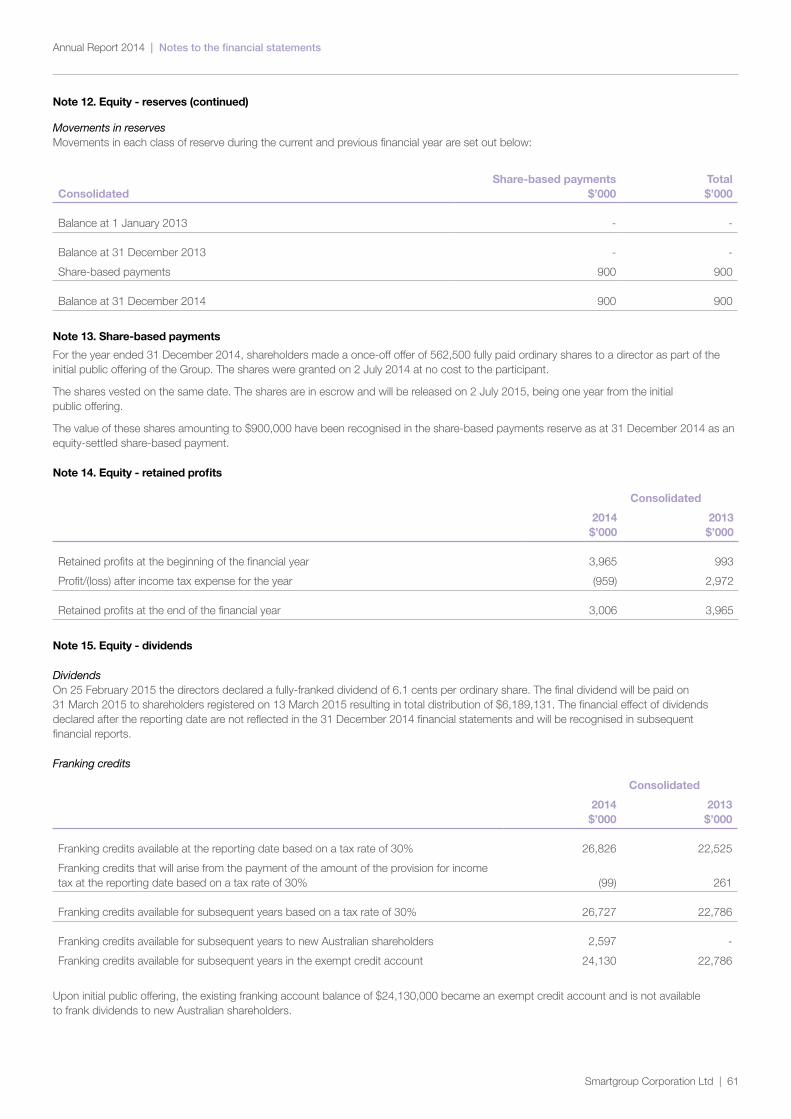
Notes to the financial statementsAnnual Report 2014 |
Smartgroup Corporation Ltd | 61
Note 12. Equity - reserves (continued)
Movements in reservesMovements in each class of reserve during the current and previous financial year are set out below:
ConsolidatedShare-based payments
$’000Total $’000
Balance at 1 January 2013 - -
Balance at 31 December 2013 - -
Share-based payments 900 900
Balance at 31 December 2014 900 900
Note 13. Share-based payments
For the year ended 31 December 2014, shareholders made a once-off offer of 562,500 fully paid ordinary shares to a director as part of the initial public offering of the Group. The shares were granted on 2 July 2014 at no cost to the participant.
The shares vested on the same date. The shares are in escrow and will be released on 2 July 2015, being one year from the initial public offering.
The value of these shares amounting to $900,000 have been recognised in the share-based payments reserve as at 31 December 2014 as an equity-settled share-based payment.
Note 14. Equity - retained profits
Consolidated
2014 $’000
2013 $’000
Retained profits at the beginning of the financial year 3,965 993
Profit/(loss) after income tax expense for the year (959) 2,972
Retained profits at the end of the financial year 3,006 3,965
Note 15. Equity - dividends
DividendsOn 25 February 2015 the directors declared a fully-franked dividend of 6.1 cents per ordinary share. The final dividend will be paid on 31 March 2015 to shareholders registered on 13 March 2015 resulting in total distribution of $6,189,131. The financial effect of dividends declared after the reporting date are not reflected in the 31 December 2014 financial statements and will be recognised in subsequent financial reports.
Franking credits
Consolidated
2014 $’000
2013 $’000
Franking credits available at the reporting date based on a tax rate of 30% 26,826 22,525
Franking credits that will arise from the payment of the amount of the provision for income tax at the reporting date based on a tax rate of 30% (99) 261
Franking credits available for subsequent years based on a tax rate of 30% 26,727 22,786
Franking credits available for subsequent years to new Australian shareholders 2,597 -
Franking credits available for subsequent years in the exempt credit account 24,130 22,786
Upon initial public offering, the existing franking account balance of $24,130,000 became an exempt credit account and is not available to frank dividends to new Australian shareholders.
Notes to the financial statementsAnnual Report 2014 |
Smartgroup Corporation Ltd | 62
Note 15. Equity - dividends (continued)
Accounting for dividends
Dividends are recognised when declared during the financial year and no longer at the discretion of the Company.
Note 16. Earnings per share
Consolidated
2014 $’000
2013 $’000
Profit/(loss) after income tax attributable to the owners of Smartgroup Corporation Ltd (959) 2,972
Number Number
Weighted average number of ordinary shares used in calculating basic earnings per share 89,762,714 78,000,000
Weighted average number of ordinary shares used in calculating diluted earnings per share 89,762,714 78,000,000
Cents Cents
Basic earnings per share (1.07) 3.81
Diluted earnings per share (1.07) 3.81
Accounting for earnings per share
Basic earnings per share Basic earnings per share is calculated by dividing the profit attributable to the owners of Smartgroup Corporation Ltd, excluding any costs of servicing equity other than ordinary shares, by the weighted average number of ordinary shares outstanding during the year, adjusted for bonus elements in ordinary shares issued during the year.
Diluted earnings per share Diluted earnings per share adjusts the figures used in the determination of basic earnings per share to take into account the after income tax effect of interest and other financing costs associated with dilutive potential ordinary shares and the weighted average number of shares assumed to have been issued for no consideration in relation to dilutive potential ordinary shares.
Note 17. Financial instruments
Financial risk management objectivesThe Group’s activities expose it to a variety of financial risks: market risk (including foreign currency risk, price risk and interest rate risk), credit risk and liquidity risk. The Group’s overall risk management program focuses on the unpredictability of financial markets and seeks to minimise potential adverse effects on the financial performance of the Group. The Group may use derivative financial instruments such as interest rate swap contracts to hedge certain risk exposures. Derivatives are exclusively used for hedging purposes, i.e. not as trading or other speculative instruments. The Group uses different methods to measure different types of risk to which it is exposed. These methods include sensitivity analysis in the case of interest rate, foreign exchange and other price risks, ageing analysis for credit risk and rolling cash flow forecasts for analysis of liquidity risk.
Risk management is carried out centrally by the executive team under oversight from the Board. These policies include identification and analysis of the risk exposure of the Group and appropriate procedures, controls and risk limits. The executive team identifies, evaluates and may hedge financial risks within the Group’s operating units.
Market risk
Foreign currency riskThe Group is not exposed to any significant foreign currency risk.
Price riskThe Group is not exposed to any significant price risk.
Interest rate riskThe Group’s main interest rate risk arises from long-term borrowings. Borrowings issued at variable rates expose the Group to interest rate risk. Borrowings issued at fixed rates expose the Group to fair value interest rate risk.
Notes to the financial statementsAnnual Report 2014 |
Smartgroup Corporation Ltd | 63
Note 17. Financial instruments (continued)
As at the reporting date, the Group had the following variable rate borrowings and interest rate swap contracts outstanding:
2014 2013
ConsolidatedWeighted average
interest rate % Balance
$’000Weighted average
interest rate %Balance
$’000
Bank loans 4.22% 22,000 4.70% 36,409
Cash at bank 2.51% (27,823) 2.49% (16,850)
Interest rate swaps (notional principal amount) -% - 2.90% (16,595)
Net exposure to cash flow interest rate risk (5,823) 2,964
An analysis by remaining contractual maturities is shown in ‘liquidity and interest rate risk management’ below.
Sensitivity An increase in interest rates of 100 basis points (2013: 100 basis points) would have an favourable effect on profit before tax of $58,000 (2013: adverse effect on profit before tax of $30,000) per annum based on the net balance. A decrease in interest rates of 100 basis points (2013: 100 basis points) would have an adverse effect on profit before tax of $58,000 (2013: favourable effect on profit before tax of $30,000) per annum based on the net balance.
Credit riskCredit risk refers to the risk that a counterparty will default on its contractual obligations resulting in financial loss to the Group. The Group has procedures in place to monitor credit risk which includes obtaining references and setting appropriate credit limits. The Group obtains guarantees where appropriate to mitigate credit risk. The maximum exposure to credit risk at the reporting date to recognised financial assets is the carrying amount, net of any provisions for impairment of those assets, as disclosed in the statement of financial position and notes to the financial statements. The Group does not hold any collateral.
At 31 December 2014, the Group had 3 customers (2013: 3 customers) with balances greater than $300,000 each and accounted for approximately 54% (2013: 39%) of total trade receivables. This balance was within its terms of trade and no impairment was made as at 31 December 2014. There are no guarantees against these receivables but management closely monitors the receivable balance on a monthly basis and is in regular contact with these customers to mitigate risk.
Liquidity riskPrudent liquidity risk management requires the Group to maintain sufficient liquid assets (mainly cash and cash equivalents) and available borrowing facilities to be able to pay debts as and when they become due and payable.
The Group manages liquidity risk by maintaining adequate cash reserves and available borrowing facilities by continuously monitoring actual and forecast cash flows and matching the maturity profiles of financial assets and liabilities.
Financing arrangementsUnused borrowing facilities at the reporting date:
Consolidated
2014 $’000
2013 $’000
Bank loans 5,000 17,591
Letter of credit facility 1,099 1,492
6,099 19,083
Notes to the financial statementsAnnual Report 2014 |
Smartgroup Corporation Ltd | 64
Note 17. Financial instruments (continued)
Remaining contractual maturitiesThe following tables detail the Group’s remaining contractual maturity for its financial instrument liabilities. The tables have been drawn up based on the undiscounted cash flows of financial liabilities based on the earliest date on which the financial liabilities are required to be paid. The tables include both interest and principal cash flows disclosed as remaining contractual maturities and therefore these totals may differ from their carrying amount in the statement of financial position.
Consolidated - 2014
Weighted average
interest rate %
1 year or less
$’000
Between 1 and
2 years $’000
Between 2 and
5 years $’000
Over 5 years
$’000
Remaining contractual
maturities $’000
Non-derivatives
Non-interest bearing
Trade payables -% 5,894 - - - 5,894
Interest-bearing - variable
Bank loans 4.22% 928 928 22,464 - 24,320
Total non-derivatives 6,822 928 22,464 - 30,214
Consolidated - 2013
Weighted average
interest rate %
1 year or less
$’000
Between 1 and
2 years $’000
Between 2 and
5 years $’000
Over 5 years
$’000
Remaining contractual
maturities $’000
Non-derivatives
Non-interest bearing
Trade payables -% 4,253 - - - 4,253
Interest-bearing - variable
Borrowings 5.69% 10,659 35,192 3,192 23,883 72,926
Total non-derivatives 14,912 35,192 3,192 23,883 77,179
Derivatives
Interest rate swaps inflow 2.90% 454 228 - - 682
Interest rate swaps outflow 2.90% (392) (195) - - (587)
Total derivatives 62 33 - - 95
The cash flows in the maturity analysis above are not expected to occur significantly earlier than contractually disclosed above.
Fair value of financial instrumentsUnless otherwise stated, the carrying amounts of financial instruments reflect their fair value.
Note 18. Current assets - trade and other receivables
Consolidated
2014 $’000
2013 $’000
Trade receivables 7,677 6,199
Less: Provision for impairment of receivables (164) (258)
7,513 5,941
Other receivables 1,240 1,968
8,753 7,909
Notes to the financial statementsAnnual Report 2014 |
Smartgroup Corporation Ltd | 65
Note 18. Current assets - trade and other receivables (continued)
Impairment of receivablesThe ageing of the impaired receivables provided for above are as follows:
Consolidated
2014 $’000
2013 $’000
0 to 3 months overdue 63 6
3 to 6 months overdue 45 27
Over 6 months overdue 56 225
164 258
Movements in the provision for impairment of receivables are as follows:
Opening balance 258 137
Additional provisions recognised 240 280
Receivables written off during the year as uncollectable (205) (2)
Unused amounts reversed (129) (157)
Closing balance 164 258
Past due but not impairedCustomers with balances past due but without provision for impairment of receivables amount to $1,595,000 as at 31 December 2014 ($1,182,000 as at 31 December 2013).
The Group did not consider a credit risk on the aggregate balances after reviewing credit terms of customers based on recent collection practices.
The ageing of the past due but not impaired receivables are as follows:
0 to 3 months overdue 1,481 1,099
Over 3 months overdue 114 83
1,595 1,182
Accounting for trade and other receivables
Trade receivables are initially recognised at fair value and subsequently measured at amortised cost using the effective interest method, less any provision for impairment. Trade receivables are generally due for settlement within 14 days.
Collectability of trade receivables is reviewed on an ongoing basis. Debts which are known to be uncollectable are written off by reducing the carrying amount directly. A provision for impairment of trade receivables is raised when there is objective evidence that the Group will not be able to collect all amounts due according to the original terms of the receivables. Significant financial difficulties of the debtor, probability that the debtor will enter bankruptcy or financial reorganisation and default or delinquency in payments (more than 60 days overdue) are considered indicators that the trade receivable may be impaired. The amount of the impairment allowance is the difference between the asset’s carrying amount and the present value of estimated future cash flows, discounted at the original effective interest rate. Cash flows relating to short-term receivables are not discounted if the effect of discounting is immaterial.
Other receivables are recognised at amortised cost, less any provision for impairment.
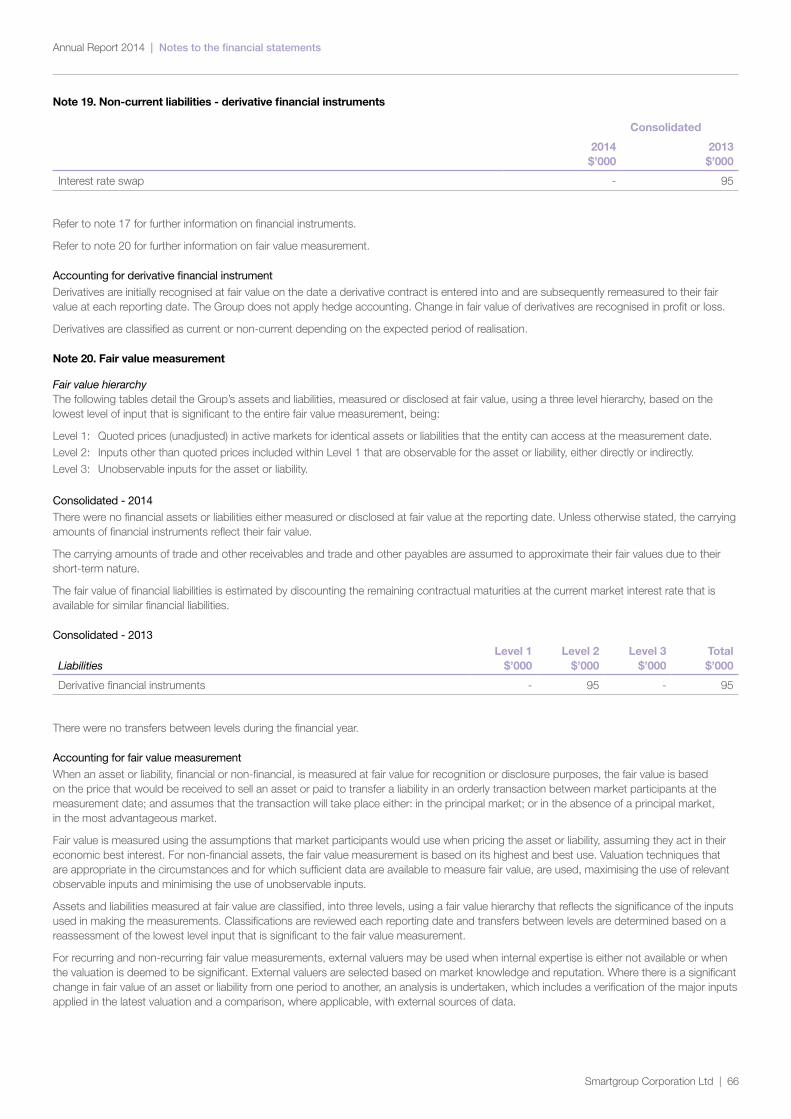
Notes to the financial statementsAnnual Report 2014 |
Smartgroup Corporation Ltd | 66
Note 19. Non-current liabilities - derivative financial instruments
Consolidated
2014 $’000
2013 $’000
Interest rate swap - 95
Refer to note 17 for further information on financial instruments.
Refer to note 20 for further information on fair value measurement.
Accounting for derivative financial instrument
Derivatives are initially recognised at fair value on the date a derivative contract is entered into and are subsequently remeasured to their fair value at each reporting date. The Group does not apply hedge accounting. Change in fair value of derivatives are recognised in profit or loss.
Derivatives are classified as current or non-current depending on the expected period of realisation.
Note 20. Fair value measurement
Fair value hierarchyThe following tables detail the Group’s assets and liabilities, measured or disclosed at fair value, using a three level hierarchy, based on the lowest level of input that is significant to the entire fair value measurement, being:
Level 1: Quoted prices (unadjusted) in active markets for identical assets or liabilities that the entity can access at the measurement date.Level 2: Inputs other than quoted prices included within Level 1 that are observable for the asset or liability, either directly or indirectly.Level 3: Unobservable inputs for the asset or liability.
Consolidated - 2014
There were no financial assets or liabilities either measured or disclosed at fair value at the reporting date. Unless otherwise stated, the carrying amounts of financial instruments reflect their fair value.
The carrying amounts of trade and other receivables and trade and other payables are assumed to approximate their fair values due to their short-term nature.
The fair value of financial liabilities is estimated by discounting the remaining contractual maturities at the current market interest rate that is available for similar financial liabilities.
Consolidated - 2013
LiabilitiesLevel 1
$’000Level 2
$’000Level 3
$’000Total $’000
Derivative financial instruments - 95 - 95
There were no transfers between levels during the financial year.
Accounting for fair value measurement
When an asset or liability, financial or non-financial, is measured at fair value for recognition or disclosure purposes, the fair value is based on the price that would be received to sell an asset or paid to transfer a liability in an orderly transaction between market participants at the measurement date; and assumes that the transaction will take place either: in the principal market; or in the absence of a principal market, in the most advantageous market.
Fair value is measured using the assumptions that market participants would use when pricing the asset or liability, assuming they act in their economic best interest. For non-financial assets, the fair value measurement is based on its highest and best use. Valuation techniques that are appropriate in the circumstances and for which sufficient data are available to measure fair value, are used, maximising the use of relevant observable inputs and minimising the use of unobservable inputs.
Assets and liabilities measured at fair value are classified, into three levels, using a fair value hierarchy that reflects the significance of the inputs used in making the measurements. Classifications are reviewed each reporting date and transfers between levels are determined based on a reassessment of the lowest level input that is significant to the fair value measurement.
For recurring and non-recurring fair value measurements, external valuers may be used when internal expertise is either not available or when the valuation is deemed to be significant. External valuers are selected based on market knowledge and reputation. Where there is a significant change in fair value of an asset or liability from one period to another, an analysis is undertaken, which includes a verification of the major inputs applied in the latest valuation and a comparison, where applicable, with external sources of data.
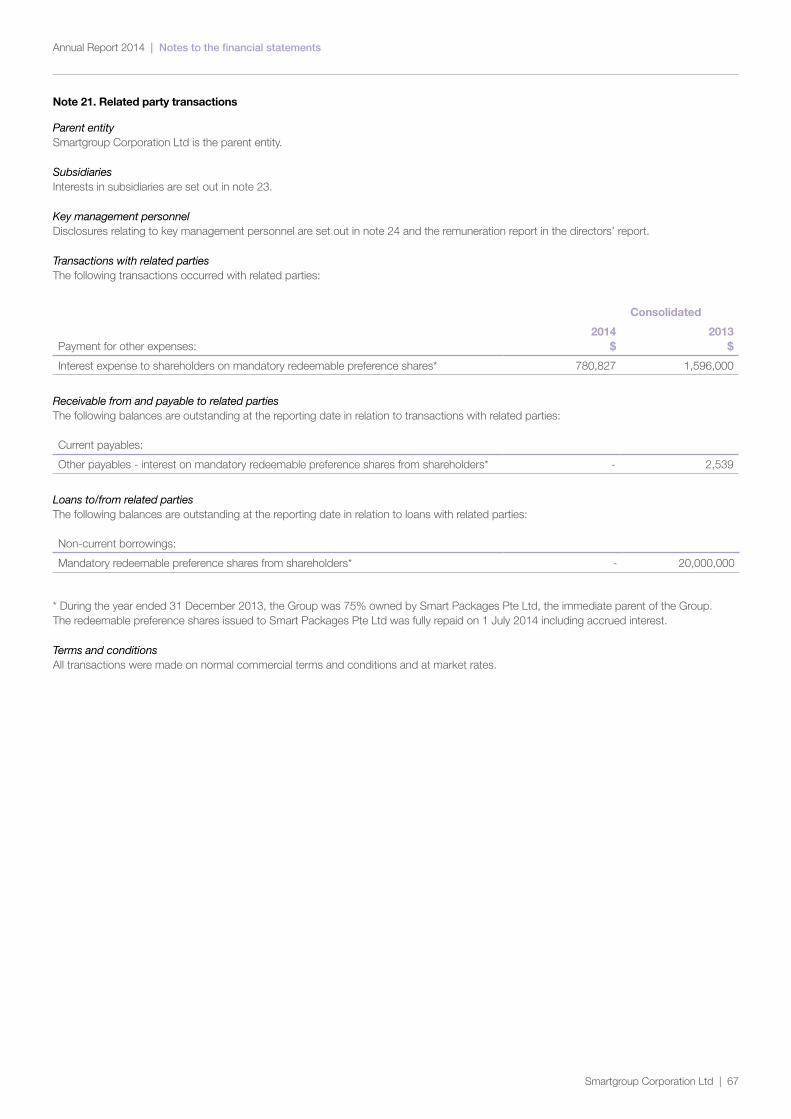
Notes to the financial statementsAnnual Report 2014 |
Smartgroup Corporation Ltd | 67
Note 21. Related party transactions
Parent entitySmartgroup Corporation Ltd is the parent entity.
SubsidiariesInterests in subsidiaries are set out in note 23.
Key management personnelDisclosures relating to key management personnel are set out in note 24 and the remuneration report in the directors’ report.
Transactions with related partiesThe following transactions occurred with related parties:
Consolidated
Payment for other expenses:2014
$2013
$
Interest expense to shareholders on mandatory redeemable preference shares* 780,827 1,596,000
Receivable from and payable to related partiesThe following balances are outstanding at the reporting date in relation to transactions with related parties:
Current payables:
Other payables - interest on mandatory redeemable preference shares from shareholders* - 2,539
Loans to/from related partiesThe following balances are outstanding at the reporting date in relation to loans with related parties:
Non-current borrowings:
Mandatory redeemable preference shares from shareholders* - 20,000,000
* During the year ended 31 December 2013, the Group was 75% owned by Smart Packages Pte Ltd, the immediate parent of the Group. The redeemable preference shares issued to Smart Packages Pte Ltd was fully repaid on 1 July 2014 including accrued interest.
Terms and conditionsAll transactions were made on normal commercial terms and conditions and at market rates.
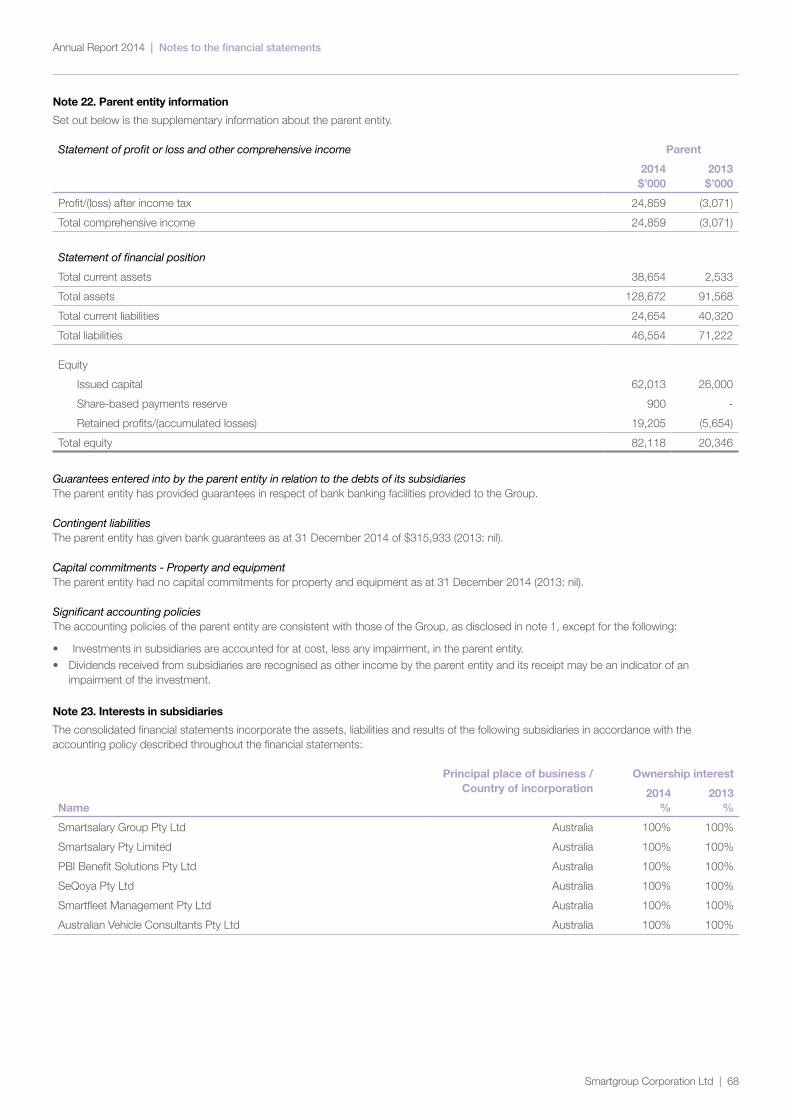
Notes to the financial statementsAnnual Report 2014 |
Smartgroup Corporation Ltd | 68
Note 22. Parent entity information
Set out below is the supplementary information about the parent entity.
Statement of profit or loss and other comprehensive income Parent
2014 $’000
2013 $’000
Profit/(loss) after income tax 24,859 (3,071)
Total comprehensive income 24,859 (3,071)
Statement of financial position
Total current assets 38,654 2,533
Total assets 128,672 91,568
Total current liabilities 24,654 40,320
Total liabilities 46,554 71,222
Equity
Issued capital 62,013 26,000
Share-based payments reserve 900 -
Retained profits/(accumulated losses) 19,205 (5,654)
Total equity 82,118 20,346
Guarantees entered into by the parent entity in relation to the debts of its subsidiariesThe parent entity has provided guarantees in respect of bank banking facilities provided to the Group.
Contingent liabilitiesThe parent entity has given bank guarantees as at 31 December 2014 of $315,933 (2013: nil).
Capital commitments - Property and equipmentThe parent entity had no capital commitments for property and equipment as at 31 December 2014 (2013: nil).
Significant accounting policiesThe accounting policies of the parent entity are consistent with those of the Group, as disclosed in note 1, except for the following:
• Investments in subsidiaries are accounted for at cost, less any impairment, in the parent entity.• Dividends received from subsidiaries are recognised as other income by the parent entity and its receipt may be an indicator of an
impairment of the investment.
Note 23. Interests in subsidiaries
The consolidated financial statements incorporate the assets, liabilities and results of the following subsidiaries in accordance with the accounting policy described throughout the financial statements:
Principal place of business / Country of incorporation
Ownership interest
Name2014
%2013
%
Smartsalary Group Pty Ltd Australia 100% 100%
Smartsalary Pty Limited Australia 100% 100%
PBI Benefit Solutions Pty Ltd Australia 100% 100%
SeQoya Pty Ltd Australia 100% 100%
Smartfleet Management Pty Ltd Australia 100% 100%
Australian Vehicle Consultants Pty Ltd Australia 100% 100%
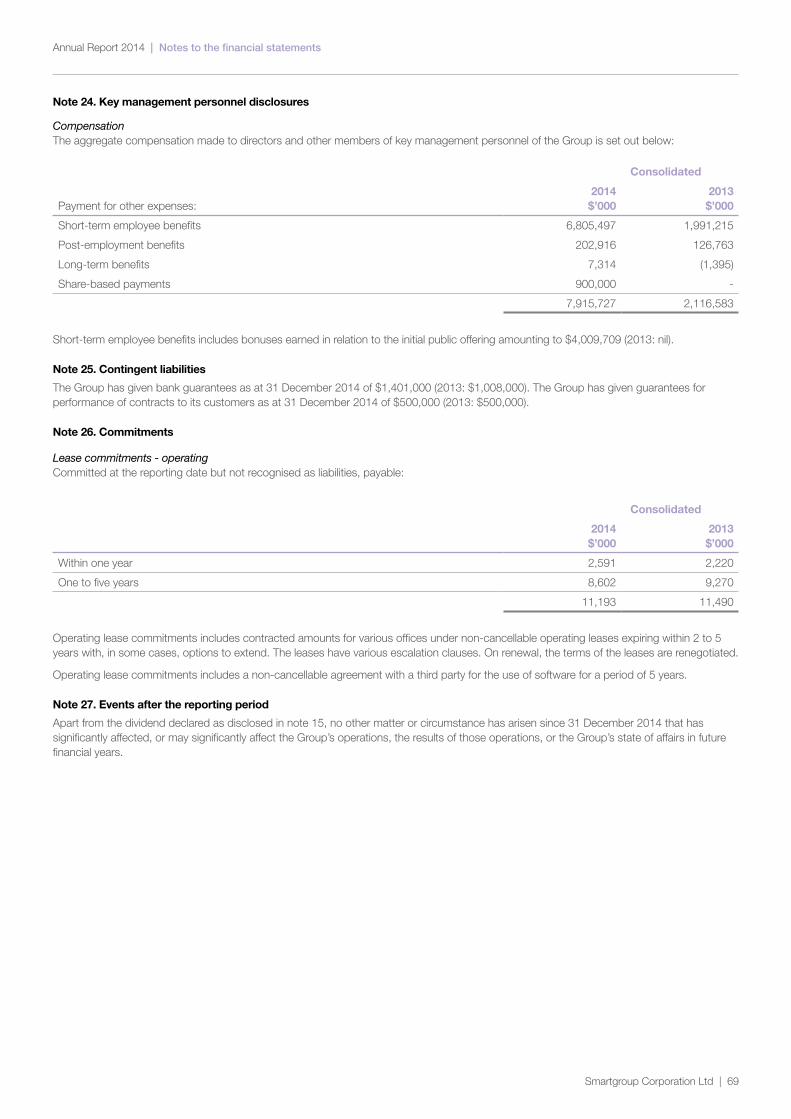
Notes to the financial statementsAnnual Report 2014 |
Smartgroup Corporation Ltd | 69
Note 24. Key management personnel disclosures
CompensationThe aggregate compensation made to directors and other members of key management personnel of the Group is set out below:
Consolidated
Payment for other expenses:2014 $’000
2013 $’000
Short-term employee benefits 6,805,497 1,991,215
Post-employment benefits 202,916 126,763
Long-term benefits 7,314 (1,395)
Share-based payments 900,000 -
7,915,727 2,116,583
Short-term employee benefits includes bonuses earned in relation to the initial public offering amounting to $4,009,709 (2013: nil).
Note 25. Contingent liabilities
The Group has given bank guarantees as at 31 December 2014 of $1,401,000 (2013: $1,008,000). The Group has given guarantees for performance of contracts to its customers as at 31 December 2014 of $500,000 (2013: $500,000).
Note 26. Commitments
Lease commitments - operatingCommitted at the reporting date but not recognised as liabilities, payable:
Consolidated
2014 $’000
2013 $’000
Within one year 2,591 2,220
One to five years 8,602 9,270
11,193 11,490
Operating lease commitments includes contracted amounts for various offices under non-cancellable operating leases expiring within 2 to 5 years with, in some cases, options to extend. The leases have various escalation clauses. On renewal, the terms of the leases are renegotiated.
Operating lease commitments includes a non-cancellable agreement with a third party for the use of software for a period of 5 years.
Note 27. Events after the reporting period
Apart from the dividend declared as disclosed in note 15, no other matter or circumstance has arisen since 31 December 2014 that has significantly affected, or may significantly affect the Group’s operations, the results of those operations, or the Group’s state of affairs in future financial years.
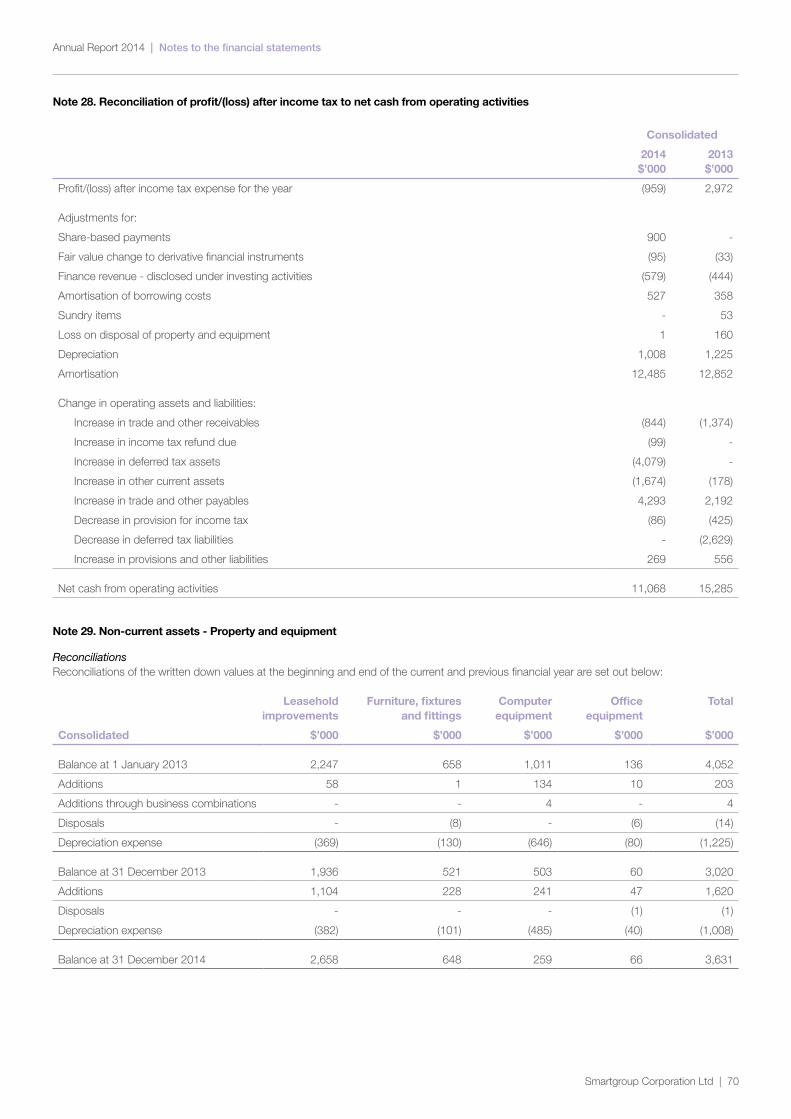
Notes to the financial statementsAnnual Report 2014 |
Smartgroup Corporation Ltd | 70
Note 28. Reconciliation of profit/(loss) after income tax to net cash from operating activities
Consolidated
2014 $’000
2013 $’000
Profit/(loss) after income tax expense for the year (959) 2,972
Adjustments for:
Share-based payments 900 -
Fair value change to derivative financial instruments (95) (33)
Finance revenue - disclosed under investing activities (579) (444)
Amortisation of borrowing costs 527 358
Sundry items - 53
Loss on disposal of property and equipment 1 160
Depreciation 1,008 1,225
Amortisation 12,485 12,852
Change in operating assets and liabilities:
Increase in trade and other receivables (844) (1,374)
Increase in income tax refund due (99) -
Increase in deferred tax assets (4,079) -
Increase in other current assets (1,674) (178)
Increase in trade and other payables 4,293 2,192
Decrease in provision for income tax (86) (425)
Decrease in deferred tax liabilities - (2,629)
Increase in provisions and other liabilities 269 556
Net cash from operating activities 11,068 15,285
Note 29. Non-current assets - Property and equipment
ReconciliationsReconciliations of the written down values at the beginning and end of the current and previous financial year are set out below:
Leasehold improvements
Furniture, fixtures and fittings
Computer equipment
Office equipment
Total
Consolidated $’000 $’000 $’000 $’000 $’000
Balance at 1 January 2013 2,247 658 1,011 136 4,052
Additions 58 1 134 10 203
Additions through business combinations - - 4 - 4
Disposals - (8) - (6) (14)
Depreciation expense (369) (130) (646) (80) (1,225)
Balance at 31 December 2013 1,936 521 503 60 3,020
Additions 1,104 228 241 47 1,620
Disposals - - - (1) (1)
Depreciation expense (382) (101) (485) (40) (1,008)
Balance at 31 December 2014 2,658 648 259 66 3,631

Notes to the financial statementsAnnual Report 2014 |
Smartgroup Corporation Ltd | 71
Note 29. Non-current assets - Property and equipment (continued)
Accounting for property and equipment Plant and equipment is stated at historical cost less accumulated depreciation and impairment. Historical cost includes expenditure that is directly attributable to the acquisition of the items.
Depreciation is calculated on a straight-line basis to write off the net cost of each item of property and equipment over their expected useful lives as follows:
Leasehold improvements Over unexpired period of leaseFurniture, fixtures and fittings 5-10 yearsComputer equipment 2-3 yearsOffice equipment 3-6 years
The residual values, useful lives and depreciation methods are reviewed annually and adjusted if appropriate.
Plant and equipment under lease are depreciated over the unexpired period of the lease or the estimated useful life of the assets, whichever is shorter.
An item of property and equipment is derecognised upon disposal or when there is no future economic benefit to the Group. Gains and losses between the carrying amount and the disposal proceeds are taken to profit or loss.
Note 30. Current liabilities - trade and other payables
Consolidated
2014 $’000
2013 $’000
Trade payables 5,894 4,253
Other payables and accruals 11,274 9,719
17,168 13,972
Refer to note 17 for further information on financial instruments.
Accounting for trade and other payables
These amounts represent liabilities for goods and services provided to the Group prior to the end of the financial year and which are unpaid. Due to their short-term nature they are measured at amortised cost and are not discounted. The amounts are unsecured and are usually paid within 30 days of recognition.
Note 31. Current liabilities - provisions
Consolidated
2014 $’000
2013 $’000
Employee benefits 1,998 1,750
Operations provision 1,590 519
Recoveries provision 177 326
3,765 2,595
Employee benefitsThe provision for employee benefits relates to the Group’s liability for annual leave and long service leave.
Recoveries provisionThe provision relates to the amounts collected in advance which may be used to satisfy a future obligation for maintenance and servicing costs for vehicles in the fleet management segment.
Operations provisionThe provision relates to negative employee salary packaging account balances which may be uncollectible, customer and supplier disputes.
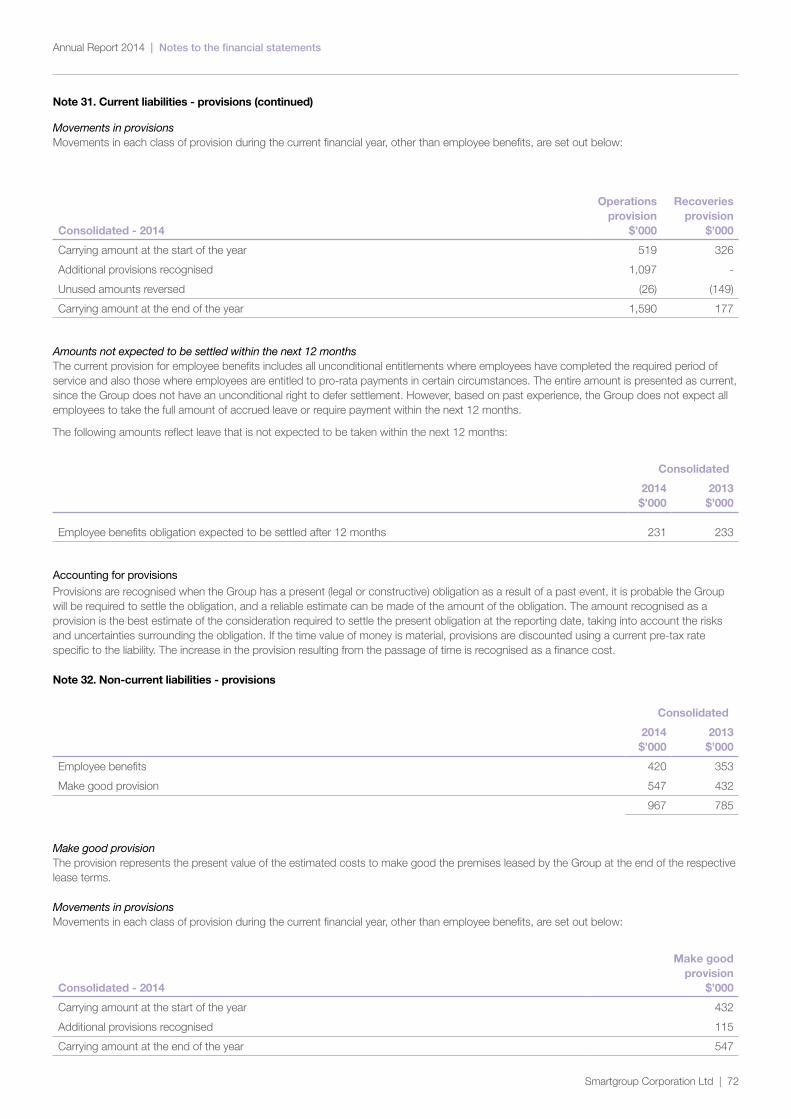
Notes to the financial statementsAnnual Report 2014 |
Smartgroup Corporation Ltd | 72
Note 31. Current liabilities - provisions (continued)
Movements in provisionsMovements in each class of provision during the current financial year, other than employee benefits, are set out below:
Consolidated - 2014
Operations provision
$’000
Recoveries provision
$’000
Carrying amount at the start of the year 519 326
Additional provisions recognised 1,097 -
Unused amounts reversed (26) (149)
Carrying amount at the end of the year 1,590 177
Amounts not expected to be settled within the next 12 monthsThe current provision for employee benefits includes all unconditional entitlements where employees have completed the required period of service and also those where employees are entitled to pro-rata payments in certain circumstances. The entire amount is presented as current, since the Group does not have an unconditional right to defer settlement. However, based on past experience, the Group does not expect all employees to take the full amount of accrued leave or require payment within the next 12 months.
The following amounts reflect leave that is not expected to be taken within the next 12 months:
Consolidated
2014 $’000
2013 $’000
Employee benefits obligation expected to be settled after 12 months 231 233
Accounting for provisions
Provisions are recognised when the Group has a present (legal or constructive) obligation as a result of a past event, it is probable the Group will be required to settle the obligation, and a reliable estimate can be made of the amount of the obligation. The amount recognised as a provision is the best estimate of the consideration required to settle the present obligation at the reporting date, taking into account the risks and uncertainties surrounding the obligation. If the time value of money is material, provisions are discounted using a current pre-tax rate specific to the liability. The increase in the provision resulting from the passage of time is recognised as a finance cost.
Note 32. Non-current liabilities - provisions
Consolidated
2014 $’000
2013 $’000
Employee benefits 420 353
Make good provision 547 432
967 785
Make good provisionThe provision represents the present value of the estimated costs to make good the premises leased by the Group at the end of the respective lease terms.
Movements in provisionsMovements in each class of provision during the current financial year, other than employee benefits, are set out below:
Consolidated - 2014
Make good provision
$’000
Carrying amount at the start of the year 432
Additional provisions recognised 115
Carrying amount at the end of the year 547
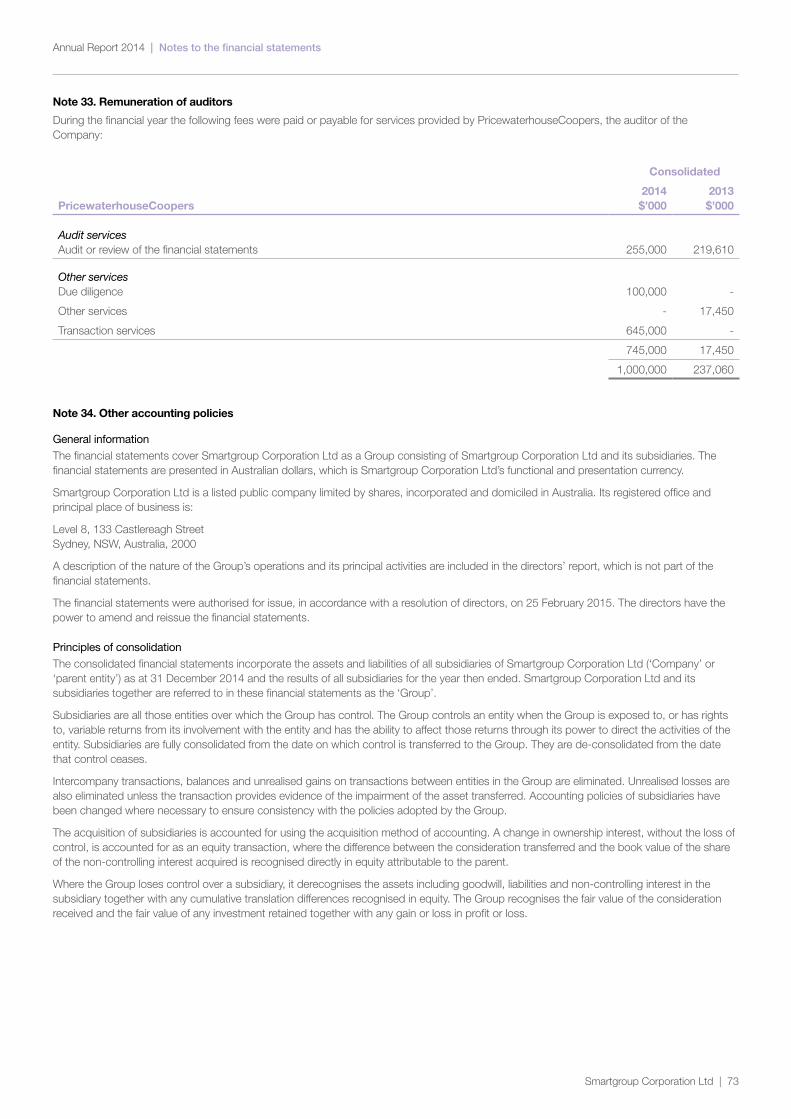
Notes to the financial statementsAnnual Report 2014 |
Smartgroup Corporation Ltd | 73
Note 33. Remuneration of auditors
During the financial year the following fees were paid or payable for services provided by PricewaterhouseCoopers, the auditor of the Company:
PricewaterhouseCoopers
Consolidated
2014 $’000
2013 $’000
Audit servicesAudit or review of the financial statements 255,000 219,610
Other servicesDue diligence 100,000 -
Other services - 17,450
Transaction services 645,000 -
745,000 17,450
1,000,000 237,060
Note 34. Other accounting policies
General information
The financial statements cover Smartgroup Corporation Ltd as a Group consisting of Smartgroup Corporation Ltd and its subsidiaries. The financial statements are presented in Australian dollars, which is Smartgroup Corporation Ltd’s functional and presentation currency.
Smartgroup Corporation Ltd is a listed public company limited by shares, incorporated and domiciled in Australia. Its registered office and principal place of business is:
Level 8, 133 Castlereagh Street Sydney, NSW, Australia, 2000
A description of the nature of the Group’s operations and its principal activities are included in the directors’ report, which is not part of the financial statements.
The financial statements were authorised for issue, in accordance with a resolution of directors, on 25 February 2015. The directors have the power to amend and reissue the financial statements.
Principles of consolidation
The consolidated financial statements incorporate the assets and liabilities of all subsidiaries of Smartgroup Corporation Ltd (‘Company’ or ‘parent entity’) as at 31 December 2014 and the results of all subsidiaries for the year then ended. Smartgroup Corporation Ltd and its subsidiaries together are referred to in these financial statements as the ‘Group’.
Subsidiaries are all those entities over which the Group has control. The Group controls an entity when the Group is exposed to, or has rights to, variable returns from its involvement with the entity and has the ability to affect those returns through its power to direct the activities of the entity. Subsidiaries are fully consolidated from the date on which control is transferred to the Group. They are de-consolidated from the date that control ceases.
Intercompany transactions, balances and unrealised gains on transactions between entities in the Group are eliminated. Unrealised losses are also eliminated unless the transaction provides evidence of the impairment of the asset transferred. Accounting policies of subsidiaries have been changed where necessary to ensure consistency with the policies adopted by the Group.
The acquisition of subsidiaries is accounted for using the acquisition method of accounting. A change in ownership interest, without the loss of control, is accounted for as an equity transaction, where the difference between the consideration transferred and the book value of the share of the non-controlling interest acquired is recognised directly in equity attributable to the parent.
Where the Group loses control over a subsidiary, it derecognises the assets including goodwill, liabilities and non-controlling interest in the subsidiary together with any cumulative translation differences recognised in equity. The Group recognises the fair value of the consideration received and the fair value of any investment retained together with any gain or loss in profit or loss.
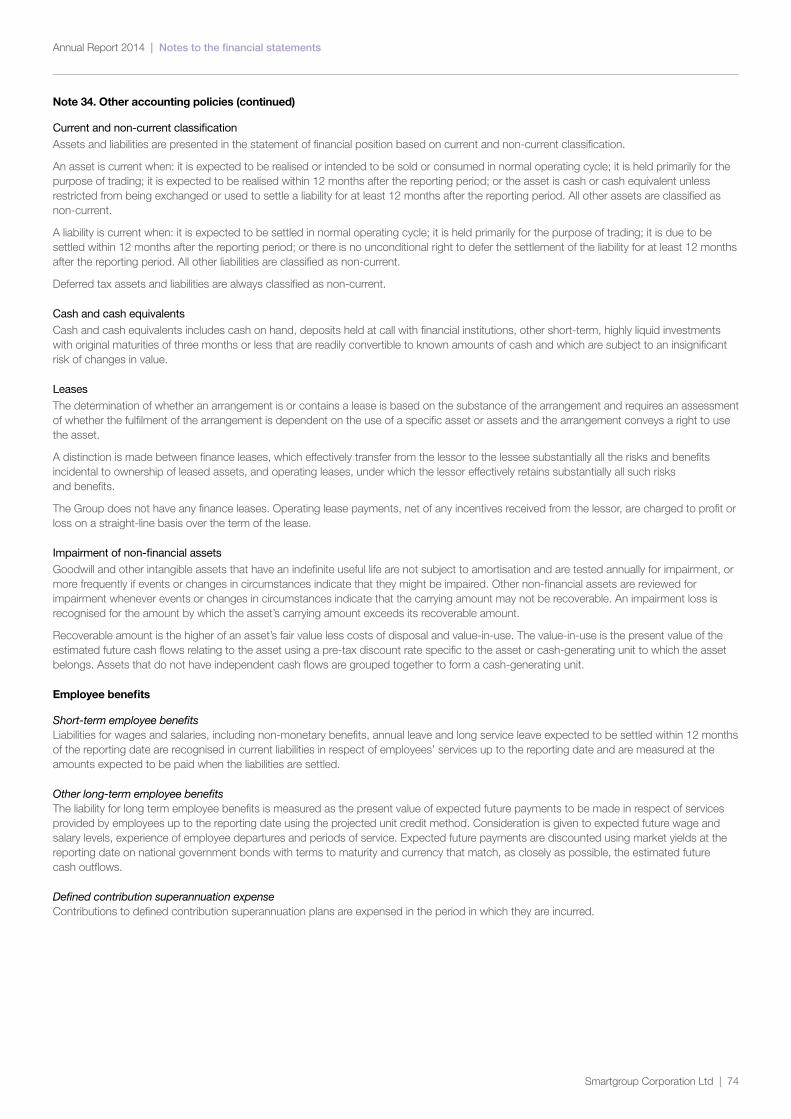
Notes to the financial statementsAnnual Report 2014 |
Smartgroup Corporation Ltd | 74
Note 34. Other accounting policies (continued)
Current and non-current classification
Assets and liabilities are presented in the statement of financial position based on current and non-current classification.
An asset is current when: it is expected to be realised or intended to be sold or consumed in normal operating cycle; it is held primarily for the purpose of trading; it is expected to be realised within 12 months after the reporting period; or the asset is cash or cash equivalent unless restricted from being exchanged or used to settle a liability for at least 12 months after the reporting period. All other assets are classified as non-current.
A liability is current when: it is expected to be settled in normal operating cycle; it is held primarily for the purpose of trading; it is due to be settled within 12 months after the reporting period; or there is no unconditional right to defer the settlement of the liability for at least 12 months after the reporting period. All other liabilities are classified as non-current.
Deferred tax assets and liabilities are always classified as non-current.
Cash and cash equivalents
Cash and cash equivalents includes cash on hand, deposits held at call with financial institutions, other short-term, highly liquid investments with original maturities of three months or less that are readily convertible to known amounts of cash and which are subject to an insignificant risk of changes in value.
Leases
The determination of whether an arrangement is or contains a lease is based on the substance of the arrangement and requires an assessment of whether the fulfilment of the arrangement is dependent on the use of a specific asset or assets and the arrangement conveys a right to use the asset.
A distinction is made between finance leases, which effectively transfer from the lessor to the lessee substantially all the risks and benefits incidental to ownership of leased assets, and operating leases, under which the lessor effectively retains substantially all such risks and benefits.
The Group does not have any finance leases. Operating lease payments, net of any incentives received from the lessor, are charged to profit or loss on a straight-line basis over the term of the lease.
Impairment of non-financial assets
Goodwill and other intangible assets that have an indefinite useful life are not subject to amortisation and are tested annually for impairment, or more frequently if events or changes in circumstances indicate that they might be impaired. Other non-financial assets are reviewed for impairment whenever events or changes in circumstances indicate that the carrying amount may not be recoverable. An impairment loss is recognised for the amount by which the asset’s carrying amount exceeds its recoverable amount.
Recoverable amount is the higher of an asset’s fair value less costs of disposal and value-in-use. The value-in-use is the present value of the estimated future cash flows relating to the asset using a pre-tax discount rate specific to the asset or cash-generating unit to which the asset belongs. Assets that do not have independent cash flows are grouped together to form a cash-generating unit.
Employee benefits
Short-term employee benefitsLiabilities for wages and salaries, including non-monetary benefits, annual leave and long service leave expected to be settled within 12 months of the reporting date are recognised in current liabilities in respect of employees’ services up to the reporting date and are measured at the amounts expected to be paid when the liabilities are settled.
Other long-term employee benefitsThe liability for long term employee benefits is measured as the present value of expected future payments to be made in respect of services provided by employees up to the reporting date using the projected unit credit method. Consideration is given to expected future wage and salary levels, experience of employee departures and periods of service. Expected future payments are discounted using market yields at the reporting date on national government bonds with terms to maturity and currency that match, as closely as possible, the estimated future cash outflows.
Defined contribution superannuation expenseContributions to defined contribution superannuation plans are expensed in the period in which they are incurred.
Notes to the financial statementsAnnual Report 2014 |
Smartgroup Corporation Ltd | 75
Note 34. Other accounting policies (continued)
Share-based paymentsEquity-settled and cash-settled share-based compensation benefits are provided to employees.
Equity-settled transactions are awards of shares, or options over shares, that are provided to employees in exchange for the rendering of services. Cash-settled transactions are awards of cash for the exchange of services, where the amount of cash is determined by reference to the share price.
The cost of equity-settled transactions are measured at fair value on grant date. Fair value is independently determined using either the Binomial or Black-Scholes option pricing model that takes into account the exercise price, the term of the option, the impact of dilution, the share price at grant date and expected price volatility of the underlying share, the expected dividend yield and the risk free interest rate for the term of the option, together with non-vesting conditions that do not determine whether the Group receives the services that entitle the employees to receive payment. No account is taken of any other vesting conditions.
The cost of equity-settled transactions are recognised as an expense with a corresponding increase in equity over the vesting period. The cumulative charge to profit or loss is calculated based on the grant date fair value of the award, the best estimate of the number of awards that are likely to vest and the expired portion of the vesting period. The amount recognised in profit or loss for the period is the cumulative amount calculated at each reporting date less amounts already recognised in previous periods.
The cost of cash-settled transactions is initially, and at each reporting date until vested, determined by applying either the Binomial or Black-Scholes option pricing model, taking into consideration the terms and conditions on which the award was granted. The cumulative charge to profit or loss until settlement of the liability is calculated as follows:
• during the vesting period, the liability at each reporting date is the fair value of the award at that date multiplied by the expired portion of the vesting period, and
• from the end of the vesting period until settlement of the award, the liability is the full fair value of the liability at the reporting date.
All changes in the liability are recognised in profit or loss. The ultimate cost of cash-settled transactions is the cash paid to settle the liability.
Market conditions are taken into consideration in determining fair value. Therefore any awards subject to market conditions are considered to vest irrespective of whether or not that market condition has been met, provided all other conditions are satisfied.
If equity-settled awards are modified, as a minimum an expense is recognised as if the modification has not been made. An additional expense is recognised, over the remaining vesting period, for any modification that increases the total fair value of the share-based compensation benefit as at the date of modification.
If the non-vesting condition is within the control of the Group or employee, the failure to satisfy the condition is treated as a cancellation. If the condition is not within the control of the Group or employee and is not satisfied during the vesting period, any remaining expense for the award is recognised over the remaining vesting period, unless the award is forfeited.
If equity-settled awards are cancelled, it is treated as if it has vested on the date of cancellation, and any remaining expense is recognised immediately. If a new replacement award is substituted for the cancelled award, the cancelled and new award is treated as if they were a modification.
Business combinations
The acquisition method of accounting is used to account for business combinations regardless of whether equity instruments or other assets are acquired.
The consideration transferred is the sum of the acquisition-date fair values of the assets transferred, equity instruments issued or liabilities incurred by the acquirer to former owners of the acquiree and the amount of any non-controlling interest in the acquiree. For each business combination, the non-controlling interest in the acquiree is measured at either fair value or at the proportionate share of the acquiree’s identifiable net assets. All acquisition costs are expensed as incurred to profit or loss.
On the acquisition of a business, the Group assesses the financial assets acquired and liabilities assumed for appropriate classification and designation in accordance with the contractual terms, economic conditions, the Group’s operating or accounting policies and other pertinent conditions in existence at the acquisition-date.
Where the business combination is achieved in stages, the Group remeasures its previously held equity interest in the acquiree at the acquisition-date fair value and the difference between the fair value and the previous carrying amount is recognised in profit or loss.
Contingent consideration to be transferred by the acquirer is recognised at the acquisition-date fair value. Subsequent changes in the fair value of contingent consideration classified as an asset or liability is recognised in profit or loss. Contingent consideration classified as equity is not remeasured and its subsequent settlement is accounted for within equity.
The difference between the acquisition-date fair value of assets acquired, liabilities assumed and any non-controlling interest in the acquiree and the fair value of the consideration transferred and the fair value of any pre-existing investment in the acquiree is recognised as goodwill. If the consideration transferred and the pre-existing fair value is less than the fair value of the identifiable net assets acquired, being a bargain purchase to the acquirer, the difference is recognised as a gain directly in profit or loss by the acquirer on the acquisition-date, but only after a reassessment of the identification and measurement of the net assets acquired, the non-controlling interest in the acquiree, if any, the consideration transferred and the acquirer’s previously held equity interest in the acquirer.
Notes to the financial statementsAnnual Report 2014 |
Smartgroup Corporation Ltd | 76
Note 34. Other accounting policies (continued)
Business combinations are initially accounted for on a provisional basis. The acquirer retrospectively adjusts the provisional amounts recognised and also recognises additional assets or liabilities during the measurement period, based on new information obtained about the facts and circumstances that existed at the acquisition-date. The measurement period ends on either the earlier of (i) 12 months from the date of the acquisition or (ii) when the acquirer receives all the information possible to determine fair value.
Goods and Services Tax (‘GST’) and other similar taxes
Revenues, expenses and assets are recognised net of the amount of associated GST, unless the GST incurred is not recoverable from the tax authority. In this case it is recognised as part of the cost of the acquisition of the asset or as part of the expense.
Receivables and payables are stated inclusive of the amount of GST receivable or payable. The net amount of GST recoverable from, or payable to, the tax authority is included in other receivables or other payables in the statement of financial position.
Cash flows are presented on a gross basis. The GST components of cash flows arising from investing or financing activities which are recoverable from, or payable to the tax authority, are presented as operating cash flows.
Commitments and contingencies are disclosed net of the amount of GST recoverable from, or payable to, the tax authority.
New Accounting Standards and Interpretations not yet mandatory or early adopted
Australian Accounting Standards and Interpretations that have recently been issued or amended but are not yet mandatory, have not been early adopted by the Group for the annual reporting period ended 31 December 2014. The Group’s assessment of the impact of these new or amended Accounting Standards and Interpretations, most relevant to the Group, are set out below.
AASB 9 Financial Instruments and its consequential amendmentsThese standards are applicable to annual reporting periods beginning on or after 1 January 2018. AASB 9 has been revised and reissued and completes the project to replace IAS 39 (AASB 139) ‘Financial Instruments: Recognition and Measurement’ and IAS 32 (AASB 132) ‘Financial instruments: Presentation’. The reissued standard supersedes the December 2009 (as amended) and December 2010 (as amended) versions of AASB 9. AASB 2014-7 makes consequential amendments to accounting standards and interpretations arising from the reissue of AASB 9.
AASB 9 introduces new classification and measurement models for financial assets. A financial asset shall be measured at amortised cost if the financial asset is held within a business model whose objective is to hold assets in order to collect contractual cash flows where the contractual cash flows arise on specified dates and are solely payments of principal and interest based on the principal outstanding. A financial asset shall be measured at fair value through other comprehensive income if the financial asset is held within a business model whose objective is to both hold assets in order to collect contractual cash flows (as per amortised cost) and sell financial assets. All other financial instrument assets are to be classified and measured at fair value through profit or loss unless the entity makes an irrevocable election on initial recognition to present gains and losses on equity instruments (that are not held-for-trading) in other comprehensive income. For financial liabilities, the standard requires the portion of the change in fair value that relates to the entity’s own credit risk to be presented in other comprehensive income (unless it would create an accounting mismatch). This removes situations where gains caused by a deterioration in own credit risk on financial liabilities held are no longer recognised in profit or loss. New hedge accounting requirements are intended to more closely align the accounting treatment with the risk management activities undertaken by entities enabling entities to better reflect these activities through enhanced disclosure.
New impairment requirements will use an ‘expected credit loss’ (‘ECL’) model to recognise an allowance meaning that it is no longer necessary for a credit event to have occurred before credit losses are recognised. This will therefore bring forward the timing of recognising impairment losses. Impairment will be measured at either an amount equal to the 12-month expected credit losses, being the portion of lifetime expected credit losses that represent the expected credit losses resulting from events of default that could occur within the 12 months of reporting date, or the full lifetime expected credit losses which are the expected credit losses that result from all possible default events over the expected life of the financial instrument. Expected credit losses shall be measured under the 12-month expected credit losses method unless the credit risk on a financial instrument has increased significantly since initial recognition in which case the lifetime expected credit loss method is adopted. The amendments add extensive new disclosures relating to the ECL provisions.
The Group will adopt these standards from 1 January 2018 but the impact of their adoption is not expected to be material.
Notes to the financial statementsAnnual Report 2014 |
Smartgroup Corporation Ltd | 77
Note 34. Other accounting policies (continued)
IFRS 15 Revenue from Contracts with CustomersThis standard is expected to be applicable to annual reporting periods beginning on or after 1 January 2017. The standard provides a single standard for revenue recognition. The core principle of the standard is that an entity will recognise revenue to depict the transfer of promised goods or services to customers in an amount that reflects the consideration to which the entity expects to be entitled in exchange for those goods or services.
The standard will require: contracts (either written, verbal or implied) to be identified, together with the separate performance obligations within the contract; determine the transaction price, adjusted for the time value of money excluding credit risk; allocation of the transaction price to the separate performance obligations on a basis of relative stand-alone selling price of each distinct good or service, or estimation approach if no distinct observable prices exist; and recognition of revenue when each performance obligation is satisfied. Credit risk will be presented separately as an expense rather than adjusted to revenue. For goods, the performance obligation would be satisfied when the customer obtains control of the goods. For services, the performance obligation is satisfied when the service has been provided, typically for promises to transfer services to customers. For performance obligations satisfied over time, an entity would select an appropriate measure of progress to determine how much revenue should be recognised as the performance obligation is satisfied. Contracts with customers will be presented in an entity’s statement of financial position as a contract liability, a contract asset, or a receivable, depending on the relationship between the entity’s performance and the customer’s payment. Sufficient quantitative and qualitative disclosure is required to enable users to understand the contracts with customers; the significant judgments made in applying the guidance to those contracts; and any assets recognised from the costs to obtain or fulfil a contract with a customer.
The Group will adopt this standard from 1 January 2017 but the impact of its adoption is yet to be assessed by the Group.
Smartgroup Corporation Ltd | 78
Annual Report 2014
Directors’ declaration
In the directors’ opinion:
• the attached financial statements and notes thereto comply with the Corporations Act 2001, the Accounting Standards, the Corporations Regulations 2001 and other mandatory professional reporting requirements;
• the attached financial statements and notes thereto comply with International Financial Reporting Standards as issued by the International Accounting Standards Board as described in note 1 to the financial statements;
• the attached financial statements and notes thereto give a true and fair view of the Group’s financial position as at 31 December 2014 and of its performance for the financial year ended on that date; and
• there are reasonable grounds to believe that the Company will be able to pay its debts as and when they become due and payable.
The directors have been given the declarations required by section 295A of the Corporations Act 2001.
Signed in accordance with a resolution of directors made pursuant to section 295(5)(a) of the Corporations Act 2001.
On behalf of the directors
Michael Carapiet Chairman
25 February 2015, Sydney
Smartgroup Corporation Ltd | 79
Annual Report 2014 |
PricewaterhouseCoopers, ABN 52 780 433 757 Darling Park Tower 2, 201 Sussex Street, GPO BOX 2650, SYDNEY NSW 1171 T: +61 2 8266 0000, F: +61 2 8266 9999, www.pwc.com.au
Liability limited by a scheme approved under Professional Standards Legislation.
Independent auditor’s report to the members of Smartgroup Corporation Ltd
Report on the financial report We have audited the accompanying financial report of Smartgroup Corporation Ltd (the company), which comprises the statement of financial position as at 31 December 2014, the statement of profit or loss and other comprehensive income, statement of changes in equity and statement of cash flows for the year ended on that date, a summary of significant accounting policies, other explanatory notes and the directors’ declaration for Smartgroup Corporation Ltd (the consolidated entity). The consolidated entity comprises the company and the entities it controlled at year’s end or from time to time during the financial year.
Directors’ responsibility for the financial report The directors of the company are responsible for the preparation of the financial report that gives a true and fair view in accordance with Australian Accounting Standards and the Corporations Act 2001 and for such internal control as the directors determine is necessary to enable the preparation of the financial report that is free from material misstatement, whether due to fraud or error. In Note 1, the directors also state, in accordance with Accounting Standard AASB 101 Presentation of Financial Statements, that the financial statements comply with International Financial Reporting Standards as issued by the International Accounting Standards Board.
Auditor’s responsibility Our responsibility is to express an opinion on the financial report based on our audit. We conducted our audit in accordance with Australian Auditing Standards. Those standards require that we comply with relevant ethical requirements relating to audit engagements and plan and perform the audit to obtain reasonable assurance whether the financial report is free from material misstatement.
An audit involves performing procedures to obtain audit evidence about the amounts and disclosures in the financial report. The procedures selected depend on the auditor’s judgement, including the assessment of the risks of material misstatement of the financial report, whether due to fraud or error. In making those risk assessments, the auditor considers internal control relevant to the consolidated entity’s preparation and fair presentation of the financial report in order to design audit procedures that are appropriate in the circumstances, but not for the purpose of expressing an opinion on the effectiveness of the entity’s internal control. An audit also includes evaluating the appropriateness of accounting policies used and the reasonableness of accounting estimates made by the directors, as well as evaluating the overall presentation of the financial report.
We believe that the audit evidence we have obtained is sufficient and appropriate to provide a basis for our audit opinion.
Independence In conducting our audit, we have complied with the independence requirements of the Corporations Act 2001.
Smartgroup Corporation Ltd | 80
Annual Report 2014 |
Auditor’s opinion In our opinion:
(a) the financial report of Smartgroup Corporation Ltd is in accordance with the Corporations Act 2001, including:
(i) giving a true and fair view of the consolidated entity's financial position as at 31 December 2014 and of its performance for the year ended on that date; and
(ii) complying with Australian Accounting Standards (including the Australian Accounting Interpretations) and the Corporations Regulations 2001.
(b) the financial report and notes also comply with International Financial Reporting Standards as disclosed in Note 1.
Report on the Remuneration Report We have audited the remuneration report included in pages 34 to 40 the directors’ report for the year ended 31 December 2014. The directors of the company are responsible for the preparation and presentation of the remuneration report in accordance with section 300A of the Corporations Act 2001. Our responsibility is to express an opinion on the remuneration report, based on our audit conducted in accordance with Australian Auditing Standards.
Auditor’s opinion In our opinion, the remuneration report of Smartgroup Corporation Ltd for the year ended 31 December 2014 complies with section 300A of the Corporations Act 2001.
PricewaterhouseCoopers
Scott Walsh Sydney Partner 25 February 2015
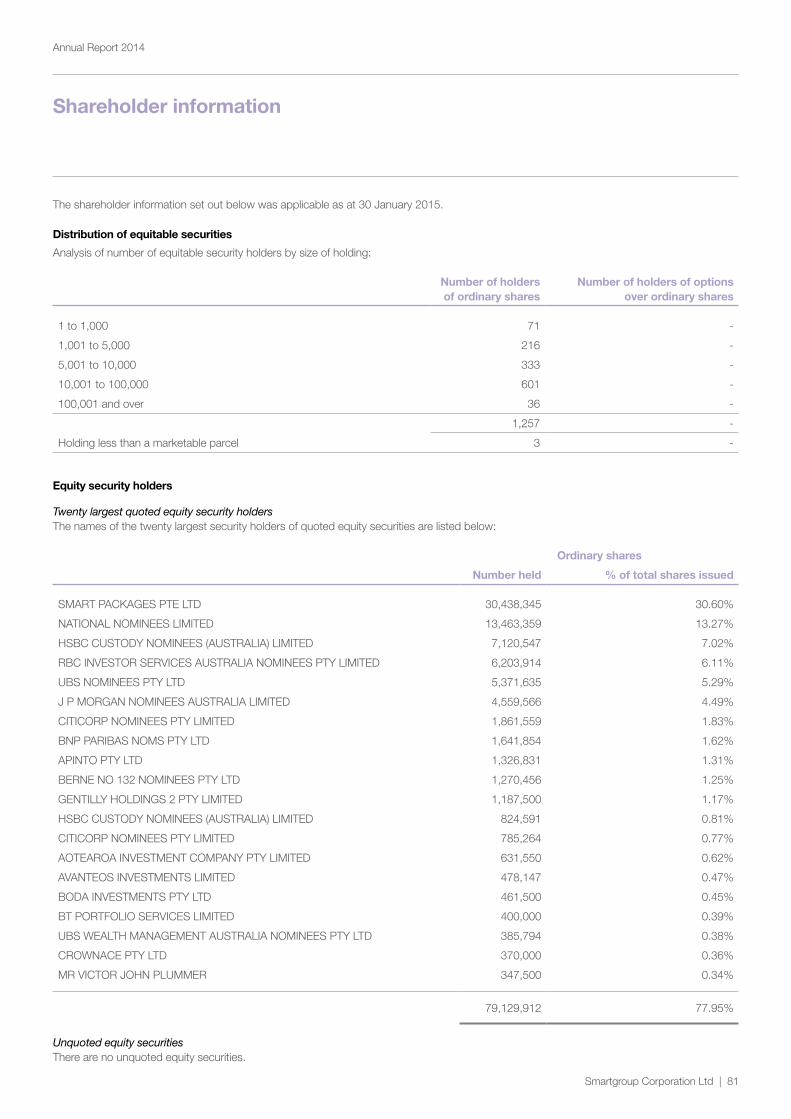
Smartgroup Corporation Ltd | 81
Annual Report 2014
Shareholder information
The shareholder information set out below was applicable as at 30 January 2015.
Distribution of equitable securities
Analysis of number of equitable security holders by size of holding:
Number of holders of ordinary shares
Number of holders of options over ordinary shares
1 to 1,000 71 -
1,001 to 5,000 216 -
5,001 to 10,000 333 -
10,001 to 100,000 601 -
100,001 and over 36 -
1,257 -
Holding less than a marketable parcel 3 -
Equity security holders
Twenty largest quoted equity security holdersThe names of the twenty largest security holders of quoted equity securities are listed below:
Ordinary shares
Number held % of total shares issued
SMART PACKAGES PTE LTD 30,438,345 30.60%
NATIONAL NOMINEES LIMITED 13,463,359 13.27%
HSBC CUSTODY NOMINEES (AUSTRALIA) LIMITED 7,120,547 7.02%
RBC INVESTOR SERVICES AUSTRALIA NOMINEES PTY LIMITED 6,203,914 6.11%
UBS NOMINEES PTY LTD 5,371,635 5.29%
J P MORGAN NOMINEES AUSTRALIA LIMITED 4,559,566 4.49%
CITICORP NOMINEES PTY LIMITED 1,861,559 1.83%
BNP PARIBAS NOMS PTY LTD 1,641,854 1.62%
APINTO PTY LTD 1,326,831 1.31%
BERNE NO 132 NOMINEES PTY LTD 1,270,456 1.25%
GENTILLY HOLDINGS 2 PTY LIMITED 1,187,500 1.17%
HSBC CUSTODY NOMINEES (AUSTRALIA) LIMITED 824,591 0.81%
CITICORP NOMINEES PTY LIMITED 785,264 0.77%
AOTEAROA INVESTMENT COMPANY PTY LIMITED 631,550 0.62%
AVANTEOS INVESTMENTS LIMITED 478,147 0.47%
BODA INVESTMENTS PTY LTD 461,500 0.45%
BT PORTFOLIO SERVICES LIMITED 400,000 0.39%
UBS WEALTH MANAGEMENT AUSTRALIA NOMINEES PTY LTD 385,794 0.38%
CROWNACE PTY LTD 370,000 0.36%
MR VICTOR JOHN PLUMMER 347,500 0.34%
79,129,912 77.95%
Unquoted equity securitiesThere are no unquoted equity securities.
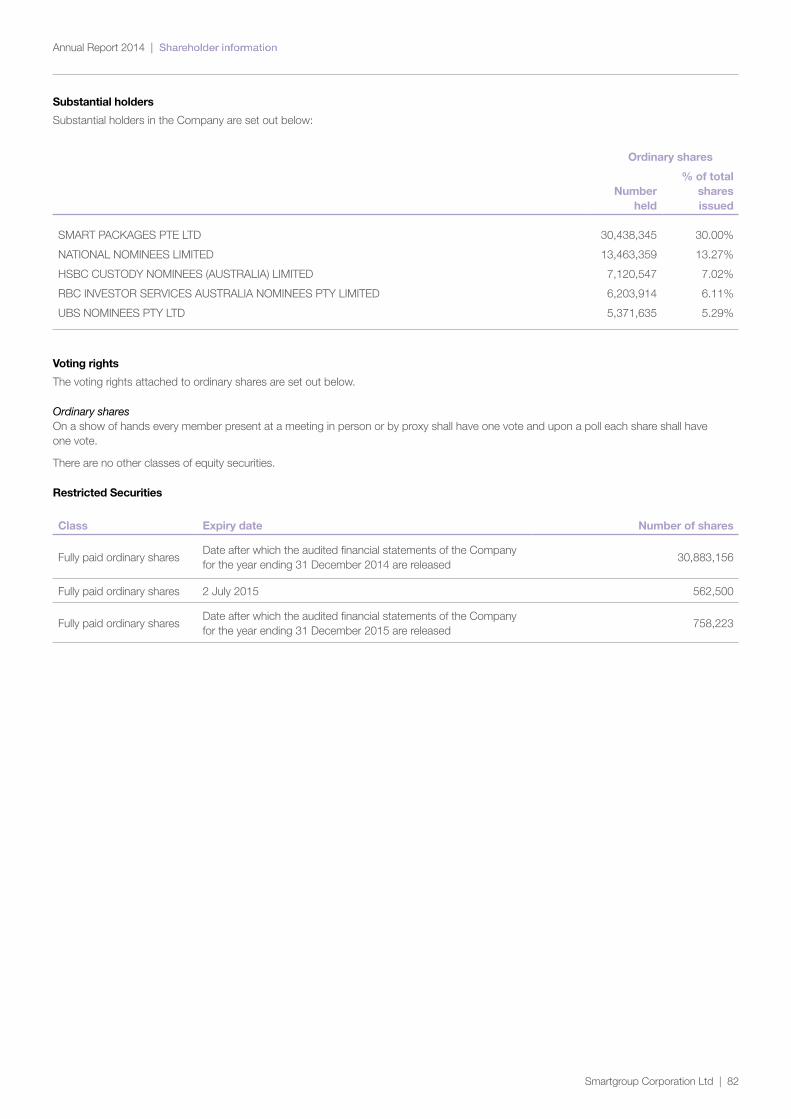
Smartgroup Corporation Ltd | 82
Annual Report 2014 |
Substantial holders
Substantial holders in the Company are set out below:
Ordinary shares
Number held
% of total shares issued
SMART PACKAGES PTE LTD 30,438,345 30.00%
NATIONAL NOMINEES LIMITED 13,463,359 13.27%
HSBC CUSTODY NOMINEES (AUSTRALIA) LIMITED 7,120,547 7.02%
RBC INVESTOR SERVICES AUSTRALIA NOMINEES PTY LIMITED 6,203,914 6.11%
UBS NOMINEES PTY LTD 5,371,635 5.29%
Voting rights
The voting rights attached to ordinary shares are set out below.
Ordinary sharesOn a show of hands every member present at a meeting in person or by proxy shall have one vote and upon a poll each share shall have one vote.
There are no other classes of equity securities.
Restricted Securities
Class Expiry date Number of shares
Fully paid ordinary sharesDate after which the audited financial statements of the Company for the year ending 31 December 2014 are released
30,883,156
Fully paid ordinary shares 2 July 2015 562,500
Fully paid ordinary sharesDate after which the audited financial statements of the Company for the year ending 31 December 2015 are released
758,223
Smartgroup Corporation Ltd | 83
Annual Report 2014
Corporate directory
Directors Michael Carapiet
Deven Billimoria
John Prendiville
Gavin Bell
Andrew Bolam
Company secretaries
Timothy Looi
Amanda Morgan
Notice of annual general meeting
The details of the annual general meeting of Smartgroup Corporation Ltd are: 11am on 23 April 2015 Smartgroup Corporation Ltd Level 8, 133 Castlereagh Street Sydney, NSW, Australia, 2000
Registered office Smartgroup Corporation Ltd Level 8, 133 Castlereagh Street Sydney, NSW, Australia, 2000 Tel: 1300 476 278
Principal place of business
Smartgroup Corporation Ltd Level 8, 133 Castlereagh Street Sydney, NSW, Australia, 2000
Share register LINK Market Services Limited Level 12, 680 George Street, Sydney, NSW, Australia, 2000 Tel: 1300 554 474
Auditor PricewaterhouseCoopers Darling Park Tower 2 201 Sussex Street Sydney, NSW, Australia, 2000
Solicitors Minter Ellison Lawyers Level 23, 525 Collins Street Melbourne, VIC, Australia, 3000 Tel: 03 8608 2000
Bankers Australia and New Zealand Banking Group Limited 242 Pitt Street Sydney, NSW, Australia, 2000
Stock exchange listing
Smartgroup Corporation Limited shares are listed on the Australian Securities Exchange (ASX code: SIQ)
Website www.smartgroup.com.au
Smartgroup Corporation LtdNational Head Offi ceLevel 8, 133 Castlereagh StreetSydney NSW 2000
smartgroup.com.au