Pacific Smiles Group Limited (ASX: PSQ) Appendix 4E...
59
Pacific Smiles Group Limited (ASX: PSQ) Appendix 4E Results for Announcement to the Market Reporting period: Year ended 30 June 2017 Previous corresponding period: Year ended 30 June 2016 Statutory Financial Results 30 Jun 17 30 Jun 16 Movement up/(down) $'000 $'000 $'000 % Revenue from ordinary activities 91,471 83,337 8,134 9.8% Profit from ordinary activities after tax attributable to members 10,037 9,903 134 1.4% Net profit attributable to members 10,037 9,903 134 1.4% Earnings per share (basic and diluted) - cents per share 6.6 6.5 0.1 1.4% Underlying Financial Results 30 Jun 17 30 Jun 16 Movement up/(down) $'000 $'000 $'000 % Revenue from ordinary activities 91,471 83,337 8,134 9.8% Profit from ordinary activities after tax attributable to members 10,286 10,158 128 1.3% Net profit attributable to members 10,286 10,158 128 1.3% Earnings per share (basic and diluted) - cents per share 6.8 6.7 0.1 1.3% Reconciliation from Statutory to Underlying Financial Results 30 Jun 17 $'000 30 Jun 16 $'000 Movement up/(down) $'000 % Statutory net profit after tax 10,037 9,903 134 1.4% Severance costs 356 - Major dental centre relocations – once-off costs - 364 Income tax effect of adjustments (107) (109) Underlying statutory net profit after tax 10,286 10,158 128 1.3% For further explanation of the statutory figures above refer to the accompanying Annual Report for the year ended 30 June 2017. For a review of the operations and activities for the year ended 30 June 2017, please refer to the Operating and Financial Review contained in the Annual Report. The Results Presentation released in conjunction with this Results Announcement will also provide further analysis of the results.
Transcript of Pacific Smiles Group Limited (ASX: PSQ) Appendix 4E...

Pacific Smiles Group Limited (ASX: PSQ)
Appendix 4E
Results for Announcement to the Market
Reporting period: Year ended 30 June 2017
Previous corresponding period: Year ended 30 June 2016
Statutory Financial Results 30 Jun 17 30 Jun 16 Movement up/(down)
$'000 $'000 $'000 %
Revenue from ordinary activities 91,471 83,337 8,134 9.8%
Profit from ordinary activities after tax attributable to members 10,037 9,903 134 1.4%
Net profit attributable to members 10,037 9,903 134 1.4%
Earnings per share (basic and diluted) - cents per share 6.6 6.5 0.1 1.4%
Underlying Financial Results 30 Jun 17 30 Jun 16 Movement up/(down)
$'000 $'000 $'000 %
Revenue from ordinary activities 91,471 83,337 8,134 9.8%
Profit from ordinary activities after tax attributable to members 10,286 10,158 128 1.3%
Net profit attributable to members 10,286 10,158 128 1.3%
Earnings per share (basic and diluted) - cents per share 6.8 6.7 0.1 1.3%
Reconciliation from Statutory to Underlying Financial Results 30 Jun 17 $'000
30 Jun 16 $'000
Movement up/(down) $'000 %
Statutory net profit after tax 10,037 9,903 134 1.4%
Severance costs 356 -
Major dental centre relocations – once-off costs - 364
Income tax effect of adjustments (107) (109)
Underlying statutory net profit after tax 10,286 10,158 128 1.3%
For further explanation of the statutory figures above refer to the accompanying Annual Report for the year ended
30 June 2017.
For a review of the operations and activities for the year ended 30 June 2017, please refer to the Operating and
Financial Review contained in the Annual Report. The Results Presentation released in conjunction with this
Results Announcement will also provide further analysis of the results.

Dividends Amount per
security (cps) Franked amount
Dividends paid
FY 2016 final dividend - paid 4 October 2016 3.50 100%
FY 2017 interim dividend – paid 1 April 2017 2.20 100%
Dividends declared
FY 2017 final dividend declared 3.70 100%
Record date 15 September 2017
Date payable 3 October 2017
The Company does not currently offer a dividend reinvestment plan.
Net Tangible Assets Per Security 30 Jun 17 30 Jun 16 Movement up/(down)
Cents Cents Cents %
Net tangible assets per ordinary security 21.63 20.72 0.91 4.4%
Independent Review by Auditor
The financial statements have been audited and an unqualified opinion has been issued. This is attached as part
of the Annual Report.
Annual General Meeting
Pacific Smiles Limited advises that its Annual General Meeting will be held on Monday 20 November 2017. The time and other details relating to the meeting will be advised in the Notice of Meeting to be sent to all shareholders and released to ASX immediately after dispatch. In accordance with the ASX Listing Rules and the Company’s Constitution, valid nominations for the position of director are required to be lodged at the registered office of the Company by 5:00pm (AEDT) Wednesday 27 September 2017.
Belinda Cleminson
Company Secretary
Pacific Smiles Group Limited
Date: 18 August 2017

Pacific Smiles Group Limited ABN 42 103 087 449
Annual Report
30 June 2017

PACIFIC SMILES GROUP LIMITED ANNUAL REPORT 2017 1
Table of Contents Page
Operating and Financial Review 2 Corporate Governance Statement 7 Directors’ Report 8
Remuneration Report 12
Auditor’s Independence Declaration 20 Financial Report
Consolidated Statement of Profit or Loss and Other Comprehensive Income 21
Consolidated Balance Sheet 22
Consolidated Statement of Changes in Equity 23 Consolidated Statement of Cash Flows 24 Notes to the Financial Statements 25 Directors’ Declaration 48
Independent Auditor’s Report 49 Shareholder Information 54
Corporate Directory 56

Operating and Financial Review For the year ended 30 June 2017
PACIFIC SMILES GROUP LIMITED ANNUAL REPORT 2017 2
Overview
Pacific Smiles Group Limited (Pacific Smiles) owns and operates 62 Pacific Smiles Dental Centres and 8 nib
Dental Care Centres in Queensland, New South Wales, Victoria and the ACT. Almost 350 dentists have
engaged Pacific Smiles as their serviced facility provider, practicing from one or more of the 70 facilities as
independent clinical practitioners.
The business model is relatively simple. Dentists devote their working days to clinical dentistry while
employees of Pacific Smiles take care of everything else such as administration, human resources, marketing,
facility management, stock ordering and IT systems management. Dentists pay Pacific Smiles a monthly
service fee for the range of business services provided.
An absolute commitment to outstanding patient care and customer service at dental centres operated by
Pacific Smiles is reflected in strong patient demand and in a high group-average Patient Net Promoter Score of
above 70. Convenient locations, extended opening hours and on-line appointments enhance patient access
and convenience and an outstanding in-centre experience underpins patient trust and loyalty.
Pacific Smiles expands its network of dental centres via a roll-out of new centres each year, typically in busy
retail hubs that are popular with the local community for shopping, dining, entertainment and other services.
The roll-out of new centres has been focused on suburban locations in Brisbane, Sydney, Melbourne and
Canberra over recent years.
Operations Overview and Highlights
During 2017, management added a total of eleven new Pacific Smiles Dental Centres and one new nib Dental
Centre, all in busy shopping centres and providing patient access seven-days-a-week. The eleven new Pacific
Smiles Dental Centres are at Mt Gravatt, Redbank Plains and Strathpine in South East Queensland, at Mill
Park, Mulgrave, Ringwood and Werribee in Victoria and at Belrose, Brookvale, Campbelltown and Marrickville
in New South Wales.
As has been the strategy for the last few years, the roll-out of new Pacific Smiles Dental Centres was focused
on existing and adjacent geographic regions to realise efficiencies and benefits in our operations and
marketing.
The new nib Dental Care Centre is at Erina on the Central Coast of New South Wales. The rationale underlying
the development of a new nib Centre in a region with an established network of Pacific Smiles Dental Centres
is linked to the refinement of the relationship with nib to position no-gap dental check-ups as a benefit
exclusively available to nib customers from nib branded Dental Care Centres. Both the nib Dental Care Centres
and the Pacific Smiles Dental Care Centres are now included in the nib First Choice provider network. While it
is too early to precisely predict the long-term impact of these changes, the no-gap check-up benefit, now
available exclusively at nib Dental Care Centres, should be very attractive to nib customers.
In addition to the accelerated new centre roll-out and the refinement of the nib arrangements, there were a
number of value-adding initiatives introduced during the year to enhance support and development of dentists
and to encourage more patients to attend our centres for their dental care requirements.
With regard to dentists, the inaugural dentist education and development conference was held, a bolstered
Dental Advisory Committee with elected dentist representatives was launched, as was a dentist graduate
development program with experienced mentor dentists. These enhancements to the value proposition for
dentists, have contributed to a 27% improvement in the 12 month rolling retention rate for dentists.
For patient attraction and retention the emphasis this year was on introducing solutions to help with the
affordability of dental care. This is in keeping with our True Purpose to improve the oral health of ALL
Australians to world’s best.

Operating and Financial Review For the year ended 30 June 2017
PACIFIC SMILES GROUP LIMITED ANNUAL REPORT 2017 3
This included collaborative marketing initiatives with nib and separately with Medibank and ahm to encourage
their customers to attend our centres to make use of no-gap benefits, if applicable. It also extended to
awareness campaigns in relation to the Child Dental Benefit Schedule, a program for which about 3 million
Australian children are eligible. Approximately 27,000 services were provided by dentists at dental centres
owned and operated by Pacific Smiles under this beneficial Commonwealth government program.
In addition, there was in-house development and piloting of a dental plan product for patients without private
health insurance and a new arrangement with zipmoney to allow patients access to interest-free funds for
required dental treatments. Both of these initiatives are in their formative stages and will be rolled out more
comprehensively in 2018.
Other key highlights of 2017 included the establishment of a central data warehouse for dental centre and
corporate data access and reporting. Completion of the data warehouse will allow faster and more effective
business insights and greater business efficiencies.
The two large dental centres acquired from Medibank Private and rebranded as Pacific Smiles Dental Centres
in 2014 and relocated during 2016 continued to underperform, although the centre now located in The Galeries
at Town Hall showed marked improvement towards the end of the year and is well positioned for growth in
2018. The Parramatta centre remains a challenge and we are continuing to explore ways to improve
performance of this centre.
Group Financial Performance Underlying Underlying Change
$ millions 2017 2016
Revenue 91.5 83.3 9.8%
Gross profit 85.9 78.5 9.4%
EBITDA 20.9 19.7 6.3%
EBIT 14.9 14.6 1.6%
Net profit after tax 10.3 10.2 1.3%
Operating metrics
Number of Dental Centres 70 58 20.7%
Commissioned Dental Chairs 276 243 13.6%
Patient Fees ($m) 147.0 133.8 9.8%
Same Centre Patient Fees growth 3.8% 5.0%
Financial metrics
Earnings per share (cents) 6.8 6.7 1.3%
EBITDA margin 22.9% 23.6%
EBITDA to Patient Fees margin 14.2% 14.7%
EBIT margin 16.3% 17.6%
Adjustments to the statutory income statement 2017 2016
$million $million
Statutory net profit after tax 10.0 9.9
Severance costs 0.4 -
Major dental centre relocations – once-off costs 0.4
Income tax effect of adjustments (0.1) (0.1)
Underlying statutory net profit after tax 10.3 10.2

Operating and Financial Review For the year ended 30 June 2017
PACIFIC SMILES GROUP LIMITED ANNUAL REPORT 2017 4
Statutory Results
The Group achieved statutory Net Profit After Tax of $10.0 million, up by 1% from $9.9 million in 2016.
During 2017, the statutory results were impacted by once-off severance costs and in 2016 by once–off
costs associated with two major dental centre relocations. To assist with the year to year comparison,
further discussion of the results in this Operating and Financial Review focuses on both the statutory and
the underlying results for 2017 and the comparative period.
Underlying and Statutory Results
Underlying EBITDA increased by 6.3% to $20.9 million compared with 2016 underlying EBITDA.
Underlying Net Profit After Tax of $10.3 million was 1% higher than the previous year due to the
accelerated rollout of new dental centres increasing depreciation by 20% in 2017.
Group revenue was $91.5 million, up by 9.8% over the previous financial year driven by higher service fee
revenue charged from dentists, off the back of the increased patient fees generated by the dentists
practising from our dental centres during the year. Same centre growth of 3.8%, plus a full year effect
from new centres opened in 2016 and part-year impact of new centre openings in 2017, resulted in patient
fees increasing 9.8% over the previous year to $147 million.
The Group’s underlying EBITDA to Patient fees margin in 2017 of 14.2% was slightly lower than the 14.7%
achieved in 2016. Although Pacific Smiles achieved strong same centre growth in 2017, this was lower
than expected due to the underperformance of the centres acquired from Medibank Private. They are
positive contributors, but at lower margins than is usual for large, mature centres and are therefore dilutive
to overall margin. The accelerated dental centre roll out strategy also impacts Group profitability in the
short term, as Pacific Smiles’ dental centres are typically not profitable in the first year of operation. The
2017 new openings have performed in line with expectations and like the centres opened in prior years,
will be strong contributors to long term growth and profit margins over time.
Financial Position
In line with Pacific Smiles long term growth strategy, total capital expenditure was $13.6 million, which
included $10.3 million for new dental centres and $1.1 million for additional surgeries in existing centres. In
2017 modest borrowings supplemented the strong operating cashflows and cash reserves to continue the
expansion of the dental centre network and upgrading of existing facilities, equipment and systems.
Pacific Smiles increased ordinary dividends with $8.7 million paid to shareholders compared with $8.1
million in ordinary dividends in FY2016. After considering the final dividend declared of 3.7 cents per share
in relation to 2017, which will be paid in October 2017, the dividend payout increased to 87.2% of
underlying Net Profit After Tax (2016 was 82.3% of underlying Net Profit After Tax).
The Market
The market for dental services in Australia is approximately $9b per annum and the market has grown
steadily over the long term. Funding for dental services is predominantly from individuals, however private
health insurance participation supports dental attendances and spending through co-payment
arrangements.
The industry is highly fragmented with the majority of providers operating from small scale single locations,
although corporate activity in the sector is increasing. There are more branded networks, including some

Operating and Financial Review For the year ended 30 June 2017
PACIFIC SMILES GROUP LIMITED ANNUAL REPORT 2017 5
owned and operated by private health insurance organisations, who market to their own members to
encourage them to attend.
During the year there was no material change to direct government funding to the private sector for
delivery of dental services. The Child Dental Benefit Schedule and some partnership arrangements with
the States and Territories, continue to be the main funding programs of the Commonwealth government,
albeit a very small proportion of the total market.
The other major feature of the market is the continued growth in the number of registered dentists. The
increase in recent years has been the combined impact of overseas trained dentists and local graduates.
The number of registered dentists was 16,684 in March 2017, up by 2.9% from a year earlier.
Business Strategy
Our True Purpose is to improve the oral health of ALL Australians to world’s best. From a business
strategy perspective, this means continued expansion of the two branded dental networks via a carefully
planned rollout strategy focused on busy community hubs such as popular shopping centres, which
patients can easily access to attend to their dental care needs. The roll-out strategy facilitates consistency
of operations and market positioning.
The rollout has been accelerated in recent years and this has delivered a multi-state presence at scale,
increasingly clustered in suburban locations around the capital cities of the eastern states. We anticipate
continued investment into these clusters via the development of new dental centres and commissioning of
additional dental chairs in existing centres.
Ultimately, business success depends on attracting and retaining patients and this is achieved through
innovative marketing, private health insurance collaboration, extended hours of operations, motivated and
caring staff and dentists and the delivery of a superior in-centre and post-visit experience. Initiatives in
these areas are very much the strategic focus for Pacific Smiles.
Outlook
The outlook is for a continued roll-out of branded dental centres in new and adjacent geographic clusters
throughout the eastern states and territories of Australia, as we scale to our long term dental network
potential of at least 250 centres. Ongoing refinement of site selection, centre presentation, patient
marketing and staff and dentist development and training will be the focus as we strive for continuous
improvement of the patient experience at our Pacific Smiles Dental Centres and nib Dental Care Centres.
We will continue to collaborate with private health insurers to encourage those with extras insurance to
attend the dentist regularly as an important part of their oral health program. We will also attract patients
without health insurance through payment plans and via government funding for those eligible. Accessible
locations, extended opening hours and affordable solutions, combined with a superior patient experience,
will deliver market share gain in the catchments we serve.
As we continue to scale and as recent years of new centre cohorts mature, we will generate increased
revenues and improved profitability. Corporate and operational efficiency gains will accrue from the
increased scale and through strategic investments in technology and process improvements, over time.
Pacific Smiles will pursue its true purpose of improving the oral health of ALL Australians to world’s best,
without compromising the professional and ethical standards that have defined the organisation from the
start.

Operating and Financial Review For the year ended 30 June 2017
PACIFIC SMILES GROUP LIMITED ANNUAL REPORT 2017 6
Risk Management
Pacific Smiles is subject to various risk factors, both business specific and of a general nature. Pacific
Smiles has not identified any specific, material exposure to its economic, social or environmental
sustainability over the long term.
Pacific Smiles has established policies and structures for oversight and management of material business
risks. Further information regarding how Pacific Smiles recognises and manages risks can be sourced
from our Corporate Governance Statement and related governance policies on our website.
The following risk areas and mitigating factors have been identified by Pacific Smiles:
Risk Area Mitigating Factors
General economic conditions – downturns in
general economic conditions could adversely
impact demand for dental services, given the
discretionary nature of some of those services.
Dentists at Pacific Smiles dental centres provide
a range of treatments to patients in a number of
different geographic zones throughout the
eastern states of Australia.
Reduction in private health insurance coverage –
changes to the nature or extent of private health
insurance coverage could impact upon the
attendance frequency of patients.
Patients at Pacific Smiles’ dental centres are a
mix of privately insured and non-insured
individuals and there are payment plans and
treatment payment options available.
Competition-induced fee pressure – an increase in
the number of practicing dentists could increase
competition for patients and the degree to which
dentists compete on the basis of fee levels.
Pacific Smiles’ dental centres are usually
differentiated from other local providers and
compete on the basis of convenience, value,
access and overall patient experience.
Termination of Service and Facility Agreements by
dentists - Under the Service and Facility
Agreements between Pacific Smiles and dentists,
the dentists may terminate without cause, on a few
months’ notice.
Pacific Smiles views the dentists as a key
customer group and focuses resources
accordingly, with increased focus on this area in
FY18.
Reputational damage – Actions by employees or
dentists could give rise to reputational damage to
Pacific Smiles and its brands.
There is a close focus on internal procedures and
clinical governance by management and the
Board. This has been further enhanced with new
internal and external appointments to the Dental
Advisory Committee.

Corporate Governance Statement For the year ended 30 June 2017
PACIFIC SMILES GROUP LIMITED ANNUAL REPORT 2017 7
Pacific Smiles Group Limited and the Board of Directors are committed to achieving and demonstrating the highest standards of corporate governance. Pacific Smiles Group Limited has reviewed its corporate governance practices against the Corporate Governance Principles and Recommendations (3
rd edition)
published by the ASX Corporate Governance Council. The 2017 corporate governance statement is dated as at 30 June 2017 and reflects the corporate governance practices in place for the 2017 financial year. The 2017 corporate governance statement was approved by the Board on 17 August 2017. A description of the Group’s current corporate governance practices is set out in the Group’s corporate governance statement which can be viewed at www.pacificsmilesgroup.com.au/Investors/CorporateGovernance.

Directors’ Report For the year ended 30 June 2017
PACIFIC SMILES GROUP LIMITED ANNUAL REPORT 2017 8
Your directors present their report on the consolidated entity (referred to hereafter as “the Group”) consisting of Pacific Smiles Group Limited (“the Company”) and the entities it controlled at the end of, or during the year ended 30 June 2017. Directors The following persons were directors of Pacific Smiles Group Limited during the whole of the financial year and up to the date of this report: Mr Robert Cameron AO
Mr John Gibbs Dr Alex Abrahams Mr Grant Bourke Mr Ben Gisz
Mr Simon Rutherford Principal Activities Pacific Smiles Group principally operates dental centres at which independent dentists practice and provide clinical treatments and services to patients. Revenues and profits are primarily derived from fees charged to dentists for the provision of these fully serviced dental facilities. Review of Operations Information on the operations and financial position of the Group and its business strategies and prospects is set out in the Operating and Financial Review accompanying this report. Dividends Dividends paid to members during the financial year were as follows: 2017 2016 $’000 $’000 Interim dividend for the year ended 30 June 2017 of 2.20 cents (2016 – 2.00 cents) per share
3,344 3,040
Final dividend for the year ended 30 June 2016 of 3.50 cents per share (2015 – 3.33 cents)
5,320 5,061
8,664 8,101
Subsequent to the end of the financial year, the Directors declared a final dividend of 3.70 cents per share in relation to the financial year ended 30 June 2017. The dividend, which totals $5.624 million, will be paid on 3 October 2017.

Directors’ Report For the year ended 30 June 2017
PACIFIC SMILES GROUP LIMITED ANNUAL REPORT 2017 9
Information on Directors Name Particulars
Robert Cameron AO Non-executive Chairman, appointed in 2003 BE Min (Hons) MBA Grad. Dip. Geoscience, FAICD, FAIM, FAusIMM
Member of the Nomination and Remuneration Committee Bob is the founder of Centennial Coal Company Limited and was its Managing Director and Chief Executive Officer until 2011 and Chairman from then till 31 March 2017. He is currently Chairman of County International Limited, Chairman of Hunter Valley Training Company, a Trustee of the University of NSW Foundation and the Museum of Applied Arts and Sciences. In addition to his extensive business career, he has served on many community, educational, industry and government bodies.
John Gibbs Managing Director and Chief Executive Officer, appointed in 2008 B.Bus, M.Bus. (Int. Mkg.), AFAIM, GAICD
John commenced as General Manager in 2004. His background experience includes the development and management of private health facilities and business development roles in medical and surgical device markets. He was involved in establishing new private hospitals in the Asia-Pacific region and private hospital projects in Australia. John has undergraduate and postgraduate business and marketing degrees.
Dr Alex Abrahams BDS (Syd Uni)
Founder and Executive Director, appointed in 2002 till 30 June 2017 Non-executive Director, appointed 1 July 2017
Alex has overseen the development of the Company from a group of partnerships to an incorporated entity on 1 January 2003. Alex is a dentist with a special interest in dental implants. Alex is a member of the Australian Dental Association and a member of the Australian Osseointegration Society (Implants). He is a director of Group Homes Australia Pty Limited and a Director of the Trustees of Canyon Property Trust and Key Health Unit Trust.
Grant Bourke BSc (Hons), MBA, MAICD
Non-executive Director, appointed in 2014 Member of the Audit and Risk Management Committee Member of the Nomination and Remuneration Committee Grant is an entrepreneur and investor, with a background in retailing and the food service industry. He is a Non-executive Director of Domino’s Pizza Enterprises Ltd and Domino’s Pizza Japan. Grant was deeply involved in the listing of Domino’s on the ASX in 2005. Grant’s involvement with Domino’s started as a successful franchisee. He sold his stores to Domino’s in exchange for a substantial shareholding, and then moved into senior executive positions within the Domino’s organisation. Prior to joining Domino’s, Grant worked in various technical, sales, and marketing roles in Australia, New Zealand and Japan.
Ben Gisz B.Comm., CA, FFin, CFA
Non-executive Director, appointed in 2012 Chairman of the Nomination and Remuneration Committee Member of the Audit and Risk Management Committee Ben is a partner at TDM Asset Management, a Sydney based private investment firm. Ben has extensive financial markets experience, including roles in investment banking and private equity/principal investments with Investec Group in Sydney and London. Prior to this, Ben was an equities analyst with Credit Suisse. Ben holds a Bachelor of Commerce degree from the University of Sydney and is a fellow of the Financial Services Institute of Australasia. Ben is also a chartered accountant and a CFA charter holder. Ben is a Non-executive Director of specialty retailer kikki.K Holdings Pty
Ltd.

Directors’ Report For the year ended 30 June 2017
PACIFIC SMILES GROUP LIMITED ANNUAL REPORT 2017 10
Information on Directors (continued) Name Particulars
Simon Rutherford B. Comm., CA, FAICD
Non-executive Director, appointed in 2003 Chairman of the Audit and Risk Management Committee
Simon is a chartered accountant and partner with PKF working in business advisory services. He is a director and responsible manager with PKF Corporate Finance Pty Limited and specialises in strategy, governance, structuring, business sales, mergers and acquisitions. In this role Simon has assisted various companies with capital raising, listing requirements and transactions. Simon is a director of Haemokinesis Pty Limited and the Trustee of Canyon Property Trust and is involved with other syndicated investments. He has also served on a number of boards including National Brokers Group and Vow Financial Group.
Company Secretary Jane Coleman held the position of Company Secretary from 2006 till 3 March 2017. Allanna Ryan, Acting Chief Financial Officer was the Acting Company Secretary from 3 March 2017 till 12th April 2017. From 12 April 2017 Mark Licciardo and Belinda Cleminson of Mertons Corporate Services (Mertons) were joint company secretaries. Mark is the founder of Mertons and a director of various Australian Stock Exchange (ASX) listed public and private companies. Belinda has extensive experience as a Company Secretary of Australian listed and unlisted companies including providing support to ASX 200 clients. Meetings of Directors The number of meetings of the Company’s Board of Directors held during the year ended 30 June 2017, and the attendances by each director were:
Meetings of Committees
Full Meetings of Directors Audit and Risk Management
Nomination and Remuneration
Held Attended Held Attended Held Attended
Robert Cameron AO
11 11 - - 4 4
John Gibbs 11 11 - - - -
Alex Abrahams 11 11 - - - -
Grant Bourke 11 11 3 3 4 4
Ben Gisz 11 11 3 3 4 4
Simon Rutherford 11 11 3 3 - -
- Not a member of the relevant committee Matters Subsequent to the End of the Financial Year Other than the declaration of a final dividend subsequent to the end of the financial year, no other matter or circumstance has arisen since 30 June 2017 that has significantly affected, or may significantly affect:
(a) the Group’s operations in future financial years, or (b) the results of those operations in future financial years, or (c) the Group’s state of affairs in future financial years.
Directors’ Report For the year ended 30 June 2017
PACIFIC SMILES GROUP LIMITED ANNUAL REPORT 2017 11
Likely Developments and Expected Results of Operations The Group will continue to pursue opportunities to enhance the growth and prosperity of its business. Refer to the Operating and Financial Review accompanying this report for further detail. Further information on likely developments in the operations of the Group and the expected results of operations have not been included in this annual financial report because the directors believe it would be likely to result in unreasonable prejudice to the Group. Environmental Regulation The Group’s operations are not regulated by any significant environmental regulation. Insurance of Officers and Auditors During the financial year, the Group paid a premium in respect of a contract insuring the directors and officers of the Group against liability incurred as such a director or officer, other than conduct involving a wilful breach of duty in relation to the Group, to the extent permitted by the Corporations Act 2001. The contract of insurance prohibits disclosure of the nature of the liability and the amount of the premium. No such insurance contracts entered into by the Group apply to insure auditors of the Group.

Directors’ Report For the year ended 30 June 2017
PACIFIC SMILES GROUP LIMITED ANNUAL REPORT 2017 12
Remuneration Report (Audited) This Directors 2017 Remuneration Report sets out remuneration information for Pacific Smiles Group Limited’s non-executive directors, executive directors and other key management personnel for the year ended 30 June 2017. The Remuneration Report is set out under the following headings: a) Key management personnel disclosed in this report b) Remuneration governance c) Executive remuneration policy and framework d) Relationship between remuneration and Pacific Smiles Group’s performance e) Non-executive director remuneration policy f) Details of remuneration g) Employment contracts h) Details of share based compensation i) Equity instruments held by key management personnel. The information provided in this remuneration report has been audited as required by section 308(3C) of the Corporations Act 2001. (a) Key management personnel disclosed in this report The key management personnel are all the directors of the Group and the executive managers within the Group who report directly to the Board or Chief Executive Officer, and have prime responsibility for significant functional areas within the Group. These directors and executives have been identified as having the greatest authority for the strategic direction and management of the Group. Non-executive Directors Robert Cameron AO Non-executive Chairman Grant Bourke Non-executive Director Ben Gisz Non-executive Director Simon Rutherford Non-executive Director Executive Directors
John Gibbs Managing Director and Chief Executive Officer Dr Alex Abrahams Executive Director (Non-executive from 1 July 2017) Other Executives Jane Coleman Allanna Ryan
Chief Financial Officer and Company Secretary (until 3 Mar 2017) Acting Chief Financial Officer (appointed 3 Mar 2017)
Paul Robertson Chief Operating Officer Dr Alison Hughes Principal Dental Officer Emma McKenny Executive Manager – People and Culture Peter McKinney Andrew Streat
Executive Manager – Business Development (until 18 Oct 2016) Executive Manager – Business Development (appointed 13 Jun 2017)
Where relevant, executive directors and other executives may hereafter be referred to collectively as executives within this remuneration report.

Directors’ Report For the year ended 30 June 2017
PACIFIC SMILES GROUP LIMITED ANNUAL REPORT 2017 13
(b) Remuneration governance The Nomination and Remuneration Committee is a committee of the Board. It is primarily responsible for making recommendations to the Board on:
the over-arching executive remuneration framework;
operation of the incentive plans which apply to the senior management team, including key performance indicators and performance hurdles;
remuneration packages for the chief executive officer, executive director and senior management; and
remuneration arrangements for non-executive directors.
The Committee’s objective is to ensure that remuneration policies and structures are fair and competitive and aligned with the long-term interests of the Group.
The Nomination and Remuneration Committee Charter, included on the Company’s website at www.pacificsmilesgroup.com.au provides further information on the role of this committee. (c) Executive remuneration policy and framework In determining executive remuneration, the Board aims to ensure that remuneration practices are:
competitive and reasonable, enabling the Group to attract and retain key talent;
aligned to the Group’s strategic and business objectives and the creation of shareholder value;
transparent; and
acceptable to shareholders.
The executive remuneration framework has three components:
base salary and benefits, including superannuation;
short-term performance incentives ('STI') plan; and
a long-term equity incentive (‘LTI’) plan.
Base salary and benefits Base salaries are reviewed annually or upon any substantial changes to positions. There are no guaranteed pay increases included in any key management personnel contracts. Base salary includes any elected salary sacrifice arrangements as individually nominated. Base salary is inclusive of required superannuation contributions. Short-term performance incentives Executives have the opportunity to earn an annual short-term incentive (STI) linked to the achievement of performance hurdles. The actual level of STI paid to each executive is determined at the end of the financial year based on the executives’ achievement of specific KPIs and an annual performance review. Targets are reviewed annually. The executive STI plan performance criteria are summarised below: % of Base Salary Achieve Group net profit before tax targets Up to 12.5% Individual performance metrics (financial and non-financial) Up to 7.5%
Maximum STI for full achievement of targets Up to 20.0% Exceptional performance bonus for over-achievement of net profit before tax target Up to 15.0%
Total maximum STI Up to 35.0%
Directors’ Report For the year ended 30 June 2017
PACIFIC SMILES GROUP LIMITED ANNUAL REPORT 2017 14
(c) Executive remuneration policy and framework (continued) Ongoing participation by executives in the STI plan is at the discretion of the Board. With reference to recommendations from the Nomination and Remuneration Committee, the Board will approve all executive STI payments, and may use its discretion to adjust STI remuneration up or down, to prevent any inappropriate reward outcomes. The STI amounts are paid in cash, and are those earned during the financial year and provided for in the annual financial statements. STI cash bonuses are generally payable in September following the end of the financial year, and once the financial results of the year have been subject to independent external audit. Long-term equity incentives The Group has a LTI plan to assist in the motivation, retention and reward of executives. The LTI plan is designed to align the interests of senior management more closely with the interests of shareholders by providing an opportunity for senior management to receive an equity interest in the Company through the granting of performance rights. Performance rights have been issued to selected senior managers pursuant to the LTI plan in financial years 2017, 2016 and 2015. Vesting of the performance rights on issue are subject to:
satisfaction of earnings per share (EPS) performance hurdles for a four year performance
period. The number of performance rights vesting will be determined on a sliding scale from nil
vesting for an EPS compound annual growth rate (CAGR) of 15.0% per annum or less and
100% vesting for an EPS CAGR of 25.0% per annum; and
the participant remaining employed by Pacific Smiles Group (or its subsidiaries) on the vesting
date, subject to certain “good leaver” exemptions.
Performance rights that do not vest on the relevant vesting date will lapse. Performance rights will also
lapse if total shareholder return (TSR) does not reach a minimum of 10.0% per annum over the relevant
performance period.
In the event of serious misconduct or a material misstatement in the Group’s financial statements, the Board may determine that certain performance-based remuneration (including STIs and/or LTIs) should not have been paid and may claw back performance-based remuneration paid in the preceding three financial years.

Directors’ Report For the year ended 30 June 2017
PACIFIC SMILES GROUP LIMITED ANNUAL REPORT 2017 15
(d) Relationship between remuneration and Pacific Smiles Group's performance
The following table shows key performance indicators for the Group over the last five years.
2017 2016 2015 2014 2013
$’000 $’000 $’000 $’000 $’000
Revenue 91,471 83,337 74,898 59,081 60,074
EBITDA (statutory) 20,552 19,306 16,409 15,069 12,921
Net profit after tax (statutory) 10,037 9,903 8,360 7,752 6,137
Dividends per share – ordinary (cps) 5.9 5.5 5.0 4.0 2.5
Dividends per share – special (cps) - - 1.6 7.3 -
Earnings per share (cents) 6.6 6.5 5.7 5.7 n/a
(e) Non-executive director remuneration policy Non-executive directors receive fees reflective of Board roles and market levels. These fees are inclusive of their relevant responsibilities as part of the main Board and on the various Board committees. Fees are inclusive of any applicable superannuation. These fees exclude any additional fees for special services which may be determined from time to time. No additional retirement benefits are payable. Non-executive directors do not receive performance-based compensation. The non-executive director fees are reviewed annually to ensure that the fees reflect market rates. There are no guaranteed annual increases in any directors’ fees. Non-executive directors are entitled to be reimbursed for their reasonable expenses incurred in connection with the affairs of the Company. The constitution of the Company provides that non-executive directors are entitled to receive compensation for their services as determined by approval at a general meeting. The current directors’ fees pool is an aggregate sum of $600,000. Any change to this aggregate annual amount is required to be approved by shareholders. The Board may approve additional remuneration for special exertions and additional services performed by a director outside of the aggregated pool. Remuneration paid to directors in their capacity as employees also falls outside of the aggregated pool.

Directors’ Report For the year ended 30 June 2017
PACIFIC SMILES GROUP LIMITED ANNUAL REPORT 2017 16
(f) Details of remuneration Details of the remuneration of the directors and other key management personnel of the Group for the current and prior financial year are set out in the following table.
2017
Short-term employee benefits
Long term benefits
Share based
payments
Salary and fees Bonus
Super-annuation
Other *
Long service leave Rights Total
$ $ $ $ $ $ $
Non-executive Directors
Robert Cameron 109,589 - 10,411 - - - 120,000
Grant Bourke 70,000 - - - - - 70,000
Ben Gisz 70,000 - - - - - 70,000
Simon Rutherford 70,000 - - - - - 70,000
Executive Directors
John Gibbs 385,006 16,400 19,616 - 6,667 (18,056) 409,633
Alex Abrahams 166,392 6,750 15,659 - 31,227 (9,860) 210,168
Other Key Management Personnel
Jane Coleman (until 3 Mar 2017) 257,274 - 22,046 225,000 3,654 (12,710) 495,264
Allanna Ryan (appointed 3 Mar 2017) 61,539 - 5,111 - 1,123 5,025 72,798
Paul Robertson 248,997 12,975 19,604 - 4,441 (7,743) 278,274
Alison Hughes 166,316 10,979 16,195 - 3,111 (2,770) 193,831
Emma McKenny 171,472 8,182 16,292 - 3,141 7,468 206,555
Peter McKinney (until 18 Oct 2016) 77,925 - 7,540 67,500 1,419 (23,536) 130,848
Andrew Streat (appointed 13 Jun 2017) 7,506 - 658 - 126 - 8,290
2016
Short-term employee benefits
Long term benefits
Share based
payments
Salary and fees Bonus
Super-annuation
Other *
Long service leave Rights Total
$ $ $ $ $ $
Non-executive Directors
Robert Cameron 110,010 - 10,451 - - - 120,461
Grant Bourke 70,000 - - - - - 70,000
Ben Gisz 70,000 - - - - - 70,000
Simon Rutherford 70,000 - - - - - 70,000
Executive Directors
John Gibbs 372,914 - 19,378 - 6,667 39,762 438,721
Alex Abrahams 147,744 - 13,828 - 2,466 18,574 182,612
Other Key Management Personnel
Jane Coleman 266,965 - 26,128 - 5,000 31,129 329,222
Paul Robertson 225,276 - 19,382 - 4,038 23,630 272,326
Alison Hughes 179,520 - 17,386 - 3,327 4,537 204,770
Emma McKenny 155,523 - 15,023 - 2,875 15,691 189,112
Peter McKinney 179,908 - 13,043 - 2,960 23,536 219,447

Directors’ Report For the year ended 30 June 2017
PACIFIC SMILES GROUP LIMITED ANNUAL REPORT 2017 17
* Other benefits include termination benefits paid to Jane Coleman and Peter McKinney in 2017. There were no termination benefits paid or payable to key management personnel during the previous financial year. STI awarded For each STI bonus included in the 2017 table above, the percentage of the available bonus that was earned in the financial year and the percentage that was forfeited because the person did not meet the target performance criteria are set out below.
Name % of Maximum STI Awarded Forfeited
John Gibbs 12% 88%
Alex Abrahams 11% 89%
Allanna Ryan 1 - -
Paul Robertson 14% 86%
Alison Hughes 16% 84%
Emma McKenny 12% 88%
Andrew Streat 2 - -
1 Allanna Ryan commenced as key management personnel with effect from 3 March 2017, and was not
eligible for an STI in her capacity as key management personnel during 2017. 2 Andrew Streat commenced as key management personnel with effect from 13 June 2017, and was not
eligible for an STI in his capacity as key management personnel during 2017.
(g) Employment contracts Remuneration and other terms of employment for the executives are formalised in employment contracts. The employment contracts specify the remuneration arrangements, benefits, notice periods and other terms and conditions. Participation in the STI and LTI arrangements are subject to the Board’s discretion. The current executive contracts do not have fixed terms. Contracts may be terminated by the executive with notice, or by the Company with notice or by payment in lieu of notice, or with immediate effect in circumstances involving serious or wilful misconduct.
Executive Termination Notice by Executive
Termination Notice or Payment in Lieu of Notice by
Company
John Gibbs 9 months 12 months
Alex Abrahams 3 months 6 months
Paul Robertson 3 months 3 months
Alison Hughes 3 months 6 months
Emma McKenny 3 months 3 months
Andrew Streat 3 months 3 months
(h) Details of share based compensation Performance Rights Under the LTI plan, performance rights have been granted to the executive directors and certain executives. These performance rights will vest after four years (the performance period), and are conditional on the achievement of relevant performance and service conditions.
Grant Date Number of Rights Granted
Fair Value per Right at
Grant Date Vesting Date
21 November 2014 2,137,500 $0.51 21 November 2018
30 November 2015 1,725,000 $0.89 30 November 2019
30 November 2016 2,200,000 $0.76 30 November 2020

Directors’ Report For the year ended 30 June 2017
PACIFIC SMILES GROUP LIMITED ANNUAL REPORT 2017 18
(i) Equity instruments held by key management personnel The tables below show the number of shares and performance rights in the Company that were held during the financial year by key management personnel, including their close family members and entities related to them. No amounts remain unpaid in respect of ordinary shares at the end of the financial year. There were no shares granted during the reporting period as compensation, or on exercise of an option or right. Ordinary Shares
2017 Balance at start of year
1
Net change Balance at end of year
Robert Cameron AO 3,383,258 - 3,383,258
Grant Bourke 1,538,462 - 1,538,462
Ben Gisz 19,712,581 - 19,712,581
Simon Rutherford 1,741,017 - 1,741,017
John Gibbs 6,500,000 - 6,500,000
Alex Abrahams 39,913,361 (1,740,000) 38,173,361
Jane Coleman 1,400,000 - 1,400,000
Paul Robertson 300,000 - 300,000
Alison Hughes 15,860,190 - 15,860,190
2016 Balance at start of year
Net change Balance at end of year
Robert Cameron AO 3,383,258 - 3,383,258
Grant Bourke 1,538,462 - 1,538,462
Ben Gisz 24,407,982 (4,695,401) 19,712,581
Simon Rutherford 1,741,017 - 1,741,017
John Gibbs 6,500,000 - 6,500,000
Alex Abrahams 39,643,361 270,000 39,913,361
Jane Coleman 1,400,000 - 1,400,000
Paul Robertson 337,500 (37,500) 300,000
Alison Hughes 15,860,190 - 15,860,190
1 A subdivision of capital on 9 October 2014 resulted in the conversion of each one ordinary share into three ordinary shares. The balance at the start of the year has been restated and presented on a post share-split basis to assist with comparability.
Performance Rights
2017 Balance at start of year
Net Change Balance at end of year
(all unvested)
John Gibbs 1,175,000 500,000 1,675,000
Alex Abrahams 562,500 225,000 787,500
Jane Coleman 906,250 400,000 1,306,250
Paul Robertson 693,750 350,000 1,043,750
Alison Hughes 225,000 175,000 400,000
Emma McKenny 300,000 250,000 550,000
Peter McKinney 450,000 (450,000) -
Allanna Ryan - 100,000 100,000

Directors’ Report For the year ended 30 June 2017
PACIFIC SMILES GROUP LIMITED ANNUAL REPORT 2017 19
2016 Balance at start of year
Net Change Balance at end of year
(all unvested)
John Gibbs 675,000 500,000 1,175,000
Alex Abrahams 337,500 225,000 562,500
Jane Coleman 506,250 400,000 906,250
Paul Robertson 393,750 300,000 693,750
Alison Hughes 225,000 - 225,000
Emma McKenny - 300,000 300,000
Peter McKinney - 450,000 450,000
This concludes the remuneration report, which has been audited. Non-audit Services Details of the amounts paid or payable to the auditor for non-audit services providing during the financial year by the auditor are outlined in note 22 to the financial report. Auditor’s Independence Declaration A copy of the auditor’s independence declaration as required under section 307C of the Corporations Act 2001 is set out on page 20. Rounding of Amounts The Company is of a kind referred to in ASIC Corporations (Rounding in Financial/Directors’ Reports) Instrument 2016/191 (Rounding instrument). Pursuant to this instrument, amounts in the Directors’ Report and financial report have been rounded off to the nearest thousand dollars, or in certain cases, to the nearest dollar. This report is made in accordance with a resolution of the Board of Directors.
Robert Cameron AO Chairman Greenhills 17 August 2017

Auditor’s Independence Declaration
PACIFIC SMILES GROUP LIMITED ANNUAL REPORT 2017 20
Lead Auditor’s Independence Declaration
under Section 307C of the Corporations Act
2001
To the Directors of Pacific Smiles Group Limited
I declare that, to the best of my knowledge and belief, in relation to the audit of Pacific Smiles Group
Limited for the financial year ended 30 June 2017 there have been:
i. no contraventions of the auditor independence requirements as set out in the
Corporations Act 2001 in relation to the audit; and
ii. no contraventions of any applicable code of professional conduct in relation to the
audit.
KPMG
Chris Allenby Partner
Sydney
17 August 2017

Consolidated Statement of Profit or Loss and Other Comprehensive Income For the year ended 30 June 2017
PACIFIC SMILES GROUP LIMITED ANNUAL REPORT 2017 21
2017 2016 Notes $’000 $’000
Revenue 2 91,471 83,337 Direct expenses (5,559) (4,794)
85,912 78,543 Other income 3 1,181 1,645 Expenses Consumable supplies expenses (7,416) (7,027) Employee expenses (38,373) (35,154) Occupancy expenses (10,224) (9,277) Marketing expenses (1,757) (1,664) Administration and other expenses (8,771) (7,760) Depreciation and amortisation expense 4 (6,042) (5,031) Net finance costs 4 (172) (22)
Profit before income tax 14,338 14,253 Income tax expense 5 (4,301) (4,350) Profit for the year 10,037 9,903
Other comprehensive income - -
Total comprehensive income for the year 10,037 9,903
Cents Cents Earnings per share Basic earnings per share 20 6.6 6.5 Diluted earnings per share 20 6.6 6.5
The above Consolidated Statement of Profit or Loss and Other Comprehensive Income should be read in conjunction with the accompanying notes.

Consolidated Balance Sheet As at 30 June 2017
PACIFIC SMILES GROUP LIMITED ANNUAL REPORT 2017 22
2017 2016 Notes $’000 $’000 ASSETS Current Assets Cash and cash equivalents 7 5,880 6,100 Receivables 8 972 1,335 Current tax receivable 16 67 17 Inventories 9 2,891 2,506 Other 10 693 174
Total Current Assets 10,503 10,132
Non-Current Assets Property, plant and equipment 11 41,930 34,185 Intangible assets 12 11,409 11,475 Deferred tax assets 13 4,353 4,235
Total Non-Current Assets 57,692 49,895
Total Assets 68,195 60,027
LIABILITIES Current Liabilities Payables 14 9,842 8,554 Borrowings 15 - 150 Provisions 17 3,018 3,206
Total Current Liabilities 12,860 11,910
Non-Current Liabilities Borrowings 15 5,000 - Deferred tax liabilities - 255 Provisions 17 6,046 4,894
Total Non-Current Liabilities 11,046 5,149
Total Liabilities 23,906 17,059
Net Assets 44,289 42,968
EQUITY Contributed equity 18 35,053 35,053 Reserves 19 172 224 Retained profits 9,064 7,691 Total Equity 44,289 42,968
The above Consolidated Balance Sheet should be read in conjunction with the accompanying notes.

Consolidated Statement of Changes in Equity For the year ended 30 June 2017
PACIFIC SMILES GROUP LIMITED ANNUAL REPORT 2017 23
Contributed
equity Reserves Retained profits Total equity
Notes $’000 $’000 $’000 $’000 Consolidated Balance at 30 June 2015 35,053 67 5,889 41,009
Total comprehensive income for the year - - 9,903 9,903
Transactions with owners of the Company, recognised directly in equity: Dividends provided for or paid 6(a) - - (8,101) (8,101) Share based payments charge – performance rights 19 - 157 - 157
- 157 (8,101) (7,944) Consolidated Balance at 30 June 2016 35,053 224 7,691 42,968
Total comprehensive income for the year - - 10,037 10,037
Transactions with owners of the Company, recognised directly in equity: Dividends provided for or paid 6(a) - - (8,664) (8,664) Share based payments charge – performance rights 19 - (52) - (52)
- (52) (8,664) (8,716)
Consolidated Balance at 30 June 2017 35,053 172 9,064 44,289
The above Consolidated Statement of Changes in Equity should be read in conjunction with the accompanying notes.

Consolidated Statement of Cash Flows For the year ended 30 June 2017
PACIFIC SMILES GROUP LIMITED ANNUAL REPORT 2017 24
2017 2016
Notes $’000 $’000
Cash flows from operating activities
Receipts from customers 101,541 92,991 Payments to suppliers and employees (79,528) (74,429)
22,013 18,562 Interest received 42 227 Interest and finance costs paid (210) (204) Income taxes paid (4,725) (5,532)
Net cash inflow from operating activities 29(a) 17,120 13,053
Cash flows from investing activities Payments for property, plant and equipment (13,569) (14,217) Proceeds from disposal of property, plant and equipment 43 49
Net cash outflow from investing activities (13,526) (14,168)
Cash flows from financing activities Proceeds from borrowings 5,000 - Repayment of borrowings (150) (244) Dividends paid 6(a) (8,664) (8,101)
Net cash outflow from financing activities (3,814) (8,345)
Net decrease in cash and cash equivalents (220) (9,460)
Cash and cash equivalents at the beginning of the financial year 7 6,100 15,560
Cash and cash equivalents at the end of the financial year 7 5,880 6,100
The above Consolidated Statement of Cash Flows should be read in conjunction with the accompanying notes.

Notes to the Consolidated Financial Statements 30 June 2017
PACIFIC SMILES GROUP LIMITED ANNUAL REPORT 2017 25
1. Summary of Significant Accounting Policies (a) Corporate Information The financial statements are for the consolidated entity consisting of Pacific Smiles Group Limited (“the Company”) and its subsidiaries (“the Group”). Pacific Smiles Group Limited is a public company limited by shares, incorporated and domiciled in Australia. On 21 November 2014 the Company was listed on the ASX. Its registered office and its principal place of business are located at 6 Molly Morgan Drive, Greenhills, New South Wales. A description of the nature of the consolidated entity’s operations and its principal activities is included in the Directors’ Report on pages 8 to 19, which is not part of this financial report. The financial report is presented in Australian Dollars, which is the Company’s functional currency. The financial report was authorised for issue by the Directors on 17 August 2017. The Company has the power to amend and reissue the financial report. (b) Basis of Preparation Statement of Compliance The principal accounting policies adopted in preparation of these consolidated financial statements are set out below. These policies have been consistently applied to all the years presented, unless otherwise stated. These general purpose financial statements have been prepared in accordance with Australian Accounting Standards (AASBs) adopted by the Australian Accounting Standards Board (AASB) and the Corporations Act 2001. Pacific Smiles Group Limited is a for-profit entity for the purpose of preparing the financial statements. The financial statements also comply with International Financial Reporting Standards (IFRS) adopted by the International Accounting Standards Board (IASB). Historical Cost Convention These financial statements have been prepared on an accruals basis and are based on historical costs, modified where applicable, by the measurement at fair value of selected non-current assets, financial assets and financial liabilities. Critical Accounting Estimates and Judgements The preparation of financial statements requires the use of certain critical accounting estimates. It also requires management to exercise its judgement in the process of applying the Group’s accounting policies. The areas involving a higher degree of judgement or complexity, or areas where assumptions and estimates are significant to the financial statements include asset impairment testing. New Accounting Standards and Accounting Interpretations The Group has adopted all of the new and revised standards issued by the Australian Accounting Standards Board that are relevant to its operations and effective for the reporting period. Details of the impact of the adoption of these new accounting standards, where applicable, are set out in the individual accounting policy notes.
Certain new accounting standards and interpretations have been published by the Australian Accounting Standards Board that are not mandatory for 30 June 2017 reporting periods and have not been adopted early by the Group. The Group’s assessment of the impact of these new standards and interpretations is set out below. AASB 15 Revenue from Contracts with Customers is effective for annual reporting periods beginning on or after 1 January 2018. The Group is not required to adopt this new standard until the annual reporting period ending 30 June 2019 and currently has no intention of adopting this standard earlier. The potential impact of the standard has been assessed at this stage as minimal.
Notes to the Consolidated Financial Statements 30 June 2017
PACIFIC SMILES GROUP LIMITED ANNUAL REPORT 2017 26
1. Summary of Significant Accounting Policies (continued) (b) Basis of Preparation (continued) AASB 16 Leases is effective for annual reporting periods beginning on or after 1 January 2019. The Group is not required to adopt this new standard until the annual reporting period ending 30 June 2020 and currently has no intention of adopting this standard earlier. The Group is assessing the potential impact of the application of AASB 16 on its financial statements, including the potential impact of the various transition provisions available to the Group. On a high level basis, if the Group was to adopt AASB 16 as at 30 June 2017, the present value of the future minimum lease payments for non-cancellable operating leases as noted in note 24(b) would be recognised as a financial liability in the consolidated balance sheet, and under one of the transition provisions available to the Group, it would recognise a corresponding amount as a right-of-use asset. AASB 9 Financial Instruments is effective for annual reporting periods beginning on or after 1 January 2018. The Group is not required to adopt this new standard until the annual reporting period ending 30 June 2019 and currently has no intention of adopting this standard earlier. It includes revised guidance on the classification and measurement of financial instruments, a new expected credit loss model for calculating impairment on financial assets, and new general hedge accounting requirements. The potential impact of the standard has yet to be assessed, but the impact is expected to be minimal. There are no other such standards that are not yet effective and that are expected to have a material impact on the Group in the current or future reporting periods and on foreseeable future transactions. (c) Basis of Consolidation The consolidated financial statements incorporate the assets and liabilities of all subsidiaries of Pacific Smiles Group Limited (“Company” or “parent entity”) as at 30 June 2017 and the results of all subsidiaries for the year then ended. Pacific Smiles Group Limited and its subsidiaries together are referred to in this financial report as the “Group” or the “consolidated entity”. Subsidiaries are entities controlled by the Group. The Group controls an entity when it is exposed to, or has rights to, variable returns from its involvement with the entity and has the ability to affect those returns through its power over the entity. The financial statements of subsidiaries are included in the consolidated financial statements from the date on which control commences until the date on which control ceases. Subsidiaries are fully consolidated from the date on which control is transferred to the Group. The acquisition method of accounting is used to account for business combinations by the Group (refer to note 1(h)). Intercompany transactions, balances and unrealised gains on transactions between Group companies are eliminated. Unrealised losses are also eliminated unless the transaction provides evidence of the impairment of the asset transferred. Accounting policies of subsidiaries are consistent with the policies adopted by the Group. Investments in subsidiaries are accounted for at cost in the individual financial statements of the parent entity. (d) Segment Reporting Operating segments are reported in a manner consistent with the internal reporting provided to the chief operating decision maker. The chief operating decision maker is responsible for allocating resources and assessing performance of the operating segments. (e) Revenue Recognition Revenue is recognised at the fair value of consideration received or receivable. Revenue from the rendering of services is recognised once the services have been provided and is measured in accordance with contractual calculation methods and rates.

Notes to the Consolidated Financial Statements 30 June 2017
PACIFIC SMILES GROUP LIMITED ANNUAL REPORT 2017 27
1. Summary of Significant Accounting Policies (continued) (e) Revenue Recognition (continued) Revenue from the sale of goods is net of returns, discounts and other allowances, and is recognised when the significant risks and rewards of ownership of the goods have passed to the buyer. Risks and rewards of ownership are considered to pass to the buyer at the time when control of the goods passes to the customer in the case of the supply of non-customised products, or at the time a significant monetary deposit is taken in the case of customised products. Government subsidies are recognised at their fair value where there is reasonable assurance that the subsidy will be received and the Group will comply with all attached conditions. Interest income is recognised as it accrues in profit and loss. (f) Income Tax The income tax expense for the period is the tax payable on the current period’s taxable income based on the applicable income tax rate for each jurisdiction adjusted by changes in deferred tax assets and liabilities attributable to temporary differences between the tax bases of assets and liabilities and their carrying amounts in the financial statements. The current income tax charge is calculated on the basis of the tax laws enacted or substantively enacted at the end of the reporting period in the jurisdictions where the Company and its subsidiaries operate and generate taxable income. Management periodically evaluates positions taken in tax returns with respect to situations in which applicable tax regulation is subject to interpretations. It establishes provisions where appropriate on the basis of amounts expected to be paid to the tax authorities. Deferred income tax is provided in full, using the liability method, on temporary differences arising between the tax bases of assets and liabilities and their carrying amounts in the consolidated financial statements. However, the deferred income tax is not accounted for if it arises from initial recognition of an asset or liability in a transaction other than a business combination that at the time of the transactions affects neither accounting nor taxable profit or loss. Deferred income tax is determined using tax rates and laws that have been enacted or substantially enacted by the end of the reporting period and are expected to apply when the related deferred income tax asset is realised or the deferred income tax liability is settled. Deferred tax assets are recognised for deductible temporary differences and unused tax losses only if it is probable that future taxable amounts will be available to utilise those temporary differences and losses. Deferred tax assets and liabilities are not recognised for temporary differences between the carrying amount and tax bases of investments in controlled entities where the parent entity is able to control the timing of the reversal of the temporary differences and it is probable that the differences will not reverse in the foreseeable future. Deferred tax assets and liabilities are offset when there is a legally enforceable right to offset current tax assets and liabilities and when the deferred tax balances relate to the same taxation authority. Current tax assets and liabilities are offset where the entity has a legally enforceable right to offset and intends to either settle on a net basis, or to realise the asset and settle the liability simultaneously. Current and deferred tax is recognised in profit or loss, except to the extent that it relates to items recognised in other comprehensive income or directly in equity. In this case, the tax is also recognised in other comprehensive income or directly in equity, respectively. (g) Leases Leases of property, plant and equipment where the Group, as lessee, has substantially all the risks and rewards of ownership are classified as finance leases. Finance leases are capitalised at the lease inception at the lower of the fair value of the lease asset and the present value of the minimum lease payments. The corresponding rental obligations, net of finance charges, are included in borrowings. Each lease payment is allocated between the liability and finance charges so as to achieve a constant rate of the finance balance outstanding.

Notes to the Consolidated Financial Statements 30 June 2017
PACIFIC SMILES GROUP LIMITED ANNUAL REPORT 2017 28
1. Summary of Significant Accounting Policies (continued) (g) Leases (continued) The interest element of the finance cost is charged to the profit and loss over the lease period so as to produce a constant periodic rate of interest on the remaining balance of the liability for each period. The property, plant and equipment acquired under finance leases are depreciated over the shorter of the asset’s useful life and the lease term. Leases in which a significant portion of the risks and rewards of ownership are not transferred to the Group as lessee are classified as operating leases. Payments made under operating leases, net of incentives received from the lessor, are charged to profit and loss on a straight-line basis over the period of the lease. Lease income from operating leases where the Group is a lessor is recognised in income on a straight-line basis over the lease term. (h) Business Combinations The acquisition method of accounting is used to account for all business combinations. Cost is measured as the fair value of the assets given, equity instruments issued or liabilities incurred or assumed. The consideration also includes the fair value of any asset or liability resulting from a contingent consideration arrangement. Acquisition-related costs are expensed as incurred. Identifiable assets acquired and liabilities and contingent liabilities assumed in a business combination are measured initially at their fair values at the acquisition date. The excess of the cost of acquisition over the fair value of the Group’s share of the identifiable net assets acquired is recorded as goodwill (refer to note 1(n)). Where contingent consideration is classified as a financial liability and amounts are subsequently re-measured to fair value, changes in fair value are recognised in profit and loss. (i) Impairment of Assets Goodwill and intangible assets that have an indefinite useful life are not subject to amortisation and are tested at least annually for impairment. Other assets, including those that are subject to depreciation or amortisation are reviewed for impairment whenever events or changes in circumstances indicate that the carrying amount may not be recoverable. An impairment loss is recognised for the amount by which the asset’s carrying amount exceeds its recoverable amount. The recoverable amount is the higher of an asset’s fair value less costs to sell and value in use. For the purposes of assessing impairment, assets are grouped at the lowest levels for which there are separately identifiable cash flows which are largely independent of the cash flows from other assets or groups of assets (cash generating units). Non-financial assets other than goodwill that suffered an impairment are reviewed for possible reversal of the impairment at each reporting date. Cash inflows considered for the purposes of impairment testing are discounted to present value. Significant judgment has been used in testing assets for impairment and in determining the amounts recognised as impairment losses at reporting date. Further details of any material impairment losses recognised in the financial statements are provided in the notes dealing with the relevant asset category. (j) Cash and Cash Equivalents Cash and cash equivalents includes cash on hand, deposits held at call with financial institutions, other short-term, highly liquid investments with original maturities of three months or less that are readily convertible to known amounts of cash and which are subject to an insignificant risk of changes in value.

Notes to the Consolidated Financial Statements 30 June 2017
PACIFIC SMILES GROUP LIMITED ANNUAL REPORT 2017 29
1. Summary of Significant Accounting Policies (continued) (k) Receivables Receivables are recognised initially at fair value and subsequently measured at amortised cost, less provision for impairment if applicable. The amount of the impairment loss is recognised in profit and loss with other expenses. When a receivable for which an impairment allowance had been recognised becomes uncollectible in a subsequent period, it is written off against the allowance account. Subsequent recoveries of amounts previously written off are credited against other expenses in profit and loss. (l) Inventories Inventories held for sale and stores of consumable supplies are stated at the lower of cost and net realisable value. Costs are assigned to individual items of inventory on the basis of actual costs. Net realisable value is the estimated selling price less estimated costs associated with the sale. (m) Property, Plant and Equipment All property, plant and equipment are stated at historical cost less depreciation, amortisation and accumulated impairment losses. Subsequent costs are included in the asset’s carrying amount or recognised as a separate asset, as appropriate, only when it is probable that future economic benefits associated with the item will flow to the Group and the cost of the item can be measured reliably. All other repairs and maintenance are charged to profit and loss during the reporting period in which they are incurred. Depreciation is calculated using the straight line method to allocate the cost of assets, net of their residual values, over their estimated useful lives, as follows: Leasehold improvements 10 to 20 years Plant and equipment 3 to 10 years The assets’ residual values and useful lives are reviewed, and adjusted if appropriate, at the end of each reporting period. An asset’s carrying amount is written down immediately to its recoverable amount if the asset’s carrying amount is greater than its estimated recoverable amount (refer to note 1(i)). (n) Intangible Assets Goodwill Goodwill represents the excess of the cost of an acquisition over the fair value of the Group’s share of the net identifiable assets of the acquired business at the date of acquisition. Goodwill on acquisitions of businesses is included in intangible assets. Goodwill acquired in business combinations is not amortised. Instead, goodwill is tested for impairment annually or more frequently if events or changes in circumstances indicate that it might be impaired, and is carried at cost less accumulated impairment losses. Goodwill is allocated to relevant cash-generating units (CGU) for the purpose of impairment testing. Rights and Licences Contractual rights and licences have a finite useful life and are carried at cost less accumulated amortisation and impairment losses. Amortisation is calculated using the straight line method to allocate the cost of the rights and licences over their estimated useful lives, being fifteen years.
Notes to the Consolidated Financial Statements 30 June 2017
PACIFIC SMILES GROUP LIMITED ANNUAL REPORT 2017 30
1. Summary of Significant Accounting Policies (continued) (o) Payables These amounts represent liabilities for goods and services provided to the Group prior to the end of the financial year which are unpaid. (p) Borrowings Borrowings are measured at amortised cost. Borrowing costs are expensed as incurred. Borrowings are classified as current liabilities unless the Group has an unconditional right to defer settlement of the liabilities for at least 12 months after the reporting period. (q) Employee Benefits The employee benefits provisions cover the Group’s liability for employees’ annual leave and long service leave entitlements. Short-term Obligations Short-term employee benefit obligations are measured on an undiscounted basis and are expensed as the related service is provided. The liabilities are measured at the amounts expected to be paid when the liabilities are settled. The liability for annual leave is recognised in the provision for employee benefits. All other short-term employee benefit obligations are presented as payables. Long-term Obligations The Group's net obligation in respect of long-term employee benefits is the amount of future benefit that employees have earned in return for their service in the current and prior periods. Consideration is given to expected future wage and salary levels, experience of employee departures and periods of service. The benefit is discounted to determine its present value. Re-measurements are recognised in profit or loss in the period in which they arise. The obligations are presented as a current liability in the balance sheet if the Group does not have an unconditional right to defer settlement for at least twelve months after the reporting date, regardless of when the actual settlement is expected to occur. Share Based Payments Share-based compensation benefits are provided to selected employees via a Long Term Incentive plan (LTI plan). Further information on the LTI plan is set out in note 21. The fair value of performance rights granted under the LTI plan is recognised as an employee benefits expense with a corresponding increase in equity. The total amount to be expensed is determined by reference to the fair value of the performance rights granted, which includes any market performance conditions and the impact of any non-vesting conditions but excludes the impact of any service and non-market performance vesting conditions. Non-market vesting conditions are included in assumptions about the number of performance rights that are expected to vest. The total expense is recognised over the vesting period, which is the period over which all of the specified vesting conditions are satisfied. At the end of each period, the Company revises its estimates of the number of performance rights that are expected to vest based on the non-market vesting conditions. It recognises the impact of the revision to original estimates, if any, in profit or loss, with a corresponding adjustment to equity.

Notes to the Consolidated Financial Statements 30 June 2017
PACIFIC SMILES GROUP LIMITED ANNUAL REPORT 2017 31
1. Summary of Significant Accounting Policies (continued) (r) Provisions A provision is recognised if, as a result of a past event, the Group has a present legal or constructive obligation that can be estimated reliably, and it is probable that an outflow of economic benefits will be required to settle the obligation. Provisions are determined by discounting the expected future cash flows at a pre-tax rate that reflects current market assessments of the time value of money and the risks specific to the liability. Make Good Provision The Group is required to restore most leased premises to their original condition at the end of their respective lease terms. A provision has been recognised for the present value of the estimated expenditure required to remove any leasehold improvements and repair any associated damage. These costs have been capitalised as part of the cost of leasehold improvements and are amortised over the shorter of the term of the lease or the useful life of the assets. Onerous Contracts A provision for onerous contracts is recognised when the expected benefits to be derived by the Group from a contract are lower than the unavoidable cost of meeting its obligations under the contract. The provision is measured at the present value of the lower of the expected cost of terminating the contract and the expected net cost of continuing with the contract. Before a provision is established, the Group recognises any impairment loss on the assets associated with that contract. Restructuring A provision for restructuring is recognised when the Group has approved a detailed and formal restructuring plan, and the restructuring has either commenced or has been announced. Future operating losses are not provided for. (s) Dividends Provision is made for the amount of any dividend declared on or before the end of the financial year but not distributed at balance date. (t) Earnings Per Share Basic earnings per share Basic earnings per share is calculated by dividing:
the profit attributable to owners of the Company, excluding any costs of servicing equity other than ordinary shares
by the weighted average number of ordinary shares outstanding during the financial year, adjusted for bonus elements in ordinary shares issued during the year.
Diluted earnings per share Diluted earnings per share adjusts the figures used in the determination of basic earnings per share to take into account:
the after income tax effect of interest and other financial costs associated with dilutive potential ordinary shares, and
the weighted average number of additional ordinary shares that would have been outstanding assuming the conversion of all dilutive potential ordinary shares.
(u) Goods and Services Tax (GST) Revenues, expenses and assets are recognised net of the amount of GST, except where the amount of GST incurred is not recoverable from the taxation authority. In these circumstances, the GST is recognised as part of the cost of acquisition of the asset or as part of an item of expense. Receivables and payables in the balance sheet are shown inclusive of GST. Cash flows are presented in the cash flow statement on a gross basis, except for the GST component of investing and financing activities, which are disclosed as operating cash flows.

Notes to the Consolidated Financial Statements 30 June 2017
PACIFIC SMILES GROUP LIMITED ANNUAL REPORT 2017 32
1. Summary of Significant Accounting Policies (continued)
(v) Rounding of Amounts The Company is of a kind referred to ASIC Corporations (Rounding in Financial/Directors’ Reports) Instrument 2016/191 (Rounding instrument). Pursuant to this instrument, amounts in the Directors’ Report and financial report have been rounded off to the nearest thousand dollars, or in certain cases, to the nearest dollar. (w) Parent Entity Financial Information The financial information for the parent entity, Pacific Smiles Group Limited, disclosed in note 30 has been prepared on the same basis as the consolidated financial statements, except as set out below. Investments in subsidiaries Investments in subsidiaries are accounted for at cost in the financial statements of Pacific Smiles Group Limited. Tax consolidation legislation Pacific Smiles Group Limited and its wholly-owned Australian controlled entities have implemented the tax consolidation legislation. The head entity, Pacific Smiles Group Limited, and the controlled entities in the tax consolidated group account for their own current and deferred tax amounts. These tax amounts are measured as if each entity in the tax consolidated group continues to be a stand-alone taxpayer in its own right. In addition to its own current and deferred tax amounts, Pacific Smiles Group Limited also recognises the current tax liabilities (or assets) and the deferred tax assets arising from unused tax losses and unused tax credits assumed from controlled entities in the tax consolidated group. The entities have also entered into a tax funding agreement under which the wholly–owned entities fully compensate Pacific Smiles Group Limited for any current tax payable assumed and are compensated by Pacific Smiles Group Limited for any current tax receivable and deferred tax assets relating to unused tax losses or unused tax credits that are transferred to Pacific Smiles Group Limited under the tax consolidation legislation. The funding amounts are determined by reference to the amounts recognised in the wholly-owned entities’ financial statements. Assets or liabilities arising under tax funding agreements with the tax consolidated entities are recognised as current amounts receivable from or payable to other entities in the Group. Any difference between the amounts assumed and amounts receivable or payable under the tax funding agreement are recognised as a contribution to (or distribution from) wholly-owned tax consolidated entities.

Notes to the Consolidated Financial Statements 30 June 2017
PACIFIC SMILES GROUP LIMITED ANNUAL REPORT 2017 33
2017 2016 $’000 $’000 2. Revenue Services rendered 90,967 82,864 Sale of goods 504 473
91,471 83,337
3. Other Income Rents 1,168 1,582 Sundry income 13 63
1,181 1,645
4. Expenses Profit before income tax includes the following specific expenses: Employee benefits – share based payments expense (52) 157 Depreciation and amortisation
Plant and equipment 3,252 2,915 Leasehold improvements 2,724 2,050
Total Depreciation 5,976 4,965
Amortisation
Rights and licences 66 66
Total Amortisation 66 66
Net profit on disposal of non-current assets (8) (22) Impairment loss on write-down of assets to recoverable amount
Receivables – other entities 25 23 Net finance costs
Interest and finance charges paid/payable 210 204 Interest received/receivable (38) (182)
Total net finance costs 172 22
Defined contribution superannuation plans expense 3,067 2,790

Notes to the Consolidated Financial Statements 30 June 2017
PACIFIC SMILES GROUP LIMITED ANNUAL REPORT 2017 34
2017 2016 $’000 $’000 5. Income Tax Expense Current tax 4,674 4,572 Deferred tax (373) (222)
4,301 4,350
Profit before income tax expense 14,338 14,253
Income tax calculated at 30% (2016: 30%) 4,301 4,277 Tax effect of amounts which are not deductible/(taxable) in calculating taxable income:
Share based payments (16) 47 Sundry items 16 26
Income tax expense 4,301 4,350
6. Dividends (a) Dividends paid during the year: Interim dividend for the year ended 30 June 2017 of 2.20 cents (2016 – 2.00 cents) per share, fully franked 3,344 3,040
Final dividend for the year ended 30 June 2016 of 3.50 cents (2015 – 3.33 cents) per share, fully franked
5,320 5,061
8,664 8,101
(b) Dividends declared but not recognised at the end of the year: The Directors have declared the payment of a final dividend of 3.7 cents (2016 – 3.50 cents) per share, fully franked. 5,624 5,320
It is expected to be paid on 3 October 2017 out of retained earnings at 30 June 2017, but not recognised as a liability at year end. (c) Franking credits available for subsequent financial years based on tax rate of 30% (2016: 30%) 10,045
7,475
The above amounts represent the balance of the franking account as at the end of the financial year, adjusted for franking credits that will arise from the payment of the amount of income tax payable or collection of income tax receivable. The consolidated amount includes franking credits that would be available to the parent entity if distributed profits of subsidiaries were paid as dividends.

Notes to the Consolidated Financial Statements 30 June 2017
PACIFIC SMILES GROUP LIMITED ANNUAL REPORT 2017 35
2017 2016 $’000 $’000 7. Cash and Cash Equivalents CURRENT Cash at bank and in hand 5,880 6,100
8. Receivables CURRENT Trade debtors 529 651 Provision for doubtful debts (81) (94)
448 557 Sundry debtors 524 778
972 1,335
9. Inventories CURRENT Inventories – at cost 2,891 2,506
10. Other Assets CURRENT Prepayments 595 76 Other 98 98
693 174
11. Property, Plant and Equipment NON-CURRENT Leasehold improvements – at cost 40,323 32,948 Less accumulated depreciation and impairment (12,008) (10,282)
28,315 22,666
Plant and equipment – at cost 33,401 28,558 Less accumulated depreciation and impairment (19,786) (17,039)
13,615 11,519
Total property, plant and equipment 41,930 34,185

Notes to the Consolidated Financial Statements 30 June 2017
PACIFIC SMILES GROUP LIMITED ANNUAL REPORT 2017 36
11. Property, Plant and Equipment (continued) Movements in Carrying Amounts 2017 Leasehold
improvements $’000
Plant and equipment
$’000
Total
$’000 Carrying amount at the beginning of the year 22,666 11,519 34,185 Additions 8,380 5,377 13,757 Disposals (7) (29) (36) Depreciation expense (2,724) (3,252) (5,976)
Carrying amount at the end of the year 28,315 13,615 41,930
2016 Leasehold
improvements $’000
Plant and equipment
$’000
Total
$’000 Carrying amount at the beginning of the year 15,415 9,191 24,606 Additions 9,261 5,310 14,571 Disposals 40 (67) (27) Depreciation expense (2,050) (2,915) (4,965)
Carrying amount at the end of the year 22,666 11,519 34,185
2017
2016 $’000 $’000 12. Intangible Assets NON-CURRENT Goodwill 12,517 12,517 Less accumulated amortisation and impairment (1,892) (1,892)
10,625 10,625
Rights and licences 985 985 Less accumulated amortisation and impairment (201) (135)
784 850
Total intangible assets 11,409 11,475
Movements in Carrying Amounts 2017 Goodwill
$’000
Rights and licences
$’000
Total
$’000 Carrying amount at the beginning of the year 10,625 850 11,475 Amortisation - (66) (66)
Carrying amount at the end of the year 10,625 784 11,409
2016 Goodwill
$’000
Rights and licences
$’000
Total
$’000 Carrying amount at the beginning of the year 10,625 916 11,541 Amortisation - (66) (66)
Carrying amount at the end of the year 10,625 850 11,475

Notes to the Consolidated Financial Statements 30 June 2017
PACIFIC SMILES GROUP LIMITED ANNUAL REPORT 2017 37
12. Intangible Assets (continued) Impairment testing for cash generating units (CGUs) For the purposes of impairment testing, the carrying amount of goodwill has been allocated to groups of CGUs as follows: 2017 2016 $’000 $’000
New South Wales 5,548 5,548
Victoria 2,631 2,631
Queensland 2,446 2,446
10,625 10,625
The impairment assessments for each CGU are made on the basis of the assets’ expected value in use and involve the use of key assumptions. Recoverable amounts of the CGUs exceeded their carrying values, and therefore no impairment losses were recorded in the year. The calculations use discounted cash flow projections covering a ten year period, which is consistent with the typical lease term entered into for the Group’s dental centre locations. The cash flows for years one to five are based on detailed management projections, which consider historical financial results and trends, the Board-approved financial budget for the next financial year and reasonable expectations regarding future business and market circumstances. Cash flows beyond the first five year period are extrapolated using an estimated growth rate of 5%. A longer term growth rate of 2.5% is used in determining the terminal values, which is considered reasonable in the context of the long term growth rates for the markets in which each CGU operates. Future cash flows are discounted using the Group’s weighted average cost of capital of 9.8% (2016: 9.7%).
2017 2016 $’000 $’000 13. Deferred Tax Assets
NON-CURRENT The balance comprises temporary differences attributable to:
Provision for doubtful debts 29 28 Depreciation of property, plant and equipment 1,658 1,478
Accrued expenses 204 139 Prepayments 339 509 Provisions 2,358 2,078 Intangibles (235) - Other - 3
Deferred tax assets 4,353 4,235
14. Payables
CURRENT Trade payables and accruals – related entities 14 40 Trade payables and accruals – other entities 9,828 8,514
9,842 8,554

Notes to the Consolidated Financial Statements 30 June 2017
PACIFIC SMILES GROUP LIMITED ANNUAL REPORT 2017 38
2017 2016 $’000 $’000 15. Borrowings CURRENT Secured: Bank loans - 150
Total - 150
NON-CURRENT Secured:
Bank bills 5,000 -
Total 5,000 -
Security Bank bills, bank loans and asset finance provided by the bank are secured by registered equitable mortgage over the whole of the assets and undertakings of the Group, including uncalled capital and inter-entity guarantees. Financing Arrangements Access was available at balance date to the following lines of credit:
Total bank borrowings facilities 14,500 12,950 Used at balance date (7,490) (2,412)
Unused at balance date 7,010 10,538
Covenants attached to bank borrowings were complied with during the year. Further details on financing facilities are included in note 27. 16. Current Tax Receivable CURRENT Income tax receivable 67 17

Notes to the Consolidated Financial Statements 30 June 2017
PACIFIC SMILES GROUP LIMITED ANNUAL REPORT 2017 39
2017 2016 $’000 $’000 17. Provisions
CURRENT Employee benefits 2,848 2,801 Straight-line operating lease adjustment 170 127 Other - 278
3,018 3,206
NON-CURRENT Employee benefits 935 902 Straight-line operating lease adjustment 3,255 2,323 Make good provision 1,856 1,669
6,046 4,894
Movements: Employee
Benefits
$’000
Straight-line Lease
Adjustment $’000
Make Good
Provision $’000
Other
$’000
Total
$’000 Balance at the beginning of the year 3,703 2,450 1,669 278 8,100 Additional provisions charged 2,273 1,308 187 (62) 3,706 Amounts used (2,193) (333) - (216) (2,742)
Balance at the end of the year 3,783 3,425 1,856 - 9,064
2017 2016 $’000 $’000 18. Contributed Equity (a) Share Capital Ordinary shares – fully paid 35,053 35,053
(b) Movements in Share Capital
Number of Shares $’000
Balance 30 June 2016
151,993,395
35,053
Balance 30 June 2017
151,993,395
35,053
(c) Ordinary Shares Fully paid ordinary shares – Ordinary shares participate in dividends and the proceeds on winding up of the Company in proportion to the number of shares held. At shareholders’ meetings, each ordinary share is entitled to one vote when a poll is called, otherwise each shareholder has one vote on a show of hands. (d) Capital Management The Group’s objectives when managing capital are to safeguard its ability to continue as a going concern so that it can continue to provide returns for shareholders and benefits for other stakeholders, maintain sufficient financial flexibility to pursue its growth objectives, and maintain an optimal capital structure to reduce the cost of capital.

Notes to the Consolidated Financial Statements 30 June 2017
PACIFIC SMILES GROUP LIMITED ANNUAL REPORT 2017 40
2017 2016 $’000 $’000 19. Reserves Share based payments reserve 172 224
20. Earnings Per Share Profit attributable to the ordinary equity holders of the Company used in calculating basic and diluted earnings per share
10,037
9,903
Shares Shares Weighted average number of ordinary shares used as the denominator in calculating basic and diluted earnings per share
151,993,395
151,993,395
Cents Cents Basic earnings per share 6.6 6.5 Diluted earnings per share 6.6 6.5 Information Concerning the Classification of Shares (i) Performance Rights Performance rights granted to employees under the Company’s long term incentive plan are considered to be potential ordinary shares and are only included in the determination of diluted earnings per share to the extent to which they are dilutive. The total 6,062,500 performance rights on issue are not included in the calculation of diluted earnings per share because they are contingently issuable ordinary shares and conditions were not satisfied at 30 June 2017. These performance rights could potentially dilute basic earnings per share in the future.
21. Share Based Payments
(a) Long Term Incentive Plan Overview
The Group has established a LTI plan to assist in the motivation, retention and reward of senior
management. The LTI plan is designed to align the interests of senior management more closely with the
interests of shareholders by providing an opportunity for senior management to receive an equity interest
in the Company through the granting of performance rights.

Notes to the Consolidated Financial Statements 30 June 2017
PACIFIC SMILES GROUP LIMITED ANNUAL REPORT 2017 41
21. Share Based Payments (continued)
Performance rights have been issued to selected senior managers pursuant to the LTI plan in financial
years 2017, 2016 and 2015.
The performance rights will vest for a set term (the performance period), and are conditional on the
achievement of relevant performance and service conditions. Vesting of the performance rights will be
subject to:
satisfaction of earnings per share (EPS) performance hurdles for a four year performance period.
The number of performance rights vesting will be determined on a sliding scale from nil vesting for
an EPS compound annual growth rate (CAGR) of 15.0% per annum or less and 100% vesting for
an EPS CAGR of 25.0% per annum; and
the participant remaining employed by Pacific Smiles Group (or its subsidiaries) on the vesting
date, subject to certain “good leaver” exemptions.
Performance rights that do not vest on the relevant vesting date will lapse. Performance rights will also
lapse if total shareholder return (TSR) does not reach a minimum of 10.0% per annum over the relevant
performance period.
(b) Performance Rights
Balance at 1 July 2016
Granted Forfeited, lapsed or vested
Balance at 30 June 2017
21 November 2014 2,137,500 - - 2,137,500 30 November 2015 2,175,000 - (450,000) 1,725,000 30 November 2016 - 2,200,000 - 2,200,000
Total 4,312,500 2,200,000 (450,000) 6,062,500
(c) Fair Value of Performance Rights Granted
The fair values at grant dates have been determined via pricing models which use a Monte Carlo simulation, and take into account the following inputs:
2017 2016
Grant Date 30 November 2016 30 November 2015 Fair value of right $0.76 $0.89 Share price at grant date $2.15 $2.25 Exercise price Nil Nil Term 4 years 4 years Expected price volatility 30% 30% Expected dividend yield 4.0% 4.0% Risk free interest rate 2.00% 3.10%
2017
2016 $’000 $’000 22. Remuneration of Auditors Audit and review of financial statements 119 118 Non-audit services:
Tax compliance and advisory services 22 41
141 159

Notes to the Consolidated Financial Statements 30 June 2017
PACIFIC SMILES GROUP LIMITED ANNUAL REPORT 2017 42
2017 2016 $’000 $’000 23. Contingencies
Bank guarantees 2,490 2,262
The bank guarantees at the end of the financial year relate to security provided under operating leases for premises.
24. Commitments
(a) Capital Commitments Capital expenditure contracted for at the reporting date but not recognised as liabilities is as follows:
Property, plant and equipment
Payable within one year 2,172 1,006
(b) Operating Lease Commitments Non-cancellable operating leases contracted for at the reporting date but not recognised as liabilities are as follows:
Payable within one year 9,629 7,762 Payable later than one year but not later than five years 35,200 29,113 Payable later than five years 26,721 23,359
71,550 60,234
Operating leases relate to rented premises. Leases have various terms, including some options to extend the terms. 25. Subsidiaries The parent entity within the Group is Pacific Smiles Group Limited. The consolidated financial statements incorporate the assets, liabilities and results of the following subsidiaries in accordance with the accounting policy described in note 1(c):
Name of Entity Country of
incorporation Class of shares Equity holding
2017 2016 % %
Dentist Smiles Group Pty Limited Australia Ordinary 100 100 Dental Assistant Training Solutions Pty Limited * Australia Ordinary 100 100 Pacific Eyes Pty Limited * Australia Ordinary 100 100 Dentalwise Pty Limited ** Australia Ordinary 100 100
* No longer trading ** Subsidiary has not traded since incorporation. Name changed from Pacific Medical Care Pty Limited 5 September 2016.
Notes to the Consolidated Financial Statements 30 June 2017
PACIFIC SMILES GROUP LIMITED ANNUAL REPORT 2017 43
26. Related Party Disclosures (a) Key Management Personnel Compensation
2017
2016 $ $
Short-term employment benefits 2,050,434 1,982,479 Long-term benefits 54,909 27,333 Termination benefits 292,500 - Share-based payments (62,182) 156,859
2,335,661 2,166,671
Detailed remuneration disclosures are provided in the Remuneration Report within the Directors’ Report. (b) Related Party Transactions Other than remuneration for their positions as directors and executives of the Company, key management personnel or entities related to them entered into a number of transactions with the Company. Information on these transactions is set out below. Key management personnel or their related parties held shares in the Company during 2017 and 2016, and as such, participated in dividends. Bislab Pty Limited ATF the Canyon Property Trust, an entity related to Alex Abrahams and Simon Rutherford, provided premises rental to the Company during 2017 and 2016 on normal commercial terms and conditions. Exandal Investments, an entity related to Alex Abrahams and Alison Hughes, leased business premises to the Company during 2017 and 2016 on normal commercial terms and conditions. 88 Park Avenue Pty Limited ATF the Key Health Unit Trust, an entity related to Alex Abrahams, leased business premises to the Company during 2017 and 2016 on normal commercial terms and conditions. The Company received fees for the provision of services to Alex Abrahams during 2017 and 2016 under normal terms and conditions of dental service and facility agreements.
The aggregate amounts of each of the above types of transactions were: 2017 2016 $ $
Dividends paid 3,943,492 3,796,304 Revenues from rendering services 87,910 203,429 Rental expenses 1,228,256 1,248,014 Marketing expenses - 3,391 Employee expenses - 11,377

Notes to the Consolidated Financial Statements 30 June 2017
PACIFIC SMILES GROUP LIMITED ANNUAL REPORT 2017 44
27. Financial Risk Management Financial Risk Management Objectives The Group’s activities expose it to a variety of financial risks: market risk (interest rate risk), credit risk and liquidity risk. The Board has overall responsibility for the establishment and oversight of the risk management framework, and is supported by the Board Audit and Risk Management Committee. Senior management develops and monitors risk management policy, and reports regularly to the Directors on issues and compliance matters. Risk management principles and systems are reviewed regularly to reflect changes in market conditions and the Group’s activities. The Group’s principal financial instruments during the 2017 and 2016 financials years comprised bank bills, bank and other loans, and cash. The main purpose of these instruments has been to raise finance for the Group’s operations and investments. The Group has various other financial instruments such as trade and other debtors and creditors, which arise directly from its operations. The Group does not trade in financial instruments. Market Risk The Group’s exposure to market risk for changes in interest rates at the end of the year was minimal, with cash balances mostly offset by bank debt at 30 June. Cash balances are held in a combination of short term fixed interest deposit accounts and other cheque and on-call accounts which attract variable interest rates. The weighted average interest rate on cash balances at the end of the year was 0.97% (2016: 1.36%) for the Group. Variable rate bank loans totaling $5,000,000 form part of an ongoing loan facility which was updated during the financial year. The overall facility has a confirmed three year three month term which expires on 30 September 2020. The bills are subject to interest charged at the prevailing variable rate payable on each reset date. The weighted average interest rate on borrowings at the end of the year was 5.12% (2016: 6.8%) for the Group. Interest Rate Sensitivity Analysis 2017 2016 $’000 $’000 Effect on profit before tax and equity:
1% increase in interest rates 7 61 1% decrease in interest rates (7) (61)
Credit Risk The Group has no significant concentrations of credit risk. The Group does not have significant credit exposure to any one financial institution or customer. The credit risk on financial assets of the consolidated entity which have been recognised in the balance sheet is generally the carrying amount, net of any provision for doubtful debts.
Liquidity Risk The Group’s objective is to maintain a balance between continuity of funding and flexibility through the use of working capital and bank borrowings. The Group aims to achieve this flexibility by keeping committed credit lines available. Opportunities to raise additional capital from shareholders are also considered where appropriate. Bank financing facilities are identified at note 15. The Group manages liquidity risk by continuously monitoring forecast and actual cash flows to ensure sufficient liquidity is always available to meet liability obligations as they fall due. The Group’s balance sheet shows an excess of current liabilities over current assets at balance date of $2,357k. Liabilities have been

Notes to the Consolidated Financial Statements 30 June 2017
PACIFIC SMILES GROUP LIMITED ANNUAL REPORT 2017 45
classified as current where it is probable that they will be settled within twelve months or if there is a contractual obligation that may require settlement within twelve months, regardless of how likely settlement under contractual arrangements is judged to be. The Group’s current assets, available financing facilities, and ongoing positive operating cash flows continue to be sufficient to satisfy all payment obligations within the timeframes required. Maturities of Financial Liabilities The following tables show the maturity groupings of gross (undiscounted) payment obligations under contracts for financial liabilities. Less than 6
months $’000
6 to 12 months
$’000
1 to 5 Years $’000
Total Contractual Amounts
$’000 Consolidated – 2017 Bank loans - 5,000 5,000 Payables and accruals 9,842 - - 9,842
9,842 - 5,000 14,842
Consolidated – 2016 Bank loans 150 - - 150 Payables and accruals 8,554 - - 8,554
8,704 - - 8,704
Fair Value The fair value of financial assets and liabilities held by the Group approximate the individual carrying values of those assets and liabilities.
28. Segment Information The Group’s activities are within the dental sector. The Group’s activities are located throughout Eastern Australia. The financial results from this segment are consistent with the financial statements for the Group as a whole.

Notes to the Consolidated Financial Statements 30 June 2017
PACIFIC SMILES GROUP LIMITED ANNUAL REPORT 2017 46
2017 2016
$’000 $’000 29. Notes to the Statement of Cash Flows
(a) Reconciliation of Profit After Income Tax to Net Cash Inflow from Operating Activities Profit for the year 10,037 9,903 Depreciation and amortisation 6,042 5,031 Net (profit) on disposal of non-current assets (8) (22) Share based payments (credited) / expense (52) 157 Change in operating assets and liabilities
Decrease / (Increase) in receivables 363 (213) (Increase) in inventories (385) (294) (Increase) in other operating assets (519) (49) (Increase) in deferred tax assets (118) (202) Increase / (decrease) in trade payables 1,288 (1,153) Increase in provisions 777 875 (Decrease) in income tax (50) (960) (Decrease) in deferred tax liabilities (255) (20)
Net cash inflow from operating activities 17,120 13,053
(b) Non-cash Investing and Financial Activities Capitalisation of estimated future make-good obligations in relation to leasehold premises 187 247

Notes to the Consolidated Financial Statements 30 June 2017
PACIFIC SMILES GROUP LIMITED ANNUAL REPORT 2017 47
2017 2016 $’000 $’000 30. Parent Entity Financial Information (a) Summary Financial Information The individual financial statements for the parent entity show the following aggregate amounts: Balance Sheet Current assets 10,480 10,090 Total assets 68,092 59,882 Current liabilities 12,558 11,720 Total liabilities 23,603 16,870 Shareholders’ equity
Issued capital 35,053 35,053 Reserves 171 224 Retained earnings 9,265 7,735
44,489 43,012
Profit or loss for the year 10,193 9,081
Total comprehensive income 10,193 9,081
(b) Contingent liabilities of the Parent Entity Bank guarantees 2,490 2,262
The parent entity did not have any contingent liabilities or financial guarantees as at 30 June 2017 or 30 June 2016, other than bank guarantees.

Directors’ Declaration 30 June 2017
PACIFIC SMILES GROUP LIMITED ANNUAL REPORT 2017 48
In the directors’ opinion:
(a) the financial statements and notes set out on pages 21 to 47 are in accordance with the Corporations Act 2001, including:
(i) giving a true and fair view of the consolidated entity’s financial position as at 30 June
2017 and of its performance for the financial year ended on that date; (ii) complying with Australian Accounting Standards, the Corporations Regulations 2001
and other mandatory professional reporting requirements; and
(b) there are reasonable grounds to believe that the Company will be able to pay its debts as and when they become due and payable.
Note 1 confirms that the financial statements comply with International Financial Reporting Standards as issued by the International Accounting Standards Board. The directors have been given the declarations by the Chief Executive Officer and Chief Financial Officer required by section 295A of the Corporations Act 2001. This declaration is made in accordance with a resolution of the Board of Directors.
Robert Cameron AO Chairman Greenhills 17 August 2017

Independent Auditor’s Report
PACIFIC SMILES GROUP LIMITED ANNUAL REPORT 2017 49
Independent Auditor’s Report
To the shareholders of Pacific Smiles Group Limited
We have audited the Financial Report of
Pacific Smiles Group Limited (the
Company).
In our opinion, the accompanying Financial
Report of the Company is in accordance
with the Corporations Act 2001, including:
giving a true and fair view of the Group’s financial position as at 30
June 2017 and of its financial
performance for the year ended on
that date; and
complying with Australian Accounting
Standards and the Corporations
Regulations 2001.
The Financial Report comprises:
Consolidated balance sheet as at 30 June 2017;
Consolidated statement of profit or loss and other
comprehensive income, consolidated statement of
changes in equity, and consolidated statement of
cash flows for the year then ended;
Notes including a summary of significant accounting
policies; and
Directors’ Declaration.
The Group consists of the Company and the entities it
controlled at the year-end or from time to time during
the financial year.
We conducted our audit in accordance with Australian Auditing Standards. We believe that the audit
evidence we have obtained is sufficient and appropriate to provide a basis for our opinion.
Our responsibilities under those standards are further described in the Auditor’s responsibilities for
the audit of the Financial Report section of our report.
We are independent of the Group in accordance with the Corporations Act 2001 and the ethical
requirements of the Accounting Professional and Ethical Standards Board’s APES 110 Code of Ethics
for Professional Accountants (the Code) that are relevant to our audit of the Financial Report in
Australia. We have fulfilled our other ethical responsibilities in accordance with the Code.
KPMG, an Australian partnership and a member firm of the KPMG network of independent member firms affiliated with KPMG International Cooperative (“KPMG International”), a Swiss entity.
Liability limited by a scheme approved under Professional Standards Legislation.
Basis for opinion
Report on the audit of the Financial Report
Opinion

Independent Auditor’s Report
PACIFIC SMILES GROUP LIMITED ANNUAL REPORT 2017 50
The Key Audit Matters we identified are:
Revenue recognition
Carrying value of intangible assets
Key Audit Matters are those matters that, in our
professional judgment, were of most significance
in our audit of the Financial Report of the current
period.
These matters were addressed in the context of
our audit of the Financial Report as a whole, and in
forming our opinion thereon, and we do not
provide a separate opinion on these matters.
Revenue recognition ($91,471,000)
Refer to Note 2 to the Financial Report.
The key audit matter How the matter was addressed in our audit
A substantial amount of the Group’s revenue
relates to revenue from the rendering of
services, being service fees charged to dentists
who practice from the Group’s fully serviced
dental surgeries.
We focused on revenue recognition as a key
audit matter due to the significant audit effort
required to test the Group’s revenue, including:
The high volume of transactions recorded
as revenue;
The significant value of revenue recognised;
and
The opening of 12 new dental centres
during the current year.
Our procedures included:
Evaluating the Group’s processes for capturing
and recognising revenue in accordance with
accounting standards.
Testing the application of key controls in the
revenue calculation process, including:
- Daily bank account reconciliations;
- Management’s review and approval of
monthly revenue calculations;
- Management’s review and authorisation
of payments to dentists; and
- Selecting a sample of services fees
charged to dentists and agreeing them to
contractual terms.
We applied analytical procedures by:
- Comparing total patient fees received as
cash receipts to revenue recognised
during the year; and
- Assessing revenue recognised against
budget, prior year and historical trends for
new centres opened during the year.
Key Audit Matters

Independent Auditor’s Report
PACIFIC SMILES GROUP LIMITED ANNUAL REPORT 2017 51
Carrying value of intangible assets ($11,409,000)
Refer to Note 12 to the Financial Report
The key audit matter How the matter was addressed in our audit
Carrying value of intangible assets, including
goodwill, was identified as a key audit matter
due to:
The size of the balance, being 17% of total
assets; and
The significant level of judgement involved
in forecasting and discounting future cash
flows, which form the basis for assessing
whether intangible assets are impaired.
We focused on the significant forward-looking
assumptions the Group applied in their value-in-
use model, including:
Forecast operating cash flows, growth rates
and terminal growth rates – the Group has
experienced competitive market conditions
with varying levels of year on year sales
growth across centres of varying maturity
and geographic regions. These conditions
increase the possibility of intangible assets
being impaired, plus the risk of inaccurate
forecasts or a wider range of possible
outcomes for us to consider; and
Discount rate - these are complicated in
nature and vary according to the conditions
and environment the Group is subject to
from time to time and the models approach
to incorporating risks into the cash flows or
discount rates. The Group’s modelling is
sensitive to changes in the discount rate.
The Group has a large number of individual
dental centre locations, which includes 12 new
centres opened during the financial year,
necessitating our consideration of the Group’s
determination of Cash Generating Units (CGU),
based on the smallest group of assets to
generate largely independent cash inflows.
Our procedures included:
We considered the appropriateness of the
value-in-use method applied by the Group to
perform the annual impairment testing of
intangible assets against the requirements of
the accounting standards, including:
- Assessing the integrity of the model used,
including the accuracy of the underlying
calculation formulas;
- Assessing the Group’s allocation of
corporate assets to CGUs and the
allocation of corporate costs to the
forecast cash flows contained in the
model, for consistency;
- Comparing forecast cash flows contained
in the model to Board approved forecasts;
- Assessing the accuracy of previous Group
forecasts to inform our evaluation of
forecasts incorporated in the model; and
- Considering the sensitivity of the model
by varying key assumptions, such as
forecast growth rates, terminal growth
rates and discount rates, within a
reasonably possible range, to identify
those CGUs at higher risk of impairment
and to focus our further procedures.
We analysed the Group’s discount rate against
publicly available data of a group of
comparable entities.
We considered the Group’s determination of
their CGUs (including the allocation of the 12
new centres to CGUs) based on our
understanding of the operations of the Group’s
business and how independent cash inflows
were generated, against the requirements of
the accounting standards.
We assessed the disclosures in the financial
report using our understanding of the issue
obtained from our testing and against the
requirements of the accounting standards.

Independent Auditor’s Report
PACIFIC SMILES GROUP LIMITED ANNUAL REPORT 2017 52
Other Information is financial and non-financial information in Pacific Smiles Group Limited’s annual
reporting which is provided in addition to the Financial Report and the Auditor’s Report. This includes
the Highlights, the Chairman’s Review, the Managing Director’s Review, the Director’s Report, the
Remuneration Report, the Shareholder Information and the Corporate Directory. The Directors are
responsible for the Other Information.
Our opinion on the Financial Report does not cover the Other Information and, accordingly, we do not
express an audit opinion or any form of assurance conclusion thereon, with the exception of the
Remuneration Report and our related assurance opinion.
In connection with our audit of the Financial Report, our responsibility is to read the Other
Information. In doing so, we consider whether the Other Information is materially inconsistent with
the Financial Report or our knowledge obtained in the audit, or otherwise appears to be materially
misstated.
We are required to report if we conclude that there is a material misstatement of this Other
Information, and based on the work we have performed on the Other Information that we obtained
prior to the date of this Auditor’s Report we have nothing to report.
The Directors are responsible for:
preparing the Financial Report that gives a true and fair view in accordance with Australian
Accounting Standards and the Corporations Act 2001;
implementing necessary internal control to enable the preparation of a Financial Report that gives
a true and fair view and is free from material misstatement, whether due to fraud or error; and
assessing Group’s ability to continue as a going concern. This includes disclosing, as applicable,
matters related to going concern and using the going concern basis of accounting unless they
either intend to liquidate the Group or to cease operations, or have no realistic alternative but to
do so.
Our objective is:
to obtain reasonable assurance about whether the Financial Report as a whole is free from
material misstatement, whether due to fraud or error; and
to issue an Auditor’s Report that includes our opinion.
Reasonable assurance is a high level of assurance, but is not a guarantee that an audit conducted in
accordance with Australian Auditing Standards will always detect a material misstatement when it
exists.
Misstatements can arise from fraud or error. They are considered material if, individually or in the
aggregate, they could reasonably be expected to influence the economic decisions of users taken on
the basis of this Financial Report.
A further description of our responsibilities for the audit of the Financial Report is located at the
Auditing and Assurance Standards Board website at: http://www.auasb.gov.au/auditors_files/ar2.pdf.
This description forms part of our Auditor’s Report.
Other Information
Responsibilities of the Directors for the Financial Report
Auditor’s responsibilities for the audit of the Financial Report

Independent Auditor’s Report
PACIFIC SMILES GROUP LIMITED ANNUAL REPORT 2017 53
Opinion
In our opinion, the Remuneration Report of
Pacific Smiles Group Limited for the year ended
30 June 2017, complies with Section 300A of
the Corporations Act 2001.
KPMG
Directors’ responsibilities
The Directors of the Company are responsible for
the preparation and presentation of the
Remuneration Report in accordance with Section
300A of the Corporations Act 2001.
Our responsibilities
We have audited the Remuneration Report
included in pages 12 to 19 of the Directors’ report
for the year ended 30 June 2017.
Our responsibility is to express an opinion on the
Remuneration Report, based on our audit
conducted in accordance with Australian Auditing
Standards.
Chris Allenby
Partner
Sydney
17 August 2017
Report on the Remuneration Report

Shareholder Information As at 1 August 2017
PACIFIC SMILES GROUP LIMITED ANNUAL REPORT 2017 54
Distribution of Equity Security Holders Range
Number of equity security holders
1 – 1,000 212 1,001 – 5,000 312 5,001 – 10,000 176 10,001 – 100,000 201 100,001 and over 73
Total 974
There were 80 holders of less than a marketable parcel of ordinary shares.
Twenty Largest Shareholders Name
Number of ordinary
shares held
Percentage of issued shares
%
Alexander John Abrahams 19,936,010 13.12 HSBC Custody Nominees (Australia) Limited 17,740,815 11.67 Alison Jane Hughes 15,860,190 10.43 Susan Louise Abrahams 13,268,269 8.73 BNP Paribas Noms Pty Ltd 8,521,926 5.61 National Nominees Limited 5,524,972 3.64 JP Morgan Nominees Australia Pty Ltd 4,828,100 3.18 BNP Paribas Nominees Pty Ltd 4,090,917 2.69 Just Paddling Pty Ltd 3,789,082 2.49 Robert G Cameron & Paula S Cameron 3,383,258 2.23 John Gibbs 3,337,265 2.20 Channings Holdings Pty Ltd 3,090,150 2.03 Citicorp Nominees Pty Limited 2,666,626 1.75 Karen Wright 2,022,000 1.33 Lasardi Pty Limited 1,869,215 1.23 Citicorp Nominees Pty Limited 1,749,337 1.15 Sudemo Pty Ltd 1,741,017 1.15 William Mcillwraith Pty Ltd 1,695,000 1.12 Amanda Taylor 1,647,735 1.08 Joseph Nominees Pty Limited 1,637,793 1.08
Total 118,399,677 77.90
Other holders 33,593,718 22.10
Total quoted equity securities 151,993,395 100.00
Unquoted Equity Securities
Number on issue
Number of holders
Performance rights issued under the Company’s LTI plan 6,062,500 9
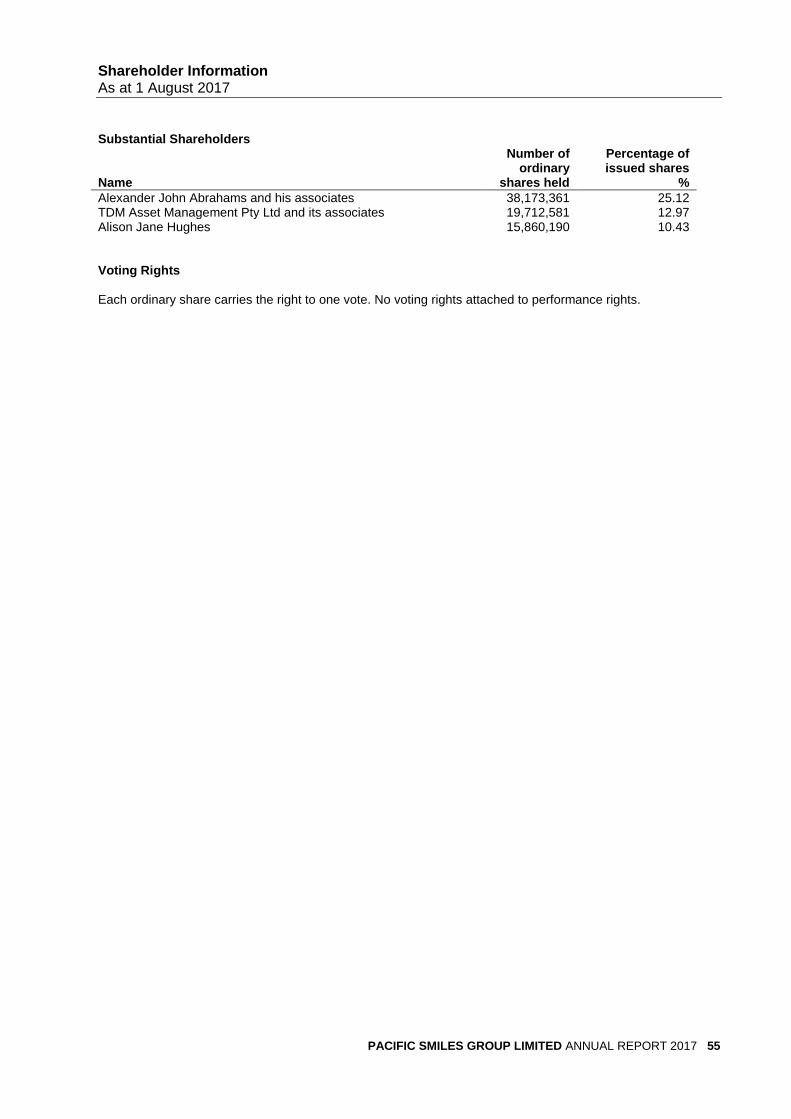
Shareholder Information As at 1 August 2017
PACIFIC SMILES GROUP LIMITED ANNUAL REPORT 2017 55
Substantial Shareholders Name
Number of ordinary
shares held
Percentage of issued shares
%
Alexander John Abrahams and his associates 38,173,361 25.12 TDM Asset Management Pty Ltd and its associates 19,712,581 12.97 Alison Jane Hughes 15,860,190 10.43 Voting Rights Each ordinary share carries the right to one vote. No voting rights attached to performance rights.

Corporate Directory
PACIFIC SMILES GROUP LIMITED ANNUAL REPORT 2017 56
Principal Registered Office Level 1, 6 Molly Morgan Drive Greenhills NSW 2323 T: 02 4930 2000 F: 02 4930 2099 W: www.pacificsmilesgroup.com.au
Directors Robert Cameron AO Non-executive Chairman John Gibbs Managing Director and Chief Executive Officer Dr Alex Abrahams Non-executive Director Grant Bourke Non-executive Director Ben Gisz Non-executive Director Simon Rutherford Non-executive Director
Company Secretary Mark Licciardo and Belinda Cleminson
Auditor KPMG Tower Three, 300 Barangaroo Avenue Sydney NSW 2000
Share Registry Link Market Services Limited Level 12, 680 George Street Sydney NSW 2000 Locked Bag A14 Sydney South NSW 1235 T: 1300 554 474 F: 02 9287 0303 E: [email protected]
Stock Exchange Listing Pacific Smiles Group Limited shares are listed on the Australian Security Exchange under the code “PSQ”.