Annual Report 2012 - teamtankers.com · the chemical tanker market eventually will benefit from...
84
Eitzen Chemical ASA Annual Report 2012
Transcript of Annual Report 2012 - teamtankers.com · the chemical tanker market eventually will benefit from...

Eitzen Chemical ASAAnnual Report 2012


Table of Contents Description of Eitzen Chemical ...................................................................................................................................... 4
Introduction to the chemical tanker market ................................................................................................................. 9
Board of Directors’ report ........................................................................................................................................... 14
Consolidated Income Statement ................................................................................................................................. 22
Consolidated Statement of Comprehensive Income ................................................................................................... 23
Consolidated Statement of Financial Position ............................................................................................................. 24
Consolidated Cash Flow Statement ............................................................................................................................. 25
Consolidated Statement of Changes in Equity ............................................................................................................ 26
Notes to the Financial Statements .............................................................................................................................. 27
Income Statement – Parent Company ........................................................................................................................ 57
Statement of Financial Position – Parent Company .................................................................................................... 58
Cash Flow Statement – Parent Company .................................................................................................................... 59
Notes to the Financial Statements – Parent Company ................................................................................................ 60
Statement of responsibility ......................................................................................................................................... 74
Corporate Governance ................................................................................................................................................ 75
Auditor’s report ........................................................................................................................................................... 80
Fleet list ....................................................................................................................................................................... 82

4
Description of Eitzen Chemical
Overview of Eitzen Chemical
Eitzen Chemical ASA (“Eitzen Chemical” or “the Company”) is a leading marine chemical and related products transportation company with a sailing fleet of 50 vessels as of year-end 2012. The Company transports a wide variety of cargoes such as organic chemicals, non-organic chemicals, clean and dirty petroleum products, vegetable oils and lube oils. The fleet consists of coated and stainless steel vessels ranging from 3,500 to 48,000 dwt, primarily designed for the transport of IMO II classified chemical cargoes. The vessels are employed in the spot market or chartered out through time-charter agreements or Contracts of Affreightment (CoAs).
The fleet comprises 50 vessels, of which 46 vessels are owned or on finance lease and four vessels are on operating lease. Eitzen Chemical operates one of the industry’s most modern chemical tanker fleets with an average age of less than eight years for the owned and leased vessels.
The vessels are commercially operated through offices in Denmark, Spain, USA and Singapore. The commercial offices communicate on a common IT platform, which includes global voyage management and communication systems to ensure that commercial activities are co-ordinated and optimised between the various commercial offices. The technical management of the owned vessels is handled by Selandia, V. Ships and Thome Ship Management. Eitzen Chemical has a global presence as illustrated in the figure below.
Eitzen Chemical offices
Our vision and mission statement
Our vision: Superior commitment to customers and quality creates value.
Mission statement: We are an ambitious global organisation with focus on:
• Safety & environment • Customers • Quality • People • New thinking • Being proactive

5
Overview of the Eitzen Chemical fleet
The fleet consists of various types and sizes of chemical tankers, with focus on the segment between 3,500 and 48,000 dwt. Cargo segregations vary from 12 to 30, and the fleet consists of both coated and stainless steel vessels. Of the owned and leased fleet at the end of the year, 28 were coated and 22 were stainless. With an average fleet age of less than eight years, Eitzen Chemical operates one of the most modern chemical fleets in the world.
Of the vessels operated by the Company, 36 are owned through subsidiaries in Singapore and Norway. 14 vessels are chartered in on time-charter or bareboat basis (most of them with purchase options). The vessels which are chartered in are classified as finance or operating leases in the Company’s financial statements.
Owned vessels
Vessel Built Dwt Flag Ship owning company Technical Mgmt.
Coating IMO
Siteam Adventurer 2007 46,026 Singapore Eitzen Chemical (Singapore) Pte. Ltd.
Thome Epoxy / Zinc II
Siteam Explorer 2007 46,026 Singapore Eitzen Chemical (Singapore) Pte. Ltd.
Thome Epoxy / Zinc II
Siteam Voyager 2008 46,017 Singapore Eitzen Chemical (Singapore) Pte. Ltd.
Thome Epoxy / Zinc II
Siteam Leader 2009 46,017 Singapore Eitzen Chemical (Singapore) Pte. Ltd.
V-Ships Epoxy / Zinc II
Siteam Discoverer 2008 46,005 Singapore Eitzen Chemical (Singapore) Pte. Ltd.
Thome Epoxy / Zinc II
Siteam Anja 1997 44,640 Marshall Islands
Eitzen Chemical (Singapore) Pte. Ltd.
Thome Epoxy II/III
Sichem Eagle 2008 25,421 Singapore Eitzen Chemical (Singapore) Pte. Ltd.
V-Ships Epoxy II
Sichem Falcon 2009 25,419 Malta Eitzen Chemical (Singapore) Pte. Ltd.
V-Ships Epoxy II
Sichem Hawk 2008 25,385 Malta Eitzen Chemical (Singapore) Pte. Ltd.
V-Ships Epoxy II
Sichem Osprey 2009 25,431 Malta Eitzen Chemical (Singapore) Pte. Ltd.
V-Ships Epoxy / Zinc II
Sichem Defiance 2001 17,396 Marshall Island
Eitzen Chemical (Singapore) Pte. Ltd.
Selandia Stainless Steel II
Sichem Rio 2006 13,162 Italy Eitzen Chemical (Singapore) Pte. Ltd.
Selandia Epoxy II
Sichem Edinburgh 2007 13,153 Singapore Eitzen Chemical (Singapore) Pte. Ltd.
Selandia Marineline II
Sichem Singapore 2006 13,141 Italy Eitzen Chemical (Singapore) Pte. Ltd.
Selandia Epoxy II
Sichem Manila 2007 13,125 Singapore Eitzen Chemical (Singapore) Pte. Ltd.
Thome Marineline II
Sichem Paris 2008 13,079 Singapore Eitzen Chemical (Singapore) Pte. Ltd.
Selandia Epoxy II
Sichem Hong Kong 2007 13,069 Singapore Eitzen Chemical (Singapore) Pte. Ltd.
Selandia Epoxy II
Sichem Beijing 2007 13,068 Singapore Eitzen Chemical (Singapore) Pte. Ltd.
Selandia Epoxy II
Sichem Montreal 2008 13,056 Singapore Eitzen Chemical (Singapore) Pte. Ltd.
V-Ships Epoxy II
Sichem New York 2007 12,945 Singapore Eitzen Chemical (Singapore) Pte. Ltd.
V-Ships Epoxy II
Sichem Melbourne 2007 12,937 Singapore Eitzen Chemical (Singapore) Pte. Ltd.
Selandia Epoxy II

6
Vessel Built Dwt Flag Ship owning company Technical Mgmt.
Coating IMO
Sichem Marseille 2007 12,928 Singapore Eitzen Chemical (Singapore) Pte. Ltd.
Selandia Epoxy II
Sichem Dubai 2007 12,889 Malta Eitzen Chemical (Singapore) Pte. Ltd.
Selandia Epoxy II
Sichem Challenge 1998 12,181 Singapore Eitzen Chemical (Singapore) Pte. Ltd.
Selandia Stainless Steel II
Sichem Fumi 1996 11,674 Panama Eitzen Chemical (Singapore) Pte. Ltd.
Thome Stainless Steel II
Tour Pomerol 1998 10,379 Singapore Eitzen Chemical Invest (Singapore) Pte. Ltd
V-Ships Stainless Steel II
Sichem Palace 2004 8,807 Singapore Eitzen Chemical (Singapore) Pte. Ltd.
Thome Stainless Steel II
Tour Margaux 1993 8,674 Malta Eitzen Chemical (Singapore) Pte. Ltd.
V-Ships Stainless Steel II
Sichem Iris 2008 8,140 Malta Eitzen Chemical (Singapore) Pte. Ltd.
Thome Stainless Steel II
Sichem Orchid 2008 8,115 Malta Eitzen Chemical (Singapore) Pte. Ltd.
Thome Stainless Steel II
Sichem Lily 2009 8,000 Malta Eitzen Chemical (Singapore) Pte. Ltd.
Thome Stainless Steel II
Sichem Croisic 2001 7,721 Malta Sichem Pearl Shipping Co Pte. Ltd.
V-Ships Stainless Steel II
Sichem Casablanca 1993 6,999 UK Napoli Chemicals KS
V-Ships Stainless Steel II
Sichem Houston 1995 6,239 UK Napoli Chemicals KS
V-Ships Stainless Steel II
Sichem Sparrow 2001 3,596 Malta Eitzen Chemical (Singapore) Pte. Ltd.
Selandia Stainless Steel II
Sichem Colibri 2001 3,592 Malta Eitzen Chemical (Singapore) Pte. Ltd.
Selandia Stainless Steel II
Leased vessels
As of 31 December 2012, the Company had chartered in 14 chemical tankers, of which four are on bareboat basis and ten are on time-charter basis. The duration of all charters are arranged as firm periods with additional option periods for the Company. Charter hire is differentiated in relation to firm and optional periods for some of the charters. All charter-parties include purchase options in favour of the Company apart from the Sichem Pace charter-party. For an overview of the vessels chartered in by subsidiaries of the Company and the main provisions of these charter-parties, reference is made to the following two tables.

7
Vessels on finance leases
The vessels classified as finance lease vessels are recognized in the same manner as vessels owned by the Company. Overview of Eitzen Chemical’s ten finance lease vessels:
Vessel Built Dwt Flag Technical Mgmt.
Latest exercise
Purchase Price*
Coating IMO
Siteam Jupiter 2000 48,309 Liberia Chemikalien Seetransport
May-2013 USD 15.8M Epoxy / Zinc
II
Siteam Neptun 2000 48,309 Liberia Chemikalien Seetransport
Apr-2013 USD 15.8M Epoxy / Zinc
II
Sichem Defender 2007 20,000 Panama Fleet Management
Jan-2019 JPY 1,485M Stainless Steel
II
North Fighter 2006 19,932 Panama Selandia May-2014 USD 18.8M Stainless Steel
II
North Contender 2005 19,925 Panama Selandia Jan-2014 USD 18.8M Stainless Steel
II
Sichem Contester
2007 19,822 Singapore Fleet Management
Oct-2019 JPY 1,510M Stainless Steel
II
Sichem Mumbai 2006 13,084 Panama V-Ships Oct-2018 USD 8.5M Epoxy II
Sichem Aneline 1998 8,941 Marshall Island
Selandia Jul-2018 JPY 348M Epoxy II
Sichem Ruby 2006 8,824 Panama Bernhard Schulte
Aug-2016 JPY 840M Stainless Steel
II
Sichem Amethyst
2006 8,817 Panama Bernhard Schulte
Oct-2016 JPY 840M Stainless Steel
II
* The purchase price indicates the option price at the latest possible exercise date.
Vessels on operating leases
Overview of the Company’s four operating lease vessels:
Vessel Built Dwt Flag Technical Mgmt.
Latest exercise
Purchase Price*
Coating IMO
Sichem Pace 2006 19,983 Panama Selandia No option No option Stainless Steel
II
Sichem Onomichi 2008 13,104 Singapore Selandia Feb-2015 USD 16.6M Epoxy II
Sichem Hiroshima 2008 13,000 Singapore Selandia May-2015 USD 16.6M Epoxy II
Sichem Mississippi
2008 12,273 Panama V-Ships Dec-2028 JPY 1,060M Stainless Steel
II
* The purchase price indicates the option price at the latest possible exercise date.
Contract coverage
Eitzen Chemical has long term relationships with many of its customers. The term business coverage, measured in earnings, was 39 per cent for 2012, with the CoA cover at 34 per cent and Time Charter cover at 5 per cent. Firm CoAs and CoAs that, in the management’s opinion, are expected to be renewed based on historical and other reasons are included in the estimated contract coverage. CoAs typically have minimum and maximum volumes and the contract coverage is thus based on management’s anticipated volume. The CoA contracts typically have a firm duration of one year at a time and are subject to annual re-negotiations, but some of the CoAs have firm periods lasting up to five years. The following figure illustrates the expected contract coverage in 2013.

8
Eitzen Chemical Contract coverage 2013
Source: Eitzen Chemical (expected 2013 coverage as at 31.12.2012)
Time Charter Agreements
Some of the vessels owned or leased by the Company are chartered out on a time-charter / bare boat basis. All charters are based on standard charter party forms and are governed by English or US law. Most of the contracts are on short to medium term (from 1 – 2 years).
Contracts of Affreightment
The Company has entered into several CoAs with various customers. Several of the Company’s owned or chartered vessels are employed for the performance of these CoAs. The CoAs are with few exceptions not linked to the use of a particular vessel or a particular group of vessels.
Vessels employed in the spot market
Several of the vessels owned or chartered by the Company are employed in the spot market for voyage charters. These contracts are typically based on standard charter party forms like Asbatankvoy, Shell Voy or similar and governed by English or US law.
Spot59 %
CoA35 %
T/C6 %

9
Introduction to the chemical tanker market
Introduction
Chemical tanker vessels are mainly used for cost-efficient long-distance bulk transportation of organic chemicals, inorganic chemicals and vegetable oils and animal fats. In addition, miscellaneous cargoes such as molasses, lube oils and refined petroleum products, e.g. gasoline and jet fuel, can be transported with chemical tanker vessels.
Organic chemicals, also referred to as petrochemicals, are chemicals derived from petroleum products and are carbon based. The most common organic chemicals transported by sea include methanol, MTBE and BTX (benzene, toluene and xylene). Organic chemicals are estimated to be the largest chemicals product group in the seaborne chemical trade.
Inorganic chemicals are chemicals of mineral origin. These chemicals are derived from other sources than petroleum products and do not necessarily have carbon structures. The most common inorganic chemicals include phosphoric acid, sulphuric acid and caustic soda.
Vegetable oils and animal fats is the third main category transported on chemical tankers. Growth in the trade of these products has recently outpaced growth in the organic and inorganic chemicals trade.
In addition to chemical transportation, chemical tankers can also be used to transport refined petroleum products (CPP), which are usually transported by less sophisticated product tankers. Product tankers can, in turn, be used to carry certain less hazardous chemicals. The chemical tanker market is therefore linked to the product tanker market and the boundary between the product tanker and the chemical tanker market is therefore not easily defined.
However, IMO rules which came into effect on 1 January 2007 added several new cargoes to the chemical tanker trade and certain cargoes which previously could be transported by product tankers had to be transported by chemical tankers with effect from 1 January 2007. Of these cargoes, the most significant in terms of cargo volumes were vegetable oils and soft oils.
The figure below illustrates Eitzen Chemical’s cargo liftings for 2012.
Eitzen Chemical Cargo liftings 2012
Source: Eitzen Chemical (excluding vessels fixed out on T/C contracts)
Seaborne transportation of chemicals takes place in all parts of the world. The most important long haul trade lanes for chemical tankers are between the major chemical supply areas in the US, Northwest Europe, Singapore and the Arabian Gulf region, and the main chemical importing regions in Europe, Asia and South America. There is also substantial transatlantic trade between the US and Northwest Europe. Other important trade lanes are from the Middle East to North America and to Europe. The Middle East and Asia are expected to become more important regions in the chemical trade as a result of growth in chemical plant and petroleum refinery capacity in these regions. In the medium to long term, the shale gas development in the US is expected to have a positive effect on demand for chemical tanker transportation. The customers of the

10
chemical tanker operators are mainly producers or consumers of chemical products, e.g. major industrial chemical companies, oil companies and mining companies.
The figure below illustrates Eitzen Chemical’s main trade lanes.
IMO regulation
The International Maritime Organization (“IMO”) is a specialized agency of the United Nations which is responsible for measures to improve the safety and security of international shipping and to prevent marine pollution from ships. Some of these measures include issuing technical requirements that vessels must fulfil in order to gain permission to transport oil products and chemicals. Product and chemical tankers can be segregated based on their IMO classification, which are quality grades for the permission to transport various chemical and oil products. IMO I graded products are the most hazardous, IMO III the least hazardous. In general, IMO I and IMO II grade tankers are referred to as chemical tankers.
Non-IMO / product tankers are classed as carriers for oil and oil products. In addition to oil and oil products, such as gasoline, non-IMO / product tankers can carry non-IMO liquids such as molasses and ethanol. IMO III tankers are classed as carriers for oil and oil products as well as carriers for type III cargoes. Type III cargoes include, among others, methanol, MTBE, styrene, toluene, and chemical tankers transporting these cargoes have to be classed as IMO III tankers (or better). IMO II tankers are classed as carriers for oil and oil products as well as carriers for type III and type II cargoes. Type II cargoes include, among others, acids, fatty acids, xylene, white spirit and vegetable oils (e.g. palm oil, sunflower oil and soybean oil), and chemical tankers transporting these cargoes have to be classed as IMO II tankers, although vegetable oils can be shipped in double hulled IMO III tonnage. The requirements for IMO II chemical tankers are the same as for IMO III chemical tankers, but with stricter requirements, e.g. with respect to tank size. IMO II tankers can transport both oil products and type III and type II chemicals.
IMO revised carriage requirements under Annex I (oil) and Annex II (noxious liquid substances in bulk which mainly have to be carried by chemical tankers), with the aim of protecting the environment through stricter regulations. The revisions to Annex I have been implemented, with the result that single hull tankers had to be phased out within year end 2010, but with several exceptions. A fairly comprehensive revision has also been made to Annex II, which took effect on 1 January 2007. The revision has imposed stricter requirements on the carriage of chemical products. A number of cargoes were moved from not being IMO categorised to requiring IMO III or even IMO II classed tankers. To illustrate this by means of some examples, xylene went from requiring IMO III tankers to requiring IMO II tankers. Methanol, MEG and MTBE went from no IMO

11
requirement to requiring IMO III tankers. The most significant change in terms of volume was for vegetable oils and soft oils which went from no IMO requirement to requiring IMO II (effectively meaning IMO III, but double hull).
Overview of current fleet and order book
The chemical tanker market is relatively small in terms of number of vessels compared to the total tanker market.
The graph below gives an overview of the age distribution of the existing fleet of chemical tankers from 3,000 to 54,000 dwt. The order book is estimated to represent about 6 per cent of the current fleet, reduced significantly from peak levels in 2008. The recent global economic recession and the financial turmoil have led to significant newbuilding cancellations and it is still uncertain whether all newbuildings will be delivered.
Current fleet of chemical tankers, 3k to 54k dwt
Source: Eitzen Chemical based on industry sources
Estimated fleet growth
The remaining orderbook for chemical tankers (tankers below 54,000 dwt) is about 6 per cent of the fleet, while the orderbook of smaller stainless steel vessels is only 2 per cent. In 2012, total deliveries of newbuildings were 1.8 million dwt, with scrapping of 1.2 million dwt, i.e. a net fleet growth of 0.6 million dwt, or 1.6 per cent. The fleet growth is to a great degree influenced by the level of scrapping of vessels. Scrapping is correlated to the age and technical standard of a vessel. Further, the decision to scrap is strongly influenced by the freight market. In a weaker market the relative degree of scrapping is higher. Costs associated with dry-dockings and new IMO regulations which will come into effect over the next years, are also expected to have a strong influence on the level of scrapping considering the opportunity cost for older vessel to meet new requirements. Consequently, we expect the level of scrapping to remain at today’s level until the freight market experience more sustainable market improvement. If the relative level of scrapping in 2013 and 2014 equals scrapping in 2012, the net annual fleet growth the coming years will be marginal. Based on the rapidly decreasing order book and estimated scrapping and removal of older tonnage, the fleet growth is expected to be moderate going forward.

12
Freight rate development
Chemical market – tonnage demand Demand for chemical tankers is influenced by many variables as a vast number of commodities are involved in the seaborne chemical trade. World GDP growth and world industrial production is one of the main drivers for demand for chemicals and is therefore often considered to be one of the main indicators for chemical tanker demand. Although, there is some uncertainties with regards to the macroeconomic indicators following the European sovereign debt crisis, world GDP figures are anticipated to grow, according to the IMF1, by 3.5 per cent in 2013 and 4.1 per cent in 2014 and historically the demand for chemical tanker transportation has been growing at a factor of approximately 1.5. The world’s chemical production capacity has been growing steadily during the last decade, partly influenced by increasing consumption as a result of a growing world population. Traditionally, the key areas for production and consumption of chemicals have been the main traditional industrial areas in North America, Northwest Europe and Japan. Going forward a rapid build-up of new chemical plants, especially in the Middle East, Asia and South America is expected. The Middle East and Asia is therefore expected to become more important regions for the chemical tanker industry. In recent years, China has also emerged as a significant importer and exporter of chemicals, and this is likely to continue. The long term growth rate for global chemicals and plastics demand has been estimated to be around five per cent. Further, the demand for marine chemical transportation, measured in tonne miles, is expected to continue exceeding the growth in demand measured in tonnes, as a result of the increasing industrial production and increased chemical plant and refinery capacity in the Middle East and Asia.
Freight rates The table on the following page sets forth the development in the Eitzen Chemical Index (ECI) since 2006, both the actual development and the development on same-ship basis. The Eitzen Chemical Index (ECI) is based on the Company’s sailed in time-charter equivalent (TCE) earnings per day. The TCE earnings are included with nominal values. Certain vessels in the current fleet were delivered in the period 2007-2009. The average weighted TCE for these vessels are only included from the time of delivery. In 2009, high fleet growth coupled with reduced industrial production as a consequence of lower economic activity and negative GDP growth in the major economies, had a negative impact on chemical tanker demand and freight rates. Industrial production has however, in most parts of the world, picked up and increased demand for chemicals and the seaborne transportation of same. The continuation of high bunker expenses throughout 2012 had a negative impact on the Eitzen Chemical Tanker Index, which measures time-charter equivalent earnings, i.e. revenues after voyage related costs such as bunker costs. However, lately the market has partly managed to absorb the increase in bunker prices with modest increases in freight rates.
1 International Monetary Fund: World Economic Outlook Update, 23 January 2013

13
Eitzen Chemical Index
The chemical industry is reporting improved earnings, increased sales and has a positive outlook in general. The increased production of petrochemical products in the Middle East and Asia is likely to have positive consequences for the tonne-mile matrix for chemical tankers. Industry sources estimate that demand for seaborne chemical transportation will increase by 4-5 per cent in 2013, and demand for tonnage expressed in tonne-mile to increase even more. Furthermore, the fleet growth for chemical tankers between 3,000 and 54,000 dwt is expected to be limited going forward. As a consequence, the remaining oversupply is expected to be absorbed, giving rise to an increase in the global fleet utilization and a significant recovery in freight rates.

14
Board of Directors’ report
A successful financial restructuring of Eitzen Chemical’s bank and bond debt was concluded in January 2013. The new financial structure will secure headroom and stable operations in the years to come, even in a slowly improving market. A term- and revolving credit facility of USD 30 million is secured to provide the Company with sufficient available liquidity. The facility was undrawn as of year-end 2012. Eitzen Chemical will continue its focus on strengthening the Company’s capital situation and evaluate potential partners who are willing to invest long term in the Company. The weak chemical tanker market continued in 2012. Eitzen Chemical experienced a firmer market in the first half of 2012 relative to 2011, driven by positive signals for the global industrial production and improvement in the supply and demand balance in the chemical tanker market. However, spot volumes and spot market freight rates came under pressure in the second half of 2012 influenced by the uncertain and slowing world economy. Eitzen Chemical sold three older vessels in 2012. The vessels are considered non-core and the transactions are expected to improve the Company’s operating performance. The average time-charter rate in 2012 increased by 8.0 per cent to USD 10,275 per day, up from USD 9,516 per day in 2011. Consolidated Freight revenue in 2012 for Eitzen Chemical was USD 401.2 million, compared to USD 426.0 million in 2011. EBITDA was USD 33.5 million, up from USD 25.6 million in the previous year. Net loss for 2012 was USD 136.3 million, including impairment of USD 70.4 million of vessels in the Company’s lease portfolio, which compares to a net loss of USD 154.0 million in 2011. The chemical tanker market improved towards year end 2012, and going into 2013 we have seen increased activity and higher fleet utilization in important trade lanes. Although we expect a challenging market in 2013, the fundamental outlook for the supply/demand balance in 2013 is more optimistic than for 2012 due to easing supply growth. Operationally Eitzen Chemical is focused on continuous improvements in all disciplines of the Company’s business. Cost control, vetting performance, maintaining and establishing long term customer relationships are key focus areas for the Company during these challenging market conditions. Business summary Eitzen Chemical operates vessels ranging from 3,500 to 48,000 dwt, designed for the transport of IMO II classified chemical cargoes. As of 31 December 2012, the Eitzen Chemical fleet consisted of 50 vessels, of which 46 were owned or on finance lease and four were on operating lease. As part of our strategy to improve fleet efficiency and operating cash flow, three older and non-core vessels were sold in 2012; the Sichem Pearl (10,331 dwt, built 1994), the Ievoli Silver (5,400 dwt, built 1992) and the Torquato (5,400 dwt, built 1992). The strategy of discontinuing as pool manager was completed in the first half of 2012, and we have consequently experienced improved vetting performance and utilization within these ship classes. Eitzen Chemical has one of the most modern chemical tanker fleets in the world with an average age of less than eight years. The vessels are commercially operated through offices in Denmark, Spain, USA and Singapore. Eitzen Chemical’s headquarter is located in Norway. The Company’s 16 stainless steel vessels below 12,000 dwt primarily operate on regional trades servicing our customers in Europe, the Mediterranean and West Africa. This is an intensive industrial shipping operation with several long running customer relationships. Through the City Class vessels, consisting of 15 vessels of around 13,000 dwt, Eitzen Chemical is trading both in Europe, Transatlantic, in the Americas and to a certain extent in Asia. The Company’s 10 vessels between 17,000 dwt and 30,000 dwt are trading in contract- and spot trades on a worldwide basis, with focus around the Middle East chemical exports. The IMO II MRs operates in global trades and are commercially managed through Team Tankers. At year end Team Tankers consisted of 8 vessels, of

15
which the Company financially controls all eight. The operation of Team Tankers is based on a portfolio of Contracts of Affreightment (CoAs) in the commodity chemicals trade.
During 2012 the Company has renewed and entered into several longer term CoAs with major international oil and chemical companies at higher freight rate levels than has been the case in recent years prior to 2012. The term business coverage, measured in earnings, was 39 per cent for 2012, with the CoA cover at 34 per cent and Time Charter cover at 5 per cent. In line with the Company’s strategy the CoA cover has increased over the past years. The quantity and number of liftings under the CoAs increased during 2012, resulting in increased revenues under the CoAs. In the first quarter of 2012, the market conditions in all of the Company’s markets showed positive volume and freight rate developments. The market development for the smaller vessels trading regionally was particularly strong, where both CoA volumes and spot volumes improved, resulting in higher fleet utilization and upward pressure on freight rates. The short sea European market also held up relatively well supported by strong CoA nominations throughout the second quarter. The intra Atlantic market had a continuous positive development through the first quarter but experienced sluggish spot volume and rate developments towards the end of the first half of 2012. Export volumes from both Europe and USA to Asia started 2012 at the high level from the previous year. In the long-haul trades between the Atlantic and Pacific the spot volumes and freight rates came under pressure while CoA volumes persisted and several of the Company’s larger vessels were scheduled on long CoA voyages at sustainable levels. The intra-Asia spot market experienced marginal improvements in activity and rates. The long haul palm oil and bio fuels trades from Asia direction Atlantic had a weaker development with less volume. The Middle East market improved significantly through the first quarter but came later under pressure. The weaker undertone that was experienced through the second quarter continued into the third quarter. In most trade lanes the market remained stagnant in the second half of 2012. The CoA volumes were overall stable but with geographic and product specific variances. The backwardation of product prices continued to negatively impact shipped spot volumes resulting in lower fleet utilization. Although the market conditions continued to be influenced by the uncertain and slow world economy, at the end of the year the market showed improvements. In particular the freight rates in the USG/Asia and Middle East trades were stronger and the Asia export market for Palm oils remained firm. The continuing very high bunker price is an area of concern. The corresponding increase in voyage costs, even if partly compensated for by our customers, challenges the development of net freight rates towards more sustainable levels. The average bunker price in 2012 was about USD 638 per ton, and the bunker prices have risen from around USD 200 per ton at the beginning of 2009. The chemical tanker market is still negatively impacted by the extensive deliveries of new tonnage in the years prior to the financial crisis and downturn in the chemical tanker market. However, we experience that the demand for chemicals and the seaborne transportation of chemical products is improving, driven by strong demand from China and other emerging Asian economies. The supply side is also improving with around 6 per cent of current fleet on order and about a 1.6 per cent fleet growth in 2012. Although the world macroeconomic indicators are uncertain and market improvements fragile, Eitzen Chemical believes that with the improvements on the supply side, only a moderate increase in demand is required for a recovery. Financial review Consolidated freight income for the Company in 2012 was USD 401.2 million compared to USD 426.0 million in 2011. Freight income on T/C basis was USD 194.6 million following the sale of three vessels in 2012, down from USD 200.6 million in 2011. The average time-charter rate in 2012 was 10,275 per day, up from 9,516 per day in 2011. Ship operating expenses of USD 119.4 million and Charterhire expenses of USD 20.7 million, were down USD 3.7 million and USD 11.3 million, respectively, compared to 2011 following a reduction in the fleet. General and administrative expenses were USD 22.9 million, and down USD 2.6 million compared to previous year mainly due to a reduction in overhead costs. Reported EBITDA in 2012 was USD 33.5 million, compared to USD 25.6 million in 2011.

16
The Company has performed an impairment test at year-end and recognized an impairment of USD 70.4 million (2011: USD 62.5 million). The impairment is related to vessels in the Company’s lease portfolio, and reflects the effect of updated assumptions of vessels in the lease portfolio including the contractual expiry of two vessels in 2013. The Company has sold three older vessels in 2012 and recognized a loss of USD 10.2 million from the sales, compared to a gain on sale of assets of USD 3.7 million in 2011. Depreciation amounted to USD 64.8 million (2011: USD 77.6 million). The operating result (EBIT) for 2012 was negative USD 111.8 million compared to negative USD 110.8 million in the previous year. Net financial items for 2012 were negative USD 24.5 million (2011: 40.7 million), of which interest expenses were USD 47.0 million. This also comprises a finance income of USD 30.4 million mainly related to two of the Company’s time charter contracts accounted for as finance leases which expire in the first half of 2013 and where it is assumed that the purchase options on these vessels will not be exercised. The estimated lease obligations have been updated to reflect this assumption. Further, USD 2.2 million in net unrealized currency loss on the NOK denominated bond loan and JPY denominated purchase options included in the finance lease obligations have been recognized. Debt restructuring fees of USD 5.8 million have been expensed, and in 2012 the Company has capitalized USD 6.1 million in fees related to the debt restructuring process. Net loss for the year was USD 136.3 million compared to a net loss of USD 154.0 million in 2011. As of 31 December 2012, Eitzen Chemical’s total assets were USD 962.6 million. Total fleet book value was USD 858.6 million as of 31 December 2012. The book value of the Company’s vessels decreased by USD 136.5 million in 2012, reflecting depreciation, impairment of USD 70.4 million, and the sale of three vessels. Cash and cash equivalents amounted to USD 30.9 million, a decrease of USD 35.9 million during the year. In 2012, Eitzen Chemical had a net cash flow from operating activities of USD 36.2 million. Net cash flow from investing activities was negative USD 8.8 million. Net cash flow from financing activities amounted to negative USD 63.8 million. Total equity at the end of the year was negative USD 32.1 million, down from USD 104.1 million in 2011. On 5 February 2013 the Company held an extraordinary general meeting where a reverse share split in the ratio 100:1 was approved. The Company’s share capital is at the issue date of this report NOK 846,016,800 divided by 11,280,224 shares, each with a par value of NOK 75. Eitzen Chemical’s market capitalization was USD 16.2 million on 31 December 2012 compared to USD 30.1 million at year end 2011. Capital resources and investments In 2012 Eitzen Chemical entered into a process with its lenders to restructure the Company’s debt as the debt moratorium period, agreed with its banks in 2009, would expire in November 2012. A successful financial restructuring of Eitzen Chemical’s bank and bond debt was concluded in January 2013. The new financial structure will secure headroom and stable operations in the years to come, even in a slowly improving market. A term- and revolving credit facility of USD 30 million is secured to provide the Company with sufficient available liquidity. The facility was undrawn as of year-end 2012. Until January 2015, the Company’s cash commitments on interest payments are limited to LIBOR on the restructured bank debt. All other interest commitments may accrue on the balance of the bank and bond facilities. When the market recovers and the Company has excess cash to service interest margins and/or installments, excess cash will be swept in accordance with the agreement between all the Company’s lenders. From January 2015, the Company is obliged to pay LIBOR plus a margin of 2.75 per cent on the majority of the loans. Fixed debt installments will commence in April 2015 with flexible repayment terms from then to maturity in May 2016. More details regarding the agreements can be found in note 18 to the financial statements. Total interest bearing debt per 31 December 2012 was USD 935.6 million down from USD 973.3 million at the beginning of the year. Total interest bearing debt includes USD 668.7 million drawn on bank facilities and USD 114.3 million related to the bond loan. Total interest bearing debt also includes USD 152.5 million in finance lease obligations, of which USD 84.8 million is the potential payment if the Company declares its right, but not

17
obligation, to purchase the vessels from its owners on certain dates in the leasing period. USD 769.8 million of the Company’s bank and bond debt has been classified as short term debt at the reporting date in accordance with the presentation requirements under IFRS. However, both the bank and bond debt have been restructured and is not payable short term. The bank and bond debt will be reclassified to non-current in the first quarter of 2013 following the conclusion of the financial restructuring. Total equity at the end of the year was negative USD 32.1 million (2011: positive USD 104.1 million), and as stated in the minutes from the extraordinary general meeting held on 5 February 2013 and based on the agreements with the Company's lenders, the Board currently considers the Company's capital situation as adequate. Nevertheless, the Board considers the current net asset value to be below par value of the Company’s shares in the current market situation. At the Ordinary General Meeting in 2013 a share capital reduction through a write down of par value will be proposed. With challenging conditions prevailing and a historically long downturn in the chemical tanker market, Eitzen Chemical has since 2009 focused on improving its financial position. Eitzen Chemical will continue to focus on strengthening the Company’s capital situation and evaluate potential partners who are willing to invest long term in the Company. There is significant long term risk associated with the current leverage of the Company and the liquidity risk inherent in the Company’s financial liabilities is considerable. However, Eitzen Chemical remains confident that the chemical tanker market eventually will benefit from improved market fundamentals and fully recover. As of 31 December 2012, Cash and cash equivalents amounted to USD 30.9 million (2011: 66.8 million). Under the new loan agreements the Company will have a minimum liquidity covenant of USD 30 million, measured based on the Company’s cash and cash equivalents and any undrawn amount under the new revolving credit facility of USD 30 million. Eitzen Chemical invested a total of USD 14.8 million in 2012, mainly relating to upgrading and docking of vessels, compared to total investments of USD 19.9 million in the previous year. Net proceeds from the sale of three vessels in 2012 amounted to USD 6.0 million. Based on the above and pursuant to Section 3-3a of the Norwegian Accounting Act, the Board confirms that the going-concern assumption applies and that the annual accounts have been prepared on the basis of this assumption. Financial risk A successful financial restructuring of Eitzen Chemical’s bank and bond debt was concluded in January 2013 (refer to the “Capital resources and investments” section above and note 18 for further information). Market conditions for shipping activities are typically volatile and results may vary considerably from year to year. Furthermore, vessels and cargoes are subject to perils particular to marine operations, including capsizing, grounding, collision, piracy, and loss or damage from severe weather conditions. Such circumstances may result in damages to property, the environment or persons and expose the company to loss or liability. In addition, the Company is exposed to a number of different financial market risks arising from the normal business activities. Additional risks not presently known to the Board of Directors, or considered immaterial at this time may also impair its business operations and prospects. Fluctuations in freight rates and bunker fuel prices are key factors affecting the cash flow and the value of our assets. The fluctuation in freight rates is to some extent reduced by the Company’s portfolio of CoAs and time-charters. The Company seeks to reduce the exposure to fluctuating bunker fuel prices through compensation clauses in contracts with customers. On CoAs where this is not possible, the Company may utilize commodity based derivatives to reduce the bunker exposure. The Company does not hedge the bunker risk related to its spot market exposure. Over time, freight rates should adjust to reflect changes in bunker expenses. However, this adjustment tends to lag in time.

18
Interest and exchange rate risks are significant financial risks for Eitzen Chemical. Management periodically review and assess the primary financial market risks. The risks are managed on a group portfolio level in accordance with strategies, policies and authorization defined by the Board of Directors. At the end of 2012 approximately 84 per cent of our interest bearing debt carried floating interest rates. The Company currently pays floating interest rates on its bond and bank debt, while the Company’s leasing obligations have fixed rates. Eitzen Chemical’s revenues are predominately in USD. Portions of our operating expenses and general and administrative expenses are denominated in non-USD currencies, mainly DKK, NOK, EUR and SGD. Interest bearing debt is mainly in USD. However, the Company's outstanding bond loan has one NOK tranche. Some of the purchase options on leased vessels are in JPY. Health, safety and environment The safety and well-being of our employees has our highest priority. Eitzen Chemical aims to continuously provide and enhance healthy, high-quality working conditions, both onshore and onboard vessels. The Company has outsourced crewing and technical management. Eitzen Chemical has a fleet management department responsible for monitoring the Health, Safety, Environment and Quality performance of the technical managers. Attracting and retaining qualified seafarers remains an area of strategic importance for Eitzen Chemical, and the Company is executing a comprehensive crewing strategy in close cooperation with our technical managers. The objective is to strengthen Eitzen Chemical’s brand and image in selected national pools while exploiting the strong presence and position that the individual technical manager has established regionally. During 2012 the Company achieved a further improvement of retention rate for officers, measured at 89 per cent according to Intertanko’s standard. To ensure a continued flow of dedicated and qualified officers, Eitzen Chemical, in close cooperation with our technical managers, is engaged in the continued training of seafarers and education of cadets and has around 40 cadet positions onboard our vessels. The Company will further develop and execute on the crewing strategy and the implementation of crew welfare initiatives in order to continue improving officers’ retention rate and maintaining a challenging and motivating work place, thus creating top performing vessels. The Lost Time Injury Frequency (LTIF) was 0.63 per million working hours in 2012 for crews on Eitzen Chemical operated vessels. Absence due to illness for onshore employees was 0.8 per cent in 2012. For shore-based employees, no work-related injuries were reported during the year. Piracy is still an area of great concern. While there recently has been a decrease in acts of piracy in the Gulf of Aden and Somali Basin, the number of reported incidents in West Africa has increased. Our technical managers have adopted best management practices consistent with the industry standards and under suggestion by Intertanko and OCIMF to deter piracy. All of our vessels are registered with the EU Naval Force (Maritime security centre) which co-ordinates vessel’s transit schedules with the appropriate naval vessels in the Gulf of Aden and Somali basin. Depending on the present conditions and individual risk factors for the particular vessel, preventive measures are being evaluated for each transit according to Eitzen Chemical piracy policy. Eitzen Chemical is aware of its environmental responsibility and we strive to comply with and maintain high standards in order to reduce the environmental impact from our operations. The technical managers are certified with Environmental Management Systems Certificate ISO 14001 as well as ISO 9001:2000. The certificates are issued by the classification society and establish environmental standards and implementation routines. Continuous efforts are made in order to reduce the general waste produced by the vessels and to dispose of waste onshore in a controlled manner at approved port waste reception facilities. The fleet complies with the IMO recommendations on waste management. Pollution by invasive species carried with ballast water has become an important issue. All the ships have ballast water management systems in place. The company has further started preparing its vessels to install ballast water treatment systems in line with new regulations entering into force. The Company has invested additional funds in new vessels, meeting requirements that refrigeration and air-conditioning systems in the vessels be upgraded to R404 refrigeration gas, which is CFC free.

19
Exhaust fumes from the vessels' engines account for the main part of the air pollution generated by the Company's operations. All vessels contracted after 2005 are compliant with NOX emissions requirements. The modern Siteam class of vessels from Trogir meets all the criteria of the Lloyd’s Register Environmental Protection Notation. This notation covers a diversity of subjects ranging from air pollution to sea water pollution. To further limit air pollution, the smaller vessels have been built fully compliant with current regulations on NOX and SOX emissions and are also built to be able to further reduce SOX emissions. Eitzen Chemical conducts improvement projects and testing aimed at reducing our environmental impact, including hull cleaning and propeller polishing in addition to testing of fuel additives for improved combustion, both aimed at reducing fuel consumption and air pollution. Human resources and diversity On 5 September 2012 Bjørn J. Sjaastad withdrew as Chairman of the Board and Aage R. B. Figenschou, who has served as a Board member since 2009, took up the position as new Chairman. The Board of Directors currently consist of four members, and represent a strong combination of shipping, banking and financial experience. Three out of four members of the Board of Directors are independent of Eitzen Chemical’s largest shareholder, Jason Shipping ASA. As of year-end 2012, Eitzen Chemical had 1,250 crew members employed on its vessels or on leave. In addition, the Company had 79 permanent employees onshore. We value our employees as our key resource. Eitzen Chemical will continue to focus on attracting and keeping the best qualified and motivated employees. Eitzen Chemical is a global organization with a diversified working environment in which employment, promotions, responsibility and job enrichment are based on qualifications and abilities, and not on gender, age, race and political or religious views. Eitzen Chemical believes in equal opportunity for men and women in the workplace. However, the shipping business is historically male-dominated. Female representation among employees therefore remains low and accounted for approximately 24 per cent of the onshore work force in 2012. At executive management level, there are currently no women represented. The Board complies with the 40 per cent gender requirement for Board of Directors stipulated by Norwegian law. Eitzen Chemical focuses on transparency in its business practices, supports free enterprise and seeks to compete in a fair and ethical manner. The Board of Eitzen Chemical has approved a Code of Conduct defining the Company’s ethical standards. Corporate governance The Board of Eitzen Chemical is committed to developing a strong, sustainable and competitive company in the best interest of the shareholders, employees, customers, creditors, business associates, third parties and society at large. The Board of Directors and Management aim for a controlled and profitable development and long-term creation of growth through well-founded governance principles, operational procedures and risk management. The responsibility and working procedures of the Board are regulated by Instructions for the Board of Directors of Eitzen Chemical ASA, Eitzen Chemical’s Corporate Governance policy and the Company’s Code of Conduct. The Board acknowledges the Norwegian Code of Practice for Corporate Governance and will work on implementing this Code, using the guidelines as recommendations for the board’s governance duties. For more detailed information see the Corporate Governance principles included in the annual report. Parent company The Board proposes that the net loss of NOK 824.0 million for the parent company is attributed to Retained losses. The loss in 2012 mainly relates to a loss of NOK 760.4 from an internal sale of shares in subsidiaries due to a company restructuring following the new loan agreements with the lenders of the Eitzen Chemical Group.

20
Further, impairment charges NOK 10.5 million were recorded on financial assets. Total equity for the parent company as at 31 December 2012 is negative NOK 216.0 million. The unrestricted equity available for distribution as of 31 December 2012 is zero. Total assets as of 31 December 2012 amounts to NOK 481.2 million, compared to NOK 1,289.7 million as of 31 December 2011. Total cash and cash equivalents amount to NOK 18.1 million as of 31 December 2012, compared to NOK 216.0 million the previous year. Outlook The fundamental outlook for the supply/demand balance in 2013 is more optimistic than for 2012 due to easing supply growth. World GDP growth and industrial production in most parts of the world has picked up from the low point in 2009, which has increased demand for chemicals and the seaborne transportation of same. The remaining orderbook[1] for chemical tankers (tankers below 54,000 dwt) is about 6 per cent of the fleet, while the orderbook of smaller stainless steel vessels is only 2 per cent. In 2012, total deliveries of newbuildings were 1.8 million dwt, with scrapping of 1.2 million dwt, i.e. a net fleet growth of 0.6 million dwt, or 1.6 per cent, compared to 3.9 per cent in 2011 and 4.2 per cent in 2010. If the relative level of scrapping in 2013 and 2014 equals scrapping in 2012, the net annual fleet growth the coming years will be marginal. Industry sources estimate that demand for seaborne chemical transportation will increase by 4-5 per cent in 2013, and demand for tonnage expressed in tonne-mile to increase even more. Hence, the development of the supply/demand balance is expected to continue improving. Over the coming years the market should experience increased fleet utilization. When the remaining oversupply of chemical tankers has been absorbed the chemical tanker market should see a significant recovery, both in rates and second hand values. Forward looking statement This report contains forward looking statements. These statements are based upon various assumptions. Although Eitzen Chemical believes that these assumptions were reasonable when made, because assumptions are inherently subject to significant uncertainties and contingencies which are difficult or impossible to predict and are beyond its control. Eitzen Chemical cannot give assurance that it will achieve or accomplish these expectations, beliefs or intentions. No assurance can be given that the Company will be able at all times to be in compliance with all of its financial covenants towards its finance providers or to agree such necessary arrangements to timely secure full compliance with the terms of the agreements with its lenders. Such arrangements might require discussions with, amongst others, the Company’s lenders and such discussions might not be concluded and agreed in a timely manner, if at all.
[1] Source: Eitzen Chemical based on industry sources

21
Oslo, 15 March 2013
The Board of Directors of Eitzen Chemical ASA
Aage Rasmus Bjelland Figenschou
Chairman of the Board
Carl Erik Steen
Helene Jebsen Anker
Heidi Marie Petersen
Per Sylvester Jensen
Chief Executive Officer

GROUP
22
Consolidated Income Statement
See accompanying notes that are an integral part of these consolidated financial statements.
(USD '000, except per share data)
Note 2012 2011
Freight revenue 3 401 248 426 039
Voyage expenses 5 -206 655 -225 465
Freight income on T/C basis 194 593 200 574
Management fees and other income 6 1 933 5 654
Gross profit 196 526 206 228
Ship operating expenses 7 -119 356 -123 144
Charterhire expenses 4,19 -20 713 -31 979
General and administrative expenses 8 -22 944 -25 505
EBITDA (Earnings before interest, taxes, depreciation and amortisation) 33 513 25 600
Impairment 12 -70 391 -62 510
Depreciation and amortisation 12 -64 779 -77 586
Gain/(loss) on sale of assets 12 -10 172 3 661
EBIT (Earnings before interest and taxes) -111 829 -110 835
Interest income 9 92 453
Interest expenses 9 -46 976 -43 683
Other financial items 9 22 398 2 566
Profit (loss) before taxes -136 315 -151 499
Income tax expense 10 -1 -2 530
Net profit (loss) -136 316 -154 029
Attributable to owners of the parent -136 316 -154 029
Basic/diluted earnings per share 11 -USD 12.10 -USD 15.53
GROUP
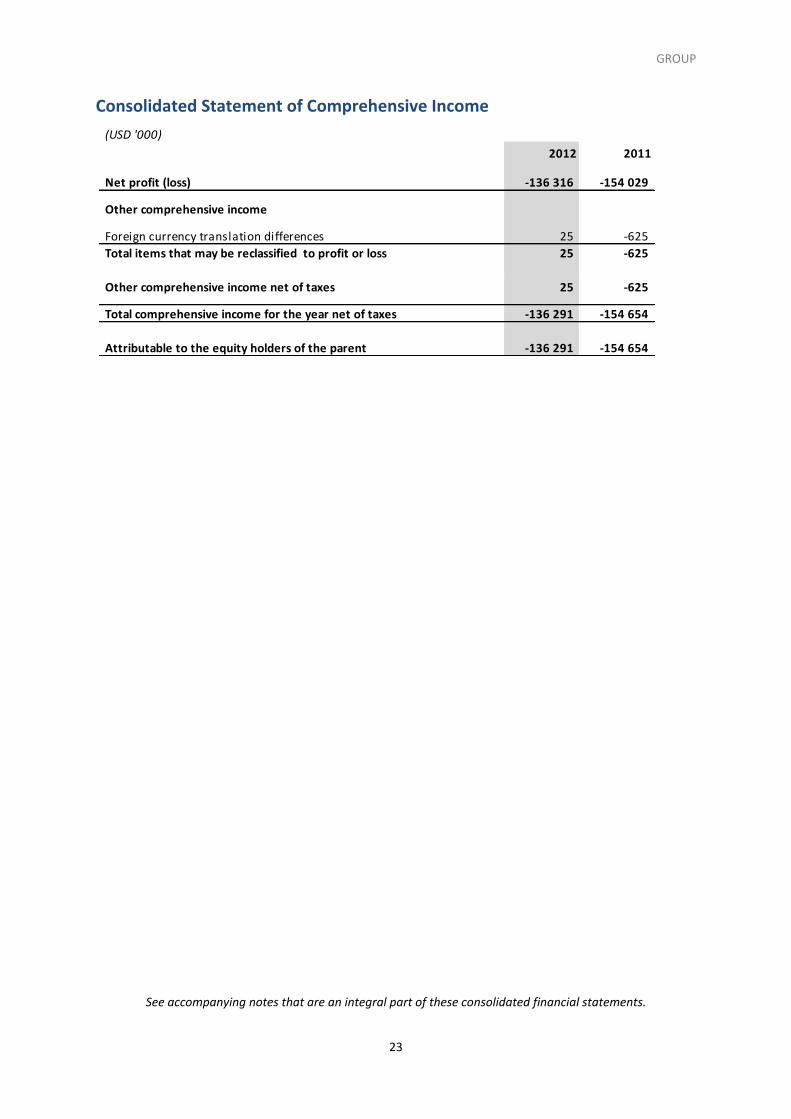
23
Consolidated Statement of Comprehensive Income
See accompanying notes that are an integral part of these consolidated financial statements.
(USD '000)
2012 2011
Net profit (loss) -136 316 -154 029
Other comprehensive income
Foreign currency translation differences 25 -625
Total items that may be reclassified to profit or loss 25 -625
Other comprehensive income net of taxes 25 -625
Total comprehensive income for the year net of taxes -136 291 -154 654
Attributable to the equity holders of the parent -136 291 -154 654

GROUP
24
Consolidated Statement of Financial Position
(USD '000)
See accompanying notes that are an integral part of these consolidated financial statements.
Note 31.12.2012 31.12.2011
ASSETS
Vessels 12 706 102 759 500
Vessels held under finance leases 12 152 499 235 637
Other equipment 12 205 419
Other non-current assets 3 347 2 000
Total non-current assets 862 153 997 556
Trade and other receivables 14 50 951 62 375
Inventories 16 681 20 457
Derivative financial instruments 20 - 169
Other current assets 1 911 2 235
Cash and cash equivalents 15 30 926 66 826
Total current assets 100 469 152 062
TOTAL ASSETS 962 622 1 149 618
EQUITY AND LIABILITIES
Share capital 148 037 148 037
Share premium 20 550 20 550
Treasury shares -116 -116
Other paid in equity 631 440 631 440
Total paid in capital 16 799 911 799 911
Retained earnings -841 681 -705 365
Other reserves 9 625 9 600
Total equity 16 -32 144 104 146
Interest-bearing loans and borrowings 18 13 263 761 666
Obligations under finance leases 18,19 140 149 186 587
Pension obligations 13 202 562
Total non-current liabilities 153 614 948 815
Trade and other payables 17 58 568 70 786
Current portion of interest-bearing loans and borrowings 18 769 793 11 669
Current portion of obligations under finance leases 18,19 12 380 13 406
Income tax payable 10 7 21
Other current l iabilities 4 404 775
Total current liabilities 841 152 96 657
Total liabilities 994 766 1 045 472
TOTAL EQUITY AND LIABILITIES 962 622 1 149 618

GROUP
25
Consolidated Cash Flow Statement
(USD '000)
See accompanying notes that are an integral part of these consolidated financial statements.
Note 2012 2011
Profit/(loss) before taxes -136 315 -151 499
Non-cash adjustment
(Gain)/loss on sale of assets 10 172 -3 661
Depreciation and amortisation 12 64 779 77 586
Impairment 12 70 391 62 510
Effect of updated estimated finance lease obligations 18 -30 432 -11 135
Share-based incentive expense 8 - 446
Amortised borrowing cost 6 046 2 448
Interest expenses 40 930 41 235
Interest income -92 -453
Foreign currency (gain)/loss 2 292 5 341
Change in pension liabilities 13 -392 -162
Other changes 7 457 732
Working capital adjustments
Change in current assets 14 186 -3 314
Change in current l iabilities -12 811 -3 170
Taxes paid - -22
Net cash flow from operating activities 36 211 16 882
Net proceeds from sale of vessels 5 954 2 821
Payments on vessels (mainly upgrading and docking) 12 -14 806 -19 871
Interest received 92 489
Net cash flow from investing activities -8 760 -16 561
Proceeds from borrowings 2 139 416
Repayment of long term debt -7 033 -5 399
Repayment of obligations under finance leases -13 407 -12 420
Interest paid -39 914 -39 706
Payment of other financial costs -5 544 -
Net proceeds from share issuance - 52 919
Net cash flow from financing activities -63 759 -4 191
Net change in cash and cash equivalents -36 308 -3 868
Effect of exchange rate changes on cash 408 -1 427
Cash and cash equivalents at the beginning of period 66 826 72 121
Cash and cash equivalents at 31 December * 15 30 926 66 826 * Whereof USD 1.9 million is restricted (2011: MUSD 1.1).

GROUP
26
Consolidated Statement of Changes in Equity
(USD '000)
Employee benefit reserve The employee benefits reserve is used to record the value of the Company’s share-based incentive program. Refer to Note 8 for further details of the plans. Foreign currency translation reserve The foreign currency translation reserve is used to record exchange differences arising from the translation of the financial statements of subsidiaries in foreign currencies. Treasury shares The treasury shares are used to record purchase of own shares. The Company has 1 010 000 treasury shares. See Note 16 for further details. On 5 February 2013 the Company held an extraordinary general meeting whereby a reverse share split in the ratio 100:1 was approved. The Company currently has 10 100 treasury shares. Refer to note 23 for further information. Revaluations reserve The revaluation reserves are used to record step by step revaluation in connection with purchase of subsidiaries.
See accompanying notes that are an integral part of these consolidated financial statements.
2012 Attributable to equity holders of the parent company
Paid in capital Other reserves
Share Share Employee Treasury Other Retained Reva- Trans- Total Total
capital premium benefit shares paid in profits/ luation lation other
Figures in USD '000 (Note 16) reserve (Note 16) equity losses reserve reserves reserves
At 1 January 2012 148 037 20 550 1 591 -116 629 849 -705 365 3 406 6 194 9 600 104 146
Profit (loss) for the period - - - - - -136 316 - - - -136 316
Other comprehensive income - - - - - - - 25 25 25
Total comprehensive income - - - - - -136 316 - 25 25 -136 291
At 31 December 2012 148 037 20 550 1 591 -116 629 849 -841 681 3 406 6 219 9 625 -32 144
2011 Attributable to equity holders of the parent company
Paid in capital Other reserves
Share Share Employee Treasury Other Retained Reva- Trans- Total Total
capital premium benefit shares paid in profits/ luation lation other
Figures in USD '000 (Note 16) reserve (Note 16) equity losses reserve reserves reserves
At 1 January 2011 128 279 19 458 1 145 -155 597 818 -551 336 3 406 6 819 10 225 205 435
Profit (loss) for the period - - - - - -154 029 - - - -154 029
Other comprehensive income - - - - - - - -625 -625 -625
Total comprehensive income - - - - - -154 029 - -625 -625 -154 654
Reduction of share capital (Note 16) -32 070 - - 39 32 031 - - - - -
Issue of share capital (Note 16) 51 827 3 455 - - - - - - - 55 282
Transaction costs - -2 363 - - - - - - - -2 363
Share-based payment (Note 8) - - 446 - - - - - - 446
At 31 December 2011 148 037 20 550 1 591 -116 629 849 -705 365 3 406 6 194 9 600 104 146

GROUP
27
Notes to the Financial Statements Note 1 - Corporate information Eitzen Chemical ASA (Eitzen Chemical or the Company) is a public limited liability company incorporated and domiciled in Norway which shares are listed on Oslo Stock Exchange. The address of the domicile is Ruseløkkveien 6, P. O. Box 1794 Vika, 0122 Oslo, Norway. The principal activities of Eitzen Chemical are described in the Board of Directors’ report. The consolidated financial statements of Eitzen Chemical for 2012 were approved by the Board of Directors (the Board) and the Chief Executive Officer (CEO) on 15 March 2013, and will be presented for approval at the Annual General Meeting in the second quarter of 2013.
Note 2.1 - Basis of preparation The consolidated financial statements for Eitzen Chemical and all its subsidiaries have been prepared in accordance with International Financial Reporting Standards (lFRS) as adopted by the EU. The consolidated financial statements have been prepared on a historical cost basis, except for financial assets and liabilities held for trading and all financial assets that are classified as available for sale. These financial assets and liabilities are measured at fair value. The consolidated financial statements are presented in US Dollars thousands (USD ‘000) except when otherwise indicated. Going concern Based on the agreements with the lenders, the financial statements have been prepared on the basis of the going concern assumption, which contemplates the realisation of assets and the liquidation of liabilities as part of the normal course of business. Basis of consolidation The consolidated financial statements comprise the financial statement of Eitzen Chemical and its subsidiaries at 31 December each year. The financial statements of the subsidiaries are prepared for the same reporting period as the parent company, using consistent policies. The consolidated financial statements include the parent company Eitzen Chemical ASA and undertakings in which the parent company directly or indirectly holds more than 50 per cent of the share capital, has corresponding voting rights, or otherwise has an actual controlling interest. All Group balances, and profits and losses resulting from intercompany transactions are eliminated.
Note 2.2 - Significant accounting judgments, estimates and assumptions Certain of our accounting principles require the application of significant judgment by management in selecting the appropriate assumptions for calculating financial estimates that affect the reported amounts of assets, liabilities, revenues, expenses and information on potential liabilities. By their very nature, these judgments are subject to an inherent degree of uncertainty. These judgments and estimates are based on historical experience, terms of existing contracts, observation of trends in the industry, information provided by customers and where appropriate, information available from other sources. Although these estimates are based on management’s interpretations of current events and actions, future events may lead to these estimates being changed and actual results may ultimately differ materially from those estimates. Such changes will be recognized when new estimates can be determined. Judgments In the process of applying Eitzen Chemical’s accounting policies, management has made the following judgments which have the most significant effect on the amounts recognised in the financial statements.

GROUP
28
Impairment The Company has defined the whole fleet as one Cash Generating Unit (CGU) as the vessels are operated as a portfolio and each vessel is dependent of each other. An individual vessel can be chartered on behalf of several clients and trade lanes throughout the world. No vessels are defined for a specific type of cargo or trade within a particular geographical area. Refer to note 12 for further information on the impairment assessment. Operating versus finance lease agreements Based on the content of a leasing agreement, Eitzen Chemical determines whether the agreement is considered as an operating or a finance lease agreement. In this determination, assumptions are made and if the same assumptions were judged differently, it could have an effect on the income statement and the statement of financial position. One of the most significant judgments is the forecasted future market value of the leased vessel at the dates when the purchase option is expected to be declared. Estimates and assumptions Management has made estimates and assumptions which have significant effect on the amounts recognised in the financial statements. In general, accounting estimates are considered significant if:
- the estimates require assumptions about matters that are highly uncertain at the time the estimates are made
- different estimates could have been used - changes in the estimates have a material impact on Eitzen Chemical’s financial position
Carrying amount of vessels, depreciation and residual values In addition to the purchase price, the carrying amount of vessels is based on management’s assumptions of useful life and residual value of the vessels. Useful life may change due to change in technological developments, competition, environmental and legal requirements, freight rates and steel prices. The residual value of the vessel is calculated as the light displacement of the vessel multiplied with the estimated steel prices minus the estimated cost in connection with the scrapping. Residual values are challenging to estimate given the long lives of the vessels, the uncertainty as to future economic conditions and the future price of steel, which is considered as the main determinant of the residual price. Eitzen Chemical currently estimates residual value annually based upon the average steel price for the last five years. Impairment When value in use calculations are performed, management estimate the expected future cash flows from the assets or cash-generating unit and determine a suitable discount rate in order to calculate the present value of those cash flows. This will be based on management’s evaluations, including estimating future performance, revenue generating capacity, and assumptions of future market conditions and appropriate discount rates. Changes in circumstances and in management’s evaluations and assumptions may give rise to impairment losses. While management believes that the estimates of future cash flows are reasonable, different assumptions regarding such cash flows could materially affect the evaluations. At each reporting date, management assesses indicators of impairment for non-financial assets and whether the assumptions in the value in use calculations are reasonable. Onerous contracts At each reporting date, management assesses if there are contracts in which the unavoidable costs of meeting the obligations under the contract exceed the economic benefits expected to be received. A provision is recorded by estimating the present obligation under the contract.

GROUP
29
Finance leases Agreements to charter in vessels where Eitzen Chemical has substantially all risks and rewards of ownership, are recognised in the balance sheet as finance lease. Finance leased assets are at the inception of the lease measured at the lower of the fair value and the present value of minimum lease payments determined in the agreement. For the purpose of calculating the net present value, the interest rate implicit in the lease or the Company’s incremental borrowing rate is used as a discount factor. Provisions Provisions are based on management’s best estimate. Provisions are reviewed at each balance sheet date to reflect the best estimate of the liability.
Note 2.3 - Summary of significant accounting policies
Presentation and classification Income statement As permitted by IAS 1 the income statement is prepared based on a mix of nature and function, since this gives the most relevant presentation of the income statement. Consolidated statement of financial position Current assets and current liabilities include items due in less than one year from the balance sheet date, items used in the daily operation of the business and assets held primarily for the purpose of being traded. The current portion of long-term debt is classified under current liabilities. Cash flow statement The cash flow statement is prepared using the indirect method. Participation in pools Revenue and expenses, assets and liabilities from pool vessels are proportionately consolidated, based on the relative interest in the pools, calculated by a pool point system. Revenue and expense All voyage revenues and voyage expenses are recognised on a percentage of completion basis. Eitzen Chemical uses a discharge-to-discharge principle in determining the percentage of completion for all spot voyages and voyages under contracts of affreightment (CoAs). Under this method voyage revenue is recognised evenly over the period from the departure of a vessel from its original discharge port to departure from the next discharge port. For vessels without signed contracts in place at discharge no revenue is recognised before a new contract is signed. Voyage expenses incurred for vessels in the idle time are expensed. Revenues from time charters (T/C) and bareboat charters (B/B) accounted for as operating leases are recognised over the rental periods of such charters, as service is performed. Demurrage is included if a claim is considered probable. Losses arising from time or voyage charters are provided for in full when they become probable. Other income Management fee and other income are recognised at or during time of delivery. Vessels Vessels are recorded at historical cost less accumulated depreciation and any accumulated impairment charges. Cost includes expenditures that are directly attributable to the acquisition of the vessels. The cost is decomposed into vessel, docking and coating.

GROUP
30
Useful life, depreciation and residual value All decomposed items are depreciated on a straight-line basis over the useful life of the separate item. Depreciation is based on cost less the estimated residual value. The residual value of the vessels is estimated as the lightweight tonnage of each vessel multiplied by scrap value per ton. The residual values of docking, coating and major improvements are estimated to nil. The residual values, useful lives and methods are reviewed, and adjusted if appropriate, at each financial year-end. Impairment of non-financial assets At each reporting date the Company assesses whether there is an indication that an asset may be impaired. If any such indication exists, or when annual impairment testing for an asset is required, the Company makes an estimate of the asset’s recoverable amount. The recoverable amount is the highest of the fair market value of the asset, less cost to sell, and the net present value (NPV) of future estimated cash flow from the employment of the asset (“value in use”). The NPV is based on a discount rate according to a weighted average cost of capital (“WACC”) reflecting the Company’s required rate of return. The WACC is calculated based on the expected long-term borrowing rate and a risk free rate plus a risk premium for the equity. If the recoverable amount is lower than the book value, an impairment charge is recorded. Impairment losses are recognized in the profit and loss statement. Assets are grouped at the lowest level where there are separately identifiable independent cash flows. We have made the following assumptions when calculating the value in use for material tangible assets: Future cash flows are based on an assessment of our expected time charter earning and estimated level of operating expenses for each type of vessel over the remaining useful life of the vessel. As the Eitzen Chemical vessels are interchangeable and the regional chemical tankers are integrated with the deep sea chemical tankers through a logistical system, all chemical tankers are seen together as a portfolio of vessels. In addition the pool of officers and crew are used throughout the fleet. Eitzen Chemical has a strategy of a total crew composition and how the crew is dedicated to the individual vessels varies. As a consequence, vessels will only be impaired if the total value of the fleet of vessels based on future estimated cash flows is lower than the total book value. An impairment loss recognised in prior periods for an asset is reversed if, and only if, there has been a change in the estimates used to determine the asset’s recoverable amount since the last impairment loss was recognised. Derecognition Components of vessels are derecognised upon disposal or when no future economic benefits are expected from its use or disposal. Any gain or loss arising on derecognition of an asset is included in the income statement in the year it is derecognised. Leases The determination of whether an arrangement is, or contains a lease is based on the substance of the arrangement at inception date. Leases are classified as finance leases if the terms of the lease agreement transfers substantially all the risks and rewards incidental to ownership of an asset. All other leases are classified as operating lease. Finance leases are capitalised at inception of the lease at the fair value of the leased vessel or, if lower, at the present value of the minimum lease payments. The corresponding lease obligation is recognised as a liability in the balance sheet. Lease payments are split between interest cost and reduction of the lease liability. Interest cost is recognized in the income statement. Finance leased assets are depreciated over the shorter of the estimated useful life of the asset and the lease term. For operating leases, the payments (time-charter hire or bare boat hire) are recognised as an expense on a straight line basis over the term for the lease.

GROUP
31
Foreign currency translation Functional currency Each entity in Eitzen Chemical determines its own functional currency, and items included in the financial statements of each entity are measured using their functional currency. The functional currency is the currency of the primary economic environment in which the entity operates. The consolidated financial statements are presented in US Dollars which is the group’s presentation currency. Transactions and balance sheet items Transactions in foreign currencies are recorded in the functional currency rate at the date of the transaction. Monetary assets and liabilities denominated in foreign currencies are retranslated at the functional currency rate of exchange prevailing at the balance sheet date. All differences are recognized in the income statement. Non-monetary items that are measured in terms of historical cost in a foreign currency are translated using the exchange rates as at the dates of the initial transactions. Non-monetary items measured at fair value in a foreign currency are translated using the exchange rates at the date when the fair value is determined. Subsidiary companies in foreign currency For foreign operations with functional currency other than the presentation currency of Eitzen Chemical (USD), balance sheet items are translated into USD at the rate of exchange at the balance sheet date, and income statements are translated at the weighted average exchange rate for the year. The exchange differences arising on the translation are recorded directly as other comprehensive income. On disposal of a foreign entity, the deferred cumulative amount recognised in equity relating to that particular foreign operation is recognised in the income statement. Financial assets Financial assets are classified as either financial assets at fair value through profit or loss, loans and receivables or available-for-sale financial assets. Financial assets classified at fair value through profit and loss are initially recognised at fair value. Other financial assets are initially recognised based on fair value plus directly attributable transaction costs. Eitzen Chemical determines the classification of its financial assets after initial recognition and, where allowed and appropriate, revaluates this designation at each financial year end. All purchases and sales of financial assets are recognised at the trade date i.e. the date that Eitzen Chemical commits to purchase the asset. Purchases or sales; are purchases or sales of financial assets that require delivery of assets within the period generally established by regulation or convention in the market place. Fair value Fair value of assets that are actively traded in organised markets is determined by reference to quoted market bid prices at the close of business on the balance sheet date. For investments where there is no active market, fair value is determined using valuation techniques. Such techniques include using recent arm’s length market transactions with reference to the current market value of other similar instruments, discounted cash flow analysis or other valuation models. From time to time the Company may enter into financial instruments in order to hedge a portion of its exposure to bunker prices. Fair value changes of the financial instruments are recognized through profit and loss under other financial items. Amortised cost Loans and receivables are measured at amortised cost and are computed using the effective interest method less any allowance for impairment. The calculation considers any premium or discount on acquisition and includes transaction cost and fees that are an integral part of the effective interest rate. Loans and receivables Loans and receivables are non-derivative financial assets with fixed or determinable payments that are not quoted in an active market. They arise when Eitzen Chemical provides money, goods or services directly to a debtor with no intention of trading the receivables.

GROUP
32
Impairment of financial assets Eitzen Chemical assesses at each balance sheet date whether an asset or portfolio of assets are impaired. A portfolio is the lowest levels for which there are separate identifiable cash flows (cash-generating units). If there is objective evidence that an impairment loss on loans and receivables carried at amortised cost has occurred, the amount of the loss is measured as the difference between the asset’s carrying amount and the present value of estimated future cash flows (excluding future credit losses that have not occurred) discounted at the financial asset’s original effective interest rate i.e. the effective interest rate computed at initial recognition). If the amount of impairment loss subsequently decreases and the decrease can be related objectively to an event occurring after the impairment was recognised, the previously recognised impairment loss is reversed. Any subsequent reversal of an impairment loss is recognised in the income statement, to the extent that the carrying value of the asset does not exceed its amortised cost at the reversal date. Inventories Inventories are valued at the lower of cost and net realisable value. Cost is determined as a first-in, first-out (FIFO) basis. Net realisable value is the estimated selling price in the ordinary course of business, less applicable variable selling expense. Cash and cash equivalents Cash and cash equivalents in the balance sheet comprise cash at bank and in hand and short-term deposits with an original maturity of three months or less. For the purpose of the consolidated cash flow statement, cash and cash equivalents consist of cash and cash equivalents, net of outstanding bank overdrafts. Provisions Provisions are recognised when Eitzen Chemical has a present obligation (legal or constructive) as a result of a past event, it is probable that the obligation has to be settled and that a reliable estimate of the obligation can be made. Segment reporting Operating segments are reported in a manner consistent with the internal reporting provided to the chief operating decision-maker. The chief operating decision-maker whom is responsible for allocating resources and assessing performance of the operating segments, has been identified as the Board of Directors. Taxes Income tax Tax payable for the current and prior periods is measured at the amount paid or expected to be paid to the tax authorities. The tax rates and tax laws used to compute the amount are those that are enacted or substantively enacted at the balance sheet date. Deferred tax is provided using the liability method on temporary differences at the balance sheet date between the tax basis of assets and liabilities and their carrying amounts for financial reporting purposes. Deferred tax liabilities are recognized for all taxable temporary differences, except: • where the deferred tax liability arises from the initial recognition of goodwill or of an asset or liability in a
transaction that is not a business combination, and at the time of the transaction affects neither the accounting profit nor taxable profit or loss; and
• in respect of taxable temporary differences associated with investments in subsidiaries, associates and interests in joint ventures, where the timing of the reversal of the temporary differences can be controlled and it is probable that the temporary differences will not reverse in the foreseeable future.
Deferred tax assets and deferred tax liabilities are offset, if a legally enforceable right exists to set off current tax assets against current tax liabilities and the deferred taxes relate to the same taxable entity and the same tax authority, and are the basis for deferred tax assets for the Company. The Company’s total deferred tax assets and liabilities are measured at the tax rates that are expected to apply at the time when the asset is realized or the liability is settled, based on the tax rates and tax laws that have been enacted or substantively enacted at the balance sheet date.

GROUP
33
Deferred tax assets made probable through prospective earnings, and which can be utilized against the tax reducing temporary differences are recognized as intangible assets. The carrying amount of deferred tax assets is reviewed at each balance sheet date and reduced to the extent that it is no longer probable that sufficient taxable profit will be available to allow all or part of the deferred income tax asset to be utilized. The carrying amount of the tax positions in local currency are translated to USD applying the rate of exchange at year-end. Eitzen Chemical's main shipping activity is in Singapore, Denmark and Norway. Eitzen Chemical has also taxable activities in the United States. Income tax relating to items recognized directly in equity or other comprehensive income is recognized in equity and not in the income statement. Singapore AIS tax scheme The Company is granted the status of Approved International Shipping Enterprise (AIS) In Singapore. All qualified shipping income derived from the shipping activity is exempt from taxation for the duration of the AIS status. The AIS status has been granted for a period of ten years commencing November 2004. There is no tax on dividend paid from the Singapore companies to the parent companies in Singapore and Norway. Danish tax scheme The companies in Denmark are taxable according to the normal company tax scheme. The corporate tax rate is 25 per cent. Norwegian tax scheme The activities in Norway are taxable in accordance with the normal company tax scheme. The tax rate is 28 per cent.
US tax scheme
The commercial management activities are taxable in accordance with the normal tax scheme. The tax rate is
approximately 35 per cent.
Note 2.4 - Changes in accounting policy and disclosures
(a) New and amended standards adopted by the Group There are no IFRSs or IFRIC interpretations that are mandatory for the first time for the financial year beginning on or after 1 January 2012 that had a significant impact on the group. The following amendment to an existing standard is early adopted by the Group:
IAS 1 Presentation of financial statements (amendment) The IASB has issued an amendment to IAS 1. The amendment changes the disclosure of items presented in other comprehensive income (OCI) in the statement of comprehensive income. The amendment was endorsed by the EU in June, 2012. The Company has implemented the amended standard in its Consolidated Statement of Comprehensive Income.
(b) New and amended standards, and interpretations mandatory for the first time for the financial year beginning 1 January 2012 but not currently considered relevant to the group (although they may affect the accounting for future transactions and events)
The following standards and amendments to existing standards have been published and are mandatory for the group’s accounting periods beginning on or after 1 January 2012 or later periods.
IFRS 7 Financial instruments (amendment), applies to annual periods beginning on or after 1 July 2011. The amendments will assist users to understand the implications of transfers of financial assets and the potential risks that may remain with the transferor.

GROUP
34
(c) New standards, amendments and interpretations issued but not effective for the financial year beginning 1 January 2012 and not early adopted.
IAS 19 –Employee benefits. This standard was amended in June 2011. The impact on the Group will be as follows: to eliminate the corridor approach and recognize all actuarial gains and losses in OCI as they occur; to immediately recognize all past service costs; and to replace interest cost and expected return on plan assets with a net interest amount that is calculated by applying the discount rate to the net defined benefit liability (asset). Based on current parameters, the Group estimates that an actuarial gain of approximately USD 0.1 million will be recognized in OCI for 2013.
IFRS 10 – Consolidated Financial Statements. This standard replaces the portion of IAS 27 – Consolidated and Separate Financial Statements that addresses the accounting for consolidated financial statements. IFRS 10 establishes a single control model that applies to all entities including special purpose entities. The changes introduced by IFRS 10 will require management to exercise significant judgment to determine which entities are controlled, and therefore, are required to be consolidated by a parent, compared with the requirements that were in IAS 27. The application of this standard will not have an impact on the financial position of the Group. This standard becomes effective for annual periods beginning on or after 1 January 2014.
IFRS 11 – Joint Arrangements. This standard replaces IAS 31 – Interest in Joint Ventures and SIC-13 – Jointly–controlled Entities – Non-monetary Contributions by Venturers. It removes the option to account for jointly controlled entities (JCEs) using proportionate consolidation. Instead, JCEs that meet the definition of a joint venture must be accounted for using the equity method. The application of this standard will not have an impact on the financial position of the Group. This standard becomes effective for annual periods beginning on or after 1 January 2014.
IFRS 12 – Disclosures of interest in other entities. This standard includes the disclosure requirements for all forms of interests in other entities, including joint arrangements, associates, special purpose vehicles and other off balance sheet vehicles. The application of this standard will not have an impact on the financial position of the Group. This standard becomes effective for annual periods beginning on or after 1 January 2014.
IFRS 13 – Fair Value Measurement. This standard establishes a single source of guidance under IFRS for all fair value measurements. IFRS 13 does not change when an entity is required to use fair value, but rather provides guidance on how to measure fair value under IFRS when fair value is required or permitted. The Group is currently assessing the impact that this standard will have on the financial position and performance. This standard becomes effective for annual periods beginning on or after 1 January 2013.
There are no other IFRSs or IFRIC interpretations that are not yet effective that is expected to have a material impact on the Group.
Note 3 - Segment information
The Company and the chief operating decision maker (“CODM”) measure performance based on the Company’s overall return to shareholders based on consolidated net income. The CODM does not regularly review a measure of operating result at a lower level than the consolidated group. Consequently, the Company has only one reportable segment: chemical tankers. (USD '000)
2012 2011
Freight revenue 401 248 426 039
Voyage expenses -206 655 -225 465
Freight income on T/C basis 194 593 200 574
Management fees and other income 1 933 5 654
Gross profit 196 527 206 228

GROUP
35
The Company’s management does not evaluate performance by geographical region. The Company does not have any counterpart that contributes to more than 10 per cent of the total operating revenues.
Note 4 - Onerous contracts (USD '000)
Note 5 - Voyage expenses (USD '000)
Port expenses include pilotage, towage, agency fee, survey, stevedoring and cleaning.
Note 6 - Management fee and other income (USD '000)
The Company discontinued as pool manager in the first half of 2012.
Note 7 – Ship operating expenses (USD '000)
2012 2011
At 1 January 670 6 250
Provisions made during the year - 670
Provisions used during the year -670 -2 083
Provisions reversed during the year - -4 167
At 31 December - 670
Figures in USD '000 2012 2011
Bunker expenses 142 593 156 772
Port expenses 54 864 59 101
Other voyage expenses 9 198 9 592
Total 206 655 225 465
Figures in USD '000 2012 2011
Management fee from pools 1 836 5 353
Other 97 301
Total 1 933 5 654
Figures in USD '000 2012 2011
Crew expenses 57 001 58 262
Technical expenses 30 534 31 005
Other expenses (insurance, fees, etc) 31 821 33 877
Total 119 356 123 144

GROUP
36
Note 8 - Other specifications to the income statement
(USD '000) Employee benefits expense
At 31 December 2012, the Company had 79 permanent employees onshore (2011: 87) and 1,250 crew members employed on its vessels or on leave (2011: 1,340). Remuneration
The members of the Board of Directors and Executive Management have no loans or guarantees from the Company. Refer to note 2 in parent company for remuneration to Executive Management. Compensation to the Board The compensation to the Board is determined on a yearly basis by the Company in its Annual General Meeting. Refer to note 2 in parent company for further information. In addition to the Board of Directors remuneration, Chairman of the board Aage Rasmus Bjelland Figenschou was engaged by the Company as a consultant and received payment of USD 25 thousand and USD 98 thousand for services provided in 2011 and 2012 respectively. Former Chairman of the Board Bjørn J. Sjaastad, was also engaged by the Company as a consultant and received payment of USD 131 thousand and USD 211 thousand in 2011 and 2012 respectively. Benefits upon termination of employment Executive management have termination compensation built into their contracts of employment. Compensation varies between 3 to 9 months for members of executive management. Executive management currently consist of five people.
Figures in USD '000 2012 2011
Included in ship operating expenses:
Wages and salaries, seafarers 43 679 43 703
Social security costs, seafarers 1 116 835
Total 44 795 44 538
Included in General and administrative expenses:
Wages and salaries 12 191 13 569
Social security costs 1 175 1 298
Pension costs (Note 13) 790 523
Share incentive programme - 446
Total 14 156 15 836
2012 2011
Chief Executive Officer
Remuneration 598 775
Pension 18 106
Bonus - -
Executive Management
Remuneration 1 188 2 018
Pension 91 164
Bonus - -
1 895 3 063
Board of Directors 283 306
Total remuneration 2 179 3 370
Total compensation paid to the CEO and Executive Management

GROUP
37
Bonus agreement The Company has established a discretionary bonus scheme for key employees which is based on an evaluation of the Company’s and the employee’s performance. Employee share option program Senior management participates in a share-based incentive program, where the employees are granted share options. The program does not provide the choice of cash settlement instead of shares. The fair value of the shares and options are measured at the grant date and is recognised in the income statement under General and Administrative expenses over the vesting period. Eitzen Chemical has used the Black & Scholes option pricing model based on the exercise price. The total number of shares to be issued under the share option program is limited up to a maximum of 18,854,446 shares.
Each share option gives the right to acquire one share. The strike price was NOK 1.90 per share on the date of the award, increasing by ten per cent per annum. The strike price was calculated based on the average share price of Eitzen Chemical from the summons to the Extraordinary General Meeting on 5 November 2009 and the Extraordinary General Meeting held on 26 November 2009. On 5 February 2013 the Company held an extraordinary general meeting whereby a reverse share split in the ratio 100:1 was approved. The number of number of share options currently exercisable is 80,400 and the weighted average exercise price is NOK 231. Refer to note 23 for further information. Allotted share options can be exercised over a period of five years. One third of the allotted share options can be exercised twelve months after the date of allotment, one third can be exercised 24 months after the date of allotment and one third can be exercised 36 months after the date of allotment. Options that are vested shall be valid and can be declared for a period of 60 months from the award date.
Remuneration to the auditors (ex VAT)
Number of
share options
Weighted
average
exercise price
Number of
share options
Weighted
average
exercise price
(NOK) (NOK)
At the beginning of the year 11 280 000 2.31 16 020 000 2.31
Granted during the year - - - -
Forfeited during the year -3 240 000 2.31 -4 740 000 2.31
Exercised during the year - - - -
Outstanding at the end of the year 8 040 000 2.31 11 280 000 2.31
Exercisable at the end of the year 8 040 000 2.31 7 520 000 2.19
2012 2011
Figures in USD '000 2012 2011
Statutory audit 429 435
Other assurance services 3 20
Tax assistance 98 33
Other non-assurance services 3 3
Attestation services 25 6
Total 556 497

GROUP
38
Note 9 - Financial items (USD ‘000)
* Other financial income in 2012 is mainly related to two of the Company’s time charter contracts accounted for as
finance leases which expire in the first half of 2013 and where it is assumed that the purchase options on these vessels will not be exercised. Refer to note 18 for further information.
** Other financial expenses in 2012 include debt restructuring fees of USD 5.8 million.
Foreign exchange gains and losses relates mainly to exchange rate fluctuations in Norwegian and Danish kroner, Euro and Japanese Yen. Note 22 include further details on foreign currency risk and exposure. Items of income, expenses, gain and losses
Interest income
Figures in USD '000 2012 2011
Bank interest 92 309
Interest income, other - 144
Total 92 453
Interest expenses
Figures in USD '000 2012 2011
Interest expense, debts and borrowings -35 266 -30 059
Interest expense, finance leased vessels -11 710 -13 624
Total -46 976 -43 683
Other financial items
Figures in USD '000 2012 2011
Foreign exchange gain 11 171 41 211
Foreign exchange net gain, finance lease 3 626 5 943
Other financial income * 32 239 1 724
Other financial income 47 036 48 878
Foreign exchange loss -17 312 -41 635
Changes in market value of financial instruments -169 -285
Other financial expenses ** -7 156 -4 392
Other financial expenses -24 637 -46 312
Total 22 398 2 566
2012 Debt and
payables
Loan and
receivables
Other financial
assets/ liabilities Total
Interest income - 92 - 92
Interest expense -46 976 - - -46 976
Other financial items 3 626 -6 141 24 913 22 398
Net financial income/(expenses) -43 350 -6 049 24 913 -24 486

GROUP
39
Items of income, expenses, gain and losses
Note 10 - Income tax expense (USD ‘000) The Company’s and / or its subsidiaries’ activities will to a large extent be governed by the fiscal legislation of the jurisdictions where it is operating. Thus, the Company is exposed to a risk regarding the correct application of the tax regulations as well as possible future changes in the tax legislation of those relevant countries. In addition, the Company is, to a certain extent, exposed to different rules on freight duty and withholding tax. The Company participates in the tax scheme in Singapore. All qualified shipping income derived from the shipping activity is exempt from taxation for the duration of the Approved International Shipping Enterprise (AIS) approval. The AIS approval has been granted for a period of ten years commencing November 2004. Furthermore, dividend paid from Singapore to the parent company in Norway is also exempt from tax. Income taxes included in the income statement
Effective tax rate
2011 Debt and
payables
Loan and
receivables
Other financial
assets/ liabilities Total
Interest income - 309 144 453
Interest expense -43 683 - - -43 683
Other financial items 5 943 -424 -2 953 2 566
Net financial income/(expenses) -37 740 -115 -2 809 -40 664
2012 2011
Tax payable -1 -19
Changes in deferred tax - -2 555
Tax adjustments previous years - 44
Income taxes -1 -2 530
2012 2011
Profit (loss) before taxes -136 315 -151 499
Statutory tax rate (Norway) 28% 28 %
Estimated tax expenses at statutory tax rate 38 168 42 420
Non-deductible expenses (incl impariment of assets) -19 775 -18 032
Share issuance cost recorded in equity - 2 208
Income/loss not subject to tax/countries with lower tax rate -25 017 -49 989
Tax loss carried forward and other tax credits 6 622 20 864
Income tax expense -1 -2 530
Effective tax rate in % 0 % 2 %

GROUP
40
* Eitzen Chemical ASA realized a loss from an internal sale of shares in subsidiaries in 2012, due to a company
restructuring following the new loan agreements with the lenders of the Eitzen Chemical Group. Refer to note 6 in parent company for further information. In the tax return for 2012 Eitzen Chemical ASA intends to claim a tax loss from the transaction of USD 291.6 million. However, there is a risk whether the transaction is within the scope of the Tax Exemption Method in Norway. In this case, the transaction may not be tax deductible.
The temporary differences as of 31 December 2012 and 2011 are mainly related to companies taxable in Norway and Denmark. USD 351.0 million (2011: USD 46.3 million) of the deferred tax assets relates to tax loss carried forward in Norway and Denmark. Loss carried forward in Norway and Denmark is not subject to expiration. Tax liabilities related to limited liability companies taxed in Norway amounts to USD 1.4 million (2011: USD 10.4 million). In addition, deferred tax liabilities related to surplus values from business combinations amount to USD 1.3 million (2011: USD 1.7 million).
Note 11 - Earnings per share Basic and diluted earnings per share are calculated by dividing net profit (loss) for the year attributable to ordinary equity holders by the weighted average number of ordinary shares outstanding during the year. On 5 February 2013 the Company held an Extraordinary General Meeting whereby a reverse share split in the ratio 100:1 was approved. Refer to notes 16 and 23 for further information. Earnings per share for both 2012 and 2011 have been calculated based on the weighted average number of shares adjusted for the reverse split. The following reflects the income and share data used in the total operations basic and diluted earnings per share computations:
The Board of Directors has proposed that no dividend will be paid for the financial year 2012 (2011: 0). Treasury shares are not included in the weighted average number of shares.
2012 2011
Deferred tax
Loss carried forward * 351 028 46 340
Other temporary differences 4 190 950
Deferred tax assets 355 219 47 290
Deferred tax liabilities
Non-current liabilities -2 743 -12 143
Deferred tax liabilities -2 743 -12 143
Net deferred tax assets/(-liabilities) 352 476 35 147
Deferred tax assets not recorded in balance sheet -352 476 -35 147
Recorded deferred tax assets/(-liabilities) in balance sheet - -
Figures in USD '000 2012 2011
Net profit (loss) attributable to equity holders (USD '000 ) -136 316 -154 029
Number of shares outstanding end of period 1 127 012 323 1 127 012 000
Weighted average number of ordinary shares outstanding in the period 1 127 012 323 991 672 702
Weighted average number of ordinary shares for earnings per share calculation 11 270 123 9 916 727
Earnings per share - basic/diluted earnings per share (USD) -12.10 -15.53

GROUP
41
Note 12 – Vessels (USD ‘000)
All owned vessels are pledged to secure various banking facilities (refer to note 18 for further information). The Company is not aware of any pledges on finance leased vessels, but such arrangements might however exist.
* The Company recalculated the finance lease obligations and updated the estimates for vessels accounted for finance
leases. This resulted in non-cash effect of USD 22.5 million as at 31 December 2011, decreasing total finance lease obligations. The Company determined that USD 11.4 million of this effect has corresponding balance sheet effect on vessels held under finance leases.
At 1 January 2012, net of cost and
accumulated depreciation 759 500 235 637 419 995 555
Additions (mainly upgrading and docking of vessels) 14 540 203 63 14 806
Disposals -16 216 - -168 -16 384
Depreciations for the year -51 721 -12 949 -108 -64 779
Impairment - -70 391 - -70 391
At 31 December 2012, net of costs and
accumulated depreciation 706 102 152 499 205 858 807
At 31 December 2012
Cost 1 067 345 347 445 1 112 1 415 902
Accumulated impairment -159 424 -107 638 - -267 062
Accumulated depreciation -201 819 -87 308 -906 -290 033
Net carrying amount 706 102 152 499 206 858 807
No. of vessels 36 10 46
31 December 2012 Vessels Finance lease
vessels
Other fixed
assets Total
At 1 January 2011, net of cost and
accumulated depreciation 853 699 285 252 568 1 139 519
Additions (mainly upgrading and docking of vessels) 16 033 3 794 44 19 871
Effect of update of lease schedules * - -11 377 - -11 377
Disposals -3 652 -12 546 -4 -16 202
Depreciations for the year -56 401 -17 155 -193 -73 749
Impairment -50 179 -12 331 -62 510
Exchange adjustment - - 4 4
At 31 December 2011, net of costs and
accumulated depreciation 759 500 235 637 419 995 556
At 31 December 2011
Cost 1 113 203 347 243 1 990 1 462 436
Accumulated impairment -167 676 -37 247 - -204 923
Accumulated depreciation -186 027 -74 359 -1 571 -261 957
Net carrying amount 759 500 235 637 419 995 556
No. of vessels 39 10 49
Vessels Finance lease
vessels
Other fixed
assets Total 31 December 2011

GROUP
42
Vessels Vessels are depreciated on a straight-line basis. The expected useful life of the vessels is estimated to 25 years. Docking and coating costs are capitalized and depreciated over the estimated period to the next docking or coating (3 and 7 years respectively). The expected residual value is USD 325 per light displacement ton (2011: USD 325). Commitments related to lease vessels are described in Note 19. Loss from sale of vessels amounts to USD 10.2 million in 2012 (2011: gain USD 3.7 million). Impairment The Company has performed an impairment test where the value in use is calculated using estimated cash flows that reflect the Company’s expectation that the chemical tanker market is at the bottom of the downturn in the market cycle, and that the rates will gradually improve to a balanced and sustainable level in 2015. An impairment loss of USD 70.4 million was recorded as of 31 December 2012 (2011: USD 62.5 million). The impairment is related to vessels in the Company’s lease portfolio. The impairment reflects the effect of updated assumptions of vessels in the lease portfolio including the contractual expiry of two vessels in 2013. The contractual expiry of the two vessels has an effect on the estimated finance lease obligations. Refer to note 18 for further information. Impairment indicators The chemical tanker market continued at a weak level in 2012. In addition, based on the average quotes from two independent broker firms, the estimated market value of the vessels was below the book value of the vessels at 31 December 2012. Recoverable amount An impairment test has been performed based on the estimated future value in use of the fleet. The Company has defined the entire fleet as a CGU, due to the Company’s operational strategy to manage the fleet as a portfolio and thereby optimizing the portfolio’s cash flow and the earnings for the entire Company. Recoverable amount for vessels in the lease portfolio, where it is assumed that the purchase options will not be exercised, is determined to be the net present value of cash flows to expiry of the lease. The net present value of future cash flows was based on a pre-tax weighted average cost of capital (WACC) of 8.0 per cent in 2012 (2011: 6.8 per cent). Key assumptions The estimated cash flows are based on management’s best estimate and reflect the Company’s expectation that the market will recover to a sustainable level due to improvements in the supply and demand development. The cash flows for 2013 are based on the Company’s budget. The Company expects improved market balance through ample demand growth combined with reduced fleet growth in 2014, a gradual move towards a normalized market in 2015. Further, it is the Company’s expectation that the rates obtained when the market is more balanced, is fundamentally improved with rates corresponding to the market in 2006/2007. From 2016 and onwards, the model is based on a zero-growth scenario. The cash flows are estimated over the remaining economic life of the vessels, with an estimated residual value at the end of the economic life based on USD 325 per light displacement ton. For finance leased vessels with purchase options where it is assumed that the options will be exercised and the Company expect the continuing use of the vessel, the cash flows are based on the remaining economic life of the vessels. Compared to the impairment test performed as of year-end 2011, the underlying assumptions in the impairment test are based on a similar market scenario. The impairment recognized reflects updated assumptions on the exercise of purchase options and continuing use of the vessels in the lease portfolio. The WACC was estimated as follows:
Borrowing rate: Debt ratio*(10 years US Government bond + loan margin) + Equity Return: Equity ratio*(10 years US Government bond + Beta * market premium) = WACC

GROUP
43
If vessels are sold or disposed in a distressed situation before the estimated improved market rates used in the impairment test has materialized, there is a risk that the company might experience further losses or impairment charges on its vessels. Sensitivities A negative change in the estimated TC rate (see Key assumptions above) from 2013 of USD 1,000 per day would increase the impairment with USD 66.8 million, all other factors held constant. A positive change in the estimated TC rates of USD 1,000 per day would not have an effect on the impairment as the impairment reflects the updated assumption that the Company will not exercise the purchase options on certain vessels in the lease portfolio. If the estimated cost of capital used in the vessel valuation model had been 1.0 per cent higher than the cost of capital used in the model, the impairment would have increased by USD 11.8 million. If the cost of capital had been 1.0 per cent lower, the impairment would not have been affected.
Note 13 - Pensions and other post-employment benefit plans Pension Cost, Funding and Obligations In Norway there is a defined benefit pension plans for the employees. The plan is funded through an insurance company. An unfunded benefit pension plan was terminated in 2012. The current benefit pension plan defines the amount of pension that an employee will receive upon retirement, usually dependent on one or more factors such as age, years of service and compensation. Some employees in Denmark are part of a contribution plan where the Company pays fixed contributions into a separate entity. The Company has no legal or constructive obligations to pay future contributions if the fund does not hold sufficient assets to pay all employees the benefit relating to employee service in the current and prior periods. As at 31 December 2012 the Company has recorded a net pension liability of USD 0.2 million (2011: USD 0.6 million). Refer to note 9 in the financial statements of the parent for further details. Defined contribution plan Expenses in 2012 related to contribution plans amount to USD 0.5 million (2011 USD 0.5 million).
Note 14 - Trade and other receivables (USD ‘000)
All receivables are non-interest bearing. The majority of the receivables are receivables from customers and generally due within 3 to 30 days after discharge. Demurrage receivables have different payment terms. Carrying amount of trade receivables as of year-end are as follows:
Figures in USD '000 2012 2011
Trade receivables 35 095 43 910
Accrued income 9 743 10 289
Other receivables 6 112 8 176
Total 50 951 62 375
Figures in USD '000 Not due < 90 d > 90 d Total
Trade receivables, carrying amount as of 31 December 2012 16 815 11 367 6 913 35 095
Trade receivables, carrying amount as of 31 December 2011 19 563 16 075 8 273 43 910
Past due, but not impaired

GROUP
44
Trade receivables are impaired individually or collectively. As at 31 December 2012 the provision for loss on debtors amounts to USD 2.9 million (2011: USD 2.8 million). Movements in the provision for impairment of trade receivables are as follows:
Note 15 - Cash and cash equivalents (USD ‘000)
The fair value of cash and cash equivalents is USD 30.9 million (2011: USD 66.8 million). The Company does not have any undrawn committed borrowing facilities available as per 31 December 2012 (2011: USD 0.0 million). The Company has through the financial restructuring completed in January 2013 secured a new working capital facility of USD 30 million. Refer to notes 18 and 23 for further information.
Note 16 - Share capital and reserves
As of 31 December 2012 the Company has a share capital of USD 148,036,668, which consists of 1,128,022,323 each with par value of NOK 0.75. On 5 February 2013 the Company held an extraordinary general meeting whereby a reverse share split in the ratio 100:1 was approved. The company’s share capital is currently NOK 846,016,800 divided between 11,280,224 shares, each with a par value of NOK 75. Also refer to note 23.
2012 2011
At 1 January 2 847 2 586
Net provision recognised 1 917 2 529
Utilised -1 851 -2 268
At 31 December 2 913 2 847
Figures in USD '000 2012 2011
Cash at bank and in hand 29 010 65 738
Cash at bank, restricted 1 807 797
Employee tax withholding accounts 109 291
Total 30 926 66 826
Authorised shares
Number of
shares NOK '000 USD '000
At 31 December 2010 754 177 831 754 178 128 279
Reduction of share capital on 9 May 2011 - -188 544 -32 070
Shares issued on 12 May 2011 in connection with private placement 371 937 500 278 953 51 563
Shares issued on 8 June 2011 in connection with subsequent offering 1 906 992 1 430 265
At 31 December 2011 1 128 022 323 846 017 148 037
Changes in shares and share capital in the period - - -
At 31 December 2012 1 128 022 323 846 017 148 037

GROUP
45
Shareholder information Shareholders as of 31 December 2012 are specified below:
Directors and Key Management personnel interest At 31 December 2012 the Board of Directors and Key Management Personnel held shares in Eitzen Chemical as follows:
1) Shares are owned through Luuna AS, a company controlled by Heidi Marie Petersen. 2) 1 000 000 of the shares are owned through Capreca AS, a company controlled by Carl Erik Steen.
Note 17 - Trade and other payables (current) (USD ‘000)
Name:
Number of
shares Ownership
Jason Shipping ASA 383 532 236 34.0%
Skandinaviska Enskilda Banken AB 56 398 182 5.0%
Odin Maritim 17 430 831 1.5%
Apollo Asset Limited 15 945 000 1.4%
Hustadlitt A/S 14 945 000 1.3%
Sabaro Investments Ltd 14 200 000 1.3%
MP Pensjon PK 14 011 700 1.2%
Torgeir Herfindal 10 800 000 1.0%
Toluma Norden AS 10 450 500 0.9%
BNY Mellon 10 426 088 0.9%
Other 578 872 786 51.3%
Total numbers of shares excluding treasury shares 1 127 012 323 99.9%
Treasury shares at 31 December 2012 1 010 000 0.1%
Total numbers of shares including treasury shares 1 128 022 323 100.0%
Total number of shareholders 2 678
Foreign ownership 131 448 481 11.7%
Directors and Key Management Personnel Position
Number of
shares
Share
options
Aage Rasmus Bjelland Figenschou Chairman of the Board - -
Helene Jebsen Anker Board member 336 000 -
Heidi Marie Petersen 1) Board member 250 000 -
Carl Erik Steen 2) Board member 2 104 075 -
Per Sylvester Jensen Chief Excecutive Officer 10 000 2 400 000
Andreas Reklev Chief Financial Officer 1 848 -
Geir Frode Abelsen Chief Technical Officer - 1 200 000
Aage Rasmussen Senior Vice President - 1 800 000
Martin D. Solberg Senior Vice President - -
Figures in USD '000 2012 2011
Trade payables 16 237 19 171
Accrued expenses 35 609 32 993
Deferred income 5 457 8 255
Other payables 1 265 10 367
Total 58 568 70 786

GROUP
46
Note 18 - Interest-bearing loans and borrowings (USD ‘000)
* USD 769.8 million of the Company’s bank and bond debt has been classified as short term debt at year-end 2012 as
the new loan agreements with its syndicate banks and the trustee of the bond loan was finalized on 4 January 2013. However, both the bank and bond debt have been restructured and is not payable short term at the date of approval of these financial statements. Refer to the Financial restructuring of bank loan agreements in 2012 section below for further information on the restructuring of the debt. Accrued interest expenses under the new loan agreements are classified as non-current.
** Two of the Company’s time charter contracts accounted for as finance leases will expire in the first half of 2013. It is assumed that the purchase options on these vessels will not be exercised and the estimated lease obligations have been updated. Consequently, a non-cash reduction in finance lease obligations of USD 30.4 million is reported as finance income in 2012.
Included in the facilities above are deferred charges of borrowing costs of USD 1.5 million (2011: USD 4.2 million). The following table provides an overview of the contractual undiscounted cash flows for the Company’s interest-bearing loans, assuming that the margins are capitalized and payable on the maturity date. For the determination of interest payments, the Company have used LIBOR as at the reporting date. Refer to note 22 for further details on the Company’s liquidity risk. (USD ‘000)
The following table provides an overview of the expected undiscounted cash flows for the finance lease vessels, including service cost element and option payments on vessels where it is assumed that the options will be exercised. (USD ‘000)
Figures in USD '000 Current * Non-current Total Current Non-current Total
NOK 490 million and USD 25 million bond loan 112 718 1 611 114 330 - 105 888 105 888
USD 510 million credit facility 266 802 2 380 269 182 3 227 263 852 267 079
USD 265 million credit facility 189 956 1 640 191 596 2 142 187 889 190 031
USD 170 million credit facility 160 333 1 278 161 611 3 929 155 895 159 824
Other loan agreements 39 984 6 354 46 338 2 371 48 142 50 513
Total interest-bearing loans 769 793 13 263 783 055 11 669 761 666 773 335
Leasing debt ** 12 380 140 149 152 529 13 406 186 587 199 993
Total 782 173 153 412 935 585 25 075 948 253 973 328
20112012
Figures in USD '000
2013 2014 2015 2016 2017 -
Contractual
cash flows
Carrying
amount
NOK 490 million and USD 25 million bond loan 53 54 55 139 916 - 140 077 114 330
USD 510 million credit facility 964 1 194 22 415 300 690 - 325 263 269 182
USD 265 million credit facility 1 139 871 15 089 216 848 - 233 946 191 596
USD 170 million credit facility 953 756 15 984 184 128 - 201 820 161 611
Other loan agreements 397 6 203 8 173 41 321 - 56 095 46 338
Total payments on interest-bearing loans 3 506 9 077 61 715 882 903 - 957 201 783 055
2013 2014 2015 2016 2017 -
Expected
cash flows
Carrying
amount
Total payments on finance lease obligations 33 007 59 646 20 171 32 938 66 198 211 959 152 529

GROUP
47
The following table provides an overview of currencies in which the carrying amounts of interest-bearing liabilities are denominated. (USD ‘000)
Bank syndicate loan agreements Eitzen Chemical (Singapore) Pte Ltd. has three syndicate facility agreements, USD 510 million, USD 265 million and USD 170 million, with Nordea Bank Finland Plc., Singapore Branch as agent and certain banks as lenders. Final maturity was in July 2014. Eitzen Chemical ASA was the guarantor of the loan. The facilities were secured by a first priority charge inter alia in vessels and proceeds from the vessels. All syndicate bank loans agreements were in USD at LIBOR plus a fixed margin of 2.75 per cent per annum. Bilateral loan agreements Two companies in the Eitzen Chemical Group had entered into USD 15 million and USD 4.7 million loan agreements, respectively, with Nordea Bank Finland Plc, Singapore Branch and one company had a USD 36 million loan agreement with DVB Bank SE. The loans were secured by inter alia a mortgage over the relevant vessels and a guarantee from the Eitzen Chemical ASA. All bilateral loan agreements were in USD at LIBOR plus a fixed margin of 2.75 per cent. Bond loan agreement Eitzen Chemical ASA had unsecured bond loans outstanding totalling NOK 490 million and USD 25 million at 31 December 2012. Under the previous loan agreements, the bonds carried interest of NIBOR + 3.5 per cent and LIBOR + 3.5 per cent, respectively. The bond loans had a loan to value covenant effective from 6 November 2012. Until the completion of the financial restructuring in January 2013, Eitzen Chemical’s syndicate and bilateral bank loans included financial covenants on minimum cash and minimum value clauses. The Company was granted waivers on all existing financial covenants relating to its bond and bank loan agreements at 31 December 2012. Financial restructuring of bank loan agreements in 2012 On 22 November 2012, Eitzen Chemical announced that the consensual financial restructuring of the Company’s bank and bond debt was approved by all of the banks in the Company’s loan syndicates. The restructuring is based on a slowly improving market and will secure headroom and stable operations in the years to come. With reference to note 23, the new loan agreements were formally signed on 4 January 2013. The key terms in the restructuring agreement include: New working capital facility
- The Company has secured a new working capital facility of USD 30 million. The facility is split into (i) a term loan facility of USD 10 million and (ii) a revolving credit facility of USD 20 million.
- The new facilities are secured by a first ranking lien in certain of the Company’s vessels. - Maturity of term loan facility is in May 2016 and the revolving credit facility will mature in April 2016,
with five quarterly equal reductions to commence from April 2015. - Payment of interest is under a “pay-as-you-can” structure where the margin of 8.95 per cent p.a. is
only payable to the extent it can be paid with excess cash until maturity and LIBOR shall be paid in cash. If not paid in cash the margin will be capitalized and be payable on the maturity date together with an additional margin of 2.05 per cent p.a.
- The new facilities have similar covenants as the senior bank loans.
Figures in USD '000 2012 2011
US Dollars 806 954 850 853
Japanese Yen 39 555 41 434
Norwegian Kroner 89 075 81 041
Total 935 585 973 328

GROUP
48
Restructuring of the bond loan: - The bond loan comprising a NOK tranche of NOK 490 million (ISIN NO 001033434.5) and a USD
tranche of USD 25 million (ISIN NO 001033433.7) was in January 2013 exchanged into (i) a secured loan of approximately USD 50 million and (ii) an unsecured loan of approximately USD 60 million. The secured loan has a third ranking lien security in the Company’s vessels (owned through subsidiaries). Eitzen Chemical ASA is the borrower for both loans. The loans have NOK and USD tranches as in the previous bond loan agreement.
- The secured loan will mature in June 2016 with no instalments until maturity. The loan will receive payment-in-kind interest of NIBOR/LIBOR plus 11 per cent p.a. due at maturity.
- The restructured interest terms of the Company’s loans were effective from October 2012. - The unsecured loan will mature in September 2016 with no instalments or interest payments until
maturity. If the Company raises new equity (in the form of cash) of at least USD 50 million, the unsecured loan can be called and redeemed in full in exchange for an amount equal to USD 10 million of new equity in the Company.
- The loans do not include any financial covenants. - The bond restructuring fee agreed in 2009 due in November 2012 were postponed to maturity of the
secured loan.
Restructuring of the senior bank loans:
- The senior bank loans consists of the USD 510 million, USD 265 million and USD 170 million bank syndicate loan agreements and the USD 36 million, USD 15 million and USD 4.7 million bilateral loan agreements.
- USD 30 million of the existing senior bank loans with a principal amount of approximately USD 661 million was converted into a third lien loan of USD 30 million. The third lien loan has third lien security in the Company’s vessels (owned through subsidiaries).
- Maturities are extended to May 2016 for the existing bank loans and June 2016 for the new third lien loan.
- The grace period with no fixed debt instalments was extended from November 2012 until April 2015. Furthermore, the Company has the option to defer three quarterly instalments until maturity in 2016 (with a maximum of two deferrals in one year).
- Payment of interest is under a “pay-as-you-can” structure where the margin of 2.75 per cent p.a. is only payable to the extent it can be paid with excess cash in the period until 1 January 2015 and LIBOR shall be paid in cash. If not paid in cash the margin is capitalized and payable on the maturity date together with an additional margin of 3.05 per cent p.a. From 1 January 2015, the interest payments will be reset to the pre-restructuring level of LIBOR plus 2.75 per cent p.a.
- The restructured interest terms of the Company’s loans were effective from October 2012. - A new mechanism for sweep of excess cash and potential variable debt amortisation depending on
the Company’s financial performance was introduced. - Existing financial covenants was suspended until maturity. The Company has a minimum liquidity
covenant of USD 30 million. - The bank restructuring fee agreed in 2009 due in November 2012 was postponed to final maturity.
The Company agreed to a new restructuring fee of USD 10 million. Approximately USD 4.5 million was paid in January 2013, when the new term loan facility became available, while approximately USD 5.5 million is due on final maturity.
Third lien bank loan:
- USD 30 million of the existing senior bank loans was in January 2013 converted into a new facility in the principal amount of USD 30 million with Eitzen Chemical ASA as borrower and third lien security in the Company’s vessels (owned through subsidiaries).
- The loan will mature in June 2016 with no instalments until maturity. - Payment of interest is under a “pay-as-you-can” structure where the margin of 8.95 per cent p.a. is
only payable to the extent it can be paid with excess cash until maturity and LIBOR shall be paid in cash. If not paid in cash the margin will be capitalized and be payable on the maturity date together with an additional margin of 2.05 per cent p.a.
- The loan does not include any financial covenants and ranks pari passu with the secured bond loan described above.

GROUP
49
Note 19 - Commitments Lease commitments The Company had 14 vessels on lease as per 31 December 2012 (2011: 14), of which 10 (2011: 10) vessels are recorded as finance leases (on balance sheet), and 4 vessels (2011: 4) are recorded as operating leases (off balance sheet). The vessels are either on Bareboat (BB) or Time Charter (T/C). The Company is responsible for the technical management of the BB vessels, while the leasing counterparts are responsible for the technical management of the TC vessels. The charters have a firm charter period, and the Company has an option to extend the charter for multiple years (except Sichem Aneline, Sichem Mississippi and Sichem Pace). The minimum leasing period and the maximum leasing period are shown in the table below. Eitzen Chemical has options to purchase all leased vessels except Sichem Pace. The first possible purchase date is included in the table below. Under the current loan agreements, the Company needs to obtain consent from a certain majority of the lenders under each of the loans for new investments, including declaring purchase options.
* Maturity date of the firm charter period. Most of the leased vessels have options to extend the charter and option to
purchase the vessel on or before the end of the firm charter period. ** The purchase price indicates the option price at the latest possible exercise date
Finance lease commitments The total balance sheet commitments as per 31 December 2012 were USD 152.5 million (2011: USD 200.0 million). The table on the next page shows future minimum lease payments, given the expected lease term, for the finance lease vessels and the present value of the net minimum lease payments for different time horizons.
Vessel DWT Contract Lease Min period end * Max period end Latest excercise Purchase Price **
Sichem Aneline 8 940 BB Financial Q3'18 Q3'18 Q3'18 JPY 348M
Sichem Mumbai 13 058 BB Financial Q4'16 Q4'18 Q4'18 USD 8.5M
Sichem Amethyst 8 750 T/C Financial Q4'13 Q4'16 Q4'16 JPY 840M
Sichem Ruby 8 750 T/C Financial Q3'13 Q3'16 Q3'16 JPY 840M
Sichem Contester 19 821 T/C Financial Q4'14 Q4'19 Q4'19 JPY 1,510M
North Contender 19 925 T/C Financial Q4'10 Q4'15 Q1'14 USD 18.8M
North Fighter 19 932 T/C Financial Q1'11 Q1'16 Q2'14 USD 18.8M
Sichem Defender 19 999 T/C Financial Q1'14 Q1'19 Q1'19 JPY 1,485M
Siteam Neptun 48 309 T/C Financial Q2'10 Q2'13 Q2'13 USD 15.8M
Siteam Jupiter 48 309 T/C Financial Q2'10 Q2'13 Q2'13 USD 15.8M
Sichem Mississippi 12 272 BB Operational Q4'28 Q4'28 Q4'28 JPY 1,060M
Sichem Pace 19 998 BB Operational Q3'14 Q3'14 No option No option
Sichem Onomichi 13 104 T/C Operational Q1'15 Q1'18 Q1'18 USD 16.6M
Sichem Hiroshima 13 119 T/C Operational Q2'15 Q2'18 Q2'18 USD 16.6M

GROUP
50
(USD ‘000)
Included in the debt is an unrealised currency loss of USD 9.2 million (2011: Loss of USD 12.9 million) related to purchase options nominated in Japanese Yen. The USD/JPY rate was 86.10 per 31 December 2012 (2011: 77.44). Payment if option on finance leased vessels is exercised If the Company has an option to purchase a vessel at a price, which at the inception of the lease is expected to be significant lower than the fair value at the date the option becomes exercisable, the lease payments comprise the payment required to exercise the option. Hence, the lease liabilities recorded in the balance sheet consist of one part which is deemed hire payments and one part which is the payment required if the option to purchase the vessel should be exercised. The split between hire payments and payments required if the option should be exercised is included in the table below. (USD million)
Operating expense commitments on time charter vessels under finance lease:
(USD ‘000)
Operating lease commitments On the next page is an overview of the operating lease commitments. The table is divided into charter hire for operating leased vessels on time charter and bare-boat charter. Other leases are rent, cars and office equipment.
Figures in USD '000
Minimum
payments
Present
value of
payments
Minimum
payments
Present
value of
payments
Within one year 21 009 20 502 25 125 24 258
After one year, but not more than five years 108 543 91 537 150 886 129 397
More than five years 52 713 40 490 65 558 46 338
Total minimum lease payments 182 265 152 529 241 569 199 993
Less amounts representing finance charges -29 735 - -41 576 -
Present value of minimum lease payments 152 529 152 529 199 993 199 993
2012 2011
2013 2014 2015 2016 2017 - Total
Maturity of booked finance lease 20 502 46 476 11 212 25 713 48 626 152 529
Whereof payments if option is excercised - -33 775 - -16 780 -34 195 -84 751
Hire obligation under finance leases 20 502 12 701 11 212 8 933 14 431 67 779
Figures in USD '000 2012 2011
Falling due within one year 11 981 15 482
Falling due between one and five years 21 996 30 557
Falling due after five years 4 902 7 525
Total 38 880 53 564

GROUP
51
(USD ‘000)
* Other operating leases include premises, cars and office equipment
Note 20 - Financial instruments Carrying amount and fair value of financial items by class of financial assets and liabilities The fair value of the financial assets and liabilities are included at the amount at which the instrument could be exchanged in a current transaction between willing parties, other than in a forced or liquidation sale. The following methods and assumptions were used to estimate the fair values: Cash and short-term deposits, trade receivables, trade payables and other current liabilities Cash and short-term deposits, trade receivables, trade payables and other current liabilities approximate their carrying amounts largely due to the short-term maturities of these instruments. Long-term fixed-rate and variable-rate receivables and/or borrowings Long-term fixed-rate and variable-rate receivables and/or borrowings are evaluated by the Group based on parameters such as interest rates, specific country risk factors, individual creditworthiness of the customer and the risk characteristics of the financed project. Based on this evaluation, allowances are taken to account for the expected losses of these receivables. As at 31 December 2012, the carrying amounts of such receivables, net of allowances, are not materially different from their calculated fair values. Bond loans The bond loans are unsecured financial instruments. Fair value of the NOK and USD bond loans listed at Oslo Stock Exchange is based on the market quotations for these loans. The fair value is based on the latest exchange trade. The bonds are not listed after the exchange of bonds on 17 January 2013. Refer to note to 23 for further information. Available-for-sale financial assets Fair value of unquoted available-for-sale financial assets is estimated using appropriate valuation techniques. Derivative financial instruments The Company may enter into derivative financial instruments with various counterparties, principally financial institutions with investment grade credit ratings. Derivatives valued using valuation techniques with market observable inputs are mainly commodity forward contracts.
2012 2011
Falling due within one year 7 201 7 201
Fall ing due between one and five years 9 036 16 277
Fall ing due after five years - -
16 238 23 479
Falling due within one year 8 826 8 826
Fall ing due between one and five years 17 529 22 774
Fall ing due after five years 30 287 33 892
Charter hire for vessels on bare-boat charter (operating lease) 56 641 65 491
Falling due within one year 890 1 064
Fall ing due between one and five years 526 1 037
Fall ing due after five years - -
Other leases (operating lease) * 1 416 2 101
Total contractual liabilities (operating lease) 74 295 91 071
Charter hire for vessels on time charter (operating lease)

GROUP
52
Unquoted instruments, loans from banks and other financial liabilities, obligations under finance leases The fair value of unquoted instruments, loans from banks and other financial liabilities, obligations under finance leases, as well as other non-current financial liabilities is estimated by discounting future cash flows using rates currently available for debt on similar terms. The obligations under finance leases were updated at 31 December 2012 to reflect best timing estimate of declaring purchase options. Fair value of the obligations under finance leases are therefore not considered to be materially different from book value as of the reporting date. The table below provides an overview of the carrying and fair value of the Company’s financial instruments and the accounting treatment of these instruments. (USD ‘000)
* If any of the mortgage banks were to sell its debt, it is not unreasonable to believe that the fair value of the loans
would be below the carrying amount in the current market. Our bank loans are sophisticated secured products not traded in an active market and the determination of fair value is associated with a significant level of uncertainty. As such, we have not been able to quantify the fair value of the bank loans.
Carrying
amount Fair value
Carrying
amount Fair value
Loans and receivables
Other receivables 2 000 2 000 2 000 2 000
Trade and receivables 50 951 50 951 62 375 62 375
Cash and cash equivalents 30 926 30 926 66 826 66 826
Total loans and receivables 83 877 83 877 131 201 131 201
Financial assets at fair value through profit or loss
Shares held for trading 230 230 226 226
Derivates not designated as hedge accounting
Bunker hedge - - 169 169
Total financial assets at fair value through profit or loss 230 230 395 395
Total financial assets 84 107 84 107 131 596 131 596
Financial liabilities measured at amortised cost
Trade and other payables 58 568 58 568 70 786 70 786
Bond loan 114 330 38 332 105 888 44 465
Credit facil ities 668 726 * 667 447 667 447
Financial lease liabilities 152 529 152 529 199 993 199 993
Other current l iabilities 6 6 35 35
Total financial liabilities measured at amortised cost 994 159 * 1 044 149 982 727
Total financial liabilities 994 159 * 1 044 149 982 727
2012 2011

GROUP
53
Note 21 - Related party disclosures
The consolidated financial statements include the financial statements of Eitzen Chemical ASA and the subsidiaries listed in the following table.
The following table provides the total amount of transactions which have been entered into with related parties for the relevant financial year. (USD ‘000)
1) Jason Shipping ASA holds 34.0 per cent of the shares in the Company. 2) The company was controlled by Jason Shipping ASA until 21 December 2011. Transaction balances include all
transactions up to that date. 3) The company is controlled by Chairman of the Board Aage Rasmus Bjelland Figenschou 4) The company is controlled by former Chairman of the Board Bjørn J. Sjaastad
Terms and conditions of transactions with related parties Sales to and purchases from related parties are made at normal market prices. There have been no guarantees provided or received for any related party receivables or payables. The Company has not made any provision for doubtful debts relating to amounts owed by related parties. Significant influence and dual roles:
- Aage R B Figenschou was on the Board of Directors in both Jason Shipping ASA and Eitzen Chemical ASA in 2011 and 2012. On 1 February 2012, Mr. Figenschou withdrew as member of the Board of Jason Shipping ASA and took up the position as the Chief Executive Officer.
For remuneration to CEO and Key Management personnel, refer to Group Note 8 and Parent Note 2.
Country of
Name incorporation 2012 2011 2012 2011
Eitzen Chemical Shipholding AS Norway 100 % 100 % 100 % 100 %
- Eitzen Chemical (Singapore) Pte.Ltd. Singapore 100 % 100 % 100 % 100 %
- Eitzen Chemical Shipping & Trading (Singapore) Pte.Ltd. Singapore 100 % 100 % 100 % 100 %
- Sichem Pearl Shipping Co. Pte.Ltd. Singapore 100 % 100 % 100 % 100 %
- Eitzen Chemical Invest (Singapore) Pte.Ltd. Singapore 100 % 100 % 100 % 100 %
- Napoli Chemical KS Norway 100 % 100 % 100 % 100 %
- Napoli Chemical AS Norway 100 % 100 % 100 % 100 %
- Team Tankers AS Norway 100 % 100 % 100 % 100 %
- Team Tankers (USA) L.L.C USA 100 % 100 % 100 % 100 %
- Eitzen Chemical (France) S.A.S. (closed 30.06.2011) France 100 % 100 %
- Eitzen Chemical (USA) L.L.C. USA 100 % 100 % 100 % 100 %
- Eitzen Chemical (Denmark) A/S Denmark 100 % 100 % 100 % 100 %
- Eitzen Chemical Shipping (Singapore) Pte.Ltd. Singapore 100 % 100 % 100 % 100 %
- Eitzen Chemical A/S Denmark 100 % 100 % 100 % 100 %
- Eitzen Chemical (Spain) S.A. Spain 100 % 100 % 100 % 100 %
- Team Shipping AS Norway 100 % 100 % 100 % 100 %
% voting rights % equity interest
Figures in USD '000
Related party Type of transaction 2012 2011 2012 2011
Entities with significant influence over the Company:
Jason Shipping ASA 1) Corporate administration and office rent - -251 - 45
EMS Seven Seas Group 2) IT services and corporate administration - -621 - -
Camillo Eitzen (Danmark) A/S Corporate administration and office rent -18 -70 1 -
Camillo Real A/S Rent -387 -415 61 58
Camillo Eitzen (Singapore) Pte Ltd Corporate administration -10 -206 - -10
Sigas (Singapore) Pte Ltd Corporate administration - 8 - -
Aage Figenschou AS 3) Consultancy services -98 -25 - -
Bsc - Bjørn Sjaastad Consulting 4) Consultancy services -211 -131 - -11
Companies which are a part of the JSHIP Group or controlled by a related party:
Amounts owed
by/-to related
Sale to /
purchase from

GROUP
54
Note 22 - Financial risk management, objectives and policies
Risk management overview Generally the market conditions for shipping activities are volatile and, as a consequence, the result may vary considerably from year to year. Market risks are related to freight rates, bunker prices and vessel prices, which the Company has no or limited possibilities to influence or hedge. In addition the Company is exposed to a number of different financial risks such as liquidity-, interest rate-, and currency risks arising from our normal business activities. Such risks are monitored on a regular basis, and the Company might use financial derivatives to limit the exposure. Market risks Freight rate risks Fluctuations in freight rates are the key factor influencing Eitzen Chemical’s cash flow and results. To limit the exposure, the future open ship days are hedged by entering into fixed long-term Contracts of Affreightment (CoA) and time charters. The time charters generate secure cash flow for the period it is effective, while the CoAs have fluctuating cargo nominations, depending on each customer’s requirement. Bunker price risks The exposure to fluctuations in bunker prices depends on the type of contract. Exposure in a spot trade is taken into consideration when the spot charter rate is determined. The Company seeks to reduce the exposure to fluctuating bunker fuel prices through compensation clauses in contracts with clients. On contracts (CoAs) where this is not possible the Company use commodity based derivative to reduce the bunker exposure. Vessel price risks The risk of changes in the value of the Company’s owned and leased vessels are one of Eitzen Chemical’s most material risks. At the end of 2012, the Company had 36 owned vessels and 13 leasing vessels with purchase option (including financial- and operational leases). The change in asset values will affect Eitzen Chemical’s Net Asset Value (NAV), while a change in the value of financial leased vessels will only affect the Company’s theoretical NAV. Financial risks Liquidity risk The Company finalized the financial restructuring of the Company’s bank and bond debt in January 2013. Until January 2015, the Company’s cash commitments on interest payments are limited to LIBOR on the restructured bank debt. All other interest commitments may accrue on the balance of the bank and bond facilities. Thereafter the Company is obliged to pay LIBOR plus a margin of 2.75 per cent on the majority of the loans. Fixed debt instalments will commence in April 2015 with flexible repayment terms from then to maturity in May 2016. In 2015 minimum USD 14.4 million in instalments are due in in the fourth quarter. Thereafter, all loans mature in 2016. There is significant long term risk associated with the current leverage of the Company and the liquidity risk inherent in the Company’s financial liabilities is considerable. Eitzen Chemical remains confident that the chemical tanker market eventually will benefit from improved market fundamentals and fully recover. However, the Company is dependent on a substantial increase in freight rates compared to today’s market to meet its financial liabilities. The Company also has a cash covenant which requires that Eitzen Chemical (on a consolidated basis) shall maintain cash and cash equivalents plus any undrawn credit under the 1. Lien Revolving Loan Facility for an amount equal to or greater than USD 30 million in 2013 and until maturity. As of 31 December 2012, the Company’s cash position was USD 30.9 million and the 1. Lien Revolving Loan Facility was undrawn. Interest rate risk The Company’s exposure to interest rate risk is related to interest-bearing assets and non-current debt liabilities. Eitzen Chemical’s management periodically review and assesses the interest rate risk, and consider hedging of such risk based on various short and long term effects on liquidity and results. A part of the

GROUP
55
Company’s financial strategy is to utilise finance leases, which also limit the interest rate exposures since the leases are at a fixed level throughout the leasing period. As of 31 December 2012, 16 per cent of the debt carried fixed rates (2011: 20 per cent), relating to obligations under financial leases. The following table shows estimated changes in profit before tax for the Company from reasonable possible changes in interest rates in 2012, with all other variables held constant. (USD ‘000)
Currency risk The Company’s functional currency is USD as the majority of the transactions are in USD. Currency risks therefore arise in connection with transactions in other currencies than USD, including administrative expenses, declaration of vessel purchase options denominated in Japanese Yen, and debt financing in other currencies than USD. A significant share of the Company’s general and administrative expenses is in other currencies than USD, mainly Singapore Dollar, Danish and Norwegian kroner. Eitzen Chemical may use financial derivatives to reduce the net operational currency exposure. Eitzen Chemical has issued bonds denominated in NOK. As a result there is a currency exposure related to the bond loan accrued interest and principal which is due in 2016. As of 31 December 2012, the Company held 84 per cent (2011: 73 per cent) of total cash in USD, 2 per cent (2011: 16 per cent) in Norwegian Kroner, and 14 per cent (2011: 11 per cent) in other currencies. The following table shows estimated changes in profit before tax for the Company from reasonable possible changes in the US dollar exchange rate within the previous year, with all other variables held constant. Reasonable changes are defined as the standard deviation the five last years before reporting date. (USD ‘000)
Change in Interest rate 2012 2011
USD LIBOR + 1.50% 10 472 10 463
+ 0.75% 5 236 5 232
- 0.75% -5 236 -5 232
- 1.50% -10 472 -10 463
NIBOR + 1.50% 1 274 1 312
+ 0.75% 637 656
- 0.75% -637 -656
- 1.50% -1 274 -1 312
Change in currency rate 2012 2011
USDNOK + 0.50 7 891 6 179
- 0.50 -9 388 -7 247
USDDKK + 0.40 595 838
- 0.40 -675 -966
USDJPY + 10.0 4 062 4 739
- 10.0 -5 121 -6 144
USDEUR + 0.05 128 158
- 0.05 -145 -176

GROUP
56
Credit risk The Company’s main credit risks are related to payment of freight income. The Company aims at trading with creditworthy counterparties. The credit risk involved in relation to allowing our customer to issue prepaid bills of lading on vegetable oil freights is mitigated by keeping the bill of lading in our control until payments are received. Sometimes it can be possible to take arrest in the cargo after it has been discharged. However, a default of a charterer will always impose potential loss for the Company. The maximum exposure to credit risk is the Trade receivable balance of USD 35.1 million (2011: USD 43.9) and the USD 2.0 million seller’s credit balance under Other non-current assets (2011: USD 2.0 million). Derivative instruments are only entered into with highly rated financial institutions, which mean that the credit exposures for these transactions are expected to be at an acceptable level. Capital management The primary objective of the Company’s capital management is to safeguard the Company’s ability to continue as a going concern in order to provide returns to shareholders and benefits for other stakeholders. Eitzen Chemical manages its capital structure and makes adjustments to it, in light of changes in economic conditions. As of 31 December 2012, the Company’s equity ratio was 3 per cent negative (2011: 9 per cent positive). There is high risk associated with the current leverage of the Company if the current weak chemical tanker market continues. Eitzen Chemical will continue its focus on strengthening the Company’s capital situation and evaluate potential partners who are willing to invest long term in the Company.
Note 23 – Subsequent events
On 4 January 2013 the Company finalized the new loan agreements with its syndicate banks and the trustee of the bond loan. On 17 January 2013 the exchange of bonds was implemented in accordance with the restructuring proposal adopted at the bondholders’ meeting held 7 December 2012. On 5 February 2013 the Company held an extraordinary general meeting whereby a reverse share split in the ratio 100:1 was approved. The company’s share capital is currently NOK 846,016,800 divided by 11,280,224 shares, each with a nominal value of NOK 75.

57
Income Statement – Parent Company
(NOK '000, except per share data)
See accompanying notes that are an integral part of these financial statements.
Figures in NOK '000 Note 2012 2011
Management fees and other income 23 194 25 942
Salaries 2 -17 656 -19 904
General and administrative expenses 2 -17 265 -13 715
EBITDA (Earnings before interest, taxes, depreciation and amortisation) -11 727 -7 677
Depreciation 3 -26 -142
EBIT (Earnings before interest and taxes) -11 753 -7 819
Impairment financial assets 6, 7 -10 468 -1 051 758
Loss on disposal of financial assets 6 -760 436 -
Interest income 4 39 977 30 564
Interest expenses 4 -36 984 -37 647
Other financial items 4 -44 376 36 854
Profit (loss) before taxes -824 039 -1 029 807
Income tax expenses 5 - -
Net profit (loss) -824 039 -1 029 807
Attributed to retained losses -824 039 -1 029 807
Earnings per share – basic/diluted earnings per share 11 -73.12NOK -103.85NOK

58
Statement of Financial Position – Parent Company (NOK '000)
See accompanying notes that are an integral part of these financial statements.
Figures in NOK '000 Note 31.12.2012 31.12.2011
ASSETS
Property, plant and equipment 3 163 857
Total tangible non-current assets 163 857
Investments in subsidiaries 6 - 760 436
Receivables, Group companies 7 456 563 309 690
Related party receivables - 404
Total financial non-current assets 456 563 1 070 530
Total non-current assets 456 726 1 071 387
Other receivables 6 363 2 306
Cash and short-term deposits 18 095 216 007
Total current assets 24 459 218 313
TOTAL ASSETS 481 185 1 289 701
EQUITY AND LIABILITIES
Share capital 846 017 846 017
Share premium - -
Treasury shares -758 -758
Other paid in capital - -
Total paid in capital 845 259 845 259
Retained losses -1 061 240 -237 200
Total equity 11 -215 981 608 059
Non-current portion of bond loan 9 8 969 639 350
Loans, Group companies 7 17 620 22 325
Pension liability 8 1 125 3 370
Total non-current liabilities 27 713 665 045
Current portion of bond loan 9 627 406 -
Related party payables - 244
Trade and other payables 42 047 16 353
Total current liabilities 669 453 16 597
Total liabilities 697 166 681 642
TOTAL EQUITY AND LIABILITIES 481 185 1 289 701

59
Cash Flow Statement – Parent Company (NOK '000)
See accompanying notes that are an integral part of these financial statements.
Figures in NOK '000 Note 2012 2011
Profit/loss (-) before taxes -824 039 -1 029 807
Amortisation of share-based payments - 2 498
Impairment of financial assets 6, 7 10 468 1 051 758
Loss on disposal of financial assets 6 760 436 -
Depreciation 3 26 142
Interest expenses 4 36 984 37 647
Interest income 4 -39 977 -30 564
Foreign currency (gain) loss 20 832 -37 884
Other adjustments 20 657 3 048
Change in pension liability -2 245 -1 098
Change in current assets -3 653 -1 147
Change in current l iabilities 25 450 881
Net cash flows from operating activities 4 937 -4 525
Net cash flows from intercompany debt and receivables -180 660 -389 205
Proceeds from sale of companies 6 - -
Interest received 39 977 30 148
Net cash flows from investing activities -140 683 -359 057
Net proceeds from issuance of shares 11 - 286 697
Payment of other financial costs -21 441 -
Interest paid -37 255 -28 407
Net cash flows from financing activities -58 695 258 290
Net change in cash and cash equivalents -194 441 -105 292
Effect of exchange rate changes on cash -3 471 16 864
Cash and cash equivalents at 1 January 216 007 304 436
Cash and cash equivalents at 31 December 18 095 216 007
Of which:
Restricted bank deposits including employee tax withholding accounts 5 378 3 149

60
Notes to the Financial Statements – Parent Company
Note 1 - Summary of significant accounting policies General The Financial Statements have been prepared in accordance with the Norwegian Accounting Act and Norwegian Generally Accepted Accounting Principles (NGAAP). The Financial Statements for the Parent Company is reported in NOK. Revenue recognition Management fee and other income are recognised at the time of delivery of the services. Use of estimates Management has used estimates and assumptions that have affected assets, liabilities, incomes, expenses and information on potential liabilities in accordance with generally accepted accounting principles in Norway. The preparation of the financial statements is based on available information at the time of finalising the financial information. Actual outcome may differ. The effects of changes in accounting estimates are accounted for in the same period at the estimates are changed. Foreign currencies Amounts in currencies other than NOK are translated into NOK at the exchange rate at the date of the transaction. Realised and unrealized currency gains and losses are recognised in the profit and loss account as financial income and expenses. Short-term accounts receivable and payable in other currencies than NOK are stated at the rate of exchange at the balance sheet date or at the hedged rate. Income tax The tax charge in the income statement includes both payable taxes for the period and changes in deferred tax. Deferred tax is calculated at relevant tax rates on the basis of the temporary differences which exist between accounting and tax values, and any carry forward losses for tax purposes at the year-end. Tax enhancing or tax reducing temporary differences, which are reversed or may be reversed in the same period, have been off set. The disclosure of deferred tax benefits on net tax reducing differences which have not been offset, and carry forward losses, is based on estimated future earnings. Deferred tax and tax benefits which may be shown in the balance sheet are presented net. Deferred tax is reflected at nominal value. Balance sheet classification Current assets and short term liabilities consist of receivables and payables due within one year. Other balance sheet items are classified as non-current assets / liabilities. Current assets are valued at the lower of cost and fair value. Current term liabilities are recognized at nominal value. Non-current assets are valued at cost, less depreciation and impairment losses. Non-current liabilities are recognized at nominal value. Property, plant and equipment Property, plant and equipment are capitalised and depreciated over the estimated useful economic life. If carrying value of a non-current asset exceeds the estimated recoverable amount, the asset is written down to the recoverable amount. The recoverable amount is the greater of the net selling price and value in use. In assessing value in use, the estimated future cash flows are discounted to their present value. Depreciation is recognised on a straight-ling basis provided over the expected useful lives of the individual assets less estimated scrape value on the date of purchase, using the following useful lives: Operating equipment 3–10 years Computer hardware and software 3–5 years

61
Investments in subsidiaries Subsidiaries and investments in associates are valued at cost in the Company accounts. The investments are valued at cost less any impairment losses. An impairment loss is recognised if the impairment is not considered temporary, in accordance with generally accepted accounting principles. Impairment losses are reversed if there is an indication that the economic circumstances under which the impairment loss were provided for have changed. Dividends, group contributions and other distributions from subsidiaries are recognised in the same year as they are recognised in the financial statement of the provider. If dividends / group contribution exceed withheld profits after the acquisition date, the excess amount represents repayment of invested capital, and the distribution will be deducted from the recorded value of the acquisition in the balance sheet for the parent company. Pension Cost, Funding and Obligations The company has set up a defined benefit scheme with a life insurance company to provide pension benefits for its employees. The scheme provides entitlement to benefits based on future service from the commencement date of the scheme. These benefits are principally dependent on an employee’s pension qualifying period, salary at retirement age and the size of benefits from the National Insurance Scheme. Full retirement pension will amount to approximately 66 per cent of the scheme pension-qualifying income (limited to 12G). The scheme also includes entitlement to disability, spouses and children’s pensions. The retirement age under the scheme is 67 years. The company may at any time make alterations to the terms and conditions of the pension scheme and undertake that they will inform the employees of any such changes. The benefits accruing under the scheme are funded obligations. The company also has pension obligations for employees with salaries exceeding 12G. These are non-funded obligations. Changes in the pension obligations as a result of changed actuarial assumptions and variations between actual and anticipated return on pension funds will be entered on the average remaining earnings period according to the “corridor” regulations. Cash and cash equivalents Cash and short-term deposits in the balance sheet comprise cash at bank and in hand and short-term deposits with an original maturity of three months or less. For the purpose of the cash flow statement, cash and cash equivalents consist of cash and cash equivalents as defined above, net of outstanding bank overdrafts. The cash flow statement is prepared using the indirect method. Treasury shares Treasury shares are recognised as a separate component of equity at cost. No gain or loss is recognised in the income statement on the purchase, sale, issue or cancellation of own equity instruments. Any differences between the carrying amount and the consideration are recognised in other equity. Share-based payment Senior management participates in a share-based incentive program, where the employees are granted share options. The program does not provide the choice of cash settlement instead of shares. The fair value of the shares and options are measured at the grant date and is recognised in the income statement under General and Administrative expenses over the vesting period. The fair value of the award program is calculated based on the Black-Scholes model. Related parties All transactions between related parties are based on the arm’s length principle, which means that they are recorded at (estimated) market value.

62
Note 2 - Salaries and remuneration (NOK '000)
The average number of employees in 2012 was 7 (2011: 8).
1)
In addition to ordinary board fee, Aage R. B. Figenschou and Bjørn J. Sjaastad received fees for consultancy services. 2) Bjørn J. Sjaastad withdrew from the Board of Directors on 5 September 2012.
The Company purchases CEO services from its subsidiary Eitzen Chemical (USA) L.L.C. Refer to note 12 for further information. Currently the Chairman of the Board receives an annual remuneration of NOK 450,000 and the other board members will receive an annual remuneration of NOK 300,000. The Chairman of the Audit Committee receives an annual remuneration of NOK 50,000 and other members receive NOK 35,000. The Chairman of the Compensation Committee receives an annual remuneration of NOK 10,000 and other members receive NOK 7,500. The Board of Directors’ statement of guidelines for the remuneration of the Executive Management Pursuant to section 6-16a if the Public Limited Companies Act, the board of directors must draw up a statement of guidelines for the payment and other remuneration of Executive management. Furthermore, section 5-6 (3) of the same Act prescribes that an advisory vote must be held at the AGM on the board’s guidelines for the remuneration of the Executive Management for the next financial year. To the extent the guidelines concern share-based incentive arrangements theses must also be approved by the AGM. Regarding guidelines for remuneration to the Executive Management for the next financial year, the board will present the following guidelines to the AGM in 2013 for an advisory note.
- Remuneration to the CEO shall be decided by the Board in a Board meeting. - Remuneration to other members of the Executive Management will be decided by the CEO on
relevant directions approved by the Board. The remuneration shall be on market terms. - The remuneration shall encourage value creation for the Company and all bonus agreements shall be
linked to value creation for the Company.
Figures in NOK '000 2012 2011
Wage and salaries 14 218 17 962
Social security contributions 2 876 1 682
Other 562 259
Total salaries 17 656 19 904
Remuneration Pension Bonus Total
Executive Management
Andreas Reklev, CFO 1 693 66 - 1 759
Geir Frode Abelsen, CTO 1 853 159 - 2 011
Martin D. Solberg, SVP 1 301 107 - 1 408
Board members
Aage Rasmus Bjelland Figenschou 1) 301 - - 301
Carl Erik Steen 252 - - 252
Helene Jebsen Anker 252 - - 252
Helene Marie Petersen 252 - - 252
Bjørn Johan Sjaastad 1 & 2) 236 - - 236
Total remunerations 6 141 332 - 6 473

63
Share-based payment plan Eitzen Chemical has a share option program for the Company's key management personnel. No share option program has been set up for the Board of Directors. See note 8 in the financial statement for the Group for further information. Expenses arising from equity-settled share-based payment
For further information regarding the share-based payment plan refer to note 8 in the consolidated financial statements for the Group. Remuneration to the auditor (ex VAT)
Note 3 – Property, plant and equipment (NOK '000)
Fixed assets are depreciated on a straight-line basis. The useful life of the assets is estimated to be 3-10 years.
Note 4 - Financial income and expenses (NOK '000) Interest income
2012 2011
Expenses included in the salaries in the income statement - 2 498
Total - 2 498
2012 2011
Statutory audit 825 825
Other assurance services - 99
Tax assistance - 5
Other non-assurance services - -
Attestation services 147 35
Total 972 964
Figures in NOK '000 2012 2011
At 1 January, net of accumulated depreciation 857 999
Additions 189 -
Disposals -857 -
Depreciation for the year -26 -142
At 31 December, net of accumulated depreciation 163 857
At 31 December
Cost 738 1 974
Accumulated depreciation -575 -1 117
Net carrying amount 163 857
2012 2011
Interest income on intercompany receivables 39 475 28 830
Bank interest 502 1 734
Total interest income 39 977 30 564

64
Interest expenses
Other financial items
The net currency gain is primarily related to intercompany receivables and debt in USD.
Note 5 - Taxes (NOK '000)
2012 2011
Bond loan, finance institutions -36 247 -36 635
Interest expenses on intercompany receivables -733 -1 012
Other interest -4 -1
Total interest expenses -36 984 -37 647
2012 2011
Net currency gain/(loss) -20 832 37 884
Dividend from subsidiaries - 5 504
Other financial expenses -23 544 -6 534
Total other financial items -44 376 36 854
Income tax expense include the following items 2012 2011
Tax payable - -
Changes in deferred taxes - -
Income tax expense - -
Profit before tax -824 039 -1 029 807
Non-deductible expenses 3 138 2 617
Income and expense not subject to taxes - -5 504
Permanent differences -864 320 1 012 415
Change in temporary differences -2 844 1 962
Taxable income -1 688 066 -18 316
Group contribution - 10
Taxable income -1 688 066 -18 306
Effective tax rate 2012 2011
Profit before taxes -824 039 -1 029 807
Expected income tax based on a tax rate of 28 % -230 731 -288 346
Non-deductible expenses 879 733
Share issuance cost - -3 465
Income not subject to income taxes - -1 541
Taxable gain (loss) from subsidiaries -143 -
Tax effect of asset impairment 2 931 286 942
Tax effect of disposal of financial assets -244 798 -
Tax loss carried forward and other tax credits 472 658 5 129
Tax effect of changes in other temporary differences -796 549
Income tax expense - -
Effective tax rate in % 0 % 0 %

65
Eitzen Chemical ASA realized a loss from an internal sale of shares in subsidiaries in 2012, due to a company restructuring following the new loan agreements with the lenders of the Eitzen Chemical Group. Refer to note 6 for further information. In the tax return for 2012 Eitzen Chemical ASA intends to claim a tax loss from the transaction of NOK 1,634 million. However, there is a risk whether the transaction is within the scope of the Tax Exemption Method in Norway. In this case, the transaction may not be tax deductible. Total loss carried forward as of 31 December 2012, including the tax loss of NOK 1,634 million, is NOK 1,916 million. Net deferred tax liabilities in limited partnerships as of 31 December 2012 amounts to NOK 0.0 million following the sale of Napoli Chemical KS in December 2012 (2011: MNOK 17.2).
Note 6 - Investments in subsidiaries In December 2012, the Company sold its investments in Team Shipping AS, Eitzen Chemical (Denmark) A/S, Napoli Chemical KS, Napoli Chemical AS, Eitzen Chemical (Singapore) Pte. Ltd. and Eitzen Chemical Invest (Singapore) Pte. Ltd. to its wholly owned subsidiary Eitzen Chemical Shipholding AS. The company restructuring followed the new loan agreements with the lenders of the Eitzen Chemical Group. (NOK '000)
* Nominal share capital in Napoli Chemical KS is paid in capital in the partnership.
Loss on disposal of financial assets
Deferred tax assets/(liabilities) 2012 2011
Fixed assets 9 -72
Pension obligation 315 943
Capitalized transaction costs -491 -129
Other current assets and liabilities 1 245 -
Tax loss carried forward 535 426 63 900
Deferred tax assets/(liabilities) 536 504 64 642
Deferred tax assets not recorded in balance sheet -536 504 -64 642
Deferred tax liabilities in balance sheet - -
Subsidiaries
Eitzen Chemical Shipholding AS Norway 2006 NOK 40 100 100 % - -
Team Shipping AS Norway 2006 NOK 343 0 % - 306
Eitzen Chemical (Danmark) A/S Denmark 2006 DKK 500 0 % - 47 149
Napoli Chemical KS Norway 2007 NOK 83 500 * 0 % - -
Napoli Chemical AS Norway 2007 NOK 100 0 % - 100
Eitzen Chemical (Singapore) Pte.Ltd. Singapore 2010 USD 382 257 0 % - 712 643
Eitzen Chemical Invest (S) Pte.Ltd. Singapore 2010 USD 38 0 % - 238
Total interest in subsidiary undertakings - 760 436
Country of
incorporation
Year of
acquisition
Nominal
share capital
Interest
Carrying
value 2012
Carrying
value 2011
2012 2011
Team Shipping AS 306 -
Eitzen Chemical (Danmark) A/S 47 149 -
Napoli Chemical AS 100 -
Eitzen Chemical (Singapore) Pte.Ltd. 712 643 -
Eitzen Chemical Invest (S) Pte.Ltd. 238 -
Total loss on disposal of financial assets 760 436 -

66
Impairment of investments in subsidiaries
The Company has an investment in only one subsidiary at 31 December 2012. The carrying value of the subsidiary, Eitzen Chemical Shipholding AS, is zero.
Note 7 - Receivables and debt to group companies (NOK '000)
The Group debt and receivables are interest-bearing. The debt is denominated in USD. Impairment of receivables from Group companies
Note 8 - Pensions and other post-employment benefit plans The company has set up a defined benefit scheme with a life insurance company to provide pension benefits for its employees. The Company's funds are managed by an independent life insurance company that invests the Company's funds according to Norwegian law. All employees are part of the pension scheme. The scheme provides entitlement to benefits based on future service from the commencement date of the scheme. The company also had pension obligations for employees with salaries exceeding 12G. These are non-funded obligations. The scheme was terminated in 2012.
Figures in NOK '000 2012 2011
Eitzen Chemical Shipholding AS - 232 500
Napoli Chemical AS - -
Eitzen Chemical (Singapore) Pte.Ltd - 512 833
Total impairment of investments in subsidiaries - 745 333
Figures in NOK '000 2012 2011
Eitzen Chemical (Singapore) Pte.Ltd. 433 884 286 359
Eitzen Chemical Invest (S) Pte.Ltd. 22 140 22 424
Sichem Pearl Shipping Co. Pte.Ltd. 539 -
Team Shipping AS -426 -405
Napoli Chemical AS -50 -99
Eitzen Chemical (USA) L.L.C. -17 101 -21 124
Eitzen Chemical Shipholding AS - -652
Eitzen Chemical (Spain) S.A. -42 -45
Receivables from Group companies 456 563 309 690
Debt to Group companies -17 620 -22 325
Net receivables from Group companies 438 943 287 365
Figures in NOK '000 2012 2011
Eitzen Chemical A/S -11 925 67 762
Eitzen Chemical (Singapore) Pte.Ltd. - 206 070
Eitzen Chemical Invest (S) Pte.Ltd. - 52 803
Sichem Pearl Shipping Co.Pte.Ltd. - 283
Napoli Chemical KS 22 393 41 516
Eitzen Chemical (France) SAS - -62 008
Total impairment receivables from Group companies 10 468 306 425

67
(NOK '000)
In the balance sheet a net pension asset in one scheme is only offset against an obligation in another scheme to the extent that it is possible to fund the net obligation scheme with the assets.
Figures in NOK '000 2012 2011
Net benefit expense (recognised in administration expenses):
Current service cost 1 190 1 886
Interest cost 139 244
Expected return on plan assets -94 -102
Administration fee 25 24
Amortization of actuarial losses/(gains) 663 -2 673
Payroll taxes 174 286
Total pension cost (- income) 2 098 -335
The amounts recognised in the balance sheet are determined as follows:
Present value of funded obligations 2 302 3 721
Fair value of plan assets -1 713 -2 270
589 1 451
Present value of unfunded obligations - 2 605
Unrecognised actuarial gains/(losses) 453 -1 640
Payroll taxes 83 954
Net benefit obligation (asset) 1 125 3 370
Net benefit obligation is classified in the balance sheet as follows:
Asset - -
Liability 1 125 3 370
-1 125 -3 370
Changes in the present value of the defined benefit obligation are as follows: 2012 2011
Beginning of year 9 032 6 108
Current service cost 1 190 1 886
Interest cost 139 244
Actuarial losses (gain) -5 090 794
End of year 5 271 9 032
Changes in the fair value of plan assets are as follows: 2012 2011
Beginning of year 2 227 1 286
Expected return on plan assets 94 102
Actuarial (losses)/gains -1 423 191
Employer contributions 837 669
Administration -22 -21
End of year 1 713 2 227
The principal actuarial assumptions used were as follows:
Discount rate 3.90 % 2.60 %
Expected return on plan assets 4.00 % 4.10 %
Future salary increases 3.50 % 3.50 %
Future pension increases 0.20 % 0.10 %

68
The assumptions used for death and disability are standardised assumptions well known in the insurance business. The Company’s pension scheme qualifies as mandatory occupational pension according to the Norwegian law regulations.
Note 9 – Bond loan NOK 627.4 million of the Company’s bond debt has been classified as short term debt at year-end 2012 as the new loan agreements with the trustee of the bond loan was finalized on 4 January 2013 and the exchange of bonds was implemented on 17 January 2013. However, the bond debt has been restructured and is not payable short term at the date of approval of these financial statements. Accrued interest expenses under the new loan agreements are classified as non-current. Refer to note 13 for further information. Eitzen Chemical ASA had unsecured bond loans outstanding totalling NOK 490 million and USD 25 million at 31 December 2012. Under the previous loan agreements, the bonds carried interest of NIBOR + 3.5 per cent and LIBOR + 3.5 per cent, respectively. The bond loans had a loan to value covenant effective from 6 November 2012. No security was provided for the bonds. The Company was granted waivers on the existing financial covenant relating to its bond loan agreements at 31 December 2012. Financial restructuring of bond loan agreements On 22 November 2012, Eitzen Chemical announced that the consensual financial restructuring of the Company’s bank and bond debt was approved by all of the banks in the Company’s loan syndicates. The restructuring is based on a slowly improving market and will secure headroom and stable operations in the years to come. The new loan agreements were formally signed on 4 January 2013. Refer to note 13 for further information. The key terms in the restructuring agreement include:
- The bond loan comprising a NOK tranche of NOK 490 million (ISIN NO 001033434.5) and a USD
tranche of USD 25 million (ISIN NO 001033433.7) was in January 2013 exchanged into (i) a secured loan of approximately USD 50 million and (ii) an unsecured loan of approximately USD 60 million. The secured loan has a third ranking lien security in the Company’s vessels (owned through subsidiaries). Eitzen Chemical ASA is the borrower for both loans. The loans have NOK and USD tranches as in the previous bond loan agreement.
- The secured loan will mature in June 2016 with no instalments until maturity. The loan will receive payment-in-kind interest of NIBOR/LIBOR plus 11 per cent p.a. due at maturity.
- The restructured interest terms of the Company’s loans were effective from October 2012. - The unsecured loan will mature in September 2016 with no instalments or interest payments until
maturity. If the Company raises new equity (in the form of cash) of at least USD 50 million, the unsecured loan can be called and redeemed in full in exchange for an amount equal to USD 10 million of new equity in the Company.
- The loans do not include any financial covenants. - The bond restructuring fee agreed in 2009 due in November 2012 are postponed to maturity of the
secured loan. On 17 January 2013 the exchange of bonds was implemented in accordance with the restructuring proposal adopted at the bondholders’ meeting held on 7 December 2012. Refer to note 13 for further information.

69
Note 10 – Commitments and guarantee Eitzen Chemical ASA is the guarantor of some of the loans in the Company; the guarantees are listed below;
- Eitzen Chemical (Singapore) Pte Ltd. has a USD 510 million facility agreement with final maturity in May 2016. Eitzen Chemical ASA is the guarantor of the loan. The facility has a second ranking lien security inter alia in vessels and proceeds from the vessels.
- Eitzen Chemical (Singapore) Pte Ltd. has a USD 265 million credit facilities agreement with final maturity in May 2016. Eitzen Chemical ASA is the guarantor of the loan. The facility has a second ranking lien security inter alia in vessels and proceeds from the vessels.
- Eitzen Chemical (Singapore) Pte Ltd. has a USD 170 million credit facilities agreement with final maturity in May 2016. Eitzen Chemical ASA is the guarantor of the loan. The facility has a second ranking lien security inter alia in vessels and proceeds from the vessels.
- Napoli Chemical KS has a loan agreement of USD 36 million for the purpose of financing the purchase of Napoli Chemical KS' four vessels. The loan has a second ranking lien security inter alia in vessels. Final maturity is in May 2016.
- Eitzen Chemical Invest (Singapore) Pte. Ltd, the new vessel owning entity of the vessel Tour Pomerol has entered into a loan agreement of USD 4.7 million. The loan has a second ranking lien security inter alia in the vessel Tour Pomerol. Final maturity is in May 2016.
- Sichem Pearl Shipping Co. Pte. Ltd. has entered into a loan agreement in the amount of USD 15 million. The loan has a second ranking lien security inter alia in the vessel Sichem Croisic.Final maturity is in May 2016.
- Eitzen Chemical (Singapore) Pte. Ltd. has secured a working capital facility of USD 30 million. The facility is split into (i) a term loan facility of USD 10 million and (ii) a revolving credit facility of USD 20 million. The facility was undrawn as of year-end 2012. Eitzen Chemical ASA is one of the guarantors of the loan. Final maturity of the term loan facility is May 2016 and the revolving credit facility will mature in April 2016. The loan is secured by a first ranking lien in the Company’s vessels.
Eitzen Chemical ASA is the guarantor for some of the charter parties in the Company; the guarantees are listed below:
- The Sichem Defender charter party commitments are guaranteed by Eitzen Chemical ASA, on behalf of Eitzen Chemical Shipping & Trading Pte. Ltd.
- The Sichem Mississippi and the Sichem Pace charter party commitments are guaranteed by Eitzen Chemical ASA, on behalf of Eitzen Chemical Singapore Pte. Ltd.
The vessel Sichem Casablanca, which is owned by Napoli Chemical KS, a subsidiary of the Company, was in August 2006 arrested in Turkey in respect of a claim of USD 0.8 million. The vessel was released against a bank guarantee from Eitzen Chemical ASA and arbitration is initiated. As of 31 December 2012, no provisions are made for the guarantees. The Company has a potential liability for 75 per cent of the unpaid corporate capital commitment in Napoli Chemical KS of NOK 16.5 million. The Company sold its share in Napoli Chemical KS to Eitzen Chemical Shipholding AS in 2012, but is still jointly liable for the unpaid corporate capital commitment. As of 31 December 2012, no provisions are made for the potential liability.
Note 11 – Equity As of 31 December 2012 the Company has a share capital of NOK 846,016,742.25, which consists of 1,128,022,323 each with par value of NOK 0.75. On 5 February 2013 the Company held an extraordinary general meeting whereby a reverse share split in the ratio 100:1 was approved. The company’s share capital is currently NOK 846,016,800 divided between 11,280,224 shares, each with a par value of NOK 75. Also refer to note 13.

70
(NOK '000)
For further information refer to the description in note 16 in the financial statements for the Group.
Shareholder information
Shareholders as of 31 December 2012 specified below:
Earnings per share Basic and diluted earnings per share are calculated by dividing net profit (loss) for the year attributable to ordinary equity holders by the weighted average number of ordinary shares outstanding during the year. On 5 February 2013 the Company held an extraordinary general meeting whereby a reverse share split in the ratio 100:1 was approved. Refer to note 13 for further information. Earnings per share for both 2012 and 2011 have been calculated based on the weighted average number of shares adjusted for the reverse split. The following reflects the income and share data used in the total operations basic and diluted earnings per share computations:
Figures in NOK '000
Share
capital
Share
premium
reserve
Other paid in
capital
Retained
losses Total
Equity as of 1 January 2011 753 168 111 344 4 807 071 -4 322 912 1 348 671
Decreased nominal value -188 544 - 188 544 - -
Decreased nominal value own shares 252 - - -252 -
Increase in connection with private placement 278 953 18 597 - - 297 550
Increase in connection with subsequent offering 1 430 95 - - 1 525
Transaction cost - -12 378 - - -12 378
Share incentive programme - - 2 498 - 2 498
Result of the year - - - -1 029 807 -1 029 807
Accumulated loss transfered to share premium
reserve and other paid in capital - -117 658 -4 998 113 5 115 771 -
Equity as of 31 December 2011 845 259 - - -237 200 608 059
Equity as of 1 January 2012 845 259 - - -237 200 608 059
Result of the year - - - -824 039 -824 039
Equity as of 31 December 2012 845 259 - - -1 061 240 -215 981
Name:
Number of
shares Ownership
Jason Shipping ASA 383 532 236 34.0%
Skandinaviska Enskilda Banken AB 56 398 182 5.0%
Odin Maritim 17 430 831 1.5%
Apollo Asset Limited 15 945 000 1.4%
Hustadlitt A/S 14 945 000 1.3%
Sabaro Investments Ltd 14 200 000 1.3%
MP Pensjon PK 14 011 700 1.2%
Torgeir Herfindal 10 800 000 1.0%
Toluma Norden AS 10 450 500 0.9%
BNY Mellon 10 426 088 0.9%
Other 578 872 786 51.3%
Total numbers of shares excluding treasury shares 1 127 012 323 99.9%
Treasury shares at 31 December 2012 1 010 000 0.1%
Total numbers of shares including treasury shares 1 128 022 323 100.0%
Total number of shareholders 2 678
Foreign ownership 131 448 481 11.7%

71
The Board proposes that no dividend will be paid for the fiscal year 2012. Treasury shares are not included in the weighted average number of shares. Shares under the share option program are not included since they are out of money.
Note 12 – Related party transactions (NOK '000)
1) The company was controlled by Jason Shipping ASA until 21 December 2011. Transaction balances include all transactions up to that date.
2) The company is controlled by Aage Rasmus Bjelland Figenschou. 3) The company is controlled by Bjørn J. Sjaastad.
Figures in USD '000 2012 2011
Net profit attributable to equity holders (NOK '000 ) -824 039 -1 029 807
Number of shares outstanding end of period 1 127 012 323 1 127 012 000
Weighted average number of shares outstanding in the period 1 127 012 323 991 672 702
Weighted average number of ordinary shares for diluted earnings per share 11 270 123 9 916 727
Earnings per share - basic/diluted earnings per share (NOK) -73.12 -103.85
Sale to / purchase from
Related party Type of transaction 2012 2011
Entities with significant influence over the Company:
Jason Shipping ASA Corporate administration - -46
Jason Shipping ASA Rent - -1 351
EMS Seven Seas ASA 1) Corporate administration - 16
Camillo Eitzen (Danmark) A/S Corporate administration - -286
Eitzen IT A/S 1) IT services - -1 970
Aage Figenschou AS 2) Consultancy services -560 -141
Bsc - Bjørn Sjaastad Consulting 3) Consultancy services -1 400 -720
Sichem Pearl Shipping Co Pte Ltd Advisory fee 705 850
Sichem Pearl Shipping Co Pte Ltd Interest income 550 283
Eitzen Chemical (Singapore) Pte Ltd Advisory fee 16 412 19 125
Eitzen Chemical (Singapore) Pte Ltd Interest income 28 029 18 324
Eitzen Chemical Shipping & Trading Pte Ltd Advisory fee 3 984 3 825
Eitzen Chemical Invest (Singapore) Pte.Ltd. Advisory fee 443 425
Eitzen Chemical Invest (Singapore) Pte.Ltd. Interest income 1 423 734
Team Shipping AS Interest expense -3 -150
Team Shipping AS Group contribution - 10
Napoli Chemical AS Group contribution - 13 386
Napoli Chemical AS Interest expense -1 -392
Napoli Chemical KS Advisory fee 1 627 1 700
Napoli Chemical KS Interest income 7 335 5 945
Eitzen Chemical A/S Management/CEO services -1 043 -
Eitzen Chemical A/S Corporate administration -996 -1 671
Eitzen Chemical A/S Interest income 2 138 1 600
Eitzen Chemical (Denmark) A/S Interest income - 1 366
Eitzen Chemical Shipholding AS 4) Sale of companies - -
Eitzen Chemical (France) S.A.S Interest income - 578
Eitzen Chemical (USA) L.L.C. CEO services -2 496 -
Eitzen Chemical (USA) L.L.C. Interest expense -729 -470
Companies which are/were a part of the JSHIP Group or controlled by a related party:
Companies which are a subsidiary:

72
4) In December 2012, the Company sold shares in subsidiary companies to the subsidiary Eitzen Chemical Shipholding AS for USD 1 each company. Refer to note 6 for further information.
Note 13 – Subsequent events On 4 January 2013 the Company finalized the new loan agreements with its syndicate banks and the trustee of the bond loan. On 17 January 2013 the exchange of bonds was implemented in accordance with the restructuring proposal adopted at the bondholders’ meeting held 7 December 2012. On 5 February 2013 the Company held an extraordinary general meeting whereby a reverse share split in the ratio 100:1 was approved. The company’s share capital is currently NOK 846,016,800 divided by 11,280,224 shares, each with a nominal value of NOK 75.

73
Oslo, 15 March 2013
The Board of Directors of Eitzen Chemical ASA
Aage Rasmus Bjelland Figenschou
Chairman of the Board
Carl Erik Steen
Helene Jebsen Anker
Heidi Marie Petersen
Per Sylvester Jensen
Chief Executive Officer

74
Statement of responsibility We confirm to the best of our knowledge that the consolidated financial statements for 2012 have been prepared in accordance with International Financial Reporting Standards (IFRS) as adopted by the European Union, as well as additional information requirements in accordance with the Norwegian Accounting Act, that the financial statements for the parent company for 2012 have been prepared in accordance with the Norwegian Accounting Act and generally accepted accounting practice in Norway, and that the information presented in the financial statements gives a true and fair view of the assets, liabilities, financial position and result of Eitzen Chemical ASA and the Eitzen Chemical Group for the period. We also confirm to the best of our knowledge that the Board of Directors' Report includes a true and fair review of the development, performance and financial position of Eitzen Chemical ASA and the Eitzen Chemical Group, together with a description of the principal risks and uncertainties that they face.
Oslo, 15 March 2013
The Board of Directors of Eitzen Chemical ASA
Aage Rasmus Bjelland Figenschou
Chairman of the Board
Carl Erik Steen
Helene Jebsen Anker
Heidi Marie Petersen
Per Sylvester Jensen
Chief Executive Officer
75
Corporate Governance
The main objective for Eitzen Chemical’s principles for good corporate governance is to develop a strong sustainable and competitive company in the best interest of the shareholders, employees, business associates, third parties and society at large. Good corporate governance is characterised by responsible interaction between owners, the Board of Directors and its management, viewed in short and long term value creation perspective. With reference to the Norwegian Code of Practice for Corporate Governance issued on 21 October 2009, and revised on 21 October 2010, 20 October 2011 and 23 October 2012 (the “Code”), the following chapters explain how Eitzen Chemical complies with each of the recommendations therein or explain why an alternative approach has been chosen according to the “comply or explain” principle. 1. Implementation and reporting on corporate governance Corporate governance deals with issues and principles related to the distribution of roles between governing bodies of a company and the responsibility and authority assigned to each of those bodies. The Board ensures that Eitzen Chemical is being subject to good corporate governance, and that the Company complies with all applicable laws and regulations in this respect as well as the Code. The Board of Directors ensures that the Company is adequately organized and managed in such a manner that the Company’s set goals can be reached and foster proper controls, but at the same time encourage the business to assume risks and manage risks by encouraging innovation and entrepreneurship in order to enhance shareholder values. Eitzen Chemical is committed to ethical business practices and our values are an integrated part of how we conduct our business. The Company has developed a Corporate Social Responsibility Guideline and a Code of Conduct, which focus on ethical behaviour in everyday business activities to be followed by all employees. The Corporate Social Responsibility Guideline, the Corporate Governance principles and the Code of Conduct are published on the Company’s website. The topic of corporate governance is subject to assessment and discussion by the Board annually or more often if deemed necessary. 2. Business With reference to the Articles of Association, Eitzen Chemical’s objective is to “be engaged in shipping, portfolio investments and related business, including participating in companies engaged in similar business.”
Our vision: Superior commitment to customers and quality creates value.
Mission statement: We are an ambitious global organisation with focus on:
• Safety & environment • Customers • Quality • People • New thinking • Being proactive

76
3. Equity and dividends The financial restructuring of Eitzen Chemical’s bank and bond debt was concluded in January 2013. The new financial structure is based on a slowly improving market and will secure headroom and stable operations in the years to come. A term- and revolving credit facility of USD 30 million is secured to provide the Company with sufficient available liquidity. The facility was undrawn as of year-end 2012. Total equity as of 31 December 2012 was negative USD 32.1 million, which gives an equity ratio of 3 per cent negative. Based on the agreements with the Company's lenders, the Board currently considers the Company's capital situation as adequate. Nevertheless, the Board considers the current net asset value to be below par value of the Company’s shares in the current market situation. At the Ordinary General Meeting in 2013 a share capital reduction through a write down of par value will be proposed. Eitzen Chemical will continue its focus on strengthening the Company’s capital situation and evaluate potential partners who are willing to invest long term in the Company. On 31 December 2012, the total number of shares outstanding was 1,128,022,323. The share price ended at NOK 0.08, and the Company’s market capitalization was USD 16.2 million. On 5 February 2013 the Company held an extraordinary general meeting where a reverse share split in the ratio 100:1 was approved. The Company’s share capital is at the issue date of this statement NOK 846,016,800 divided by 11,280,224 shares, each with a par value of NOK 75. As part of the overall agreements with its banks in 2013, the Company has agreed not to pay dividend nor repurchase own shares before the maturity of its debt in 2016 without a prior approval from the banks. 4. Equal treatment of shareholders and transactions with close associates Eitzen Chemical has one class of shares and each share entitles the holder to one vote. The shares are registered with the Norwegian Registry of Securities. The Company has established Code of Conduct which applies to all employees and the Board of Directors, and promotes core values including transparency and integrity. The members of the Board and executive personnel are required to notify the Board if they have any interest in any transaction entered into by the Company. In addition the Company has established Directives for inside trading and trading in own shares. 5. Freely negotiable shares All the Company’s shares carry equal rights and are freely negotiable. 6. General meetings Eitzen Chemical seeks to ensure that the General Meetings are an effective forum for the views of shareholders and the Board. The Annual General Meeting is held every year before the end of June. The date of the 2012 annual general meeting was 25 May 2012. The financial statements, annual reports and share dividend shall be approved in the General Meeting, including other decisions required under existing laws and regulations. Shareholders may notify the Company in writing of issues to be discussed or considered at the General Meetings within seven days prior to the company’s notice as per below. Notices of General Meetings are published and distributed by mail no later than 21 days prior to the date of the general meeting. Within the same time the notice is also made available on the Company’s website, including supporting information. The shareholders may give notice of their intent to be represented at the meeting by mail or email within three business days prior to the meeting. Shareholders who are unable to attend may vote by proxy. Proxy forms which allow separate voting instructions to be given for each matter to be considered by the meeting, and separate voting for each candidate nominated for election, are available with the notice. The Company will make a person available to vote on behalf of shareholders as their proxy. The Chairman of the Board, the auditor, the CEO and the CFO are present at the General Meetings to answer questions. The remaining members of the Board, the Nomination Committee and other executives attend as necessary.

77
The General Meetings are opened by the Chairman of the Board who proposes a chairman to be elected for the meeting. 7. Nomination Committee The Company’s Articles of Association provide for a Nomination Committee composed of two to three members elected by the General Meeting. The Nomination Committee Guidelines were approved by the Annual General Meeting 9 May 2011 and states that the committee itself shall propose the members for the General Meeting. The Nomination Committee is currently composed of Andreas Mellbye (chairman) and Jan Fredrik Eriksen (member). Both were elected for a term of 2 years, ending May 2014. The members of the Nomination Committee are independent of the Board of Directors and the Executive management of the Company. 8. Corporate Assembly and Board of Directors, composition and independence Eitzen Chemical is not required to have a Corporate Assembly and has chosen not to include such requirement to its Articles of Association. The Board, including its Chairman are nominated by the Nomination Committee and elected by the General Meeting. Under to the Articles of Association the Board shall have a minimum of three and maximum seven members. The current Board was elected by the Annual General Meeting on 9 May 2011 for two years. Bjørn Sjaastad, who was elected Chairman by the Annual General Meeting on 9 May 2011, withdrew from the Board in September 2012. Aage Figenschou, who has served as a Board member since 2009, took over the position as new Chairman and was formally elected Chairman on the Extraordinary General Meeting held on 5 February 2013. Board members Helene J. Anker, Heidi M. Petersen and Carl Erik Steen are all independent of the Company’s largest shareholder, the Company’s executives and its material business relations. Aage Figenschou was on the Board of the Company’s largest shareholder Jason Shipping ASA, which is holding 34.0 per cent of the Company’s outstanding shares, until 1 February 2012. When Aage Figenschou withdrew from the Board of Jason Shipping ASA, he took up the position as the Chief Executive Officer of Jason Shipping ASA. The Board represent a strong combination of shipping, banking and financial experience. A summary of the Board members professional background is available on the Company’s website. In addition to receiving the annual remuneration as Chairman, Aage Figenschou has from September 2012 been delegated additional tasks by the Board under a consultancy agreement. None of the board members have options or profit-based remunerations. The members of the Board are encouraged to own shares in the Company. Further information about the Board members shareholding is disclosed in note 16 to the financial statements. As of year-end 2012, Eitzen Chemical had 1,250 crew members employed on its vessels or on leave. In addition, the Company had 81 permanent employees onshore. 9. The work of the Board The law stipulates the responsibilities of the Board to include the overall management and oversight of the Company. In 2012 the Board of Eitzen Chemical ASA held 21 regular board meeting. Four of the meetings dealt with the quarterly financial reports, and one meeting was related to approving the annual report. In addition to the regular Board meetings, the Board may also arrange special meetings, either by telephone conference or by written resolution requested of the chairman, the CEO or by any other Board member. In 2010 the Board appointed a permanent Audit Committee. The committee is currently composed of Helene J. Anker (chairman) and Heidi M. Petersen (member). In addition, the board appointed a permanent remuneration committee in 2011 composed of Aage Figenschou and Helene J. Anker. These committees do not make resolutions, but prepare matters for the Board’s consideration within the committee’s specialized

78
area and supervise the work of the Company’s management on behalf of the Board. The Board evaluates its performance and expertise annually. 10. Risk management and internal control The Board of Directors are kept updated on the company activities through regularly reporting, including monthly financial reporting. The Audit Committee ensures that the Company has adequate financial risk management, and effective internal control systems. The Company is also subject to external control by its auditors, the ship classification societies, port and flag state control, and other regulatory bodies like IMO etc. The Management of Eitzen Chemical monitors that the Company acts in accordance to applicable law and regulations. 11. Remuneration of the Board Remuneration of the Board is disclosed in note 8 to the financial statements. The remuneration reflects the Board’s responsibility, expertise, time commitment and the complexity of the Company’s activities. The remuneration is not linked to the Company’s performance. The Company has not granted any share options to the Board members. The remuneration is approved at the Annual General meeting. The Chairman was delegated additional tasks by the Board. The remuneration for these additional services was NOK 140,000 excluding VAT per month. 12. Remuneration of executive personnel The Board has established and the General Meeting has approved the Board’s guidelines for the remuneration of key personnel. The financial interests of the key personnel and the shareholders are aligned through a discretionary bonus scheme. Further information about remuneration of the CEO and executive management is disclosed in note 8 to the consolidated financial statements for the Group. 13. Information and communication Eitzen Chemical’s communication to the market is based on openness and equal treatment of all participants in the securities market. Each December the Company publishes the financial calendar for the coming year. In general the Company presents preliminary annual accounts with the fourth quarter results in February. The Annual Report is normally published in March or April. The Company publishes accounts on a quarterly basis. Official communication is published simultaneously on the Oslo Stock Exchange and on the Company’s website. In connection with the Company’s presentation of quarterly reports, open investor presentations and webcasts are conducted. The CEO reviews the results and comments on the performance and the outlook. The CFO presents the financial figures. In addition, Eitzen Chemical maintains dialog with analysts and investors. It is the Company’s ambition to maintain an impartial distribution of information when dealing with shareholders and analysts. 14. Take-overs There are no defence mechanisms against take-over bids in the Company’s Articles of Association, nor have other measures been implemented to obstruct such take-overs. The Board will not seek to obstruct any takeover bid for the Company’s activities or shares unless there are particular reasons for doing so. In the event of such a bid the Board will seek to comply with the recommendations made in section 14 in the Code and other relevant law and regulations. 15. Auditor Eitzen Chemical has appointed Ernst & Young as auditor. The auditor prepares an annual audit plan which is presented to the Audit Committee in the autumn each year. The auditor also presents to the Audit Committee the results of their assessment and testing of the Company’s internal controls. The auditor is present at the Audit Committee meetings and participates at the Board meeting approving the annual financial statements. At these meetings, the auditor reports on any material changes in the Company’s accounting principles, and on financial items which include material estimation or judgement. The auditor also reports any material matters of contention between the auditor and the management. Further, the Board has a session with the auditor without the presence of the CEO or other members of the management.

79
In order to secure consistency in controls and audits of the Company, Eitzen Chemical generally uses the same audit firm for all subsidiaries worldwide. The Board is kept updated on the use of the auditor by the Company’s executive management for services other than the audit. The Board report the remuneration paid to the auditor at the Annual General Meeting, including details of the fee paid for audit work and any fees paid for other specific assignments. Such details are disclosed in note 8 to the consolidated financial statements for the Group.


82
Fleet list as of 31 December 2012
Owned and leased vessels
Vessel DWT Built Flag Ownership IMO
Sichem Colibri 3,592 2001 MAL Owned II*
Sichem Sparrow 3,596 2001 MAL Owned ll*
Sichem Houston 6,239 1995 UK Owned II*
Sichem Casablanca 6,999 1993 UK Owned II*
Sichem Croisic 7,721 2001 MAL Owned ll*
Sichem Lily 8,000 2009 MAL Owned ll*
Sichem Orchid 8,115 2008 MAL Owned ll*
Sichem Iris 8,140 2008 MAL Owned ll*
Tour Margaux 8,674 1993 MAL Owned ll*
Sichem Palace 8,807 2004 SIN Owned ll*
Sichem Amethyst 8,817 2006 PAN Finance lease ll*
Sichem Ruby 8,824 2006 PAN Finance lease ll*
Tour Pomerol 10,379 1998 SIN Owned ll*
Sichem Fumi 11,674 1996 PAN Owned ll*
Sichem Challenge 12,181 1998 SIN Owned ll*
Sichem Mississippi 12,273 2008 PAN Operating lease II*
Sichem Aneline 8,941 1998 MAR Finance lease ll
Sichem Dubai 12,889 2007 MAL Owned ll
Sichem Marseille 12,928 2007 SIN Owned ll
Sichem Melbourne 12,937 2007 SIN Owned ll
Sichem New York 12,945 2007 SIN Owned ll
Sichem Hiroshima 13,000 2008 SIN Operating lease ll
Sichem Montreal 13,056 2008 SIN Owned ll
Sichem Beijing 13,068 2007 SIN Owned ll
Sichem Hong Kong 13,069 2007 SIN Owned ll
Sichem Paris 13,079 2008 SIN Owned ll
Sichem Mumbai 13,084 2006 PAN Finance lease ll
Sichem Onomichi 13,104 2008 SIN Operating lease ll
Sichem Manila 13,125 2007 SIN Owned ll
Sichem Singapore 13,141 2006 ITA Owned ll
Sichem Edinburgh 13,153 2007 SIN Owned ll
Sichem Rio 13,162 2006 ITA Owned ll
Sichem Defiance 17,396 2001 MAR Owned ll*
Sichem Contester 19,822 2007 SIN Finance lease ll*
North Contender 19,925 2005 PAN Finance lease ll*
North Fighter 19,932 2006 PAN Finance lease ll*
Sichem Pace 19,983 2006 PAN Operating lease ll*
Sichem Defender 20,000 2007 PAN Finance lease ll*
Sichem Osprey 25,000 2009 MAL Owned ll
Sichem Hawk 25,385 2008 MAL Owned ll
Sichem Falcon 25,419 2009 MAL Owned ll
Sichem Eagle 25,421 2008 SIN Owned ll
Siteam Anja 44,640 1997 MAR Owned ll/lll
Siteam Discoverer 46,005 2008 SIN Owned ll
Siteam Voyager 46,017 2008 SIN Owned ll
Siteam Leader 46,017 2009 SIN Owned ll
Siteam Adventurer 46,026 2007 SIN Owned ll
Siteam Explorer 46,026 2007 SIN Owned ll
Siteam Jupiter 48,309 2000 LR Finance lease ll

83
Siteam Neptun 48,309 2000 LR Finance lease ll
* Stainless steel Fleet summary
Owned Finance lease Operating lease Total
Total fleet 36 10 4 50

Eitzen Chemical ASARuseløkkveien 6
P.O. Box 1794 Vika0122 Oslo
Norway
eitzen-chemical.com