Annual Report 2005 2006
195
-
Upload
rohanranjan -
Category
Documents
-
view
248 -
download
16
Transcript of Annual Report 2005 2006


Directors’ Report
Dear Shareholders,
The directors are pleased to present the Annual Reporttogether with audited statement of accounts for the yearended March 31, 2006.
Overview
Bharti Airtel is one of India’s leading private sector providersof telecommunication services, and was the first private playerto have an all India presence. The Company is the largest GSMmobile service provider in the country based on number ofcustomers. The Company had an aggregate of 20,925,948customers as of March 31, 2006, consisting of 19,579,208Mobile and 1,346,740 Broadband & Telephone customers.
During the 2005-06 financial year, the Company crossedcertain key milestones, and maintained its position as oneof the leading telecommunications services provider in Indiaby continuously innovating its strategy and augmenting itsoperations.
Some of the key highlights include the following:The Company became India’s largest integrated privateoperator based on the total customer base;Highest ever net addition of 9,084,406 customers in ayear;Full year consolidated gross revenues of Rs. 117.3 billion(~US$ 2.63 billion) and consolidated EBITDA of Rs. 42.2billion (~US$ 947 million);Full year consolidated net profit of Rs. 20.3 billion (~US$455 million);Year-on-year growth of total customer base by 77%resulted in a 44% increase in revenues, 38% increase inEBITDA and 67% growth in net profit.
Financial Results and Results of Operations
I. Financial highlights of Consolidated Statement ofOperations:
(In Rs. Million, except ratios)
Year ended
Particulars March 31, March 31, Y-o-Y2006 2005 Growth
Gross Revenue 117,255 81,558 44%
EBITDA 42,250 30,658 38%
Cash Profit from 40,006 28,219 42%Operations
Profit before 23,455 15,832 48%Tax
Net Profit 20,279 12,116 67%
The strong operational performance of the Company duringthe year culminated into an equally robust financialperformance.
The consolidated revenues and EBITDA for the year endedMarch 31, 2006 was Rs. 117,255 million and Rs. 42,250million respectively. The consolidated revenues and EBITDAgrew by 44% and 38% respectively for the year endedMarch 31, 2006.
The net finance cost for the year was Rs. 2,244 million ascompared to Rs. 2,439 million for the corresponding periodprevious year. The finance cost declined with the net debtgoing up from Rs. 41,171million to Rs. 41,738 million. Thishas been made possible due to replacement of certain oldborrowings by new borrowings at lower finance cost andfunding through networking capital movement. The increasein absolute EBITDA along-with reduced finance cost duringthe year resulted in the cash profit from operations for theyear ended March 31, 2006 of Rs. 40,006 million as comparedto Rs. 28,219 million for the year ended March 31, 2005.
Profit before tax for the year ended March 31, 2006 was Rs.23,455 million, and the net profit was at Rs. 20,279 millionleading to a net profit growth of 67% over the previous yearand an earnings per share (basic) of Rs. 10.776.
Net debt for the year ended March 31, 2006 was Rs. 41,738million resulting in the net debt to EBITDA of 0.99 times andinterest coverage ratio of 17.71 times.
II. Financial highlights of Standalone Statement ofOperations of the Company (legal entity):
(In Rs. Million, except ratios)
Year ended
Particulars March 31, March 31, Y-o-Y2006 2005 Growth
Gross Revenue 112,906 79,442 42%
EBITDA 40,786 29,940 36%
Cash Profit from 38,530 27,481 40%Operations
Profit before 22,858 15,643 46%Tax
Net Profit 20,121 12,107 66%
DividendThe directors believe that there are tremendous growthopportunities available to the telecom sector and theCompany should leverage these by further expanding andstrengthening its existing network. This will enhanceshareholder value in the long-term. Accordingly, the directorsdo not recommend any dividend for the year endedMarch 31, 2006, in view of the proposed investments innetwork expansion and operations.
Subsidiary companiesThe Company has obtained an exemption from theMinistry of Company Affairs, Government of India vide
37

letter No. 47/164/2006-CL III dated April 26, 2006 in termsof Section 212(8) of the Companies Act from attaching theaudited accounts of its subsidiaries for the financial year. Inpursuance thereof, the Company undertakes that annualaccounts of the subsidiary companies and the relateddetailed information for the year ended March 31, 2006 willbe made available to its investors and subsidiary companies’investors seeking such information at any point of time. Theannual accounts of the subsidiary companies are also keptfor inspection by any investor at the registered office of theCompany and the concerned subsidiary companies. Thestatement required pursuant to the above referred approvalletter are disclosed after the Consolidated Accounts of theCompany forming part of this Annual Report.
Highlights of the Year
Major agreements and alliances: With the objectiveof consolidation and achieving business synergies, BhartiCellular Limited and Bharti Infotel Limited have beenmerged with the Company. The same was sanctionedby the Hon’ble High Court of Delhi on May 21, 2005.The effective date of the merger was April 1, 2004.
Bharti Airtel signed a managed capacity expansioncontract with Ericsson to provide managed servicesand expand its GSM /GPRS network into rural India in15 circles.
The Company and IBM launched Managed Servicesunder their joint go-to-market program. The initialoffering portfolio includes managed hosting servicesand business resiliency and continuity services toenterprise customers in India.
The Company entered into an agreement withNokia to expand its managed GSM/GPRS/EDGEnetworks in eight circles. Nokia will provide managedservices and expand the Company’s network in Mumbai,Maharashtra and Goa, Gujarat, Bihar and Jharkhand,Orissa, Kolkata, West Bengal and Madhya Pradesh overa three-year period.
The Company decided not to proceed with theproposed sponsored ADR due to lack of sponsorshipinterest by most of its principal shareholders.
The Company entered into strategic partnershipoutsourcing agreements for its customer care callcenter operations to four international BPOs -Hinduja TMT (HTMT), IBM Daksh, Mphasis andTeleTech Services, with the expectation of significantlyenhancing quality of customer service delivery to BhartiAirtel customers across the country. The Company alsoentered into an agreement with Nortel for technologicalexpertise and availing best practices in customer caredeveloped through Nortel’s worldwide customer base.
Vodafone acquired 10% economic interest in theCompany during the financial year 2005-06, by way of
subscription of convertible debentures in BhartiEnterprises Limited, representing an indirect economicinterest in Bharti Airtel Limited and acquisition of directinterest in the Company from Warburg Pincus LLC.
South East Asia, Middle East and Western Europe4 (SEA-ME-WE-4) - A consortium of 16 internationaltelecommunications companies including our Companysuccessfully commissioned the next generationundersea cable system during the year.
The Company announced its new integratedorganization structure with the appointment ofManoj Kohli as the President of all business units to leadthe integrated management structure with effect fromMarch 1, 2006.
In order to reflect its brand essence, objective and thenature of its business activities, the Company name waschanged to Bharti Airtel Limited from Bharti Tele-Ventures Limited, effective April 24, 2006.
Capital market ratings:
ICRA assigned Issuer Rating of “Ir AAA” to theCompany during the year. This rating is the highest creditquality rating assigned by ICRA.
Standard & Poors upgraded its corporate creditrating on Bharti Airtel Limited to “BB+” from “BB”with stable outlook.
CRISIL has assigned “AAA/Stable” to the long-termdebt programme of Bharti Airtel Limited indicatinghighest safety.
Fitch ratings, the international rating agency, upgradedthe Company’s long-term foreign currency ratingto “BB+” from “BB” with a stable outlook on rating.
CRISIL re-affirmed its Governance & Value Creation(GVC) rating viz. ‘level 1’, which indicates that theCompany’s capability with respect to creating wealthfor all its stakeholders is the highest.
New products/initiatives:
During the year, the Company introduced new andinnovative products that were received well in the marketand enabled the Company to maintain its leadership positiondespite competitive pressures.
The Company introduced Rs. 200/- denominationmonthly recharge coupon in May 2005. It thus loweredthe recharge denomination available in the market,thereby making mobile services more affordable.
Launch of BlackBerry® 7100g™ business phone inIndia in the month of June 2005 and BlackBerry®8700g™ in March 2006. Bharti Airtel has made a widerportfolio of BlackBerry® products available in India inpartnership with Research In motion (RIM). BlackBerry®solutions provide instant emailing solutions.
38
Launch of a suite of mobile services including BridgeRoaming, Bridge Prepaid, Bridge Enterprise andBridge Concierge. These services will enable ourcustomers to enjoy a seamless mobile service experiencewhen roaming overseas on the Alliance Membersnetwork. Bharti Airtel is the founder member of theBridge Alliance, which was established in November2004 and includes Globe Telecom (Philippines), Maxis(Malaysia), Singtel Mobile (Singapore), Singtel Optus(Australia), Taiwan Mobile (Taiwan), Telkomsel(Indonesia) and CSL (Hong Kong).
The Company launched ‘Future Factory - Centres ofInnovation’ to incubate pioneering mobile applications.The Future Factory has been conceptualized with thepurpose of developing applications to cater to the needsof customer segments across the entire spectrum.
Bharti Airtel, ICICI Bank and VISA joined hands to launchmChq – a credit card on the mobile phone. This isthe first mobile-to-mobile payment option, whichenables Bharti Airtel customers and ICICI Bank Visacardholders to pay for their purchases with their Airtelmobile phones.
Bharti Airtel launched a suite of ‘One India plans’ forMobile and Broadband & Telephone Servicescustomers in March 2006. These plans give the optionof making calls to any location in the country at a flat rateof Re. 1 per minute.
Bharti Airtel launched the world’s first Easy Musicservice for mobile phones. This service allows a mobilephone user a choice of over 18,000 songs in over 20languages for purchase from over 100,000 Bharti Airtelretail outlets in India for use as ring tones and call backtones.
Bharti Airtel introduced India’s first Rs. 999 Lifetimeprepaid card with a life time validity with which a mobileuser can continue to receive calls for lifetime withouthaving to recharge or worry about the validity period ofthe card or coupon. The lifetime-prepaid card also offersthe user full talk time on every future recharge of anydenomination.
Business Review
Mobile Services
During the financial year, the Company expanded its operationsto 3,778 census towns and over 80,687 non-census townsand villages covering approximately 40% of the country’stotal population. The Company added 8,594,928 mobilesubscribers during the year, garnering 22.7% share of the allIndia net additions in the wireless market and had a wirelessmarket share of 21.8% as on March 31, 2006. The Company’sstrong performance helped consolidate its leadership in themarket and has given it the might to take full advantage ofthe rapidly growing telecom market.
The revenues from mobile services for the financial yearwere Rs.83,095 million, a growth of 50% over the revenuesin the previous financial year. The mobile services business
contributed 71% to the consolidated revenues. The growthin revenues happened despite reductions in tariffs and intensecompetition. This robust growth was due to increases insubscriber base on account of the launch of Rs. 200 monthlyrecharge coupon and Rs. 999 lifetime prepaid, higher trafficon networks, and expansion of non-voice services. Withmobile tariffs in India being among the lowest in the world,the Company’s prime focus is on ensuring customersatisfaction through superior network quality, customerservice and continuous innovation in value-added servicesthat would help expand its mobile customer base and driveup volumes.
The key financial results of the mobile segment for the yearended March 31, 2006 are presented below:
Financial highlights of Mobile Services:
(In Rs. Million, except ratios)
Year ended
Particulars March 31, March 31, Y-o-Y2006 2005 Growth
Gross Revenue 83,095 55,436 50%
Earnings before 16,854 10,385 62%Interest & Taxation
Broadband & Telephone Services
The Company provides Broadband & Telephone Services in90 cities across India. As on March 31, 2006, the Companyhad 1,346,740 customers, of which 23.4% (315,729) werealso subscribing to broadband services.
The customer base for the Broadband & Telephone Servicesgrew by 57% in the year ended March 31, 2006. Therevenues from the Broadband & Telephone Services wereRs.15,075 million, a growth of 33% over the revenues in theprevious financial year. The earnings before interest andtaxation was Rs. 606 million as compared to Rs. 1442 in theprevious financial year. The decline in EBIT was essentiallydue to the launch of services in 38 new cities during thefinancial year.
The key financial results of the Broadband & Telephone Servicesfor the year ended March 31, 2006 are presented below.
Financial highlights of Broadband & Telephone Services:
(In Rs. Million, except ratios)
Year ended
Particulars March 31, March 31, Y-o-Y2006 2005 Growth
Gross Revenue 15,075 11,311 33%
Earnings beforeInterest & Taxation 606 1,442 -58%
Enterprise Services
As a part of the new integrated structure, the Company hasreclassified and created two sub units under this businessgroup, viz. Carriers (Long Distance Services) and Corporates.
39

Enterprise Services – Carriers
The Company complements its Mobile, Broadband andTelephone Services with national and international longdistance services. The Company has over 32,900 routekilometers of fibre on its national long distance network.For international connectivity to the East, it has a submarinecable landing station at Chennai which links the submarinecable (owned by an associate company) connecting Chennaiand Singapore. For international connectivity to the West, itis a member of the South East Asia-Middle East-WesternEurope – 4 (SEA-ME-WE-4) consortium jointly with 15 otherglobal telecom operators, and has commissioned the fourthgeneration cable system.
During the financial year, the Company saw significantgrowth in the long distance traffic carried on its networkdue to the increased customer base and lower tariffs onaccount of reduction in the regulatory costs (License feeand Access Deficit Charge).
The key financial results of the long distance services divisionfor the year ended March 31,2006 are presented below.
Financial highlights of Enterprise Services – Carriers:
(In Rs. Million, except ratios)
Year ended
Particulars March 31, March 31, Y-o-Y2006 2005 Growth
Gross Revenue 24,674 18,737 32%
Earnings before 7,794 4,716 65%Interest & Taxation
Enterprise Services – Corporates
This sub-unit of Enterprise Services provides secure, scalable,seamless, reliable and customized integrated solutions ofvoice and data communications to corporate, small andmedium scale enterprises, thus offering total telecomsolution through a single window. The unit focuses ondelivering telecommunications services as an integratedoffering including mobile, broadband, telephone, nationaland international long distance and data connectivityservices to key account corporate customers throughbusiness relationship management.
The key financial results of the enterprise services divisionfor the year ended March 31,2006 are presented below.
Financial highlights of Enterprises Services – Corporates:
(In Rs. Million, except ratios)
Year ended
Particulars March 31, March 31, Y-o-Y2006 2005 Growth
Gross Revenue 6,933 5,406 28%
Earnings before 1,762 2,284 -23%Interest & Taxation
Regulatory and Key Industry Developments
During the year, the following are the key regulatorydevelopments:
Telecom Regulatory Authority of India (TRAI) introduceda revised Interconnection Usage Charge (IUC) regime.‘Per-minute’ Access Deficit Charge (ADC) on domesticcalls has been replaced by a ‘revenue-share’ of 1.5% ofadjusted gross revenue as ADC, payable to BSNL. Revenuefrom Rural Fixed Wireline subscribers is exempt fromADC. ‘Per minute’ ADC continues on ILD calls but at areduced rate. Carriage charges, which were distancebased earlier, are now left to negotiation betweenoperators subject to a ceiling of Rs.0.65/minute;
The IUC (Fifth Amendment) Regulation, 2005 thatimposed ADC on calls originated by national andinternational roamers has been set aside by TDSAT;
TRAI has issued a Regulation on Quality of ServiceParameters of Basic and Cellular Mobile TelephoneServices and a Regulation on Code of Practice forMetering and Billing Accuracy in India;
The ceiling tariffs for IPLCs prescribed by TRAI, whichwere contested by VSNL, have been upheld by TDSATand these are now in effect;
Pursuant to public consultations, TRAI has submittedrecommendations to the Department of Telecom onthe following matters:
a. Spectrum
b. Convergence and Competition in Broadcasting andTelecommunications
c. Mobile Number Portability
d. Next Generation Networks
e. Measures to promote growth of telecom servicesin rural areas
f. Measures to Promote Competition in IPLC in India
g. Publications of Telephone Directory and Provisionof Directory Enquiry Services.
The DoT has issued guidelines for allocation of GSMspectrum beyond 10 MHz and upto 15 MHz, andallotment of 5th and 6th CDMA carriers. The allocationcriterion continues to be linked to a minimum subscriberbase. The rest of the recommendations are underconsideration.
The Government of India enhanced the FDI ceiling inthe telecom sector from 49% to 74% subject to certainpreconditions.
The Central Government revised terms and conditionsof several telecom service licenses which include:
a. Entry Fee for NLD and ILD licenses reduced fromRs.1,000 million and Rs. 250 million respectively toRs. 25 million;
40

b. Annual License Fee for NLD and ILD licenses reducedfrom15% to 6% of Adjusted Gross Revenue (AGR);
c. NLD and ILD licensees permitted to accesssubscribers directly for provision of Leased Circuits/Closed User Groups;
d. Annual License Fee @ 6% of AGR imposed onInternet Service Providers licensed with restrictedinternet telephony;
e. Infrastructure provider category II and VPN licensesabolished. Existing licensees permitted to migrateto NLD/ILD licenses;
f. Annual License Fee for VSAT commercial licensereduced from 10% to 6% of AGR.
Share Capital
The Company allotted 2,722,125 Equity Shares of Rs. 10/-each upon merger of Bharti Cellular Limited (BCL) into theCompany.
During the year the Company allotted 18,242,237 equityshares upon conversion of Foreign Currency ConvertibleBonds (FCCBs) by their holders. Due to these reasons, as onthe date of this report, the total issued, subscribed and paidup equity share capital of the Company stands increased to1,894,419,574 equity shares.
Corporate Governance
The Company was ranked amongst the Top 25 Companiesby the Institute of Company Secretaries of India for goodcorporate governance practices in the year 2005.
CRISIL has rated our corporate governance practices at thehighest-level GVC I, indicating our capability to create wealthfor our stakeholders while preserving the highest standardsof ethics and governance.
Pursuant to the requirements of Clause 49 of the ListingAgreement with the Stock Exchanges, a report of corporategovernance forms part of the Annual Report. A certificate byPrice Waterhouse, Chartered Accountants, Auditors of theCompany, confirming compliance of the conditions ofcorporate governance as stipulated under clause 49 of theListing Agreement, is annexed to corporate governance report.
Corporate Social Responsibility
The Company believes in the power of education. Based onthe experience of last year, Bharti Foundation expanded itsoperations this year by setting up 15 more Bharti ComputerCentres and 92 Bharti Libraries across 11 states. In the mid-day meal program, the kitchen set up in Vrindavan is able tofeed 43,000 children every day. Bharti Foundation’s programon elementary education reaches out to over 70,000children.
On March 20, 2006 the Hon’ble Prime Minister of India,Dr. Manmohan Singh inaugurated the Bharti School ofTelecommunication Technology and Management at IITDelhi. Bharti School has been set up with a vision “To developTelecom Leaders through excellence in education and
research”. Over 200 students benefit from Bharti Schoolannually. It also conducts programs for industryprofessionals. Bharti Merit Awards have been established torecognize excellence and merit.
In order to achieve its vision in the area of education, BhartiFoundation will set up a large number of primary schools inrural areas across India to provide quality education tounderprivileged children, especially girls. To support BhartiFoundation’s work, a corpus of Rs. 2 billion will be createdover the next two years.
Employees Stock option plan
Human Resource is the key to the success of anyorganization. The Company has always valued its humanresources and has tried to adopt the best HR practices.Accordingly an ESOP Scheme was introduced in 2002, whichbenefited the employees. The second ESOP Scheme wasintroduced in 2005, the approval for which was obtainedby way of a Special Resolution passed by the shareholders inthe Tenth Annual General Meeting. The ESOPs also act as aretention tool for well-performing employees who arecontributing to the growth of the Company.
The disclosures in compliance with clause 12 of the Securitiesand Exchange Board of India (Employee Stock Option Schemeand Employee Stock Purchase Scheme) Guidelines, 1999, asamended are set out in Annexure A to this Report.
A certificate from M/s. Price Waterhouse, CharteredAccountants, Statutory Auditors, with regards to theimplementation of the Company Employees’ Stock OptionSchemes, would be placed before the shareholders in thenext Annual General Meeting, and a copy of the same shallbe available for inspection at the registered office of theCompany.
Awards
We are pleased to report that the Company received manyaccolades and awards during the year in India and abroadon the quality of its management, leadership and customerservice and has been ranked amongst leading companiesin renowned business publications. Your Chairman has alsobeen conferred with many awards. Details of the awardsare separately listed in another section of this report.
Directors
Chua Sock Koong, Bashir Currimjee and Donald Cameronretire by rotation at forthcoming Annual GeneralMeeting and being eligible, offer themselves forre-appointment.
Since the last Directors Report, Gavin John Darby,Ajay Lal, Syeda Bilgrami Imam and Paul Donovan wereappointed as additional directors on the Board of theCompany and hold office until the conclusion of theforthcoming Annual General Meeting.
York Chye Chang and Arun Bharat Ram were appointed onthe Board of the Company on March 31, 2006 to fill up thecasual vacancies caused by the resignations of Lim Toon
41

and Lung Chien Ping respectively and hold office until the
conclusion of ensuing Annual General Meeting. Paul
Donovan has been appointed as director effective April, 27
2006 in the vacancy caused by the resignation of William
Thomas Morrow and he holds office until the conclusion of
the ensuing Annual General Meeting.
The Company has received notices from the members under
Section 257 of the Companies Act, 1956 proposing the
appointment of all of these directors, retiring at the ensuing
Annual General Meeting.
A brief resume, expertise, shareholding in the Company and
details of other directorships of these directors as stipulated
under Clause 49 of the Listing Agreement with the Stock
Exchanges is appended as an annexure to the Notice of
ensuing Annual General Meeting.
Since the last Directors’ report, Lim Toon, Lung Chien Ping
and William Thomas Morrow have ceased to be directors of
the Company. The Board places on record its sincere
appreciation for the services rendered by Lim Toon, Lung
Chien Ping and William Thomas Morrow during their tenure
on the board. The Board and the Company has benefited
immensely from their inputs.
Fixed Deposits
During the year, the Company has not accepted any fixed
deposits from the public.
Auditors
The Statutory Auditors of the Company, M/s. Price
Waterhouse, Chartered Accountants, New Delhi, retire at the
conclusion of ensuing Annual General Meeting of the
Company and are eligible for re-appointment and have
confirmed that their re-appointment if made, shall be within
the limits Section 224(1B) of the Companies Act, 1956. The
Audit Committee and the Board recommends the re-
appointment of Price Waterhouse, Chartered Accountants
as Auditors of the Company.
Auditor’s Report
The Board has duly examined the statutory auditor’s report
to accounts and clarifications, wherever necessary, have been
included in the Notes to Accounts, section of the Annual
Report.
Conservation of Energy, Technology Absorption and
Foreign Exchange
The Company, being a service provider organization, most
of the information as required under Section 217(1)(e) read
with the Companies (Disclosure of Particulars in the Report
of the Board of Directors) Rules 1988 as amended are not
applicable. However, the information as applicable has been
given in Annexure B to the report.
Particulars of Employees
Information as per the privisions of Section 217 (2A) of theCompanies Act, 1956 read with the Companeis (Particularof Employees) Rule 1975 as amended, forms part of thisReport and are given in Annexure C of this Report.
Directors’ Responsibility Statement
Pursuant to Section 217(2AA) of the Companies Act, 1956,the directors to the best of their knowledge and beliefconfirm that:
a) in the preparation of the annual accounts, the applicableaccounting standards have been followed along withproper explanation relating to material departures;
b) they have selected such accounting policies and appliedthem consistently and made judgements and estimatesthat are reasonable and prudent so as to give a true andfair view of the state of affairs of the Company as at theend of the financial year and of the profit of the Companyfor that period;
c) they have taken proper and sufficient care for themaintenance of adequate accounting records inaccordance with the provisions of the Companies Act,1956 and for safeguarding the assets of the Companyand for preventing and detecting fraud and otherirregularities;
d) they have prepared the annual accounts on a goingconcern basis.
Management Discussion and Analysis Report
In accordance with the listing agreements, the ManagementDiscussion and Analysis Report forms a part of the report.
Acknowledgements
The directors place on record their gratitude to the CentralGovernment, the State Governments, Department ofTelecommunications (DOT), other statutory bodies and theCompany’s Bankers for the assistance, co-operation andencouragement they extended to the Company. Thedirectors also place on record their sincere appreciation tothe employees for their continuing support and unstintingefforts in ensuring an excellent all round operationalperformance. Last but not the least the directors would liketo thank various partners viz. Bharti Telecom, SingTel TelecomInternational Ltd., Vodafone and other valuable shareholdersfor their support and contribution. We look forward to theircontinued support in the future.
For and on behalf of the Board
Sunil Bharti MittalNew Delhi Chairman and Managing DirectorApril 28, 2006
42

Annexure A
INFORMATION REGARDING THE EMPLOYEES STOCK OPTION SCHEME(S)(as on March 31, 2006)
Sl. Particulars ESOP ESOPNo. Scheme 2005 Scheme 2001
1) Number of Stock Options granted 2,763,000 16,826,505*
2) Pricing Formula The exercise price for the purpose of grant 14,507,843 @ 22.5of options will be higher of the following: 2,190,000 @ 70(i) The average of the weekly high and 71,265 @ 0
low of the closing prices of the 20,000 @ 120related shares quoted on the stock 37,397 @ 267.4exchange during the six monthspreceeding the relevant date;
(ii) The average of the weekly high and low of the closing prices of the related sharesquoted on a stock exchange during thetwo weeks preceeding the relevant date.
However, the exercise price in respect ofemployees who met the eligibility criteriaas on June 1, 2005 was Rs. 221/-
3) Option Vested Nil 14,284,826
4) Number of options exercised Nil 10,808,282
5) Number of shares arising as a result of Nil 10,808,282exercise of option
6) Number of option lapsed 164,500 3,253,147
7) Variation of terms of option NA NA
8) Money realized by exercise of options NA 219,420,557.5
9) Total number of options in force 2,598,500 2,765,076
10) Employee-wise details of options granted toi) Senior Mangerial Personnel
a) Manoj Kohli 20,000 Nilb) Sarvjit Singh Dhillon 20,000 Nilc) Viresh Dayal 20,000 Nild) Ashok Juneja 20,000 Nile) Narender Gupta 20,000 Nilf) Daljit Singh Nil 37,397g) Anil Nayar 20,000 Nil
ii) Any other employee who receives a Nil Nilgrant in any one year of optionamounting to 5% or more of optiongranted during that year;
iii) Identified employees who were granted Nil Niloptions, during any one year, equal to orexceeding 1% of the issued capital(excluding outstanding warrants andconversions) of the Company at thetime of grant.
43
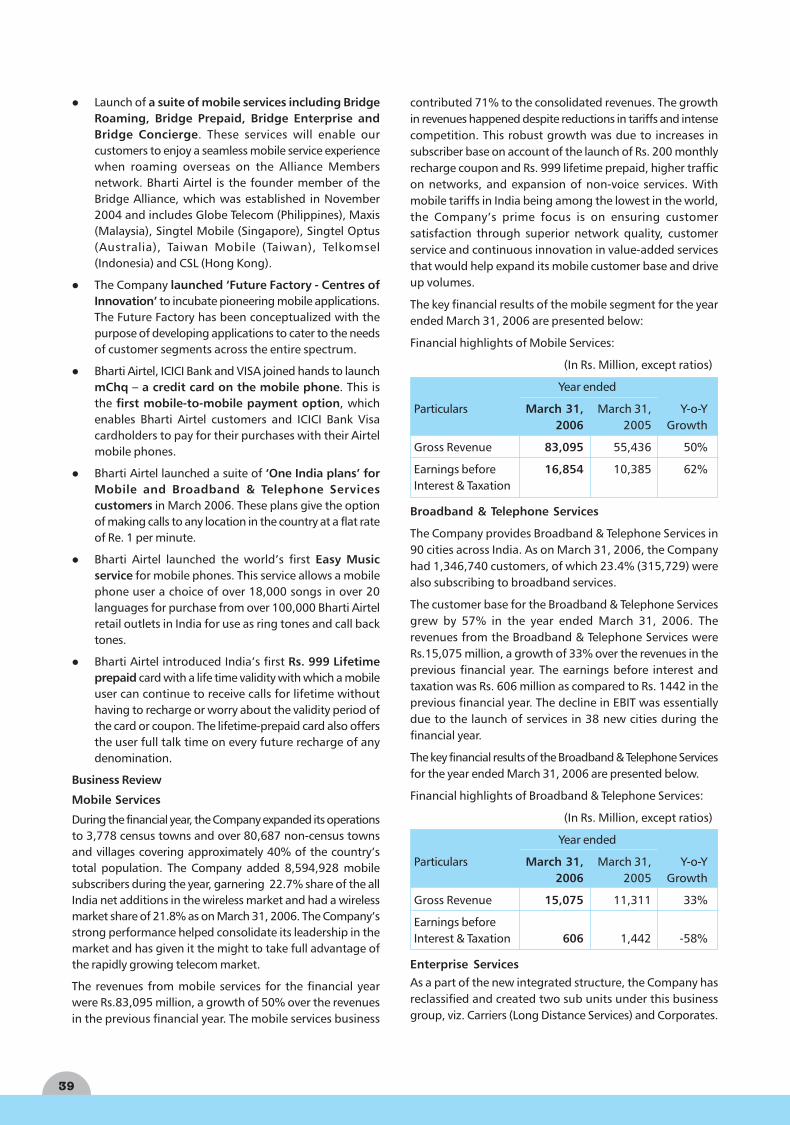
11) Diluted Earning Per Share (EPS) pursuant to Nil N.A.issue of shares on exercise of optionscalculated in accordance with AccountingStandard (AS) 20 ‘Earning Per Share’
12) In case, the employees compensation cost is N.A. Rs. 37,736,249calculated on the basis of intrinsic value ofstock option, the difference between theemployees compensation of the stockoption cost based on intrinsic value of thestock and the employees compensation ofthe stock option cost based fair value, andthe impact of this difference on profitsand on EPS of the Company
13) For options whose exercise price eitherequals or exceeds or is less than themarket price of the stock the followingare disclosed seperately:a) Weighted average exercise price a) Rs. 238.03 a) Rs. 22.5; Rs. 70; Rs. 0b) Weighted average fair value b) Rs. 191.86 b) NA; NA; Rs. 139.40
14) A description of the method and significantassumptions used during the year to estimatethe fair values of options, including thefollowing weighted-average information:
i) risk-free interest rate; i) The Government Securities curve yields NAare considered as on valuation dateWeighted average information - 6.65%per annum to 7.33% per annum
ii) expected life; ii) SEBI guidelines on ESOP have been NAstrictly followedWeighted average information -48 to 66 months
iii) expected volatility; iii) Analysing the stock price behaviour NAof Bharti Airtel Limited since February2002, the historical volatality is 44.48%annualized. Such volatality is annualizedusing daily price data and assuming250 trading days to annualize the sameWeighted average information -44.48% to 45.87%
iv) expected dividends; and iv) The dividend rate is assumed to be zero NA
v) the price the underlying shares in the v) Weighted average stock price - Rs. 327.96 NAmarket at the time of option grant.
* Grants of 2318662 number of shares were made out of the options lapsed over a period of time.
Sl. Particulars ESOP ESOPNo. Scheme 2005 Scheme 2001
44

Annexure BINFORMATION RELATING TO CONSERVATION OF ENERGY, TECHNOLOGY ABSORPTION, RESEARCH AND DEVELOPMENT
AND FOREIGN EXCHANGE EARNING AND OUTGO FORMING PART OF DIRECTORS’ REPORT IN TERMS OF SECTION
217(1)(e) OF THE COMPANIES ACT, 1956 READ WITH THE COMPANIES (DISCLOSURE OF PARTICULARS IN THE REPORT
OF THE BOARD OF DIRECTORS) RULES 1988.
Conservation of Energy
Bharti Airtel Limited being a telecom service provider requires minimal energy consumption and every endeavour has been
made to ensure the optimal use of energy, avoid wastage and conserve energy as far as possible.
Technology Absorption
The Company in its endeavour to obtain and deliver the best, has entered into a number of agreements and alliance with
major global telecom players to harness and tap the latest and the best technology available to the industry.
Foreign Exchange Earnings and Outgo
(i) Activities relating to exports; initiatives taken to increase exports; development of new export markets for products and
services; and export plans; Bharti Airtel, being a telecom service provider could due to its licences restrictions, not have
undertaken any activity relating to exports or development of export markets for services during the year.
(ii) Total foreign exchange used and earned for the year :
(a) Total Foreign Exchange Earning : Rs. 12,760 million
(b) Total Foreign Exchange Outgo : Rs. 24,440 million
45

46
An
nex
ure
- C
Stat
emen
t of
par
ticu
lars
und
er S
ecti
on 2
17(2
A) o
f the
Com
pani
es A
ct, 1
956
read
wit
h th
e C
ompa
nies
(Par
ticu
lars
of E
mpl
oyee
s) R
ules
, 197
5 fo
r the
yea
ren
ded
Mar
ch 3
1,20
06 a
nd fo
rmin
g pa
rt o
f the
Dir
ecto
rs’ R
epor
t
Sl.
Nam
eD
esig
nat
ion
Nat
ure
of
Nat
ure
of
Qu
alif
icat
ion
(s)
Age
Dat
e o
fTo
tal
Gro
ssPr
evio
us e
mp
loym
ent/
No
.Em
plo
ymen
t,d
uti
es o
f(i
n y
ears
)C
omm
ence
men
tex
peri
ence
Rem
un
erat
ion
Des
ign
atio
nw
heth
erth
eof
Em
plo
ymen
t(i
n y
ears
)(i
n R
s.)
con
trac
tual
empl
oyee
or o
ther
wis
e
(A)
EMPL
OYE
D T
HR
OU
GH
OU
T TH
E FI
NA
NC
IAL
YEA
R
1.A
run
Kr. P
adhi
Chi
ef H
uman
Reso
urce
Off
icer
Perm
anen
tH
uman
Res
ourc
eM
A (E
co),
MBA
51
20
-Jan
-03
27
27
73
28
5Bh
arti
Tel
e-Ve
ntur
es L
td./V
ice
Pres
iden
t (H
R)2.
K. V
ijaya
ragh
avan
Chi
ef T
echn
ical
Off
icer
Perm
anen
tTe
chni
cal
BE (E
&E)
, PG
Dip
lom
a5
21
0-O
ct-0
03
06
52
45
62
Spic
e Te
leco
m/V
ice
Pres
iden
t Te
chni
cal
in B
us. M
gmt,
3.K.
Sri
niva
sD
irec
tor
(Eas
t)Pe
rman
ent
Ope
rati
ons
B.Te
ch.,
PGD
M4
27
-No
v-0
21
96
82
55
23
Hin
dust
an L
ever
Ltd
./Bus
ines
s M
anag
erN
ew V
entu
res
4.D
eepa
k M
ehro
tra
Chi
ef E
xecu
tive
Off
icer
-Pe
rman
ent
Ope
rati
ons
BE (E
lect
rica
l), M
MS
41
30
-Oct
-03
17
54
80
91
8H
indu
stan
Coc
a C
ola
Beve
rage
s/Re
gion
Karn
atak
a V
ice
Pres
iden
t –
Ope
rati
ons
5.Sh
arlin
Tha
yil
Chi
ef O
pera
ting
Perm
anen
tO
pera
tion
sB.
Tec
h., M
BA4
42
8-D
ec-0
02
03
17
66
63
BILT
/Dy.
Gen
eral
Man
ager
– S
outh
Off
icer
- H
P6.
Badr
i Aga
rwal
Cor
pora
te D
irec
tor
Perm
anen
tO
pera
tion
sB.
Com
, CA
56
1-S
ep-0
03
63
02
96
33
1BM
L-A
P &
KK/
Exec
utiv
e D
irec
tor
& C
EO7.
Ani
l Nay
arC
orpo
rate
Dir
ecto
r -
Perm
anen
tG
ener
alBE
, PG
DM
55
1-A
pr-
03
33
13
98
94
61
Bhar
ti C
ellu
lar
Ltd.
(PO
)/Pre
side
ntC
hair
man
’s O
ffic
eM
anag
emen
t8.
Hem
ant
Sach
dev
Dir
ecto
r M
arke
ting
&C
omm
unic
atio
nsPe
rman
ent
Mar
keti
ngB.
Com
42
1-A
pr-
99
20
95
11
23
8Bh
arti
Tele
com
Ltd
./Sr.V
P (M
ktg
& C
orp.
Com
mn.
)9.
K. L
. Jai
nC
orpo
rate
Dir
ecto
r -
Perm
anen
tC
orp.
Aff
airs
B.Sc
. (H
ons.
), M
BA5
61
-Oct
-98
34
11
77
16
56
Bhar
ti H
ealt
hcar
e Lt
d./E
xecu
tive
Dir
ecto
rC
orpo
rate
Aff
airs
10
.N
aren
der
Gup
taD
irec
tor
- Le
gal a
ndPe
rman
ent
Secr
etar
ial &
B.Co
m, P
GD
M,
47
1-A
pr-
01
27
59
10
48
2Bh
arti
Cel
lula
r Lt
d./
Reg
ula
tory
Reg
ula
tory
FCS-
ICSI
, LL
BC
ompa
ny S
ecre
tary
11
.V
iresh
Day
alC
orpo
rate
Dir
ecto
r -
Perm
anen
tBu
sine
ssB.
Tech
, PG
DM
49
1-A
ug
-00
28
94
79
40
2Bh
arti
Tel
enet
Ltd
./Bu
sine
ss D
evel
opm
ent
Dev
elop
men
tD
irec
tor(
Op
erat
ions
)1
2.
Jant
ina
Cat
hari
naA
llian
ce D
irec
tor
Con
trac
tual
Alli
ance
&M
aste
r of
Dut
ch L
aw4
61
6-A
ug
-01
29
19
21
56
18
Brit
ish
Tele
com
/Alli
ance
Dir
ecto
rva
n de
Vre
ede
CSR
13
.M
anoj
Koh
liPr
esid
ent
Perm
anen
tG
ener
alB.
Com
, LLB
, MBA
47
26
-Oct
-02
27
16
99
22
35
Esco
tel M
obile
Com
mun
icat
ions
Ltd
./M
anag
emen
tEx
ecut
ive
Dir
ecto
r &
CEO
14
.Su
nil B
hart
i Mit
tal
Cha
irm
an &
Con
trac
tual
Gen
eral
Gra
dua
te4
81
-Oct
-01
20
98
00
29
36
Bhar
ti C
ellu
lar
Ltd.
/CM
DM
anag
ing
Dir
ecto
rM
anag
emen
t1
5.
Raja
n Bh
arti
Mit
tal
Join
t M
anag
ing
Con
trac
tual
Gen
eral
Gra
dua
te4
51
-Oct
-01
20
26
47
25
30
Bhar
ti In
fote
l Ltd
./MD
Dir
ecto
rM
anag
emen
t1
6.
Akh
il G
upta
Join
t M
anag
ing
Con
trac
tual
Gen
eral
CA5
01
-Sep
-03
24
36
08
58
29
Co
nsu
ltan
cyD
irec
tor
Man
agem
ent
17
.V
ijaya
Sam
path
Cor
pora
te D
irec
tor
-Pe
rman
ent
Lega
lB.
A.,
LLB,
FC
S5
21
-Jan
-04
22
86
94
54
7Ra
nbax
y La
bora
tori
es/V
P (L
egal
& S
ecre
tari
al)
Gen
eral
Cou
nsel
&Se
cret
aria
l1
8.
Har
ish
Dua
Chi
ef o
f C
ompl
ianc
e &
Perm
anen
tIn
tern
al A
udit
&CA
, MBA
47
23
-Feb
-04
27
37
59
66
0Pe
psi F
oods
Pvt
. Ltd
./VP
(Cor
p. P
lann
ing)
Inte
rnal
Aud
itC
hief
Com
plia
nce
19
.A
shok
Jun
eja
Chi
ef T
echn
ical
Off
icer
Perm
anen
tTe
chni
cal
B. Te
ch.,
PGD
M4
92
9-O
ct-0
32
71
07
32
48
6Bh
arti
Bro
adba
nd N
etw
orks
Ltd
./Dir
ecto
r2
0.
Suni
l K.
Goy
alC
hief
Ope
rati
ngPe
rman
ent
Ope
rati
ons
ICW
AI,
MBE
, CFA
37
2-M
ar-0
11
54
00
61
70
Dab
ur In
dia
Ltd.
/Sr.
Mgr
. Cor
pora
te P
lann
ing
Off
icer
- M
P2
1.
Dev
endr
a Kh
anna
Gro
up F
inan
cial
Perm
anen
tFi
n &
Acc
tsCA
45
1-S
ep-0
41
73
60
18
39
Triv
eni E
ngin
eeri
ng In
dust
ries
Ltd.
/C
on
tro
ller
VP
- C
orp
Fina
nce
& P
lann
ing
22
.Sa
njee
v Ku
mar
Chi
ef O
pera
ting
Perm
anen
tO
pera
tion
sB.
Com
(Hon
s), C
A,C
S4
11
-Ju
l-0
32
16
04
37
78
Bhar
ti M
obile
Ltd
./CFO
Saxe
naO
ffic
er-O
riss
a2
3.
Vin
it T
anej
aSr
.Vic
e Pr
esid
ent
Perm
anen
tH
uman
Res
ourc
eB.
Tech
. (M
ech.
),4
82
7-S
ep-0
42
43
41
05
40
Inst
itut
e of
Qua
lity
Ltd/
Sr. V
P &
Dir
ecto
rPG
DM
24
.Sa
rvjit
Sin
gh D
hillo
nD
irec
tor
Fina
nce
&C
ontr
actu
alFi
n. &
Acc
ts.
BA,
(Hon
s)3
91
-Sep
-04
18
13
40
41
92
Bhar
ti C
ellu
lar
Ltd.
/Gro
up C
FO &
Busi
ness
Int
egra
tion
FCIM
A, M
BAD
irec
tor
Mob
ility
25
.Ra
jesh
Kha
rban
daSe
nior
Vic
e Pr
esid
ent
Perm
anen
tIT
and
Tec
hnol
ogy
M.S
c.(P
hy),
MBA
51
16
-Jan
-03
25
28
70
38
9N
ew H
olla
nd/C
hief
Inf
orm
atio
n O
ffic
er2
6.
Yudh
iste
r Ba
hlG
ener
al M
anag
erPe
rman
ent
Fina
ncia
lB.
A.(H
ons)
MA
,3
96
-Ap
r-0
41
32
48
73
33
GA
IAM
, IN
C./C
hief
Fin
anci
al O
ffic
erPl
anni
ngM
.B.A
27
.Ra
vi K
aush
alG
roup
Vic
e Pr
esid
ent
Perm
anen
tFi
n &
Acc
tsB.
Com
(H
ons)
, CA
,5
01
7-A
pr-
95
23
39
69
23
0TC
IL B
ellS
outh
Ltd
./Gen
eral
Man
ager
(Fi
n.)
28
.H
arsh
vend
ra S
oin
Vic
e Pr
esid
ent
Perm
anen
tH
uman
Res
ourc
eB.
Com
(H
ons)
,3
61
9-A
ug
-02
12
25
08
38
4EI
H L
td./G
M -
HR
Bach
elor
of
Law
,M
PM &
IR2
9.
Sanj
ay N
andr
ajog
Exec
utiv
ePe
rman
ent
Ope
rati
ons
B.Te
ch (
Che
m),
MBA
43
8-J
an-0
31
91
00
33
59
1Pe
psic
o/M
arke
t U
nit
Dir
ecto
rD
irec
tor
(Nor
th )
30
.P.
Sw
amin
atha
nC
hief
Exe
cuti
ve O
ffic
erPe
rman
ent
Ope
rati
ons
B.Te
ch, P
GD
M5
01
-Ap
r-0
32
78
35
85
35
Bhar
ti T
elen
et L
td./C
hief
Exe
cuti
ve O
ffic
er,
& D
irec
tor
-TN
MP
31
.V
inod
Saw
hny
Join
t Pr
esid
ent
- A
irte
lPe
rman
ent
Gen
eral
BE (
Mec
h), P
GD
BM4
71
5-J
ul-
02
22
10
80
70
51
Spic
e C
omm
unic
atio
ns,
Punj
ab,
Ente
rpri
ses
Serv
ices
Man
agem
ent
Man
agin
g D
irec
tor
32
.Ra
jiv J
aitl
yC
hief
Exe
cuti
vePe
rman
ent
Ope
rati
ons
BE, M
BA4
518
-Mar
-02
21
49
88
44
9D
ata
Acc
ess
Indi
a Lt
d./E
xecu
tive
Vic
e Pr
esid
ent
Off
icer
- P
unja
b

47
Sl.
Nam
eD
esig
nat
ion
Nat
ure
of
Nat
ure
of
Qu
alif
icat
ion
(s)
Age
Dat
e o
fTo
tal
Gro
ssPr
evio
us e
mp
loym
ent/
No
.Em
plo
ymen
t,d
uti
es o
f(i
n y
ears
)C
omm
ence
men
tex
peri
ence
Rem
un
erat
ion
Des
ign
atio
nw
heth
erth
eof
Em
plo
ymen
t(i
n y
ears
)(i
n R
s.)
con
trac
tual
empl
oyee
or o
ther
wis
e
33
.N
orm
an D
. Pri
ceD
irec
tor
Net
wor
ksC
ontr
actu
alTe
chni
cal
—4
31
9-A
pr-
02
20
45
95
44
23
Nex
tel P
artn
ers,
U.S
./Dir
ecto
r En
gine
erin
g &
Ope
rati
ons
34
.A
tul
Bind
alEx
ecut
ive
Dir
ecto
r -
Perm
anen
tO
pera
tion
sBE
(M
ech)
, MBA
45
26
-Ju
n-0
32
11
44
48
16
5D
HL
Inte
rnat
iona
l/Com
mun
icat
ion
Dir
ecto
rSo
uth
Regi
on A
sia
Paci
fic3
5.
Jaya
nt K
hosl
aD
irec
tor
- W
RPe
rman
ent
Ope
rati
ons
BE (
Hon
), M
BA4
222
-Mar
-04
19
78
24
29
3C
oca
Col
a In
dia/
VP
Ope
rati
ons,
Mum
bai
36
.Sh
anka
r Pra
sad
Chi
ef O
pera
ting
Perm
anen
tO
pera
tion
sBE
, PG
DM
43
28
-Jan
-04
19
37
93
53
8Bh
arti
Mob
ile L
td./V
ice
Pres
iden
t -
CSD
Off
icer
(U
P -
East
)3
7.
Elan
go T
ham
biah
Chi
ef E
xecu
tive
Perm
anen
tO
pera
tion
sBE
(M
ech)
, PG
DBM
40
8-O
ct-0
11
94
63
65
73
Spic
e C
omm
unic
atio
ns/V
ice
Pres
iden
tO
ffic
er -
AP
38
.C
hris
toph
er T
obit
Chi
ef E
xecu
tive
Perm
anen
tO
pera
tion
sBA
41
1-F
eb-9
92
44
63
55
43
Col
lett
es G
roup
of
Com
pani
es/
Off
icer
- D
elhi
Gro
up B
usin
ess
Dev
elop
men
t M
anag
er3
9.
Saga
rika
Rai
Vic
e Pr
esid
ent
- HR
Perm
anen
tH
uman
Res
ourc
eM
.B.A
(HR)
37
5-M
ay-0
31
73
64
35
04
Redi
ffus
ion
DY&
R/G
ener
al M
anag
er -
HR
40
.Sa
ndee
p G
upte
Hea
d -
Tech
nica
lPe
rman
ent
Tech
nica
lM
.B.A
38
25
-Sep
-01
13
34
21
28
5C
onve
rgel
abs/
Tele
com
Con
sult
ant
41
.C
ol. V
. S. R
awat
Sr.V
ice
Pres
iden
tPe
rman
ent
Tech
nica
lBE
(Tel
ecom
), M
E5
77
-Au
g-0
13
85
16
14
08
BPL
Cel
lula
r Lt
d./C
hief
Tec
hnic
al O
ffic
er(E
lect
roni
cs &
Tel
ecom
)4
2.
Am
rita
Gan
gotr
aG
roup
Chi
ef I
TPe
rman
ent
Net
wor
k &
ITB.
Sc.
(Mat
hs),
M.S
c.4
12
5-N
ov-
02
17
43
15
70
1H
CF
Com
net
Ltd.
/Chi
efSo
luti
ons
(Ops
. Re
sear
ch)
Info
rmat
ion
Off
icer
Enga
gem
ent
43
.Bh
aska
r Ch
akra
bort
yC
hief
Sup
ply
Perm
anen
tFi
nanc
e &
PGD
BM,
48
19
-May
-97
26
41
67
59
7Bh
arti
Tel
e-Ve
ntur
es L
td./
Cha
in O
ffic
erC
omm
erci
alD
ip. i
n M
ater
ials
Vic
e Pr
esid
ent -
Mat
ls4
4.
V. V
enka
tesh
Chi
ef O
pera
ting
Perm
anen
tCS
DPG
DM
, ACA
43
4-J
an-0
32
05
66
60
56
Bhar
ti T
ele-
Vent
ures
Ltd
./Vic
e Pr
esid
ent
Off
icer
-Mar
keti
ng/
Sale
s &
CSD
45
.Su
nil C
olas
oV
ice
Pres
iden
tPe
rman
ent
Mar
keti
ngM
BA, B
BM3
91
-Oct
-02
15
28
91
28
6M
ax H
ealt
hcar
e/D
y.G
ener
al M
anag
er -
Mar
keti
ng4
6.
S. K
. Sha
rma
Hea
d - Q
ualit
yPe
rman
ent
Qua
lity
Ass
uran
ceB.
Tec
h5
09-
May
-03
29
38
61
71
3G
E C
apit
al/V
ice
Pres
iden
t -
Qua
lity
47
.P.
S. S
andh
uSr
. Vic
e Pr
esid
ent
Perm
anen
tN
etw
ork
& IT
BE, M
. Tec
h5
57
-Au
g-0
13
13
60
34
26
Bons
ai N
etw
orks
Indi
a Pv
t. L
td./C
ount
ryH
ead
(Indi
an O
pera
tion
s)4
8.
Anu
rag
Pras
har
Chi
ef -
CSD
Perm
anen
tCS
DBE
, PG
DBM
44
16
-Ju
l-0
31
93
72
77
75
XER
OX
Mod
i Cor
p. L
td./E
xecu
tive
Dir
ecto
rC
usto
mer
Ser
vice
Sup
port
49
.Su
nil
Tand
onH
ead
- C
orp
Solu
tion
Perm
anen
tM
arke
ting
B. T
ech,
MBA
44
4-N
ov-
03
19
50
74
79
7Re
lianc
e In
foco
mm
./Hea
d Ke
y N
atio
nal
Acc
ou
nt
50
.V
ivek
Bal
iH
ead
- Br
and
&Pe
rman
ent
Mar
keti
ngBA
, MBA
45
4-N
ov-
03
24
53
94
18
1Br
isto
l Mye
rs S
quib
b, U
SA/
Co
mm
un
icat
ion
Con
sult
ant
Inte
rnat
iona
l Bu
sine
ss5
1.
S. S
ivar
amak
rish
nan
Hea
d - I
N/V
AS
Perm
anen
tN
etw
ork
& IT
BE, M
Sc.
Eng
g,5
31-
Dec
-03
27
30
18
92
5Th
ink
Busi
ness
Net
wor
ks P
vt. L
td./
PGD
BAV
ice
Pres
iden
t5
2.
Anj
an C
houd
hury
Vic
e Pr
esid
ent
- IT
Perm
anen
tN
etw
ork
& IT
B.E.
44
1-A
pr-
04
20
35
80
07
0Bh
arti
Cel
lula
r Lt
d./G
ener
al M
anag
er -
IT5
3.
Am
it S
hank
ar N
andi
Vic
e Pr
esid
ent
-Pe
rman
ent
Mar
keti
ngB.
E., M
BA3
72
2-F
eb-0
51
32
63
85
86
Mar
ico
Indu
stri
es/M
arke
ting
Man
ager
Mar
keti
ng5
4.
Man
deep
Bha
tia
Chi
ef O
pera
ting
Perm
anen
tO
pera
tion
sBE
, MBA
37
4-D
ec-0
11
43
45
10
24
Spic
e Te
leco
m -
VP
(Nep
al)/
Off
icer
- M
ahar
asht
raES
PL -
Ass
ista
nt M
ange
r Sal
es5
5.
Am
ande
ep S
ingh
Vic
e Pr
esid
ent
Perm
anen
tTe
chni
cal
BE (
E&C
E)3
59-
May
-03
15
33
93
31
6Sp
ice
Com
mun
icat
ions
/VP
(Tec
h. &
IT),
Pun
jab
Com
mun
icat
ions
Ltd
. -
Man
ager
56
.G
urin
der
Sing
hC
hief
Ope
rati
ngPe
rman
ent
Ope
rati
ons
MBA
, B.
Tec
h3
91
9-A
ug
-02
17
40
08
04
5St
anda
rd C
hart
ed B
ank/
Mar
keti
ng H
ead
San
dh
uO
ffic
er -
Har
yana
57
.Ra
ndee
p Si
ngh
Chi
ef T
echn
ical
Off
icer
Perm
anen
tTe
chni
cal
B.E.
36
1-A
ug
-01
12
27
65
49
8Sp
ice
Tele
com
, Ass
t. G
ener
al M
anag
er, P
unja
bSe
khon
58
.Ra
ghun
ath
Man
dava
Chi
ef O
pera
ting
Perm
anen
tO
pera
tion
sM
. Tec
h, P
GD
BM3
92
9-S
ep-0
31
53
92
47
37
HLL
/Ope
rati
ons
& M
ktg.
Man
ager
, Ban
galo
reO
ffic
er -
Raj
asth
an5
9.
Sum
athi
Gur
umur
thi
Vic
e Pr
esid
ent
- CSD
Perm
anen
tCS
DBA
, MA
45
1-O
ct-9
62
02
69
70
29
Skyc
ell C
omm
./Gen
eral
Man
ager
- C
usto
mer
Ser
vice
60
.A
tul
Cha
turv
edi
Chi
ef O
pera
ting
Perm
anen
tO
pera
tion
sB.
Tech
, M
BA4
03
0-J
an-0
41
62
56
30
21
NIIT
Lim
ited
/Hea
d - M
arke
ting
Off
icer
- N
ESA
(C
aree
r Ed
ucat
ion)
61
.Ro
hit
Mal
hotr
aC
hief
Ope
rati
ngPe
rman
ent
Ope
rati
ons
PG D
iplo
ma
38
15
-Ap
r-0
41
23
23
30
60
Relia
nce
Info
Com
/Bus
ines
s M
anag
erO
ffic
er -
Wes
t Be
ngal
62
.Su
dipt
o C
how
dhur
yV
ice
Pres
iden
t -
Perm
anen
tD
istr
ibut
ion
Sale
sG
rad
uate
42
16
-Ju
n-0
31
82
66
69
48
Bhar
ti C
ellu
lar
Ltd.
, UP
(Wes
t)/
Sale
s D
istr
ibut
ion
Gen
eral
Man
ager
- Sa
les
63
.T.
K. B
alak
umar
Vic
e Pr
esid
ent
-Pe
rman
ent
CSD
BE4
42
1-M
ay-0
42
12
48
25
16
Dak
sh e
Serv
ices
Pvt
. Ltd
./Dir
ecto
r -C
usto
mer
Ser
vice
sO
pera
tion
s &
Qua
lity
64
.D
eepa
k So
man
Hea
d C
SD -
East
Perm
anen
tCS
DB.
Com
., M
.M.S
.4
51
8-A
ug
-03
21
24
91
89
9H
SBC
/Man
ager
- D
eliv
ery
Cha
nnel
s6
5.
Mic
hael
Eri
c Lo
boH
ead
CSD
- Ko
lkat
aPe
rman
ent
CSD
B.A
. Dip
lom
a in
42
18
-Oct
-02
19
25
79
50
1Ko
shik
a Te
leco
m L
td./A
sstt
. Gen
eral
Man
ager
-C
om
pu
ter
Cus
tom
er C
are
& C
olle
ctio
ns6
6.
Shru
ti K
ant
Pal
Chi
ef H
uman
Res
ourc
ePe
rman
ent
Hum
an R
esou
rce
MA
, PG
DIR
& W
,5
01-
Mar
-04
23
25
27
39
9Th
e W
illia
mso
n M
agor
Gro
up/V
ice
Pres
iden
tO
ffic
er -
Eas
tX
LRI
67
.Ja
yesh
Nad
kar
Hea
d -
Site
Acq
uisi
tion
Perm
anen
tFa
cilit
y M
gmt.
PG D
iplo
ma
41
1-S
ep-0
12
02
66
75
12
Relia
nce
Info
com
Lim
ited
- P
rogr
am M
anag
er6
8.
Jite
ndra
Rah
iV
ice
Pres
iden
tPe
rman
ent
Sale
sM
aste
rs in
Mar
keti
ng4
31
-Sep
-04
15
29
37
46
2Ju
mbo
Ele
ctro
nics
Pvt
. Ltd
./M
gmt.
- M
umba
iH
ead
- Re
tail
Ope
rati
ons
Uni
vers
ity
69
.M
anoj
Daw
ane
Vic
e Pr
esid
ent
Perm
anen
tM
arke
ting
BE, M
BA3
73
0-A
pr-
04
18
26
58
92
9N
etde
cisi
ons
Pvt.
Indi
a Lt
d. -
Dir
ecto
r

48
Sl.
Nam
eD
esig
nat
ion
Nat
ure
of
Nat
ure
of
Qu
alif
icat
ion
(s)
Age
Dat
e o
fTo
tal
Gro
ssPr
evio
us e
mp
loym
ent/
No
.Em
plo
ymen
t,d
uti
es o
f(i
n y
ears
)C
omm
ence
men
tex
peri
ence
Rem
un
erat
ion
Des
ign
atio
nw
heth
erth
eof
Em
plo
ymen
t(i
n y
ears
)(i
n R
s.)
con
trac
tual
empl
oyee
or o
ther
wis
e
70
.So
njoy
Moh
anty
Chie
f of
Acq
uisi
tion
and
Perm
anen
tM
arke
ting
BA (
Eco.
Hon
s)4
21
9-A
pr-
04
21
53
97
23
8Es
cote
l Mob
ile C
omm
unic
atio
ns/C
hief
Off
icer
-Re
lati
onsh
ip C
ente
rsM
A (E
co H
ons)
,C
usto
mer
Acq
uist
ion
and
Rete
ntio
nPG
Dip
. in
Mgm
t.7
1.
Sam
Ela
ngal
loor
Chi
ef O
pera
ting
Perm
anen
tO
pera
tion
sM
BA (
Mkt
g.)
42
2-F
eb-0
41
62
58
60
48
ZEE
Tele
film
s/V
ice
Pres
iden
t - S
ales
&O
ffic
er -
Sale
s/M
arke
ting
Mar
keti
ng &
CSD
72
.Ku
ljit
Sing
hG
ener
al M
anag
erPe
rman
ent
Mar
keti
ngPG
DIM
, BA
43
1-S
ep-0
31
92
52
73
16
Spri
nt R
PG/N
atio
nal C
hann
el M
anag
er7
3.
Sugu
mar
an J
.C
hief
Tec
hnic
al O
ffic
erPe
rman
ent
Tech
nica
lBE
(El
ectr
onic
s)5
02
4-J
ul-
00
26
32
65
73
4BP
L M
obile
Com
mun
icat
ions
/Hea
d N
/WPe
rfor
man
ce7
4.
Ani
l K. M
alho
tra
Gen
eral
Man
ager
Perm
anen
tTe
chni
cal
Dip
lom
a in
56
11
-May
-95
31
24
44
32
4G
atew
ay D
igit
al S
wit
ch -
VSN
L/D
eput
yTe
leco
mm
unic
atio
nEn
gine
erEn
gin
eeri
ng7
5.
Jagd
ish
Rand
haw
aV
ice
Pres
iden
t - C
SDPe
rman
ent
CSD
M.S
c.5
52
6-F
eb-0
43
32
59
18
03
Spic
e C
omm
unic
atio
ns/V
ice
Pres
iden
t7
6.
N. F
. Aib
ara
Hea
d - M
kt. S
ales
&Pe
rman
ent
Mar
keti
ngBA
, PG
DM
M, M
BA5
08
-Ap
r-0
42
93
73
33
27
Esco
tel M
obile
Com
mun
icat
ion
Ltd.
/C
hann
el D
evel
opm
ent
Dy.
Gen
eral
Man
ager
77
.A
shok
Sha
rma
Vic
e Pr
esid
ent
Perm
anen
tTe
chni
cal
BE, P
GD
IP &
IM, M
.Sc.
58
1-S
ep-0
43
42
71
03
49
Spic
e C
omm
unic
atio
ns/V
ice
Pres
iden
t7
8.
Anu
p V
ikal
Vic
e Pr
esid
ent
Perm
anen
tFi
nanc
eM
BA, B
E (M
echa
nica
l)3
71
1-O
ct-0
11
32
40
14
46
Tata
Hom
e Fi
nanc
e/G
ener
al M
anag
er7
9.
Mri
nal
Roy
Chi
ef E
xecu
tive
Perm
anen
tO
pera
tion
sBE
., PG
DBM
42
14
-Oct
-02
18
27
58
28
6A
BC C
onsu
ltan
t Pv
t. L
td./H
ead
- N
orth
Off
icer
(W
est
Beng
al)
80
.Ra
jiv K
. Sha
rma
Chi
ef E
xecu
tive
Perm
anen
tO
pera
tion
sM
A, L
LB, M
BA4
82
9-D
ec-0
02
55
77
56
02
GM
S Te
chno
logi
es/C
hief
Exe
cuti
ve O
ffic
erO
ffic
er -
NC
R8
1.
K. K
rish
nan
Join
t Pr
esid
ent-
Broa
dPe
rman
ent
Gen
eral
Mgm
t.B.
Com
., IC
WA
, CA
51
26
-Jan
-01
27
97
91
97
7Sa
rega
ma
(I) L
td./M
anag
ing
Dir
ecto
ran
d Te
leco
me
serv
ices
82
.Pr
em P
rade
epC
hief
Ope
rati
ng O
ffic
er -
Perm
anen
tO
pera
tion
sB.
Tech
, MBA
50
15
-Oct
-01
25
61
09
32
3Sa
rega
ma
(I) L
td./H
ead
E-Bu
sine
ssSo
uth
Cen
tral
83
.Ro
htas
h M
alC
hief
Exe
cuti
vePe
rman
ent
Ope
rati
ons
B.Te
ch, P
GD
M5
11
3-N
ov-
00
30
84
12
43
4M
arut
i Udy
og L
td./C
hief
Gen
eral
Off
icer
- N
orth
Man
ager
- M
ktg.
& S
ales
84
.N
. A
rjun
Exec
utiv
e D
irec
tor
-Pe
rman
ent
Ope
rati
ons
B. C
om, M
BA4
81
-Oct
-00
26
10
39
95
61
Bhar
ti Te
le-V
entu
res L
td./C
hief
Ope
ratin
g O
ffic
erEn
terp
rice
s Se
rvic
es(C
arri
ers)
85
.Ja
gbir
Sin
ghC
hief
Tec
hnic
alPe
rman
ent
Tech
nica
lM
. Phi
l, M
.Tec
h,4
19
-No
v-0
11
97
57
25
57
Nor
tel N
etw
orks
, Sin
gapo
re/
Off
icer
- M
obili
tyM
.Sc.
, MBA
Dir
ecto
r -
Net
wor
k Sy
stem
s &
Sol
utio
ns8
6.
Shan
tanu
Ban
erje
eH
ead
HR
Enga
gem
ent
Perm
anen
tH
uman
Res
ourc
eIC
WA
I, M
BA4
830
-Mar
-04
24
56
94
32
3In
do R
ama
Synt
heti
cs (
I) Lt
d./
Sr.
Vic
e Pr
esid
ent
- Cor
p. H
R8
7.
Am
it S
hukl
aV
ice
Pres
iden
tPe
rman
ent
Mar
keti
ngB.
Tech
, PG
DM
41
23
-Ju
n-0
11
73
39
46
11
G.M
.PEN
S/V
ice
Pres
iden
t - S
ales
& M
arke
ting
88
.Sh
amik
Das
Chi
ef O
pera
ting
Perm
anen
tO
pera
tion
sB.
Com
. (H
ons)
, FC
A4
31
-Ju
n-0
12
25
66
20
26
Bhar
ti M
obile
Ltd
./Chi
ef F
inan
cial
Off
icer
Off
icer
- S
outh
89
.A
lok
Kum
arV
ice
Pres
iden
tPe
rman
ent
CRM
B. T
ech
48
6-J
ul-
01
27
39
21
34
7Es
cote
l Ltd
./Chi
ef G
ener
al M
anag
er9
0.
Mri
nalin
i G
upta
Vic
e Pr
esid
ent
Perm
anen
tM
arke
ting
BA (
Eco)
,4
31
2-N
ov-
03
21
40
61
74
9Th
e H
indu
stan
Tim
es/V
ice
Pres
iden
t -
MBA
(M
ktg.
)M
arke
ting
91
.T.
K. A
nand
Kum
arC
hief
- T
echn
ical
Perm
anen
tTe
chni
cal
B.Te
ch5
11
5-N
ov-
02
26
32
69
00
5In
terw
ave
Com
mun
icat
ions
/Pro
ject
Dir
ecto
r9
2.
Rahu
l Meh
taC
hief
Ope
rati
ngPe
rman
ent
Ope
rati
ons
BA4
51
-Ju
n-9
82
34
31
77
57
RPG
Ric
ho L
td./C
ontr
olle
r Bu
sine
ssO
ffic
er -
B &
TS
Nor
thO
pera
tion
s -
Sout
h9
3.
Pras
anta
Das
Chi
ef -
Cus
tom
erPe
rman
ent
Cust
omer
Ser
vice
BE E
lec.
&4
21
9-A
ug
-02
21
32
20
64
0H
FCL/
Ass
ocia
te V
ice
Pres
iden
tSh
arm
aSe
rvic
e &
Net
wor
k&
Net
wor
kTe
leco
mO
pera
tion
s -
Nor
thO
pera
tion
s9
4.
Ram
amur
thy
Kollu
riC
hief
Tec
hnic
alPe
rman
ent
Tech
nica
lB.
Tec
h, M
.Tec
h5
13
-No
v-0
02
64
26
44
83
Siem
ens
Publ
ic C
omm
unic
atio
n N
etw
orks
Ltd
./O
ffic
er -
LD
SV
ice
Pres
iden
t -
Info
rmat
ion
& B
road
band
95
.N
. G
ambh
irH
ead
- Net
wor
kPe
rman
ent
Ope
rati
ons
BE E
lec.
& T
elec
om5
73
0-A
pr-
01
37
30
30
16
2V
SNL/
Gen
eral
Man
ange
rO
pera
tion
s9
6.
Cha
ndan
Gho
shV
ice
Pres
iden
t -
Perm
anen
tC
omm
erci
alD
iplo
ma
in4
71-
Mar
-02
25
49
25
48
1Br
itis
h Te
leco
m./D
irec
tor
ICS
Sout
h A
sia
Com
mer
cial
(IL
D)
Elec
tric
al E
ngg
97
.Su
kant
o A
ich
Vic
e Pr
esid
ent -
AES
Perm
anen
tSa
les
BE, M
BA3
79
-Ju
l-0
11
32
85
45
25
Ecos
oft
Tech
nolo
gies
Ltd
./Hea
d Sa
les
98
.A
run
Bhar
dwaj
Sr. V
ice
Pres
iden
tPe
rman
ent
Sale
sBE
, MBA
42
1-F
eb-0
22
13
86
63
60
Eric
sson
inc.
/Dir
ecto
r9
9.
Mila
n Ra
oV
ice
Pres
iden
t - A
ESPe
rman
ent
Sale
sBE
, MBA
35
1-A
pr-
03
12
32
08
63
7JM
Mor
gan
Stan
ley/
Hea
d Sa
les
10
0.
Vip
in A
garw
alV
ice
Pres
iden
t - A
ESPe
rman
ent
Spl.
Pro.
- Fi
nanc
eC.
A.
41
13
-Ju
l-0
31
82
58
16
74
Eich
er M
otor
s Lt
d./H
ead
Sale
s1
01
.M
. S. R
avic
hand
ran
Vic
e Pr
esid
ent
- BB
&Pe
rman
ent
Tech
nica
lBE
(H
ons)
,5
69
-Ap
r-0
13
24
90
58
30
RPG
Cel
lula
r/V
ice
Pres
iden
t -
Tech
. & O
ps.
TS (
Sout
h)M
.Tec
h -
Com
m1
02
.Sa
njay
Bah
lCh
ief C
SD -
B &
TS
Nor
thPe
rman
ent
Know
led
geBE
. (El
ect.
),4
21
-Ap
r-9
62
33
67
67
39
Cas
io B
hart
i/Gen
eral
Man
ager
- M
arke
ting
Mgm
t &
Qua
lity
MBA
(M
ktg.
)1
03
.A
nuj
Khun
gar
Chi
ef -
B &
TS
(NC
R)Pe
rman
ent
Tech
nica
lBE
, M.T
ech
41
28
-Feb
-05
18
27
84
68
4Re
lianc
e In
foco
m/C
hief
Tec
hnic
al O
ffic
er1
04
.P.
V. V
. Sri
niva
sa R
aoC
hief
Sal
es &
Perm
anen
tSa
les
&B.
Tech
., PG
DBM
36
17
-Jan
-05
11
26
51
01
2H
ero
Mot
ors/
Chi
ef O
pera
ting
Off
icer
Mar
keti
ngM
arke
ting
10
5.
A.M
. Rai
Vic
e Pr
esid
ent
-Pe
rman
ent
Net
wor
kEn
gine
erin
g,4
02
8-D
ec-0
02
32
85
40
86
Fib
com
Net
wor
k Pl
anni
ngPl
anni
ngRE
C W
aran
gal
10
6.
Rajiv
Meh
rotr
aV
ice
Pres
iden
tPe
rman
ent
Ope
rati
ons
B.Sc
., M
BA3
91
2-J
an-0
01
72
74
83
82
Kosh
ika
Tele
com
Ltd
./Dy.
Gen
eral
Man
ager

49
Sl.
Nam
eD
esig
nat
ion
Nat
ure
of
Nat
ure
of
Qu
alif
icat
ion
(s)
Age
Dat
e o
fTo
tal
Gro
ssPr
evio
us e
mp
loym
ent/
No
.Em
plo
ymen
t,d
uti
es o
f(i
n y
ears
)C
omm
ence
men
tex
peri
ence
Rem
un
erat
ion
Des
ign
atio
nw
heth
erth
eof
Em
plo
ymen
t(i
n y
ears
)(i
n R
s.)
con
trac
tual
empl
oyee
or o
ther
wis
e
10
7.
Nav
aidu
l Isl
am K
han
Chi
ef E
xecu
tive
Perm
anen
tO
pera
tion
sBE
56
27-M
ar-0
03
15
29
63
37
Bhar
ti H
exac
om L
imit
ed/C
EOO
ffic
er -
UP
Wes
t1
08
.Sh
anka
r Hal
der
Chi
ef T
echn
ical
Off
icer
Perm
anen
tTe
chni
cal
BE4
81
9-A
pr-
04
22
54
50
38
1Es
cote
l Ltd
./Chi
ef T
echn
ical
Off
icer
10
9.
Ram
gopa
l Val
lath
Chi
ef O
pera
ting
Perm
anen
tO
pera
tion
sB.
Tech
(El
ect.
&3
81
9-N
ov-
01
13
28
61
27
63C
om In
dia
Pvt.
Ltd
./Cou
ntry
Sal
es M
anag
erO
ffic
er -
Ker
ala
Tele
com
m.)
, PG
Dip
.in
Bus
ines
s M
gmt.
11
0.
Rand
eep
Nar
ang
Chi
ef O
pera
ting
Perm
anen
tO
pera
tion
sB.
Com
, PG
DBM
44
3-J
an-0
52
02
80
35
85
Iqua
ra/C
hief
Ope
rati
ng O
ffic
erO
ffic
er -
Wes
t1
11
.V
ivek
Y. V
yava
hark
arC
hief
Tec
hnic
alPe
rman
ent
Tech
nica
lBE
54
1-O
ct-0
13
34
06
36
61
BPL
Mob
ile C
ellu
lar
Lim
ited
/Hea
d Te
chni
cal
Off
icer
- M
ahar
asht
ra &
Mum
bai
11
2.
Dee
pak
Sriv
asta
vaC
hief
Ope
rati
ngPe
rman
ent
Ope
rati
ons
Bach
elor
of
46
13
-Sep
-04
22
44
83
08
7BO
C E
dwar
ds/G
M -
Sout
h A
sia
&O
ffic
er -
Bih
arTe
chn
olo
gy
Cou
ntry
Man
ager
, In
dia
(Che
mic
al E
ngg.
)1
13
.A
jai P
uri
Chi
ef O
pera
ting
Perm
anen
tO
pera
tion
sM
aste
r of C
omm
erce
,4
51
5-M
ay-0
42
43
64
11
34
Carg
ill F
oods
Indi
a/Bu
sine
ss H
ead
- Ind
ia F
oods
Off
icer
- K
olka
taFu
lbri
ght
Fello
wsh
ipfo
r Le
ader
ship
inM
gmt.
11
4.
Rupa
k A
garw
alC
hief
Sal
es O
ffic
erPe
rman
ent
Sale
sBE
(Ele
c.),
PG
DBM
39
.31
-Sep
-04
18
29
45
61
1H
T M
edia
Ltd
./GM
- St
rate
gic
Mar
keti
ng(M
ark.
& F
in.)
11
5.
Har
ish
K. G
andh
iSr
. Vic
e Pr
esid
ent -
Perm
anen
tH
uman
Res
ourc
eM
BA, L
LB4
91
-No
v-0
22
64
67
16
10
Bhar
ti T
ele-
Vent
ures
Ltd
./H
uman
Res
ourc
eBT
NL
(Cor
pora
te O
ffic
e),
Vic
e Pr
esid
ent
- H
R1
16
.Ra
jan
Dut
taC
hief
Hum
anPe
rman
ent
Hum
an R
esou
rce
Mas
ter i
n PM
& IR
,4
34
-Jan
-05
22
50
32
80
2ID
EA C
ellu
lar
Ltd.
/Chi
ef o
f H
R &
TQ
MRe
sour
ces
Off
icer
Dip
. in
Trai
ning
11
7.
Raja
n Sw
aroo
pD
irec
tor
- Eas
tPe
rman
ent
Ope
rati
ons
PGD
M (M
BA),
49
15
-No
v-0
42
46
86
52
41
Esco
tel M
obile
Com
unic
atio
ns L
td./
Regi
onal
Hub
Mec
h. E
ngin
eer
CEO
and
Exe
cuti
ve D
irec
tor
11
8.
Dr.
Jai M
enon
Cor
p D
irec
tor
- IT
and
Con
trac
tual
IT &
Tec
hnol
ogy
Doc
tora
te &
42
22
-Au
g-0
21
91
01
36
28
2Be
ll So
uth
Cor
p. A
tlan
ta/
Inn
ova
tio
nM
aste
rs, B
.Tec
h.C
orpo
rate
Off
icer
and
Exe
cuti
ve V
ice
Pres
iden
t1
19
.N
. V. S
ubba
Rao
Chi
ef O
pera
ting
Perm
anen
tO
pera
tion
sM
.Tec
h./P
GPI
M4
61
6-J
un
-03
29
30
09
64
4Ta
ta T
eles
ervi
ces
Ltd.
/Gen
eral
Man
ager
Off
ice
- Mkt
g./S
ales
& C
SD
(B)
EMPL
OYE
D F
OR
PA
RT
OF
THE
FIN
AN
CIA
L YE
AR
1.Ja
gdis
h Ki
niC
hief
Exe
cuti
vePe
rman
ent
Ope
rati
ons
B.Sc
., M
BA5
01
5-S
ep-0
02
61
28
06
20
6G
illet
te In
dia/
Man
agin
g D
irec
tor
Off
icer
& D
irec
tor
Mob
ility
- S
outh
Cen
tral
Reg
ion
&W
est
(Mah
.)2.
Jagd
eep
Khan
dpur
Cor
pora
te D
irec
tor
-Pe
rman
ent
Hum
an R
esou
rce
MBA
(H
R)4
61
6-A
ug
-00
26
17
99
15
86
Balla
rpur
Ind
ustr
ies
Ltd.
/Gro
up V
P (H
R)H
uman
Res
ourc
es3.
Arv
ind
Meh
raC
hief
Ope
rati
ngPe
rman
ent
Ope
rati
ons
B.C
om, F
CA
, FC
S4
21
7-D
ec-0
12
33
68
64
82
Calte
x Lu
bric
ants
Indi
a Lt
d./C
FO &
Co.
Sec
reta
ryO
ffic
er (
UP
- W
est)
4.M
adhu
r Ta
neja
Chi
ef O
pera
ting
Perm
anen
tO
pera
tion
sB.
Sc.,
MBA
36
3-J
an-0
31
42
01
23
26
Peps
ico
Inc.
/Mkt
g D
evel
opm
ent M
gr -
FRIT
OLA
YO
ffic
er -
MP
&C
hatt
isga
rh5.
Atu
l Jos
hiC
hief
Ope
rati
ngPe
rman
ent
Ope
rati
ons
MA
, MBA
42
26
-Ju
n-0
31
93
94
77
23
Max
New
Yor
k Li
fe In
sura
nce
Com
pany
/O
ffic
er -
Guj
arat
Dir
ecto
r Su
pple
men
tary
Dis
trib
utio
n6.
Sudh
ir A
garw
alC
hief
Ope
rati
ng O
ffic
erPe
rman
ent
Ope
rati
ons
MBA
41
18
-Feb
-05
15
13
30
25
3M
odi
Cor
p.Lt
d/D
irec
tor
7.D
eepa
k G
ulat
iC
hief
Exe
cuti
vePe
rman
ent
Ope
rati
ons
B.Sc
, MBA
45
15
-Ju
n-9
82
46
85
44
38
Bhar
ti C
ellu
lar
Ltd.
/Chi
ef E
xecu
tive
,O
ffic
er (
East
ern
Regi
on)
Spec
ial P
roje
ct8.
Nee
ran
Chh
iber
Chi
ef B
usin
ess
Perm
anen
tBu
sine
ssM
MS
46
15
-Ju
l-0
52
02
60
83
74
Tele
com
Sey
chel
les
Ltd.
/Chi
ef E
xecu
tive
Off
icer
Dev
elop
men
tD
evel
opm
ent
9.D
aljit
Sin
ghC
orpo
rate
Dir
ecto
r -
Con
trac
tual
Hum
an R
esou
rce
M.S
c., L
LB, M
BA5
52
5-J
ul-
05
31
71
80
97
0A
mer
ican
Exp
ress
/Vic
e Pr
esid
ent
- HR
Hum
an R
esou
rces
10
.V
ivek
Mah
endr
uV
ice
Pres
iden
t -
Gro
upPe
rman
ent
IT &
Tec
hnol
ogy
B.Sc
., M
BA, D
ip.
40
2-N
ov-
05
20
15
64
12
8ID
EA C
ellu
lar L
td./H
ead
- IT
IT T
rans
form
atio
nin
Sta
tist
ics,
Adv
ance
Syst
emD
ip. i
n C
ompu
ter
Ap
plic
atio
n1
1.
Moh
it B
hatn
agar
Hea
d -
NPD
& In
nova
tion
Perm
anen
tM
arke
ting
MBA
, MS
36
18
-Jan
-02
15
31
96
74
1Br
ight
pond
Inc
/Co-
foun
der
& C
hief
Ope
rati
ng o
ffic
er1
2.
Prat
ik P
ota
Hea
d -
Acq
isit
ion
Perm
anen
tM
arke
ting
BE, P
GD
M3
7.4
81-
Dec
-01
14
36
15
05
0H
LL/M
anag
er -
Mar
keti
ng1
3.
S. C
. Agr
awal
Vic
e Pr
esid
ent
Perm
anen
tFi
nanc
e &
Dip
lom
a in
Mec
h.5
3.6
91
2-A
pr-
88
33
28
09
80
7Bh
arti
Tel
ecom
Ltd
./Gen
eral
Man
ager
-C
omm
erci
alEn
gg.,
Gra
duat
e D
ip.
Cor
pora
te M
atri
als
Cou
rse
in M
ater
ials
Man
agem
ent
14
.Bh
uva
nes
hC
hief
Ope
rati
ngPe
rman
ent
Ope
rati
ons
Bach
elor
of
45
15
-Ju
l-0
52
42
97
48
28
BPL
Mob
ile C
ellu
lar
Ltd.
/CO
O -
Wes
tPr
atap
Sin
ghO
ffic
e -
Guj
arat
Com
mer
ce1
5.
Ans
hul
Gau
baH
ead
- Ret
ail S
ales
Perm
anen
tSa
les
BE, M
BA3
36-
Mar
-06
12
13
70
22
BPL
Mob
ile C
ellu
lar
Ltd.
/Hea
d Pr
epai
dBu
sine
ss -
Mah
aras
tra
& G
oa

50
Sl.
Nam
eD
esig
nat
ion
Nat
ure
of
Nat
ure
of
Qu
alif
icat
ion
(s)
Age
Dat
e o
fTo
tal
Gro
ssPr
evio
us e
mp
loym
ent/
No
.Em
plo
ymen
t,d
uti
es o
f(i
n y
ears
)C
omm
ence
men
tex
peri
ence
Rem
un
erat
ion
Des
ign
atio
nw
heth
erth
eof
Em
plo
ymen
t(i
n y
ears
)(i
n R
s.)
con
trac
tual
empl
oyee
or o
ther
wis
e
16
.Sh
ashi
Aro
raSr
. Vic
e Pr
esid
ent -
Perm
anen
tSa
les
&BE
, MBA
41
1-F
eb-0
61
51
69
14
50
Kota
k M
ahin
dra/
Gro
up H
ead
- M
arke
ting
Sale
s &
Mar
keti
ngM
arke
ting
17
.A
nant
Aro
raV
ice
Pres
iden
t -
Perm
anen
tSa
les
MBA
39
9-A
pr-
03
16
26
10
31
1Re
lianc
e In
foco
m/H
ead
- Sa
les
Ope
rati
ons
Sale
s - K
olka
ta1
8.
Um
esh
A D
urve
Hea
d - P
ost P
aid
Sale
sPe
rman
ent
Sale
s an
dPG
Dip
lom
a4
05
-Jan
-06
16
71
91
90
BPL
Cel
lula
r Lt
d./R
egio
nal B
usin
ess
Hea
dM
arke
ting
19
.Sh
anke
r N
aray
anC
hief
Fin
anci
al O
ffic
erPe
rman
ent
Fina
nce
CA3
91
6-A
pr-
04
16
32
46
82
1H
utch
inso
n Es
sar
Ltd.
/Vic
e Pr
esid
ent
20
.V
isha
l Seh
gal
Vic
e Pr
esid
ent
Perm
anen
tM
ange
rial/
MBA
(Mkt
. & F
inan
ce),
38
15
-Ju
l-0
51
42
67
46
43
Relia
nce
Info
com
/Hea
d -
Clu
ster
Sal
es &
Sup
ervi
sory
B.Te
ch (
Mec
h)O
pera
tions
& B
usin
ess
Hea
d Po
st P
aid
Busi
ness
21
.A
niru
ddha
Bas
uG
ener
al M
anag
erPe
rman
ent
Tech
nica
lB.
Tech
(Ra
dio
39
23
-No
v-0
51
11
10
23
95
Idea
Cel
lula
r Lt
d./G
ener
al M
anag
erPh
ysic
s &
Ele
ctro
nics
)2
2.
Fais
al S
iddq
uiG
ener
al M
anag
erPe
rman
ent
Man
geria
l/M
BA, M
S, B
S3
85-
Dec
-05
13
84
64
41
Nex
tel C
omm
unic
atio
ns/S
r. M
anag
er -
Sup
ervi
sory
Prod
uct
Stra
tegy
23
.N
ilanj
an M
ukhe
rjee
Seni
or V
ice
Pres
iden
tPe
rman
ent
Sale
s & M
arke
ting
Gra
du
atio
n4
13
0-J
an-0
61
71
57
79
02
Idea
Cel
lula
r Lt
d./V
ice
Pres
iden
t2
4.
K. B
. Ra
jend
ran
Vic
e Pr
esid
ent
Perm
anen
tSa
les
BE, M
BA4
0.6
8-O
ct-0
11
72
42
11
76
Broa
dban
d So
luti
ons
Pvt.
Ltd
.Se
nior
Man
ager
- B
usin
ess
Dev
elop
men
t2
5.
Rajiv
Koh
liC
hief
Exe
cuti
vePe
rman
ent
Ope
rati
ons
B.Te
ch, P
GD
M4
51
-Ju
n-0
01
95
53
51
25
Kosh
ika
Tele
com
Ltd
./GM
Mar
keti
ngO
ffic
er -
Acc
ess
Busi
ness
Nor
th2
6.
Moh
an G
opin
ath
Chi
ef E
xecu
tive
Perm
anen
tO
pera
tion
sB.
Com
. (H
ons.
),5
21
-Sep
-05
24
44
85
66
4N
ET-iT
ech
Asi
a Pa
cific
Pte
Ltd
./M
enon
Off
icer
& D
irec
tor
-D
ip. i
n M
arke
ting
,C
hief
Exe
cuti
ve O
ffic
erEn
terp
rise
Ser
vice
sLL
B(C
orp
orat
es)
27
.A
ksha
y Ku
mar
Chi
ef M
arke
ting
Perm
anen
tM
arke
ting
B.Te
ch (
Hon
s),
45
26
-Dec
-05
22
31
16
12
4D
BS B
ank
Ltd.
/Vic
e Pr
esid
ent
Off
icer
- B
& T
SPG
DM
28
.N
ilanj
an R
oyC
hief
Con
trol
ler
Perm
anen
tFi
nanc
e &
B.C
om (
Hon
s),
38
1-M
ar-0
61
64
48
57
6U
nile
ver
- U
SA/F
inan
ce D
irec
tor
Acc
ou
nts
A.C
.A2
9.
Sanj
ay K
apoo
rJo
int
Pres
iden
t-Pe
rman
ent
Gen
eral
B.C
om (
Hon
s),
44
1-M
ar-0
62
37
84
00
0Te
le T
ech
Serv
ices
Indi
a Lt
d./P
resi
dent
& C
EOM
obili
ty B
usin
ess
Man
agem
ent
MBA
30
.A
rvin
d M
athu
rV
ice
Pres
iden
tPe
rman
ent
Tech
nica
lB.
Sc, M
.Sc
42
7-N
ov-
05
16
20
21
08
2Si
fy L
td./G
ener
al M
anag
er(E
lect
rica
lC
om
mu
nic
atio
nEn
gin
eeri
ng
)3
1.
N. S
hekh
arV
ice
Pres
iden
tPe
rman
ent
Fina
nce
CA, M
BA4
02
0-J
an-0
61
71
00
05
71
Coc
a-C
ola
Indi
a In
c./G
ener
al M
anag
er -
Fina
nce
32
.Su
nil D
wiv
edi
Vic
e Pr
esid
ent
Perm
anen
tM
arke
ting
BE, M
BA3
81-
Mar
-06
17
25
61
48
Relia
nce
Info
com
m./I
nter
natio
nal C
allin
g Ca
rds
33
.So
umit
ra K
. Gha
tak
Vic
e Pr
esid
ent
Perm
anen
tSa
les
and
BA (E
CO
), P
GD
M5
016
-Mar
-06
25
15
20
60
LML
Ltd.
/Sr.
Vic
e Pr
esid
ent
Mar
keti
ng3
4.
Sudh
ir C
hopr
aV
ice
Pres
iden
tPe
rman
ent
Tech
nica
lBE
(H
ons)
42
27
-Jan
-06
20
10
10
02
6A
lcat
el/H
ead
- Pro
ject
s3
5.
Kant
ak S
haile
shV
ice
Pres
iden
tPe
rman
ent
Mar
keti
ngBE
, MM
S3
91
2-J
an-0
61
51
06
11
33
BPL
MO
BILE
/Chi
ef O
pera
ting
Off
icer
Ana
nt3
6.
S. R
amas
wam
ySr
.Vic
e Pr
esid
ent
Perm
anen
tCS
DBA
41
5-J
an-0
62
01
42
54
14
IDEA
Cel
lula
r/V
iice
Pres
iden
t3
7.
Shan
kho
Chow
dhur
yV
ice
Pres
iden
tPe
rman
ent
Ope
rati
ons
BA (
Engl
ish
45
11
-Jan
-06
20
58
56
60
Ow
ned
Med
ia S
olut
ion
& M
arke
ting
Com
pany
Lite
ratu
re)
Not
es:
1.G
ross
rem
uner
atio
n co
mpr
ises
of
Sala
ry, A
llow
ance
s, C
ompa
ny’s
con
trib
utio
n to
Pro
vide
nt F
und
and
taxa
ble
valu
e of
per
quis
ites
.
2.Th
e em
ploy
ee w
ould
qua
lify
for
bein
g in
clud
ed in
Cat
egor
y (A
) or
(B)
on
the
follo
win
g ba
sis:
For
(A)
if th
e ag
greg
ate
rem
uner
atio
n dr
awn
by h
im d
urin
g th
e ye
ar w
as n
ot le
ss t
han
Rs. 2
4,00
,000
p.a
.
For
(B)
if th
e ag
greg
ate
rem
uner
atio
n dr
awn
by h
im d
urin
g th
e pa
rt o
f th
e ye
ar w
as n
ot le
ss t
han
Rs. 2
,00,
000
p.m
.
3.N
one
of t
he e
mpl
oyee
s m
enti
oned
abo
ve is
a r
elat
ive
of a
ny D
irec
tor
of t
he C
ompa
ny e
xcep
t M
r. Su
nil B
hart
i Mit
tal,
Mr.
Rake
sh B
hart
i Mit
tal a
nd M
r. Ra
jan
Bhar
ti M
itta
l, w
ho a
re b
roth
ers
and
Dir
ecto
rs o
n th
e Bo
ard
of t
he C
ompa
ny.
4.N
one
of t
he e
mpl
oyee
s m
enti
oned
abo
ve h
olds
2%
or
mor
e sh
are
capi
tal o
f th
e C
ompa
ny.
5.Th
e de
sign
atio
n - ‘
Dir
ecto
r’ w
here
ver p
refix
ed d
escr
ibe
the
area
of r
espo
nsib
ility
occ
urri
ng in
the
abov
e st
atem
ent a
nd is
not
a B
oard
pos
itio
n ex
cept
that
of M
r. A
khil
Gup
ta, M
r. Su
nil B
hart
i Mit
tal a
nd M
r. Ra
jan
Bhar
tiM
ittal
.

Management Discussion & Analysis
1. INDUSTRY STRUCTURE AND DEVELOPMENTS
1.1. Indian telecom Industry
Driven by rising income levels and favourable demographics,India is poised to at least double its GDP in nominal termsfrom current levels by FY 2010, as stated in one of the recentreports released by Merrill Lynch. This era of rapid economicgrowth has been accompanied by exponential growth inthe telecom sector, particularly on the wireless side. Indiahas reached a wireless penetration of 8.3% in FY 2006, andits mobile base has increased at a compounded annualgrowth rate of 85% over the last seven years. With increasingnetwork coverage and affordability this growth is expectedto continue in the medium term.
With about 20.93 million mobile and broadband & telephonecustomers on March 31, 2006, the Company is the largest
private integrated telecom player in India. It has investedapproximately Rs. 215 billion in the telecom sector and hadannual revenue of Rs. 117 billion in the year under review.The Company has a market capitalisation of over Rs. 760billion and is among the top 10 listed entities in India.
1.2. Recent developments
The telecom industry is one of the most dynamicindustries in the country today and is characterised by aconstantly evolving regulatory environment. The relativeimportance of regulatory changes should be viewed inlight of the big challenges and opportunities that theindustry is facing today (as detailed in Section 2 of thisreport). On balance, the direction and pace of regulatorychanges is positive for the industry and augurs well forthe Company.
The following table captures few of the key regulatory changes that were implemented by the DoT/ TRAI in 2005-06.
Regulatory Brief CommentDevelopment
Alteration of Interconnection Changes effective from March 1, 2006Usage Charge (IUC) Regime On domestic calls, per minute ADC is replaced by a “revenue share ADC” wherein
operators will pay 1.5% of their non-rural AGR to BSNLADC on International call has been reducedDownward revision of tariffs.
Increase in Foreign Direct On November 3, 2005, the Government of India announced enhancement ofInvestment (FDI) limit from FDI ceiling from 49% to 74% in the telecom sector, subject to certain preconditions.49% to 74%
Revised Terms and On November 11, 2005, the central government announced revised terms forConditions of Licenses NLD, ILD, ISPs, IPVPN and VSATs with a decrease in license fee for NLD/ILD licenses
from 15% of AGR to 6% of AGRRevised norms provide considerable ease of entry to new operators with the loweringof entry barriers through reduced license fee and roll out obligations. The one timeentry fee has been reduced to Rs. 250 million from Rs. 1,000 million.
Regulation on Code of Effective March 21, 2006Practice for Metering and The regulation prescribes various measures to ensure that the customer gets completeBilling Accuracy information relating to his tariff plan and charges for value-added services.
Regulation on Quality of Effective July 01, 2005.Service (QoS) parametersof basic and cellular services
Amendment to Reporting Effective March 27, 2006System on Accounting Restriction of applicability to only those service providers whose minimum turnoverSeparation Regulation in the preceding financial year is Rs. 250 million.
51

Regulatory Brief CommentDevelopment
Amendments to Telecom Corporate plans (for data) need not be disclosed to TRAITariff Order 1999 All operators need to issue a periodic certificate of compliance with principles of
non-discrimination and non-predationLifetime plans applicable only for the remaining life of the license. Operators need todisclose the date of expiry of existing license to subscribers of the lifetime plan(s).No change in tariff would be permitted during the life of the plan.
The following table captures the salient draft regulations, directives and recommendations relating to various regulatorymatters.
Regulatory Brief CommentDevelopment
Draft Regulation on Covers the commercial and technical arrangements on how operators should connectIntelligent Network (IN) their equipment, networks and services to enable customers to have access to the INServices services of all operators.
TRAI’s Recommendations The existing ceiling on spectrum charges should be reduced from 6% to 4% of AGRon Spectrum to DoT The existing spectrum allocation criteria should be made technology-neutral
The unallocated carriers in 800 MHz should be given to existing CDMA operatorsWhen the Ministry of Defence vacates spectrum in the 900 MHz band, a part of itshould be allocated to GSM operators who have been allocated spectrum only in1800 MHz band.
TRAI’s Recommendations There should be a converged regulatory regime based on a slightly modifiedon Convergence and Communications Convergence Bill 2001Competition in Broadcasting Entry fee for unified license should be reduced to Rs.50 million as against Rs.1,070 millionand Telecommunications recommended earlier to reflect the recent change in NLD/ILD license. Further, entry fee
should reduce to Rs.3 million after 5 years as recommended earlier.
TRAI’s Recommendations MNP will allow mobile phone customers to switch service providers without having toon Mobile Number sacrifice their existing number, often the biggest deterrent for a dissatisfied customerPortability (MNP) to switch service providers. DOT has decided to defer implementation of MNP as of now.
TRAI’s Recommendations Recommendations on industry-wide issues in the event that operators decide to migrateon Next Generation to Next Generation Networks.Networks (NGN)
TRAI recommends steps for Recommendations for utilization of National Internet Exchange of India (NIXI) whichimprovement in the was set up for peering of ISPs among themselves, for the purpose of routing domesticeffectiveness of NIXI traffic within the country, instead of taking it all the way to US/ abroad.
DOT and TRAI Directives During the course of the year, TRAI and the DoT issued a number of directives to alltelecom service providers. The salient ones amongst these are:
Inter-Service-Area connectivityInformation to customers about complete details of the tariff planProvision of InterconnectionCharges for Value Added Services (VAS) and Premium Rate ServicesFormats for Publication/ Advertisement of subscriber tariffTariff plans with misleading titlesImplementation of Carrier Selection.
52

53
2. OPPORTUNITIES AND THREATS
2.1. Opportunities
A strong economy and a growing market
The Indian telecommunication industry is amongst the fastest
growing telecom markets in the world and is poised to deliver
solid growth as a result of several economic reforms that
have lead to strong GDP growth pegged at approximately
8.1% for FY 2006. Increasing per capita income supported by
increased consumption is resulting in a greater-than-
proportionate impetus for telecom growth. As India still
remains one of the lowest penetrated markets, it is one of the
most attractive telecom markets in the world today.
New technologies and paradigms
The trend towards adoption of Next Generation Networks
(NGN) is global and the discussions in India are still at a
preliminary stage. Bharti will partake in the discussions
regarding the feasibility, and the model for adopting 3G and
other NGN related technologies in the Indian context.
Technologies like Triple Play, wherein a single cable can deliver
voice, data, video on demand and IPTV provide us with a
unique opportunity as we are an integrated player and are
well positioned to deliver this service.
Strong strategic partnerships
We have strong strategic alliances with SingTel, and
Vodafone, both of whom have invested in the equity capital
of our Company. Our alliances provide us access to
technological know-how as well as best practices to enhance
customer experience. We will continue to leverage the
strengths of our partners and benefit from their experience
and know-how.
Introduction of number portability
Number portability would allow customers to retain their
telephone numbers even after switching service providers
or networks. We believe that companies with better service
delivery and customer care platforms stand to gain over
their competitors. Extensive network coverage, coupled with
aggressive pricing and innovative products and services
would help in gaining a larger share of the market. Given
our competitive position and focus on customer delight,
we believe we are well positioned to attract subscribers
presently on other networks, as and when number portability
gets introduced in the market.
2.2. Threats
Regulatory decisions and changes
On the regulatory front, reduction in the entry fee and the
annual license fee for National Long Distance and
International Long Distance (ILD), combined with the
impending implementation of Carrier Access Code (CAC)
would lead to greater competition in the Long Distance
segment. The implementation of Carrier Access Code would
make it easier for customers to choose their long distance
carrier, regardless of the access provider.
We, however, believe that given our focus on offering value-
for-money services to consumers, we would stand to gain
from the introduction of CAC.
Introduction of number portability may impact our
business
Number portability can lead to high customer attrition rate,
as the inability to retain a telephone number is currently a
significant exit barrier for a customer in the intensely
competitive Indian market. We may experience increased
price competition as operators seek to retain or attract
subscribers as well as incur an increased acquisition cost per
subscriber.
In addition, if we are required to offer number portability,
we will need to invest in implementation and maintenance
of complex back-end support systems, which will increase
our capital expenditure and expenses. However, given our
focus on customer delight, our presence in all circles as an
integrated telecom operator and our emphasis on network
enhancement and expansion, we believe that we would
benefit from introduction on number portability.
Increased competition may reduce market share
and/or revenue
Bharti Airtel is the only private GSM operator having an all-
India footprint. The Company is the market leader in the

54
wireless space based on the number of customers. With the
new foreign entities entering the Indian market through their
investments in the current operators, the financial strength
of these players is likely to increase. Also, few of our
competitors are likely to raise funds either through private
equity, borrowing or from public listings. They are likely to
plough back funds to expand network and provide greater
quality of service. This may lead to a downward pressure on
both customer and revenue market share.
3. SEGMENT WISE PERFORMANCE
3.1. Mobile Services
During the financial year, we added 8,594,928 mobile
customers on our networks, to end the year with a mobile
customer base of 19,579,208. We have maintained our
leadership in terms of wireless subscribers and have
improved our wireless subscriber market share from 21.2%
as at March 31, 2005 to 21.8% as at March 31, 2006.
Of our 19,579,208 mobile customers as at March 31, 2006,
post-paid customers contributed 17.3% to the overall
customer base, while the prepaid customers contributed
the balance 82.7%. During the financial year ended March
31, 2006, our share of 8,594,928 net additions was 22.7%
of the all-India wireless subscribers net additions.
The Mobile Services business recorded gross revenues of
Rs. 83,095 million for the year ended March 31, 2006,
showing a growth of 50% year on year. The earnings before
interest and tax was Rs. 16,854 million for the financial year
2005-06 as compared with Rs. 10,385 million in the previous
year, representing a year on year growth of 62%.
3.2. Non-Mobile Services
Non-Mobile Services comprises of Broadband & Telephone
Services and Enterprise Services. Enterprise Services is further
divided into two sub-business units, i.e. Enterprise Services–
Carriers (Long Distance) and Enterprise Services–Corporates.
3.2.1 Broadband & Telephone Services
Broadband (DSL) and telephone (fixed line) services are
provided in 90 cities across India. We had 1,346,740
customers as on March 31, 2006 of which 23.4% (315,729)
were subscribing to broadband (DSL) services. During the
financial year FY 2005-06, we added 489,478 customers
registering a growth of 57% over the previous year.
Broadband & Telephone Services recorded gross revenues
of Rs. 15,075 million for the year ended March 31, 2006,
showing a growth of 33% year on year. The earnings before
interest and tax was Rs. 606 million for the financial year
2005-06 as compared with Rs. 1,442 million in the previous
year. This reduction was attributable to the rollout of services
in 38 new cities during the financial year 2005-06.
3.2.2 Enterprise Services
3.2.2.1 Enterprise Services (Carriers)
1. The Company complements its Mobile and Broadband
& Telephone Services with national and international long
distance services. It has approximately 32,900 route
kilometres of optic fibre on its national long distance network
as at March 31, 2006. For international connectivity to the
East, it has a submarine cable landing station at Chennai,
which connects the submarine cable (owned by an associate
company) between Chennai and Singapore. For international
connectivity to the West, it is a member of the South East
Asia-Middle East-Western Europe – 4 (SEA-ME-WE-4)
consortium jointly with 15 other global telecom operators,
and have commissioned the fourth generation cable system.
SEA-ME-WE-4 supports telephone, internet, multimedia and
various other broadband and data applications.
The division recorded gross revenues of Rs. 24,674 million
for the year ended March 31, 2006, demonstrating a growth
of 32% year on year. The earnings before interest and tax
was Rs. 7,794 million for the financial year 2005-06 as
compared with Rs. 4,716 million in the previous year.
3.2.2.2 Enterprise Services (Corporates)
The Enterprise Services business unit provides secure,
scalable, seamless, reliable and customized integrated
solutions of voice and data communications for corporate,
small and medium scale enterprises.
The unit recorded gross revenues of Rs. 6,933 million for the
year ended March 31, 2006, demonstrating a growth of
28% year on year. The earnings before interest and tax was

55
Rs. 1,762 million for the financial year 2005-06 as compared
with Rs. 2,284 million in the previous year.
4. OUTLOOK
We believe that Bharti Airtel Ltd. will benefit from the overall
economic growth and the potential for further growth of
telecom services in the Indian market. We are the first and
only private GSM mobile operator to have an all-India
footprint. We believe that we are in a strong position to
enhance our leadership, based on: -
our rich human resource talent pool;
the growth potential of new services in the data market
and our track record in innovation;
the expansion of our networks to rural markets;
our ability to maximize returns on investment;
the ability to leverage the strengths of our business
partners and our integrated player status;
our focus on building a strong brand, and enhancing
customer experience.
We have consistently been the first to market with many
successful and innovative products that add to superior
customer experience and satisfaction. For instance, we
introduced a validity free world in India.
We firmly believe that we will continue to provide unique
and innovative products and services to our customers that
will help us further consolidate our market leadership.
5. RISKS AND CONCERNS
Our business is subject to extensive regulation by the
Government, which could have an adverse effect on
our business.
Our business units compete with government-owned or
government controlled companies. The regulatory
environment may tend to benefit them over the private
operators.
We, however, do not perceive adverse changes in the
regulatory environment. We are confident that the
government will continue to ensure a level playing field for
all operators keeping the customers’ best interest in mind.
Technical failures and natural disasters could damage
our telecommunication networks.
We maintain insurance for our assets equal to the
replacement value of our existing telecommunications
networks, which provides cover for damage caused by fire,
special perils, and terrorist attacks. However, there can be no
assurance that any claim under the insurance policies
maintained by us will be honored. Further, technical failures
and natural disasters, even when covered by insurance, may
cause disruption in our operations.
As a normal course of business, we have implemented back-up
solutions in the event such issues arise, which we believe will
enable us to continue with normal operations under most
circumstances.
Changes in available technology could increase
competition and our capital costs.
In order to remain competitive, we consistently introduce
sophisticated new technologies.In the event that the new
technologies that we have adopted or intended to adopt,
fail to be cost effective or are not accepted by customers,
our ability to remain competitive could be affected.
We have prudently deployed new technologies after
assessing the experience of our international partners in the
deployment process before choosing to do so ourselves.
Skilled manpower and talent.
The growth of the Indian economy has led to an increased
requirement for talented managerial personnel. We believe
that talented manpower is a key strength. Given the track
record and success of our employees, other companies often
look to Bharti Airtel as a hunting ground for talent.
As a retention strategy, the company has issued ESOPs.
Further, in order to mitigate the risk we place considerable
emphasis on development of leadership skills and on building
employee motivation.
6. INTERNAL CONTROL SYSTEMS
The Company has in place adequate systems of internal
controls commensurate with its size and nature of its
operations. These have been designed to provide reasonable

56
assurance with regard to recording and providing reliable
financial and operational information, complying with
applicable statutes, safeguarding assets from unauthorized
use or losses, executing transactions with proper
authorizations and ensuring compliance with corporate
policies.
The Company has a well-defined delegation of power with
authority limits for approving all expenses and transactions.
There are formalized processes laid down for review of the
actuals vs the budgets and annual and long-term business
plans. The Company has implemented an Enterprise Resource
Planning (ERP) system to connect financial information of
different locations for efficient exchange of information and
is continuing to align its processes and controls.
The Corporate Audit Group is responsible for performing
regular internal audit reviews to ensure adequacy of the
internal control systems and adherence to management
policies and statutory requirements. These audits are
executed as per an Internal Audit Plan, which is based on
assessment of major risks faced by the Company and is
approved by the Audit Committee. In line with best practices,
the planning and execution of the internal audit is oriented
towards review of controls in various operational and
financial areas critical to business – IT, Revenue Assurance,
Collection Credit and Risk, Network Security, Financial
Reporting, Procurement etc.
The Corporate Audit Group functionally reports to the Board
Audit Committee and administratively to the Chairman and
Group Managing Director. The Board Audit Committee
periodically reviews the audit plans, as well as observations
of both internal and statutory auditors.
7. DISCUSSION ON FINANCIAL PERFORMANCE
For the year ended March 31, 2006, the Company had
consolidated gross revenues of Rs. 117,255 million, a growth
of 44% year on year. Earnings before Interest, Tax, Depreciation
& Amortisation or EBITDA were Rs. 42,250 million, a growth
of 38% over the previous year. Cash profit from operations
was at Rs. 40,006 million, up by 42% while Profit before tax
was Rs. 23,455 million up by 48% from the previous year.
Net profit for the year was Rs. 20,279 million, a growth of
67% over the previous year.
8. MATERIAL DEVELOPMENTS IN HUMAN RESOURCES
With the ongoing economic growth in India and increasing
competitiveness in the services sector, it was imperative to
align our structures, systems and processes with our vision.
To capitalize on diverse opportunities in the telecom sector,
all our business lines have been structurally synergized to
provide the ‘One Airtel’ experience. This not only ensures
enhanced sustainability and scalability for future business
opportunities but also leverages our diverse strengths to
address prospective competitive challenges. To align people
capabilities with the revamped organizational design, the
Company has developed a comprehensive leadership
competency framework. Further, in order to ensure seamless
structural transition and account for enhanced job
responsibilities in the current context the Company is
conducting a detailed job evaluation exercise. This will
enable validated assessment of various existing/new roles
within the Company, provide more clarity to the job
incumbents and in turn support organizational optimization.
The Company’s continuing growth, coupled with quantum
developments in the services segments, and transferability
of skills has resulted in significant risks attributable to talent
retention across senior/critical positions. In order to address
these risks the Company envisages introducing a talent
assessment process to develop and recognize exemplary
leaders. The Company also plans to introduce a targeted
retention plan for senior/critical employees by providing
stock options based on performance of these employees.
A combination of these structural and systematic human
resource measures would ensure that the Company realizes
its vision of ‘being targeted by top talent’ and
simultaneously fulfill its growth agenda.

Report on corporate governance
THE COMPANY’S GOVERNANCE PHILOSOPHY
Corporate governance refers to a blend of law, regulation and voluntary practices that is able to attract capital and talent,
enable the organization to perform efficiently and ethically, generate long-term wealth and value for all its stakeholders and
respect the interests of society as a whole.
At Bharti Airtel Limited we believe in, and abide by, the following principles of effective corporate governance:
Transparency in disclosure and communication of relevant financial and operational information;
Accountability, supported by robust internal processes of management oversight and control for monitoring of performance
and risk;
Integrity and ethics in all our dealings;
Balancing the enforcement and protection of the rights of all stakeholders, thus creating wealth and value in the long-
term;
Independence of directors in reviewing and approving corporate strategy, major business plans and activities as well as
senior management appointments;
Well defined corporate structure that establishes checks and balances and delegates decision making to appropriate
levels in the organization.
The implementation of Clause 49 of the Listing Agreement with the stock exchange will undoubtedly raise the standards of
corporate governance in India. However, regulatory directives and enforcement will not be sufficient to create a best in class
transparent organization. We believe that establishing trust with our customers, investors, employees, business partners,
shareholders and the public at large requires that we go beyond regulatory compliance and adopt a culture and process for
credible self-regulation that transcends mere form.
Corporate governance rating
The earlier awarded highest Governance and Value Creation (GVC) rating viz. ‘CRISIL GVC Level 1’ by CRISIL, has been
reaffirmed once again this year. This clearly indicates our capability to create wealth for all our stakeholders, while preserving
the highest standards of ethics and governance. We acknowledge that corporate governance is a continuing process of
increasing the levels of governance and we endeavor to establish and benchmark ourselves with industry’s best practices to
ensure that our commitment to stay at the highest level is maintained.
Governance structure
The Chairman and Managing Director of Bharti Airtel is supported by two Joint Managing Directors, by the President of Bharti
Airtel and by a number of Corporate Directors to ensure the highest corporate governance standards, and to aid in designing
future strategy for the Company.
The Bharti Airtel organization is structured in three Strategic Business Units, i.e. Mobile Services, Broadband & Telephone
Services (B&TS), and Enterprise Services headed by three Joint Presidents who report directly to the President.
The President’s Office is provided the highest level of functional expertise and delivery, by functions such as Finance & Business
Integration, IT & Innovation, Marketing & Communication, Networks, Human Resources, Customer Service Delivery, Legal &
Regulatory, Supply Chain and Content Factory.
The principles of corporate governance in Bharti Airtel are practiced at multiple levels, which are interlinked with each other:
a) Strategic supervision and direction – by the Board of directors;
57
Executive
17%
83%
Non-ExecutiveIndependent
50%50%
Non-IndependentPromoter
83%
17%
Non-Promoter
b) Strategic design – by the senior management;
c) Strategic control and implementation – by the Airtel Management Board;
d) Operations management – by the management boards of the three Strategic Business Units, assisted by their respective
circle Executive Committees. There are twenty three circles in the Company, each with its own Executive Committee,
comprising of functional heads of divisions for day-to-day management and decision making;
e) Technology management – by the Airtel Technology Council.
This multi-tier structure for Corporate Governance ensures that:
i. Strategic supervision can be conducted by the Board based on independent judgment, thereby increasing accountability;
ii. Strategic design outlines the Company’s strategy for future growth;
iii. Strategic control and implementation activities have a clear focus on specific business areas, and on achieving synergies
with cross-business linkages, while maintaining a culture of customer centricity and meritocracy in the Company;
iv. Operations management of the strategic business units remains focused on enhancing the efficiency and effectiveness
of the respective businesses; and
v. Technology management concentrates on assessing emerging trends of technology, and achieves consensus on future
technology initiatives and action plans.
Our governance structure and process helps in clearly determining the responsibilities and entrusted powers of each of the
business entities, thus enabling them to perform those responsibilities in the most effective manner. It also allows us to
maintain our focus on the vision, mission and values we have defined, besides enabling effective delegation of authority and
empowerment at all levels.
BOARD OF DIRECTORS
Composition of the Board
The business of the Company is conducted by the management, under the direction of the Board, which oversees its
performance. The Board currently comprises of eighteen members, fifteen of whom are non-executive. A resume of each of
our directors is available on the website of the Company at www.bhartiairtel.in.
Sunil Bharti Mittal is the Executive Chairman, CEO and Managing Director. In accordance with the stipulations of the revised
Clause 49 of the Listing Agreement half of the Board members are independent directors, as is illustrated by the below graph.
The table sets out the names of directors, status and number of directorships held in other companies.
58

Name of the Director Category Number of Directorships1 and Committee2
Memberships & Chairmanships
Directorships Memberships Chairmanships
Sunil Bharti Mittal Executive director – Promoter 8 — —
Rajan Bharti Mittal Executive director – Promoter 5 2 —
Akhil Gupta Executive director 9 3 3
Rakesh Bharti Mittal Non-executive director – Promoter 4 1 1
Chua Sock Koong Non-executive director 2 2 —
Paul O’ Sullivan Non-executive director 2 — —
York Chye Chang4 Non-executive director 1 — —
Gavin John Darby3 Non-executive director 2 2 —
William Thomas Morrow3 Non-executive director 1 — —
Paul Donovan6 Non-executive director 1 — —
Lim Toon5 Non-executive director 2 — —
Bashir Currimjee Independent director 1 1 —
Donald Cameron Independent director 1 — —
Kurt Hellstrom Independent director 1 — —
N. Kumar Independent director 7 1 2
Pulak Chandan Prasad Independent director 3 1 —
V. S. Raju Independent director 3 2 —
Ajay Lal3 Independent director 3 2 —
Syeda Bilgrami Imam3 Independent director 1 1 0
Arun Bharat Ram4 Independent director 10 3 1
Lung Chien Ping5 Independent director 1 1 —
1. The directorships held by the directors, as mentioned above, do not include the directorships held in foreign companies,private limited companies and companies under Section 25 of the Companies Act.
2. The committees considered for the purpose are those prescribed under Clause 49(I)(C)(ii) of the Listing Agreement(s) viz.Audit Committee and Shareholders/Investors Grievance Committee of Indian Public Limited Companies.
3. William Thomas Morrow, Gavin John Darby, Ajay Lal and Syeda Bilgrami Imam were appointed as additional directors onthe Board w. e. f. January 23, 2006. William Thomas Morrow has resigned from the Board effectiveApril 27, 2006.
4. York Chye Chang and Arun Bharat Ram were appointed as directors on the Board w.e.f. March 31, 2006 to fill the casualvacancies caused due to resignation of Lim Toon and Lung Chien Ping respectively.
5. Lim Toon, non-executive director and Lung Chien Ping, independent director resigned from the Board effective February24, 2006.
6. Paul Donovan was appointed as an additional director on the Board w. e. f. April 27, 2006.
All our directors have professional skills and experience in different and complementary fields. They have proven judgmentand competence in understanding and guiding the company’s performance and strategy. The present strength and compositionof the Board reflects the diverse nature of the business environment in which we operate. The Board reviews its strength andcomposition from time to time to ensure it remains aligned with the requirements of the business.
None of the non-executive directors hold any equity shares in the Company, save for Bashir Currimjee, who – through a relative– holds 700 shares.
59

Independent directors
The independence of a director is determined by the criteria stipulated under the revised Clause 49 of the Listing Agreementas set out below.
None of the independent directors
a) apart from receiving his/her remuneration, has any material pecuniary relationships or transactions with the Company, itspromoters, its directors, its senior management or its holding company, its subsidiaries and associates that may affectindependence of the director;
b) is related to promoters or persons occupying management positions at the Board level or at one level below the Board;
c) has been an executive of the Company in the immediately preceding three financial years;
d) is a partner or an executive or was a partner or an executive during the preceding three years, of any of the following:
i. the statutory audit firm or the internal audit firm that is associated with the Company, and
ii. the legal firm(s) and consulting firm(s) that have a material association with the Company.
e) is a material supplier, service provider or customer or a lessor or lessee of the Company, which may affect independenceof the Director; and
f) is a substantial shareholder of the Company i.e. owning two percent or more of the block of voting shares.
We follow a process of self-certification by directors for ensuring that the criteria are fully met and the certificates are tabledbefore the Board.
Meeting of independent directors and Lead independent director
All independent directors meet separately prior to the commencement of all Board meetings, without the presence of anyexecutive directors or representative of management to discuss and form an independent opinion on the agenda items andother Board related matters. Mr. Bashir Currimjee has been designated as the Lead independent director. The role of the Leadindependent director is to:
preside over all executive sessions of the independent directors;
provide objective feedback of the independent directors as a group to the Board on various matters including agendaand other items;
undertake such other assignments as may be requested by the Board from time to time.
Number of Board Meetings
During the year 2005-06, the Board met four times, on
April 28 and 29, 2005
July 26 and 27, 2005
October 27, 2005 and
January 23 and 24, 2006
The time gap between two meetings was not more than 4 months. The calendar for Board and Committee meetings is fixedin advance for the whole year. Meetings are generally held at the registered office of the Company in New Delhi, though a fewmeetings are held in other cities and/or locations for logistical reasons.
Information available to the Board
The Board has complete access to all the relevant information within the Company, and to all our employees. The informationregularly supplied to the Board specifically includes:
Annual operating plans, budgets and any updates therein;
Capital budgets and any updates therein;
Quarterly results for the Company and its operating divisions or business segments;
Minutes of meetings of Audit Committee and other Committees of the Board;
Information on recruitment/remuneration of senior officers just below Board level;
Material show cause, demand, prosecution notices and penalty notices, if any;
Fatal or serious accidents, dangerous occurrences, any material effluent or pollution problems, if any;
Any material default in financial obligations to and by the Company or substantial non-payment for services provided bythe Company;
Any issue, which involves possible public or product liability claims of substantial nature, if any;
60

Details of any joint venture or collaboration agreement;
Transactions involving substantial payment towards goodwill, brand equity or intellectual property;
Significant labour problems and their proposed solutions, if any. Any significant development in human resources/industrial relations front like signing of wage agreement, implementation of voluntary retirement scheme etc. if any;
Sale of material nature, of investments, subsidiaries, assets, which is not in the normal course of business;
Quarterly details of foreign exchange exposures and the steps taken by management to limit the risks of adverseexchange rate movement, if material;
Non-compliance of any regulatory, statutory nature or listing requirements and shareholders service;
Various dislosures;
All proposals requiring strategic decisions;
Regular business updates.
The above information is generally provided as part of the agenda papers of the Board meeting and/or is placed at the tableduring the course of the meeting. The President and other senior management staff are also invited to the Board meetings topresent reports on the Company’s operations and internal control systems.
The Company Secretary, in consultation with the Chairman, prepares the agenda. All Board members are at liberty to suggestagenda items for inclusion. The detailed agenda is sent to the members a week before the Board meeting date. Board meetingsare held quarterly to coincide with the announcement of quarterly results and Committee meetings are held on the same datesas Board meetings.
Attendance of directors in the Board meetings and AGM
No. of Boardmeetings Attendance at last AGM
Name of director Held Attended held on September 6, 2005
Sunil Bharti Mittal 4 4 Yes
Rajan Bharti Mittal 4 4 Yes
Akhil Gupta 4 4 Yes
Rakesh Bharti Mittal 4 4 Yes
Chua Sock Koong 4 4 No
Paul O’ Sullivan1 4 4 No
York Chye Chang2 N.A. N.A. N.A.
Gavin John Darby3 1 1 N.A.
William Thomas Morrow3 1 — N.A.
Lim Toon4 4 4 No
Bashir Currimjee 4 4 No
Donald Cameron 4 4 No
Kurt Hellstrom 4 3 No
N. Kumar 4 3 No
Pulak Chandan Prasad 4 4 No
V. S. Raju 4 4 No
Ajay Lal3 1 — N.A.
Syeda Bilgrami Imam3 1 1 N.A.
Arun Bharat Ram2 N.A. N.A. N.A.
Lung Chien Ping4 4 4 No
1. One meeting attended through alternate director.
2. Appointed as directors with effect from March 31, 2006 to fill the casual vacancies caused due to resignation ofLim Toon and Lung Chien Ping respectively.
3. Appointed as additional director w.e.f. January 23, 2006.
4. Resigned from the Board on February 24, 2006.
61

Code of Conduct
The Board has laid down a Code of Conduct for all directors and senior management staff of the Company, which is also
available on the website of the Company www.bhartiairtel.in. All directors and members of the senior management, that
includes company executives who report directly to the Chairman and executive directors, have affirmed their compliance
with the said Code. A declaration signed by the Chief Executive Officer to this effect is appended as Annexure B at the end of
this report. Employees of the Company also confirm compliance with the Code of Conduct that is applicable for all employees.
COMMITTEES OF THE BOARD
In compliance with the Listing Agreements (both mandatory and non-mandatory) and the SEBI Regulations, the Board has
constituted the following statutory committees, viz.:
1. Audit Committee
2. HR/ Remuneration Committee
3. ESOP Compensation Committee and
4. Investors’ Grievance Committee.
AUDIT COMMITTEE
As on March 31, 2006, the Audit Committee comprises of nine members, two-thirds (6 members) of which are independent
directors. The Chairman of the Audit Committee is an independent director. The majority of the Audit Committee members,
including the Chairman, N. Kumar, have accounting and financial management expertise.
The Chief Internal Auditor, Group CFO and the representative of the Statutory Auditors are permanent invitees to the Audit
Committee. The Company Secretary acts as the secretary of the Committee.
The key responsibilities of the Audit Committee include the following:
Oversight of the Company’s financial reporting process and the disclosure of its financial information, to ensure that the
financial statements are true and accurate and provide sufficient information;
Recommending to the Board the appointment, re-appointment and, if required, the replacement or removal of the
statutory auditor and the fixation of their audit fees;
Approval of payment to statutory auditors for any other services rendered by the statutory auditors;
Reviewing, with the management, the annual financial statements before submission to the Board for approval, with
particular reference to:
a) Matters required to be included in the Director’s Responsibility Statement, which form part of the Board’s report in
terms of Clause (2AA) of Section 217 of the Companies Act, 1956;
b) Changes, if any, in accounting policies and practices and reasons for the same;
c) Major accounting entries involving estimates based on the exercise of judgment by management;
d) Significant adjustments made in the financial statements arising out of audit findings;
e) Compliance with listing and other legal requirements relating to financial statements;
f) Disclosure of any related party transactions; and
g) Qualifications in the draft audit report.
Reviewing, with the management, the quarterly financial statements before submission to the board for approval;
Reviewing, with the management, performance of statutory and internal auditors, adequacy of the internal control
systems;
Reviewing the adequacy of the internal audit function, including the structure of the internal audit department, staffing
and seniority of the official heading the department, availability and deployment of resources to complete their
responsibilities and the performance of the outsourced audit activity;
62

Discussion with internal auditors with respect to the coverage and frequency of internal audits as per the annual audit
plan, nature of significant findings and follow up thereof;
Reviewing the findings of any internal investigations by the internal auditors into matters where there is suspected fraud
or irregularity or a failure of internal control systems of a material nature and reporting the matter to the Board;
Obtaining an update on the risks management framework and the manner in which risks are being addressed;
Discussion with statutory auditors before the audit commences, about the nature and scope of audit as well as post-audit
discussion to ascertain any area of concern;
Reviewing the reasons for substantial defaults in payment to the depositors, debenture holders, shareholders (in case of
non-payment of declared dividends) and creditors, if any;
Reviewing the functioning of the whistle blower mechanism and the nature of complaints received by the Ombudsman;
Carrying out any other function as is mentioned in the terms of reference of the Audit Committee.
The Audit Committee also specifically reviews the un-audited/audited quarterly financial results of the Company before these
are submitted to the Board for approval. Minutes of each Audit Committee meeting are placed before the Board for noting.
The Audit Committee is empowered, pursuant to its terms of reference, to:
Investigate any activity within its terms of reference and to seek any information it requires from any employee;
Obtain legal or other independent professional advice and to secure the attendance of outsiders with relevant experience
and expertise, when considered necessary.
We have instituted internal processes and systems to ensure that the Audit Committee has access to all the material information,
and reviews on a regular basis the following:
Management discussion and analysis of financial condition and results of operations;
Statement of significant related party transactions (as defined by the Audit Committee), submitted by management;
Management certificates on internal controls and compliance with laws and regulations, including any exceptions to
these;
Management letters/letters of internal control weaknesses issued by the statutory auditors;
Internal audit reports relating to internal control weaknesses;
The appointment, removal and terms of remuneration of the Chief Internal Auditor;
The financial statements, in particular the investments, if any, made by the unlisted subsidiary companies.
The Audit Committee is also presented with the following information on related party transactions (whenever applicable):
A statement in summary form of transactions with related parties in the ordinary course of business;
Details of material transactions with related parties, which are not in the normal course of business;
Details of material transactions with related parties or others, which are not on an arm’s length basis accompanied by
management’s justification for the same.
The Audit Committee held four meetings during 2005-06, on
April 28, 2005
July 26, 2005
October 27 and 28, 2005 and
January 23 and 24, 2006
63

The time gap between any two meetings was less than four months. The composition of the Audit Committee as at March 31,2006 and the attendance of members at the meetings is given below:
Member Director Category No. of Audit Committee Meetings
Held Attended
N. Kumar, Chairman Independent director 4 3
Akhil Gupta Executive director 4 4
Chua Sock Koong Non-executive director 4 4
Gavin John Darby1 Non-executive director 1 1
Bashir Currimjee Independent director 4 4
Arun Bharat Ram2 Independent director N.A. N.A.
Pulak Chandan Prasad4 Independent director 4 4
Syeda Bilgrami Imam1 Independent director 1 —
Ajay Lal1 Independent director 1 —
Lung Chien Ping3 Independent director 1 1
1. Appointed as members of the Audit Committee w.e.f. January 23, 2006
2. Appointed as member of the Audit Committee w.e.f. March 31, 2006
3. Lung Chien Ping, who was appointed as member of the Audit Committee w.e.f. January 1, 2006 ceased to be a memberof the Board and Audit Committee w.e.f. February 24, 2006.
4. Pulak Chandan Prasad, member was elected as Chairman of the meeting held on April 28, 2005.
Audit Committee Report for the year ended March 31, 2006
To the shareholders of Bharti Airtel Limited:
Two-third of the Audit Committee members are independent directors, according to the definition laid down in the Clause 49of the Listing Agreement with the relevant stock exchanges.
The management is responsible for the Company’s internal controls and financial reporting process. The statutory auditors areresponsible for performing an independent audit of the Company’s financial statements in accordance with the Indian GAAP(Generally Accepted Accounting Principles) and for issuing a report thereon. The Company also has in place an internal auditgroup responsible for reviewing all the operations of the Company to evaluate the risks, internal controls and governanceprocesses.
The Audit Committee is responsible for ensuring the proper discharge of the above noted responsibilities of management andauditors. It is also responsible for overseeing the processes related to the financial reporting and information dissemination.
In this regard the Committee discussed with the Company’s internal auditors and statutory auditors the overall scope and plan fortheir respective audits. The Committee also discussed the results of their examinations, their evaluation of the Company’s internalcontrols and the overall quality of financial reporting. The management presented to the Committee, the Company’s financialstatements and also affirmed that the Company’s financial statements had been drawn up in accordance with the Indian GAAP.
The Committee has also reviewed the internal controls put in place to ensure that the accounts of the Company are properlymaintained and that the accounting transactions are in accordance with prevailing laws and regulations. Based on its reviewand discussions conducted with the management and the statutory auditors, the Audit Committee believes that the Company’sfinancial statements are in conformity with Indian GAAP.
The Committee has recommended to the Board, the re-appointment of M/s. Price Waterhouse, Chartered Accountants asstatutory auditors of the Company.
In conclusion, the Committee is sufficiently satisfied that it has complied with the responsibilities as outlined in the AuditCommittee’s Charter.
N. KumarChairman, Board Audit Committee
64

HUMAN RESOURCE (HR) COMMITTEE
In compliance with the non-mandatory requirements of Clause 49 of the Listing Agreement, we have constituted aRemuneration Committee (which is known as HR Committee).
The Committee comprises of six non-executive directors, out of which three members including the Chairman of the committeeDonald Cameron, are independent directors. The Company Secretary acts as the secretary of the Committee.
The key responsibilities of the HR Committee include the following:
Attraction and retention strategies for employees;
Employees development strategies;
Compensation (including salaries and salary adjustments, incentives/benefits bonuses, stock options) and performancetargets for the Chairman and Managing Director (CMD) and Joint Managing Director (JMDs);
All human resource related issues;
Other key issues/matters as may be referred by the Board or as may be necessary in view of Clause 49 of the ListingAgreement or any statutory provisions.
During the year, the Committee met four times, on
April 28, 2005
July 26, 2005
October 28, 2005 and
January 23, 2006
The composition and members’ attendance at the Committee meetings is presented below:
Member Director Category No. of Meetings
Held Attended
Donald Cameron Independent non-executive director 4 4(Chairman)
Kurt Hellstrom Independent non-executive director 4 3
V. S. Raju Independent non-executive director 4 4
Paul O’ Sullivan1 Non-executive director 4 4
Rakesh Bharti Mittal Non-executive director 4 4
William Thomas Morrow2
Non-executive director 1 —
Rajan Bharti Mittal3 Executive director 2 2
1. One (1) meeting attended through alternate director.
2. Appointed as member of the HR Committee w.e.f. January 23, 2006. He has subsequently resigned from the Boardeffective April 27, 2006.
3. Ceased to be member of the Committee w.e.f. January 23, 2006.
Remuneration Policy for directors
The remuneration paid to executive directors viz. Sunil Bharti Mittal - Chairman and Managing Director, Rajan Bharti Mittal andAkhil Gupta – Joint Managing Directors is reviewed by the HR Committee and approved by the Board of directors and theshareholders of the Company. The performance linked incentives paid to the executive directors are based on the performanceof the Company as well as that of the directors as reviewed by the Remuneration/HR Committee and approved by the Board.
The non-executive directors representing the key shareholders, namely Bharti Telecom Ltd., SingTel and Vodafone are notentitled to any remuneration or reimbursement of any expenses in terms of the shareholders’ agreements executed amongstthemselves. The independent non-executive directors are paid sitting fees within the prescribed limits for the Board/Committee
65

meetings attended by them. Further a commission, duly approved by the shareholders, not exceeding 1% of the net profit ofthe Company for the year calculated as per the Companies Act, 1956 is also payable to the non-executive independentdirectors. As a matter of better corporate governance, the Board of directors in its meeting held on January 23-24, 2006 hasapproved and adopted a policy on all payments including sitting fees, commissions, reimbursement of expenses etc. toindependent directors. Compensation of the non-executive independent directors is linked with the number of meetingsattended by the respective director during the year.
ESOP Compensation Committee
The ESOP Compensation Committee of the Board is constituted in accordance with SEBI (Employee Stock Option Scheme andEmployee Stock Purchase Scheme) Guidelines, 1999. The Committee comprises of 4 members of whom three are independentand all are non-executive.
The key responsibilities of the ESOP Compensation Committee includes the following:
1. ESOP plan and future grants.
2. Other key issues as may be referred by the Board.
During the year, the committee met three times viz. on
April 28, 2005,
July 26, 2005 and
January 23, 2006.
The composition and members’ attendance at the Committee meetings is presented below:
Member Director Category No. of MeetingsHeld Attended
Rakesh Bharti Mittal(Chairman) Non-executive director 3 3
Donald Cameron Independent non-executive director 3 3
Kurt Hellstrom Independent non-executive director 3 2
V. S. Raju Independent non-executive director 3 3
INVESTORS’ GRIEVANCE COMMITTEE
The Shareholders/Investors Grievance Committee of the Board oversees redressal of shareholders’/investors’ complaints onvarious matters like transfer of shares, non-receipt of annual reports and other such issues.
The meetings of the Committee are generally held on monthly basis, to review and ensure that all investor grievances areredressed within a period of 7-10 days from the date of receipt of complaint. These, however, do not include complaints/requests, which are constrained by legal impediments/procedural issues.
The Committee comprises of three members. Rakesh Bharti Mittal, the non-executive director is the Chairman of the Committee.The attendance of members at the meetings of Investors’ Grievance Committee held during the past financial year is as under:
During the year, the committee met ten times viz. on
April 29, 2005
May 27, 2005
June 16, 2005
July 27, 2005
August 31, 2005
September 20, 2005
October 27, 2005
November 30, 2005
December 26, 2005
March 9, 2006
66

Member Director Category No. of MeetingsHeld Attended
Rakesh Bharti Mittal (Chairman) Non-executive director 10 10
Rajan Bharti Mittal Executive director 10 9
Akhil Gupta Executive director 10 10
Nature of complaints and redressal status
During the past financial year, the complaints received by us were general in nature, which include issues relating to thechange of address, non-receipt of shares, refund orders etc. All these complaints/queries were resolved to the satisfaction ofinvestors. Details of the same are as follows:
Type of complaint No. of Redressed Pendingcomplaints
Non-receipt of any shares (Remat/ Transfer/Electronic Credit) 5 5 0
Non-receipt of annual report 18 18 0
Correction/change of bank mandate of refund orders — — —
Miscellaneous — — —
TOTAL 23 23 0
The above table does not include the responses furnished by us on clarifications sought by stock exchanges from time to timeon various market related information.
We have processed and completed all requests for share transfers and other related matters except those which are disputedand sub-judice.
Subsidiary companies
The revised Clause 49 defines a ‘material non-listed Indian subsidiary’ as an unlisted subsidiary, incorporated in India, whoseturnover or net worth (i.e. paid up capital and free reserves) exceeds 20% of the consolidated turnover or net worth respectively,of the listed holding company and its subsidiaries in the immediately preceding accounting year:
We do not have any material non-listed Indian subsidiary.
General Body Meetings
The last three Annual General Meetings (AGMs) were held as under:
Financial Year Location Date Time
2004-2005 Air Force Auditorium, September 6, 2005 03.30 p.m.Subroto Park,New Delhi – 110 020
2003-2004 Air Force Auditorium, August 20, 2004 03.30 p.m.Subroto Park,New Delhi – 110 020
2002-2003 Air Force Auditorium October 21, 2003 03.30 p.m.Subroto ParkNew Delhi – 110 020
Special resolutions passed at the last 3 AGMs
1. 2004-05 – Annual General Meeting held on September 6, 2005
a) Approval of the ESOP Scheme 2005;
b) Applicability of ESOP Scheme 2005 to the employees of holding and subsidiary companies;
c) Amendments in the Articles of Association of the Company consequent upon reduction in shareholding of one ofthe strategic shareholders viz. Brentwood Investment Holdings Limited.
67

2. 2003-04 – Annual General Meeting held on August 20, 2004:
a) Authorising the payment of commission to non-executive directors of the Company not exceeding 1% of the netprofits of the Company in each financial year;
b) Authorising amendments to the Company’s existing ESOP scheme; and
c) Authorising Sponsored ADR issue of the Company.
3. 2002-03 – Annual General Meeting held on October 21, 2003:
a) Authorising the Board for voluntary de-listing of the existing equity shares of Rs. 10/- each, from The Delhi StockExchange Association Limited (DSE);
b) Authorising the Board to make loans to, or furnish guarantees or provide securities on behalf of Bharti CellularLimited (BCL), an erstwhile subsidiary of the Company upto an aggregate amount of Rs. 67,000 mn; and
c) Authorising the Board to make loans to, or furnish guarantees or provide securities on behalf of Bharti InfotelLimited (BIL), an erstwhile subsidiary of the Company upto an aggregate amount of Rs. 40,000 mn.
Postal Ballot
During the year under review, in pursuance of Section 192A of the Companies Act, 1956 and Companies (Passing of theResolution by Postal Ballot) Rules, 2001, we have conducted three postal ballots for seeking approval of the shareholders byway of special resolution. M/s. S. K. Jain, Chartered Accountants, New Delhi were appointed as scrutiniser. The results of thepostal ballot were published in Business Standard (English Daily) and Jansatta (Hindi newspaper). The summary of the resultswas as follows:
Date ofS. declaration Particulars of the Total valid In favour AgainstNo. of results resolution passed Votes (%) (%)
1. 29.11.05 For increase in the limits of investments 1173100745 1173099657 1088by FIIs to sectorial cap as may be (100.00%) (99.999%) (0.0001%)applicable from time to time.
2. 02.03.06 a. For amendment in the Memorandum 1447322242 1447321399 843of Association (100.00%) (99.999%) (0.0001%)
b. For amendment in Articles of Association 1447322242 1447320371 1871(100.00%) (99.999%) (0.0001%)
3. 22.03.06 For change in the name of the Company 1386490710 1386488680 2030from Bharti Tele-Ventures Limited to (100.00%) (99.999%) (0.0001%)Bharti Airtel Limited
We believe that the postal ballot system allows for more participation of shareholders located in various parts of the country,who would normally not attend and vote at general meetings held in New Delhi.
Disclosures
i. Disclosure on materially significant related party transactions
The required statements/disclosures with respect to the related party transactions, if any are duly made to the AuditCommittee on a quarterly basis in terms of Clause 49(IV)(A) and other applicable laws. For the financial year endedMarch 31, 2006, there were no transactions of material nature with the related party which are not in the normal courseof business.
Further for the financial year ended March 31, 2006 there no material individual transactions with related parties orothers, which were not on an arm’s length basis.
The related party transactions have been disclosed under Note 28 of Schedule 23 forming part of the Annual Accounts.
68

ii Details of non-compliance with regard to capital market
There have been no instances of non-compliances by us and no penalties and/or strictures have been imposed on us bystock exchanges or SEBI or any statutory authority on any matter related to the capital markets during the last three years.
iii. Ombudsman Policy
We have implemented an Ombudsman Policy (includes Whistle Blower Policy), which outlines the method and processfor stakeholders to voice genuine concerns about unprofessional conduct that may be in breach of our Code of Conductfor employees. The policy aims to ensure that genuine complainants can raise their concerns in full confidence, withoutany fear of retaliation or victimizations. The Corporate Ombudsman administers a formal process to review and investigateany concerns raised, and undertakes all appropriate actions required to resolve the reported matter. Depending on thegravity of the concern, the Ombudsman constitutes a meeting of the Code Compliance Committee to undertake a fullinvestigation, which may involve both internal and external investigative bodies. Instances of serious misconduct dealtwith by the Ombudsman and the Code Compliance Committee are reported to the Audit Committee. Members of thisCommittee comprise the Ombudsman as Convenor, the Chief Internal Auditor, Corporate Director HR and the GeneralCounsel and Company Secretary. No employee of the Company has been denied access to this policy.
iv. Disclosure of accounting treatment
There is no deviation in following the treatments prescribed in any Accounting Standard (AS) in the preparation offinancial statements of the Company.
v. Disclosure – Risk Management
We have created a Risk Management Framework, key elements of which are as follows:
A detailed and comprehensive Risk Management Policy;
A risk register, which lists key risks faced by the organization, and their mitigating controls;
A methodology for rating these risks for their implications and probability of occurrence;
A methodology for evaluating the mitigating controls through an evaluation mechanism built in the Company’sinternal audit programme;
A process of communicating the risks through a risk matrix to the senior management and the Board AuditCommittee;
A designated Risk Manager as the owner of this process.
The key elements of this framework are in place at the corporate level and the Company is currently in the process ofextending this further down the organization so as to eventually achieve a comprehensive enterprise wide risk managementframework.
vi. Details of public funding obtained in last three years
We have not obtained any public funding in last three years.
vii. Remuneration of directors
For the financial year ended March 31, 2006, a total of Rs. 7,10,000/- were paid as sitting fee and a provision ofRs. 98,98,350/- has been made for payment of commission to all non-executive independent directors.
69

The details of the remuneration paid to all directors during the last financial year is as under:
Name of Sitting Salary and Performance Commission Stock TotalDirector Fees Allowances Linked Options
Incentive
Executive Directors
Sunil Bharti Mittal 0 51,711,081 75,048,000 0 0 126,759,081
Rajan Bharti Mittal 0 13,175,316 11,644,781 0 0 24,820,097
Akhil Gupta 0 16,693,776 15,432,813 0 0 32,126,589
Non-Executive Directors
Ajay Lal 0 0 0 0 0 0
Arun Bharat Ram 0 0 0 0 0 0
Bashir Currimjee 140,000 0 0 892,200 0 1,032,200
Chua Sock Koong 0 0 0 0 0 0
Donald Cameron 140,000 0 0 3,876,000 0 4,016,000
Gavin John Darby 0 0 0 0 0 0
Kurt Hellstrom 100,000 0 0 2,230,500 0 2,330,500
Lim Toon 0 0 0 0 0 0
Lung Chien Ping 80,000 0 0 892,200 0 972,200
N. Kumar 100,000 0 0 892,200 0 992,200
Paul O’ Sullivan 0 0 0 0 0 0
Pulak Chandan Prasad 0 0 0 0 0 0
Rakesh Bharti Mittal 0 0 0 0 0 0
Syeda Bilgrami Imam 10,000 0 0 223,050 0 233,050
V. S. Raju 140,000 0 0 892,200 0 1,032,200
William Thomas Morrow 0 0 0 0 0 0
York Chye Chang 0 0 0 0 0 0
710,000 81,580,173 102,125,594 9,898,350 0 194,314,117
Actual payment shall be subject to applicable laws and deduction of tax at source, wherever applicable.
The Company has entered into contracts with the three executive directors each dated October 1, 2001. These are basedon the approval of shareholders granted in their meeting held on September 25, 2001. There are no other contracts withany other director. No notice period or severance fee is payable to any director.
viii. Management
Detailed report on Management Discussion and Analysis (MDA) forms part of the Directors’ Report. We have a system inplace whereby senior management makes disclosures on quarterly basis to the Board relating to all material financial andcommercial transactions, where they have personal interest that may pose a potential conflict with the interest of theCompany at large.
ix. CEO/CFO Certificate
The certificate required under Clause 49(V) of the listing agreement duly signed by the CEO and CFO has been given tothe Board and the same is annexed as Annexure A.
70

x. Details of compliance with mandatory requirements and adoption of non-mandatory requirements of Clause49 of the Listing Agreement
ComplianceClause of Listing Status
Particulars agreement Yes/No
I. Board of directors 49 I
(A) Composition of Board 49(IA) Yes
(B) Non-executive directors’ compensation and disclosures 49 (IB) Yes
(C) Other provisions relating to Board and Committees 49 (IC) Yes
(D) Code of Conduct 49 (ID) Yes
II. Audit Committee 49 (II)
(A) Qualified and Independent Audit Committee 49 (IIA) Yes
(B) Meeting of Audit Committee 49 (IIB) Yes
(C) Powers of Audit Committee 49 (IIC) Yes
(D) Role of Audit Committee 49 II(D) Yes
(E) Review of Information by Audit Committee 49 (IIE) Yes
III. Subsidiary Companies 49 (III) Yes
IV. Disclosures 49 (IV)
(A) Basis of related party transactions 49 (IV A) Yes
(B) Board disclosures 49 (IV B) Yes
(C) Proceeds from public issues, rights issues, preferential issues etc. 49 (IV C) N/A
(D) Remuneration of Directors 49 (IV D) Yes
(E) Management 49 (IV E) Yes
(F) Shareholders 49 (IV F) Yes
V. CEO/CFO Certification 49 (V) Yes
VI. Report on corporate governance 49 (VI) Yes
VII. Compliance 49 (VII) Yes
N. Kumar, the Chairman of the Audit Committee could not attend the Annual General Meeting (AGM) held on September6, 2005 due to an imminent surgery he had to undergo. However, Akhil Gupta, Joint Managing Director and AuditCommittee member was present at the AGM to answer shareholder queries.
Besides complying with all the mandatory requirements of Clause 49, we have a Remuneration Committee of the Board(known as HR Committee), which comprises of non-executive directors. The scope of the Committee among otherthings includes consideration and recommendation of remuneration of executive directors. We have also established anOmbudsman Policy for employees to report to the management about unethical behavior, actual or suspected fraud orviolation of the Company’s Code of Conduct. Our objective is to comply with other applicable non-mandatory requirementsof Clause 49 as well.
Means of communication
The quarterly audited/un-audited results are published in prominent daily newspapers, viz. Business Standard and Jansatta(vernacular newspaper) and are also posted on the our website. At the end of each quarter we organize an earnings callwith analysts and investors, which is also broadcast live on our website, and the transcript is posted on the website soonafter;
Our financial results are also posted on SEBI’s EDIFAR System and can be viewed on SEBI website www.sebiedifar.nic.in;
Our website address is www.bhartiairtel.in and up-to-date financial results, official news releases, financial analysisreports, presentations made to the institutional investors and other general information about the Company are availableon the website;
Latest presentations made to the institutional investors are also made available on our website.
71

General Shareholders’ Information
i) The 11th Annual General Meeting will be held on August 21, 2006 at 3.30 p.m. at Air Force Auditorium, Subroto Park,New Delhi – 110 010.
ii) Financial Calendar for the year 2006-2007
Tentative Schedule:
Accounting year April 1, 2006 to March 31, 2007
First Quarter Results July 2006
Second Quarter and Half Yearly Results October 2006
Third Quarter Results January 2007
Fourth Quarter Results/ Annual Results April 2007
Annual General Meeting August/September 2007
iii) Book Closure Date: August 12, 2006 to August 21, 2006 (both days inclusive)
iv) We have not recommended any dividend for the financial year 2005-06.
v) Listing on stock exchanges and stock code
Our equity shares are listed on:
The National Stock Exchange of India Limited, Symbol -‘BHARTI’; and
The Bombay Stock Exchange Limited, Mumbai, Scrip code - 532454
We have paid listing fees for the year 2006-2007 to both the stock exchanges viz. the Bombay Stock Exchange Limitedand the National Stock Exchange of India Limited, where our securities are listed.
vi) Stock Market Data for the period April 1, 2005 to March 31, 2006
(Share price performance in comparison with NSE Nifty)
Bharti S & P CNX Nifty Index
Monthly Volume MonthlyMonth High Low Average Traded High Low Average
(Rs.) (Rs.) (Rs.) (Rs.)
April ‘05 225.00 192.50 208.55 4,378,302,248.55 2,084.90 1,896.30 1,987.10
May ‘05 232.00 205.25 218.93 4,276,305,665.75 2,099.35 1,898.15 2,002.28
June ‘05 246.90 217.55 230.32 6,412,689,002.55 2,226.15 2,061.35 2,134.29
July ‘05 287.00 229.80 257.32 8,887,627,078.70 2,332.55 2,171.25 2,236.70
August ‘05 324.50 279.55 304.37 10,057,797,254.30 2,426.65 2,294.25 2,357.56
September ‘05 367.25 302.15 340.62 8,323,194,812.05 2,633.90 2,382.90 2,511.70
October ‘05 352.90 305.15 332.25 10,865,693,743.65 2,669.20 2,307.45 2,486.78
November ‘05 381.00 320.45 354.57 6,812,757,769.30 2,727.05 2,366.80 2,574.66
December ‘05 370.00 326.60 352.05 8,323,194,812.05 2,857.00 2,641.95 2,772.61
January ‘06 394.90 322.75 346.69 5,015,633,521.15 3,005.10 2,783.85 2,892.68
February ‘06 395.00 350.00 368.36 4,496,869,775.80 3,090.30 2,928.10 3,019.32
March ‘06 428.90 358.00 392.48 8,546,751,861.30 3,433.85 3,064.00 3,236.37
72

Share Price vs S & P CNX Nifty
1500
1800
2100
2400
2700
3000
3300
12 1110987654321180
220
260
300
340
380
420
Nif
ty (M
on
thly
Ave
rag
e)
Bh
arti
(Mo
nth
ly A
vera
ge)
Month
Nifty Bharti
Share price performance in comparison with BSE Sensex
Bharti BSE Sensex
Monthly Volume MonthlyMonth High Low Average Traded High Low Average
(Rs.) (Rs.) (Rs.) (Rs.)
April ‘05 219.40 192.45 207.15 1,035,439,994.00 6,606.41 6,134.86 6,379.29
May ‘05 229.95 205.60 224.05 993,213,759.00 6,715.11 6,195.15 6,482.66
June ‘05 247.00 218.00 242.85 2,878,859,631.00 7,193.85 6,655.56 6,925.86
July ‘05 287.20 237.05 283.10 2,930,422,033.00 7,638.42 7,145.13 7,336.70
August ‘05 324.50 279.90 315.45 3,743,981,491.00 7,859.53 7,595.57 7,726.03
September ’05 366.70 314.50 348.50 2,720,907,760.00 8,650.17 7,876.15 8,272.32
October ‘05 352.00 305.25 322.65 3,422,109,181.00 8,799.96 7,685.64 8,220.45
November ‘05 377.00 320.15 357.55 2,047,811,186.00 8,994.94 7,944.10 8,552.09
December ‘05 368.00 327.00 345.70 2,999,826,379.00 9,397.93 8,815.53 9,162.07
January ‘06 363.75 323.00 355.60 1,748,328,707.00 9,919.89 9,237.53 9,539.67
February ‘06 378.00 349.00 361.30 1,330,054,610.00 10,370.24 9,742.58 10,090.08
March ‘06 429.00 357.00 412.85 2,240,705,140.00 10,370.24 9,742.58 10,090.08
73

Bharti Share Price vs BSE Sensex
6000
7000
8000
9000
10000
11000
12000
12-11-10-9-8-7-6-5-4-3-2-1-180
210
240
270
300
330
360
390
420
450
BSE
Sen
sex
(Mo
nth
ly A
vera
ge
in R
s.)
Bh
arti
(Mo
nth
ly A
vera
ge
in R
s.)
Month
Sensex Bharti
vii) Registrar and Transfer Agent
Our share transfer work is handled by M/s. Karvy Computershare Private Limited (previously Karvy Consultants Limited),the Registrar and Share Transfer Agent (RTA). Their complete address is as under:
Karvy Computershare Private Limited
‘Karvy House’, 46 Avenue 4,
Street No. 1, Banjara Hills
Hyderabad - 500 034
Tel: (91-40) 23420815-20
Fax: (91-40) 23420814
Email: [email protected]
viii) Share Transfer System
Our shares are traded on the stock exchanges through the depository system. The ISIN of our Scrip is: INE 397D01016.
All requests received by us/RTA for dematerialisation/re-materialisation/transfer are dealt with expeditiously. Sharecertificates duly endorsed are issued/transferred to all those shareholders who opt for shares in the physical form.
ix) Distribution of shareholding by number of shares held as on March 31, 2006
S. No. of equity No. of % to total Number of % to totalNo. shares held shareholders no. of equity shares no. of
shareholders of Rs. 10/- equity shares
1. 1-5,000 48,448 97.86 10,835,938 0.57
2. 5,001-10,000 311 0.63 2,202,979 0.12
3. 10,001-20,000 154 0.31 2,254,256 0.12
4. 20,001- 30,000 69 0.14 1,757,345 0.09
5. 30,001-40,000 31 0.06 1,115,854 0.06
6. 40,001-50,000 33 0.07 1,511,429 0.08
7. 50,001-100,000 87 0.18 6,129,664 0.32
8. 10,0001 & above 373 0.75 1,868,071,839 98.64
Total 49,506 100.00 1,893,879,304 100.00
74

x) Categories of shareholding as on March 31, 2006
S. No. Category No. of Shares Held % of Share Holding
A. PROMOTERS’ HOLDING 1. Promoters
– Indian promoters 859,986,028 45.41%– Foreign promoters 0 0.00%
2. Persons acting in concert 1,300,700 0.07%
Sub-Total A 861,286,728 45.48%
B. NON-PROMOTER HOLDINGS 3. Institutional Investors a) Mutual Funds and UTI 40,674,230 2.15%b) Banks, Financial Institution, Insurance Companies, 32,300,424 1.71%
Central/State Government Institutions/Non-Government Institutions
c) FII 485,119,934 25.62%
Sub-Total B 558,094,588 29.47%
4. Others a) Private corporate bodies 24,137,879 1.27%b) Indian public 19,136,493 1.01%c) NRIs/OCBs 15,550,929 0.82%d) Foreign Companies 409,254,605 21.62%e) Any other :
i) Trusts 4,207,230 0.22%ii) HUF 247,870 0.01%iii) Clearing Members (NSDL & CDSL) 1,962,982 0.10%
Sub-Total C 474,497,988 25.05%
GRAND TOTAL (A+B+C) 1,893,879,304 100.00%
xi) Dematerlisation of shares and liquidityTrading in equity shares in dematerialized form became mandatory from May 31, 1999. Ours equity shares are tradablein compulsory dematerialized form since listing i.e. February 15, 2002. To facilitate trading in dematerialized form inIndia, there are two depositories i.e. National Securities Depository Limited (NSDL) and Central Depository Services(India) Limited (CDSL).
We have entered into agreement with both these depositories. Shareholders can open their accounts with any of theDepository Participant registered with these depositories.
As on March 31, 2006, our more than 84% shares were held in dematerialized form;Our equity shares are frequently traded at Bombay Stock Exchange Limited and National Stock Exchange of IndiaLimited.
xii) Outstanding GDRs/ ADRs/ Warrants/ OptionsDuring the year 2004-05, we issued USD 115,000,000 Zero Coupon Convertible Bonds (“Bonds”) due in 2009. TheBonds are convertible at any time after June 12, 2004 upto April 12, 2009 by the holders, into fully paid equity sharesof Rs. 10/- per share, at an initial conversion price of Rs. 233.17 per share. During the year, we received 33 notices fromdifferent bondholders aggregating to USD 94.756 million convertible into 17,701,967 equity shares of the Company.After the aforesaid allotment of 17,701,967 equity shares, the issued, subscribed and paid-up capital of the Company isRs. 18,938,793,040/-. Outstanding FCCBs as at 31.03.2006 are USD 20.244 million the details have been provided underSchedule 23 forming part of the annual accounts.
xiii) Investors’ correspondence may be addressed to:Vijaya SampathGeneral Counsel and Company SecretaryBharti Airtel LimitedQutab Ambience, H-5/12, Mehrauli Road, New Delhi - 110 030Tel: 91-11-41666000-07 Email: [email protected],Fax: 91-11-41666011-12 Website: www.bhartiairtel.in
75

Annexure BDeclaration
This is to confirm that the Company has adopted a Code of Conduct for its Board members and the senior management and
the same is available on the Company’s website.
I confirm that the Company has in respect of financial year ended March 31, 2006, received from the senior management
team of the Company and the members of the Board a declaration of compliance with the Code of Conduct as applicable to
them.
For the purpose of this declaration, the term ‘senior management’ means the direct reportees of the Chairman and Managing
Director, and the Joint Managing Directors.
Sunil Bharti MittalChairman & Managing Director
New DelhiApril 28, 2006
Annexure AChief Executive Officer (CEO)/Chief Financial Officer (CFO) Certification
We, Sunil Bharti Mittal, Chairman and Managing Director and Akhil Gupta, Chief Financial Officer of Bharti Airtel Limited, to
the best of our knowledge and belief hereby certify that:
(a) We have reviewed financial statements and the cash flow statement for the year and that to the best of our knowledge
and belief:
(i) these statements do not contain any materially untrue statement or omit any material fact or contain statements
that might be misleading;
(ii) these statements together present a true and fair view of the Company’s affairs and are in compliance with existing
accounting standards, applicable laws and regulations.
(b) There are, to the best of our knowledge and belief, no transactions entered into by the Company during the year which
are fraudulent, illegal or violative of the Company’s code of conduct.
(c) We accept responsibility for establishing and maintaining internal controls for financial reporting and that we have
evaluated the effectiveness of internal control systems of the Company pertaining to financial reporting and we have
disclosed to the auditors and the Audit Committee, deficiencies in the design or operation of such internal controls, if
any, of which we are aware and the steps we have taken or propose to take to rectify these deficiencies.
(d) We have indicated to the auditors and the Audit committee:
(i) Significant changes in internal control over financial reporting during the year;
(ii) Significant changes in accounting policies during the year and that the same have been disclosed in the notes to the
financial statements; and
(iii) Instances of significant fraud of which we have become aware and the involvement therein, if any, of the management
or an employee having a significant role in the Company’s internal control system over financial reporting.
Name : Sunil Bharti Mittal Name : Akhil GuptaDesignation : Chairman & CEO Designation : Joint Managing Director & CFO
Date : April 28, 2006
76

Auditors’ Certificateregarding compliance of conditions of Corporate Governance
To the Members of Bharti Airtel Limited,
We have examined the compliance of conditions of Corporate Governance by Bharti Airtel Limited (‘the Company’), for the
year ended March 31, 2006, as stipulated in Clause 49 of the Listing Agreements of the said Company with stock exchanges
in India.
The compliance of conditions of Corporate Governance is the responsibility of the Company’s management. Our examination
was carried out in accordance with the Guidance Note on Certification of Corporate Governance (as stipulated in Clause 49 of
the Listing Agreements), issued by the Institute of Chartered Accountants of India and was limited to procedures and
implementation thereof, adopted by the Company for ensuring the compliance of the conditions of Corporate Governance.
It is neither an audit nor an expression of opinion on the financial statements of the Company.
In our opinion and to the best of our information and according to the explanations given to us, we certify that the Company
has in all material respects complied with the conditions of Corporate Governance as stipulated in the above mentioned
Listing Agreement.
We state that such compliance is neither an assurance as to the future viability of the Company nor the efficiency or
effectiveness with which the management has conducted the affairs of the Company.
For and on behalf of
PRICE WATERHOUSEChartered Accountants
U. RAJEEVPartner
Membership No.: F87191
Place: New DelhiDate : April 28, 2006
77

Auditors’ Report to the Members of Bharti Airtel Limited (Formerly Bharti Tele-Ventures Limited)
Standalone Financial Statements with Auditors’ Report
1. We have audited the attached Balance Sheet of BhartiAirtel Limited, as at March 31, 2006, and the relatedProfit and Loss Account and Cash Flow Statement forthe year ended on that date annexed thereto, whichwe have signed under reference to this report. Thesefinancial statements are the responsibility of thecompany’s management. Our responsibility is toexpress an opinion on these financial statements basedon our audit.
2. We conducted our audit in accordance with theauditing standards generally accepted in India. ThoseStandards require that we plan and perform the auditto obtain reasonable assurance about whether thefinancial statements are free of material misstatement.An audit includes examining, on a test basis, evidencesupporting the amounts and disclosures in the financialstatements. An audit also includes assessing theaccounting principles used and significant estimatesmade by management, as well as evaluating the overallfinancial statement presentation. We believe that ouraudit provides a reasonable basis for our opinion.
3. As required by the Companies (Auditor’s Report) Order,2003, as amended by the Companies (Auditor’s Report)(Amendment) Order, 2004, issued by the CentralGovernment of India in terms of sub-section (4A) ofSection 227 of ‘The Companies Act, 1956’ of India (the‘Act’) and on the basis of such checks of the books andrecords of the company as we considered appropriateand according to the information and explanationsgiven to us, we further report that:
(i) (a) The Company is maintaining proper recordsshowing full particulars includingquantitative details and situation of fixedassets.
(b) The fixed assets are physically verified bythe management according to a phasedprogramme designed to cover all the itemsover a period of three years, which in ouropinion, is reasonable having regard to thesize of the company and the nature of itsassets. Pursuant to the programme, aportion of the fixed assets has beenphysically verified by the management
during the year and no material discrepancies
between the book records and the physical
inventory have been noticed.
(c) In our opinion and according to the
information and explanations given to us,
a substantial part of fixed assets has not
been disposed of by the company during
the year.
(ii) (a) The inventory (excluding stocks with third
parties) has been physically verified by the
management during the year. In respect of
inventory lying with third parties, these
have substantially been confirmed by them.
In our opinion, the frequency of verification
is reasonable.
(b) In our opinion, the procedures of physical
verification of inventory followed by the
management are reasonable and adequate
in relation to the size of the company and
the nature of its business.
(c) On the basis of our examination of the
inventory records, in our opinion, the
company is maintaining proper records of
inventory. The discrepancies noticed on
physical verification of inventory as
compared to book records were not
material.
(iii) The company has neither granted nor taken any
loans, secured or unsecured, that need to be entered
into the register maintained under section 301 of
the Act. Accordingly, clauses (iii) (b), (c), (d), (f) and
(g) of the Companies (Auditor’s Report) Order, 2003,
as amended by the Companies (Auditor’s Report)
(Amendment) Order, 2004 are not applicable to
the company for the current year.
(iv) In our opinion and according to the information
and explanations given to us, having regard to
the explanation that certain items purchased are
of special nature for which suitable alternative
sources do not exist for obtaining comparative
quotations, there is an adequate internal control
78

system commensurate with the size of the
company and the nature of its business for the
purchase of inventory, fixed assets and for the
sale of goods and services, except for certain
general information system controls, which are
being further strengthened by the management.
Further, on the basis of our examination of the
books and records of the company, and according
to the information and explanations given to us,
we have neither come across nor have been
informed of any continuing failure to correct
major weaknesses in the aforesaid internal control
system.
(v) According to the information and explanations
given to us, there have been no contracts or
arrangements referred to in Section 301 of the
Act during the year to be entered in the register
required to be maintained under that section.
Accordingly commenting on transactions made
in pursuance of such contracts or arrangements
does not arise.
(vi) The company has not accepted any deposits from
the public within the meaning of Sections 58A and
58AA of the Act and the rules framed there under.
(vii) In our opinion, the company has an internal audit
system commensurate with its size and nature of
its business.
(viii) We have broadly reviewed the books of account
maintained by the company in respect of products
where, pursuant to the Rules made by the Central
Government of India, the maintenance of cost
records has been prescribed under clause (d) of
sub-section (1) of Section 209 of the Act and are
of the opinion that prima facie, the prescribed
accounts and records have been made and
maintained. We have not, however, made a
detailed examination of the records with a view
to determine whether they are accurate or
complete.
(ix) (a) According to the information and
explanations given to us and the records of
the company examined by us, in our
opinion, the company is generally regular
in depositing undisputed statutory dues
including investor education and
protection fund, employees’ state
insurance, income-tax, wealth tax, service
tax, customs duty, excise duty and other
material statutory dues as applicable, with
the appropriate authorities though there
has been a slight delay in a few cases.
(b) According to the information and
explanations given to us and the records of
the company examined by us, the
particulars of dues of income-tax, sales-tax,
wealth tax, service tax, customs duty, excise
duty and cess as at March 31, 2006 which
have not been deposited on account of a
dispute, are as follows: -
Name of the Statute Nature of Amount Amount Period to Forum where the disputethe Dues Disputed Deposited which it is pending
(in Rs. ‘000) (in Rs. ‘000) Relates
Kerala General Sales Tax 548 548 2003-04 Supreme CourtSales Tax Act,1963
CST / UP Trade Sales Tax 53 53 2003-04 Asst Commissioner TradeTax Act, 1948 Tax-Noida
CST / UP Trade Sales Tax 172 – 2005-06 Deputy Commissioner –Tax Act, 1948 Trade Tax, Meerut
CST / UP Trade Sales Tax 140 – 2001-02 Tribunal, GhaziabadTax Act, 1948
CST / UP Trade Sales Tax 4,837 4,837 2004-05 Joint Commissioner (Appeal)
Tax Act, 1948
79

Name of the Statute Nature of Amount Amount Period to Forum where the disputethe Dues Disputed Deposited which it is pending
(in Rs. ‘000) (in Rs. ‘000) Relates
CST / UP Trade Sales Tax 298 298 2003-04 Joint Commissioner (Appeal)
Tax Act, 1948
CST / UP Trade Sales Tax 251 151 2003-04 Assessing Officer
Tax Act, 1948
CST / UP Trade Sales Tax 34 - 2004-05 Assessing Officer
Tax Act, 1948
CST / UP Trade Sales Tax 129 129 2004-05 Assessing Officer
Tax Act, 1948
Madhya Pradesh Sales Tax 144 – 1998-99 MP Commercial Tax Tribunal
Commercial Tax Act, 1991
Punjab General Sales Sales Tax 611 611 2002-03 Sales Tax Tribunal Punjab
Tax Act
Punjab General Sales Sales Tax 80 – 2001-02 Dy. Commissioner of Excise &
Tax Act Taxation
West Bengal Sales 6,325 – 2002-03 Asst. Commissioner,
Tax Act, 1994 Commercial Tax Officer,
West Bengal
Andhra Pradesh General Sales Tax 2,861 – 2001-02 Appellate Deputy
Sales Tax Act, 1957 Commissioner
Bihar Value Added Sales Tax 28,147 – 2005-06 High Court
Tax Act, 2005
Tamil Nadu General Sales Tax 4,178 1,325 2002-03 CTO
Sales Tax Act, 1959
CST / UP Trade Sales Tax 397 – 2005-06 High Court
Tax Act,1948
Delhi Sales Tax Act, 1975 Sales Tax 18,698 3,000 1999-2001 Supreme court
Tamil Nadu General Sales Tax 10,928 3,773 1999-2001 Appellate commissioner
Sales Tax Act, 1959
Sub Total (A) 78,831 14,725
80

Name of the Statute Nature of Amount Amount Period to Forum where the disputethe Dues Disputed Deposited which it is pending
(in Rs. ‘000) (in Rs. ‘000) Relates
Finance Act, 1994 Service Tax 4 – 1998-99 Additional Commissioner
(Service Tax Provisions)
Finance Act, 1994 Service Tax 56 – 1995-96 Commissioner Appeals
(Service Tax Provisions)
Finance Act, 1994 Service Tax 5 – 1995-96 Commissioner Appeals
(Service Tax Provisions)
Finance Act, 1994 Service Tax 87 – 1995-96 Commissioner Appeals
(Service Tax Provisions)
Finance Act, 1994 Service Tax 10 – 1995-96 Commissioner Appeals
(Service Tax Provisions)
Finance Act, 1994 Service Tax 233 – 1998-99 Additional Commissioner
(Service Tax Provisions)
Finance Act, 1994 Service Tax 9,313 – 1998-00 Additional Commissioner
(Service Tax Provisions)
Finance Act, 1994 Service Tax 18,925 – 1997-99 Additional Commissioner
(Service Tax Provisions)
Finance Act, 1994 Service Tax 19,120 – 2001-03 Deputy Commissioner
(Service Tax Provisions)
Finance Act, 1994 Service Tax 8,851 – 1999-2000 Deputy Commissioner
(Service Tax Provisions)
Finance Act, 1994 Service Tax 14,154 – 2003-04 Deputy Commissioner
(Service Tax Provisions)
Finance Act, 1994 Service Tax 2,887 – 2003-04 Deputy Commissioner
(Service Tax Provisions)
Finance Act, 1994 Service Tax 2,588 – 2003-04 Commissioner of Central Excise
(Service Tax Provisions)
Finance Act, 1994 Service Tax 9,450 – 2003-04 Commissioner of Central Excise
(Service Tax Provisions)
Finance Act, 1994 Service Tax 15,502 – 2003-04 Dy. Commissioner of Service
(Service Tax Provisions) Tax Mumbai
Finance Act, 1994 Service Tax 547 – 2003-04 Commissioner of Central Excise
(Service Tax Provisions)
Finance Act, 1994 Service Tax 2,358 – 2004-05 Commissioner of Central Excise
(Service Tax Provisions)
81

Name of the Statute Nature of Amount Amount Period to Forum where the disputethe Dues Disputed Deposited which it is pending
(in Rs. ‘000) (in Rs. ‘000) Relates
Finance Act, 1994 Service Tax 61 – 2004-05 Assistant Commissioner
(Service Tax Provisions)
Finance Act, 1994 Service Tax 2,556 – 1997-99 Commissioner Appeals
(Service Tax Provisions)
Finance Act, 1994 Service Tax 1,613 – 2003-05 Asstt. Commissioner of
(Service Tax Provisions) Service Tax
Finance Act, 1994 Service Tax 13,040 140 2003-04 Dy. Commissioner, Service Tax
(Service Tax Provisions)
Finance Act, 1994 Service Tax 2,054 – 2003-04 Commissioner Appeals
(Service Tax Provisions)
Sub Total (B) 123,414 140
Income Tax Act,1961 Income Tax 56,400 22,862 2001-04 Income Tax Appellate Tribunal
Income Tax Act,1961 Income Tax 5,270 – 2002-04 Income Tax Appellate Tribunal
Income Tax Act,1961 Income Tax 4,924 – 2001-05 Commissioner of Income Tax
(Appeals)
Income Tax Act,1961 Income Tax 11,200 11,200 2005-06 Commissioner of Income Tax
(Appeals)
Income Tax Act,1961 Income Tax 81,458 76,980 2002-03 Commissioner of Income Tax
(Appeals)
Income Tax Act,1961 Income Tax 144,409 1,184 2003-04 Commissioner of Income Tax
(Appeals)
Income Tax Act,1961 Income Tax 11,153 642 2001-02 Commissioner of Income Tax
(Appeals)
Income Tax Act,1961 Income Tax 57,628 57,628 1997-98 Income Tax Appellate Tribunal
Income Tax Act,1961 Income Tax 573 573 1995-96 Income Tax Appellate Tribunal
Income Tax Act,1961 Income Tax 117,799 116,780 2000-01 Income Tax Appellate Tribunal
Income Tax Act,1961 Income Tax 81,894 81,894 2001-02 Income Tax Appellate Tribunal
Income Tax Act,1961 Income Tax 6,424 6,424 1998-99 Income Tax Appellate Tribunal
Income Tax Act,1961 Income Tax 4,980 4,980 2002-03 Income Tax Appellate Tribunal
Sub Total (C) 584,112 381,147
82

The above does not include amounts which have not
been deposited (as explained in Note 4(b) on Schedule
23 in respect of Sales Tax/ Service Tax, wherein the
Supreme Court has decided in favour of the telecom
operators, consequent to which the respective
authorities have/are in the process of issuing necessary
orders.
(x) The company has no accumulated losses as at March
31, 2006 and it has not incurred any cash losses in
the financial year ended on that date or in the
immediately preceding financial year.
(xi) According to the records of the company examined
by us and the information and explanation given to
us, the company has not defaulted in repayment of
dues to any financial institution or bank or debenture
holders as at the balance sheet date.
(xii) The company has not granted any loans and advances
on the basis of security by way of pledge of shares,
debentures and other securities.
(xiii) The provisions of any special statute applicable to
chit fund / nidhi / mutual benefit fund / societies are
not applicable to the company.
(xiv) In our opinion, the company has maintained proper
records of transactions and contracts relating to
dealing or trading in shares, securities, debentures
and other investments during the year and timely
entries have been made therein. Further, such
securities have been held by the company in its own
name or are in the process of transfer in its name,
except to the extent of the exemption granted under
Section 49 of the Act.
(xv) In our opinion and according to the information and
explanations given to us, the company has not given
any guarantee for loans taken by others from banks
or financial institutions during the year.
(xvi) In our opinion, and according to the information and
explanations given to us, on an overall basis, the term
loans have been applied for the purposes for which
they were obtained.
(xvii) On the basis of an overall examination of the balance
sheet of the company, in our opinion and according
to the information and explanations given to us, funds
amounting to Rs. 55,874,815 thousand raised on a
short term basis (primarily representing capital
creditors) have been used for long-term investment
(representing Fixed Assets).
(xviii) The company has not made any preferential allotment
of shares to parties and companies covered in the
register maintained under Section 301 of the Act
during the year.
(xix) The company has created security or charge in respect
of debentures issued and outstanding at the year-
end.
(xx) The company has not raised any money by public
issues during the year.
(xxi) During the course of our examination of the books
and records of the company, carried out in accordance
with the generally accepted auditing practices in India,
and according to the information and explanations
given to us, we have neither come across any instance
of fraud on or by the company, noticed or reported
during the year, nor have we been informed of such
case by the management other than 7 cases of
employee frauds which in the opinion of the
management is not expected to be significant, and
an instance of misstatement of financial statements
to the extent of Rs. 1,25,720.61 thousands, which
has been adjusted in the financial statements by
charging it to the Profit and Loss Account as explained
in Note 33 of Schedule 23.
4. Further to our comments in the Annexure referred to
in paragraph 3 above, we report that:
(a) We have obtained all the information and
explanations, which to the best of our
knowledge and belief were necessary for the
purposes of our audit;
(b) In our opinion, proper books of account as
required by law have been kept by the company
83

so far as appears from our examination of those
books;
(c) The Balance Sheet, Profit and Loss Account and
Cash Flow Statement dealt with by this report
are in agreement with the books of account;
(d) In our opinion, the Balance Sheet, Profit and
Loss Account and Cash Flow Statement dealt
with by this report comply with the accounting
standards referred to in sub-section (3C) of
Section 211 of the Act;
(e) On the basis of written representations received
from the directors, and taken on record by the
Board of Directors, none of the directors is
disqualified as on March 31, 2006 from being
appointed as a director in terms of clause (g) of
sub-section (1) of Section 274 of the Act;
(f) In our opinion and to the best of our information
and according to the explanations given to us,
the said financial statements together with the
notes thereon and attached thereto give in the
prescribed manner the information required by
the Act and give a true and fair view in
conformity with the accounting principles
generally accepted in India:
(i) in the case of the Balance Sheet, of the
state of affairs of the company as at
March 31, 2006;
(ii) in the case of the Profit and Loss Ac-
count, of the profit for the year ended
on that date; and
(iii) in the case of the Cash Flow Statement,
of the cash flows for the year ended on
that date.
U. RAJEEVPartner
Membership Number F-87191
For and on behalf of
Place : New Delhi PRICE WATERHOUSEDate : April 28, 2006 Chartered Accountants
84

Schedule As at As atParticulars No. March 31, 2006 March 31, 2005
(Rs. ‘000) (Rs. ‘000)
SOURCES OF FUNDSShareholders’ Funds
Share Capital 1 18,938,793 18,560,889Employee Stock Option Outstanding 505,961 –Less: Deferred Stock Compensation 384,701 121,260 –(Refer Note 32 on Schedule 23)Reserves and Surplus 2 54,395,531 34,639,403
Loan FundsSecured Loans 3 28,633,707 39,598,760Unsecured Loans 4 19,329,201 10,344,149
Deferred Tax Liability 1,890,459 1,009,011(Refer Note 12 on Schedule 22 and 31 on Schedule 23)
Total 123,308,951 104,152,212APPLICATION OF FUNDSFixed Assets 5
Gross Block 179,517,371 132,406,305Less: Depreciation 49,448,600 34,756,448
Net Block 130,068,771 97,649,857Capital Work in Progress 23,412,498 9,944,602
153,481,269 107,594,459Preoperative Expenditure pending allocation 6 – –
153,481,269 107,594,459Investments 7 7,196,981 9,318,953Current Assets, Loans and Advances
Inventories 8 177,444 315,838Sundry Debtors 9 10,761,709 7,157,443Cash and Bank Balances 10 3,074,285 3,841,352Other Current Assets, Loans and Advances 11 15,529,497 10,676,095
29,542,935 21,990,728Less: Current Liabilities and Provisions 12
Current Liabilities 64,655,783 42,079,834Provisions 2,335,851 1,119,910
66,991,634 43,199,744Net Current Assets (37,448,699) (21,209,016)Miscellaneous Expenditure(to the extent not written off or adjusted) 13 79,400 583,483Profit and Loss Account – 7,864,333
Total 123,308,951 104,152,212Statement of Significant Accounting Policies 22Notes to Accounts 23
This is the Balance Sheet referred to The Schedules referred to above form an integral part of the Balance Sheet.in our report of even date.
For and on behalf of the Board
U. RAJEEV SUNIL BHARTI MITTAL AKHIL GUPTAPartner Chairman & Managing Director Joint Managing DirectorMembership No. F-87191For and on behalf ofPRICE WATERHOUSEChartered Accountants
DEVEN KHANNA VIJAYA SAMPATH SARVJIT SINGH DHILLONGroup Financial Controller Company Secretary Director (Finance & Business
Place : New Delhi Integration)Date : April 28, 2006
Balance Sheet as at March 31, 2006
85

Schedule For the year ended For the year endedParticulars No. March 31, 2006 March 31, 2005
(Rs. ‘000) (Rs. ‘000)
INCOMEService Revenue 111,572,637 78,301,809Sale of Goods 714,176 728,480Other Income 14 618,980 411,651
112,905,793 79,441,940EXPENDITURE
Access Charges 21,519,176 16,831,728Network Operating 15 11,408,836 6,800,472Cost of Sales of Goods 16 674,043 721,037Personnel 17 7,754,523 5,017,651Sales and Marketing 18 8,013,612 6,258,076Administrative and Others 19 11,953,078 6,241,379
Total Expenditure 61,323,268 41,870,343
Profit including other income and before Licence Fee,Finance Expenses/(Income) (Net), Depreciation, Amortisation,Pre-operative Expenditure, Charity and Donation and Taxation 51,582,525 37,571,597
Licence fee & Spectrum charges (revenue share) 10,796,745 7,631,456
Profit including other income and beforeFinance Expenses/(Income) (Net), Depreciation, Amortisation,Pre-operative Expenditure, Charity and Donation and Taxation 40,785,780 29,940,141
Finance Expense/(income) (net) 20 2,256,011 2,459,184Depreciation 14,323,385 10,193,626Amortisation 21 1,273,894 1,157,480Pre-operative Expenditure written off 6 – 455,952Charity and Donation 74,535 31,137
Profit Before Tax 22,857,955 15,642,762
Tax ExpensesCurrent Tax 1,665,243 86,072(Net of write back for earlier years’ Rs. 351 thousand;Previous Year Rs. 914,501 thousand)(Inclusive of Provision for earlier years Rs. 72,820 Thousand;Previous year Rs. (914,501) Thousand)Deferred Tax expense (Refer Note 12 on Schedule 22 and 31 881,447 3,449,951on Schedule 23)Fringe Benefit Tax 190,471 –
Profit After Tax 20,120,794 12,106,739Transferred to/(from) Debenture Redemption Reserve (2,307,348) 2,478,854
22,428,142 9,627,885Profit/(Loss) brought forward (7,864,333) 8,031
Losses acquired under the scheme of amalgamation – (7,010,894)Difference of consideration and value of netassets acquired under the scheme of amalgamation – (10,489,355)
Profit/(Loss) carried forward to the Balance Sheet 14,563,809 (7,864,333)
Earnings per share (in Rs.) - Basic 10.6921 6.5323Earnings per share (in Rs.) - Diluted 10.6051 6.4444(Refer Note 17 on Schedule 22 and Note 30 on Schedule 23)Statement of Significant Accounting Policies 22Notes to Accounts 23
This is the Profit and Loss Account referred to The Schedules referred to above form an integral part of thein our report of even date. Profit and Loss Account.
For and on behalf of the Board
U. RAJEEV SUNIL BHARTI MITTAL AKHIL GUPTAPartner Chairman & Managing Director Joint Managing DirectorMembership No. F-87191For and on behalf ofPRICE WATERHOUSEChartered Accountants
DEVEN KHANNA VIJAYA SAMPATH SARVJIT SINGH DHILLONGroup Financial Controller Company Secretary Director (Finance & Business
Place : New Delhi Integration)Date : April 28, 2006
Profit and Loss Account for the year ended March 31, 2006
86

Cash Flow Statement for the year ended March 31, 2006
(Rs. ‘000)
Particulars For the year ended For the year endedMarch 31, 2006 March 31, 2005
A. Cash flow from operating activities:Net profit / (loss) before tax 22,857,955 15,642,762
Adjustments for:Depreciation 14,323,385 10,196,167Interest Expense 2,368,111 3,169,997Interest Income (169,656) (77,200)(Profit)/Loss on Fixed Assets sold (34,684) 3,896(Profit)/Loss on sale of Investments (106,786) (398,280)ESOP Expenditure written off 127,067 47,080Provision for Deferred Bonus 71,921 –Licence fee written off 1,146,827 1,110,400Debts/Advances Written off 1,301,308 168,297Provision for Bad and Doubtful Debts/Advances(Net of write back) 2,534,684 1,583,887Liability no longer required written back (176,761) –Provision for Gratuity and Leave Encashment 269,274 184,218Unrealized Foreign Exchange (gain) /loss 152,902 (26,685)Gain from swap arrangements (45,307) (211,415)Provision for Wealth Tax 15 22
Operating profit before working capital changes 44,620,255 31,393,146
Adjustments for changes in working capital :- (Increase)/Decrease in Sundry Debtors (5,535,291) (2,917,644)- (Increase)/Decrease in Other Receivables (6,480,746) 2,443,817- (Increase)/Decrease in Inventories 138,394 (115,671)- Increase/(Decrease) in Trade and Other Payables 14,893,742 1,834,610- Increase/(Decrease) in Security Deposit from Customers – –
Cash generated from operations 47,636,354 32,638,258
Taxes (Paid)/Received (2,164,334) (2,579,313)
Net cash from operating activities 45,472,020 30,058,945
B. Cash flow from Investing activities:Adjustments for changes in :
Purchase of Fixed Assets (52,516,784) (8,818,279)Proceeds from Sale of Fixed Assets 119,982 509,112Net Proceeds from Investments 71,831,468 66,365,086Purchase of Investments (69,445,786) (80,265,026)Licence fee paid for new circles – (50,000)Interest Received (Revenue) 165,506 45,337Advances Given to Subsidiary companies – (335,753)Acquisition on Subsidiaries/Joint Ventures (156,947) (753,487)
Net cash used in investing activities (50,002,561) (23,303,010)
87

(Rs. ‘000)
Particulars For the year ended For the year endedMarch 31, 2006 March 31, 2005
C. Cash flow from financing activities:Proceeds from long term borrowings
Receipts 23,725,487 11,119,681Payments (34,690,540) (13,114,483)FCCB issue expenses – (96,861)
Proceeds from short term borrowingsNet movement in cash credit facilities and short term loans 16,810,679 344,149Interest Paid (2,162,259) (2,694,794)Gain from swap arrangements 80,107 211,415
Net cash used in financing activities 3,763,474 (4,230,893)
Net Increase/(Decrease) in Cash and Cash Equivalents (767,067) 2,525,042Opening Cash and Cash Equivalents 3,841,352 1,333Cash and Cash Equivalents acquired on amalgamation – 1,314,977
Cash and cash equivalents as at March 31, 2006 3,074,285 3,841,352
Cash and cash equivalents comprise:Cash and Cheques in hand 820,236 740,730Balance with Scheduled Banks 2,254,049 3,100,622
Notes :1. Figures in brackets indicate cash outgo.2. Previous year figures have been regrouped and recast wherever necessary to conform to the current year classification.3. Cash and cash equivalents includes Rs.109,045 thousands pledged with various authorities (Previous year Rs.55,112
thousands) which are not available for use by the Company.
This is the Cash Flow Statement referred toin our report of even date.
For and on behalf of the Board
U. RAJEEV SUNIL BHARTI MITTAL AKHIL GUPTAPartner Chairman & Managing Director Joint Managing DirectorMembership No. F-87191For and on behalf ofPRICE WATERHOUSEChartered Accountants
DEVEN KHANNA VIJAYA SAMPATH SARVJIT SINGH DHILLONGroup Financial Controller Company Secretary Director (Finance & Business
Place : New Delhi Integration)Date : April 28, 2006
88

Schedules Annexed to and forming part of Accounts
As at As atParticulars March 31, 2006 March 31, 2005
(Rs. ‘000) (Rs. ‘000)
SCHEDULE : 1SHARE CAPITALAuthorised
2,500,000,000 (Previous Year 2,500,000,000)Equity Shares of Rs. 10 each 25,000,000 25,000,000
Issued, Subscribed and Paid up1,893,879,304 Equity Shares of Rs.10 each fully paid up 18,938,793 18,533,668(Previous year 1,853,366,767 Equity Shares of Rs.10 each)
Capital Suspense Account[Refer Note (4) below] – 27,221Notes:
1. Of the above 1,516,390,970 Equity Shares (Previous year 1,516,390,970)issued as fully paid up bonus shares out of Share Premium Account.
2. Of the above shares 20,088,445 (Previous year Nil) shares are allotted asfully paid up upon the conversion of OCRD without payment beingreceived in cash.
3. Of the above shares 17,701,967 (Previous year Nil) shares are allottedas fully paid up upon the conversion of FCCBs.
4. Of the above shares 2,722,125 (Previous year 2,722,125) shares areallotted as fully paid up under the scheme of amalgamation withoutpayments being received in cash. – 27,221
18,938,793 18,560,889SCHEDULE : 2RESERVES AND SURPLUSShare Premium
Opening balance 31,254,879 29,706,859Adjustment under the scheme of amalgamation – 1,548,020Additions during the year 7,499,667 –
38,754,546 31,254,879Revaluation Reserve 21,284 21,284
Debenture Redemption ReserveOpening balance 3,363,240 –Acquired under the scheme of amalgamation – 884,386Transfer from / (to) Profit and Loss Account during the year (2,307,348) 2,478,854
1,055,892 3,363,240Less:
Utilization during the period – –Difference of consideration and value of net assets acquired under ascheme of amalgamation – –
1,055,892 3,363,240Profit & Loss Account
Balance brought forward (7,864,333) –Acquired on acquisition – –Add: Profit / (Loss) during the period 20,120,794 –
12,256,461 –Less:
Adjustments:Difference of consideration and value of net assets acquired under ascheme of amalgamationAmount utilized for issue of shares to minority – –Pre-acquisition Loss adjusted against reserves – –Transferred to Debenture Redemption Reserve (Net) (2,307,348) –
Profit & Loss Account 14,563,809 –54,395,531 34,639,403
89

As at As atParticulars March 31, 2006 March 31, 2005
(Rs. ‘000) (Rs. ‘000)
SCHEDULE : 3SECURED LOANS(Refer Note 17 on Schedule 23)Debentures 3,132,500 4,672,857
Loans and Advances from Banks :– Term Loan 675,000 3,578,245
Others Loans and Advances :– Term Loans 24,809,896 31,333,530– Vehicle Loans 16,311 14,128
28,633,707 39,598,760
Note : Amount repayable within one year 3,710,888 6,015,731
SCHEDULE : 4UNSECURED LOANSShort Term Loans and Advances
From Banks 18,424,572 1,560,389From Others – 3,750,000
Other Loans and AdvancesFrom Parties - Other than Financial Institutions 904,629 5,033,760
19,329,201 10,344,149
Note : Amount repayable within one year 18,426,116 5,310,388
90

SCH
EDU
LE 5
:FI
XED
ASS
ETS
(Ref
er N
otes
2, 3
, 8, 1
4 an
d 15
on
Sche
dule
22
)(R
s. ‘0
00)
Gro
ss B
lock
Val
ue
Dep
reci
atio
n/
Am
ort
isat
ion
Net
Blo
ck V
alu
e
As
atA
dditi
ons
Sa
le/
As
at
A
s at
For t
he S
ale/
As
atA
s at
As
atPA
RTIC
ULA
RSA
pril
01,
durin
gA
djus
tmen
tM
arch
31,
Apr
il 01
,ye
arA
djus
tmen
tM
arch
31,
Mar
ch 3
1,M
arch
31,
2005
the
year
durin
g20
0620
05du
ring
2006
2006
2005
the
year
the
year
INTA
NG
IBLE
ASS
ETS
Soft
war
e83
,993
––
83,9
9352
,059
19,8
70–
71,9
2912
,064
31,9
34Ba
ndw
idth
2,04
2,99
730
5,74
915
,027
2,33
3,71
920
9,70
018
4,14
215
,027
378,
815
1,95
4,90
41,
833,
297
Lice
nces
21,1
41,5
21–
–21
,141
,521
5,83
5,67
01,
146,
827
–6,
982,
497
14,1
59,0
2415
,305
,851
TAN
GIB
LE A
SSET
SLe
aseh
old
Land
44,4
1410
,885
–55
,299
2,28
947
1–
2,76
052
,539
42,1
25Fr
eeho
ld L
and
328,
975
63,4
248,
400
383,
999
––
––
383,
999
328,
975
Build
ing
1,36
6,31
316
9,19
271
,221
1,46
4,28
428
9,77
669
,146
6,66
135
2,26
11,
112,
023
1,07
6,53
7Le
aseh
old
Impr
ovem
ents
686,
812
412,
538
–1,
099,
350
219,
185
119,
779
–33
8,96
476
0,38
646
7,62
7Pl
ant &
Mac
hine
ry97
,852
,219
45,1
91,2
401,
603,
937
141,
439,
522
22,8
53,0
6511
,562
,600
664,
295
33,7
51,3
7010
7,68
8,15
274
,999
,154
Com
pute
rs7,
715,
462
2,32
9,96
170
,737
9,97
4,68
64,
572,
703
2,13
8,06
155
,946
6,65
4,81
83,
319,
868
3,14
2,75
9O
ffic
e Eq
uipm
ent
651,
782
242,
359
6,86
188
7,28
041
7,81
812
9,70
68,
130
539,
394
347,
886
233,
964
Furn
iture
& F
ixtu
re40
7,99
215
5,00
622
,876
540,
122
260,
337
82,4
6622
,876
319,
927
220,
195
147,
655
Veh
icle
s78
,439
40,3
7210
,601
108,
210
42,2
1416
,815
5,12
553
,904
54,3
0636
,225
Veh
icle
on
Fina
nce
Leas
e5,
386
––
5,38
61,
632
329
–1,
961
3,42
53,
754
TOTA
L13
2,40
6,30
548
,920
,726
1,80
9,66
017
9,51
7,37
134
,756
,448
15,4
70,2
1277
8,06
049
,448
,600
130,
068,
771
97,6
49,8
57
Capi
tal W
ork-
in-P
rogr
ess
––
––
––
––
23,4
12,4
989,
944,
602
GRA
ND
TO
TAL
132,
406,
305
48,9
20,7
261,
809,
660
179,
517,
371
34,7
56,4
4815
,470
,212
778,
060
49,4
48,6
0015
3,48
1,26
910
7,59
4,45
9
Prev
ious
Yea
r10
0,72
8,71
032
,857
,954
1,18
0,35
913
2,40
6,30
524
,117
,233
11,3
06,5
6766
7,35
234
,756
,448
97,6
49,8
57
Not
es:
1.Ca
pita
l Wor
k-in
-Pro
gres
s in
clud
es:
(a)
Capi
tal a
dvan
ces
of R
s.1,
026,
633
thou
sand
(Pre
viou
s ye
ar R
s. 5
40,3
26 th
ousa
nd).
(b)
Borr
owin
g co
st o
f Rs.
Nil
(Pre
viou
s ye
ar R
s.11
,912
thou
sand
).2.
Add
ition
to fi
xed
asse
ts d
urin
g th
e ye
ar in
clud
e:(a
)Rs
. 178
,859
thou
sand
of L
oss
(Pre
viou
s ye
ar lo
ss o
f Rs.
9,7
73 th
ousa
nd) o
n ac
coun
t of f
luct
uatio
ns in
fore
ign
exch
ange
rate
s.(b
)Bo
rrow
ing
cost
s ca
pita
lised
Rs.
31,
132
thou
sand
(Pre
viou
s ye
ar R
s.13
,207
thou
sand
).3.
Leas
e ho
ld la
nd o
f Rs.
955
thou
sand
(Pre
viou
s ye
ar R
s.95
5 th
ousa
nd) r
epre
sent
s la
nd a
cqui
red
on le
ase
cum
sal
e ba
sis
from
Kar
nata
ka In
dust
rial A
reas
Dev
elop
men
t Boa
rd.
4.Ca
pita
l Wor
k-in
-Pro
gres
s as
on
Mar
ch 3
1, 2
006
is n
et o
f Rs.
89,
785
thou
sand
bei
ng lo
ss (P
revi
ous
year
incl
udes
Rs.
142
,382
thou
sand
gai
n) o
n ac
coun
t of f
luct
uatio
n in
Exc
hang
e ra
te.
5.A
dditi
ons
durin
g th
e ye
ar in
clud
es R
s. N
il th
ousa
nd (P
revi
ous
year
Rs.
140
,418
thou
sand
) allo
cate
d fr
om p
re-o
pera
tive
expe
nditu
re. (
Refe
r Sch
edul
e 6)
.6.
Free
hold
Lan
d an
d Bu
ildin
g in
clud
es R
s. 2
6,46
8 th
ousa
nd (P
revi
ous y
ear R
s. 2
6,46
8 th
ousa
nd) a
nd R
s. 7
1,47
7 th
ousa
nd (p
revi
ous y
ear R
s. 7
1,47
7 th
ousa
nd) r
espe
ctiv
ely,
in re
spec
t of w
hich
regi
stra
tion
of ti
tle in
favo
ur o
f gro
up is
pen
ding
.7.
The
rem
aini
ng a
mor
tisa
tion
per
iod
of li
cenc
e fe
es a
s at
Mar
ch 3
1, 2
006
rang
es b
etw
een
8 to
19
year
s fo
r Uni
fied
Acc
ess
Serv
ice
Lice
nce
and
14 to
16
year
s fo
r Lon
g D
ista
nce.
8.Ca
pita
l Wor
k-in
-Pro
gres
s in
clud
es g
oods
in tr
ansi
t Rs.
4,1
16,1
63 th
ousa
nd (P
revi
ous
year
Rs.
960
,717
thou
sand
).9.
Com
pute
rs in
clud
e G
ross
Blo
ck o
f ass
ets
capi
talis
ed d
urin
g th
e ye
ar u
nder
fina
nce
leas
e Rs
.3,4
26,5
44 th
ousa
nd (P
revi
ous
year
Rs.
1,87
9,71
6 th
ousa
nd a
nd d
epre
ciat
ion
char
ged
for t
heye
ar R
s.1,
576,
976
thou
sand
(Pre
viou
s ye
ar R
s.52
9,23
2 th
ousa
nd),
Net
boo
k va
lue
Rs. 1
,849
,566
thou
sand
.
91

As at As atParticulars March 31, 2006 March 31, 2005
(Rs. ‘000) (Rs. ‘000)
SCHEDULE : 6PRE-OPERATIVE EXPENDITURE PENDING ALLOCATION(Refer Note 10 on Schedule 22)Opening Balance
Acquired under the schemes of amalgamation – 5,891Additions during the periodNetwork Operating Expenses
Insurance Premium – 1,007Repairs and Maintenance – 26,388Power & Fuel – 19,454Rent – 25,999Leased Line – 12,914Others – 29,343
Sub-Total – 115,105
Personnel ExpensesSalaries – 161,053Contribution to Provident & Other Funds – 5,172Staff Welfare – 11,056Recruitment & Training – 29,282
Sub-Total – 206,563
Selling ExpensesAdvertisement & Marketing – 94,306Other selling & distribution – 15,143
Sub-Total – 109,449
Administrative & Other ExpensesLegal & Professional – 19,224Rates and Taxes – 10,392Power and Fuel – 4,614Travelling and Conveyance – 56,009Rent – 13,982Repairs and Maintenance – Buildings – 94
– Plant and Machinery – 86– Others – 13,610
Insurance – 576Miscellaneous – 32,175Collection and Recovery – 1,245Charity & Donation – –
Sub-Total – 152,007
Finance ExpensesOther Bank/Finance Charges – 4,814
Depreciation – 2,541
Total – 596,370
Less: Allocated to Fixed Assets – 140,418Less: Transferred to Profit & Loss Account – 455,952
– –Total amount carried to Balance Sheet – –
92

As at As atParticulars March 31, 2006 March 31, 2005
(Rs. ‘000) (Rs. ‘000)
SCHEDULE : 7
INVESTMENTS
(Refer Note 6 on Schedule 22 and Note 25 on Schedule 23)
Current
Other than Trade (Quoted)
– Government securities 475,421 1,035,840
– Mutual Funds, Debentures and Bonds 1,956,326 3,674,826
Other than Trade (Unquoted)
– Government securities 1,800 1,800
2,433,547 4,712,466
Long Term Investments : Trade (Unquoted)
Investment in Subsidiaries
Bharti Hexacom Limited: 122,751,980 (Previous year 122,751,980)
Equity shares of Rs.10/- each fully paid up. 4,332,748 4,332,748
Bharti Comtel Limited: 100,000 (Previous year 100,000)
Equity shares of Rs.10/- each fully paid up. 1,000 1,000
Satcom Broadband Equipment Limited: 24,859,200
(Previous year 12,678,192) Equity shares of Rs.10/- each fully paid up. 248,973 126,976
Bharti Aquanet Limited 1,275,000 (Previous year 1,275,000)
Equity shares of Rs.10/- each fully paid up. 102,000 102,000
Investment in Joint Ventures
Bridge Mobile PTE Limited: 1,000,000 (Previous year 1,000,000)
Equity shares of USD 1 each fully paid up. 43,763 43,763
Forum I Aviation Ltd. Equity Share of 9,95,000 of Rs.10 each. 34,950 –
4,763,434 4,606,487
7,196,981 9,318,953
Aggregate Market Value of Quoted Investments 2,439,862 4,727,055
Aggregate amount of Quoted Investments 2,431,747 4,710,666
Aggregate amount of Unquoted Investments 4,765,234 4,608,287
SCHEDULE : 8
INVENTORY
(Refer Note 5 on Schedule 22)
Stock-In-Trade 177,444 315,838
177,444 315,838
93

As at As atParticulars March 31, 2006 March 31, 2005
(Rs. ‘000) (Rs. ‘000)
SCHEDULE : 9SUNDRY DEBTORS(Refer Note 4 on Schedule 22 and Note 14 on Schedule 23)(Unsecured, considered good unless otherwise stated)
Billing Debtors :– Debts outstanding for a period exceeding six months– Considered good 1,403,976 833,659– Considered doubtful 3,438,771 3,290,974
Less : Provision for doubtful debts (3,438,771) 1,403,976 (3,290,974) 833,659
Other debts– Considered good 9,357,733 6,323,784– Considered doubtful 1,299,548 874,422
Less : Provision for doubtful debts (1,299,548) 9,357,733 (874,422) 6,323,784
10,761,709 7,157,443
SCHEDULE : 10CASH AND BANK BALANCESCash in Hand 61,085 41,260Cheques in Hand 759,151 699,470Balances with Scheduled Banks
– in Current Account 1,197,913 1,008,879– in Fixed deposits * 1,055,049 2,090,973– in Deposit Account as Margin Money 1,087 770
3,074,285 3,841,352[Includes Rs.109,045 thousand pledged with variousauthorities (Previous year Rs.55,112 thousand)]
SCHEDULE : 11OTHER CURRENT ASSETS, LOANS AND ADVANCES(Unsecured, considered good unless otherwise stated)
Interest Accrued on Investment 37,776 33,626Advances and Loans to Subsidiary Companies :
Bharti Comtel Limited 447,523 182,718Bharti Hexacom Limited 317,533 23,435Bharti Broadband Limited(formerly Comsat Max Limited) 412,331 1,177,387 129,905 336,058
Advances Recoverable in cash or in kind orfor value to be received
Considered good 9,514,753 6,702,289Considered doubtful 2,369,135 407,374Less: Provision (2,369,135) 9,514,753 (407,374) 6,702,289
Accrued Billing Revenue 3,469,604 2,675,433Advance to ESOP Trust 195,906 251,519Advance Tax (Net of provision for tax Rs. 3,038,518 thousand), 980,374 671,754(Previous Year Rs. 1,373,275 thousand)Balance with Custom Authorities 153,697 5,416
15,529,497 10,676,095
94

As at As atParticulars March 31, 2006 March 31, 2005
(Rs. ‘000) (Rs. ‘000)
SCHEDULE : 12CURRENT LIABILITIES AND PROVISIONSCurrent Liabilities
Sundry Creditors :Total outstanding dues of Small Scale IndustrialUndertaking (s)* (Refer Note 23 on Schedule 23) 6,613 4,186Total outstanding dues of Creditors other thanSmall Scale Industrial Undertaking (s)* 44,440,883 44,447,496 29,019,526 29,023,712
Advance Billing and Prepaid Card Revenue 14,150,174 7,648,023Premium on Redemption of Bonds(Refer Note 11 on Schedule 23) 75,952 595,564Interest accrued but not due 519,709 403,957Other Liabilities 2,110,193 1,138,226Advance Received from customers 589,655 684,479Security Deposits (Refer Note 14 on Schedule 23) 2,762,604 2,585,873
* This information has been compiled in respect ofparties to the extent they could be identified asSmall Scale and ancilliary undertakings on the basisof information available with the Company.
64,655,783 42,079,834Provisions(Refer Note 19 on Schedule 22 and Note 26 on Schedule 23)
Gratuity 244,008 77,017Leave Encashment 231,510 129,227Provision for Wealth Tax 164 149Provision for Fringe Benefit Tax (Net of payments ofRs. 10,246 thousand, Previous year Rs. Nil) 19,765 –Other Provisions 1,840,404 913,517
2,335,851 1,119,910
66,991,634 43,199,744SCHEDULE : 13MISCELLANEOUS EXPENDITURE(To the extent not written off or adjusted)(Refer Note 13 on Schedule 22 and Note 32 on Schedule 23)
Deferred Employee Compensation Expense*Opening Balance 13,372 13,035Acquired under the scheme of amalgamation – 62,137Add: Addition/(Adjustments) during the year (4,118) (14,720)Less: Amortisation for the year** 5,806 47,080
3,448 13,372
* Relating to Employee Stock Option Plan 2001 and 2004** Net of stock compensation income of Rs. 3,777 thousand
Premium on Redemption of DebenturesOpening Balance 570,111 –Add : Addition/(writeback) during the year (404,059) 693,027Less : Amortisation for the year 90,100 122,916
75,952 570,111
79,400 583,483
95

For the year ended For the year endedParticulars March 31, 2006 March 31, 2005
(Rs. ‘000) (Rs. ‘000)
SCHEDULE : 14
OTHER INCOME
Liabilities/Provisions no longer required written back 176,761 222,313
Profit on Sale of Assets (Net) 34,684 –
Miscellaneous 407,535 189,338
618,980 411,651
SCHEDULE : 15
NETWORK OPERATING EXPENDITURE
Interconnect charges and PSTN Rentals 1,454,270 640,248
Power and Fuel 2,989,626 1,440,779
Rent 1,669,731 968,576
Insurance 32,053 36,262
Repairs and Maintenance – Building 406,842 138,796
– Plant and Machinery 3,033,254 1,908,587
– Others 325,539 144,436
Leased Line and Gateway charges 685,067 712,486
Other Network Operating Expenses 812,454 810,302
11,408,836 6,800,472
SCHEDULE : 16
COST OF SALES OF GOODS
Opening Stock 315,838 –
Acquired under the schemes of amalgamation – 200,167
Add : Purchases 738,540 1,089,152
Less : Simcard Utilisation 194,347 252,144
Less : Internal issues / capitalised 8,544 300
Less : Closing Stock 177,444 315,838
674,043 721,037
SCHEDULE : 17
PERSONNEL EXPENDITURE
Salaries, Wages and Bonus * 6,568,218 4,268,536
Contribution to Provident and Other Funds 362,881 188,074
Staff Welfare 410,856 278,655
Recruitment and Training 412,568 282,386
7,754,523 5,017,651
* Excluding amortisation of Deferred ESOP cost
SCHEDULE : 18
SALES AND MARKETING EXPENDITURE
Advertisement and Marketing 4,003,273 3,255,973
Sales Commission and Incentive 2,689,470 1,883,503
Simcard Utilisation 194,347 252,144
Other Selling and Distribution Expenses 1,126,522 866,456
8,013,612 6,258,076
96

For the year ended For the year endedParticulars March 31, 2006 March 31, 2005
(Rs. ‘000) (Rs. ‘000)
SCHEDULE : 19ADMINISTRATIVE AND OTHER EXPENDITURELegal and Professional 3,776,442 1,525,973Rates and Taxes 41,192 27,740Power and Fuel 269,799 166,946Travelling and Conveyance 735,123 458,245Rent 405,117 219,086Repairs and Maintenance – Building 85,029 68,660
– Plant and Machinery 69,325 22,890– Others 168,794 39,507
Insurance 14,465 11,892Bad debts written off 1,301,308 168,297Provision for doubtful debts/advances 2,594,939 1,681,613Less : Provision for doubtful debts written back 60,255 2,534,684 97,726 1,583,887
Collection and Recovery Expenses 1,312,735 908,360Loss on sale of assets (net) – 3,896Miscellaneous Expenses 1,239,065 1,036,000
11,953,078 6,241,379
SCHEDULE : 20FINANCE EXPENSES/(INCOME) (Net)Interest :
– On Term Loan 1,540,231 1,849,100– On Debentures 283,995 664,911– On Others 59,396 143,643
Amortisation of Premium on Redemption ofForeign Currency Convertible Bonds 90,100 122,916Other Finance Charges 394,389 389,427
2,368,111 3,169,997Less : IncomeProfit on sale of Current Investments 106,786 398,280Interest Income :
– from Current Investments Other than Trade[Gross of TDS Rs. 20,949 thousand; Previous yearRs. 831 thousand] 153,270 72,275
– from loans and advances etc. 16,386 2,214
Exchange Fluctuation Gain/(Loss) (Net) (209,649) 23,918Gains from swap arrangements 45,307 211,415Other Finance Income – 2,711
112,100 710,813
2,256,011 2,459,184
SCHEDULE : 21AMORTISATION(Refer Note 3 and 13 on Schedule 22)Amortisation of Licence Fee 1,146,827 1,110,400Personnel – Deferred ESOP Cost 127,067 47,080
1,273,894 1,157,480
97

SCHEDULE: 22
STATEMENT OF SIGNIFICANT ACCOUNTING POLICIES
1. BASIS OF PREPARATION
These financial statements have been prepared under the historical cost convention on the accrual basis of accounting,
in accordance with the generally accepted accounting principles in India and the provisions of the Companies Act, 1956
as adopted consistently by the Company.
2. FIXED ASSETS
Fixed Assets are stated at cost of acquisition and subsequent improvements thereto, including taxes, duties, freight and
other incidental expenses related to acquisition and installation. Capital work-in-progress is stated at cost.
Site restoration cost obligations are capitalized when it is probable that an outflow of resources will be required to settle
the obligation and a reliable estimate of the amount can be made.
The fixed component of license fee payable by the Company for cellular and basic circles, upon migration to the National
Telecom Policy (NTP 1999), i.e. Entry Fee, has been capitalised as an asset and the one time license fee paid by the
Company for acquiring new licences (post NTP-99) has been capitalised as an asset.
3. DEPRECIATION / AMORTISATION
Depreciation is provided on straight-line method at the rates and in the manner prescribed in Schedule XIV to the
Companies Act, 1956 on all assets, except for the following on which depreciation is provided on straight line method
to write off the cost of the fixed assets over their estimated useful lives as below:
Rate of Depreciation per annum
Building 5%
Building on Leased Land 5%
Office Equipment 20.00% / 50.00%
Computer / Software 33.33%
Vehicles 20.00%
Furniture and Fixtures 20.00%
Plant & Machinery 6.67% / 10.00% / 50.00%
Leasehold Land Period of lease
Leasehold Improvements Period of lease or 10 years whichever is less
Assets individually costing Rs. 5 thousand or less are fully depreciated in the month of purchase. Software up to Rs. 500
thousand is written off in the year of purchase.
Bandwidth capacity is depreciated over the period of the agreement subject to a maximum of 15 years.
Additional depreciation is provided as appropriate, towards diminution in value of assets.
The Entry Fee capitalised is being amortised equally over the period of the license and the one time licence fee is being
amortised equally over the balance period of licence from the date of commencement of commercial operations.
The site restoration cost obligation capitalized is being depreciated over the period of the useful life of the related asset.
4. REVENUE RECOGNITION AND RECEIVABLES
Mobile Services: Service revenue is recognised on completion of provision of services. Service revenue includes income
on roaming commission and access charges passed on to other operators, and is net of discounts and waivers. Revenue,
net of discount, from sale of goods is recognised on transfer of all significant risks and rewards to the customer and when
no significant uncertainty exists regarding realisation of the consideration.
On introduction of new prepaid products, processing fees on recharge coupon is being recognised over the estimated
customer relationship period or coupon validity period, as applicable.
98

Telephone and Broadband and Long Distance Services: Service revenue is recognised on completion of provision of
services. Revenue on account of bandwidth service is recognised on time proportion basis in accordance with the related
contracts. Billing Revenue includes access charges passed on to other operators, and is net of discounts and waivers.
Revenue, net of discount, from sale of goods is recognised on transfer of all significant risks and rewards to the customer
and when no significant uncertainty exists regarding realisation of consideration.
Enterprise Services: Revenue, net of discount, from sale of goods is recognised on transfer of all significant risks and
rewards to the customer and when no significant uncertainty exists regarding realisation of consideration.
Service Revenues includes revenues from registration, installation and provision of Internet and Satellite services.
Registration fees is recognised at the time of dispatch and invoicing of Start up Kits. Installation charges are recognised
as revenue on satisfactory completion of installation of hardware and service revenue is recognised from the date of
satisfactory installation of equipment and software at the customer site and provisioning of Internet and Satellite
services.
Revenue from prepaid dialup packs is recognised on the actual usage basis and is net of sales return and discount.
Investing and other Activities: Income on account of interest and other activities are recognised on an accrual basis.
Dividends are accounted for when the right to receive the payment is established.
Provision for doubtful debts: Provision for doubtful debts is made for dues outstanding for more than 90 days in case
of active subscribers, and dues from customers who have been deactivated other than those covered by security deposit,
or in specific cases where management is of the view that the amounts are recoverable.
Provision for doubtful debts, in case of Other Telecom Operators on account of their ILD traffic and on account of
Interconnect Usage Charges (IUC), is made for dues outstanding more than 120 days from the date of billing after
considering any amount payable to that operator pertaining to the same period or in specific case when management is
of the view that the amount is recoverable.
Accrued Billing revenue: Accrued billing revenue represent revenues recognized in respect of Mobile, Broadband and
Telephone, and Long Distance services provided from the bill cycle date to the end of each month. These are billed in
subsequent periods as per the terms of the billing plans.
5. INVENTORIES
Inventories for mobile operations are valued at the lower of cost and net realisable value. Cost is determined on First in
First out basis.
Inventories for telephone and broadband and long distance services and enterprise services are valued at the lower of
cost and net realisable value. Cost is determined on a weighted average basis.
6. INVESTMENT
Current Investments are valued at lower of cost and fair market value.
Long term Investments are valued at cost. Provision is made for diminution in value to recognise a decline, if any, other
than that of temporary nature.
7. LICENSE FEES – REVENUE SHARE
With effect from August 1, 1999 the variable Licence fee computed at prescribed rates of revenue share is being charged
to the Profit and Loss Account in the year in which the related revenue arises. Revenue for this purpose comprises
adjusted gross revenue as per the license agreement of the license area to which the licence pertains.
8. TRANSLATION OF ITEMS IN FOREIGN CURRENCY
Transactions in Foreign Currency are recorded at the exchange rate prevailing at the date of the transaction. Monetary
items are restated at year-end foreign exchange rates. Resultant exchange differences arising on payment or conversion
of liabilities are recognised as income or expense in the year in which they arise except in respect of liabilities for
acquisition of fixed assets, where such exchange difference is adjusted in the carrying cost of the respective fixed asset.
Gain or loss on forward exchange contract, not in the nature of hedge, is calculated based on difference between
forward rate available at the reporting date for the remaining maturity of the contract (or forward rate last used to
measure gain or loss) and the contracted forward rate which is recognized as income or expense for the year.
99

The premium or discount arising at the inception of other forward exchange contracts is amortized as income or expense
over the life of the contract and exchange difference on such contracts is recognised as income or expense in the
reporting period in which the exchange rate change, except, in respect of liabilities incurred for acquiring fixed assets, in
which case, such difference is adjusted in carrying amount of the respective fixed assets.
9. RETIREMENT BENEFITS
Contribution to provident fund is made at predetermined rates and is charged to Profit and Loss Account. The Company
has provided for the liability at year end on account of unavailed earned leave as per the actuarial valuation as per the
Projected Unit Credit Method.
The Company either contributes to a Company Gratuity Scheme with Life Insurance Corporation of India to cover the
gratuity liability for its employees, such contribution being charged to the Profit and Loss Account for the year or
provides the gratuity liability in its books. Liability at the year-end in both cases is determined on the basis of actuarial
valuation, based on the Projected Unit Credit Method.
10. PRE-OPERATIVE EXPENDITURE
Expenditure incurred by the Company from the date of acquisition of license for a new circle, up to the date of
commencement of commercial operations of the circle, not directly attributable to fixed assets are charged to the Profit
and Loss Account in the year in which such expenditure is incurred.
11. LEASES
a) As Lessee – Operating Lease
Lease Rentals in respect of assets taken on ‘Operating Lease’ are charged to the Profit and Loss Account on a straight-
line basis over the lease term.
b) As Lessee – Finance Lease
Assets acquired on ‘Finance Lease’ which transfer risk and rewards of ownership to the Company are capitalized as
assets by the Company at the lower of fair value of the leased property or the present value of the related lease
payments or where applicable, estimated fair value of such assets.
Amortization of capitalised leased assets is computed on the Straight Line method over the useful life of the assets.
Lease rental payable is apportioned between principal and finance charge using the internal rate of return method.
The finance charge is allocated over the lease term so as to produce a constant periodic rate of interest on the
remaining balance of liability.
c) As Lessor – Operating Lease
Lease income in respect of ‘Operating Lease’ is recognised in the Profit and Loss Account on a straight-line basis over
the lease term.
d) As Lessor – Finance Lease
Finance leases as a dealer lessor are recognized as a sale transaction in the Profit and Loss Account and are treated
like other outright sales.
Finance Income is recognized based on a pattern reflecting a constant periodic rate of return on the net investment
of the lessor outstanding in respect of the lease.
e) Initial direct costs are expensed in the Profit and Loss Account at the inception of the lease.
12. TAXATION
Tax expense for the year, comprising current tax, deferred tax and Fringe Benefit Tax is included in determining the net
profit/(loss) for the year.
Deferred tax assets are recognised for all deductible timing differences and carried forward to the extent there is
reasonable certainty that sufficient future taxable profit will be available against which such deferred tax assets can
be realised.
100

Deferred tax assets to the extent they pertain to brought forward losses and unabsorbed depreciation, are recognised
only to the extent that there is virtual certainty of realisation, based on expected profitability in the future as estimated by
the Company.
Deferred tax assets and liabilities are measured at the tax rates that have been enacted or substantively enacted by the
balance sheet date.
13. MISCELLANEOUS EXPENDITURE
a) Premium on redemption of debentures is recognised as an expense to the Profit and Loss Account over the period
of the related contract.
b) Employee Stock Option Plan 2001 and 2004 (‘ESOP’) - The aggregate amount of liability on account of ESOP as
ascertained at year-end is being carried forward as Deferred Employee Compensation Benefit under Miscellaneous
Expenditure to be written off on a straight-line basis over the related vesting period of individual options.
14. BORROWING COST
Borrowing cost attributable to the acquisition or construction of a qualifying asset is capitalised as part of the cost of that
asset. Other borrowing costs are recognised as an expense in the period in which they are incurred.
15. IMPAIRMENT OF ASSETS
Assets that are subject to amortization are reviewed for impairment whenever events or changes in circumstances
indicate that the carrying amount may not be recoverable. An impairment loss is recognized for the amount by which
the assets’ carrying amount exceeds its recoverable amount. The recoverable amount is the higher of the assets fair value
less costs to sell and value in use.
For the purpose of assessing impairment, assets are grouped at the lowest levels for which there are separately identifiable
cash flows (cash generating units).
16. SEGMENTAL REPORTING
a) Primary Segment:
The Company operates in four primary business segments viz. Broadband & Telephone Services, Mobile Services,
Long Distance Services and Enterprise Service.
b) Secondary Segment:
The Company has operations within India as well as with entities located in other countries. The operations in India
constitute the major part, which is the only reportable segment, the remaining portion being attributable to others.
17. EARNING PER SHARE
The earnings considered in ascertaining the Company’s Earnings per Share (‘EPS’) comprise the net profit after tax. The
number of shares used in computing basic EPS is the weighted average number of shares outstanding during the year.
The diluted EPS is calculated on the same basis as basic EPS, after adjusting for the effects of potential dilutive equity
shares.
18. WARRANTY
Provision for warranty is based on past experience and technical estimates.
19. PROVISIONS
Provisions are recognised when the Company has a present obligation as a result of past events; it is more likely than not
that an outflow of resources will be required to settle the obligation; and the amount has been reliably estimated.
20. EMPLOYEE STOCK OPTIONS OUTSTANDING
Employee Stock options outstanding are valued using Black Scholes option – pricing model and the fair value is recognised
as an expense over the period in which the options vest.
101
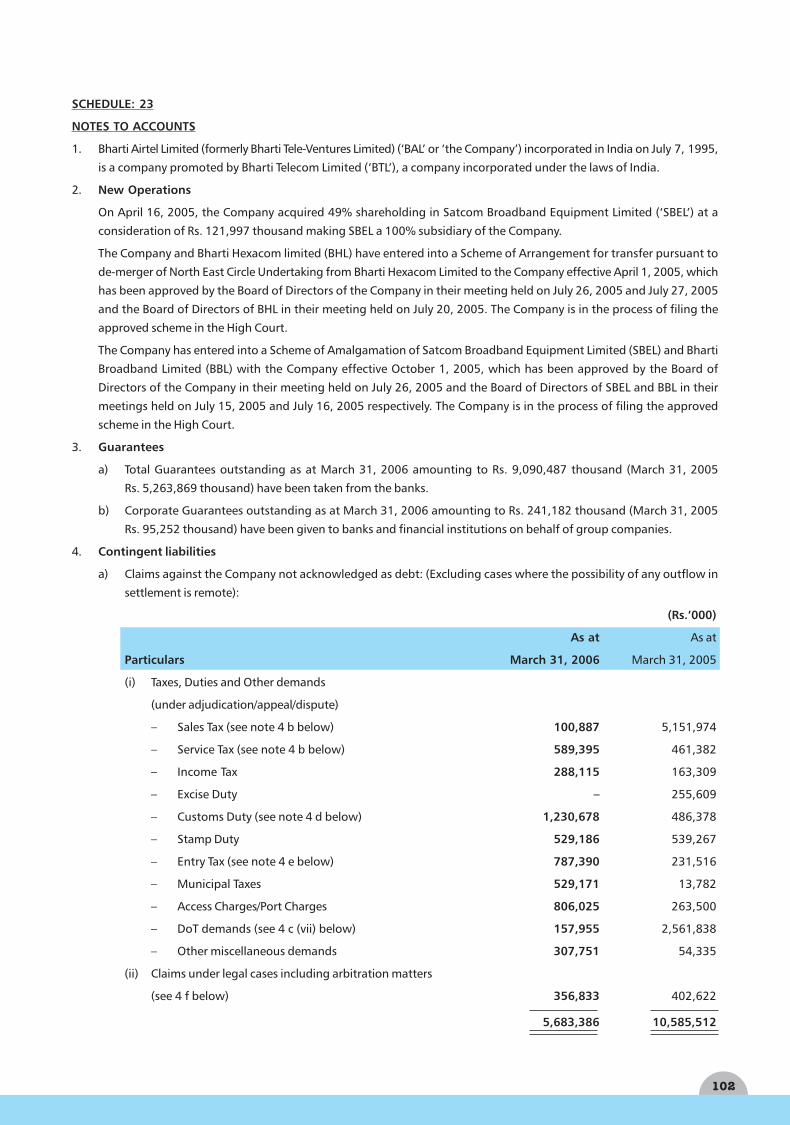
SCHEDULE: 23
NOTES TO ACCOUNTS
1. Bharti Airtel Limited (formerly Bharti Tele-Ventures Limited) (‘BAL’ or ‘the Company’) incorporated in India on July 7, 1995,
is a company promoted by Bharti Telecom Limited (‘BTL’), a company incorporated under the laws of India.
2. New Operations
On April 16, 2005, the Company acquired 49% shareholding in Satcom Broadband Equipment Limited (‘SBEL’) at a
consideration of Rs. 121,997 thousand making SBEL a 100% subsidiary of the Company.
The Company and Bharti Hexacom limited (BHL) have entered into a Scheme of Arrangement for transfer pursuant to
de-merger of North East Circle Undertaking from Bharti Hexacom Limited to the Company effective April 1, 2005, which
has been approved by the Board of Directors of the Company in their meeting held on July 26, 2005 and July 27, 2005
and the Board of Directors of BHL in their meeting held on July 20, 2005. The Company is in the process of filing the
approved scheme in the High Court.
The Company has entered into a Scheme of Amalgamation of Satcom Broadband Equipment Limited (SBEL) and Bharti
Broadband Limited (BBL) with the Company effective October 1, 2005, which has been approved by the Board of
Directors of the Company in their meeting held on July 26, 2005 and the Board of Directors of SBEL and BBL in their
meetings held on July 15, 2005 and July 16, 2005 respectively. The Company is in the process of filing the approved
scheme in the High Court.
3. Guarantees
a) Total Guarantees outstanding as at March 31, 2006 amounting to Rs. 9,090,487 thousand (March 31, 2005
Rs. 5,263,869 thousand) have been taken from the banks.
b) Corporate Guarantees outstanding as at March 31, 2006 amounting to Rs. 241,182 thousand (March 31, 2005
Rs. 95,252 thousand) have been given to banks and financial institutions on behalf of group companies.
4. Contingent liabilities
a) Claims against the Company not acknowledged as debt: (Excluding cases where the possibility of any outflow in
settlement is remote):
(Rs.’000)
As at As at
Particulars March 31, 2006 March 31, 2005
(i) Taxes, Duties and Other demands
(under adjudication/appeal/dispute)
– Sales Tax (see note 4 b below) 100,887 5,151,974
– Service Tax (see note 4 b below) 589,395 461,382
– Income Tax 288,115 163,309
– Excise Duty – 255,609
– Customs Duty (see note 4 d below) 1,230,678 486,378
– Stamp Duty 529,186 539,267
– Entry Tax (see note 4 e below) 787,390 231,516
– Municipal Taxes 529,171 13,782
– Access Charges/Port Charges 806,025 263,500
– DoT demands (see 4 c (vii) below) 157,955 2,561,838
– Other miscellaneous demands 307,751 54,335
(ii) Claims under legal cases including arbitration matters
(see 4 f below) 356,833 402,622
5,683,386 10,585,512
102

Of the above details of unpaid amounts together with forum where dispute is pending as at March 31, 2006 is set out.
Name of the Statute Nature of Amounts Amount Period to Forum when the disputethe Dues disputed disputed which it is pending
(Rs. ‘000) (Rs. ‘000) Relates
Kerala General Sales Tax Act,1963 Sales Tax 548 548 2003-04 Supreme Court
CST/UP Trade Tax Act,1948 Sales Tax 53 53 2003-04 Asstt. Commissioner
Trade Tax–Noida
CST/UP Trade Tax Act,1948 Sales Tax 172 – 2005-06 Deputy Commissioner
6 – Trade Tax, Meerut
CST/UP Trade Tax Act,1948 Sales Tax 140 – 2001-02 Tribunal, Ghaziabad
CST/UP Trade Tax Act,1948 Sales Tax 4,837 4,837 2004-05 Joint Commissioner
(Appeal)
CST/UP Trade Tax Act,1948 Sales Tax 298 298 2003-04 Joint Commissioner
(Appeal)
CST/UP Trade Tax Act,1948 Sales Tax 251 151 2003-04 Assesing Officer
CST/UP Trade Tax Act,1948 Sales Tax 34 – 2004-05 Assesing Officer
CST/UP Trade Tax Act,1948 Sales Tax 129 129 2004-05 Assesing Officer
Madhya Pradesh Commercial Sales Tax 144 – 1998-99 MP Commercial Tax
Tax Act,1991 Tribunal
Punjab General Sales Tax Act Sales Tax 611 611 2002-03 Sales Tax Tribunal, Punjab
Punjab General Sales Tax Act Sales Tax 80 – 2001-02 Deputy Commsssioner
of Excise & Taxation
West Bengal Sales Tax Act, 1994 6,325 – 2002-03 Asst. Commissioner,
Commercial Tax Officer,
West Bengal
Andhra Pradesh General Sales Tax 2,861 – 2001-02 Appelate Deputy
Sales tax Act, 1957 Commissioner
Bihar Value Added Tax Act, 2005 Sales Tax 28,147 – 2005-06 High Court
Tamil Nadu General Sales Tax Act–1959 Sales Tax 4,178 1,325 2002-03 CTO
CST/UP Trade tax Act,1948 Sales Tax 397 – 2005-06 High Court
Delhi Sales Tax Act,1975 Sales Tax 18,698 3,000 1999-2001 Supreme Court
Tamil Nadu General Sales Sales Tax 10,928 3,773 1999-2001 Appellate Commissioner
Tax Act, 1959
Sub Total (A) 78,831 14,725
Finance Act, 1994 (Service Tax Provisions) Service Tax 4 – 1998-99 Additional Commissioner
Finance Act, 1994 (Service Tax Provisions) Service Tax 56 – 1995-96 Commissioner Appeals
Finance Act, 1994 (Service Tax Provisions) Service Tax 5 – 1995-96 Commissioner Appeals
Finance Act, 1994 (Service Tax Provisions) Service Tax 87 – 1995-96 Commissioner Appeals
Finance Act, 1994 (Service Tax Provisions) Service Tax 10 – 1995-96 Commissioner Appeals
Finance Act, 1994 (Service Tax Provisions) Service Tax 233 – 1998-99 Additional Commissioner
Finance Act, 1994 (Service Tax Provisions) Service Tax 9,313 – 1998-00 Additional Commissioner
Finance Act, 1994 (Service Tax Provisions) Service Tax 18,925 – 1997-99 Additional Commissioner
103

Name of the Statute Nature of Amounts Amount Period to Forum when the disputethe Dues disputed disputed which it is pending
(Rs. ‘000) (Rs. ‘000) Relates
Finance Act, 1994 (Service Tax Provisions) Service Tax 19,120 – 2001-03 Deputy Commissioner
Finance Act, 1994 (Service Tax Provisions) Service Tax 8,851 – 1999-2000 Deputy Commissioner
Finance Act, 1994 (Service Tax Provisions) Service Tax 14,154 – 2003-04 Deputy Commissioner
Finance Act, 1994 (Service Tax Provisions) Service Tax 2,887 – 2003-04 Deputy Commissioner
Finance Act, 1994 (Service Tax Provisions) Service Tax 2,588 – 2003-04 Commissioner of Central Excise
Finance Act, 1994 (Service Tax Provisions) Service Tax 9,450 – 2003-04 Commissioner of Central Excise
Finance Act, 1994 (Service Tax Provisions) Service Tax 15,502 – 2003-04 Deputy Commissioner of
Service Tax Mumbai
Finance Act, 1994 (Service Tax Provisions) Service Tax 547 – 2003-04 Commissioner of Central Excise
Finance Act, 1994 (Service Tax Provisions) Service Tax 2,358 – 2004-05 Commissioner of Central Excise
Finance Act, 1994 (Service Tax Provisions) Service Tax 61 – 2004-05 Assistant Commissioner
Finance Act, 1994 (Service Tax Provisions) Service Tax 2,556 – 1997-99 Commissioner Appeals
Finance Act, 1994 (Service Tax Provisions) Service Tax 1,613 – 2003-05 Asstt. Comissioner of Service Tax
Finance Act, 1994 (Service Tax Provisions) Service Tax 13,040 140 2003-04 Deputy Commissioner,
Service Tax
Finance Act, 1994 (Service Tax Provisions) Service Tax 2,054 – 2003-04 Commissioner Appeals
Sub Total (B) 123,414 140
Income Tax Act,1961 Income Tax 56,400 22,862 2001-04 Income Tax Appellate Tribunal
Income Tax Act,1961 Income Tax 5,270 – 2002-04 Income Tax Appellate Tribunal
Income Tax Act,1961 Income Tax 4,924 – 2001-05 Commissioner of Income Tax
(Appeals)
Income Tax Act,1961 Income Tax 11,200 11,200 2005-06 Commissioner of Income Tax
(Appeals)
Income Tax Act,1961 Income Tax 81,458 76,980 2002-03 Commissioner of Income Tax
(Appeals)
Income Tax Act,1961 Income Tax 144,409 1,184 2003-04 Commissioner of Income Tax
(Appeals)
Income Tax Act,1961 Income Tax 11,153 642 2001-02 Commissioner of Income Tax
(Appeals)
Income Tax Act,1961 Income Tax 57,628 57,628 1997-98 Income Tax Appellate Tribunal
Income Tax Act,1961 Income Tax 573 573 1995-96 Income Tax Appellate Tribunal
Income Tax Act,1961 Income Tax 117,799 116,780 2000-01 Income Tax Appellate Tribunal
Income Tax Act,1961 Income Tax 81,894 81,894 2001-02 Income Tax Appellate Tribunal
Income Tax Act,1961 Income Tax 6,424 6,424 1998-99 Income Tax Appellate Tribunal
Income Tax Act,1961 Income Tax 4,980 4,980 2002-03 Income Tax Appellate Tribunal
Sub Total (C) 584,112 381,147
104

b) In a case involving the Uttar Pradesh Trade Tax Department and the DoT, the Supreme Court of India had ruled thata telephone connection along with a telephone set provided by a company rendering basic services tantamount toa “transfer of right to use the telephone system” and the rentals collected by DoT towards this right to use shouldsuffer sales tax. Subsequent to the passing of this order, the Cellular Operators as well as the basic operators agitatedthe same issue before the Supreme Court by way of a Petition under Article 32 of the Constitution. The Hon’bleSupreme Court, in spite of its own earlier judgement, admitted the Petitions and vide orders dated September 25,2003 referred the matter to a larger bench for determination of dispute on merits and further directed that in futurethere shall be no coercion for recovery of any dues. Vide an order dated March 2, 2006, the larger bench of theHon’ble Supreme Court, while overruling its abovementioned judgment has held, inter alia, that provision oftelecom services does not involve any transfer of right to use the telephone system/network and that imposition ofsales tax on any facilities of telecom services is untenable in law. On Sim cards, the Court has held that dependingupon the facts of the case, (i) if sim card is not being sold, then the state cannot levy sales tax on sim card value asthe same is exigible to service tax; (ii) alternatively, if sim card is being sold, then centre cannot levy service tax onthe sim card value as the same is exigible to sales tax. Accordingly, the respective authorities are in the process ofcomplying with the Supreme Court order as above in respect of total amount disputed estimated as at March 31,2006 in respect of sales tax of Rs. 5,742,668 thousand (March 31, 2005 Rs. 4,079,507 thousand) and service tax ofRs. 236,220 thousand (March 31, 2005 Rs. 140,762 thousand).
c) Erstwhile Bharti Mobile Limited (‘BML’) was awarded license by the DoT to operate cellular services in the state ofPunjab in December 1995. On April 18, 1996, subject to certain conditions, the Company obtained the permissionfrom the DoT to operate the Punjab license through its wholly owned subsidiary, Evergrowth Telecom Limited(‘ETL’).
(i) In December 1996, DoT withdrew the permission dated April 18, 1996 . DoT, however, again reinstated thepermission on March 10, 1998 (the period from April 18, 1996 to March 10, 1998 has been hereinafterreferred to as ‘the black-out period’). On July 15, 1999 license was terminated due to alleged non-payment oflicense fees, liquidated damages and related penal interest.
(ii) Subsequently in September 2001, BML received from the DoT, an offer for the restoration of the license subjectto the condition that BML pays all the dues (license fee, WPC charges, liquidated damages and related penalinterest) pending the resolution of dispute relating to the license fee for the blackout period. BML accordinglypaid Rs. 4,909,948 thousand as demanded by DoT subject to resolution of the dispute through arbitration.Consequently the license was restored and an arbitrator appointed for the settlement of the dispute.
(iii) In the arbitration proceedings the order was not favorable to BML. BML subsequently filed objections to thearbitrator’s award before the Delhi High Court. The Delhi High Court vide orders dated February 19, 2003 issuednotices to the DoT. It is pertinent to note that the issuance of notice means stay of the implementation of theaward. While the ultimate outcome of the matter cannot be predicted with certainty, BML had, in the accountsfor the year ended March 31, 2003, as a matter of conservative accounting, recognized Rs. 1,541,667 thousand(including Rs. 280,000 thousand recoverable from ETL on account of encashment of bank guarantee) aslicense fees in addition to Rs. 800,000 thousand recognized in the year ended March 31, 2002.
(iv) The management has also provided for Rs. 69,340 thousand pertaining to liquidated charges and WPC chargespaid in 2003-04 in accordance with the order of DoT in respect of restoration of Punjab license in the year2002-03.
(v) In a case against DoT, TDSAT had earlier passed an order, directing DoT to refund the interest accrued ondelayed deposit of license fees, pre NTP 99, due to extension of the effective date of license period by sixmonths. DoT had filed an appeal against the said order before the Supreme Court, which in its judgementdated March 4, 2003 upheld the contention of GSM operators.
(vi) In view of the non refund of the complete amount due pursuant to the Order dated March 4, 2003 of theHon’ble Supreme Court the COAI moved a clarification application of the Order dated March 4, 2003, beforethe Hon’ble Supreme Court which was dismissed as withdrawn. COAI thereafter moved execution applicationsin TDSAT which also stands disposed off. The COAI moved to the Supreme Court against the interpretationadvanced by the TDSAT in the execution proceedings. The Supreme Court has admitted the matter. The matterwill now come up for hearing in due course of time.
(vii) The Company received refund order of interest from the DoT in the circles of Andhra Pradesh and Karnatakaamounting to Rs. 770,334 thousand and had taken such amounts as an income to Profit and loss Account
105

during the year 2002-03. The Company also received the interest refund order in the case of mobile operationsin Punjab on the same grounds amounting to Rs. 856,644 thousand, which was set off against the interestclaim of DoT amounting to Rs. 2,778,941 thousand in 2002-03. During the year ended March 31, 2005, theCompany received a further refund of Rs. 57,338 thousand. The balance amount of Rs. 1,864,959 thousandhas been provided in the books during the year ended March 31, 2006. Pending decision of the Delhi HighCourt, any amount determined as due from the Company on account of interest etc. cannot be quantified tillthe matter is sub-judice. Though the Company is of the view that it has a good arguable case, still, as a matterof conservative accounting practice, it has now provided for the above-mentioned amount of Rs. 1,864,959thousand.
d) The Customs Authorities, in some states, has issued show cause notices amounting to Rs. 1,230,678 thousand(included in Note 4 (a) (i) above) (March 31, 2005 Rs. 486,378 thousand) on import of special software on theground that this value forms part of the hardware alongwith which the same has been imported. The view of theCompany is that such imports should not suffer any customs duty as such software is an operating software andexempt from any customs duty.
e) In certain states Entry Tax is levied on receipt of material from outside the state. This position has been challengedby theCompany in the respective states, on the grounds that the specific Entry Tax is ultravires the constitution,classification issues have been raised whereby, in view of the Company, the material proposed to be taxed is notcovered under the specific category. The amount under dispute as at March 31, 2006 is Rs. 787,390 thousand(included in Note 4 (a) (i) above) (March 31, 2005 Rs. 231,516).
f) BAL is currently in litigation with DSS Enterprises Private Limited (‘DSS’) (0.34 per cent equity interest in erstwhileBCL) on various counts. This inter alia includes alleged claim for specific performance in respect of alleged agreementsto sell the equity interest of DSS in erstwhile Bharti Mobinet Limited. (BMNL) to BAL (formerly BTVL). The case filedby DSS to enforce the sale of equity shares before the Delhi High Court was transferred to District Court. The suit filedby DSS was dismissed in default by the Ld. Additional District judge on the ground of non-prosecution. Subsequently,DSS filed an application for restoration of the suit on which notices were issued to BAL (formerly BTVL) and otherdefendants returnable on August 22, 2006.
In respect of the same transaction, Crystal Technologies Private Limited, an intermediary, initiated arbitrationproceedings against the Company demanding Rs. 194,843 thousand (March 31, 2005 Rs. 194,843 thousand)regarding termination of its appointment as a consultant to negotiate with DSS for the sale of DSS stake in erstwhileBharti Mobinet Limited to BAL (formerly BTVL). The next date of hearing is yet to be intimated by the Arbitrator.
5. Export Obligation
Erstwhile BIL and BCL have obtained licenses under the Export Promotion Credit Guarantee (‘EPCG’) Scheme for importingcapital goods at a concessional rate of customs duty against submission of bank guarantee and bonds.
Under the terms of the respective schemes, these companies are required to export goods of FOB value equivalent to, ormore than, five times the CIF value of imports in respect of certain licenses and eight times the duty saved in respect oflicenses where export obligation has been refixed by the order of Director General Foreign Trade, Ministry of Finance, asapplicable.
Accordingly the Companies are now required to export goods of FOB value of at least Rs. 26,550,884 thousand (March31, 2005 Rs. 23,470,852 thousand).
6. a) Estimated amount of contracts to be executed on capital account and not provided for (net of advances)Rs. 41,478,800 thousand (March 31, 2005 Rs. 19,491,800 thousand).
b) Under the IT Outsourcing Agreement, the Company has commitments to pay Rs. 3,731,265 thousand (March 31,2005 Rs. 5,988,619 thousand) during the non-cancellable period of the contract for three years ending on March31, 2007, comprising finance lease and servicing charges.
7. During the year, the Company has revised its estimations for recognition of site restoration cost and its depreciation fromfifteen years to ten years and has provided depreciation as per the revised estimate of useful life, resulting in a decline invalue of plant and machinery by Rs. 345,053 thousand and a higher charge of depreciation by Rs. 42,926 thousand witha consequential impact on profit for the year and net assets of the Company as at that date.
8. a) The Company has entered into a Joint Venture agreement dated November 3, 2004 with 7 other overseas mobileoperators to form a regional alliance called the Bridge Mobile Alliance incorporated in Singapore as Bridge MobilePte Ltd. with initial equity to be equally held amongst the eight operators/shareholders. On March 31, 2005 the
106

Company invested USD-1,000 thousand in ordinary shares of USD 1 each in Bridge Mobile Pte Ltd. amounting toRs. 43,763 thousand.
b) The Company has entered into a Memorandum of Understanding dated July 8, 2005 with 5 other parties to form anaircraft chartering company called the Forum I Aviation Limited incorporated in India with initial equity to beequally held amongst the six members. During the period ended March 31, 2006, the Company has invested Rs.34,950 thousand in ordinary shares of Forum I Aviation Limited.
c) Investment in Joint Ventures
Joint Venture Country of OwnershipBusiness Interest
Bridge Mobile Pte Ltd. Singapore 12.50%
Forum I Aviation Ltd. India 16.64%
The following represent the Company’s share of Assets and Liabilities, and income and results of the Joint Venture.They are included in the balance sheet and profit and loss account statement.
As at As at
March 31, 2006 March 31, 2005
Amounts in respect of joint ventures – balance sheet
Reserve and surplus (15,631) –
Fixed assets, net 9,190 –
Investments 2,526
Current assest
Sundry debtors 1,757 –
Cash and bank 29,419 –
Loans and advances 35,475 –
Current liabilities and provisions 14,439 –
Miscellaneous Expenditure – –
(to the extent not written off or adjusted)
Amounts in respect of joint ventures – statement of profit and loss
Turnover 14,203 –
Expenses
Operating expenses 11 –
Selling, general and administration expenses 25,161 –
Interest (net) (1,344) –
Depreciation 1,353 –
Profit before tax (10,978) –
Provision for tax 2 –
Profit after tax (10,980) –
9. Vide a Supply contract and Construction and maintenance agreement executed on March 27, 2004, Alcatel SubmarineNetworks of France and Fujitsu Ltd. of Japan provided the SEA-ME-WE-4 Cable Systems (broadly described as a submarinecable system linking South East Asia and Europe, via the Indian Sub-Continent & Middle East) and will also provide longterm technical support to a consortium of sixteen Telecom operators in various countries including the Company whoseshare (8.051%) of the contract price is estimated to be USD 37,840 thousand (March 31, 2005 USD 39,055 thousand).
10. The Company had allotted 37,500 Optionally Convertible Redeemable Debentures (‘OCRDs’) of Rs. 100,000 eachaggregating to Rs. 3,750,000 thousand that were optionally convertible into equity shares at an Agreed Price on a
107

preferential basis to the erstwhile shareholders of BHL (the sellers) as part of the consideration for 67.5% equity in Bharti
Hexacom limited acquired during 2004-05. The tenor of the OCRDs was 364 days from and including the date of
allotment. The OCRDs were convertible solely and entirely at the option of the Seller and BAL (formerly BTVL) was not
entitled to convert the same into equity shares unless the Sellers exercised their option to convert. If the Sellers chose not
to convert all or part of the OCRDs, then the outstanding OCRDs were to be redeemed at face value at the end of the tenor.
BAL (formerly BTVL) and the Sellers were to share any upside in the BAL (formerly BTVL) stock price, at the time of
Conversion. The difference between the Relevant Price and the Agreed Price was to be shared in the 60:40 ratio (BTVL:Sellers)
respectively at the time of conversion of the OCRDs. The upside was to be adjusted by way of reducing the number of
shares to be allotted on conversion. The Relevant Price would be the average of the closing prices (as given in the
Exchange Bhav Copy) of BAL (formerly BTVL) shares quoted on NSE and BSE (both) during the three trading days
preceding the Notice Date or the end of the Tenor as applicable.
During the year ended March 31, 2006 the Company has issued 20,088,445 equity shares of Rs. 10/- each fully paid up
to M/s. Shyam Cellular Infrastructures Projects Limited upon conversion of Optionally Convertible Redeemable Debentures
(OCRDs) which is as follows:
(Rs. ‘000)
Date of Allotment No. of Shares Conversion
Allotted Amount
April 24, 2005 5,424,479 1,012,609
May 10, 2005 14,538,078 2,713,881
June 9, 2005 125,888 23,500
11. During the year ended March 31,2005 the Company issued USD 115,000,000 Zero Coupon Convertible Bonds due 2009
(the “Bonds”). The Bonds are convertible at any time on or after June 12, 2004 (or such earlier date as is notified to the
holders of the Bonds by the Issuer) up to April 12, 2009 by holders into fully paid equity shares with full voting rights with
a par value of Rs. 10 each of the Issuer (“Shares”) at an initial Conversion Price (as defined in the “Terms and Conditions
of the Bonds”) of Rs. 233.17 per share with a fixed rate of exchange on conversion of Rs. 43.56 = USD 1.00. The
Conversion Price is subject to adjustment in certain circumstances.
The Bonds may be redeemed, in whole or in part, at the option of the Issuer at any time on or after May 12, 2007 and prior
to April 12, 2009, subject to satisfaction of certain conditions, at their “Early Redemption Amount” (as defined in the
“Terms and Conditions of the Bonds”) at the date fixed for such redemption if the “Closing Price” (as defined in the
“Terms and Conditions of the Bonds”) of the Shares translated into U.S. dollars at the “prevailing rate” (as defined in the
“Terms and Conditions of the Bonds”) for each of 30 consecutive “Trading Days” (as defined in the “Terms and Conditions
of the Bonds”), the last of which occurs not more than five days prior to the date upon which notice of such redemption
is published, is greater than 120 percent of the “Conversion Price” (as defined in the “Terms and Conditions of the
Bonds”) then in effect translated into U.S. dollars at the rate of Rs. 43.56 = USD 1.00.
The Bonds may also be redeemed in whole, and not in part, at any time at the option of the Issuer at their Early
Redemption Amount if less than 5 percent in aggregate principal amount of the Bonds originally issued is outstanding.
The Bonds may also be redeemed in whole at any time at the option of the Issuer at their Early Redemption Amount in
the event of certain changes relating to taxation in India.
Unless previously converted, redeemed or purchased and cancelled, the Bonds will be redeemed in U.S. dollars on May
12, 2009 at 111.84 percent of their principal amount.
The Issuer will, at the option of any holder of any Bonds, repurchase at the Early Redemption Amount such Bonds at such
time as the Shares cease to be listed or admitted to trading on the NSE or upon the occurrence of a “Change of Control”
(as defined in the “Terms and Conditions of the Bonds”) in respect of the Issuer. These Bonds are listed in the Singapore
Exchange Securities Trading Limited (the “SGX-ST”).
108

The Company has during the period ended March 31, 2006 Converted Bonds equivalent to USD 94,756,000 into17,701,967 equity shares of the Company at the option exercised by the bond holders which is as follows:
Date of Allotment No. of Shares Allotted FCCB Value (USD)
August 12, 2005 840,673 4,500,000August 20, 2005 706,166 3,780,000September 15, 2005 3,693,360 19,770,000September 23, 2005 2,640,088 14,132,000October 19, 2005 3,462,828 18,536,000November 7, 2005 2,073,661 11,100,000December 12, 2005 467,041 2,500,000January 12, 2006 2,860,159 15,310,000Feburary 2, 2006 453,588 2,428,000March 9, 2006 504,403 2,700,000
Total 17,701,967 94,756,000
12. Profit on sale of investments is net of loss on sale of investments Rs. 2,103 thousand (March 31, 2005 Rs. 6,732thousand).
13. Billing Revenue in the Profit and Loss Account is net of Rebates and Discounts Rs. 27,908 thousand (March 31, 2005Rs. 1,918,625 thousand).
14. Rs. 2,762,604 thousand (March 31, 2005 Rs. 2,585,873 thousand) included under Current Liabilities, represents refundablesecurity deposits received from subscribers on activation of connections granted thereto and are repayable ondisconnection, net of outstanding, if any. Sundry debtors are secured to the extent of the amount outstanding againstindividual subscribers by way of Security Deposit received from them.
15. As at March 31, 2006 4,195,449 equity shares (March 31, 2005 6,436,266 equity shares) of the Company are held byBharti Tele-Ventures Employee’s Welfare Trust (“The Trust”) issued at the rate of Rs. 51.36 per equity share fully paid up.
16. The Loans and Advances granted to subsidiaries and associates are repayable on demand and repayments made duringthe year are as mutually agreed.
17. Particulars of securities charged against secured loans taken by the Company are as follow :
Particulars Amount Security chargesOutstanding
(Rs.’000s)
Debentures
10.55%, 5 Non-Convertible Redeemable Debentures 12,500of Rs. 10,000 thousand each repayment commencingfrom December 2004
10.90%, 27 Non-Convertible Redeemable Debentures of 270,000Rs. 10,000 thousand each repayment commencing fromDecember 2006
11.45%, 5 Non-Convertible Redeemable Debentures of 50,000Rs. 10,000 thousand each repayment commencing fromDecember 2009
11.70%, 45 Non-Convertible Redeemable Debentures of 450,000Rs. 10,000 thousand each repayment commencing fromDecember 2009
7.25%, 200 Non-Convertible Redeemable Debentures of 1,400,000Rs. 10,000 thousand each repayment commencing fromOctober 2003
8.65%, 95 Non-Convertible Redeemable Debentures of 950,000Rs. 10,000 each repayable in May 2007
Debentures 3,132,500
First ranking pari passu charge onall present and future tangiblemovable and freehold immovableassets owned by the Companyincluding plant and machineryoffice equipment, furniture andfixtures fittings, spares tools andaccessories vehicles.
All rights, titles, interests in theaccounts, and monies depositedand investments made there fromand in project documents, bookdebts and insurance policies.
109

Particulars Amount Security chargesOutstanding
(Rs.’000s)
First ranking pari passu charge onall present and future tangiblemovable and freehold immovableassets owned by the Companyincluding plant and machineryoffice equipment, furniture andfixtures fittings, spares tools andaccessories vehicles.
All rights, titles, interests in theaccounts, and monies depositedand investments made there fromand in project documents, bookdebts and insurance policies.
Loans and Advances from Banks
Term Loan
Rupee Loan Rs. 400,000 thousand repayable in 4 half 100,000
yearly installments beginning March 2005
Rupee Loan Rs.500,000 thousand repayable in 4 half 125,000
yearly installments beginning September 2005
Rupee Loan of Rs.900,000 thousand repayable in 4 half 450,000
yearly installments beginning July 2005
Term Loan 675,000
Other Loans and Advances
Term loan from Financial Institution for Rs.3,000,000 3,000,000
thousand repayable in 11 quarterly installments
commencing from October 2006
Rupee Loan from financial institutions Rs.2500,000 1,500,000
thousand repayable in 10 half yearly installments
beginning March 2007
Foreign Currency Term Loan of USD 86,110 thousand 2,687,000
repayable in 20 half yearly installments beginning
December 2002
Foreign Currency Term Loan of USD 37,057 thousand 1,274,000
repayable in 20 half yearly installments beginning
August 2003
Foreign Currency Term Loan of USD 37,009 thousand 1,216,000
repayable in 20 half yearly installments beginning
February 2004
Long Term Foreign Currency Loan of USD 30,000 thousand 1,438,500
repayable in 10 half yearly installments beginning July 2006
Long Term Foreign Currency Loan of USD 10,000 thousand 384,774
repayable in 13 half yearly installments beginning June 2005
Long Term Foreign Currency Loan of USD 12,000 thousand 461,729
repayable in 13 half yearly installments beginning June 2005
Long Term Foreign Currency Loan of USD 46,000 thousand 1,673,408
repayable in 20 half yearly installments beginning June 2004
Long Term Foreign Currency Loan of USD 27,956 thousand 696,632
repayable in 19 half yearly installments beginning June 2004
Foreign Currency Term Loan of USD 18,996 thousand 765,000
repayable in 20 half yearly installments beginning May 2005
Foreign Currency Term Loan of USD 43,035 thousand 1,522,000
repayable in 20 half yearly installments beginning
September 2005
First ranking pari passu charge on
all present and future tangible
movable and freehold immovable
assets owned by the Company
including plant and machinery
office equipment, furniture and
fixtures fittings, spares tools and
accessories vehicles.
All rights, titles, interests in the
accounts, and monies deposited
and investments made there from
and in project documents, book
debts and insurance policies.
110

Particulars Amount Security chargesOutstanding
(Rs.’000)
Foreign Currency Term Loan of USD 36,822 thousand 1,565,000
repayable in 20 half yearly installments beginning
January 2006
Foreign Currency Term Loan of USD 52,125 thousand 2,333,000
repayable in 20 half yearly installments beginning
May 2006
Foreign Currency Term Loan of USD 48,310 thousand 2,155,000
repayable in 20 half yearly installments beginning
September 2006
Foreign Currency Term Loan of USD 5,000 thousand 219,700
repayable in 20 half yearly installments beginning
September 2005
Foreign Currency Term Loan of USD 4,645 thousand 204,100
repayable in 20 half yearly installments beginning
March 2006
Foreign Currency Term Loan of USD 27,229 thousand 1,196,400
repayable in 20 half yearly installments beginning
July 2006
Foreign Currency Term Loan of USD 11,781 thousand 517,653
repayable in 20 half yearly installments beginning
November 2006
Term Loan Total 24,809,896
Vehicle Loans From Banks 16,311 Secured by Hypothecation of
vehicles of the Company.
Total 28,633,707
Note : Following shall be excluded from Securities as mentioned above :-
a) Intellectual properties of BAL (formerly BTVL).
b) Investment in subsidiaries of BAL (formerly BTVL).
c) Licenses issued by DoT to operate various telecom services.
111

18. Expenditure/Earnings in Foreign Currency (on accrual basis):
(Rs.’000)
Particulars Period ended Year endedMarch 31, 2006 March 31, 2005
Expenditure
On account of :
Interest 909,265 1,175,095
Professional & Consultation Fees 20,706 106,362
Travelling 11,792 9,173
Roaming Charges (Incl. Commission) 831,529 731,870
Membership & Subscription 2,716 5,467
Staff Training & Others 2,535 11,353
Services 15,618 408,885
Annual Maintenance 122,460 8,103
Bandwidth Charges 680,263 256,760
Access Charges 3,987,105 2,146,771
Repairs & Maintenance – 832
Investment – 63,378
Marketing 296 115,597
Material 1,011,797 –
Upfront fee 527,593 145,102
Signalling charges 3,880 2,292
Registration fee 124 –
US Point of Presence Charges 29,524 31,084
Board Meeting Expenses 637 615
Bank Charges 287 –
Directors Commission 5,114 –
Sponsorship 392 –
Delegation fee 734 –
Total 8,164,367 5,218,739
Earnings
Roaming Revenue 2,740,674 2,239,362
Billing Revenue 9,968,082 7,554,242
Swap Income 8,507 63,001
Interest Income 9,078 5,521
EKN Premium Refund 34,016 1,390
Total 12,760,357 9,863,516
19. CIF Value of Imports:
Year ended Year ended
March 31, 2006 March 31, 2005
(Rs.’000) (Rs.’000)
Capital Goods 16,262,423 17,307,308
Components and spare parts 13,142 24,307
Total 16,275,565 17,331,615
112

20. The aggregate managerial remuneration under Section 198 of the Companies Act, 1956 to the directors (includingmanaging director) is:
(Rs.’000)
Particulars Year ended Year endedMarch 31, 2006 March 31, 2005
Whole Time Director
Salary * 90,609 68,875
Reimbursements and Perquisites 680 795
Performance Linked Incentive 102,126 56,087
Total Remuneration payable to Whole Time Directors 193,415 125,757
Non Whole Time Directors
Commission 9,898 9,801
Sitting Fees 710 800
Total amount paid/payble to Non-Whole Time Directors 10,608 10,601
Total Managerial Remuneration 204,023 136,358
* The amount excludes Company’s contribution/provision for gratuity cost for the year, which is determined annuallyon actuarial basis.
Computation of Net Profit in accordance with Section 349 of the Companies Act, 1956, and calculation ofRemuneration payable to Directors
(Rs.’000)
Particulars Year ended Year endedMarch 31, 2006 March 31, 2005
Net Profit before tax from ordinary activities 22,857,955 15,642,762
Add: Whole Time Director’s Remuneration 192,735 124,962
Add: Reimbursements to Whole Time Directors 680 795
Add: Directors Sitting Fees 710 800
Add: Commission to Non-Whole Time Director 9,898 9,801
Add: Provision for Doubtful Loans and advances 2,659,300 1,583,887
Add: Provision for Wealth Tax 15 22
Net Profit/(Loss) for the year Under Section 349 25,721,293 17,363,029
Maximum Amount paid/payable to Non-Whole Time Directors 257,213 173,630Restricted to 1%
Maximum Amount paid/payable to Whole Time Directors 2,829,342 1,909,933Restricted to 11%
Amount Paid/Payable to Directors 204,023 136,358
21. (i) The Central Government’s approval is pending against the application made by erstwhile BML in respect ofremuneration of Rs. 1,943 thousand [Rs. 1,274 thousand for the five month period ended August 31, 2000 andRs. 669 thousand for the year ended March 31, 2000 respectively] (March 2003: Rs. 1,943 thousand) payable to theformer Whole Time Director which exceeds the limits prescribed by Schedule XIII of the Companies Act, 1956.
(ii) The Central Government’s approval is pending against the application made by erstwhile BCL in respect of excessremuneration paid to Whole Time Directors of Rs. 4,063 thousand (March 31, 2005 Rs.4,063 thousand).
(iii) The cumulative amount of excess remuneration paid to the Whole Time Director of the Company pending approvalof Central Government is Rs. 565 thousand (March 31, 2005 Rs. 565 thousand) and is refundable by the director.
(iv) The cumulative amount of excess remuneration paid to Managing Director and Whole Time Directors (erstwhile‘BIL’) pertaining to earlier years, pending approval of the Central Government is Rs. 3,114 thousand (March 31, 2005Rs. 3,114 thousand) and is refundable by Directors.
113

22. Auditors Remuneration : (Rs.’000)
Year ended Year endedMarch 31, 2006 March 31, 2005
Audit Fee* 63,300 53,401
Certification Fee 2,202 3,730
Reimbursement of Expenses 709 2,352
Other Fees* 15,750 –
Total 81,961 59,483
* Excluding Service Tax
23. Details of SSI Creditors having outstanding balance for more than 30 days
(Rs. ‘000)
Name of SSI creditors As at As atMarch 31, 2006 March 31, 2005
Kumar Printers 68 –
Cantech Engineers 80 137
GKA Rajeendran & Co. 123 1
3 GUYS 84 179
S.P. Projects 169 111
Solux Galfab Private Limited 2,926 63
Soumitra Das 16 18
Axis Galvanising Industries 55 370
Globe Detective Agency Pvt. Ltd. 12 77
Shiva Fabricators 53 –
Kotagi Structurals 2,995 452
Ridings Consultants P. Ltd. 26 –
Modern Engineers Construction Co-op. Society Ltd. 6 –
Axis Engineers – 88
Dubas Engineering Pvt. Limited – 323
Jakson Generators (P) Ltd. – 357
Precision Control – 495
Print Screen – 1
Sai Electricals – 117
Selvon Instruments – 964
Shiva Fabricators – 378
Shruti Art – 55
6,613 4,186
114

24. Quantitative Information
2005-06
(Rs. ‘000)
Year ended Purchases Sales/Internal Year ended(Refer Notes 1) Utilisation March 31, 2006
March 31, 2005 2005-06 2005-06
Particulars Qty. Value Qty. Value Qty. Value Qty. ValueNos. (‘000) Nos. (‘000) Nos. (‘000) Nos. (‘000)
Handsets – – 320 1,416 320 1,645 – –
Simcards(Note 2) 5,363,201 302,202 26,102,020 684,268 24,859,782 694,368 6,605,439 172,933
TDMA/PAMA VSATsAssembly sets 145 2,048 – – 49 – 96 1,356
Broadband InteractiveTerminal/Gateways 70 – – – 70 – – –
Internet Modem& others 18 11,588 2,247 52,856 1,133 18,163 1,132 3,155
– 315,838 – 738,540 – 714,176 – 177,444
2004-05
(Rs. ‘000)
Acquired on Purchases (Refer Sales/Internal As atAmalgamation Notes 1 & 3 below) Utilisation March 31, 2005April 1, 2004 2004-05 2004-05
Particulars Qty. Value Qty. Value Qty. Value Qty. ValueNos. (‘000) Nos. (‘000) Nos. (‘000) Nos. (‘000)
Handsets 69 103 – – 69 – – –
Simcards(Note 2) 2,450,748 152,810 20,381,108 1,050,435 17,468,655 689,604 5,363,201 302,202
TDMA/PAMA VSATsAssembly sets 145 12,011 – – – – 145 2,048
Broadband InteractiveTerminal/Gateways 70 1,468 – – – – 70 –
Internet Modem 32 33,775 5 21,646 19 38,876 18 11,588
– 200,167 – 1,072,081 – 728,480 – 315,838
1. Includes cost transferred from fixed assets.
2. Excludes value of simcards issued free of cost.
3. The above table does not include the value of Sim card utilization Rs. 194,347 thousand (March 31, 2005 :Rs. 252,144 thousand), TDMA/PAMA VSATs Assembly sets does not include utilization of Rs 692 thousand(March 31, 2005 : Rs. 9,963 thousand)
115

25. The details of investments required as per Schedule VI of the Companies Act 1956 are provided below.a) Details of Investments held as at March 31, 2006
(Rs. ‘000)
As at As at As at As at As at As atParticulars Rate of March 31, March 31, March 31, March 31, March 31, March 31,
Interest 2006 2006 2006 2005 2005 2005(No. of Face Cost (No. of Face Cost
Units) Value Units) Value
Other than Trade (Quoted) - Government Securities9.81% GOI [email protected]% YTM — — — 1,000,000 100,000 119,208
6.18%GOI 2005 — — — 1,500,000 150,000 150,525
6.18%GOI 2005 — — — 1,000,000 100,000 100,370
6.18%GOI 2005 — — — 1,000,000 100,000 100,270
7.05% Canara Bank 2014 50 50000 50,000 150 150,000 150,000
7.15% Union Bank 2015 50 50000 50,000 100 100,000 100,000
11.50% IDBI 2010 — — — 500,000 50,000 59,388
364 Days T Bills Maturing on 14/10/2005 — — — 849,750 84,975 80,599
364 Days T Bills Maturing on 14/10/2005 — — — 849,750 84,975 80,599
364 Days T Bills Maturing on 14/10/2005 — — — 1,000,000 100,000 94,881
9.81%GOI 2013 1,000,000 100000 113,550 — — —
7.30% REC Secured Bonds 60 50000 46,500 — — —
364 Days T Bills Maturing on 14/04/2006 578,000 57800 54,719 — — —
364 Days T Bills Maturing on 14/04/2006 600,000 60000 56,802 — — —
8.07% GOI 2017 1,000,000 — 103,850 — — —
Total (A) 367,800 475,421 1,019,950 1,035,840
Other than trade (Unquoted)National Saving Certificate 180 1,800 1,800 180 1,800 1,800
Total (B) 1,800 1,800 1,800 1,800
Other than Trade (Quoted) - Mutual Funds,Debentures and BondsKotak Mahindra Mutual Fund — — — 5,120,185 55,000 55,000
Kotak Mahindra Mutual Fund — — — 4,686,251 51,000 51,000
PRUDENTIAL ICICI MF — — — 9,669,403 100,000 100,000
ABN AMRO Floating Rate Fund — — — 6,480,357 64,804 66,360
ABN AMRO Liquid Fund I Plan — — — 16,708,746 167,087 171,590
Birla Mutual Fund - Liquid - I Plan Premium — — — 6,476,645 64,766 67,955
Deutsche Floating rate fund — — — 10,582,759 105,828 113,031
DSP ML Liquid Fund — — — 3,309,093 33,091 53,623
HDFC Mutual Fund - Cash Mgmt. Saving Plus Plan — — — 21,214,445 212,144 303,910
HDFC Mutual Fund - Cash Mgmt. Saving Plan — — — 21,760,891 217,609 300,000
HSBC Floating Rate Fund — — — 4,243,159 42,432 43,223
HSBC Liquid Fund — — — 1,921,303 19,213 20,000
ING ST Floater — — — 5,939,171 59,392 60,621
ING Vysya Liquid — — — 3,355,543 33,555 34,850
J M Fixed Maturity Plan QSA 5 — — — 20,344,838 203,448 203,448
J M MUTUAL FUND - Equity & Derivative — — — 5,000,000 50,000 50,000
Kotak Floater ST Growth — — — 10,784,823 107,848 117,238
Prudential ICICI Mutual Fund - FMP Series 25 Quaterly — — — 24,987,007 249,870 250,000
Prudential ICICI Mutual Fund - Floating Rate Plan C — — — 2,588,907 25,889 26,734
Principal Floating Rate Fund — — — 4,907,164 49,072 50,364
Reliance Mutual Fund - Floater — — — 6,984,563 69,846 71,752
Reliance Mutual Fund - FMP Quarter Plan 8 — — — 15,000,000 150,000 150,000
Reliance Mutual Fund - FMP Quarter Plan 7 — — — 20,000,000 200,000 200,000
Tata Mutual Fund Floating Rate — — — 20,034,464 200,345 205,980
UTI Floater — — — 7,085,128 70,851 76,370
HDFC (M+55) Floating Rate Bonds 2007 — — — 200 200,000 200,000
5.87% HDFC NCD 2006 — — — 250 250,000 250,000
Kotak Mahindra Bank — — — 1,000 100,000 95,444
ING Vysya Bank — — — 3,000 300,000 286,333
Alliance Mutual Fund - Liquid - I Plan — — — — — —
Birla Mutual Fund - Liquid - I Plan — — — — — —
Canbank Mutual - liquid Fund — — — — — —
Deutsche Mutual Income — — — — — —
116

(Rs. ‘000)
As at As at As at As at As at As atParticulars Rate of March 31, March 31, March 31, March 31, March 31, March 31,
Interest 2006 2006 2006 2005 2005 2005(No. of Face Cost (No. of Face Cost
Units) Value Units) Value
Deutsche Liquid Fund — — — — — —
DSP ML Liquid Fund — — — — — —
First India Mutual Fund - Liquid — — — — — —
Grindlay Liquid Fund - I Plan — — — — — —
IL & FS Mutual Fund - Liquid- I Plan — — — — — —
IL & FS Mutual Fund - Income — — — — — —
J M MUTUAL FUND - Liquid - IPlan — — — — — —
KMMF K Liquid - Premiun — — — — — —
Prudential ICICI Liquid - I Plan — — — — — —
Prudential ICICI Mutual Fund - Floating Rate — — — — — —
Reliance Mutual Fund - Liquid — — — — — —
Templeton India Floating Rate ST — — — — — —
Templeton India Mutual Liquid Fund — — — — — —
10.55% Bharti Mobile Debentures 10.55% — — — — — —
ABN AMRO Flexi Debt Fund 9,730,824 — 102,566 — — —
CAN Bank Floater Fund 6,710,663 — 71,421 — — —
Deutsche Liquid Cash Plus - IP 4,973,082 — 54,516 — — —
DSP Liquid Fund 137,116 — 139,941 — — —
Kotak Liquid Premium 8,010,148 — 112,803 — — —
Prudential ICICI Mutual Fund - Floating Rate Plan D 12,774,826 — 130,519 — — —
Tata Liquid Fund 48,567 — 62,405 — — —
UTI Liquid Fund 5,981,755 — 117,338 — — —
ABN AMRO Liquid Fund - I Plan 5,964 — 61 — — —
Birla Mutual Fund - Liquid - I Plan Premium 13,178,755 — 146,195 — — —
GE Capital Services Ltd. NCD 100 — 1,018,561 — — —
Total (C) — 1,956,326 3,453,090 3,674,826
TOTAL (A) + (B) + (C) 369,600 2,433,547 4,474,840 4,712,466
117

25.(b) Details of Investments purchased and redeemed/sold during the year
Balance Purchased Sale/Redemption as on 1.04.05 During the Year Proceeds
Particulars Units INR Units INR Units INR(Rs. ‘000) (Rs. ‘000) (Rs. ‘000)
NON-TRADE9.81% GOI [email protected]% YTM 1,000,000 119,208 – – 1,000,000 117,105National Saving Certificate 180 1,800 – – – –Mutual Funds/BondsKotak Mahindra Mutual Fund 5,120,185 55,000 – – 5,120,185 56,238Kotak Mahindra Mutual Fund 4,686,251 51,000 – – 4,686,251 51,472Kotak Mahindra Mutual Fund – – 4,665,502 51,000 4,665,502 51,244Prudential ICICI MF 9,669,403 100,000 – – 9,669,403 100,925ABN AMRO Floating Rate Fund 6,480,357 66,360 – – 6,480,357 66,766ABN AMRO Liquid Fund – I Plan 16,708,746 171,590 – – 16,708,746 172,179Birla Mutual Fund – Liquid – I Plan Premium 6,476,645 67,955 – – 6,476,645 68,027Deutsche Floating Rate Fund 10,582,759 113,031 – – 10,582,759 113,517DSP ML Liquid Fund 3,309,093 53,623 – – 3,309,093 53,812HDFC Mutual Fund – Cash Mgmt. Saving Plus Plan 21,214,445 303,910 – – 21,214,445 305,031HDFC MutualFund – Cash Mgmt. Saving Plan 21,760,891 300,000 – – 21,760,891 300,337HSBC Floating Rate Fund 4,243,159 43,223 – – 4,243,159 43,405HSBC Liquid Fund 1,921,303 20,000 – – 1,921,303 20,018ING ST Floater 5,939,171 60,621 – – 5,939,171 61,133ING Vysya Liquid 3,355,543 34,850 – – 3,355,543 34,968J M Fixed Maturity Plan QSA 5 20,344,838 203,448 – – 20,344,838 206,527J M MUTUAL FUND – Equity & Derivative 5,000,000 50,000 – – 5,000,000 50,865Kotak Floater ST Growth 10,784,823 117,238 – – 10,784,823 117,479Prudential ICICI Mutual Fund – FMP Series 25 Quaterly 24,987,007 250,000 – – 24,987,007 253,332Prudential ICICI Mutual Fund – Floating Rate Plan C 2,588,907 26,734 – – 2,588,907 26,833Principal Floating Rate Fund 4,907,164 50,364 – – 4,907,164 50,570Reliance Mutual Fund – Floater 6,984,563 71,752 – – 6,984,563 72,118Reliance Mutual Fund – FMP Quarter Plan 8 15,000,000 150,000 – – 15,000,000 152,181Reliance Mutual Fund – FMP Quarter Plan 7 20,000,000 200,000 – – 20,000,000 202,894Tata Mutual Fund Floating Rate 20,034,464 205,980 – – 20,034,464 206,687UTI Floater 7,085,128 76,370 – – 7,085,128 76,639HDFC (M+55) Floating Rate Bonds 2007 200 200,000 – – 200 200,0005.87% HDFC NCD 2006 250 250,000 – – 250 250,014Kotak Mahindra Bank 1,000 95,444 – – 1,000 95,575ING Vysya Bank 3,000 286,333 – – 3,000 286,774ABN AMRO Flexi Debt Fund – – 9,730,824 102,566 – –ABN AMRO Liquid Fund I Plan – – 5,964 61 – –Birla Mutual Fund – Liquid – I Plan Premium – – 13,178,755 146,195 – –CAN Bank Floater Fund – – 6,710,663 71,421 – –Deutsche Liquid Cash Plus – IP – – 4,973,082 54,516 – –DSP Liquid Fund – – 137,116 139,941 – –Kotak Liquid Premium – – 8,010,148 112,803 – –Prudential ICICI Mutual Fund – Floating Rate Plan D – – 12,774,826 130,519 – –Tata Liquid Fund – – 48,567 62,405 – –UTI Liquid Fund – – 5,981,755 117,338 – –Deutsche Liquid Cash Plus – IP – – 30,811,792 320,000 30,811,792 320,058HDFC Floater – – 21,308,885 237,300 21,308,885 237,402HDFC Mutual Fund – Cash Mgmt. Saving Plan – – 10,145,148 140,000 10,145,148 140,020HSBC Liquid Fund – – 19,196,069 200,000 19,196,069 200,086ABN AMRO Liquid Fund I Plan – – 2,699,873 27,789 2,699,873 27,821Deutsche Floating rate fund – – 8,062,478 86,419 8,062,478 86,483Grindlays Cash Fund S-plan C – – 15,228,233 159,795 15,228,233 160,000HDFC Mutual Fund – Cash Mgmt. Saving Plus Plan – – 3,127,866 44,937 3,127,866 44,969HDFC Mutual Fund – Cash Mgmt. Saving Plan – – 3,621,194 50,000 3,621,194 50,015Kotak Floater ST Growth – – 18,022,188 196,312 18,022,188 196,521Principal Liquid Fund – – 9,704,310 100,000 9,704,310 100,118HDFC Mutual Fund – Cash Mgmt. Saving Plan – – 14,476,284 200,000 14,476,284 200,000ABN AMRO Liquid Fund I Plan – – 7,015,845 72,211 7,015,845 72,317Grindlays Cash Fund S-Plan C – – 7,954,278 83,475 7,954,278 83,599Grindlays FRF STP Plan C-Super IP – – 10,608,525 111,471 10,608,525 111,520HSBC Floating Rate Fund – – 9,256,177 94,601 9,256,177 94,695Kotak Floater ST Growth – – 1,524,495 16,608 1,524,495 16,629Kotak Floater ST Growth – – 15,769,710 171,831 15,769,710 172,011
118

Balance Purchased Sale/Redemption as on 1.04.05 During the Year Proceeds
Particulars Units INR Units INR Units INR(Rs. ‘000) (Rs .‘000) (Rs. ‘000)
Kotak Floater ST Growth – – 24,642 269 24,642 269Kotak Floater ST Growth – – 1,211,182 13,207 1,211,182 13,211Prudential ICICI Mutual Fund – Floating Rate Plan C – – 21,627,673 223,836 21,627,673 224,167Prudential ICICI Mutual Fund – Floating Rate Plan C – – 1,682,618 17,414 1,682,618 17,440Reliance Mutual Fund – Liquid – – 1,236,384 20,000 1,236,384 20,027Prudential ICICI Mutual Fund – Floating Rate Plan C – – 5,676,617 58,750 5,676,617 58,926Prudential ICICI Mutual Fund – Floating Rate Plan C – – 2,993,486 30,990 2,993,486 31,074Prudential ICICI Mutual Fund – Floating Rate Plan C – – 13,427,669 139,010 13,427,669 139,406Prudential ICICI Mutual Fund – Floating Rate Plan C – – 5,836,442 60,459 5,836,442 60,594Grindlays Cash Fund S-Plan C – – 13,320,774 140,000 13,320,774 140,226Grindlays Cash Fund S-Plan C – – 853,390 8,977 853,390 8,984Reliance Mutual Fund – Liquid – – 4,448,333 72,118 4,448,333 72,172Reliance Mutual Fund – Liquid – – 1,098,868 17,815 1,098,868 17,828J M Mutual Fun Floating Rate – – 6,959,174 76,135 6,959,174 76,213Kotak Floater ST Growth – – 2,397,840 26,147 2,397,840 26,200Tata Mutual Fund Floating rate – – 6,766,554 69,894 6,766,554 70,000Kotak Floater ST Growth – – 1,893,344 20,646 1,893,344 20,697Kotak Floater ST Growth – – 2,772,158 30,257 2,772,158 30,303Kotak Floater ST Growth – – 6,389,966 69,743 6,389,966 69,893Kotak Floater ST Growth – – 2,021,155 22,078 2,021,155 22,107Deutsche Floating Rate Fund – – 10,195,167 109,279 10,195,167 109,700DSP ML Liquid Fund – – 4,304,699 70,000 4,304,699 70,129HSBC Liquid Fund – – 4,788,538 50,000 4,788,538 50,110Templeton India TMA – IP – – 95,961 100,000 95,961 100,055Deutsche Liquid Cash Plus – IP – – 3,834,135 39,939 3,834,135 40,000Birla Mutual Fund – Floater – – 5,468,864 60,000 5,468,864 60,009Reliance Mutual Fund – Liquid – – 1,985,211 32,185 1,985,211 32,275Reliance Mutual Fund – Liquid – – 475,132 7,711 475,132 7,725Templeton India Mutual Fund – Floater – – 4,159,111 50,000 4,159,111 50,067Kotak Floater ST Growth – – 4,565,043 49,867 4,565,043 50,000Prudential ICICI Mutual Fund – Floating Rate Plan C – – 197,075 2,041 197,075 2,051Prudential ICICI Mutual Fund – Floating Rate Plan C – – 11,086,795 115,000 11,086,795 115,396Prudential ICICI Mutual Fund – Floating Rate Plan C – – 3,127,567 32,548 3,127,567 32,553HDFC Mutual Fund – Cash Mgmt. Saving Plus Plan – – 2,769,661 39,791 2,769,661 40,000Prudential ICICI Mutual Fund – Floating Rate Plan C – – 14,409,360 149,957 14,409,360 150,000Deutsche Liquid Cash Plus – IP – – 144,874 1,509 144,874 1,514Deutsche Liquid Cash Plus – IP – – 9,425,145 98,266 9,425,145 98,486DSP ML Floater – – 3,900,651 43,000 3,900,651 43,124DSP ML Floater – – 7,248,741 80,000 7,248,741 80,140DSP ML Floater – – 6,940,824 76,616 6,940,824 76,736Grindlays FRF STP Plan C– Super IP – – 1,287,513 13,529 1,287,513 13,600Grindlays FRF STP Plan C– Super IP – – 8,179,495 86,149 8,179,495 86,400HDFC MutualFund – Cash Mgmt. Saving Plus Plan – – 24,753,529 355,629 24,753,529 357,703HDFC Mutual Fund – Cash Mgmt. Saving Plus Plan – – 2,926,983 42,051 2,926,983 42,297HSBC Floating Rate Fund – – 1,506,717 15,399 1,506,717 15,489HSBC Floating Rate Fund – – 6,567,370 67,357 6,567,370 67,511ING Vysya Liquid – IP – – 9,551,281 100,000 9,551,281 100,015Tata Mutual Fund Floating Rate – – 1,946,524 20,106 1,946,524 20,194Tata Mutual Fund Floating Rate – – 4,662,185 48,200 4,662,185 48,368Tata Mutual Fund Floating Rate – – 6,283,229 65,000 6,283,229 65,186Tata Mutual Fund Floating Rate – – 3,862,570 40,000 3,862,570 40,073Tata Mutual Fund Floating Rate – – 2,523,344 26,155 2,523,344 26,179Templeton India Mutual Fund – Floater – – 1,672,611 20,115 1,672,611 20,151Templeton India Mutual Fund – Floater – – 6,627,728 79,722 6,627,728 79,849Templeton India Mutual Fund – Floater – – 1,690,388 20,333 1,690,388 20,368Templeton India Mutual Fund – Floater – – 4,119,078 49,567 4,119,078 49,632Reliance Mutual Fund – Liquid – – 1,228,735 19,942 1,228,735 20,000DSP ML Floater – – 656,374 7,245 656,374 7,259DSP ML Floater – – 4,001,497 44,170 4,001,497 44,251ABN AMRO Liquid Fund I Plan – – 4,086,026 42,154 4,086,026 42,330DSP ML Floater – – 528,145 5,830 528,145 5,842DSP ML Floater – – 11,667,285 128,920 11,667,285 129,054DSP ML Floater – – 2,894,827 32,000 2,894,827 32,020Grindlays FRF STP Plan C – Super IP – – 2,264,568 23,851 2,264,568 23,931
119

Balance Purchased Sale/Redemption as on 1.04.05 During the Year Proceeds
Particulars Units INR Units INR Units INR(Rs. ‘000) (Rs .‘000) (Rs. ‘000)
Grindlays FRF STP Plan C – Super IP – – 6,162,715 65,000 6,162,715 65,125Grindlays FRF STP Plan C – Super IP – – 13,015,041 137,500 13,015,041 137,538HSBC Floating Rate Fund – – 3,182,734 32,643 3,182,734 32,733HSBC Floating Rate Fund – – 4,882,268 50,110 4,882,268 50,212HSBC Floating Rate Fund – – 4,474,099 46,000 4,474,099 46,014Kotak Floater ST Growth – – 2,568,294 28,055 2,568,294 28,160Kotak Floater ST Growth – – 8,674,769 95,000 8,674,769 95,113Prudential ICICI Mutual Fund – Floating Rate Plan C – – 2,289,342 23,825 2,289,342 23,853Prudential ICICI Mutual Fund – Floating Rate Plan C – – 14,411,437 150,000 14,411,437 150,154Reliance Mutual Fund – Liquid – – 4,457,828 72,347 4,457,828 72,581Reliance Mutual Fund – Liquid TP – IP – – 1,847,450 30,000 1,847,450 30,080Tata Mutual Fund Floating Rate – – 4,636,121 48,055 4,636,121 48,119Tata Mutual Fund Floating Rate – – 8,680,304 90,000 8,680,304 90,095Tata Mutual Fund Floating Rate – – 7,712,330 80,000 7,712,330 80,048Tata Mutual Fund Floating Rate – – 7,708,837 80,000 7,708,837 80,012Templeton India Mutual Fund – Floater – – 1,697,968 20,433 1,697,968 20,465Templeton India Mutual Fund – Floater – – 2,576,664 31,011 2,576,664 31,055Templeton India Mutual Fund – Floater – – 2,031,447 24,449 2,031,447 24,498Templeton India Mutual Fund – Floater – – 456,280 5,496 456,280 5,502Deutsche Liquid Cash Plus – IP – – 166,353 1,734 166,353 1,741Deutsche Liquid Cash Plus – IP – – 9,391,135 98,061 9,391,135 98,259Grindlays Cash Fund S-Plan C – – 3,899,778 41,023 3,899,778 41,227Grindlays Cash Fund S-Plan C – – 6,912,106 73,031 6,912,106 73,073ING Vysya Liquid – IP – – 4,918,408 51,510 4,918,408 51,564ING Vysya Liquid – IP – – 4,620,118 48,429 4,620,118 48,436ABN AMRO Liquid Fund I Plan – – 760,485 7,846 760,485 7,886Deutsche Floating Rate Fund – – 2,272,667 24,360 2,272,667 24,533Deutsche Liquid Cash Plus – IP – – 929,784 9,709 929,784 9,728Deutsche Liquid Cash Plus – IP – – 6,692,097 70,000 6,692,097 70,019Deutsche Liquid Cash Plus – IP – – 1,935,608 20,247 1,935,608 20,252HDFC Mutual Fund – Cash Mgmt. Saving Plus Plan – – 6,910,516 99,282 6,910,516 100,000ING Vysya Liquid – IP – – 4,919,864 51,571 4,919,864 51,594ING Vysya Liquid – IP – – 2,861,148 30,000 2,861,148 30,004ING Vysya Liquid – IP – – 381,486 4,000 381,486 4,001Kotak Floater ST Growth – – 9,610,986 105,378 9,610,986 105,470Templeton India Mutual Fund –Floater – – 3,870,289 46,622 3,870,289 46,690UTI Floater – – 4,592,633 49,789 4,592,633 50,000Deutsche Liquid Cash Plus – IP – – 4,756,489 49,753 4,756,489 49,798Deutsche Liquid Cash Plus – IP – – 19,334 202 19,334 202Grindlays Cash Fund S-Plan C – – 1,265,375 13,369 1,265,375 13,387Grindlays Cash Fund S-Plan C – – 4,405,916 46,571 4,405,916 46,613Deutsche Liquid Cash Plus – IP – – 10,686,588 111,798 10,686,588 111,913Deutsche Liquid Cash Plus – IP – – 19,100,737 200,000 19,100,737 200,029Grindlays FRF STP Plan C – Super IP – – 14,452,232 152,977 14,452,232 153,000Principal Floating Rate Fund – – 6,295,460 65,000 6,295,460 65,355Principal Floating Rate Fund – – 9,395,622 97,100 9,395,622 97,539Templeton India Mutual Fund – Floater – – 654,296 7,882 654,296 7,900Templeton India Mutual Fund – Floater – – 5,810,238 70,000 5,810,238 70,150Templeton India Mutual Fund – Floater – – 6,207,743 74,939 6,207,743 74,950UTI Liquid Fund Cash Plan – I Plan – – 63,939 70,000 63,939 70,135Birla Mutual Fund – Floater – – 7,269,753 80,000 7,269,753 80,045Deutsche Floating Rate Fund – – 18,504,811 199,937 18,504,811 200,000Grindlays FRF STP Plan C – Super IP – – 1,608,231 17,023 1,608,231 17,031Grindlays FRF STP Plan C – Super IP – – 8,501,313 90,000 8,501,313 90,028J M Liquid Fund – – 9,507,330 100,000 9,507,330 100,046Kotak Liquid Premium – – 4,760,313 64,062 4,760,313 64,100Templeton India Mutual Fund – Floater – – 10,359,658 125,061 10,359,658 125,116UTI Floater – – 1,864,335 20,211 1,864,335 20,322UTI Floater – – 8,745,604 95,000 8,745,604 95,330UTI Floater – – 7,738,179 84,311 7,738,179 84,348Grindlays FRF STP Plan C – Super IP – – 2,359,737 24,993 2,359,737 25,000J M Mutual Fun Floating Rate – – 5,324,367 58,250 5,324,367 58,677Tata Mutual Fund Floating Rate – – 9,607,625 99,719 9,607,625 100,000Kotak Liquid Premium – – 1,927,407 25,938 1,927,407 25,977Kotak Liquid Premium – – 1,782,425 23,991 1,782,425 24,023
120

Balance Purchased Sale/Redemption as on 1.04.05 During the Year Proceeds
Particulars Units INR Units INR Units INR(Rs. ‘000) (Rs .‘000) (Rs. ‘000)
Principal Liquid Fund – – 7,691,272 80,000 7,691,272 80,013UTI Floater – – 4,582,531 49,929 4,582,531 50,000Grindlays FRF STP Plan C – Super IP – – 3,305,236 35,007 3,305,236 35,039Grindlays FRF STP Plan C – Super IP – – 1,411,300 14,954 1,411,300 14,961HSBC Liquid Fund – – 3,853,587 40,475 3,853,587 40,534HSBC Liquid Fund – – 7,606,660 80,000 7,606,660 80,011Principal Liquid Fund – – 9,612,519 100,000 9,612,519 100,014Prudential ICICI Mutual Fund – Short Term – – 15,761,311 200,000 15,761,311 201,789Prudential ICICI Mutual Fund – Short Term – – 641,351 8,162 641,351 8,211Reliance Mutual Fund – Short Term Fund – – 17,574,340 202,894 17,574,340 204,657J M Mutual Fun Floating Rate – – 6,594,227 72,142 6,594,227 72,704Prudential ICICI Mutual Fund – Floating Rate Plan C – – 20,091,656 210,000 20,091,656 210,038Reliance Mutual Fund – Floater – – 19,673,989 204,657 19,673,989 204,686Grindlays FRF STP Plan C – Super IP – – 3,376,311 35,776 3,376,311 35,808Grindlays FRF STP Plan C – Super IP – – 2,281,025 24,177 2,281,025 24,192Grindlays Cash Fund S-Plan C – – 3,607,329 38,129 3,607,329 38,248Kotak Liquid Premium – – 7,414,218 99,792 7,414,218 100,000Reliance Mutual Fund – Liquid TP – IP – – 2,755,361 45,000 2,755,361 45,027Tata Liquid Fund – – 65,119 80,000 65,119 80,096UTI Floater – – 1,446,441 15,760 1,446,441 15,794UTI Floater – – 770,815 8,401 770,815 8,416Birla Mutual Fund – Short Term Debt – – 4,816,194 60,009 4,816,194 60,406Birla Mutual Fund – Short Term Debt – – 7,220,566 90,012 7,220,566 90,562Deutsche Mutual Fund – Short Term – – 8,754,191 99,291 8,754,191 100,000HDFC Mutual Fund – Cash Mgmt. Saving Plus Plan – – 6,686,869 96,069 6,686,869 97,076ING Vysya Mutual Fund – Short Term Debt – – 9,589,934 99,452 9,589,934 100,000Kotak Mahindra Mutual Fund – Short Term Debt – – 4,136,607 49,648 4,136,607 50,000Prudential ICICI Mutual Fund – Short Term – – 11,145,449 141,838 11,145,449 142,792Prudential ICICI Mutual Fund – Short Term – – 562,599 7,162 562,599 7,208Templeton India Mutual Fund – Short Term Debt – – 79,251 97,312 79,251 98,000Birla Mutual Fund – Floater – – 4,532,064 49,993 4,532,064 50,000Deutsche Liquid Cash Plus – IP – – 4,763,220 49,993 4,763,220 50,000HSBC Floating Rate Fund – – 6,796,182 70,000 6,796,182 70,181Kotak Liquid Premium – – 796,300 10,718 796,300 10,745Kotak Liquid Premium – – 2,055,444 27,698 2,055,444 27,735ING Vysya Liquid – – 9,508,777 100,000 9,508,777 100,088ING Vysya Liquid – – 5,076,644 53,420 5,076,644 53,436Prudential ICICI Mutual Fund – Floating Rate Plan C – – 5,737,728 60,000 5,737,728 60,080Prudential ICICI Mutual Fund – Floating Rate Plan C – – 3,812,458 39,885 3,812,458 39,920Templeton India Mutual Fund – Floater – – 8,259,343 100,000 8,259,343 100,018Birla Mutual Fund – Floater – – 9,153,805 100,975 9,153,805 101,066Grindlays FRF STP Plan C – Super IP – – 2,156,491 22,858 2,156,491 22,902Grindlays FRF STP Plan C – Super IP – – 4,858,196 51,510 4,858,196 51,594Grindlays FRF STP Plan C – Super IP – – 2,683,995 28,466 2,683,995 28,504Prudential ICICI Mutual Fund – Floating Rate Plan C – – 9,548,818 99,897 9,548,818 100,000UTI Mutual Fund Short Term – – 4,537,658 50,000 4,537,658 50,099Deutsche Liquid Cash Plus – IP – – 4,764,582 50,007 4,764,582 50,066Deutsche Liquid Cash Plus – IP – – 4,752,068 49,876 4,752,068 49,934Grindlays FRF STP Plan C – Super IP – – 3,916,230 41,534 3,916,230 41,603Grindlays FRF STP Plan C – Super IP – – 790,450 8,392 790,450 8,397Templeton India Mutual Fund – Floater – – 8,256,343 100,000 8,256,343 100,014Deutsche Liquid Cash Plus – IP – – 1,917,394 20,124 1,917,394 20,148Deutsche Liquid Cash Plus – IP – – 9,518,008 100,000 9,518,008 100,014ING Vysya Liquid – – 4,749,466 50,000 4,749,466 50,008Kotak Liquid Premium – – 804,540 10,842 804,540 10,867Kotak Liquid Premium – – 3,706,010 50,000 3,706,010 50,059Prudential ICICI Mutual Fund – Floating Rate Plan C – – 976,738 10,218 976,738 10,230Prudential ICICI Mutual Fund – Floating Rate Plan C – – 5,795,204 60,628 5,795,204 60,700Deutsche Liquid Cash Plus – IP – – 9,988,109 105,000 9,988,109 105,015J M Mutual Fund Floating Rate – – 6,346,098 70,000 6,346,098 70,140J M Mutual Fund Floating Rate – – 1,172,563 12,936 1,172,563 12,960Prudential ICICI Mutual Fund – Floating Rate Plan C – – 3,763,471 39,372 3,763,471 39,436Prudential ICICI Mutual Fund – Floating Rate Plan C – – 3,820,658 40,000 3,820,658 40,036Prudential ICICI Mutual Fund – Floating Rate Plan C – – 2,913,356 30,506 2,913,356 30,528Reliance Fixed Maturity 30 Days – – 20,000,000 200,000 20,000,000 200,956
121

Balance Purchased Sale/Redemption as on 1.04.05 During the Year Proceeds
Particulars Units INR Units INR Units INR(Rs. ‘000) (Rs .‘000) (Rs. ‘000)
Tata Mutual Fund Floating Rate – – 27,029 281 27,029 282Tata Mutual Fund Floating Rate – – 10,321,300 107,316 10,321,300 107,738UTI Floater – – 7,487,050 81,599 7,487,050 81,925UTI Floater – – 1,651,880 18,006 1,651,880 18,075ABN AMRO Liquid Fund I Plan – – 2,406,832 25,000 2,406,832 25,084Grindlays FRF STP Plan C – Super IP – – 8,628,673 91,608 8,628,673 91,731Grindlays FRF STP Plan C – Super IP – – 777,780 8,261 777,780 8,269HDFC Floater – – 8,215,679 92,462 8,215,679 92,640J M Mutual Fund Floating Rate – – 2,453,220 27,064 2,453,220 27,118Kotak Liquid Premium – – 5,552,430 75,000 5,552,430 75,055Principal Floating Rate Fund – – 5,768,399 60,000 5,768,399 60,133Principal Floating Rate Fund – – 9,605,410 100,000 9,605,410 100,133Prudential ICICI Mutual Fund – Short Term – – 11,220,220 142,838 11,220,220 144,121Prudential ICICI Mutual Fund – Short Term – – 457,657 5,860 457,657 5,879Tata Mutual Fund Floating Rate – – 1,219,936 12,684 1,219,936 12,738Tata Mutual Fund Floating Rate – – 6,238,303 65,000 6,238,303 65,138Tata Mutual Fund Floating Rate – – 2,118,745 22,080 2,118,745 22,123UTI Floater – – 1,507,496 16,432 1,507,496 16,500Deutsche Floating Rate Fund – – 10,366,392 112,005 10,366,392 112,509Deutsche Floating Rate Fund – – 690,255 7,489 690,255 7,491Grindlays FRF STP Plan C – Super IP – – 752,403 7,992 752,403 8,000ING ST Floater – – 8,274,784 85,598 8,274,784 86,044ING ST Floater – – 293,925 3,053 293,925 3,056Reliance Mutual Fund – Floater – – 12,604,720 131,192 12,604,720 131,500Kotak Floater ST Growth – – 2,017,663 22,122 2,017,663 22,263Kotak Liquid Premium – – 1,154,293 12,667 1,154,293 12,737Kotak Liquid Premium – – 1,123,840 12,333 1,123,840 12,425HDFC Floater – – 409,997 4,614 409,997 4,629HDFC Floater – – 3,109,453 35,000 3,109,453 35,104HDFC Floater – – 9,744,948 110,000 9,744,948 110,017Deutsche Liquid Cash Plus – IP – – 12,352,718 130,000 12,352,718 130,158HDFC Mutual Fund – Cash Mgmt. Saving Plan – – 7,146,788 100,000 7,146,788 100,014Kotak Liquid Premium – – 553,759 7,485 553,759 7,500Kotak Liquid Premium – – 3,803,556 51,415 3,803,556 51,522Kotak Liquid Premium – – 2,840,570 38,444 2,840,570 38,478ABN AMRO Liquid Fund I Plan – – 9,586,165 100,000 9,586,165 100,151ABN AMRO Liquid Fund I Plan – – 5,025,284 52,470 5,025,284 52,501Birla Mutual Fund – Liquid – I Plan Premium – – 9,440,201 100,490 9,440,201 100,624Birla Mutual Fund – Liquid – I Plan Premium – – 7,039,411 75,000 7,039,411 75,034CAN Bank Floater – – 4,411,678 45,000 4,411,678 45,055Deutsche Mutual Fund – Short Term – – 62,518 709 62,518 717Deutsche Mutual Fund – Short Term – – 8,789,895 100,000 8,789,895 100,787Deutsche Mutual Fund – Short Term – – 6,845,900 78,367 6,845,900 78,496Deutsche Floating Rate Fund – – 8,988,634 97,526 8,988,634 97,786Deutsche Floating Rate Fund – – 11,969,773 130,158 11,969,773 130,218Grindlays FRF STP Plan C – Super IP – – 7,884,506 83,747 7,884,506 84,020Grindlays FRF STP Plan C – Super IP – – 366,796 3,900 366,796 3,909HDFC Mutual Fund – Cash Mgmt. Saving Plus Plan – – 9,600,812 139,829 9,600,812 140,000HSBC Liquid Fund – – 8,513,214 90,000 8,513,214 90,014ING ST Floater – – 14,488,531 150,472 14,488,531 151,001ING Vysya Liquid – – 7,585,527 80,000 7,585,527 80,118J M Mutual Fund Floating Rate – – 4,600,045 50,865 4,600,045 50,974Kotak Liquid Premium – – 5,411,362 73,236 5,411,362 73,324Kotak Liquid Premium – – 5,437,346 73,599 5,437,346 73,676Principal Liquid Fund – – 2,215,001 23,090 2,215,001 23,166Principal Liquid Fund – – 6,713,855 70,000 6,713,855 70,220Principal Liquid Fund – – 4,781,989 50,000 4,781,989 50,014Prudential ICICI Mutual Fund – Short Term – – 15,540,016 198,963 15,540,016 200,000Prudential ICICI Mutual Fund – Floating Rate Plan C – – 5,108,801 53,494 5,108,801 53,684Reliance Mutual Fund – Floater – – 2,016,540 20,989 2,016,540 21,084Tata Mutual Fund Floating Rate – – 5,557,987 57,920 5,557,987 58,180Tata Mutual Fund Floating Rate – – 5,280,863 55,066 5,280,863 55,280Tata Liquid Fund SHIP – – 38,171 47,100 38,171 47,172Tata Liquid Fund SHIP – – 72,917 90,000 72,917 90,110Tata Liquid Fund SHIP – – 80,969 100,000 80,969 100,061
122

Balance Purchased Sale/Redemption as on 1.04.05 During the Year Proceeds
Particulars Units INR Units INR Units INR(Rs. ‘000) (Rs .‘000) (Rs. ‘000)
Templeton India Mutual Fund – Short Term Debt – – 2,189 2,688 2,189 2,720Templeton India Mutual Fund – Short Term Debt – – 56,908 70,000 56,908 70,698Templeton India Mutual Fund – Short Term Debt – – 21,398 26,508 21,398 26,582UTI Floater – – 6,932,089 75,562 6,932,089 76,064UTI Floater – – 642,184 7,000 642,184 7,046UTI Floater – – 5,041,570 55,000 5,041,570 55,320UTI Floater – – 4,812,866 52,621 4,812,866 52,810UTI Liquid Fund – – 90,616 100,000 90,616 100,061Prudential ICICI Mutual Fund – Liquid – – 4,730,187 78,669 4,730,187 78,900UTI Floater – – 7,992,051 87,379 7,992,051 87,749UTI Floater – – 1,115,832 12,202 1,115,832 12,251Prudential ICICI Mutual Fund – Liquid – – 380,688 6,331 380,688 6,351Prudential ICICI Mutual Fund – Liquid – – 2,316,733 38,608 2,316,733 38,649Tata Mutual Fund Floating Rate – – 4,309,255 44,934 4,309,255 45,136Tata Mutual Fund Floating Rate – – 5,238,013 54,804 5,238,013 54,864Prudential ICICI Mutual Fund – BPBG Blended Plan B – – 9,951,437 100,000 9,951,437 100,370UTI Floater – – 3,465,436 37,897 3,465,436 38,067UTI Floater – – 1,996,706 21,835 1,996,706 21,933Principal Liquid Fund – – 6,418,424 66,910 6,418,424 67,000DSP ML Floater – – 8,061,049 90,000 8,061,049 90,037Kotak Liquid Premium – – 1,456,963 19,721 1,456,963 19,771Kotak Liquid Premium – – 2,957,088 40,087 2,957,088 40,129Tata Liquid Fund SHIP – – 48,530 60,000 48,530 60,063Kotak Liquid Premium – – 3,313,152 44,913 3,313,152 44,967Kotak Liquid Premium – – 4,794,147 65,000 4,794,147 65,067UTI Floater – – 7,147,656 78,165 7,147,656 78,560UTI Floater – – 2,041,681 22,413 2,041,681 22,440Kotak Floater ST Growth – – 2,707,899 29,982 2,707,899 30,000Tata Mutual Fund Floating Rate – – 3,841,774 40,196 3,841,774 40,299Tata Mutual Fund Floating Rate – – 5,691,296 59,674 5,691,296 59,701Kotak Floater ST Growth – – 4,510,559 49,941 4,510,559 50,000Kotak Floater ST Growth – – 911,133 10,088 911,133 10,100Kotak Liquid Premium – – 6,618,328 89,867 6,618,328 90,000UTI Floater – – 5,245,953 57,587 5,245,953 57,769UTI Floater – – 2,018,783 22,188 2,018,783 22,231Deutsche Liquid Cash Plus – IP – – 4,740,099 50,100 4,740,099 50,173Deutsche Liquid Cash Plus – IP – – 4,255,641 45,000 4,255,641 45,046Deutsche Liquid Cash Plus – IP – – 451,681 4,780 451,681 4,781HDFC Mutual Fund – Cash Mgmt. Saving Plus Plan – – 681,161 9,921 681,161 9,975HDFC Mutual Fund – Cash Mgmt. Saving Plus Plan – – 3,074,643 44,814 3,074,643 45,025ABN AMRO Liquid Fund – I Plan – – 2,871,528 30,000 2,871,528 30,142ABN AMRO Liquid Fund – I Plan – – 6,655,004 69,589 6,655,004 69,858Deutsche Liquid Cash Plus – IP – – 4,745,825 50,220 4,745,825 50,264Deutsche Liquid Cash Plus – IP – – 4,318,304 45,703 4,318,304 45,736Kotak Liquid Premium – – 3,471,151 47,133 3,471,151 47,259Kotak Liquid Premium – – 3,873,851 52,625 3,873,851 52,741Prudential ICICI Mutual Fund – Liquid – – 1,790,799 29,843 1,790,799 30,000Deutsche Liquid Cash Plus – IP – – 3,303,632 34,964 3,303,632 35,000Deutsche Liquid Cash Plus – IP – – 3,716,468 39,333 3,716,468 39,397Deutsche Liquid Cash Plus – IP – – 1,000,202 10,598 1,000,202 10,603Deutsche Liquid Cash Plus – IP – – 4,716,670 49,977 4,716,670 50,000HSBC Floating Rate Fund – – 2,890,898 30,000 2,890,898 30,153Principal Floating Rate Fund – – 4,756,424 49,831 4,756,424 50,000Tata Mutual Fund Floating Rate – – 1,461,644 15,326 1,461,644 15,392Tata Mutual Fund Floating Rate – – 8,034,401 84,435 8,034,401 84,608HSBC Floating Rate Fund – – 1,902,828 19,815 1,902,828 19,847HSBC Floating Rate Fund – – 4,806,190 50,050 4,806,190 50,130ING Vysya Liquid – – 9,414,068 100,000 9,414,068 100,014Reliance Fixed Maturity 30 Days – – 16,000,000 160,000 16,000,000 160,638ABN AMRO Liquid Fund – I Plan – – 995,667 10,411 995,667 10,473ABN AMRO Liquid Fund – I Plan – – 3,964,047 41,500 3,964,047 41,697Principal Floating Rate Fund – – 4,276,428 44,802 4,276,428 45,000UTI Liquid Fund – – 56,523 62,614 56,523 62,850ABN AMRO Floating Rate Fund – – 4,777,603 50,000 4,777,603 50,227ABN AMRO Floating Rate Fund – – 3,117,309 32,659 3,117,309 32,773
123

Balance Purchased Sale/Redemption as on 1.04.05 During the Year Proceeds
Particulars Units INR Units INR Units INR(Rs. ‘000) (Rs .‘000) (Rs. ‘000)
HSBC Floating Rate Fund – – 4,334,127 45,134 4,334,127 45,259HSBC Floating Rate Fund – – 9,592,878 100,000 9,592,878 100,174Principal Floating Rate Fund – – 512,230 5,366 512,230 5,391Principal Floating Rate Fund – – 5,015,877 52,719 5,015,877 52,789UTI Floater – – 4,804,982 52,812 4,804,982 53,119UTI Floater – – 4,999,545 55,000 4,999,545 55,269UTI Floater – – 5,256,667 57,926 5,256,667 58,112Alliance Cash Manager I Plan – – 12,885,911 145,000 12,885,911 145,349UTI Floater – – 3,818,154 42,074 3,818,154 42,223UTI Floater – – 5,210,835 57,500 5,210,835 57,623UTI Floater – – 3,149,083 34,769 3,149,083 34,824Grindlay Short Term – – 3,727,699 50,000 3,727,699 50,687Grindlay Short Term – – 3,718,689 50,000 3,718,689 50,565UTI Floater – – 488,114 5,389 488,114 5,400Templeton India Mutual Fund – Short Term Debt – – 59,338 73,510 59,338 74,367Templeton India Mutual Fund – Short Term Debt – – 80,685 100,014 80,685 101,121Principal Floating rate Fund – – 1,168,415 12,281 1,168,415 12,308UTI Floater – – 1,807,632 19,958 1,807,632 20,000Principal Floating Rate Fund – – 8,324,835 87,511 8,324,835 87,692Prudential ICICI Mutual Fund – Floating Rate Plan C – – 4,725,987 50,000 4,725,987 50,058Prudential ICICI Mutual Fund – Floating Rate Plan C – – 9,435,510 99,856 9,435,510 99,942Birla Mutual Fund – Liquid – I Plan Premium – – 9,199,907 98,830 9,199,907 98,845J M Mutual Fund Floating Rate – – 5,398,256 60,000 5,398,256 60,315J M Mutual Fund Floating Rate – – 3,551,811 39,514 3,551,811 39,685Deutsche Liquid Cash Plus – IP – – 1,833,219 19,425 1,833,219 19,481UTI Floater – – 1,348,096 14,884 1,348,096 14,921Principal Floating Rate Fund – – 2,139,297 22,489 2,139,297 22,542Principal Floating Rate Fund – – 7,351,161 77,299 7,351,161 77,458UTI Floater – – 7,687,042 84,908 7,687,042 85,079Reliance Mutual Fund – Liquid TP – IP – – 7,554,833 124,822 7,554,833 125,000Deutsche Liquid Cash Plus – IP – – 1,862,120 19,769 1,862,120 19,789Birla Mutual Fund – Liquid – I Plan Premium – – 7,724,092 83,000 7,724,092 83,012Kotak Liquid Premium – – 3,487,426 47,375 3,487,426 47,657Kotak Liquid Premium – – 2,539,640 34,500 2,539,640 34,705Reliance Mutual Fund – Liquid TP – IP – – 2,167,746 35,816 2,167,746 35,878Prudential ICICI Mutual Fund – Floating Rate Plan C – – 4,265,708 45,144 4,265,708 45,202Prudential ICICI Mutual Fund – Floating Rate Plan C – – 7,058,679 74,734 7,058,679 74,798Reliance Mutual Fund – Liquid – – 9,870,012 99,896 9,870,012 100,000Deutsche Liquid Cash Plus – IP – – 5,927,515 63,000 5,927,515 63,009Deutsche Liquid Cash Plus – IP – – 3,036,054 32,231 3,036,054 32,273HSBC Liquid Fund – – 7,519,206 80,160 7,519,206 80,172Kotak Liquid Premium – – 1,290,738 17,636 1,290,738 17,638Kotak Liquid Premium – – 6,028,138 82,364 6,028,138 82,412Kotak Liquid Premium – – 1,286,456 17,585 1,286,456 17,588ABN AMRO Floating Rate Fund – – 1,177,977 12,341 1,177,977 12,412ABN AMRO Floating Rate Fund – – 6,823,691 71,500 6,823,691 71,898J M Mutual Fund Floating Rate – – 5,059,425 56,286 5,059,425 56,589ABN AMRO Floating Rate Fund – – 540,068 5,673 540,068 5,690J M Mutual Fund Floating Rate – – 3,881,201 43,313 3,881,201 43,411Prudential ICICI Mutual Fund – Floating Rate Plan C – – 9,427,470 99,814 9,427,470 100,000Reliance Mutual Fund – Liquid – – 2,465,313 24,952 2,465,313 25,000Grindlays FRF STP Plan C – Super IP – – 6,510,780 70,000 6,510,780 70,040Prudential ICICI Mutual Fund – Liquid – – 1,893,104 31,548 1,893,104 31,873DSP ML Floater – – 8,878,156 99,264 8,878,156 100,000UTI Floater – – 8,330 92 8,330 92UTI Floater – – 7,689,942 85,000 7,689,942 85,252Prudential ICICI Mutual Fund – Floating Rate Plan C – – 514,872 5,451 514,872 5,464Reliance Mutual Fund – Liquid – – 5,529,651 55,967 5,529,651 56,099Prudential ICICI Mutual Fund – Floating Rate Plan C – – 8,025,985 85,000 8,025,985 85,171Reliance Mutual Fund – Liquid – – 4,327,227 43,835 4,327,227 43,901Kotak Liquid Premium – – 3,727,171 50,948 3,727,171 51,000Prudential ICICI Mutual Fund – Liquid – – 1,670,624 28,110 1,670,624 28,127Tata Mutual Fund Floating Rate – – 1,481,071 15,565 1,481,071 15,663Tata Mutual Fund Floating Rate – – 6,249,406 65,800 6,249,406 66,089Tata Mutual Fund Floating Rate – – 6,453,652 67,972 6,453,652 68,249
124

Balance Purchased Sale/Redemption as on 1.04.05 During the Year Proceeds
Particulars Units INR Units INR Units INR(Rs. ‘000) (Rs .‘000) (Rs. ‘000)
ABN AMRO Floating Rate Fund – – 9,264,787 97,327 9,264,787 97,691ABN AMRO Floating Rate Fund – – 1,142,313 12,000 1,142,313 12,045ABN AMRO Floating Rate Fund – – 2,016,674 21,242 2,016,674 21,264DSP ML Floater – – 65,828 736 65,828 742DSP ML Floater – – 5,664,888 63,500 5,664,888 63,842J M Mutual Fund Floating Rate – – 5,975,695 66,687 5,975,695 66,917DSP ML Floater – – 870,111 9,781 870,111 9,806Reliance Mutual Fund – Liquid – – 5,544,344 56,165 5,544,344 56,282Reliance Mutual Fund – Liquid – – 1,974,002 20,000 1,974,002 20,038J M Mutual Fund Floating Rate – – 2,954,311 33,068 2,954,311 33,083Tata Mutual Fund Floating Rate – – 3,040,951 32,028 3,040,951 32,187Tata Mutual Fund Floating Rate – – 6,406,827 67,490 6,406,827 67,813Grindlays Cash Fund S-Plan C – – 6,965,599 75,000 6,965,599 75,011Prudential ICICI Mutual Fund – Floating Rate Plan C – – 6,871,752 73,000 6,871,752 73,010UTI Liquid Fund – – 20,208 22,386 20,208 22,569Tata Mutual Fund Floating Rate – – 5,500,331 57,940 5,500,331 58,235Tata Mutual Fund Floating Rate – – 3,555,615 37,500 3,555,615 37,645Deutsche Mutual Fund – Short Term – – 8,224,303 95,282 8,224,303 95,516Kotak Liquid Premium – – 1,570,470 21,467 1,570,470 21,518ABN AMRO Floating Rate Fund – – 3,489,621 36,758 3,489,621 36,839ABN AMRO Floating Rate Fund – – 4,249,467 44,768 4,249,467 44,861Kotak Liquid Premium – – 947,484 12,955 947,484 12,982Kotak Liquid Premium – – 2,554,446 34,927 2,554,446 35,000Tata Mutual Fund Floating Rate – – 389,066 4,111 389,066 4,119Principal Floating Rate Fund – – 3,079,372 32,500 3,079,372 32,543Principal Floating Rate Fund – – 4,043,433 42,687 4,043,433 42,732Principal Floating Rate Fund – – 447,074 4,701 447,074 4,725Deutsche Mutual Fund – Short Term – – 1,889,785 21,633 1,889,785 21,948J M Mutual Fund Floating Rate – – 3,566,588 39,922 3,566,588 40,000Kotak Liquid Premium – – 886,216 12,117 886,216 12,152Kotak Liquid Premium – – 9,139,164 125,000 9,139,164 125,315Principal Floating Rate Fund – – 3,534,334 37,313 3,534,334 37,379Principal Floating Rate Fund – – 5,921,037 62,519 5,921,037 62,621Tata Mutual Fund Floating Rate – – 5,289,634 55,889 5,289,634 56,045Tata Mutual Fund Floating Rate – – 5,337,720 56,447 5,337,720 56,555HDFC Floater – – 5,742,100 65,000 5,742,100 65,676HDFC Floater – – 3,000,916 34,273 3,000,916 34,324ABN AMRO Floating Rate Fund – – 1,920,443 20,232 1,920,443 20,298ABN AMRO Floating Rate Fund – – 5,689,523 60,000 5,689,523 60,136ABN AMRO Floating Rate Fund – – 11,849,577 125,000 11,849,577 125,245J M Mutual Fund Floating Rate – – 2,413,016 27,010 2,413,016 27,071J M Mutual Fund Floating Rate – – 2,667,786 29,866 2,667,786 29,929Prudential ICICI Mutual Fund – Liquid – – 2,935,261 49,390 2,935,261 49,542Prudential ICICI Mutual Fund – Liquid – – 1,804,609 30,420 1,804,609 30,458HDFC Floater – – 1,377,022 15,727 1,377,022 15,768HDFC Floater – – 1,750,915 20,000 1,750,915 20,050Birla Mutual Fund – Short Term Debt – – 7,778,945 98,845 7,778,945 99,329Birla Mutual Fund – Short Term Debt – – 6,530,904 83,012 6,530,904 83,393Deutsche Floating Rate Fund – – 9,150,805 100,000 9,150,805 100,874DSP ML Floater – – 9,805,476 110,219 9,805,476 110,803HSBC Short Term – – 10,527,094 120,546 10,527,094 122,787HSBC Short Term – – 2,333,098 27,017 2,333,098 27,213ING Vysya Liquid – – 4,681,955 50,000 4,681,955 50,086Kotak Mahindra Mutual Fund –Short Term Debt – – 29,330 352 29,330 361Kotak Mahindra Short Term – – 4,140,958 50,000 4,140,958 50,973Kotak Mahindra Short Term – – 8,160,001 100,000 8,160,001 100,446Kotak Mahindra Short Term – – 3,917,324 48,026 3,917,324 48,220Principal Floating Rate Fund – – 2,602,659 27,481 2,602,659 27,558Prudential ICICI Mutual Fund – Blended Fund Inst. Plan –B – – 10,030,900 100,370 10,030,900 101,949Prudential ICICI Mutual Fund – Liquid – – 4,578,458 77,180 4,578,458 77,343Prudential ICICI Mutual Fund – Liquid – – 1,341,259 22,624 1,341,259 22,657Reliance Mutual Fund – Short Term Fund – – 9,424,022 109,768 9,424,022 111,800Tata Mutual Fund Floating Rate – – 3,409,159 36,053 3,409,159 36,164Tata Mutual Fund Floating Rate – – 7,561,580 80,000 7,561,580 80,212Templeton India Mutual Fund – Short Term Debt – – 175,488 175,488 175,488 176,367
125

Balance Purchased Sale/Redemption as on 1.04.05 During the Year Proceeds
Particulars Units INR Units INR Units INR(Rs. ‘000) (Rs .‘000) (Rs. ‘000)
ABN AMRO Floating Rate Fund I Plan – – 10,000,000 100,000 10,000,000 100,136ABN AMRO Floating Rate Fund I Plan Plus – – 1,484,381 14,848 1,484,381 14,864Birla Mutual Fund – Liquid – I Plan Premium – – 5,562,870 60,000 5,562,870 60,090Birla Mutual Fund – Liquid – I Plan Premium – – 3,694,761 39,857 3,694,761 39,910Can Bank Floater – – 7,775,823 80,000 7,775,823 80,524Can Bank Floater – – 7,741,886 80,000 7,741,886 80,173J M Mutual Fund Floating Rate – – 4,478,261 50,134 4,478,261 50,301J M Mutual Fund Floating Rate – – 4,812,884 53,945 4,812,884 54,059Prudential ICICI Mutual Fund – Liquid – – 733,688 12,376 733,688 12,398Prudential ICICI Mutual Fund – Liquid – – 6,098,643 103,007 6,098,643 103,052UTI Liquid Fund – – 44,764 50,000 44,764 50,106UTI Liquid Fund – – 89,473 100,000 89,473 100,152UTI Liquid Fund – – 44,438 49,689 44,438 49,742Principal Mutual Fund – Short Term – – 7,126,209 80,013 7,126,209 81,618Principal Mutual Fund – Short Term – – 8,906,162 100,014 8,906,162 102,004Principal Mutual Fund – Short Term – – 4,400,634 50,000 4,400,634 50,401ABN AMRO Floating Rate Fund – I Plan Plus – – 10,678,982 106,822 10,678,982 106,950Birla Mutual Fund – Liquid – I Plan Premium – – 5,278,588 56,943 5,278,588 57,027Birla Mutual Fund – Liquid – I Plan Premium – – 17,917,599 193,544 17,917,599 193,573Grindlay Short Term Plan C – – 10,119,862 101,252 10,119,862 101,861Grindlay Short Term Plan C – – 6,983,366 70,040 6,983,366 70,291Grindlay Short Term Plan C – – 7,470,486 75,011 7,470,486 75,194HDFC Mutual fund – Cash Mgmt. Saving Plus Plan – – 3,787,260 55,200 3,787,260 55,987HSBC Short Term – – 1,984,728 22,983 1,984,728 23,159HSBC Short Term – – 6,904,121 80,172 6,904,121 80,563ING Vysya Mutual Fund – Short Term Debt – – 54,276 563 54,276 577ING Vysya Mutual Fund – Short Term Debt – – 9,626,121 100,000 9,626,121 102,272ING Vysya Mutual Fund – Short Term Debt – – 9,472,739 100,014 9,472,739 100,642ING Vysya Liquid – – 19,781,220 199,968 19,781,220 200,000J M Mutual Fund Short Term – – 5,176,226 58,677 5,176,226 59,829J M Mutual Fund Short Term – – 6,409,365 72,704 6,409,365 74,083Kotak Floater ST Growth – – 902,119 9,988 902,119 10,108Kotak Mahindra Short Term – – 4,239,283 51,974 4,239,283 52,206Prudential ICICI Mutual Fund – Short Term – – 407,330 5,215 407,330 5,323Prudential ICICI Mutual Fund – Short Term – – 7,796,420 100,000 7,796,420 101,880Prudential ICICI Mutual Fund – Short Term – – 7,686,336 100,000 7,686,336 100,441Prudential ICICI Mutual Fund – Short Term – – 5,601,871 73,010 5,601,871 73,202Reliance Mutual Fund – Short Term Fund – – 8,149,080 94,918 8,149,080 96,718Reliance Mutual Fund – Short Term Fund – – 8,468,548 100,000 8,468,548 100,510Reliance Mutual Fund – Short Term Fund – – 3,038,303 35,878 3,038,303 36,060Tata Mutual Fund – Short Term – – 8,394,614 100,000 8,394,614 102,120Tata Mutual Fund – Short Term – – 8,285,828 100,000 8,285,828 100,796UTI Liquid Fund – – 44,994 50,311 44,994 50,372UTI Liquid Fund – – 3,285 3,674 3,285 3,678UTI Liquid Fund – – 28,011 31,326 28,011 31,373UTI Liquid Fund – – 5,024 5,621 5,024 5,627Birla Mutual Fund – Liquid – I Plan Premium – – 9,248,127 99,897 9,248,127 100,000ING Vysya Liquid – – 10,884,524 110,032 10,884,524 110,162ING Vysya Liquid Super IP – – 3,936,146 39,797 3,936,146 39,838Tata Liquid Fund SHIP – – 68,013 85,000 68,013 85,293Tata Liquid Fund SHIP – – 11,728 14,698 11,728 14,707Birla Mutual Fund – Liquid – I Plan Premium – – 607,166 6,559 607,166 6,571Birla Mutual Fund – Liquid – I Plan Premium – – 1,702,794 18,415 1,702,794 18,429Birla Mutual Fund – Liquid – I Plan Premium – – 4,076,431 44,085 4,076,431 44,125Birla Mutual Fund – Liquid – I Plan Premium – – 3,129,578 33,860 3,129,578 33,875ING Vysya Liquid Super IP – – 3,481,811 35,203 3,481,811 35,271ING Vysya Liquid Super IP – – 5,007,740 50,676 5,007,740 50,729UTI Liquid Fund – – 66,479 74,379 66,479 74,571UTI Liquid Fund – – 22,669 25,394 22,669 25,429ABN AMRO Floating Rate Fund I Plan Plus – – 8,398,427 84,009 8,398,427 84,282ABN AMRO Floating Rate Fund I Plan Plus – – 1,566,199 15,667 1,566,199 15,718Birla Mutual Fund – Liquid – I Plan Premium – – 9,237,107 99,941 9,237,107 100,000Grindlays FRF STP Plan C – Super IP – – 9,244,451 100,000 9,244,451 100,056J M Mutual Fund Floating Rate – – 2,324,556 26,055 2,324,556 26,169J M Mutual Fund Floating Rate – – 2,116,927 23,753 2,116,927 23,831
126

Balance Purchased Sale/Redemption as on 1.04.05 During the Year Proceeds
Particulars Units INR Units INR Units INR(Rs. ‘000) (Rs .‘000) (Rs. ‘000)
Reliance Mutual Fund – Liquid – – 19,611,689 200,000 19,611,689 200,210Templeton India Mutual Fund – Liquid – – 35,203 60,000 35,203 60,033ING Vysya Liquid Super IP – – 5,917,393 59,882 5,917,393 60,000Prudential ICICI Mutual Fund – Long Term – – 10,636,261 150,000 10,636,261 152,413Grindlays Cash Fund S-Plan C – – 9,229,094 99,597 9,229,094 100,000Grindlays Cash Fund S-Plan C – – 500,696 5,403 500,696 5,426Grindlays Cash Fund S-Plan C – – 7,867,092 85,000 7,867,092 85,255Grindlays Cash Fund S-Plan C – – 859,943 9,304 859,943 9,319ING Vysya Liquid Super IP – – 1,427,134 14,442 1,427,134 14,484ING Vysya Liquid Super IP – – 5,928,268 60,000 5,928,268 60,165ING Vysya Liquid Super IP – – 2,497,980 25,293 2,497,980 25,351Prudential ICICI Mutual Fund – Liquid – – 1,006,069 16,993 1,006,069 17,063Prudential ICICI Mutual Fund – Liquid – – 1,941,975 32,878 1,941,975 32,937Templeton India Mutual Fund –Floater – – 11,392,004 115,000 11,392,004 115,016Prudential ICICI Mutual Fund – Liquid – – 1,602,009 27,122 1,602,009 27,175Prudential ICICI Mutual Fund – Liquid – – 5,354,390 90,772 5,354,390 90,825ABN AMRO Floating Rate Fund I Plan Plus – – 8,430,802 84,333 8,430,802 84,763ABN AMRO Floating Rate Fund I Plan Plus – – 1,515,488 15,185 1,515,488 15,237Birla Mutual Fund – Liquid – I Plan Premium – – 6,118,457 66,199 6,118,457 66,360Birla Mutual Fund – Liquid – I Plan Premium – – 3,101,702 33,605 3,101,702 33,640DSP Liquid Fund – – 3,583,566 59,856 3,583,566 60,000J M Mutual Fund Floating Rate – – 2,428,365 27,247 2,428,365 27,388J M Mutual Fund Floating Rate – – 1,991,666 22,384 1,991,666 22,462Kotak Liquid Premium – – 3,626,394 49,881 3,626,394 50,000Tata Liquid Fund SHIP – – 68,061 85,302 68,061 85,600Tata Liquid Fund SHIP – – 10,782 13,527 10,782 13,560UTI Liquid Fund – – 66,601 74,606 66,601 74,856UTI Liquid Fund – – 22,371 25,071 22,371 25,144HDFC Liquid Fund – – 3,664,426 50,000 3,664,426 50,125J M Mutual Fund Floating Rate – – 4,652,524 52,290 4,652,524 52,480UTI Liquid Fund – – 40,090 44,929 40,090 45,067UTI Liquid Fund – – 4,389 4,921 4,389 4,933ABN AMRO Floating Rate Fund – I Plan Plus – – 4,967,764 49,775 4,967,764 50,000Birla Mutual Fund – Liquid – I Plan Premium – – 2,436,266 26,395 2,436,266 26,456Birla Mutual Fund – Liquid – I Plan Premium – – 2,168,125 23,519 2,168,125 23,544Grindlay Short Term Plan C – – 9,902,167 100,000 9,902,167 100,149ING Vysya Mutual Fund – Short Term Debt – – 9,384,472 100,000 9,384,472 100,107Prudential ICICI Mutual Fund – Liquid – – 2,943,653 49,903 2,943,653 50,000SBI MF MIIF Saving – – 9,069,554 99,895 9,069,554 100,000Tata Liquid Fund SHIP – – 39,707 49,817 39,707 50,000Templeton India Mutual Fund – Short Term Debt – – 114,167 115,016 114,167 115,136DSP Liquid Fund – – 906,672 15,144 906,672 15,204DSP Liquid Fund – – 4,776,604 80,000 4,776,604 80,098DSP Liquid Fund – – 1,174,657 19,677 1,174,657 19,698SBI MF MIIF Saving – – 9,552 105 9,552 105SBI MF MIIF Saving – – 7,261,109 80,000 7,261,109 80,084SBI MF MIIF Saving – – 1,796,262 19,808 1,796,262 19,811DSP Liquid Fund – – 3,605,982 60,403 3,605,982 60,487DSP Liquid Fund – – 559,368 9,379 559,368 9,383Sahara Mutual Fund – Liquid Fund VP – – 24,376 30,000 24,376 30,047Templeton India Mutual Fund – Liquid – – 107,361 115,136 107,361 115,186Reliance Mutual Fund – Liquid – – 10,382,491 125,000 10,382,491 125,202Tata Liquid Fund SHIP – – 103,508 129,864 103,508 130,500UTI Liquid Fund – – 84,799 95,079 84,799 95,548UTI Liquid Fund – IP – – 12,456 14,000 12,456 14,035UTI Liquid Fund – IP – – 45,633 51,329 45,633 51,417Birla Mutual Fund – Liquid – I Plan Premium – – 7,373,244 79,981 7,373,244 80,202Birla Mutual Fund – Liquid – I Plan Premium – – 3,199,135 34,724 3,199,135 34,798DSP Liquid Fund – – 11,561,970 193,851 11,561,970 194,180DSP Liquid Fund – – 11,027,198 185,000 11,027,198 185,198ING Vysya Liquid Super IP – – 3,929,157 39,785 3,929,157 40,000Tata Liquid Fund SHIP – – 5,413 6,792 5,413 6,829Tata Liquid Fund SHIP – – 39,846 50,000 39,846 50,268Tata Liquid Fund SHIP – – 45,898 57,832 45,898 57,902ABN AMRO Floating Rate Fund – I Plan Plus – – 1,501,098 15,040 1,501,098 15,141
127

Balance Purchased Sale/Redemption as on 1.04.05 During the Year Proceeds
Particulars Units INR Units INR Units INR(Rs. ‘000) (Rs .‘000) (Rs. ‘000)
ABN AMRO Floating Rate Fund – – 10,891,704 109,405 10,891,704 109,859Birla Mutual Fund – Liquid – I Plan Premium – – 2,789,330 30,276 2,789,330 30,350Birla Mutual Fund – Liquid – I Plan Premium – – 13,344,500 145,000 13,344,500 145,197Birla Mutual Fund – Liquid – I Plan Premium – – 2,247,341 24,423 2,247,341 24,453CAN Bank Floater – – 7,235,681 75,000 7,235,681 75,493CAN Bank Floater – – 2,348,831 24,399 2,348,831 24,507DSP Liquid Fund – – 99,937 100,000 99,937 100,031DSP Liquid Fund – – 49,921 49,961 49,921 49,969HSBC Liquid Fund – – 3,713,779 40,000 3,713,779 40,079HSBC Liquid Fund – – 5,552,430 59,813 5,552,430 59,921ING Vysya Liquid Super IP – – 3,448,918 34,922 3,448,918 35,123ING Vysya Liquid Super IP – – 7,103,114 72,000 7,103,114 72,336ING Vysya Liquid Super IP – – 4,177,389 42,449 4,177,389 42,541J M Mutual Fund Floating Rate – – 29,002 326 29,002 328J M Mutual Fund Floating Rate – – 6,664,238 75,000 6,664,238 75,407J M Mutual Fund Floating Rate – – 888,431 10,000 888,431 10,053J M Mutual Fund Floating Rate – – 3,435,466 38,693 3,435,466 38,873Kotak Liquid Premium – – 3,643,742 50,119 3,643,742 50,399Kotak Liquid Premium – – 3,586,027 49,540 3,586,027 49,601Kotak Liquid Premium – – 1,373,448 18,974 1,373,448 19,000Reliance Mutual Fund – FMP VII – – 20,020,985 200,210 20,020,985 201,171Reliance Mutual Fund – Liquid – – 12,052,657 123,563 12,052,657 123,600SBI MF MIIF Saving – – 8,178,801 90,192 8,178,801 90,355Tata Liquid Fund SHIP – – 53,308 67,168 53,308 67,261Tata Liquid Fund SHIP – – 25,947 32,704 25,947 32,739UTI Liquid Fund IP – – 7,708 8,671 7,708 8,692UTI Liquid Fund IP – – 66,655 75,000 66,655 75,162UTI Liquid Fund IP – – 44,437 50,000 44,437 50,108UTI Liquid Fund IP – – 14,223 16,016 14,223 16,038ABN AMRO Floating Rate Fund – – 1,801,431 18,095 1,801,431 18,173ABN AMRO Floating Rate Fund – – 7,453,935 75,000 7,453,935 75,196ABN AMRO Floating Rate Fund – – 657,304 6,625 657,304 6,631Birla Mutual Fund – Liquid – I Plan Premium – – 10,108,157 109,850 10,108,157 110,000Can Bank Floater – – 7,278,032 75,601 7,278,032 75,947Can Bank Floater – – 3,263,314 33,963 3,263,314 34,053DSP Liquid fund – – 119,868 119,962 119,868 120,000Grindlays Cash Fund S-Plan C – – 3,299,407 35,696 3,299,407 35,880Grindlays Cash Fund S-Plan C – – 6,911,296 75,000 6,911,296 75,158Grindlays Cash Fund S-Plan C – – 9,227,388 100,149 9,227,388 100,345Grindlays Cash Fund S-Plan C – – 3,551,050 38,582 3,551,050 38,617ING Vysya Liquid Super IP – – 1,235,198 12,551 1,235,198 12,581ING Vysya Liquid Super IP – – 9,848,687 100,107 9,848,687 100,312ING Vysya Liquid Super IP – – 8,552,257 87,012 8,552,257 87,107J M Mutual Fund Floating Rate – – 2,380,191 26,807 2,380,191 26,936J M Mutual Fund Floating Rate – – 8,863,912 100,000 8,863,912 100,312J M Mutual Fund Floating Rate – – 2,010,410 22,706 2,010,410 22,752Kotak Liquid Premium – – 216,860 2,996 216,860 3,000Kotak Liquid Premium – – 1,373,448 19,000 1,373,448 19,000Kotak Liquid Premium – – 2,554,446 35,000 2,554,446 35,338Reliance Mutual Fund – Liquid – – 159,953 1,640 159,953 1,641Reliance Mutual Fund – Liquid – – 7,802,214 80,000 7,802,214 80,024Tata Liquid Fund SHIP – – 61,327 77,296 61,327 77,391Tata Liquid Fund SHIP – – 18,708 23,584 18,708 23,609UTI Liquid Fund IP – – 96,783 108,984 96,783 109,152UTI Liquid Fund IP – – 9,619 10,836 9,619 10,848Birla Mutual Fund – Liquid – I Plan Premium – – 3,747,562 40,727 3,747,562 40,819Birla Mutual Fund – Liquid – I Plan Premium – – 5,708,833 62,060 5,708,833 62,181Grindlays Cash Fund S-Plan C – – 1,050,883 11,418 1,050,883 11,438Grindlays Cash Fund S-Plan C – – 5,839,586 63,485 5,839,586 63,562ABN AMRO Floating Rate Fund – – 5,791,941 58,375 5,791,941 58,492ABN AMRO Floating Rate Fund – – 4,110,226 41,451 4,110,226 41,508DSP Liquid Fund – – 99,781 99,860 99,781 100,000Grindlays Cash Fund S-Plan C – – 1,519,104 16,515 1,519,104 16,537Grindlays Cash Fund S-Plan C – – 4,359,898 47,420 4,359,898 47,463ING Vysya Liquid Super IP – – 14,036,473 142,808 14,036,473 143,114
128

Balance Purchased Sale/Redemption as on 1.04.05 During the Year Proceeds
Particulars Units INR Units INR Units INR(Rs. ‘000) (Rs .‘000) (Rs. ‘000)
ING Vysya Liquid Super IP – – 2,063,135 21,010 2,063,135 21,036Kotak Liquid Premium – – 2,786,198 38,490 2,786,198 38,585Kotak Liquid Premium – – 824,276 11,401 824,276 11,415Tata Liquid Fund SHIP – – 79,159 99,786 79,159 100,000UTI Liquid Fund IP – – 88,559 99,769 88,559 100,000ING Vysya Liquid Super IP – – 1,998,961 20,357 1,998,961 20,400DSP Liquid Fund – – 49,795 49,834 49,795 50,000Tata Liquid Fund SHIP – – 60,790 76,631 60,790 76,935Tata Liquid Fund SHIP – – 18,225 23,013 18,225 23,065UTI Liquid Fund IP – – 79,350 89,394 79,350 89,756UTI Liquid Fund IP – – 9,056 10,220 9,056 10,244CAN Bank Floater – – 2,501,759 26,037 2,501,759 26,195CAN Bank Floater – – 7,174,768 75,000 7,174,768 75,124ING Vysya Liquid Super IP – – 7,230,459 73,633 7,230,459 73,892ING Vysya Liquid Super IP – – 4,891,346 49,827 4,891,346 49,988UTI Floater – – 7,559,924 85,000 7,559,924 85,026DSP Liquid Fund – – 59,714 59,761 59,714 60,019DSP Liquid Fund – – 39,778 39,847 39,778 39,981SBI MF MIIF Saving – – 9,016,807 99,969 9,016,807 100,000Grindlays Cash Fund S-Plan C – – 9,617,763 104,607 9,617,763 105,000HSBC Floating Rate Fund – – 6,464,510 64,882 6,464,510 65,000ING Vysya Liquid Super IP – – 5,465,656 55,678 5,465,656 55,900Reliance Mutual Fund – Liquid – – 3,892,792 40,000 3,892,792 40,090UTI Liquid Fund IP – – 55,628 62,776 55,628 63,000Birla Mutual Fund – Liquid – I Plan Premium – – 3,674,101 39,940 3,674,101 40,158Birla Mutual Fund – Liquid – I Plan Premium – – 9,169,769 100,000 9,169,769 100,226Birla Mutual Fund – Liquid – I Plan Premium – – 5,454,392 59,548 5,454,392 59,617CAN Bank Liquid Fund – – 7,965,969 99,624 7,965,969 100,000Grindlays Cash Fund S-Plan C – – 641,147 6,973 641,147 7,002HSBC Liquid Fund – – 945,658 10,187 945,658 10,250ING Vysya Liquid Super IP – – 441,286 4,495 441,286 4,514ING Vysya Liquid Super IP – – 7,349,123 75,000 7,349,123 75,175ING Vysya Liquid Super IP – – 1,985,623 20,271 1,985,623 20,311Kotak Liquid Premium – – 5,682,517 78,599 5,682,517 78,949Kotak Liquid Premium – – 1,515,145 20,999 1,515,145 21,051Prudential ICICI Mutual Fund – Liquid – – 692,411 11,738 692,411 11,835Reliance Mutual Fund – Liquid – – 8,263,370 100,000 8,263,370 100,114Reliance Mutual Fund – Liquid – – 2,536,934 30,706 2,536,934 30,736Tata Liquid Fund SHIP – – 78,906 99,635 78,906 100,000ABN AMRO Floating Rate Fund – – 3,822,426 38,549 3,822,426 38,726ABN AMRO Floating Rate Fund – – 7,434,502 75,000 7,434,502 75,320ABN AMRO Floating Rate Fund – – 3,548,821 35,904 3,548,821 35,954DSP Liquid Fund – – 119,945 120,153 119,945 120,638DSP Liquid Fund – – 101,075 101,360 101,075 101,658DSP Liquid Fund – – 27,545 27,645 27,545 27,704J M Mutual Fund Floating Rate – – 6,843,771 77,294 6,843,771 77,803J M Mutual Fund Floating Rate – – 8,813,666 99,652 8,813,666 100,197Prudential ICICI Mutual Fund – Floating Rate Plan C – – 5,881,767 59,000 5,881,767 59,208Prudential ICICI Mutual Fund – Floating Rate Plan C – – 9,962,640 100,000 9,962,640 100,288Prudential ICICI Mutual Fund – Floating Rate Plan C – – 3,030,266 30,451 3,030,266 30,504UTI Liquid Fund IP – – 1,776 2,004 1,776 2,012UTI Liquid Fund IP – – 81,525 92,114 81,525 92,358UTI Liquid Fund IP – – 49,105 55,501 49,105 55,630Kotak Liquid Premium – – 719,652 9,974 719,652 10,000SBI MF MIIF Saving – – 9,022,338 100,031 9,022,338 100,106Tata Liquid Fund SHIP – – 27,613 34,867 27,613 35,000Reliance Mutual Fund – FMP VIII – – 20,117,085 201,171 20,117,085 202,195DSP Liquid Fund – – 32,238 32,355 32,238 32,441DSP Liquid Fund – – 98,938 99,411 98,938 99,559ING Vysya Liquid Super IP – – 7,856,962 80,209 7,856,962 80,445J M Mutual Fund Floating Rate – – 30,804 348 30,804 350J M Mutual Fund Floating Rate – – 4,783,083 54,237 4,783,083 54,420Reliance Mutual Fund – Liquid – – 7,790,572 94,294 7,790,572 94,521Reliance Mutual Fund – Liquid – – 4,952,375 60,000 4,952,375 60,086Reliance Mutual Fund – Liquid – – 2,475,636 30,000 2,475,636 30,036
129

Balance Purchased Sale/Redemption as on 1.04.05 During the Year Proceeds
Particulars Units INR Units INR Units INR(Rs. ‘000) (Rs .‘000) (Rs. ‘000)
Reliance Mutual Fund – Liquid – – 16,674,348 202,195 16,674,348 202,305Reliance Mutual Fund – Liquid – – 6,597,340 80,000 6,597,340 80,044Tata Liquid Fund SHIP – – 1,968 2,485 1,968 2,497Tata Liquid Fund SHIP – – 76,865 97,206 76,865 97,503UTI Liquid Fund IP – – 39,580 44,735 39,580 44,874UTI Liquid Fund IP – – 48,622 55,015 48,622 55,126Reliance Mutual Fund – Liquid – – 13,736,898 141,648 13,736,898 141,670UTI Liquid Fund IP – – 51,661 58,455 51,661 58,590Birla Mutual Fund – Liquid – I Plan Premium – – 8,285,143 90,452 8,285,143 90,767Birla Mutual Fund – Liquid – I Plan Premium – – 4,493,943 49,111 4,493,943 49,233CAN Bank Liquid Fund – – 4,028,082 50,376 4,028,082 50,686CAN Bank Liquid Fund – – 4,117,700 51,727 4,117,700 51,814DSP Liquid Fund – – 117,074 117,633 117,074 118,000HSBC Liquid Fund – – 9,205,560 99,952 9,205,560 100,000Reliance Mutual Fund – Liquid – – 14,530,941 149,836 14,530,941 150,000Tata Mutual Fund Floating Rate – – 7,453,787 80,000 7,453,787 80,192Tata Mutual Fund Floating Rate – – 1,376,359 14,777 1,376,359 14,808Birla Mutual Fund – Liquid – I Plan Premium – – 3,284,099 35,889 3,284,099 35,985Birla Mutual Fund – Liquid – I Plan Premium – – 4,117,109 45,000 4,117,109 45,112Birla Mutual Fund – Liquid – I Plan Premium – – 9,147,624 100,000 9,147,624 100,233Birla Mutual Fund – Liquid – I Plan Premium – – 1,703,839 18,635 1,703,839 18,669CAN Bank Liquid Fund – – 5,832,786 73,273 5,832,786 73,408CAN Bank Liquid Fund – – 7,959,059 100,000 7,959,059 100,168CAN Bank Liquid Fund – – 2,099,585 26,384 2,099,585 26,424DSP Liquid Fund – – 14,337 14,406 14,337 14,453DSP Liquid Fund – – 49,713 50,000 49,713 50,114DSP Liquid Fund – – 99,409 100,000 99,409 100,212DSP Liquid Fund – – 62,218 62,629 62,218 62,720HDFC Floater – – 16,532,911 191,878 16,532,911 192,000HSBC Liquid Fund – – 9,214,378 100,048 9,214,378 100,111J M Mutual Fund Floating Rate – – 4,917,607 55,763 4,917,607 56,031J M Mutual Fund Floating Rate – – 8,817,409 100,000 8,817,409 100,465J M Mutual Fund Floating Rate – – 7,679,952 87,169 7,679,952 87,505Kotak Liquid Premium – – 4,980,574 69,027 4,980,574 69,362Kotak Liquid Premium – – 6,023,558 83,560 6,023,558 83,887Kotak Liquid Premium – – 3,092,546 43,000 3,092,546 43,068Kotak Liquid Premium – – 5,298,001 73,689 5,298,001 73,783Principal Liquid Fund – – 6,523,218 70,000 6,523,218 70,114Principal Liquid Fund – – 13,973,767 150,000 13,973,767 150,194Principal Liquid Fund – – 12,066,304 129,607 12,066,304 129,692Prudential ICICI Mutual Fund – Floating Rate Plan C – – 9,408,907 94,549 9,408,907 94,925Prudential ICICI Mutual Fund – Floating Rate Plan C – – 12,934,809 130,000 12,934,809 130,497Prudential ICICI Mutual Fund – Floating Rate Plan C – – 12,348,220 124,161 12,348,220 124,579Reliance Mutual Fund – Liquid – – 17,020,519 175,507 17,020,519 175,727Reliance Mutual Fund – Liquid – – 2,351,067 24,258 2,351,067 24,273SBI MF MIIF Saving – – 7,838,685 87,000 7,838,685 87,177Tata Liquid Fund SHIP – – 29,886 37,794 29,886 37,964Tata Mutual Fund Floating Rate – – 7,937,837 85,223 7,937,837 85,414Tata Mutual Fund Floating Rate – – 6,002,295 64,504 6,002,295 64,586Birla Mutual Fund – Liquid – I Plan Premium – – 5,610,580 61,365 5,610,580 61,518Birla Mutual Fund – Liquid – I Plan Premium – – 3,236,072 35,440 3,236,072 35,482Birla Mutual Fund – Liquid – I Plan Premium – – 5,894,931 64,560 5,894,931 64,700Birla Mutual Fund – Liquid – I Plan Premium – – 7,229,756 79,219 7,229,756 79,350CAN Bank Liquid Fund – – 3,470,781 43,616 3,470,781 43,755CAN Bank Liquid Fund – – 6,444,660 81,053 6,444,660 81,245DSP Liquid Fund – – 37,126 37,371 37,126 37,488DSP Liquid Fund – – 86,668 87,310 86,668 87,512ABN AMRO Floating Rate Fund – – 6,390,593 64,655 6,390,593 65,000ABN AMRO Floating Rate Fund – – 2,415,783 24,441 2,415,783 24,578ABN AMRO Floating Rate Fund – – 7,413,192 75,384 7,413,192 75,422Birla Mutual Fund – Liquid – I Plan Premium – – 3,721,847 40,781 3,721,847 40,876Birla Mutual Fund – Liquid – I Plan Premium – – 5,383,465 59,018 5,383,465 59,124CAN Bank Liquid Fund – – 5,482,157 68,947 5,482,157 69,160CAN Bank Liquid Fund – – 1,255,587 15,821 1,255,587 15,840J M Mutual Fund Floating Rate – – 1,130,466 12,831 1,130,466 12,908
130

Balance Purchased Sale/Redemption as on 1.04.05 During the Year Proceeds
Particulars Units INR Units INR Units INR(Rs. ‘000) (Rs .‘000) (Rs. ‘000)
J M Mutual Fund Floating Rate – – 7,476,866 85,000 7,476,866 85,375J M Mutual Fund Floating Rate – – 150,386 1,711 150,386 1,717Prudential ICICI Mutual Fund – Floating Rate Plan C – – 580,671 5,839 580,671 5,872Prudential ICICI Mutual Fund – Floating Rate Plan C – – 6,953,827 70,000 6,953,827 70,318Prudential ICICI Mutual Fund – Floating Rate Plan C – – 2,354,645 23,752 2,354,645 23,810Tata Mutual Fund Floating Rate – – 7,955,738 85,496 7,955,738 85,796Tata Mutual Fund Floating Rate – – 1,317,087 14,163 1,317,087 14,204ABN AMRO Floating Rate Fund – – 14,713,095 149,616 14,713,095 149,759Birla Mutual Fund – Liquid – I Plan Premium – – 6,773,630 74,258 6,773,630 74,430DSP Liquid Fund – – 12,596 12,690 12,596 12,734DSP Liquid Fund – – 86,323 87,078 86,323 87,266HDFC Floater – – 699,852 8,122 699,852 8,149HDFC Floater – – 11,718,945 136,030 11,718,945 136,462HSBC Floating Rate Fund – – 3,498,924 35,118 3,498,924 35,368HSBC Floating Rate Fund – – 4,970,327 50,000 4,970,327 50,241HSBC Floating Rate Fund – – 2,217,122 22,343 2,217,122 22,411J M Mutual Fund floating Rate – – 9,516,204 108,289 9,516,204 108,712Prudential ICICI Mutual Fund – Floating Rate Plan C – – 10,830,512 109,248 10,830,512 109,576Prudential ICICI Mutual Fund – Floating Rate Plan C – – 4,856,871 49,000 4,856,871 49,138Reliance Mutual Fund – Liquid – – 12,186,775 125,742 12,186,775 126,156Tata Mutual Fund Floating Rate – – 6,122,421 65,837 6,122,421 66,059CAN Bank Liquid Fund – – 7,921,231 99,810 7,921,231 100,000DSP Liquid Fund – – 72,290 72,922 72,290 73,093DSP Liquid Fund – – 27,898 28,170 27,898 28,207Reliance Mutual Fund – Liquid – – 6,401,733 77,846 6,401,733 78,000CAN Bank Liquid Fund – – 1,537,213 19,369 1,537,213 19,413CAN Bank Liquid Fund – – 6,381,321 80,393 6,381,321 80,587Principal Liquid Fund – – 6,553,589 70,393 6,553,589 70,668Principal Liquid Fund – – 123,526 1,327 123,526 1,332Birla Mutual Fund – Liquid – I Plan Premium – – 613,365 6,724 613,365 6,748Birla Mutual Fund – Liquid – I Plan Premium – – 8,476,718 92,974 8,476,718 93,252DSP Liquid Fund – – 70,050 70,733 70,050 70,900DSP Liquid Fund – – 20,894 21,098 20,894 21,147DSP Liquid Fund – – 8,747 8,835 8,747 8,853HSBC Floating Rate Fund – – 7,706,073 77,657 7,706,073 77,974Kotak Liquid Premium – – 2,610,604 36,311 2,610,604 36,500Kotak Liquid Premium – – 4,541,755 63,211 4,541,755 63,500Principal Liquid Fund – – 9,267,583 99,594 9,267,583 100,000Reliance Mutual Fund – Liquid – – 5,606,392 68,174 5,606,392 68,376Reliance Mutual Fund – Liquid – – 2,592,951 31,556 2,592,951 31,624Prudential ICICI Mutual Fund – Floating Rate Plan D – – 11,612,757 117,571 11,612,757 117,650ABN AMRO Floating Rate Fund Long Term – – 10,000,000 100,000 10,000,000 101,674Standard Chartered Liquidity Fund – – 1,494,307 14,979 1,494,307 15,000ABN AMRO Liquid Fund I Plan – – 4,645,631 50,000 4,645,631 50,091ABN AMRO Liquid Fund I Plus Plan – – 9,804,306 100,000 9,804,306 100,067Birla Mutual Fund – Liquid – I Plan Premium – – 2,464,002 27,026 2,464,002 27,143Birla Mutual Fund – Liquid – I Plan Premium – – 6,613,703 72,589 6,613,703 72,857Deutsche Liquid Cash Plus – IP – – 9,186,955 99,524 9,186,955 100,000Standard Chartered Liquidity Fund – – 9,951,635 99,757 9,951,635 100,000Prudential ICICI Mutual Fund – Floating Rate Plan D – – 3,400,627 34,429 3,400,627 34,493Prudential ICICI Mutual Fund – Floating Rate Plan D – – 7,148,312 72,409 7,148,312 72,507Reliance Mutual Fund – Liquid – – 4,391,494 53,444 4,391,494 53,632Reliance Mutual Fund – Liquid – – 3,796,703 46,252 3,796,703 46,368DSP Liquid Fund – – 50,655 51,165 50,655 51,348DSP Liquid Fund – – 71,671 72,430 71,671 72,652CAN Bank Liquid Fund – – 762,556 9,607 762,556 9,654CAN Bank Liquid Fund – – 8,479,442 106,936 8,479,442 107,346Kotak Liquid Premium – – 6,065,233 84,414 6,065,233 85,000Tata Mutual Fund Floating Rate – – 4,618,170 49,886 4,618,170 50,000Standard Chartered Liquidity Fund – – 525,088 5,264 525,088 5,283Standard Chartered Liquidity Fund – – 7,472,799 75,000 7,472,799 75,181Standard Chartered Liquidity Fund – – 1,941,878 19,493 1,941,878 19,536HSBC Cash Fund I Plus Plan – – 9,145,449 99,699 9,145,449 100,000Kotak Liquid Premium – – 3,763,202 52,375 3,763,202 52,748Kotak Liquid Premium – – 3,371,145 47,213 3,371,145 47,252
131

Balance Purchased Sale/Redemption as on 1.04.05 During the Year Proceeds
Particulars Units INR Units INR Units INR(Rs. ‘000) (Rs .‘000) (Rs. ‘000)
LIC Liquid Fund – – 7,168,744 90,000 7,168,744 90,110LIC Liquid Fund – – 786,768 9,879 786,768 9,890Reliance Mutual Fund – Liquid – – 5,643,377 68,748 5,643,377 69,000Reliance Mutual Fund – Liquid – – 2,535,378 30,959 2,535,378 31,000Principal Liquid Fund – – 4,620,346 49,653 4,620,346 50,000ABN AMRO Liquid Fund I Plan – – 8,809,195 90,000 8,809,195 90,060Birla Mutual Fund – Liquid – I Plan Premium – – 219,698 2,411 219,698 2,424Birla Mutual Fund – Liquid – I Plan Premium – – 7,250,560 79,630 7,250,560 80,007Birla Mutual Fund – Liquid – I Plan Premium – – 1,592,145 17,527 1,592,145 17,569CAN Bank Liquid Fund – – 1,432,383 18,064 1,432,383 18,159CAN Bank Liquid Fund – – 4,753,567 60,000 4,753,567 60,262DSP Liquid Fund – – 47,072 47,570 47,072 47,789DSP Liquid Fund – – 61,277 62,073 61,277 62,211Standard Chartered Liquidity Fund – – 8,020,167 80,507 8,020,167 80,729Standard Chartered Liquidity Fund – – 1,914,463 19,241 1,914,463 19,271Principal Liquid Fund – – 3,482,613 37,426 3,482,613 37,694Principal Liquid Fund – – 5,945,858 64,093 5,945,858 64,356Prudential ICICI Mutual Fund – Floating Rate Plan D – – 2,230,235 22,591 2,230,235 22,659Prudential ICICI Mutual Fund – Floating Rate Plan D – – 9,580,672 97,113 9,580,672 97,341Reliance Mutual Fund – Liquid – – 5,133,697 62,686 5,133,697 62,800Deutsche Liquid Cash Plus – IP – – 4,659,370 50,476 4,659,370 50,830Deutsche Liquid Cash Plus – IP – – 2,893,041 31,528 2,893,041 31,560LIC Liquid Fund – – 7,946,978 99,788 7,946,978 100,000Birla Mutual Fund – Liquid – I Plan Premium – – 7,491,827 82,473 7,491,827 82,727Birla Mutual Fund – Liquid – I Plan Premium – – 2,243,464 24,739 2,243,464 24,773DSP Liquid Fund – – 27,569 27,927 27,569 28,008DSP Liquid Fund – – 49,333 50,000 49,333 50,120DSP Liquid Fund – – 21,528 21,853 21,528 21,872Standard Chartered Liquidity Fund – – 9,030,484 90,759 9,030,484 90,962Standard Chartered Liquidity Fund – – 5,861,105 58,977 5,861,105 59,038Kotak Liquid Premium – – 3,055,131 42,787 3,055,131 42,874Kotak Liquid Premium – – 4,070,726 57,020 4,070,726 57,126Principal Liquid Fund – – 3,331,096 35,907 3,331,096 36,078Principal Liquid Fund – – 5,550,981 60,000 5,550,981 60,122Principal Liquid Fund – – 4,967,316 53,727 4,967,316 53,800CAN Bank Floater Fund – – 9,436,455 99,650 9,436,455 100,000HSBC Cash Fund I Plus Plan – – 4,614,125 50,301 4,614,125 50,520HSBC Cash Fund I Plus Plan – – 6,163,213 67,301 6,163,213 67,480Kotak Liquid Premium – – 5,567,037 77,980 5,567,037 78,138Kotak Liquid Premium – – 5,119,920 71,801 5,119,920 71,862LIC Liquid Fund – – 822,905 10,333 822,905 10,362LIC Liquid Fund – – 3,977,060 50,000 3,977,060 50,081LIC Liquid Fund – – 3,141,333 39,500 3,141,333 39,557DSP Liquid Fund – – 81,913 83,147 81,913 83,323DSP Liquid Fund – – 16,394 16,653 16,394 16,677Standard Chartered Liquidity Fund – – 4,076,881 41,023 4,076,881 41,114Standard Chartered Liquidity Fund – – 5,839,130 58,806 5,839,130 58,886Standard Chartered Liquidity Fund – – 6,572,746 66,194 6,572,746 66,284Standard Chartered Liquidity Fund – – 3,343,266 33,710 3,343,266 33,716Kotak Liquid Premium – – 2,545,620 35,699 2,545,620 35,767Kotak Liquid Premium – – 4,571,514 64,154 4,571,514 64,233Kotak Liquid Premium – – 2,554,343 35,846 2,554,343 35,890Kotak Liquid Premium – – 4,562,791 64,065 4,562,791 64,110UTI Liquid Fund – – 5,582,215 109,000 5,582,215 109,098UTI Liquid Fund – – 1,581,146 30,879 1,581,146 30,902Prudential ICICI Mutual Fund – Floating Rate Plan D – – 4,724,351 47,887 4,724,351 48,097Prudential ICICI Mutual Fund – Floating Rate Plan D – – 6,276,858 63,765 6,276,858 63,903ABN AMRO Flexi Debt Fund – – 9,656,476 101,674 9,656,476 102,209ABN AMRO Flexi Debt Fund – – 4,515,190 47,591 4,515,190 47,791CAN Bank Floater Fund – – 2,355,091 24,870 2,355,091 25,000Principal Liquid Fund – – 2,891,267 31,273 2,891,267 31,367Principal Liquid Fund – – 8,169,762 88,426 8,169,762 88,633DSP Liquid Fund – – 91,898 93,347 91,898 93,582DSP Liquid Fund – – 6,302 6,406 6,302 6,418Prudential ICICI Mutual Fund – Floating Rate Plan D – – 3,074,733 31,235 3,074,733 31,330
132

Balance Purchased Sale/Redemption as on 1.04.05 During the Year Proceeds
Particulars Units INR Units INR Units INR(Rs. ‘000) (Rs .‘000) (Rs. ‘000)
Prudential ICICI Mutual Fund – Floating Rate Plan D – – 6,739,388 68,555 6,739,388 68,670Birla Mutual Fund–Liquid – I Plan Premium – – 4,517,324 49,813 4,517,324 50,000Prudential ICICI Mutual Fund – Floating Rate Plan D – – 3,091,231 31,445 3,091,231 31,520Prudential ICICI Mutual Fund – Floating Rate Plan D – – 4,757,611 48,455 4,757,611 48,511DSP Liquid Fund – – 116,671 118,594 116,671 118,918DSP Liquid Fund – – 31,083 31,676 31,083 31,682Standard Chartered Liquidity Fund – – 1,615,625 16,290 1,615,625 16,323Standard Chartered Liquidity Fund – – 8,918,397 90,000 8,918,397 90,103UTI Liquid Fund – – 6,099,425 119,121 6,099,425 119,444UTI Liquid Fund – – 1,560,319 30,506 1,560,319 30,556Deutsche Liquid Cash Plus–IP – – 4,566,794 49,768 4,566,794 50,000Kotak Liquid Premium – – 1,847,100 25,935 1,847,100 26,022Kotak Liquid Premium – – 1,702,045 23,927 1,702,045 23,978Kotak Liquid Premium – – 2,566,018 36,073 2,566,018 36,163Kotak Liquid Premium – – 4,351,601 61,207 4,351,601 61,327ABN AMRO Liquid Fund I Plan – – 34,051,661 349,939 34,051,661 350,000Birla Mutual Fund – Liquid – I Plan Premium – – 2,307,698 25,447 2,307,698 25,608Birla Mutual Fund – Liquid – I Plan Premium – – 9,036,199 100,000 9,036,199 100,271Birla Mutual Fund – Liquid – I Plan Premium – – 2,173,757 24,098 2,173,757 24,121CAN Bank Floater Fund – – 583,337 6,160 583,337 6,215CAN Bank Floater Fund – – 9,366,165 99,110 9,366,165 99,785DSP Liquid Fund – – 86,671 88,324 86,671 88,511DSP Liquid Fund – – 39,244 40,000 39,244 40,077DSP Liquid Fund – – 20,967 21,383 20,967 21,412Kotak Liquid Premium – – 2,758,044 38,793 2,758,044 38,898Kotak Liquid Premium – – 8,517,948 120,000 8,517,948 120,133Kotak Liquid Premium – – 10,645,546 150,000 10,645,546 150,139Kotak Liquid Premium – – 701,570 9,828 701,570 9,895Principal Liquid Fund – – 1,069,308 11,574 1,069,308 11,637Principal Liquid Fund – – 4,618,255 50,000 4,618,255 50,261Principal Liquid Fund – – 3,908,370 42,445 3,908,370 42,535Prudential ICICI Mutual Fund – Floating Rate Plan D – – 7,020,227 71,545 7,020,227 71,739Prudential ICICI Mutual Fund – Floating Rate Plan D – – 11,566,019 118,000 11,566,019 118,192Prudential ICICI Mutual Fund – Floating Rate Plan D – – 14,915,168 152,260 14,915,168 152,417Prudential ICICI Mutual Fund – Floating Rate Plan D – – 748,847 7,651 748,847 7,652UTI Liquid Fund – – 1,764,319 34,494 1,764,319 34,615UTI Liquid Fund – – 2,822,931 55,271 2,822,931 55,385UTI Liquid Fund – – 3,305,960 64,729 3,305,960 64,862UTI Liquid Fund – – 1,566,719 30,692 1,566,719 30,738Kotak Liquid Premium – – 1,949,511 27,490 1,949,511 27,500Birla Mutual Fund – Liquid – I Plan Premium – – 11,356,944 125,902 11,356,944 126,098Birla Mutual Fund – Liquid – I Plan Premium – – 6,385,689 70,805 6,385,689 70,902CAN Bank Floater Fund – – 84,112 890 84,112 897CAN Bank Floater Fund – – 6,603,151 70,000 6,603,151 70,394CAN Bank Floater Fund – – 7,383,240 78,579 7,383,240 78,710Deutsche Liquid Cash Plus – IP – – 1,257,441 13,703 1,257,441 13,793Deutsche Liquid Cash Plus – IP – – 7,760,785 85,000 7,760,785 85,130Deutsche Liquid Cash Plus – IP – – 5,933,689 65,000 5,933,689 65,088Deutsche Liquid Cash Plus – IP – – 545,883 5,984 545,883 5,988DSP Liquid Fund – – 38,876 39,647 38,876 39,724DSP Liquid Fund – – 137,281 140,059 137,281 140,276HSBC Cash Fund I Plus Plan – – 4,825,999 52,699 4,825,999 53,108Kotak Liquid Premium – – 11,338,270 159,880 11,338,270 160,000LIC Liquid Fund – – 4,016,123 50,500 4,016,123 50,838Principal Liquid Fund – – 3,458,045 37,555 3,458,045 37,592Principal Liquid Fund – – 1,160,210 12,600 1,160,210 12,613Prudential ICICI Mutual Fund – Floating Rate Plan D – – 20,733,294 211,830 20,733,294 212,000Reliance Mutual Fund – Liquid – – 2,158,372 26,355 2,158,372 26,555Tata Mutual Fund Floating Rate – – 2,324,925 25,114 2,324,925 25,337Tata Liquid Fund – – 77,947 100,000 77,947 100,296Tata Liquid Fund – – 60,389 77,595 60,389 77,704UTI Liquid Fund – – 475,129 9,308 475,129 9,327UTI Liquid Fund – – 7,284,174 142,780 7,284,174 142,997UTI Liquid Fund – – 900,382 17,662 900,382 17,676
Total Non–Trade 3,795,834 61,593,087 64,642,882
133

Balance Purchased Sale/Redemption as on 1.04.05 During the Year Proceeds
Particulars Units INR Units INR Units INR(Rs. ‘000) (Rs .‘000) (Rs. ‘000)
Trade Investments6.18% GOI 2005 1,500,000 150,525 1,500,000 150,0006.18% GOI 2005 1,000,000 100,370 1,000,000 100,0006.18% GOI 2005 1,000,000 100,270 1,000,000 100,0007.05% Canara Bank 2014 150 150,000 100 100,0557.15% Union Bank 2015 100 100,000 50 50,00511.50% IDBI 2010 500,000 59,388 500,000 59,554364 Days T Bills Maturing on 14/10/2005 849,750 80,599 849,750 84,975364 Days T Bills Maturing on 14/10/2005 849,750 80,599 849,750 84,975364 Days T Bills Maturing on 14/10/2005 1,000,000 94,881 1,000,000 100,0009.81% GOI 2013 – – 1,000,000 113,550 – –7.30% REC Secured Bonds – – 50 46,500 – –364 Days T Bills Maturing on 14/04/2006 – – 578,000 54,719 – –364 Days T Bills Maturing on 14/04/2006 – – 600,000 56,802 – –8.07% GOI 2017 – – 1,000,000 103,850 – –GE Capital Services Ltd. NCD – – 100 1,018,561 – –HDFC Ltd. Commercial Paper – – 5 48,079 5 48,23810.90% IDBI OMNI Bonds – – 5 54,800 5 55,32510.90% IDBI OMNI Bonds – – 5 54,800 5 55,3258.07% GOI 2017 – – 5 52,420 5 52,4458.07% GOI 2017 – – 5 52,420 5 52,5758.07% GOI 2017 – – 5 52,420 5 52,5758.07% GOI 2017 – – 5 52,420 5 52,6007.77% SDL Gujarat 2015 – – 108,800 10,880 108,800 10,9677.77% SDL Karnataka 2015 – – 57,100 5,710 57,100 5,7647.77% SDL Rajasthan 2015 – – 161,700 16,170 161,700 16,2917.77% SDL Maharashtra 2015 – – 187,500 18,750 187,500 18,9006.85% GOI 2012 – – 500,000 50,088 500,000 50,1407.55% GOI 2010 – – 500,000 51,873 500,000 51,9007.55% GOI 2010 – – 500,000 51,873 500,000 51,9257.77% SDL Karnataka – – 500,000 50,400 500,000 51,2756.65% HDFC 2008 – – 320 320,000 320 319,9776.65% HDFC 2008 – – 200 200,000 200 199,985PFC Ltd. Commercial Paper – – 340 166,090 340 166,31710.25% GOI 2021 – – 500,000 62,375 500,000 62,75010.25% GOI 2021 – – 500,000 62,320 500,000 62,6507.25% IDBI 2015 – – 100,000 9,860 100,000 10,0107.50% GOI 2034 – – 500,000 50,000 500,000 50,2756.10% PGC 2014 – – 625,000 57,717 625,000 57,9067.4% IOB 2015 – – 1,000,000 100,000 1,000,000 100,40010.25% GOI 2021 – – 500,000 62,185 500,000 62,5407.45% BOB 2015 – – 100 100,000 100 100,400Standard Chartered Inv & Loan CP – – 1,000,000 99,851 1,000,000 100,0007.49% GOI 2017 – – 1,500,000 151,830 1,500,000 152,235HDFC Ltd. CP – – 1,000,000 99,785 1,000,000 100,000Citi Corp Finance India Ltd. CP – – 2,500,000 249,380 2,500,000 250,0006.15% Rabo India Finance P Ltd. 2005 – – 1,000,000 100,000 1,000,000 100,0006% NCD ICICI Securities Ltd. 2005 – – 2,500,000 250,000 2,500,000 250,0007.40% IOC 2015 – – 200 20,010 200 20,5606.30% GE Capital Services Ltd. 2005 – – 2,500,000 250,000 2,500,000 250,0008.07% GOI 2017 – – 500,000 53,110 500,000 53,405HDFC Ltd. CP – – 400 195,314 400 196,0366.45% ICICI Securities Ltd. 2005 – – 500 250,000 500 250,0007.40% IOC 2015 – – 24 23,421 24 23,978Citifinancial Consumer Finance India Ltd. – – 250 250,000 250 250,000DSP Merrill Lynch Capital Ltd. – – 400 198,888 400 200,0007.50% GE Capital Services India – – 50 500,000 50 500,00012% HUCO 2011 – – 500 53,450 500 54,493
Total Trade 916,632 5,952,671 5,399,726
OthersG E Countywide Intercorporate Deposit – – 1 300,000 1 300,000DSP ML Capital Ltd. – – 1 250,000 1 250,000IL & FS ICD – – 1 250,000 1 250,000G E Countrywide – – 1 250,000 1 250,000Bank of America – – 1 350,000 1 350,0006.50% IL & FS Ltd. – – 1 250,000 1 250,000IL & FS Ltd. – – 1 250,000 1 250,000
Total Others – 1,900,000 1,900,000
Total Investments 4,712,466 69,445,758 71,942,601
134

26. a) The Company uses various premises on lease to install the equipment. A provision is recognized for the costs to be
incurred for the restoration of these premises at the end of the lease period. It is expected that this provision will be
utilized at the end of the lease period of the respective sites as per the respective lease agreements.
b) The Company has introduced bonus plans aimed towards performance and retention of employees who are eligible
based on certain eligibility cirterias. This provision will be utilised at the end of the period of the bonus plan on
payment to the eligible employees.
c) The movement of Provision made for Site Restoration Cost, leave encashment and deferred bonus plan in accordance
with AS–29 ‘Provisions, Contingent liabilities and Contingent Assets’ issued by Institute of Chartered Accountants of
India, is given below:
(i) Site Restoration Cost:
Year ended Year ended
March 31, 2006 March 31, 2005
(In Rs.’000) (In Rs.’000)
Opening Balance 913,517 –
Addition during the year 854,966 913,517
Less: Utilised during the year – –
Closing Balance 1,768,483 913,517
(ii) Leave encashment:
Year ended Year ended
March 31,2006 March 31,2005
(In Rs.’000) (In Rs.’000)
Opening Balance 129,227 9,789
Acquired under the scheme of amalgamation – 71,624
Addition during the year 150,659 88,493
Less: Utilised during the year 48,376 40,679
Closing Balance 231,510 129,227
(iii) Deferred Bonus plan:
Year ended Year ended
March 31,2006 March 31,2005
(In Rs.’000) (In Rs.’000)
Opening Balance – –
Acquired under the scheme of amalgamation – –
Addition during the year 71,921 –
Less: Utilised during the year – –
Closing Balance 71,921 –
135

27. Information about Business Segments-PrimaryFor the year ended March 31, 2006
(Rs. ‘000)
Reportable Segments Mobile Broadband & Enterprise Enterprise Others Eliminations TotalService Telephone Services Services
Services Carriers Corporate
RevenueBilling Revenue/Sale of Goodsand Other Income 77,886,497 14,368,482 14,617,951 5,956,863 76,000 – 112,905,793Inter Segment Revenue 1,390,163 705,927 10,009,882 74,110 – (12,180,082) –
Total Revenue 79,276,660 15,074,409 24,627,833 6,030,973 76,000 (12,180,082) 112,905,793
ResultsSegment Result, Profit/(Loss) 16,095,910 625,962 7,767,797 1,935,248 (1,310,951) – 25,113,966
Operating Profit/(Loss)before Finance Expenses 16,095,910 625,962 7,767,797 1,935,248 (1,310,951) – 25,113,966
Net Finance Expense/(Income) net – – – – 2,256,011 – 2,256,011
Net Profit/(Loss) 16,095,910 625,962 7,767,797 1,935,248 (3,566,962) – 22,857,955Provision for Tax – – – – 1,665,243 – 1,665,243Fringe Benefit Tax – – – – 190,471 – 190,471Deferred Tax Expense – – – – 881,447 – 881,447
Net Profit/(Loss) after tax 16,095,910 625,962 7,767,797 1,935,248 (6,304,123) – 20,120,794
Other InformationSegment Assets 117,096,613 30,116,537 25,814,960 7,984,043 8,308,058 – 189,320,211Inter Segment Assets 2,118,844 10,895,906 19,002,918 3,304,018 41,039,987 (76,361,673) –Advance Tax(Net of provision for tax) – – – – 980,374 – 980,374
Total Assets 119,215,457 41,012,443 44,817,878 11,288,061 50,328,419 (76,361,673) 190,300,585
Segmental Liabilities 83,852,497 7,689,976 12,680,132 3,028,685 7,703,252 – 114,954,542Inter Segment Liabilities 20,075,885 35,645,249 16,305,686 4,272,539 62,314 (76,361,673) –Deferred Tax Liability – – – – 1,890,459 – 1,890,459
Total Liabilities 103,928,382 43,335,225 28,985,818 7,301,224 9,656,025 (76,361,673) 116,845,001
Capital Expenditure 32,787,757 10,027,692 4,776,788 1,290,082 38,407 – 48,920,726Depreciation andAmortisation 10,695,396 2,647,182 1,878,171 313,409 63,121 – 15,597,279
For the year ended March 31, 2005(Rs. ‘000)
Reportable Segments Mobile Broadband & Enterprise Enterprise Others Eliminations TotalService Telephone Services Services
Services Carriers Corporate
RevenueBilling Revenue/Sale of Goodsand Other Income 52,774,090 10,642,645 11,091,243 4,921,654 12,308 – 79,441,940Inter Segment Revenue 794,866 664,544 7,596,963 48,576 367,329 (9,472,278) –
Total Revenue 53,568,956 11,307,189 18,688,206 4,970,230 379,637 (9,472,278) 79,441,940
ResultsSegment Result, Profit/(Loss) 9,931,452 1,437,465 4,686,201 2,362,204 (315,376) – 18,101,946
Operating Profit/(Loss)before Finance Expenses 9,931,452 1,437,465 4,686,201 2,362,204 (315,376) – 18,101,946
Net Finance Expense/(Income) net – – – – 2,459,184 – 2,459,184Net Profit/(Loss) 9,931,452 1,437,465 4,686,201 2,362,204 (2,774,560) – 15,642,762Provision for Tax – – – – 86,072 – 86,072Deferred Tax Expense – – – – 3,449,951 – 3,449,951
Net Profit/(Loss) after tax 9,931,452 1,437,465 4,686,201 2,362,204 (6,310,583) – 12,106,739
Other InformationSegment Assets 85,630,271 17,905,094 20,273,214 3,346,207 11,661,083 – 138,815,869Inter Segement Assets 920,746 7,821,542 13,073,257 1,324,688 37,582,615 (60,722,848) –Advance Tax(Net of provision for tax) – – – – 671,754 – 671,754
Total Assets 86,551,017 25,726,636 33,346,471 4,670,895 49,915,452 (60,722,848) 139,487,623
Segmental Liabilities 64,213,131 3,679,996 12,739,284 890,107 11,620,135 – 93,142,653Inter Segment Liabilities 22,180,852 23,741,405 12,835,337 1,960,336 4,918 (60,722,848) –Deferred Tax Liability – – – – 1,009,011 – 1,009,011
Total Liabilities 86,393,983 27,421,401 25,574,621 2,850,443 12,634,064 (60,722,848) 94,151,664
Capital Expenditure 24,408,708* 4,371,934 3,247,497 802,275 27,540 – 32,857,954Depreciation 7,852,127 1,775,714 1,476,810 196,319 175,593 – 11,476,563
* Includes Rs.50,000 thousand for license fee paid towards Unified Access License.
136

Notes:
1. Others’ represents the unallocated revenue, profit/(loss), assets & liabilities of the Corporate office of the Company
2. Segment results represents Profit/(loss) before Finance expenses and tax.
3. Capital expenditure pertains to gross additions made to fixed assets during the year.
4. Segment Assets include Fixed Assets, Capital Work in progress, Pre-operative expenses pending allocation, Current
Assets and Miscellaneous Expenditure to the extent not written off.
5. Segment Liabilities include Secured and Unsecured loans, current liabilities and provisions.
6. Inter segment assets/liabilities represent the inter segment account balances.
7. Inter segment revenue excludes the provision of telephone services free of cost among Group Companies. Other
Inter segment revenues are accounted for at market prices. These transactions have been eliminated in consolidation.
8. The accounting policies used to derive reportable segment results are consistent with those described in the
“Significant Accounting Policies” note to the financial statements.
9. The Company has revised its estimation for Site Restoration Cost, resulting in a higher charge of depreciation by
Rs. 43,310 thousand in Mobile services and Rs. Nil in Broadband and Telephone service, Long Distance, Enterprise
Services and Others, decrease in Fixed assets and Provisions by Rs. 337,367 thousand in Mobile Services and Rs.
Nil in Broadband and Telephone services, Long Distance, Enterprise Services and Others with corresponding
impact on profit for the year and net assets of the Company.
10. During the year the Company has changed the name of its long distance and Enterprises Services segment to
Enterprise Services Carrier and Enterprise Services Corporate respectively.
Information about Geographical Segment – Secondary
The Company has operations within India as well as with entities located in other countries. The information relating to
the Geographical segments in respect of operations within India, which is the only reportable segment, the remaining
portion being attributable to others, is presented below:
(Rs. ‘000)
Particulars As at As at
March 31, 2006 March 31, 2005
Segment Revenue from external customers based on geographicallocation of customers (including Other Income)
Within India 102,396,639 71,888,881
Others 10,509,154 7,553,059
112,905,793 79,441,940
Carrying amount of Segment Assets by geographical location
Within India * 184,038,121 135,553,034
Others 6,262,464 3,934,589
190,300,585 139,487,623
Cost incurred during the year to acquire segment assets bygeographical location
Within India 45,718,253 32,151,849
Others 3,202,473 706,105
48,920,726 32,857,954
Notes:
1. ‘Others’ represents the unallocated revenue, assets and acquisition of segment assets of the Company.
2. Assets include Fixed Assets, Capital work in progress, Investments, Current Assets, Deferred Tax Asset and
Miscellaneous Expenditure to the extent not written off.
3. Cost incurred to acquire segment assets pertain to gross additions made to Fixed Assets during the year.
137

28. Related Party Disclosures:
In accordance with the requirements of Accounting Standards (AS) -18 on Related Party Disclosures, the names of the
related parties where control exists and/or with whom transactions have taken place during the year and description of
relationships, as identified and certified by the management are:
Key Management Personnel :
Sunil Bharti Mittal
Rajan Bharti Mittal
Akhil Gupta
Manoj Kohli
Other Related Parties
Name of the Related Party Relationship
Bharti Comtel Limited Subsidiary Company
Bharti Aquanet Limited Subsidiary Company
Bharti Hexacom limited Subsidiary Company
Bharti Broadband Limited Subsidiary Company
Satcom Broadband Equipment Limited Subsidiary Company
Singapore Telecommunications Limited Entity having Significant Influence
Bharti Telesoft Limited Entity where Key Management Personnel exercises significant influence
Bharti Teletech Limited Entity where Key Management Personnel exercises significant influence
Bharti Telesoft International Limited Entity where Key Management Personnel exercises significant influence
Teletech Services (India) Limited Entity where Key Management Personnel exercises significant influence
Mulberry Projects Private Limited Entity where Key Management Personnel exercises significant influence
Bharti Foundation Entity where Key Management Personnel exercises significant influence
Bharti Tele-Ventures Employees’ Trust Entity where Key Management Personnel exercises significant influence
Forum I Aviation Limited Joint Venture
Bridge Mobile Pte Limited Joint Venture
138

Rel
ated
Par
ty T
ran
sact
ion
fo
r 20
05–0
6
(Rs.
’000
)
Bh
arti
Bh
arti
Bh
arti
Satc
omB
har
tiSi
ng
apo
reFo
rum
lBr
idge
Bh
arti
Bh
arti
Bh
arti
Tele
tech
Mul
ber
ryB
har
tiB
har
tiM
ano
jN
atu
re o
fH
exac
om
Aq
uan
etB
road
-B
road
-Co
mte
lTe
leco
mm
-A
viat
ion
Mo
bile
Tele
soft
Tele
tech
Tele
soft
Serv
ices
(I)
Pro
ject
sFo
un
da-
Tele
-K
olh
iTr
ansa
ctio
nLi
mit
edLi
mit
edb
and
ban
dLi
mit
edu
nic
atio
nLi
mit
edPt
eLi
mit
edLi
mit
edIn
ter-
Lim
ited
Pvt.
tion
vent
ures
Lim
ited
Equ
ip-
Lim
ited
Ltd.
nat
ion
alLi
mit
edEm
plo
yee’
sm
ent
Lim
ited
Wel
fare
Lim
ited
Trus
t
Purc
hase
of
Fixe
d as
sets
(6,9
02
)–
––
––
––
(1,5
55
)(3
03
,75
0)
––
––
––
Sale
of F
ixed
Ass
ets
10
,11
8–
––
––
––
––
––
––
––
Rend
erin
g of
Ser
vice
s3
10
,25
51
07
––
64
,37
91
,42
6,8
40
––
–1
3–
––
––
–
Rece
ivin
g of
Ser
vice
s(2
20
,90
6)
(30
,60
1)
––
–(8
94
,33
3)
(3,7
75
)(9
,63
0)
(13
,10
3)
(31
6,6
67
)(2
2,0
49
)(6
7,5
92
)(1
0,9
38
)–
––
Fund
s tr
ansf
erre
d/In
clud
es e
xpen
ses
incu
rred
on
beha
lfof
oth
ers
50
8,8
44
50
36
27
,59
88
,51
02
47
,77
0–
5,8
00
–6
18
15
,45
1–
––
––
–
Fund
s re
ceiv
ed/
Incl
udes
exp
ense
sin
curr
ed o
n be
half
of c
ompa
ny(1
65
,70
4)
(28
,89
6)
(33
3,9
97
)(9
,50
0)
(16
0,5
16
)–
––
–(2
6)
––
––
––
Empl
oyee
Rel
ated
Tran
sact
ion
incu
rred
on b
ehal
f of
oth
ers
6,5
46
64
33
7,6
08
––
––
––
10
8–
––
––
–
Empl
oyee
Rel
ated
Tran
sact
ion
incu
rred
on b
ehal
f of
com
pany
(4,0
27
)(3
)–
––
––
––
––
––
––
–
Sala
ry–
––
––
––
––
––
––
––
18
,18
1
Don
atio
n–
––
––
––
––
––
––
56
,85
5–
–
Am
ount
rec
eive
don
exe
rcis
e of
ESO
P op
tion
s–
––
––
––
––
––
––
–(5
9,7
32
)–
Clo
sin
g B
alan
ce3
80
,68
1(3
,59
9)
47
0,1
06
(97
5)
38
8,5
34
31
8,3
73
2,0
25
(2,9
70
)2
45
,94
4(3
8,5
13
)(4
,84
2)
–7
,92
0–
21
5,5
33
Uns
ecur
ed L
oan
–(1
,40
6)
––
––
––
––
––
––
––
Cre
dit
ors
–(2
,19
3)
–(9
75
)(5
8,9
89
)–
–(2
,97
0)
–(3
8,5
13
)(4
,84
2)
––
––
–
Loan
and
Adv
ance
s3
17
,53
3–
41
2,3
31
–4
47
,52
3–
2,0
25
––
––
–7
,92
0–
21
5,5
33
–
Deb
tors
63
,14
8–
57
,77
5–
–3
18
,37
3–
–2
45
,94
4–
––
––
––
Clo
sin
g B
alan
ce3
80
,68
1(3
,59
9)
47
0,1
06
(97
5)
38
8,5
34
31
8,3
73
2,0
25
(2,9
70
)2
45
,94
4(3
8,5
13
)(4
,84
2)
–7
,92
0–
21
5,5
33
–
No
tes:
1. T
he a
bove
exc
lude
s pr
ovis
ion
of t
elep
hone
ser
vice
s fr
ee o
f co
st a
mon
g th
e G
roup
Com
pani
es a
nd f
ree
of c
ost
use
of B
illin
g Sy
stem
of
the
Com
pany
by
its
subs
idia
ries
.
2. R
efer
Not
e 20
on
Sche
dule
23
for
Man
ager
ial R
emun
erat
ion
paid
to
Key
man
ager
ial p
erso
nnel
.
139

Rel
ated
Par
ty T
ran
sact
ion
fo
r 20
04–0
5
(Rs.
’000
)
Bh
arti
Bh
arti
Bh
arti
Satc
omB
har
tiSi
ng
apo
reB
har
tiB
har
tiB
har
tiB
har
tiB
har
tiM
ulb
erry
Am
bien
ceTu
lipN
etw
ork
Nat
ure
of
Hex
aco
mA
qu
anet
Bro
ad-
Bro
ad-
Com
tel
Tele
com
m-
Ente
r-Te
leco
mTe
leso
ftTe
lete
chTe
leso
ftPr
oje
cts
Real
ity
Pro
ject
si2
iTr
ansa
ctio
nLi
mit
edLi
mit
edb
and
ban
dLi
mit
edu
nic
atio
np
rise
sLi
mit
ed**
Lim
ited
Lim
ited
Inte
r-Pr
ivat
ePr
ivat
ePr
ivat
eLi
mit
ed*
Lim
ited
Equ
ip-
Lim
ited
Priv
ate
nat
ion
alLi
mit
edLi
mit
ed*
Lim
ited
*m
ent
Lim
ited
*Li
mit
edLi
mit
ed
Purc
hase
of
Fixe
d as
sets
(2,7
74
)–
––
––
––
–(2
,98
2)
(3,4
75
)–
––
(67
4,5
34
)
Sale
of F
ixed
Ass
ets
27
,20
8–
––
––
––
––
––
––
–
Rend
erin
g of
Ser
vice
s2
15
,03
81
13
––
78
41
,32
6,8
18
––
1,9
26
61
––
––
–
Rece
ivin
g of
Ser
vice
s(8
5,9
51
)(4
6,9
92
)–
–(1
1,4
26
)(2
67
,88
2)
––
(1,4
25
)(3
68
,21
6)
(10
7,7
22
)(6
,83
5)
(23
,36
0)
(2,9
29
)(6
7,5
91
)
Fund
s tr
ansf
erre
d/In
clud
es e
xpen
ses
incu
rred
on
beha
lf of
oth
ers
29
,42
27
6,1
68
23
1,5
20
15
14
4,7
14
––
–3
61
03
,04
4–
7,9
20
–8
28
–
Fund
s re
ceiv
ed/In
clud
es e
xpen
ses
incu
rred
on
beha
lf of
com
pany
(32
,96
5)
(33
,91
1)
(92
,62
4)
–(1
73
,03
9)
––
–(6
89
)(5
,17
9)
(8)
––
––
Empl
oyee
Rel
ated
Tra
nsac
tion
incu
rred
on
beha
lf of
oth
ers
29
97
71
––
––
24
73
60
––
––
––
–
Empl
oyee
Rel
ated
Tra
nsac
tion
incu
rred
on
beha
lf of
com
pany
–(5
54
)–
––
–(2
47
)(3
60
)–
–(1
3)
––
––
Clo
sin
g B
alan
ce3
1,2
26
(6,2
87
)1
38
,89
61
52
36
,90
15
4,9
41
––
4,2
58
(26
,12
9)
(24
,46
6)
7,9
20
95
,62
54
,11
3–
Uns
ecur
ed L
oan
–(3
,66
0)
––
––
––
––
––
––
–
Cre
dit
ors
–(2
,62
7)
––
––
––
–(2
6,1
29
)(2
4,4
66
)–
––
–
Loan
and
Adv
ance
s2
3,4
35
–1
29
,90
5–
18
2,7
18
––
–2
,45
0–
–7
,92
09
5,6
25
4,1
13
–
Deb
tors
7,7
91
–8
,99
11
55
4,1
83
54
,94
1–
–1
,80
8–
––
––
–
Clo
sin
g B
alan
ce3
1,2
26
(6,2
87
)1
38
,89
61
52
36
,90
15
4,9
41
––
4,2
58
(26
,12
9)
(24
,46
6)
7,9
20
95
,62
54
,11
3–
*En
tity
whe
re K
ey M
anag
emen
t Pe
rson
nel e
xerc
ises
sig
nific
ant
influ
ence
in t
he y
ear
2004
-05.
**En
tity
hav
ing
sign
ifica
nt i
nflu
ence
in
the
year
200
4-05
.
No
tes:
1.Th
e ab
ove
excl
udes
pro
visi
on o
f te
leph
one
serv
ices
fre
e of
cos
t am
ong
the
Gro
up C
ompa
nies
and
fre
e of
cos
t us
e of
Bill
ing
Syst
em o
f th
e C
ompa
ny b
y it
s w
holly
ow
ned
subs
idia
ry.
2.Re
fer
Not
e 20
on
Sche
dule
23
for
Man
ager
ial R
emun
erat
ion
paid
to
Key
man
ager
ial p
erso
nnel
.
140

29. Leases
a) Operating lease - As a Lessee
The lease rentals charged during the year for cancelable/non-cancellable leases relating to rent of building premises
and cell sites as per the agreements and maximum obligation on long-term non-cancellable operating leases are as
follows:
Year ended Year ended
March 31, 2006 March 31, 2005
(Rs.’000s) (Rs.’000s)
Lease Rentals 2,074,848 1,227,643
Obligations on non-cancellable leases:
Not later than one year 30,560 2,445
Later than one year and not later than five years 146,663 58,362
Total 177,223 60,807
b) Operating Lease – As a Lessor
i) The Company has entered into a non–cancellable lease arrangement to provide approximately 100,000 Fiber
pair kilometers of dark fiber on Indefeasible Right of Use (IRU) basis for a period of 15 years. The lease rental
receivable proportionate to actual kilometers accepted by the customer is credited to the Profit and Loss
Account on a straight – line basis over the lease term. Due to the nature of the transaction, it is not possible to
compute gross carrying amount, depreciation for the year and accumulated depreciation of the asset given on
operating lease as at March 31, 2006 and accordingly, disclosures required by AS 19 is not provided.
ii) The future minimum lease payments receivable are:
Year ended Year ended
March 31, 2006 March 31, 2005
(Rs.’000s) (Rs.’000s)
Not later than one year 281,734 280,000
Later than one year and not later than five years 1,126,936 1,120,000
Later than five year 2,300,829 2,567,699
Total 3,709,499 3,967,699
c) Finance Lease – As a Lessee
During the year the Company has taken certain vehicles on Finance lease. The reconciliation between the total of
minimum lease payments as at March 31, 2006 and their present value is as follows:
Minimum Future Finance Present
Lease Charges Value
Payments
(Rs. ‘000) (Rs. ‘000) (Rs. ‘000)
Not later than one year 375 6 369
Later than one year but not later than five years 156 1 155
Total 531 7 524
As at March 31, 2005
Not later than one year 1,681 96 1,585
Later than one year but not later than five years 1,442 32 1,410
3,123 128 2,995
141

d) Exchange of IRU’s
The Company has also entered into a non-cancellable operating lease to take approximately 922.37 kilometers 2pair of dark fiber pairs against consideration in cash and exchange of approximately 246.75 kilometers 2 pair of darkfiber pairs and bandwidth on IRU basis for a period of 15 years. Due to the nature of the transaction, it is not possibleto compute gross carrying amount, depreciation for the year and accumulated depreciation of the asset given onoperating lease as at March 31, 2006 and accordingly, disclosures required by AS 19 is not provided.
e) The Company entered into a composite IT outsourcing agreement, whereby the vendor supplied fixed assets and ITrelated services to the Company. Based on the risks and rewards incident to the ownership, the fixed assets receivedare accounted for as a finance lease transaction. Accordingly, the asset and liability are recorded at the fair value ofthe leased assets at the inception. These assets are depreciated over their useful lives as in the case of the Company’sown assets.
Since the entire amount payable to the vendor towards the supply of fixed assets during the year is accrued, thereare no minimum lease payments outstanding as at the year-end in relation to these assets and accordingly, otherdisclosures as per AS 19 are not applicable.
30. Earnings per share (Basic and Diluted):
As at As atMarch 31, 2006 March 31,2005
Basic and Diluted Earnings per Share :
Nominal value of equity shares (Rs.) 10/- 10/-
Profit attributable to equity shareholders (Rs.’000) (A) 20,120,794 12,106,739
Weighted average number of equity shares outstanding
during the year (B) 1,881,838,518 1,853,366,767
Basic earnings per Share (Rs.) (A/B) 10.6921 6.5323
Dilutive effect on profit (Rs.’000) (C )* 4,080 75,652
Profit attributable to equity shareholders for computing DilutedEPS (Rs.’000) (D)=(A+C) 20,124,874 12,182,391
Dilutive effect on weighted average number of equity sharesoutstanding during the year (E)* 15,822,704 37,018,694
Weighted Average number of Equity shares and Equity Equivalentshares for computing Diluted EPS (F)=(B+E) 1,897,661,222 1,890,385,461
Diluted earnings per share (Rs.) (D/F) 10.6051 6.4444
* Diluted effect on weighted average number of equity shares and profit attributable is on account of ForeignCurrency Convertible Bonds and Optionally Convertible Redeemable Debentures. Refer Notes 10 and 11 above.
31. a) The breakup of net Deferred Tax Asset/(Liability) as on March 31, 2005 is as follows:
(In Rs.’000)
As at As atMarch 31, 2006 March 31, 2005
Deferred Tax Assets/(Liabilities) arising from:
(i) Provision for doubtful debts/advances charged in the financial 807,343 544,843statements but allowed as deduction under the Income Tax Actin future years (to the extent considered realisable)
(ii) Unabsorbed depreciation allowance and business loss carried – 1,137,463forward (to the extent considered realizable, on the basis ofestimated future profitability)
(iii) Depreciation claimed as deduction under the Income tax Act but (2,646,398) (2,508,144)chargeable in the financial statements in future years.
(iv) Other expenses claimed as deduction under the Income Tax Act butchargeable in the financial statements in future years (Net) (51,404) (183,173)
Net Deferred Tax Asset/(Liability) (1,890,459) (1,009,011)
The Tax impact for the above purpose has been arrived at by applying a tax rate of 33.66% being the prevailing taxrate for Indian companies under the Income Tax Act, 1961.
142

32. Employee stock compensation
(i) Pursuant to the shareholders’ resolutions dated February 27, 2001 and September 25, 2001, the Company has
introduced the “Bharti Tele-Ventures Employees’ Stock Option Plan” (hereinafter called “the Old Scheme”) under
which the Company decided to grant, from time to time, options to the employees of the Company and its
subsidiaries. The grant of options to the employees under the ESOP Scheme is on the basis of their performance and
other eligibility criteria.
(ii) On August 31, 2001 and September 28, 2001, the Company issued a total of 1,440,000 equity shares at a price of
Rs. 565 per equity share to the Trust. The Company issued bonus shares in the ratio of 10 equity shares for every one
equity share held as of September 30, 2001, as a result of which the total number of shares allotted to the trust
increased to 15,840,000 equity shares.
(iii) Pursuant to the shareholders’ further resolution dated September 6, 2005, the Company announced a new Employee
Stock Option Scheme (hereinafter called “the New Scheme”) under which the maximum quantum of options was
determined at 9,367,276 options to be granted to employees from time to time on the basis of their performance
and other eligibility criteria.
(iv) All above options are planned to be settled in equity at the time of exercise and have maximum period of 7 years
from the date of respective grants. The plans existing during the year are as follows:
a) 2001 Plan under the Old Scheme
The options under this plan have an exercise price of Rs. 22.50 per share and vest on a graded basis as follows:
Vesting period from the grant date Vesting schedule
For options with a vesting On completion of 12 months 20%
period of 36 months: On completion of 24 months 30%
On completion of 36 months 50%
For options with a vesting On completion of 12 months 15%
period of 42 months: On completion of 18 months 15%
On completion of 30 months 30%
On completion of 42 months 40%
For options with a vesting On completion of 12 months 10%
period of 48 months: On completion of 24 months 20%
On completion of 36 months 30%
On completion of 48 months 40%
b) 2004 Plan under the Old Scheme
The options under this plan have an exercise price of Rs. 70 per share and vest on a graded basis as follows:
Vesting period from the grant date Vesting schedule
For options with a vesting On completion of 12 months 10%
period of 48 months: On completion of 24 months 20%
On completion of 36 months 30%
On completion of 48 months 40%
c) Super-pot Plan under the Old Scheme
The options under this plan have an exercise price of Rs. Nil per share and vest on a graded basis as follows:
Vesting period from the grant date Vesting schedule
For options with a vesting On completion of 12 months 30%
period of 36 months: On completion of 24 months 30%
On completion of 36 months 40%
143

d) 2005 Plan under the New Scheme
The options under this plan have an exercise price in the range of Rs. 221 to Rs. 366 per share and vest on agraded basis from the effective date of grant as follows:
Vesting period from the grant date Vesting schedule
For options with a vesting On completion of 12 months 10%period of 48 months: On completion of 24 months 20%
On completion of 36 months 30%On completion of 48 months 40%
(v) The Information concerning stock options granted, exercised, forfeited and outstanding at the year-end is asfollows:
As of March 31, 2006
Options Weighted Weighted(Shares in average average
thousands) exercise price remaining(Rs.) contractual
life (years)
2001 Plan
Outstanding at beginning of year 2,321 22.50
Granted – –
Exercised 2,024 22.50
Cancelled or expired 27 22.50
Outstanding at the year end 270 22.50 2.94
Exercisable at end of year 270 22.50
2004 Plan
Outstanding at beginning of year 2,134 70.00
Granted – –
Exercised 203 70.00
Cancelled or expired 271 –
Outstanding at the year end 1,660 70.00 4.83
Exercisable at end of year 266 70.00
Superpot Plan
Outstanding at beginning of year – –
Granted 71 –
Exercised 14 –
Cancelled or expired 5 –
Outstanding at the year end 52 – 5.25
Exercisable at end of year 6 –
Weighted average fair value of options granted during the year 71 139.40
2005 Plan
Outstanding at beginning of year – –
Granted 2,589 238.03
Exercised – –
Cancelled or expired – –
Outstanding at the year end 2,589 238.03 6.46
Exercisable at end of year – –
Weighted average fair value of options granted during the year 2,589 191.86
144

(vi) The fair value of the options granted during the year under the Super-pot Plan and the New Scheme is estimated on
the date of grant using the Black-Scholes model with the following assumptions.
Superpot Scheme Scheme 2005
Risk Free Interest Rates 4.59% p.a. to 5.30% p.a. 6.65% p.a. to 7.33% p.a.
Expected Life 12 to 36 months 48 to 66 months
Expected Volatility 55.15% 44.48% to 45.87%
Expected Dividend 0.00% 0.00%
Expected volatility is determined by taking into account the closing prices of stock listed on Bombay Stock Exchange
from February 18, 2002 i.e. the date of the initial public offer (IPO).
(vii) The balance of deferred stock compensation as on March 31, 2006 is Rs. 388,149 thousand (March 31, 2005
Rs. 13,370 thousand) and total employee compensation cost recognized for the year then ended is Rs. 127,067
thousand (March 31, 2005 Rs. 47,128 thousand).
33. a) During the year there have been seven instances of employee frauds reported across five circles of the Company.
These frauds are in the nature of extending favours to third parties. The amounts of these cases are not presently
quantifiable. The management has taken appropriate action against these employees.
b) During the year there was an instance of financial misstatement at one of the circles of the Company, estimated at
approximately Rs. 125,721 thousand, which have been appropriately adjusted in the financial statements. The
Company has taken appropriate action against the circle management.
34. The Company has undertaken to provide financial support, to it’s subsidiaries – Bharti Comtel Limited and Satcom
Broadband Equipment Limited.
35. Previous Year figures have been regrouped or reclassified, wherever necessary, to conform to current year classifications.
145

I. Registration Details
Registration No. State Code
Balance Sheet Date
II. Capital raised during the year (Amount in thousands)Public Issue Rights Issue
Bonus Issue Private Placement
III. Position of mobilisation and deployment of funds (Amount in thousands)Total Liabilities Total Assets
Sources of funds Paid up Capital Reserves and Surplus
Secured Loans Unsecured Loans
Application of funds Net Fixed Assets Investments
Net Current Assets Miscellaneous Expenditure
IV. Performance of the Company (Amount in thousands)Turnover Total Expenditure
Profit/(Loss) Before Tax Profit/(Loss) After Tax
Earning per Share in Rs. Dividend Rate
V. Generic names of three principal products/services of the Company (as per monetary terms)
Item Code No. (ITC Code)
Product Description
7 0 6 0 9
3 1 - 0 3 - 0 6Date Month Year
5 5
N I L N I L
N I L 4 0 5 1 2 5
1 2 3 3 0 8 9 5 1
N O T A P P L I C A B L E
1 2 3 3 0 8 9 5 1
1 8 9 3 8 7 9 3 5 4 3 9 5 5 3 1
2 8 6 3 3 7 0 7 1 9 3 2 9 2 0 1
1 5 3 4 8 1 2 6 9 7 1 9 6 9 8 1
(3 7 4 4 8 6 9 9) 7 9 4 0 0
1 1 2 9 0 5 7 9 3 9 0 0 4 7 8 3 7
2 2 8 5 7 9 5 6 2 0 1 2 0 7 9 4
1 0 . 6 9 N I L
BASIC AND CELLULAR TELEPHONE SERVICES, BROAD-BAND & LONG DISTANCE COMMUNICATION SERVICES
On behalf of the Board
SUNIL BHARTI MITTAL AKHIL GUPTAChairman & Managing Director Joint Managing Director
DEVEN KHANNA VIJAYA SAMPATH SARVJIT SINGH DHILLONGroup Financial Controller Company Secretary Director (Finance & Business
Place : New Delhi Intergration)Date : April 28, 2006
Balance Sheet Abstract and Company’s General Business Profile
146

On behalf of the Board
SUNIL BHARTI MITTAL AKHIL GUPTAChairman & Managing Director Joint Managing Director
DEVEN KHANNA VIJAYA SAMPATH SARVJIT SINGH DHILLONGroup Financial Controller Company Secretary Director (Finance & Business
Place : New Delhi Integration)Date : April 28, 2006
Section 212
STATEMENT PURSUANT TO SECTION 212 OF THE COMPANIES ACT 1956,RELATING TO SUBSIDIARY COMPANIES
1. Name of Subsidiary Bharti Bharti Bharti SatcomAquanet Hexacom Comtel BroadbandLimited Limited Limited Equipment
Limited
2. Financial Year of the Subsidiary ended on : 31-03-2006 31-03-2006 31-03-2006 31-03-2006
3. Shares of the Subsidiary held by the companyon the above dates:
(a) Nos. 1,275,000 122,751,980 100,000 24,859,200
(b) Face Value Rs. 10/- Rs. 10/- Rs. 10/- Rs. 10/-
(c) Extent of Holding 51% 68.5% 100% 100%
4. Net aggregate amount of profit / losses of theSubsidiary for the above financial year so far asthey concern members of the Company (Rs.)
(a) Dealt with the accounts of the Companyfor the year ended 31-03-2006 Nil Nil Nil Nil
(b) Not dealt with in the Accounts of the Companyfor the year ended 31-03-2006 (Rs. in Thousands) 5,624 567,879 (80,048) 4,320
5. Net aggregate amount of profits / (losses) for theprevious financial years of the Subsidiary, since itbecame a Subsidiary so far as they concern themembers of the Company (Rs.)
(a) Dealt with in the Accounts of the Companyfor previous financial years Nil Nil Nil Nil
(b) Not dealt with in the Accounts of the Companyfor previous financial years (Rs. in Thousands) 17,584 322,581 (23,707) (9,097)
147

Report of the Auditors to the Board of Directors ofBharti Airtel Limited (Formerly Bharti Tele-Ventures Limited) on the Consolidated
Financial Statements of Bharti Airtel Limited and its Subsidiaries
Consolidated Financial Statements with Auditors’ Report
1. We have audited the attached consolidated Balance
Sheet of Bharti Airtel Limited (Formerly Bharti Tele-
Ventures Limited) and its subsidiaries as at March 31,
2006, the consolidated Profit and Loss Account for the
year ended on that date annexed thereto and the
consolidated Cash Flow Statement for the year ended
on that date, which we have signed under reference to
this report. These consolidated financial statements are
the responsibility of the Company’s management. Our
responsibility is to express an opinion on these
consolidated financial statements based on our audit.
2. We conducted our audit in accordance with auditing
standards generally accepted in India. Those Standards
require that we plan and perform the audit to obtain
reasonable assurance about whether the consolidated
financial statements are prepared, in all material respects,
in accordance with an identified financial reporting
framework and are free of material misstatement. An
audit includes examining, on a test basis, evidence
supporting the amounts and disclosures in the
consolidated financial statements. An audit also includes
assessing the accounting principles used and significant
estimates made by management, as well as evaluating
the overall consolidated financial statement
presentation. We believe that our audit provides a
reasonable basis for our opinion.
3. We report that the consolidated financial statements
have been prepared by the Company in accordance
with the requirements of Accounting Standard 21
‘Consolidated Financial Statements’ issued by the
Institute of Chartered Accountants of India and on the
basis of separate audit of financial statements of Bharti
Airtel Limited and its subsidiaries included in the
consolidated financial statements.
4. On the basis of the information and explanations given
to us, and on consideration of the separate audit reports
of individual audited financial statements of Bharti Airtel
Limited and its aforesaid subsidiaries, in our opinion,
consolidated financial statements give a true and fair
view in conformity with the accounting principles
generally accepted in India:
(i) in the case of the consolidated Balance Sheet, of the
consolidated state of affairs of Bharti Airtel Limited and
its subsidiaries as at March 31, 2006;
(ii) in the case of the consolidated Profit and Loss Account,
of the consolidated results of operations of Bharti Airtel
Limited and its subsidiaries for the year ended on that
date; and
(iii) in the case of the consolidated Cash Flow Statement, of
the consolidated cash flows of Bharti Airtel Limited and
its subsidiaries for the year ended on that date.
U. RAJEEVPartner
Membership No. F-87191
For and on behalf of
Place: New Delhi PRICE WATERHOUSEDate: April 28, 2006 Chartered Accountants
148

Schedule As at As atParticulars No. March 31, 2006 March 31, 2005
(Rs. ’000) (Rs. ’000)
SOURCES OF FUNDSShareholders’ Funds
Share Capital 1 18,938,793 18,560,889Employee Stock Option Outstanding 505,961 –Less: Deferred Stock Compensation 384,701 121,260 –(Refer Note 26 on Schedule 23 and Note 22 on Schedule 22)Reserves and Surplus 2 54,563,810 34,639,403
Loan FundsSecured Loans 3 28,399,081 39,619,760Unsecured Loans 4 19,329,267 10,386,242
Deferred Tax Liability (Net)(Refer Note 14 on Schedule 22, Note 25 on Schedule 23 1,948,431 1,011,019and Note 2 on Schedule 22)Minority Interest 1,091,048 924,569(Refer Note 11 on Schedule 23 and Note 2 on Schedule 22)
124,391,690 105,141,882APPLICATION OF FUNDSFixed Assets
Gross Block 5 190,488,165 140,627,322Less: Depreciation 52,302,210 36,802,292
Net Block 138,185,955 103,825,030Capital Work-in-Progress 24,364,837 10,166,556
162,550,792 113,991,586Pre-operative Expenditure Pending Allocation 6 – –
162,550,792 113,991,586Investments 7 2,479,545 4,780,749Current Assets, Loans and Advances
Inventories 8 381,320 544,835Sundry Debtors 9 11,140,089 7,414,710Cash and Bank Balances 10 3,510,627 4,098,042Other Current Assets, Loans and Advances 11 15,089,432 10,819,812
30,121,468 22,877,399Less: Current Liabilities and Provisions 12
Current Liabilities 68,399,949 43,760,812Provisions 2,439,565 1,185,269
70,839,514 44,946,081Net Current Assets (40,718,046) (22,068,682)Miscellaneous Expenditure(to the extent not written off or adjusted) 13 79,399 583,483Profit and Loss Account – 7,854,746
124,391,690 105,141,882Statement of Significant Accounting Policies 22Notes to Accounts 23
This is the Balance Sheet referred to The Schedules referred to above form an integral part of the Balance Sheet.in our report of even date.
For and on behalf of the BoardU. RAJEEV SUNIL BHARTI MITTAL AKHIL GUPTAPartner Chairman & Managing Director Joint Managing DirectorMembership No. F-87191For and on behalf ofPRICE WATERHOUSEChartered Accountants
DEVEN KHANNA VIJAYA SAMPATH SARVJIT SINGH DHILLONGroup Financial Controller Company Secretary Director (Finance & Business
Place : New Delhi Integration)Date : April 28, 2006
Consolidated Balance Sheet as at March 31, 2006
149

Schedule For the year ended For the year endedParticulars No. March 31, 2006 March 31, 2005
(Rs. ’000) (Rs. ’000)
INCOMEService Revenue 115,392,605 80,076,607Sale of Goods 1,248,248 1,046,428Other Income 14 614,240 434,810
117,255,093 81,557,845EXPENDITURE
Access Charges 21,795,091 16,893,080Network Operating 15 12,125,988 7,102,625Cost of Sales of Goods 16 1,146,560 1,026,989Personnel 17 8,005,395 5,170,882Sales and Marketing 18 8,335,924 6,442,162Administrative and Others 19 12,459,623 6,474,627
63,868,581 43,110,365
Profit including other income and before Licence Fee,Finance Expenses/(Income) (Net), Depreciation, Amortisation,Pre-operative Expenditure, Charity and Donation and Taxation 53,386,512 38,447,480
Licence fee and Spectrum charges (revenue share) 11,136,540 7,789,494
Profit including Other Income and before Finance Expenses/(Income) (Net), Depreciation, Amortisation, Pre-operativeExpenditure, Charity and Donation and Taxation 42,249,972 30,657,986
Finance Expenses (Net) 20 2,244,107 2,439,179Depreciation 14,819,199 10,441,487Amortisation 21 1,599,575 1,440,296Pre-operative Expenditure written off 29,668 473,912Charity and Donation 102,534 31,139
Profit Before Tax 23,454,889 15,831,973Tax Expenses /(Credit)– Current 1,773,852 130,861– Deferred 937,413 3,464,514
(Refer Note 14 on Schedule 22 and Note 25 on Schedule 23)– Fringe Benefit Tax 197,593 –
Profit After Tax 20,546,031 12,236,598Minority Interest (Refer Note 11 on Schedule 23 andNote 2 on Schedule 22) 266,545 120,857
Profit for the year 20,279,486 12,115,741Transferred (from)/to Debenture Redemption Reserve (2,307,348) 2,478,854
22,586,834 9,636,887Loss brought forward (7,854,746) (6,747,934)
Adjustments under the schemes of amalgamation during the year – (10,742,998)Profit for pre-acquisition period for 1% stake of BHL acquired – (701)
Profit/ (Loss) carried forward to the Balance Sheet 14,732,088 (7,854,746)
Earnings per share in Rs. (Basic) 10.776 6.528Earnings per share in Rs. (Diluted) 10.689 6.440(Refer Note 19 on Schedule 22 and Note 28 on Schedule 23)
Statement of Significant Accounting Policies 22Notes to Accounts 23
Consolidated Profit and Loss Accountfor the year ended March 31, 2006
This is the Profit and Loss Account referred to The Schedules referred to above form an integral part of thein our report of even date. Profit and Loss Account.
For and on behalf of the BoardU. RAJEEV SUNIL BHARTI MITTAL AKHIL GUPTAPartner Chairman & Managing Director Joint Managing DirectorMembership No. F-87191For and on behalf ofPRICE WATERHOUSEChartered Accountants
DEVEN KHANNA VIJAYA SAMPATH SARVJIT SINGH DHILLONGroup Financial Controller Company Secretary Director (Finance & Business
Place : New Delhi Integration)Date : April 28, 2006
150

Consolidated Cash Flow Statementfor the year ended March 31, 2006
(Rs. ’000)
Particulars For the year ended For the year endedMarch 31, 2006 March 31, 2005
A. Cash flow from operating activities:Net profit / (loss) before tax 23,454,889 15,831,973
Adjustments for:Depreciation 14,819,199 10,444,026Interest Expense 2,385,639 3,178,002Interest Income (201,627) (102,576)(Profit)/Loss on Fixed Assets sold (24,607) 9,583(Profit)/Loss on sale of Investments (108,940) (400,180)ESOP Expenditure written off 127,067 47,128Amortisation of Goodwill 268,325 231,145Pre-operative Expenditure Written off 410 –Provision for Deferred Bonus 73,622 –Licence fee written off 1,204,183 1,162,023Debts / Advances Written off 1,317,725 208,233Provision for Bad and Doubtful Debts/Advances (Net of write back) 2,620,280 1,598,136Liability no longer required written back (147,681) (226,356)Provision for Gratuity and Leave Encashment 270,530 65,964Provision for Inventory for obsolete/Damaged stock 78,796 9,420Unrealized Foreign Exchange (gain) /loss 154,246 (28,822)Provision for Warranty (4,567) 1,829Gain from swap arrangements (45,307) (211,415)Provision for Wealth Tax 15 (1,257)Inventory Written Off 9,014 11,267
Operating profit before working capital changes 46,251,211 31,828,123
Adjustments for changes in working capital :– (Increase)/Decrease in Sundry Debtors (5,748,529) (3,250,277)– (Increase)/Decrease in Other Receivables (5,885,376) (2,920,453)– (Increase)/Decrease in Inventories 75,705 (224,025)– Increase/(Decrease) in Trade and Other Payables 16,312,918 11,077,687
Cash generated from operations 51,005,929 36,511,055
Taxes (Paid)/Received (2,306,611) (1,413,212)
Net cash from operating activities 48,699,318 35,097,843
B. Cash flow from Investing activities:Adjustments for changes in :
Purchase of fixed assets (55,343,408) (27,734,476)Proceeds from Sale of fixed assets 118,777 518,342Net Proceeds from Investments 71,943,399 104,444,000Purchase of Investments (69,826,973) (105,435,006)Licence fee paid for new circles – (50,000)Interest Received (Revenue) 201,627 66,339Amount paid for acquisition of subsidiaries/joint ventures (121,997) (753,487)
Net cash used in investing activities (53,028,575) (28,944,288)
151

(Rs. ’000)
Particulars For the year ended For the year endedMarch 31, 2006 March 31, 2005
C. Cash flow from financing activities:Proceeds from long term borrowings
Receipts 23,725,487 7,508,781Payments (26,818,595) (7,670,432)FCCB issue expenses – (96,861)
Proceeds from short term borrowingsNet movement in cash credit facilities and short term loans 8,891,080 (671,111)Interest Paid (2,179,787) (3,157,001)Realised Gain from swap arrangements 80,107 211,415
Net cash used in financing activities 3,698,292 (3,875,209)
Net Increase/(Decrease) in Cash and Cash Equivalents (630,965) 2,278,346Opening Cash and Cash Equivalents 4,098,042 1,354,194Cash and Cash Equivalents on consolidation of Joint Ventures 43,550 465,502
Cash and cash equivalents as at March 31, 2006 3,510,627 4,098,042
Cash and cash equivalents comprise:Cash and Cheques in hand 861,581 742,500Balance with Scheduled Banks 2,649,046 3,355,542
Notes :1. Figures in brackets indicate cash outgo.2. Previous year figures have been regrouped and recast wherever necessary to conform to the current year classification.3. Cash and cash equivalents includes Rs.230,294 thousands pledged with various authorities (Previous year Rs.227,730
thousands) which are not available for use by the Company.
This is the Cash Flow Statement referred toin our report of even date.
For and on behalf of the Board
U. RAJEEV SUNIL BHARTI MITTAL AKHIL GUPTAPartner Chairman & Managing Director Joint Managing DirectorMembership No. F-87191For and on behalf ofPRICE WATERHOUSEChartered Accountants
DEVEN KHANNA VIJAYA SAMPATH SARVJIT SINGH DHILLONGroup Financial Controller Company Secretary Director (Finance & Business
Place : New Delhi Integration)Date : April 28, 2006
152

Schedules Annexed to and forming part of Accounts
As at As atParticulars March 31, 2006 March 31, 2005
(Rs. ’000) (Rs. ’000)
SCHEDULE : 1SHARE CAPITALAuthorised
2,500,000,000 (Previous year 2,500,000,000)Equity Shares of Rs.10 each 25,000,000 25,000,000
Issued, Subscribed and Paid up1,893,879,304 Equity Shares of Rs.10 each fully paid up 18,938,793 18,533,668(Previous year 1,853,366,767 Equity Shares of Rs.10 each)[Refer Note (a), (b) and (c) below]
Capital Suspense Account[Refer Note (d) below] – 27,221
Notes:a) Of the above 1,516,390,970 Equity Shares
(Previous year 1,516,390,970) issued as fully paid up bonusshares out of Share Premium Account.
b) Of the above shares 20,088,445 (Previous year Nil) shares areallotted as fully paid up upon the conversion of OCRD withoutpayment being received in cash. [Refer Note 12 on Schedule 23]
c) Of the above shares 17,701,967 (Previous year Nil) shares areallotted as fully paid up upon the conversion of FCCBs.[Refer Note 14 on Schedule 23]
d) Of the above shares 2,722,125 (Previous year 2,722,125) sharesare allotted as fully paid up under the scheme of amalgamationwithout payments being received in cash.
18,938,793 18,560,889
SCHEDULE : 2RESERVES AND SURPLUSShare Premium
Opening balance 31,254,879 29,706,859Adjustment under the scheme of amalgamation – 1,548,020Additions during the year 7,499,667 –
38,754,546 31,254,879
Revaluation Reserve 21,284 21,284Debentures Redemption Reserve
Opening balance 3,363,240 884,386Transfer from / (to) Profit and Loss Account during the year (2,307,348) 2,478,854
1,055,892 3,363,240
Profit and Loss Account 14,732,088 –
54,563,810 34,639,403
153

As at As atParticulars March 31, 2006 March 31, 2005
(Rs. ’000) (Rs. ’000)
SCHEDULE : 3
SECURED LOANS
(Refer Note 19 on Schedule 23)
Debentures 2,882,500 4,672,857
Loans and Advances from Banks :
– Term Loans 675,000 3,578,245
– Cash Credit 15,373 21,000
Other Loans and Advances :
– Term Loans 24,809,897 31,333,530
– Vehicle Loans 16,311 14,128
28,399,081 39,619,760
* Note : Amount repayable within one year 3,417,929 6,036,731
SCHEDULE : 4
UNSECURED LOANS
Short Term Loans and Advances
From Banks 18,426,182 1,606,142
From Others – 3,750,000
Other Loans and Advances
From Others 903,085 5,030,100
19,329,267 10,386,242
Note: Amount repayable within one year 18,426,182 5,356,141
154

SCH
EDU
LE 5
:FI
XED
ASS
ETS
(Ref
er N
ote
3, 4
, 5, 1
0, 1
3, 1
6 an
d 17
on
Sche
dule
22
and
Not
e 10
, 24
on S
ched
ule
23)
Gro
ss B
lock
Val
ue
Dep
reci
atio
n/A
mo
rtis
atio
nN
et B
lock
As
atA
dditi
ons
Sa
le/
As
at
A
s at
For t
he S
ale/
As
atA
s at
As
atPA
RTIC
ULA
RSA
pril
01,
durin
gA
djus
tmen
tM
arch
31,
Apr
il 01
,ye
arA
djus
tmen
tM
arch
31,
Mar
ch 3
1,M
arch
31,
2005
the
year
durin
g20
0620
05du
ring
2006
2006
2005
the
year
the
year
INTA
NG
IBLE
ASS
ETS
Goo
dwill
3,15
8,34
526
,581
–3,
184,
926
231,
145
268,
325
–49
9,47
02,
685,
456
2,92
7,20
0So
ftw
are
83,9
93–
–83
,993
52,0
5919
,870
–71
,929
12,0
6431
,934
Band
wid
th2,
042,
997
305,
749
15,0
272,
333,
719
209,
700
184,
142
15,0
2737
8,81
51,
954,
904
1,83
3,29
7Li
cenc
e22
,219
,000
––
22,2
19,0
006,
278,
383
1,20
4,18
3–
7,48
2,56
614
,736
,434
15,9
40,6
17TA
NG
IBLE
ASS
ETS
Leas
ehol
d La
nd53
,039
10,8
85–
63,9
243,
267
568
–3,
835
60,0
8949
,772
Free
hold
Lan
d46
3,70
863
,424
8,40
051
8,73
2–
––
–51
8,73
246
3,70
8Bu
ildin
g1,
517,
618
172,
453
71,3
791,
618,
692
322,
509
81,6
586,
671
397,
496
1,22
1,19
61,
195,
109
Leas
ehol
d Im
prov
emen
ts71
2,87
741
5,31
3–
1,12
8,19
023
6,67
811
8,79
0–
355,
468
772,
722
476,
199
Plan
t and
Mac
hine
ry10
1,28
9,88
447
,886
,250
1,62
0,72
114
7,55
5,41
324
,053
,750
11,9
98,1
1167
4,41
935
,377
,442
112,
177,
971
77,2
36,1
34Co
mpu
ters
7,84
0,38
22,
365,
818
70,7
3710
,135
,463
4,62
8,99
72,
170,
765
55,9
466,
743,
816
3,39
1,64
73,
211,
385
Off
ice
Equi
pmen
t72
7,92
324
9,86
811
,919
965,
872
470,
532
141,
460
11,1
7660
0,81
636
5,05
625
7,39
1Fu
rnitu
re &
Fix
ture
431,
343
156,
286
22,8
7656
4,75
326
9,29
686
,899
22,8
7633
3,31
923
1,43
416
2,04
7V
ehic
le79
,965
40,8
8711
,612
109,
240
44,0
1817
,017
6,08
454
,951
54,2
8935
,947
Veh
icle
on
Fina
nce
Leas
e6,
248
––
6,24
81,
958
329
–2,
287
3,96
14,
290
TOTA
L14
0,62
7,32
251
,693
,514
1,83
2,67
119
0,48
8,16
536
,802
,292
16,2
92,1
1779
2,19
952
,302
,210
138,
185,
955
103,
825,
030
Capi
tal W
ork-
in-P
rogr
ess
24,3
64,8
3710
,166
,556
GRA
ND
TO
TAL
140,
627,
322
51,6
93,5
141,
832,
671
190,
488,
165
36,8
02,2
9216
,292
,117
792,
199
52,3
02,2
1016
2,55
0,79
211
3,99
1,58
6
Prev
ious
Yea
r11
2,19
1,64
737
,501
,641
12,3
22,8
6114
0,62
7,32
226
,114
,752
11,8
37,1
962,
627,
179
36,8
02,2
92
Not
es:
1.Ca
pita
l Wor
k In
Pro
gres
s in
clud
es:
a)Ca
pita
l adv
ance
s of
Rs.
1,10
2,96
6 th
ousa
nd (P
revi
ous
year
Rs.
560,
700
thou
sand
)b)
Borr
owin
g co
st o
f Rs.
Nil
(Pre
viou
s ye
ar R
s.11
,912
thou
sand
)2.
Add
ition
to fi
xed
asse
ts d
urin
g th
e ye
ar in
clud
e:(a
)Rs
. 193
,117
thou
sand
of L
oss
(Pre
viou
s ye
ar lo
ss o
f Rs.
13,
297
thou
sand
) on
acco
unt o
f flu
ctua
tions
in fo
reig
n ex
chan
ge ra
tes.
(b)
Borr
owin
g co
sts
capi
talis
ed R
s. 3
1,13
2 th
ousa
nd (P
revi
ous
year
Rs.
13,2
07 th
ousa
nd).
3.Le
aseh
old
land
of R
s. 9
55 th
ousa
nd (P
revi
ous
year
Rs.
955
thou
sand
) rep
rese
nts
land
acq
uire
d on
leas
e cu
m s
ale
basi
s fr
om K
arna
taka
Indu
stria
l Are
as D
evel
opm
ent B
oard
.4.
Capi
tal W
ork-
in-P
rogr
ess
as o
n M
arch
31,
200
6 is
net
of R
s. 9
3,31
2 th
ousa
nd b
eing
loss
(Pre
viou
s ye
ar in
clud
es R
s. 1
46,4
65 th
ousa
nd g
ain)
on
acco
unt o
f flu
ctua
tion
in E
xcha
nge
rate
.5.
Add
ition
s du
ring
the
year
incl
udes
Rs.
12,
567
thou
sand
(Pre
viou
s ye
ar R
s. 1
40,4
18 th
ousa
nd) a
lloca
ted
from
pre
–ope
rativ
e ex
pend
iture
. (Re
fer S
ched
ule
6).
6.Fr
eeho
ld L
and
and
Build
ing
incl
udes
Rs.
26,
468
thou
sand
(Pre
viou
s yea
r Rs.
26,
468
thou
sand
) and
Rs.
71,
477
thou
sand
(Pre
viou
s yea
r Rs.
71,
477
thou
sand
) res
pect
ivel
y, in
resp
ect o
f whi
chre
gist
ratio
n of
title
in fa
vour
of g
roup
is p
endi
ng.
7.Bu
ildin
g in
clud
es b
uild
ing
on le
aseh
old
land
Rs.
17,
288
thou
sand
(Pre
viou
s ye
ar R
s.17
,288
thou
sand
).8.
The
rem
aini
ng a
mor
tisa
tion
per
iod
of li
cenc
e fe
es a
s at
Mar
ch 3
1, 2
006
rang
es b
etw
een
8 to
19
year
s fo
r Uni
fied
Acc
ess
Serv
ice
Lice
nce
and
14 to
16
year
s fo
r Lon
g D
ista
nce.
9.Ca
pita
l Wor
k-in
-Pro
gres
s in
clud
es g
oods
in tr
ansi
t Rs.
4,3
78,0
02 th
ousa
nd (P
revi
ous
year
Rs.
980
,618
thou
sand
)10
.Co
mpu
ters
incl
ude
Gro
ss B
lock
of a
sset
s ca
pita
lised
dur
ing
the
year
und
er fi
nanc
e le
ase
Rs.3
,466
,160
thou
sand
(Pre
viou
s ye
ar R
s.1,
908,
724
thou
sand
) and
dep
reci
atio
n ch
arge
d fo
r the
year
Rs.
1,59
3,77
0 th
ousa
nd (P
revi
ous
year
Rs.
534
,880
thou
sand
), N
et b
ook
valu
e Rs
. 1,8
49,5
68 th
ousa
nd.
11.
The
rem
aini
ng a
mor
tisa
tion
per
iod
of G
oodw
ill a
s at
Mar
ch 3
1, 2
006
rang
es b
etw
een
9 to
11
year
s.
(Rs.
’000
)
155

As at As atParticulars March 31, 2006 March 31, 2005
(Rs. ’000) (Rs. ’000)
SCHEDULE : 6PRE-OPERATIVE EXPENDITURE PENDING ALLOCATION(Refer note 12 on Schedule 22 and Note 2 on Schedule 23)Opening Balance as on April 1, 2005 – 5,891Additions during the periodNetwork Operating Expenses
Insurance Premium – 1,007Repairs and Maintenance – Plant and Machinery 174 26,388Power and Fuel 275 19,454Rent 4,263 25,999Leased Line 1,853 12,914Others – 29,343
Sub-Total 6,565 115,105
Personnel ExpensesSalaries 18,889 163,882Contribution to Provident and Other Funds 970 5,172Staff Welfare 1,994 11,131Recruitment and Training 951 30,668
Sub-Total 22,804 210,853
Selling ExpensesAdvertisement and Marketing 86 97,590Other Selling and Distribution 4,395 15,663
Sub-Total 4,481 113,253
Administrative and Other ExpensesLegal and Professional 936 19,916Rates and Taxes – 12,232Power and Fuel 293 5,083Travelling and Conveyance 2,041 57,618Rent 2,911 14,136Repairs and Maintenance charges – Building 9 175
– Plant and Machinery 7 2,100– Others 32 13,730
Insurance 10 590Miscellaneous 1,462 35,012Collection and Recovery – 1,245
Sub-Total 7,701 161,837
Finance ExpensesOther Bank/Finance Charges 274 4,784
Depreciation 410 2,541Other Income – (66)
Total 42,235 614,330
Less : Allocated to Fixed Assets 12,567 140,418
Less :Transferred to Profit and Loss Account 29,668 473,912
Total amount carried to Balance Sheet – –
156

As at As atParticulars March 31, 2006 March 31, 2005
(Rs. ’000) (Rs. ’000)
SCHEDULE : 7
INVESTMENTS
(Refer Note 8 on Schedule 22)
Current
Other than Trade (Quoted)
– Government securities 475,421 1,035,840
– Mutual Funds and Bonds 2,002,324 3,699,346
2,477,745 4,735,186
Short term Unquoted
– Government securities 1,800 1,800
Long Term Invesmtent Trade (Unquoted)
Investment in Joint Ventures
Bridge Mobile PTE Limited: 1,000,000 (Previous year 1,000,000) – 43,763
Equity shares of USD 1 each fully paid up.
Total Investments 2,479,545 4,780,749
Aggregate Market Value of Quoted Investments 2,483,474 4,751,649
Aggregate Value of Quoted Investments 2,477,745 4,735,186
Aggregate Value of Unquoted Investments 1,800 45,563
SCHEDULE : 8
INVENTORY
(Refer Note 7 on Schedule 22)
Stock-In-Trade* 381,320 544,835
381,320 544,835
* Includes Goods in Transit Rs. 11,377 thousand.
(Previous year Rs. 5,250 thousand)
* Net of Provision for diminution in value Rs. 88,216 thousand
(Previous year Rs. 9,420 thousand)
SCHEDULE : 9
SUNDRY DEBTORS
(Refer Note 6 on Schedule 22 and Note 15 on Schedule 23)
(Unsecured, considered good unless otherwise stated)
Debtors :
Debts outstanding for a period exceeding six months
– Considered good 1,402,327 875,356
– Considered doubtful 3,605,826 3,401,209
Less : Provision (3,605,826) 1,402,327 (3,401,209) 875,356
Other debts
– Considered good 9,737,762 6,539,354
– Considered doubtful 1,372,351 929,681
Less: Provision (1,372,351) 9,737,762 (929,681) 6,539,354
11,140,089 7,414,710
157

As at As atParticulars March 31, 2006 March 31, 2005
(Rs. ’000) (Rs. ’000)
SCHEDULE : 10
CASH AND BANK BALANCES
Cash in Hand 93,353 42,905
Cheques in Hand 768,228 699,595
Balances with Scheduled Banks
– in Current Account 1,288,859 1,052,501
– in Fixed Deposits * 1,355,360 2,301,597
– in Deposit Account as Margin Money 4,827 1,444
3,510,627 4,098,042
* [Includes Rs. 230,294 thousand pledged with various authorities
(Previous year Rs. 227,730 thousand )]
SCHEDULE : 11
OTHER CURRENT ASSETS, LOANS AND ADVANCES
(Unsecured, considered good unless otherwise stated)
Interest Accrued on Investment 53,645 39,075
Advances recoverable in cash or in kind or for
value to be received
Considered good 9,913,091 7,034,068
Considered doubtful 2,385,834 412,841
Less : Provision (2,385,834) 9,913,091 (412,841) 7,034,068
Accrued Billing Revenue 3,632,421 2,793,372
Advance to ESOP Trust 195,604 251,217
Advance Tax [(Net of provision for tax Rs.3,243,619 thousand
(Previous year Rs.1,469,767 thousand)] 1,031,629 696,463
Balances with Custom Authorities 263,042 5,617
15,089,432 10,819,812
158

As at As atParticulars March 31, 2006 March 31, 2005
(Rs. ’000) (Rs. ’000)
SCHEDULE : 12CURRENT LIABILITIES AND PROVISIONSCurrent Liabilities(Refer Note 15 on Schedule 23)
Sundry Creditors :Total outstanding dues of SmallScale Industrial Undertaking (s)* 6,613 4,345
Total outstanding dues of creditors other thanSmall Scale Industrial Undertakings (s) 47,934,313 47,940,926 30,643,404 30,647,749Advance Billing and Prepaid Card Revenue 14,743,243 7,923,904Premium on Redemption of Bonds 106,996 595,564Interest accrued but not due on loans 519,709 403,957Other Liabilities 1,580,064 804,828Advance Received from customers 638,521 722,622Security Deposits (Refer Note 15 on Schedule 23) 2,870,490 2,662,188
68,399,949 43,760,812
* This information has been compiled in respect of partiesto the extent they could be identified as Small Scale andancillary undertakings on the basis of information availablewith the Company.
Provisions(Refer Note 11, 20 and 21 on Schedule 22 and Note 20 on Schedule 23)
Gratuity 249,283 82,166Leave Encashment 237,925 134,512Provision for Warranty 2,633 7,200Provision for Wealth Tax 164 149Provision for Fringe Benefit Tax [Net of amounts paidRs.10,246 thousand (Previous year Nil)] 9,519 –Other Provisions 1,940,041 961,242
2,439,565 1,185,269
70,839,514 44,946,081
SCHEDULE : 13MISCELLANEOUS EXPENDITURE(To the extent not written off or adjusted)(Refer Note 15 on Schedule 22)Deferred Employee Compensation Expense
Opening Balance 13,372 75,175Add: Adjustments during the year (4,119) (14,675)Less: Amortisation for the year # 5,806 47,128
3,447 13,372# Net of write backPremium on Redemption of Debentures
Opening Balance 570,111 –Add : Addition/(Write back) during the year (404,059) 693,027Less : Amortisation for the year 90,100 122,916
75,952 570,111
79,399 583,483
159

For the year ended For the year endedParticulars March 31, 2006 March 31, 2005
(Rs. ’000) (Rs. ’000)
SCHEDULE : 14OTHER INCOME
Liabilities/Provisions no longer required written back 147,681 226,356Profit on Sale of Assets (Net) 24,607 –Miscellaneous 441,952 208,454
614,240 434,810
SCHEDULE : 15NETWORK OPERATING EXPENDITURE
Interconnect charges and PSTN Rentals 685,577 648,324Installation 55,909 32,104Power and Fuel 3,155,832 1,501,552Rent 1,730,610 970,362Insurance 33,881 36,661Repairs and Maintenance – Building 410,318 141,690
– Plant and Machinery 2,801,756 1,785,873– Others 773,797 343,004
Leased Line and Gateway charges 805,776 827,876Other Network Operating Expenses 1,672,532 815,179
12,125,988 7,102,625
SCHEDULE : 16COST OF SALES
Opening Stock 544,835 316,827Add : Stock acquired under acquisition – 12,003Add : Purchases 1,243,519 1,523,148Less : Simcard Utilisation 194,348 252,144Less : Internal issues/capitalised 66,126 28,010Less : Closing Stock * 381,320 544,835
1,146,560 1,026,989* Net of obsolete inventory written off Rs. 9,014
thousand (Previous year Rs. 11,267 thousand)
* Net of provision for diminution in value Rs.78,796thousand (Previous year Rs.9,420 thousand)
SCHEDULE : 17PERSONNEL EXPENDITURE
Salaries, Wages and Bonus* 6,791,852 4,407,602Contribution to Provident and Other Funds 369,714 194,587Staff Welfare 419,729 283,267Recruitment and Training 424,100 285,426
8,005,395 5,170,882* Excluding amortisation of Deferred ESOP Cost
160

For the year ended For the year endedParticulars March 31, 2006 March 31, 2005
(Rs. ’000) (Rs. ’000)
SCHEDULE : 18
SALES AND MARKETING EXPENDITURE
Advertisement and Marketing 4,113,547 3,357,372
Sales Commission and Incentive 2,820,676 1,937,470
Simcard Utilisation 194,348 252,144
Other Selling and Distribution 1,207,353 895,176
8,335,924 6,442,162
SCHEDULE : 19
ADMINISTRATIVE AND OTHER EXPENDITURE
Legal and Professional 4,015,033 1,583,943
Rates and Taxes 48,497 32,077
Power and Fuel 274,492 174,344
Travelling and Conveyance 767,224 476,490
Rent 425,087 237,761
Repairs and Maintenance – Building 89,730 69,547
– Plant and Machinery 21,345 12,072
– Others 223,916 58,555
Insurance 15,395 13,007
Bad debts written off 1,317,725 208,233
Provision for doubtful debts/advances 2,727,945 1,709,271 –
Less : Provision for doubtful debts written back 107,665 2,620,280 111,135 1,598,136
Provision for diminution in value of inventory 78,796 9,420
Collection and Recovery 1,355,166 921,456
Loss on sale of assets (net) – 9,583
Miscellaneous 1,206,937 1,070,003
12,459,623 6,474,627
161

For the year ended For the year endedParticulars March 31, 2006 March 31, 2005
(Rs. ’000) (Rs. ’000)
SCHEDULE : 20
FINANCE EXPENSES
Interest :
– On Term Loan 1,540,231 1,850,763
– On Debentures 261,299 664,911
– On Others 61,281 144,385
Amortisation of Premium on Redemption of Foreign
Currency Convertible Bonds 90,100 122,916
Other Finance Charges 432,728 395,027
2,385,639 3,178,002
Less : Income
Profit on sale of Current Investments 108,940 400,180
Interest Income :
– from Current Investments (Other than Trade)
(Gross of TDS Rs.20,956 thousand; Previous year Rs. 4,763 thousand) 178,043 89,412
– from loans and advances etc. 23,584 10,453
Exchange fluctuation Gain /(Loss) (Net) (214,342) 24,652
Gains from swap arrangements 45,307 211,415
Other Finance Income – 2,711
141,532 738,823
2,244,107 2,439,179
SCHEDULE : 21
AMORTISATION
(Refer Note 3, 5 and 15 on Schedule 22 and Note 10 on Schedule 23)
Licence Fee 1,204,183 1,162,023
Personnel - Deferred ESOP Cost 127,067 47,128
Goodwill 268,325 231,145
1,599,575 1,440,296
162

163
SCHEDULE : 22
STATEMENT OF SIGNIFICANT ACCOUNTING POLICIES
The significant accounting policies adopted by Bharti Airtel Limited (formerly Bharti Tele-Ventures Limited) ('BAL' or 'the
Company') and its subsidiaries (hereinafter referred to as the “Group”) in respect of these Consolidated Financial Statements,
are set out below.
1. BASIS OF PREPARATION
These consolidated financial statements are prepared under the historical cost convention on the accrual basis of
accounting and reporting requirements of Accounting Standard 21 ‘Consolidated Financial Statements’ issued by the
Institute of Chartered Accountants of India, consolidated as per Para 2 below for the year ended March 31, 2006.
2. PRINCIPLES OF CONSOLIDATION
These accounts represent consolidated accounts of the Company and its majority owned subsidiaries and joint ventures,
all incorporated in India except Bridge Mobile Pte Limited which is incorporated in Singapore , as follows:
Entity Principal Service Relationship Shareholding
as at
March 31, 2006
Bharti Aquanet Limited (‘BAQL’) Submarine Cable landing station Subsidiary 51%
Bharti Comtel Limited (‘BCTL’) Administrative support to
BAL and VSAT equipment trading Subsidiary 100%
Bharti Hexacom Limited (‘BHL’) Cellular Mobile Telephony Subsidiary 68.5%
Services (CMTS)
Bharti Broadband Limited (BBL) Enterprise Services Subsidiary 100%
Satcom Broadband Equipment Enterprise Services and VSAT Subsidiary 100%
Limited (SBEL) Equipment trading
Bridge Mobile Pte Limited Mobile Services Joint Venture 12.5%
Forum I Aviation Limited Buy, sell, lease, hire, maintain, Joint Venture 16.64%
operate and run Aircrafts /
Helicopters etc.
On April 16, 2005, 49% of the share capital of Satcom Broadband Equipment Limited (SBEL) was transferred to BAL
making SBEL a 100% subsidiary of the Company.
For the purpose of this consolidation, jointly owned entities, where BAL or its subsidiaries own directly or indirectly more
than 50 percent of voting rights of a Company’s share capital have been accounted for as subsidiaries.
The Group’s interests in jointly controlled entities are accounted for by proportionate consolidation.
The Group combines its share of the joint ventures’ individual income and expenses, assets and liabilities and cash flows
on a line-by-line basis with similar items in the Group’s financial statements.
The equity and net income attributable to minority shareholders’ interest are shown separately in the Balance Sheets and
Profit and Loss Account, respectively.
All inter-Company balances have been eliminated in the consolidation. The consolidated financial statements are prepared
using uniform accounting policies for like transactions and other events in similar circumstances.
3. GOODWILL
Goodwill is stated as an excess of the purchase consideration over BAL’s interest in the net identifiable assets acquired.
Goodwill is carried at cost less accumulated amortisation and is amortised on a straight-line basis over the remaining
period of the service licence of the acquired Company from the date of acquisition.

4. FIXED ASSETS
Fixed Assets are stated at cost of acquisition and subsequent improvements thereto, including taxes, duties, freight and
other incidental expenses related to acquisition and installation. Capital work-in-progress is stated at cost.
Site restoration cost obligations are capitalised when it is probable that an outflow of resources will be required to settle
the obligation and a reliable estimate of the amount can be made.
The fixed component of license fee payable by the Group for cellular and basic circles, upon migration to the National
Telecom Policy (NTP 1999), i.e. Entry Fee, has been capitalised as an asset and the one time license fee paid by the Group
for acquiring new licences (post NTP-99) (basic, cellular, national long distance and international long distance services)
has been capitalised as an asset.
5. DEPRECIATION / AMORTISATION
Depreciation is provided on straight-line method at the rates and in the manner prescribed in Schedule XIV to the
Companies Act, 1956 on all assets, except for the following on which depreciation is provided on straight line method
to write off the cost of the fixed assets over their estimated useful lives:
Rate of Depreciation per annum
Building 5%
Office Equipment 20.00% / 50.00%
Computer / Software 33.33%
Vehicles 20.00%
Furniture and Fixtures 20.00%
Plant & Machinery 6.67% / 10.00% / 50.00%
Leasehold Land Period of lease
Leasehold Improvements Period of lease or 10 years whichever is less
Assets individually costing Rs. 5 thousand or less are fully depreciated in the month of purchase. Software up to Rs. 500
thousand is written off in the year of purchase.
Bandwidth capacity is depreciated over the period of the agreement subject to a maximum of 15 years.
Additional depreciation is provided as appropriate, towards diminution in value of assets
The Entry Fee capitalised is being amortised equally over the period of the license and the one time licence fee is being
amortised equally over the balance period of licence from the date of commencement of commercial operations.
The site restoration cost obligation capitalised is being depreciated over the period of the useful life of the related asset.
6. REVENUE RECOGNITION AND RECEIVABLES
Mobile Services: Service revenue is recognised on completion of provision of services. Service revenue includes income
on roaming commission and access charges passed on to other operators, and is net of discounts and waivers. Revenue,
net of discount, from sale of goods is recognised on transfer of all significant risks and rewards to the customer and when
no significant uncertainty exists regarding realisation of the consideration.
On introduction of new prepaid products, processing fees on recharge coupon is being recognised over the estimated
customer relationship period or coupon validity period, as applicable.
Telephone and Broadband and Long Distance Services: Service revenue is recognised on completion of provision of
services. Revenue on account of bandwidth service is recognised on time proportion basis in accordance with the related
contracts. Billing Revenue includes access charges passed on to other operators, and is net of discounts and waivers.
Revenue, net of discount, from sale of goods is recognised on transfer of all significant risks and rewards to the customer
and when no significant uncertainty exists regarding realisation of consideration.
164

Enterprise Services: Revenue, net of discount, from sale of goods is recognised on transfer of all significant risks and
rewards to the customer and when no significant uncertainty exists regarding realisation of consideration.
Service Revenues includes revenues from registration, installation and provision of Internet and Satellite services.
Registration fees is recognised at the time of dispatch and invoicing of Start up Kits Installation charges are recognised as
revenue on satisfactory completion of installation of hardware and service revenue is recognised from the date of
satisfactory installation of equipment and software at the customer site and provisioning of Internet and Satellite
services.
Revenue from prepaid dialup packs is recognised on the actual usage basis and is net of sales return and discount.
Investing and other Activities: Income on account of interest and other activities are recognised on an accrual basis.
Dividends are accounted for when the right to receive the payment is established.
Provision for doubtful debts:
Provision for doubtful debts is made for dues outstanding for more than 90 days in case of active subscriber, and dues
from customers who have been deactivated other than those covered by security deposit, or in specific cases where
management is of the view that the amounts are recoverable.
Provision for doubtful debts, in case of Other Telecom Operators on account of their ILD traffic and on account of
Interconnect Usage Charges (IUC), is made for dues outstanding more than 120 days from the date of billing after
considering any amount payable to that operator pertaining to the same period or in specific case when management is
of the view that the amount is recoverable.
Accrued Billing revenue:
Accrued billing revenue represent revenues recognised in respect of Mobile, Broadband and Telephone, and Long
Distance services provided from the bill cycle date to the end of each month. These are billed in subsequent periods as per
the terms of the billing plans.
7. INVENTORIES
Inventories for mobile operations are valued at the lower of cost and net realisable value. Cost is determined on First in
First out basis.
Inventories for telephone and broadband and long distance services and enterprise Services are valued at the lower of
cost and net realisable value. Cost is determined on a weighted average basis.
8. INVESTMENT
Current Investments are valued at lower of cost and fair market value.
Long-term Investments are valued at cost. Provision is made for diminution in value to recognise a decline, if any, other
than that of temporary nature.
9. LICENSE FEES – REVENUE SHARE
With effect from August 1, 1999 the variable Licence fee computed at prescribed rates of revenue share is being charged
to the Profit and Loss Account in the year in which the related revenue arises. Revenue for this purpose comprises
adjusted gross revenue as per the license agreement of the license area to which the licence pertains
10. TRANSLATION OF ITEMS IN FOREIGN CURRENCY
Transactions in Foreign Currency are recorded at the exchange rate prevailing at the date of the transaction. Monetary
items are restated at year-end foreign exchange rates. Resultant exchange differences arising on payment or conversion
of liabilities are recognised as income or expense in the year in which they arise except in respect of liabilities for
acquisition of fixed assets, where such exchange difference is adjusted in the carrying cost of the respective fixed asset.
Gain or loss on forward exchange contract, not in the nature of hedge, is calculated based on difference between
forward rate available at the reporting date for the remaining maturity of the contract (or forward rate last used to
measure gain or loss) and the contracted forward rate which is recognised as income or expense for the year.
165

The premium or discount arising at the inception of other forward exchange contracts is amortised as income or expense
over the life of the contract and exchange difference on such contracts is recognised as income or expense in the
reporting period in which the exchange rate change, except, in respect of liabilities incurred for acquiring fixed assets, in
which case, such difference is adjusted in carrying amount of the respective fixed assets.
11. RETIREMENT BENEFITS
Contribution to provident fund is made at predetermined rates and is charged to Profit and Loss Account. The Group has
provided for the liability at year end on account of unavailed earned leave as per the actuarial valuation as per the
Projected Unit Credit Method.
The Group either contributes to a Group Gratuity Scheme with Life Insurance Corporation of India to cover the gratuity
liability for its employees, such contribution being charged to the Profit and Loss Account for the year or provides the
gratuity liability in its books. Liability at the year-end in both cases is determined on the basis of actuarial valuation, based
on the Projected Unit Credit Method.
12. PRE-OPERATIVE EXPENDITURE
Expenditure incurred by the Group from the date of acquisition of license for a new circle, up to the date of commencement
of commercial operations of the circle, not directly attributable to fixed assets are charged to the Profit and Loss account
in the year in which such expenditure is incurred.
13. LEASES
a) As Lessee – Operating Lease
Lease Rentals in respect of assets taken on ‘Operating Lease’ are charged to the Profit and Loss Account on a straight-
line basis over the lease term.
b) As Lessee – Finance Lease
Assets acquired on ‘Finance Lease’ which transfer risk and rewards of ownership to the Company are capitalised as
assets by the Company at the lower of fair value of the leased property or the present value of the related lease
payments or where applicable, estimated fair value of such assets.
Amortization of capitalised leased assets is computed on the Straight Line method over the useful life of the assets.
Lease rental payable is apportioned between principal and finance charge using the internal rate of return method.
The finance charge is allocated over the lease term so as to produce a constant periodic rate of interest on the
remaining balance of liability.
c) As Lessor – Operating Lease
Lease income in respect of ‘Operating Lease’ is recognised in the Profit and Loss Account on a straight-line basis over
the lease term.
d) As Lessor – Finance Lease
Finance leases as a dealer lessor are recognised as a sale transaction in the Profit and loss account and are treated as
other outright sales.
Finance Income is recognised based on a pattern reflecting a constant periodic rate of return on the net investment
of the lessor outstanding in respect of the lease.
e) Initial direct costs are expensed in the Profit and Loss Account at the inception of the lease.
14. TAXATION
Tax expense for the year, comprising current tax, deferred tax and Fringe Benefit Tax is included in determining the net
profit/ (loss) for the year.
Deferred tax assets are recognised for all deductible timing differences and carried forward to the extent there is reasonable
certainty that sufficient future taxable profit will be available against which such deferred tax assets can be realised.
Deferred tax is recognised only for such timing differences which reverse after tax holiday period. Deferred tax assets to
166

the extent they pertain to brought forward losses and unabsorbed depreciation, are recognised only to the extent that
there is virtual certainty of realisation, based on expected profitability in the future as estimated by the Company.
Deferred tax assets and liabilities are measured at the tax rates that have been enacted or substantively enacted by the
Balance Sheet date.
15. MISCELLANEOUS EXPENDITURE
a) Premium on redemption of debentures is recognised as an expense to the Profit and Loss Account over the period
of the related contract.
b) Employee Stock Option Plan (‘ESOP’) - The aggregate amount of liability on account of ESOP as ascertained at year-
end is being carried forward as Deferred Employee Compensation Benefit under Miscellaneous Expenditure to be
written off on a straight-line basis over the related vesting period of individual options.
16. BORROWING COST
Borrowing cost attributable to the acquisition or construction of a qualifying asset is capitalised as part of the cost of that
asset. Other borrowing costs are recognised as an expense in the period in which they are incurred.
17. IMPAIRMENT OF ASSETS
Assets that are subject to amortisation are reviewed for impairment whenever events or changes in circumstances
indicate that the carrying amount may not be recoverable. An impairment loss is recognised for the amount by which the
assets’ carrying amount exceeds its recoverable amount. The recoverable amount is the higher of the assets’ fair value
less costs to sell and value in use.
For the purpose of assessing impairment, assets are grouped at the lowest levels for which there are separately identifiable
cash flows (cash generating units).
18. SEGMENTAL REPORTING
a) Primary Segment:
The Group operates in four primary business segments viz. Broadband & Telephone Services, Mobile Services, Long
Distance Services and Enterprise Service.
b) Secondary Segment:
The Group has operations within India as well as with entities located in other countries. The operations in India
constitute the major part, which is the only reportable segment, the remaining portion being attributable to others.
19. EARNING PER SHARE
The earnings considered in ascertaining the Group’s Earnings per Share (‘EPS’) comprise the net profit after tax. The
number of shares used in computing basic EPS is the weighted average number of shares outstanding during the year.
The diluted EPS is calculated on the same basis as basic EPS, after adjusting for the effects of potential dilutive equity
shares.
20. WARRANTY
Provision for warranty is based on past experience and technical estimates.
21. PROVISIONS
Provisions are recognised when the Company has a present obligation as a result of past events; it is more likely than not
that an outflow of resources will be required to settle the obligation; and the amount has been reliably estimated.
22. EMPLOYEE STOCK OPTIONS OUTSTANDING
Employee Stock options outstanding are valued using Black Scholes option – pricing model and the fair value is recognised
as an expense over the period in which the options vest.
167

SCHEDULE : 23NOTES TO ACCOUNTS
1. Bharti Airtel Limited (formerly Bharti Tele-Ventures Limited)(‘BAL’ or ‘the Company’) incorporated in India on July 7, 1995,is a company promoted by Bharti Telecom Limited (‘BTL’), a company incorporated under the laws of India. BAL togetherwith its subsidiaries is referred to as ‘the Group’.
2. New Operations
On April 16, 2005, the Group acquired 49% shareholding in Satcom Broadband Equipment Limited (‘SBEL’) at a considerationof Rs. 121,997 thousand making SBEL a 100% subsidiary of the Group.
Bharti Airtel Limited (formerly Bharti Tele-Ventures Limited) (BAL) and Bharti Hexacom Limited (BHL) have entered intoa Scheme of Arrangement for transfer pursuant to de-merger of North East Circle Undertaking from Bharti HexacomLimited to the Group effective April 1, 2005, which has been approved by the Board of Directors of BAL in their meetingheld on July 26, 2005 and July 27, 2005 and the Board of Directors of BHL in their meeting held on July 20, 2005. TheGroup is in the process of filing the approved scheme in the High Court.
BAL has entered into a Scheme of Amalgamation of Satcom Broadband Equipment Limited (SBEL) and Bharti BroadbandLimited (BBL) with the Group effective October 1, 2005, which has been approved by the Board of Directors of the BALin their meeting held on July 26, 2005 and the Board of Directors of SBEL and BBL in their meetings held on July 16, 2005and July 15, 2005 respectively. The Group is in the process of filing the approved scheme in the High Court.
Bharti Hexacom Limited has migrated its Cellular Mobile Telephone Licence to Unified Access Service Licence with effectfrom April 10, 2006 in the telecom circle of Rajasthan.
3. Guarantees
Total Guarantees outstanding as at March 31, 2006 amounting to Rs. 9,362,505 thousand (March 31, 2005 Rs. 5,466,562thousand) have been taken from the banks.
4. Contingent Liability
a) Claims against the Group not acknowledged as debt
(Rs.’000)
Particulars As at As atMarch 31, 2006 March 31, 2005
(i) Taxes, Duties and Other demands(under adjudication / appeal / dispute)
– Sales Tax (see 4 b below) 104,709 5,373,072– Service Tax (see 4 b below) 648,369 471,772– Income Tax 288,115 309,842– Excise Duty – 255,609– Customs Duty (see 4 d below) 1,230,678 486,378– Stamp Duty 529,343 539,267– Entry Tax (see 4 e below) 801,120 231,516– Municipal Taxes 529,171 13,782– Access Charges / Port Charges 806,025 263,500– DoT demands (see 4 c (vii) and 4 g below) 218,518 2,662,990– Other miscellaneous demands 307,751 54,735
(ii) Claims under legal cases including arbitration matters 361,698 404,632
5,825,497 11,067,095
b) In a case involving the Uttar Pradesh Trade Tax Department and the DoT, the Supreme Court of India had ruled that atelephone connection along with a telephone set provided by a company rendering basic services tantamount to a“transfer of right to use the telephone system” and the rentals collected by DoT towards this right to use should suffersales tax. Subsequent to the passing of this order, the Cellular Operators as well as the basic operators agitated the sameissue before the Supreme Court by way of a Petition under Article 32 of the Constitution. The Hon’ble Supreme Court,in spite of its own earlier judgement, admitted the Petitions and vide orders dated September 25, 2003 referred the
168

matter to a larger bench for determination of dispute on merits and further directed that in future there shall be no
coercion for recovery of any dues. Vide an order dated March 2, 2006, the larger bench of the Hon’ble Supreme Court,
while overruling its abovementioned judgement has held, inter alia, that provision of telecom services does not
involve any transfer of right to use the telephone system / network and that imposition of sales tax on any facilities
of telecom services is untenable in law. On Sim cards, the Court has held that depending upon the facts of the case,
(i) if sim card is not being sold, then the state cannot levy sales tax on sim card value as the same is exigible to service
tax; (ii) alternatively, if sim card is being sold, then centre cannot levy service tax on the sim card value as the same
is exigible to sales tax. Accordingly, the respective authorities are in the process of complying with the Supreme
Court order as above in respect of total amount disputed estimated as at March 31, 2006 in respect of sales tax of
Rs. 6,052,432 thousand (March 31, 2005 Rs. 4,297,037 thousand) and service tax of Rs. 257,574 thousand (March
31, 2005 Rs. 98,365 thousand).
c) Erstwhile Bharti Mobile Limited (‘BML’) was awarded license by the DoT to operate cellular services in the state of
Punjab in December 1995. On April 18, 1996, subject to certain conditions, the Group obtained the permission from
the DoT to operate the Punjab license through its wholly owned subsidiary, Evergrowth Telecom Limited (‘ETL’).
(i) In December 1996, DoT withdrew the permission dated April 18, 1996 . DoT, however, again reinstated the
permission on March 10, 1998 (the period from April 18, 1996 to March 10, 1998 has been hereinafter
referred to as ‘the black-out period’). On July 15, 1999 license was terminated due to alleged non-payment of
license fees, liquidated damages and related penal interest.
(ii) Subsequently in September 2001, BML received from the DoT, an offer for the restoration of the license subject
to the condition that BML pays all the dues (license fee, WPC charges, liquidated damages and related penal
interest) pending the resolution of dispute relating to the license fee for the blackout period. BML accordingly
paid Rs. 4,909,948 thousand as demanded by DoT subject to resolution of the dispute through arbitration.
Consequently the license was restored and an arbitrator appointed for the settlement of the dispute.
(iii) In the arbitration proceedings the order was not favourable to BML. BML subsequently filed objections to the
arbitrator’s award before the Delhi High Court. The Delhi High Court vide orders dated February 19, 2003 issued
notices to the DoT. It is pertinent to note that the issuance of notice means stay of the implementation of the
award. While the ultimate outcome of the matter cannot be predicted with certainty, BML had, in the accounts
for the year ended March 31, 2003, as a matter of conservative accounting, recognised Rs. 1,541,667 thousand
(including Rs. 280,000 thousand recoverable from ETL on account of encashment of bank guarantee) as
license fees in addition to Rs. 800,000 thousand recognised in the year ended March 31, 2002.
(iv) The management has also provided for Rs. 69,340 thousand pertaining to liquidated charges and WPC charges paid
in 2003-04 in accordance with the order of DoT in respect of restoration of Punjab license in the year 2002-03.
(v) In a case against DoT, TDSAT had earlier passed an order, directing DoT to refund the interest accrued on
delayed deposit of license fees, pre NTP 99, due to extension of the effective date of license period by six
months. DoT had filed an appeal against the said order before the Supreme Court, which in its judgement
dated March 4, 2003 upheld the contention of GSM operators.
(vi) In view of the non refund of the complete amount due pursuant to the Order dated March 4, 2003 of the
Hon’ble Supreme Court the COAI moved a clarification application of the Order dated March 4, 2003, before
the Hon’ble Supreme Court which was dismissed as withdrawn. COAI thereafter moved execution applications
in TDSAT which also stands disposed off. The COAI moved to the Supreme Court against the interpretation
advanced by the TDSAT in the execution proceedings. The Supreme Court has admitted the matter. The matter
will now come up for hearing in due course of time.
(vii) The Group received refund order of interest from the DoT in the circles of Andhra Pradesh and Karnataka
amounting to Rs. 770,334 thousand and had taken such amounts as an income to Profit and Loss Account
during the year 2002-03. The Group also received the interest refund order in the case of mobile operations in
Punjab on the same grounds amounting to Rs. 856,644 thousand, which was set off against the interest claim
of DoT amounting to Rs. 2,778,941 thousand in 2002-03. During the year ended March 31, 2005, the Group
received a further refund of Rs. 57,338 thousand. The balance amount of Rs. 1,864,959 thousand has been
169

provided in the books during the year ended March 31, 2006. Pending decision of the Delhi High Court, any
amount determined as due from the Group on account of interest etc. cannot be quantified till the matter is
sub-judice. Though the Group is of the view that it has a good arguable case, still, as a matter of conservative
accounting practice, it has now provided for the above-mentioned amount of Rs. 1,864,959 thousand.
d) The Customs Authorities, in some states, demanded Rs. 1,230,678 thousand (included in 4 (a) (i) above) (March 31,
2005 Rs. 486,378 thousand) on import of special software on the ground that this value forms part of the hardware
alongwith which the same has been imported. The view of the Group is that such imports should not suffer any
customs duty as such software is an operating software and exempt from any customs duty.
e) In certain states Entry Tax is levied on receipt of material from outside the state. This position has been challenged
by the Group in the respective states, on the grounds that the specific Entry Tax is ultravires the constitution,
classification issues have been raised whereby, in view of the Group, the material proposed to be taxed is not
covered under the specific category. The amount under dispute as at March 31, 2006 is Rs. 801,120 thousand
(included in 4 (a) (i) above) (March 31, 2005 Rs. 231,516)
f) BAL is currently in litigation with DSS Enterprises Private Limited (‘DSS’) (0.34 per cent equity interest in erstwhile
BCL) on various counts. This inter alia includes alleged claim for specific performance in respect of alleged agreements
to sell the equity interest of DSS in erstwhile Bharti Mobinet Limited. (BMNL) to BAL. The case filed by DSS to enforce
the sale of equity shares before the Delhi High Court was transferred to District Court. The suit filed by DSS was
dismissed in default by the Ltd. Additional District judge on the ground of non-prosecution. Subsequently, DSS filed
an application for restoration of the suit on which notices were issued to BAL and other defendants returnable on
August 22, 2006.
In respect of the same transaction, Crystal Technologies Private Limited, an intermediary, initiated arbitration
proceedings against the Group demanding Rs. 194,843 thousand (March 31, 2005 Rs. 194,843 thousand) regarding
termination of its appointment as a consultant to negotiate with DSS for the sale of DSS stake in erstwhile Bharti
Mobinet Limited to BAL. The next date of hearing is yet to be intimated by the Ld. Arbitrator.
g) During the current year the Group has received demands from DoT pertaining to Bharti Broadband Limited amounting
to Rs. 50,563 thousand against which an appeal has been filed before Hon’ble TDSAT (included in note 4(a) (i)
above). The erstwhile promoter of the Bharti Broadband Limited has undertaken to reimburse the Company in the
event of the claim being payable.
5. Export Obligation
BAQL, erstwhile BIL and erstwhile BCL have obtained licenses under the Export Promotion Credit Guarantee (‘EPCG’)
Scheme for importing capital goods at a concessional rate of customs duty against submission of bank guarantee and
bonds.
Under the terms of the respective schemes, these companies are required to export goods of FOB value equivalent to, or
more than, five times the CIF value of imports in respect of certain licenses and eight times the duty saved in respect of
licenses where export obligation has been refixed by the order of Director General Foreign Trade, Ministry of Finance, as
applicable.
Accordingly these Companies are now required to export goods of FOB value of at least Rs. 27,158,252 thousand (March
31, 2005 Rs. 24,312,530 thousand)
6. a) Estimated amount of contracts to be executed on capital account and not provided for (net of advances)
Rs. 42,954,081 thousand (March 31, 2005 Rs. 19,740,686 thousand).
b) Under the IT Outsourcing Agreement, the Group has commitments to pay Rs. 3,731,265 thousand (March 31, 2005
Rs. 5,988,619 thousand) during the non-cancellable period of the contract for three years ending on March 31,
2007, comprising finance lease and servicing charges.
7. During the current quarter, the Group has revised its estimations for recognition of site restoration cost and its depreciation
from fifteen years to ten years and has provided depreciation as per the revised estimate of useful life, resulting in a
decline in value of plant and machinery by Rs. 366,159 thousand and a higher charge of depreciation by Rs. 44,829
thousand with a consequential impact on profit for the year and net assets of the Group as at that date.
170

8. a) The Group has entered into a Joint Venture agreement dated November 3, 2004 with 7 other overseas mobile
operators to form a regional alliance called the Bridge Mobile Alliance incorporated in Singapore as Bridge Mobile
Pte Ltd. with initial equity to be equally held amongst the eight operators / shareholders. On March 31, 2005 the
Group invested USD-1,000 thousand in ordinary shares of USD 1 each in Bridge Mobile Pte Ltd. amounting to
Rs. 43,763 thousand.
b) The Group has entered into a Memorandum of Understanding dated July 8, 2005 with 5 other parties to form an
aircraft chartering company called the Forum I Aviation Limited incorporated in India with initial equity to be
equally held amongst the six members. During the period ended March 31, 2006 the Group has invested Rs. 34,950
thousand in ordinary shares of Forum I Aviation Limited.
c) Investment in Joint Ventures
Joint Venture Country of Business Ownership Interest
Bridge Mobile Pte Ltd. Singapore 12.50%
Forum I Aviation Ltd. India 16.64%
The following represent the group’s share of Assets and Liabilities, and income and results of the Joint Venture. They are
included in the balance sheet and profit and loss account statement.
As at As at
March 31, 2006 March 31, 2005
Amounts in respect of joint ventures - balance sheet
Reserve and Surplus (15,631) –
Fixed Assets, Net 9,190 –
Investments 2,526 –
Current Assest
Sundry Debtors 1,757 –
Cash and Bank 29,419 –
Loans and Advances 35,475 –
Current Liabilities and Provisions 14,439 –
Amounts in respect of Joint Ventures – Statement of Profit and Loss
Turnover 14,203 –
Expenses
Operating Expenses 11 –
Selling, General and Administration Expenses 25,161 –
Interest (Net) (1,344) –
Depreciation 1,353 –
Profit Before Tax (10,978) –
Provision for Tax 2 –
Profit After Tax (10,980) –
9. Vide a Supply contract and Construction and Maintenance Agreement executed on March 27, 2004, Alcatel
Submarine Networks of France and Fujitsu Ltd. of Japan provided the SEA-ME-WE-4 Cable Systems (broadly described
as a submarine cable system linking South East Asia and Europe, via the Indian Sub-Continent & Middle East) and
will also provide long-term technical support to a consortium of sixteen Telecom operators in various countries
including the Group whose share (8.051%) of the contract price is estimated to be USD 37,840 thousand
(March 31, 2005 USD 39,055 thousand).
171

10. Goodwill
The following is the detail of Goodwill in the consolidated financial statements of BAL as at March 31, 2006:
(Rs.’000)
Nature of Transaction As at As atMarch 31, 2006 March 31, 2005
On Acquisition of :
68.5 per cent equity interest in BHL by BAL 3,056,346 3,056,346
100 per cent equity interest in SBEL by BAL 31,070 9,139
100 per cent equity interest in BBL by SBEL 92,860 92,860
Proportionate consolidation of Bridge Mobile Pte Ltd. 4,650 –
Total 3,184,926 3,158,345
11. Minority interest represents that part of the net results of operations and of the net assets of a subsidiary attributable tointerests which are not owned, directly or indirectly through subsidiary (ies) by BAL Minority interest as at the year-end is:
Name of Company As at As atMarch 31, 2006 March 31, 2005
Bharti Aquanet Limited 49.00% 49.00%
Bharti Hexacom Limited 31.50% 31.50%
Satcom Broadband Equipment Limited – 49.00%
The amount attributable to the minority shareholders as the year-end is on account of:
(Rs.’000)
Particulars As at As atMarch 31, 2006 March 31, 2005
Share Capital 576,730 698,540
Share Premium 85,750 85,750
Share of Opening Reserve 162,023 19,422
Share of current year Profit/(Loss) 266,545 120,857
Total 1,091,048 924,569
12. The Group had allotted 37,500 Optionally Convertible Redeemable Debentures (‘OCRDs’) of Rs. 100,000 each aggregatingto Rs. 3,750,000 thousand that were optionally convertible into equity shares at an Agreed Price on a preferential basisto the erstwhile shareholders of BHL (the sellers) as part of the consideration for 67.5% equity in Bharti Hexacom Limitedacquired during 2004-05. The tenor of the OCRDs was 364 days from and including the date of allotment. The OCRDswere convertible solely and entirely at the option of the Seller and BAL was not entitled to convert the same into equityshares unless the Sellers exercised their option to convert. If the Sellers chose not to convert all or part of the OCRDs, thenthe outstanding OCRDs were to be redeemed at face value at the end of the tenor. BAL and the Sellers were to share anyupside in the BAL stock price, at the time of Conversion. The difference between the Relevant Price and the Agreed Pricewas to be shared in the 60:40 ratio (BAL:Sellers) respectively at the time of conversion of the OCRDs. The upside was tobe adjusted by way of reducing the number of shares to be allotted on conversion. The Relevant Price would be theaverage of the closing prices (as given in the Exchange Bhav Copy) of BAL shares quoted on NSE and BSE (both) duringthe three trading days preceding the Notice Date or the end of the Tenor as applicable.
During the year ended March 31, 2006 the Group has issued 20,088,445 equity shares of Rs. 10/- each fully paid up toM/s. Shyam Cellular Infrastructures Projects Limited upon conversion of Optionally Convertible Redeemable Debentures(OCRDs) which is as follows:
(Rs. ‘000)
Date of Allotment No. of Shares Allotted Conversion Amount
April 24, 2005 5,424,479 1,012,609
May 10, 2005 14,538,078 2,713,881
June 9, 2005 125,888 23,500
172

13. As mentioned in Note 2 above the Group has acquired 49% shareholding in Satcom Broadband Equipment Limited on
April 16, 2005. SBEL has 100% shareholding in Bharti Broadband Limited. The details of net assets of consolidated SBEL
acquired and goodwill on the date of acquisition is set out below:
(Rs. ’000)
Net Assets acquired as at April 16, 2005 (A) 100,067
Consideration (including consideration for Bharti Broadband Limited paid by SBEL)
- Cash (B) 121,997
Goodwill on acquisition (B) - (A) 21,930
14. During the year ended March 31, 2005 the Group issued USD 115,000,000 Zero Coupon Convertible Bonds due 2009
(the “Bonds”). The Bonds are convertible at any time on or after June 12, 2004 (or such earlier date as is notified to the
holders of the Bonds by the Issuer) up to April 12, 2009 by holders into fully paid equity shares with full voting rights with
a par value of Rs. 10 each of the Issuer (“Shares”) at an initial Conversion Price (as defined in the “Terms and Conditions
of the Bonds”) of Rs. 233.17 per share with a fixed rate of exchange on conversion of Rs. 43.56 = USD 1.00. The
Conversion Price is subject to adjustment in certain circumstances.
The Bonds may be redeemed, in whole or in part, at the option of the Issuer at any time on or after May 12, 2007 and prior
to April 12, 2009, subject to satisfaction of certain conditions, at their “ Early Redemption Amount” (as defined in the
“Terms and Conditions of the Bonds”) at the date fixed for such redemption if the “Closing Price” (as defined in the
“Terms and Conditions of the Bonds”) of the Shares translated into U.S. dollars at the “prevailing rate” (as defined in the
“Terms and Conditions of the Bonds”) for each of 30 consecutive “Trading Days” (as defined in the “Terms and Conditions
of the Bonds”), the last of which occurs not more than five days prior to the date upon which notice of such redemption
is published, is greater than 120 per cent of the “Conversion Price” (as defined in the “Terms and Conditions of the
Bonds”) then in effect translated into U.S. dollars at the rate of Rs. 43.56 = USD 1.00.
The Bonds may also be redeemed in whole, and not in part, at any time at the option of the Issuer at their Early
Redemption Amount if less than 5 per cent in aggregate principal amount of the Bonds originally issued is outstanding.
The Bonds may also be redeemed in whole at any time at the option of the Issuer at their Early Redemption Amount in
the event of certain changes relating to taxation in India.
Unless previously converted, redeemed or purchased and cancelled, the Bonds will be redeemed in U.S. dollars on
May 12, 2009 at 111.84 per cent of their principal amount.
The Issuer will, at the option of any holder of any Bonds, repurchase at the Early Redemption Amount such Bonds at such
time as the Shares cease to be listed or admitted to trading on the NSE or upon the occurrence of a “Change of Control”
(as defined in the “Terms and Conditions of the Bonds”) in respect of the Issuer. These Bonds are listed in the Singapore
Exchange Securities Trading Limited (the “SGX-ST”).
The Group has during the period ended March 31, 2006 Converted Bonds equivalent to USD 94,756,000 into 17,701,967
equity shares of the Group at the option exercised by the bond holders which is as follows:
Date of Allotment No. of Shares Allotted FCCB Value (USD)
August 12, 2005 840,673 4,500,000
August 20, 2005 706,166 3,780,000
September 15, 2005 3,693,360 19,770,000
September 23, 2005 2,640,088 14,132,000
October 19, 2005 3,462,828 18,536,000
November 7, 2005 2,073,661 11,100,000
December 12, 2005 467,041 2,500,000
January 12, 2006 2,860,159 15,310,000
Feburary 2, 2006 453,588 2,428,000
March 9, 2006 504,403 2,700,000
Total 17,701,967 94,756,000
173

Particulars Amount Security ChargesOutstanding
(Rs. ’000)
15. Rs. 2,870,490 thousand (March 31, 2005 2,662,188 thousand) included under Current Liabilities, represents refundable
security deposits received from subscribers on activation of connections granted thereto and are repayable on
disconnection, net of outstanding, if any. Sundry debtors are secured to the extent of the amount outstanding against
individual subscribers by way of Security Deposit received from them.
16. As at March 31, 2006 4,195,449 equity shares (March 31, 2005 6,436,266 equity shares) of the Group are held by Bharti
Tele-Ventures Employee’s Welfare Trust (“The Trust”), issued at the rate of Rs. 51.36 per equity share fully paid up.
17. Billing Revenue in the Profit and Loss Account is net of Rebates and Discounts Rs. 61,467 thousand (March 31, 2005
Rs. 1,920,154 thousand).
18. The Loans and Advances granted to associates are repayable on demand and repayments made during the year are as
mutually agreed.
19. Particulars of securities charged against secured loans taken by the Group are as follows :
Debentures
10.55%, 5 Non-Convertible Redeemable 12,500Debentures of Rs. 10,000 thousandeach repayment commencingfrom December 2004
10.90%, 27 Non-Convertible Redeemable 20,000Debentures of Rs. 10,000 thousandeach repayment commencingfrom December 2006
11.45%, 5 Non-Convertible Redeemable 50,000Debentures of Rs. 10,000 thousandeach repayment commencingfrom December 2009
11.70%, 45 Non-Convertible Redeemable 450,000Debentures of Rs. 10,000 thousandeach repayment commencingfrom December 2009
7.25%, 200 Non-Convertible Redeemable 1,400,000Debentures of Rs. 10,000 thousandeach repayment commencingfrom October 2003
8.65%, 95 Non-Convertible Redeemable 950,000Debentures of Rs. 10,000each repayable in May 2007
Debentures 2,882,500
• First ranking pari passu charge on allpresent and future tangible movable andfreehold immovable assets owned by theCompany including plant and machineryoffice equipment, furniture and fixturesfittings, spares tools and accessoriesvehicles.
• All rights, titles, interests in the accounts,and monies deposited and investmentsmade there from and in projectdocuments, book debts and insurancepolicies.
174

Particulars Amount Security ChargesOutstanding
(Rs. ’000)
Loans and Advances from Banks
Term Loan
Rupee Loan Rs. 400,000 thousand Repayable 100,000in 4 half yearly installments beginningMarch 2005
Rupee Loan Rs.500,000 thousand Repayable 125,000in 4 half yearly installments beginningSeptember 2005
Rupee Loan of Rs. 900,000 thousand 450,000Repayable in 4 half yearly installmentsbeginning July 2005
Term Loan 675,000
Cash Credit
Cash Credit Rs. 50,000 thousand (BCTL) 15,373
Cash Credit 15,373
Other Loans and Advances
Term loan from Financial Institution for 3,000,000Rs. 3,000,000 thousand repayable in11 quarterly installments commencingfrom October 2006
Rupee Loan from financial institutions 1,500,000Rs. 2500,000 thousand repayable in10 half yearly installments beginningMarch 2007
Foreign Currency Term Loan of USD 86,110 2,687,000thousand repayable in 20 half yearlyinstallments beginning December 2002
Foreign Currency Term Loan of USD 37,057 1,274,000thousand repayable in 20 half yearlyinstallments beginning August 2003
Foreign Currency Term Loan of USD 37,009 1,216,000thousand repayable in 20 half yearlyinstallments beginning February 2004
Long Term Foreign Currency Loan of 1,438,500USD 30,000 thousand repayable in10 half yearly installmentsbeginning July 2006
Long Term Foreign Currency Loan of 384,774USD 10,000 thousand repayable in 13 halfyearly installments beginning June 2005
• First ranking pari passu charge on all presentand future tangible movable and freeholdimmovable assets owned by the Companyincluding plant and machinery officeequipment, furniture and fixtures fittings,spares tools and accessories vehicles.
• All rights, titles, interests in the accounts, andmonies deposited and investments madethere from and in project documents, bookdebts and insurance policies.
• Secured by hypothecation of all current assetsboth present and fututre, including bookdebts, monies, receivables, claim bills andcontracts of the Company.
175

Particulars Amount Security ChargesOutstanding
(Rs. ’000)
Long Term Foreign Currency Loan of 461,729USD 12,000 thousand repayable in 13 halfyearly installments beginning June 2005
Long Term Foreign Currency Loan of 1,673,408USD 46,000 thousand repayable in 20 halfyearly installments beginning June 2004
Long Term Foreign Currency Loan of 696,632USD 27,956 thousand repayable in 19 halfyearly installments beginning June 2004
Foreign Currency Term Loan of 765,000USD 18,996 thousand repayable in 20 halfyearly installments beginning May 2005
Foreign Currency Term Loan of USD 43,035 1,522,000thousand repayable in 20 half yearlyinstallments beginning September 2005
Foreign Currency Term Loan of USD 36,822 1,565,000thousand repayable in 20 half yearlyinstallments beginning January 2006.
Foreign Currency Term Loan of 2,333,000USD 52,125 thousand repayable in 20 halfyearly installments beginning May 2006
Foreign Currency Term Loan of USD 48,310 2,155,000thousand repayable in 20 half yearlyinstallments beginning September 2006
Foreign Currency Term Loan of USD 5,000 219,700thousand repayable in 20 half yearlyinstallments beginning September 2005
Foreign Currency Term Loan of USD 4,645 204,100thousand repayable in 20 half yearlyinstallments beginning March 2006
Foreign Currency Term Loan of USD 27,229 1,196,400thousand repayable in 20 half yearlyinstallments beginning July 2006
Foreign Currency Term Loan of USD 11,781 517,654thousand repayable in 20 half yearlyinstallments beginning November 2006
Term Loan Total 24,809,897
Vehicle Loans From Banks 16,311 • Secured by Hypothecation of vehicles of the Company.
Total 28,399,081
• First ranking pari passu charge on all presentand future tangible movable and freeholdimmovable assets owned by the Companyincluding plant and machinery officeequipment, furniture and fixtures fittings,spares tools and accessories vehicles.
• All rights, titles, interests in the accounts, andmonies deposited and investments madethere from and in project documents, bookdebts and insurance policies.
176

Note : Following shall be excluded from Securities as mentioned above:-
a) Intellectual properties of BAL.
b) Investment in subsidiaries of BAL.
c) Licenses issued by DoT to operate various telecom services.
20. a) The Group has introduced bonus plans aimed towards performance and retention of employees who are eligible
based on certain eligibility criterias. This provision will be utilised at the end of the period of the bonus plan on
payment to the eligible employees.
b) The movement of Provision made for Site Restoration Cost, leave encashment, deferred bonus plan and warranty
charges in accordance with AS-29 ‘Provisions, Contingent Liabilities and Contingent Assets’ issued by Institute of
Chartered Accountants of India, is given below:
i) Site Restoration Cost:
(Rs. ‘000)
Year ended Year ended
March 31, 2006 March 31, 2005
Opening Balance 961,242 –
Addition during the year 905,177 961,242
Less: Utilised during the year – –
Closing Balance 1,866,419 961,242
ii) Leave encashment:
(Rs. ‘000)
Year ended Year ended
March 31, 2006 March 31, 2005
Opening Balance 134,512 82,400
Addition during the year 154,147 92,945
Less: Utilised during the year 50,734 40,833
Closing Balance 237,925 134,512
iii) Deferred Bonus plan:
(Rs. ‘000)
Year ended Year ended
March 31, 2006 March 31, 2005
Opening Balance – –
Acquired under the scheme of amalgamation – –
Addition during the year 73,622 –
Less: Utilised during the year – –
Closing Balance 73,622 –
iv) Warranty Charges:
(Rs. ‘000)
Year ended Year ended
March 31, 2006 March 31, 2005
Opening Balance 7,200 5,370
Acquired under the scheme of amalgamation – –
Addition during the year 2,731 2,430
Less: Utilised/Reversed during the year 7,298 600
Closing Balance 2,633 7,200
177

21. Profit on sale of investments is net of loss on sale of investments Rs. 2,103 thousand (March 31, 2005 Rs. 6,732
thousand).
22. Information about Business Segments – Primary
For the year ended March 31, 2006 (Rs. ‘000)
Reportable Segments Broadband & Enterprises Enterprise
Mobile Telephone Services Services
Services Services Carriers Corporate Others Eliminations Total
Revenue
Billing Revenue/Sale of 81,660,647 14,369,149 14,369,560 6,857,577 (1,840) – 117,255,093
Goods and Other Income
Inter Segment Revenue 1,434,342 705,927 10,304,307 75,504 – (12,520,080) –
Total Revenue 83,094,989 15,075,076 24,673,867 6,933,081 (1,840) (12,520,080) 117,255,093
Results
Segment Result, Profit/(Loss) 16,853,850 605,793 7,794,046 1,761,538 (1,316,231) – 25,698,996
Operating Profit/(Loss)
before Finance Expenses 16,853,850 605,793 7,794,046 1,761,538 (1,316,231) – 25,698,996
Net Finance Expense/
(Income) – – – – 2,244,107 – 2,244,107
Net Profit/(Loss) 16,853,850 605,793 7,794,046 1,761,538 (3,560,338) – 23,454,889
Provision for Tax – – – – 1,773,852 – 1,773,852
Fringe Benefit Tax – – – – 197,593 – 197,593
Deferred Tax Expense – – – – 937,413 – 937,413
Minority Share 261,141 – 5,404 – – – 266,545
Net Profit/(Loss) after tax 16,592,709 605,793 7,788,642 1,761,538 (6,469,196) – 20,279,486
Other Information
Segment Assets 126,674,072 30,348,910 25,883,831 7,805,110 3,487,652 – 194,199,575
Inter Segment Assets 2,115,780 10,705,203 19,061,109 4,077,043 41,044,678 (77,003,813) –
Advance Tax
(Net of provision for tax) – – – – 1,031,629 – 1,031,629
Total Assets 128,789,852 41,054,113 44,944,940 11,882,153 45,563,959 (77,003,813) 195,231,204
Segmental Liabilities 87,157,350 7,761,593 12,680,028 3,250,947 7,717,944 – 118,567,862
Inter Segment Liabilities 20,108,217 35,932,027 16,306,979 4,592,614 63,976 (77,003,813) –
Minority Interest 974,893 – 116,155 – – – 1,091,048
Deferred Tax Liability – – – – 1,948,431 – 1,948,431
Total Liabilities 108,240,460 43,693,620 29,103,162 7,843,561 9,730,351 (77,003,813) 121,607,341
Capital Expenditure 35,477,562 10,089,375 4,817,384 1,243,597 39,015 – 51,666,933
Depreciation
and amortisation 11,444,626 2,647,423 1,882,629 380,973 63,123 – 16,418,774
178

For the year ended March 31, 2005 (Rs. ‘000)
Reportable Segments Broadband & Enterprises Enterprise
Mobile Telephone Services Services
Services Services Carriers Corporate Others Eliminations Total
Revenue
Billing Revenue/Sale of 54,621,629 10,646,178 10,931,824 5,345,906 12,308 – 81,557,845
Goods and Other Income
Inter Segment Revenue 814,274 664,544 7,805,577 59,760 367,329 (9,711,484) –
Total Revenue 55,435,903 11,310,722 18,737,401 5,405,666 379,637 (9,711,484) 81,557,845
Results
Segment Result, Profit/(Loss) 10,384,665 1,441,987 4,716,022 2,284,148 (544,796) (10,874) 18,271,152
Operating Profit/(Loss)
before Finance Expenses 10,384,665 1,441,987 4,716,022 2,284,148 (544,796) (10,874) 18,271,152
Net Finance Expense/ – – – – 2,439,179 – 2,439,179
(Income) net
Net Profit/(Loss) 10,384,665 1,441,987 4,716,022 2,284,148 (2,983,975) (10,874) 15,831,973
Provision for Tax – – – – 130,861 – 130,861
Deferred Tax Expense – – – – 3,464,514 – 3,464,514
Minority Share – – 6,891 (13,150) 127,116 – 120,857
Net Profit/(Loss) after tax 10,384,665 1,441,987 4,709,131 2,297,298 (6,706,466) (10,874) 12,115,741
Other Information
Segment Assets 89,213,406 18,270,396 20,388,847 3,519,715 10,155,264 (10,874) 141,536,754
Inter Segment Assets 921,566 7,560,446 13,094,937 1,884,957 37,582,942 (61,044,848) –
Advance Tax
(Net of provision for tax) – – – – 696,463 – 696,463
Total Assets 90,134,972 25,830,842 33,483,784 5,404,672 48,434,669 (61,055,722) 142,233,217
Segmental Liabilities 65,514,119 3,678,045 12,746,477 1,393,745 11,619,697 – 94,952,083
Inter Segment Liabilities 22,197,861 24,020,307 12,835,844 1,985,157 5,679 (61,044,848) –
Minority Interest – – – – 924,569 – 924,569
Deferred Tax Liabilities – – – – 1,011,019 – 1,011,019
Total Liabilities 87,711,980 27,698,352 25,582,321 3,378,902 13,560,964 (61,044,848) 96,887,671
Capital Expenditure 25,853,008 4,371,933 3,255,070 835,745 27,540 – 34,343,296
Depreciation and 8,126,044 1,917,452 1,397,218 161,512 405,014 – 12,007,240
Amortisation
Notes:
1. ‘Others’ represents the unallocated revenue, profit/(loss), assets and liabilities of the Group.
2. Segment results represents Profit/(loss) before Finance expenses and tax.
3. Capital expenditure pertains to gross additions made to fixed assets during the year excluding goodwill.
4. Segment Assets include Fixed Assets, Capital Work in progress, Pre-operative expenses pending allocation, Investments,Current Assets and Miscellaneous Expenditure to the extent not written off.
5. Segment Liabilities include Secured and Unsecured loans and Current Liabilities and provisions.
6. Inter segment assets/liabilities represent the inter segment account balances.
7. Inter segment revenue excludes the provision of telephone services free of cost among Group Companies. Other Intersegment revenues are accounted for at market prices. These transactions have been eliminated in consolidation.
179
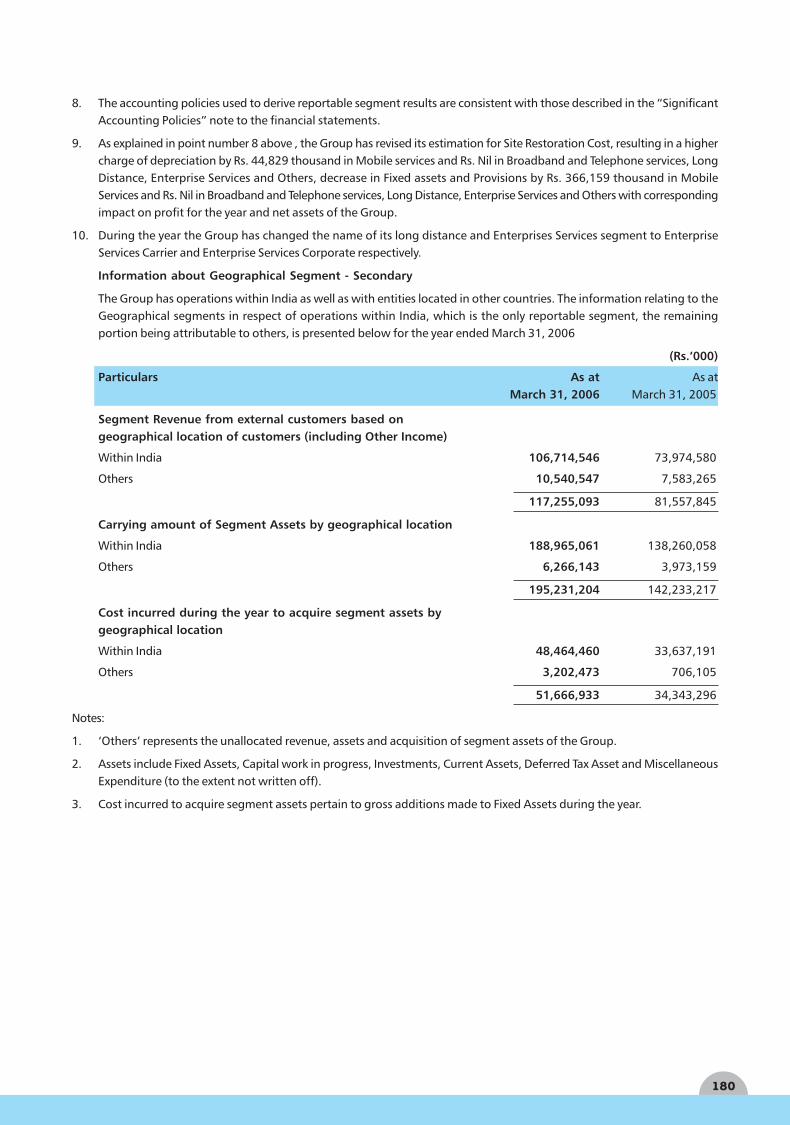
8. The accounting policies used to derive reportable segment results are consistent with those described in the “SignificantAccounting Policies” note to the financial statements.
9. As explained in point number 8 above , the Group has revised its estimation for Site Restoration Cost, resulting in a highercharge of depreciation by Rs. 44,829 thousand in Mobile services and Rs. Nil in Broadband and Telephone services, LongDistance, Enterprise Services and Others, decrease in Fixed assets and Provisions by Rs. 366,159 thousand in MobileServices and Rs. Nil in Broadband and Telephone services, Long Distance, Enterprise Services and Others with correspondingimpact on profit for the year and net assets of the Group.
10. During the year the Group has changed the name of its long distance and Enterprises Services segment to EnterpriseServices Carrier and Enterprise Services Corporate respectively.
Information about Geographical Segment - Secondary
The Group has operations within India as well as with entities located in other countries. The information relating to theGeographical segments in respect of operations within India, which is the only reportable segment, the remainingportion being attributable to others, is presented below for the year ended March 31, 2006
(Rs.’000)
Particulars As at As atMarch 31, 2006 March 31, 2005
Segment Revenue from external customers based ongeographical location of customers (including Other Income)
Within India 106,714,546 73,974,580
Others 10,540,547 7,583,265
117,255,093 81,557,845
Carrying amount of Segment Assets by geographical location
Within India 188,965,061 138,260,058
Others 6,266,143 3,973,159
195,231,204 142,233,217
Cost incurred during the year to acquire segment assets bygeographical location
Within India 48,464,460 33,637,191
Others 3,202,473 706,105
51,666,933 34,343,296
Notes:
1. ‘Others’ represents the unallocated revenue, assets and acquisition of segment assets of the Group.
2. Assets include Fixed Assets, Capital work in progress, Investments, Current Assets, Deferred Tax Asset and MiscellaneousExpenditure (to the extent not written off).
3. Cost incurred to acquire segment assets pertain to gross additions made to Fixed Assets during the year.
180

23. Related Party Disclosures:
In accordance with the requirements of Accounting Standards (AS) -18 on Related Party Disclosures, the names of the
related parties where control exists and/or with whom transactions have taken place during the year and description of
relationships, as identified and certified by the management are:
List of Related Parties:
Key Management Personnel:
Sunil Bharti Mittal
Rajan Bharti Mittal
Akhil Gupta
Manoj Kohli
Other Related Parties
Name of the Related Party Relationship
Singapore Telecommunications Limited Entity having Significant Influence
Bharti Telesoft Limited Entity where Key Management Personnel exercises
significant influence
Bharti Teletech Limited Entity where Key Management Personnel exercises
significant influence
Bharti Telesoft International Limited Entity where Key Management Personnel exercises
significant influence
Teletech Services (India) Limited Entity where Key Management Personnel exercises
significant influence
Mulberry Projects Private Limited Entity where Key Management Personnel exercises
significant influence
Bharti Foundation Entity where Key Management Personnel exercises
significant influence
Bharti Tele-Ventures Employees’ Trust Entity where Key Management Personnel exercises
significant influence
181

Rel
ated
Par
ty t
ran
sact
ion
fo
r 20
05-0
6
Sin
gap
ore
Bh
arti
Bh
arti
Tele
tech
Bh
arti
Mu
lber
ryB
har
tiB
har
tiM
ano
jN
atu
re o
f Tr
ansa
ctio
ns
Tele
com
mu
ni-
Tele
soft
Tele
tech
Serv
ices
(I)
Tele
soft
Pro
ject
sFo
un
da-
Tele
-Ven
ture
sK
oh
lica
tio
ns
Lim
ited
Lim
ited
Lim
ited
Inte
rnat
ion
alPv
t. L
td.
tio
nEm
plo
yees
’Li
mit
edLi
mit
edW
elfa
re T
rust
Purc
hase
of
Fixe
d as
sets
–(1
,55
5)
(30
3,7
50
)–
––
––
Rend
erin
g of
Ser
vice
s1
,42
6,8
40
–1
3–
––
––
–
Rece
ivin
g of
Ser
vice
s(8
94
,33
3)
(13
,10
3)
(31
7,3
39
)(1
44
,79
4)
(23
,21
7)
(10
,93
8)
––
–
Fund
s tr
ansf
erre
d/In
clud
es e
xpen
ses
incu
rred
on
beha
lf of
oth
ers
–6
18
15
,45
1–
––
––
–
Fund
s re
ceiv
ed/In
clud
es e
xpen
ses
incu
rred
on
beha
lf of
com
pany
––
(26
)–
––
––
–
Empl
oyee
Rel
ated
Tra
nsac
tion
incu
rred
on
beha
lf of
oth
ers
––
10
8–
––
––
–
Sala
ry–
––
––
––
–1
8,1
81
Don
atio
n–
––
––
–8
4,8
55
––
Am
ount
rec
eive
d on
exe
rcis
e of
ESO
P op
tion
s–
––
––
––
(59
,73
2)
–
Clo
sin
g B
alan
ce3
18
,37
22
46
,01
9(3
6,5
37
)–
(4,8
41
)7
,92
0–
21
5,5
33
–
Cre
dit
ors
––
(38
,51
3)
–(4
,84
1)
––
––
Loan
and
Adv
ance
s–
–1
,97
6–
–7
,92
0–
21
5,5
33
–
Deb
tors
31
8,3
72
24
6,0
19
––
––
––
–
Clo
sin
g B
alan
ce3
18
,37
22
46
,01
9(3
6,5
37
)–
(4,8
41
)7
,92
0–
21
5,5
33
–
Not
es:
1)
The
abov
e ex
clud
es p
rovi
sion
of
tele
phon
e se
rvic
es f
ree
of c
ost
amon
g th
e G
roup
Com
pani
es.
2)
Paym
ent
mad
e to
Key
Man
agem
ent
Pers
onne
l (ex
clud
ing
Man
oj K
ohli)
is R
s. 1
93,4
14 t
hous
and
(Mar
ch 3
1, 2
005
Rs.
159,
132
thou
sand
).
(Rs.
’00
0)
182

Rel
ated
Par
ty T
ran
sact
ion
s fo
r 20
04-0
5
(Rs.
’00
0)
Sin
gap
ore
Bh
arti
Bh
arti
Bh
arti
Bh
arti
Bhar
ti Te
leso
ftM
ulb
erry
Am
bien
ceTu
lipN
etw
ork
Tele
tech
Tele
com
mun
i-N
atu
re o
f tr
ansa
ctio
nTe
leco
mm
u-En
terp
rise
sTe
leco
mTe
leso
ftTe
lete
chIn
tern
atio
nal
Pro
ject
sRe
alit
yPr
oje
cts
i2i
Serv
ices
(I)
cati
on
Co
nsu
l-n
icat
ion
sPr
ivat
eLi
mit
ed**
Lim
ited
Lim
ited
Lim
ited
Pvt.
Ltd
.Pv
t. L
td.*
Pvt.
Ltd
.*Li
mit
ed*
Lim
ited
tan
ts o
f In
dia
Lim
ited
Lim
ited
*Li
mit
ed**
Pur
chas
e of
Fix
ed a
sset
s–
––
–(2
,98
2)
(7,6
35
)–
––
(67
4,5
34
)–
–
Sale
of F
ixed
Ass
ets
––
––
––
––
––
––
Rend
erin
g of
Ser
vice
s1
,32
6,8
18
––
2,0
01
7,6
68
––
––
13
,47
5–
–
Rece
ivin
g of
Ser
vice
s(2
67
,88
2)
––
(1,4
25
)(3
68
,21
6)
(10
7,7
22
)(6
,83
5)
(23
,36
0)
(2,9
29
)(6
7,5
91
)(2
6,7
82
)–
Fund
s tr
ansf
erre
d/ In
clud
es e
xpen
ses
incu
rred
on b
ehal
f of
oth
ers
––
–3
61
03
,04
44
,16
07
,92
0–
82
81
,80
2–
2,0
29
Fund
s re
ceiv
ed/
Incl
udes
exp
ense
s in
curr
edon
beh
alf
of c
ompa
ny–
––
(68
9)
(5,1
79
)(8
)–
––
––
–
Empl
oyee
Rel
ated
Tra
nsac
tion
incu
rred
on b
ehal
f of
oth
ers
–2
47
36
0–
––
––
––
––
Empl
oyee
Rel
ated
Tra
nsac
tion
incu
rred
on b
ehal
f of
com
pany
–(2
47
)(3
60
)–
–(1
3)
––
––
–(1
,99
5)
Clo
sin
g B
alan
ce5
4,9
41
––
4,3
33
(26
,12
9)
(24
,46
6)
7,9
20
95
,62
54
,11
38
,36
3–
–
Cre
dit
ors
––
––
(26
,12
9)
(24
,46
6)
––
––
––
Loan
and
Adv
ance
s–
––
2,4
50
––
7,9
20
95
,62
54
,11
3–
––
Deb
tors
54
,94
1–
–1
,88
3–
––
––
8,3
63
––
Clo
sin
g B
alan
ce5
4,9
41
––
4,3
33
(26
,12
9)
(24
,46
6)
7,9
20
95
,62
54
,11
38
,36
3–
–
* En
tity
whe
re K
ey M
anag
emen
t Pe
rson
nel e
xerc
ises
sig
nific
ant
influ
ence
in t
he y
ear
2004
–05.
** E
ntit
y ha
ving
sig
nific
ant
influ
ence
in t
he y
ear
2004
–05.
Not
es:
1.Th
e ab
ove
excl
udes
pro
visi
on o
f te
leph
one
serv
ices
fre
e of
cos
t am
ong
the
grou
p co
mpa
nies
2.Pa
ymen
t m
ade
to K
ey M
anag
eria
l Per
sonn
el is
Rs.
159
,132
tho
usan
d (M
arch
31,
200
4 Rs
. 84
,942
tho
usan
d).
183

24. Leases
a) Operating Lease – As a Lessee
The lease rentals charged during the year for cancellable/non-cancellable leases relating to rent of building premises andcell sites as per the agreements and maximum obligation on long-term non-cancelable operating leases are as follows:
(Rs. ’000)
As at As atMarch 31, 2006 March 31, 2005
Lease Rentals debited to Profit and Loss Account 2,162,871 1,248,258Obligations on non-cancellable leases:Not later than one year 30,560 2,445Later than one year but not later than five years 159,600 58,362Later than five years 30,095 –
Total 220,255 60,807
b) Operating Lease - As a Lessor
i) The Group has entered into a non-operating lease arrangement to provide approximately 100,000 Fiber pairkilometers of dark fiber on Indefeasible Right of Use (IRU) basis for a period of 15 years. The lease rental receivableproportionate to actual kilometers accepted by the customer is credited to the Profit and Loss Account on a straight- line basis over the lease term. Due to the nature of the transaction, it is not possible to compute gross carryingamount, depreciation for the year and accumulated depreciation of the asset given on operating lease as atMarch 31, 2006 and accordingly, disclosures required by AS 19 is not provided.
ii) The future minimum lease payments receivable are:
(Rs. ’000)
As at As atMarch 31, 2006 March 31, 2005
Not later than one year 281,734 280,000Later than one year but not later than five years 1,126,936 1,120,000Later than five years 2,300,829 2,567,699
Total 3,709,499 3,967,699
c) Finance Lease - As a Lessor
During the year the Group has given certain VSAT assets under Finance lease. The reconciliation between the totalof minimum lease payments as at March 31, 2006 and their present value is as follows:
(Rs. ’000)
Gross Unearned PresentInvestment Finance Income value
Not later than one year 20,353 2,949 17,404Later than one year but not later than five years 21,445 1,550 19,895
Total 41,798 4,498 37,299
As at March 31, 2005(Rs. ’000)
Gross Unearned PresentInvestment Finance Income value
Not later than one year 29,730 4,585 25,145 Later than one year but not later than five years 33,887 3,485 30,402
Total 63,617 8,070 55,547
Note: The unguaranteed residual value of finance lease accruing to the group is Nil (Previous year Nil).
184

d) Finance Lease – As a Lessee
The group has taken certain vehicles on Finance Lease.The reconciliation between the total of minimum lease paymentsas at March 31, 2006 and their present value is as follows:-
(Rs. ’000)
Minimum Future Finance PresentLease Payments Charges value
Not later than one year 376 6 370Later than one year but not later than five years 157 1 156
Total 533 7 526
As at March 31, 2005 (Rs. ’000)
Minimum Future Finance PresentLease Payments Charges value
Not later than one year 1,681 96 1,585Later than one year but not later than five years 1,442 32 1,410
Total 3,123 128 2,995
e) Exchange of IRU’s
The Group has also entered into a non-cancelable operating lease to take approximately 922.37 kilometers 2 pair of darkfiber against consideration in cash and exchange of approximately 246.75 kilometers 2 pair of dark fiber for a period of15 years. Due to the nature of the transaction, it is not possible to compute gross carrying amount, depreciation for theyear and accumulated depreciation of the asset given on operating lease as at March 31, 2006 and accordingly, disclosuresrequired by AS 19 is not provided.
f) The Group entered into a composite IT outsourcing agreement, whereby the vendor supplied fixed assets and IT relatedservices to the Group. Based on the risks and rewards incident to the ownership, the fixed assets received are accountedfor as a finance lease transaction. Accordingly, the asset and liability are recorded at the fair value of the leased assets atthe inception. These assets are depreciated over their useful lives as in the case of the Group’s own assets.
Since the entire amount payable to the vendor towards the supply of fixed assets during the year is accrued, there are nominimum lease payments outstanding as at the year-end in relation to these assets and accordingly, other disclosures asper AS 19 are not applicable.
25. Break-up of net deferred tax asset/(liability) into major components of the respective balances is as follows:
(Rs. ’000)
March 31, 2006 March 31, 2005
Deferred Tax Assets/(Liabilities) arising from:
(i) Provision for doubtful debts/advances charged in the financialstatements but allowed as deduction under the Income Tax Actin future years (to the extent considered realisible) 877,288 556,542
(ii) Unabosorbed depreciation allowance and business loss carriedforward (to the extent considered realizable, on the basis ofestimated future profitably) — 1,145,678
(iii) Depreciation claimed as deducation under the Income Tax Actbut chargable in the financial statement in future years (2,785,099) (2,544,955)
(iv) Other expenses claimed as deducation under the Income Tax Actbut chargable in the financial statements in future years (Net) (40,620) (168,284)
Net Deferred Tax Asset/(Liability) (1,948,431) (1,011,019)
The tax impact for the above purpose has been arrived at by applying atax rate of 33.66% being the prevailing tax rate forIndian Companies under the Income Tax Act, 1961.
185

26. Employee stock compensation
(i) Pursuant to the shareholders’ resolutions dated February 27, 2001 and September 25, 2001, the Group hasintroduced the “Bharti Tele-Ventures Employees’ Stock Option Plan” (hereinafter called “the Old Scheme”) underwhich the Group decided to grant, from time to time, options to the employees of the Group and its subsidiaries.The grant of options to the employees under the ESOP Scheme is on the basis of their performance and othereligibility criteria.
(ii) On August 31, 2001 and September 28, 2001, the Group issued a total of 1,440,000 equity shares at a price ofRs. 565 per equity share to the Trust. The Group issued bonus shares in the ratio of 10 equity shares for every oneequity share held as of September 30, 2001, as a result of which the total number of shares allotted to the trustincreased to 15,840,000 equity shares.
(iii) Pursuant to the shareholders’ further resolution dated September 6, 2005, the Group announced a new EmployeeStock Option Scheme (hereinafter called “the New Scheme”) under which the maximum quantum of options wasdetermined at 9,367,276 options to be granted to employees from time to time on the basis of their performanceand other eligibility criteria.
(iv) All above options are planned to be settled in equity at the time of exercise and have maximum period of 7 yearsfrom the date of respective grants. The plans existing during the year are as follows:
a) 2001 Plan under the Old Scheme
The options under this plan have an exercise price of Rs. 22.50 per share and vest on a graded basis as follows:
Vesting period from the grant date Vesting Schedule
For options with a vesting period of 36 months: On completion of 12 months 20%
On completion of 24 months 30%
On completion of 36 months 50%
For options with a vesting period of 42 months: On completion of 12 months 15%
On completion of 18 months 15%
On completion of 30 months 30%
On completion of 42 months 40%
For options with a vesting period of 48 months: On completion of 12 months 10%
On completion of 24 months 20%
On completion of 36 months 30%
On completion of 48 months 40%
b) 2004 Plan under the Old Scheme.
The options under this plan have an exercise price of Rs. 70 per share and vest on a graded basis as follows:
Vesting period from the grant date Vesting Schedule
For options with a vesting period of 48 months: On completion of 12 months 10%
On completion of 24 months 20%
On completion of 36 months 30%
On completion of 48 months 40%
186

c) Super-pot Plan under the Old Scheme
The options under this plan have an exercise price of Rs. Nil per share and vest on a graded basis as follows:
Vesting period from the grant date Vesting Schedule
For options with a vesting period of 36 months: On completion of 12 months 30%
On completion of 24 months 30%
On completion of 36 months 40%
d) 2005 Plan under the New Scheme
The options under this plan have an exercise price in the range of Rs. 221 to Rs. 366 per share and vest on a gradedbasis from the effective date of grant as follows:
Vesting period from the grant date Vesting Schedule
For options with a vesting period of 48 months: On completion of 12 months 10%
On completion of 24 months 20%
On completion of 36 months 30%
On completion of 48 months 40%
(v) The Information concerning stock options granted, exercised, forfeited and outstanding at the year-end is as follows:
As of March 31, 2006
Options Weighted Average Weighted Average(Shares in exercise price remaining contractual
thousands) (Rs.) life (years)
2001 Plan
Outstanding at beginning of year 2,321 22.50 —
Granted — — —
Exercised 2,024 22.50 —
Cancelled or expired 27 22.50 —
Outstanding at the year end 270 22.50 2.94Excercisable at end of year 270 22.50 —
2004 Plan
Outstanding at beginning of year 2,134 70.00 —
Granted — — —
Exercised 203 70.00 —
Cancelled or expired 271 — —
Outstanding at the year end 1,660 70.00 4.83
Excercisable at end of year 266 70.00 —
Super-pot Plan
Outstanding at beginning of year — — —
Granted 71 — —
Exercised 14 — —
Cancelled or expired 5 — —
Outstanding at the year end 52 — 5.25Excersible at end of year 6 — —
Weighted average fair value of 71 139.40 —options granted during the year
187

As of March 31, 2006
Options Weighted Average Weighted Average
(Shares in exercise price remaining contractual
thousands) (Rs.) life (years)
2005 Plan
Outstanding at beginning of year — —
Granted 2,589 238.03
Exercised — —
Cancelled or expired — —
Outstanding at the year end 2,589 238.03 6.46
Excersible at end of year
Weighted average fair value of 2,589 191.86 —
options granted during the year
(vi) The fair value of the options granted during the year under the Super-pot Plan and the New Scheme is estimated on
the date of grant using the Black-Scholes model with the following assumptions:
Super-pot Scheme Scheme 2005
Risk Free Interest Rates 4.59% p.a. to 5.30% p.a. 6.65% p.a. to 7.33 p.a.
Expected Life 12 to 36 months 48 to 66 months
Expected Volatility 55.15% 44.48% to 45.87%
Expected Dividend 0.00% 0.00%
Expected volatility is determined by taking into account the closing prices of stock listed on Bombay Stock Exchange
from February 18, 2002 i.e. the date of the Initial Public Offer (IPO).
(vii) The balance of deferred stock compensation as on March 31, 2006 is Rs. 388,148 thousand (March 31, 2005
Rs. 13,370 thousand) and total employee compensation cost recognised for the year then ended is Rs. 127,067
thousand (March 31, 2005 Rs. 47,128 thousand).
27. (i) The Central Government’s approval is pending against the application made by erstwhile BML in respect of
remuneration of Rs. 1,943 thousand [Rs. 1,274 thousand for the five month period ended August 31, 2000 and
Rs. 669 thousand for the year ended March 31, 2000 respectively](March 31, 2003 Rs. 1,943 thousand) payable to
the former Whole-Time Director which exceeds the limits prescribed by Schedule XIII of the Companies Act, 1956.
(ii) The Central Government’s approval is pending against the application made by erstwhile BCL in respect of excess
remuneration paid to Whole Time Directors of Rs. 4,063 thousand (March 31, 2005 Rs.4,063 thousand).
(iii) The cumulative amount of excess remuneration paid to the Whole Time Director (‘BAL’) pending approval of Central
Government is Rs. 565 thousand (March 31, 2005 Rs. 565 thousand) and is refundable by the Director.
(iv) The cumulative amount of excess remuneration paid to Managing Director and Whole Time Directors (erstwhile
‘BIL’) pertaining to earlier years, pending approval of the Central Government is Rs. 3,114 thousand (March 31, 2005
Rs. 3,114 thousand) and is refundable by Directors.
188

28. Earnings per Share
As at As atMarch 31, 2006 March 31, 2005
Basic and Diluted Earnings per Share :
Nominal value of equity shares (Rs.) 10/- 10/-
Profit attributable to equity shareholders (Rs. ’000) (A) 20,279,486 12,115,741
Weighted average number of equity shares outstanding
during the year (B) 1,881,838,518 1,856,088,892
Basic earnings per Share (Rs.) (A / B) 10.776 6.528
Dilutive effect on profit (Rs. ’000) (C )* 4,080 75,652
Profit attributable to equity shareholders for computing
Diluted EPS (Rs’000) (D)=(A+C) 20,283,566 12,191,393
Dilutive effect on weighted average number of equity shares
outstanding during the year (E)* 15,822,704 37,018,694
Weighted Average number of Equity shares and Equity Equivalent
shares for computing Diluted EPS (F)=(B+E) 1,897,661,222 1,893,107,586
Diluted earnings per share (Rs.) (D/F) 10.689 6.440
Diluted effect on weighted average number of equity shares and profit attributable is on account of Foreign Currency
Convertible Bonds and Optionally Convertible Redeemable Debentures. Refer notes 12 and 14 above.
29. As at the year end, the accumulated losses exceed the paid up share capital of Bharti Comtel Limited. However, in view
of the support from the holding Company, the accounts are prepared on a going concern basis.
30. Previous year figures have been regrouped / reclassified, wherever necessary, to conform to current year’s classification.
189

Sta
tem
ent
pu
rsu
an
t to
ex
empti
on r
ecei
ved
un
der
Sec
tion
212 (
8)
of t
he
Com
pan
ies
Act
, 1956
rela
tin
g to
su
bsid
iary
com
pan
ies
for
the
yea
r en
ded
Marc
h 3
1,
2006
Sr.
Nam
e o
f th
e Su
bsi
dia
ryR
epo
rtin
gC
apit
alRe
serv
esTo
tal
Tota
lIn
vest
men
tsTu
rno
ver
Pro
fit
Pro
visi
on
Pro
fit
Pro
po
sed
Co
un
try
No
.C
om
pan
yC
urr
ency
Ass
ets
Lia
bili
ties
Oth
er t
han
Bef
ore
f
or
Aft
erD
ivid
end
Inve
stm
ent
Taxa
tio
n T
axat
ion
Taxa
tio
nin
Su
bsi
dia
ry
1.Bh
arti
Hex
acom
Lim
ited
INR
1,79
2,00
01,
302,
900
6,93
8,22
13,
843,
321
—3,
923,
107
1,00
9,58
318
0,56
382
9,02
0—
Indi
a
2.Bh
arti
Aqu
anet
Lim
ited
INR
25,0
0021
2,04
624
8,61
811
,572
43,4
7247
,844
11,1
2093
11,0
27—
Indi
a
3.Sa
tcom
Bro
adba
nd E
quip
men
t Lim
ited
INR
248,
592
(19,
796)
318,
614
89,8
18—
94,3
022,
358
(1,9
62)
4,32
0—
Indi
a
4.Bh
arti
Com
tel L
imite
dIN
R1,
000
(103
,755
)58
2,75
168
5,50
5—
566,
555
(72,
688)
7,36
0(8
0,04
8)—
Indi
a
5.Bh
arti
Broa
dban
d Li
mite
dIN
R29
2,00
0(1
94,1
33)
717,
209
619,
342
280,
877
254,
539
(41,
863)
(4,3
58)
(37,
505)
—In
dia
No
te:
As
requ
ired
und
er p
ara
iii o
f th
e A
ppro
val
lett
er d
ated
Apr
il 26
, 20
06,
issu
ed b
y th
e M
inis
try
of C
ompa
ny A
ffai
rs,
Indi
an r
upee
eq
uiva
lent
s of
the
fig
ures
giv
en i
nfo
reig
n cu
rren
cies
in
the
acco
unts
of
the
subs
idia
ries
com
pani
es,
have
bee
n gi
ven
base
d on
the
exc
hang
e ra
tes
as o
n 31
.03.
2006
.
190