ANNUAL FINANCIAL REPORT - · PDF fileThe Alaska, Virgin America merger promises more inflight...
86
i Comprehensive ANNUAL FINANCIAL REPORT GALLATIN AIRPORT AUTHORITY Belgrade, Montana
Transcript of ANNUAL FINANCIAL REPORT - · PDF fileThe Alaska, Virgin America merger promises more inflight...

i
Comprehensive ANNUAL FINANCIAL REPORT
GALLATIN AIRPORT AUTHORITY Belgrade, Montana

ii
Bozeman Yellowstone International Airport (BZN) connects Bozeman, Southwest Montana and Yellowstone National Park with the rest of the world.
BZN is owned and operated by the Gallatin Airport Authority.

i
Comprehensive Annual Financial Report Fiscal Year Ended June 30, 2017
Gallatin Airport Authority
Belgrade, MT
Prepared by: Gallatin Airport Authority
Finance and Administration

Table of Contents
‐ 4 ‐
Page
INTRODUCTORY SECTION
Letter of transmittal ...................................................................................................................................................... 8
Board of commissioners and senior staff ................................................................................................................... 19
Organizational chart ................................................................................................................................................... 20
Certificate of Achievement ......................................................................................................................................... 21
FINANCIAL SECTION
Independent auditor's report ..................................................................................................................................... 24
Management’s discussion and analysis ...................................................................................................................... 27
Basic financial statements:
Statement of net position ........................................................................................................................................... 36
Statement of revenues, expenses, and changes in net position ................................................................................ 37
Statement of cash flows ............................................................................................................................................. 38
Notes to the financial statements ............................................................................................................................... 39
Required supplementary information – pension schedules:
Schedule of proportionate share of the net pension liability ..................................................................................... 57
Schedule of contributions ........................................................................................................................................... 57
Notes to the required supplementary information .................................................................................................... 58
STATISTICAL SECTION
Statistical section introduction ................................................................................................................................... 62
Net position and changes in net positon .................................................................................................................... 63
Changes in cash and cash equivalents ........................................................................................................................ 64
Operating revenues, airline cost per enplanement, and airline rates ........................................................................ 65
Debt service, coverages, and ratios ............................................................................................................................ 66
Aircraft operations and total passengers .................................................................................................................... 67
Enplanements and load factor by air carrier .............................................................................................................. 68
Budgeted employees by department ......................................................................................................................... 69
Insurance coverage ..................................................................................................................................................... 70
Airport information ..................................................................................................................................................... 71
Demographic and economic statistics ........................................................................................................................ 72
Principal employers in region ..................................................................................................................................... 73

Table of Contents
‐ 5 ‐
Page
COMPLIANCE SECTION
Independent auditor’s report on internal control over financial reporting and on
compliance and other matters based on an audit of financial statements performed
in accordance with Government Auditing Standards ................................................................................................ 76
Independent auditor’s report on compliance for each major program and on
internal control over compliance required by the Uniform Guidance ....................................................................... 78
Schedule of expenditures of federal awards ............................................................................................................. 80 Schedule of findings and questioned costs ................................................................................................................ 81 Independent auditor's report on compliance with requirements that could have a
direct and material effect on the passenger facility charge program and on internal
control over compliance applicable to the passenger facility charge program .......................................................... 82
Schedule of passenger facility charge collections, interest and disbursements ........................................................ 84

ii
iii
INTRODUCTORY SECTION ‐ Letter of transmittal
‐ Board of commissioners and senior staff
‐ Organizational chart
‐ Certificate of achievement
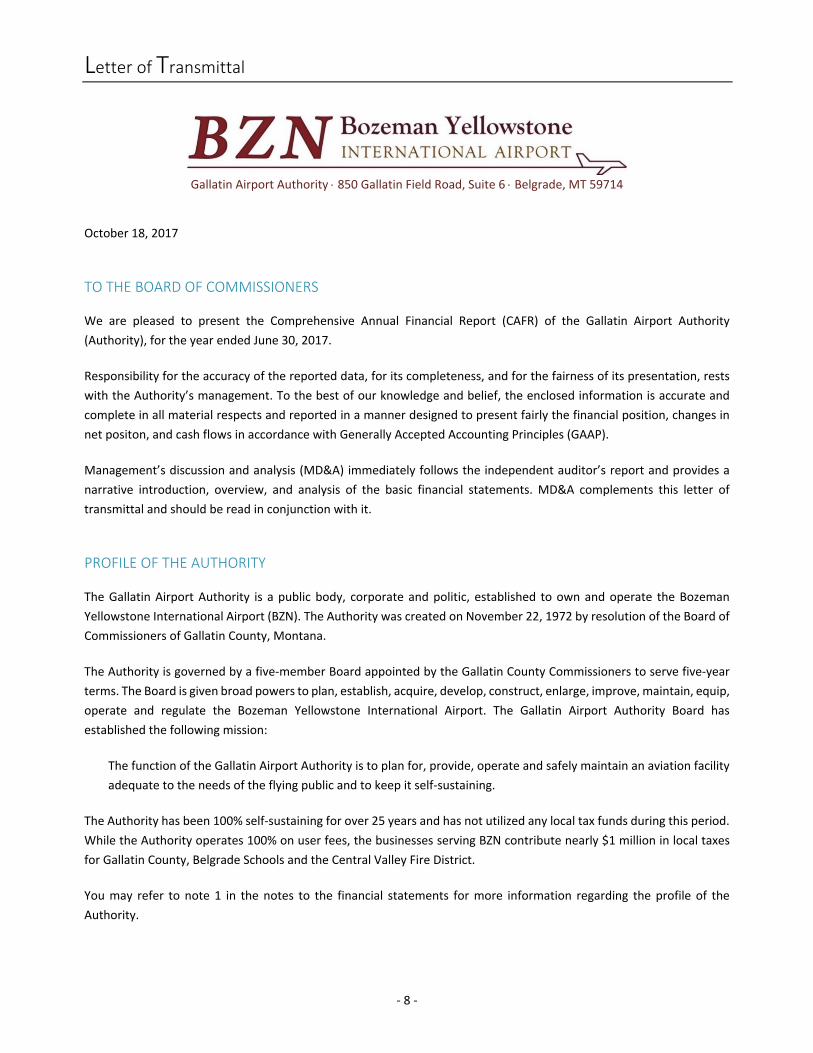
Letter of Transmittal
‐ 8 ‐
Gallatin Airport Authority 850 Gallatin Field Road, Suite 6 Belgrade, MT 59714
October 18, 2017
TO THE BOARD OF COMMISSIONERS We are pleased to present the Comprehensive Annual Financial Report (CAFR) of the Gallatin Airport Authority
(Authority), for the year ended June 30, 2017.
Responsibility for the accuracy of the reported data, for its completeness, and for the fairness of its presentation, rests
with the Authority’s management. To the best of our knowledge and belief, the enclosed information is accurate and
complete in all material respects and reported in a manner designed to present fairly the financial position, changes in
net positon, and cash flows in accordance with Generally Accepted Accounting Principles (GAAP).
Management’s discussion and analysis (MD&A) immediately follows the independent auditor’s report and provides a
narrative introduction, overview, and analysis of the basic financial statements. MD&A complements this letter of
transmittal and should be read in conjunction with it.
PROFILE OF THE AUTHORITY The Gallatin Airport Authority is a public body, corporate and politic, established to own and operate the Bozeman
Yellowstone International Airport (BZN). The Authority was created on November 22, 1972 by resolution of the Board of
Commissioners of Gallatin County, Montana.
The Authority is governed by a five‐member Board appointed by the Gallatin County Commissioners to serve five‐year
terms. The Board is given broad powers to plan, establish, acquire, develop, construct, enlarge, improve, maintain, equip,
operate and regulate the Bozeman Yellowstone International Airport. The Gallatin Airport Authority Board has
established the following mission:
The function of the Gallatin Airport Authority is to plan for, provide, operate and safely maintain an aviation facility
adequate to the needs of the flying public and to keep it self‐sustaining.
The Authority has been 100% self‐sustaining for over 25 years and has not utilized any local tax funds during this period.
While the Authority operates 100% on user fees, the businesses serving BZN contribute nearly $1 million in local taxes
for Gallatin County, Belgrade Schools and the Central Valley Fire District.
You may refer to note 1 in the notes to the financial statements for more information regarding the profile of the
Authority.
‐ 9 ‐
ECONOMIC CONDITIONS AND OUTLOOK State of the Industry Despite record operating profits over the past 24 months, domestic airline yields fell 1.2¢ this past year as the industry
increased seat capacity 3.4% while enplanements increased just 2.4% over the same timeframe. After airline
consolidation this past decade, legacy airlines finally were able to enforce capacity and fare disciple. Low Cost Carriers
(LCC) are now aggressively adding capacity and moderating fares with Allegiant Air adding 19.2% more seats, Frontier
Airlines 15.9%, Spirit Airlines 15.8%, JetBlue 7.2%, and Alaska Airlines 5.1%. With the additional capacity, industry load
factors fell 0.7% from 82.6% in 2016 to 81.9% in 2017. Overcapacity is generally detrimental to profitability as airlines
tend to reduce fares so that they can fill up extra seats, thus reducing yields.
While LCCs are gaining market share, the differences between product offerings is blurring. JetBlue, one of the original
LCCs, now offers a business class premium experience with their “Mint” product including fully reclining seats and
premium food on long‐haul flights. The Alaska, Virgin America merger promises more inflight entertainment, Wi‐Fi and
the ability to order food and beverage from the seat‐back over the combined network. Likewise, legacy carriers including
United and Delta are tweaking fares to include a nonrefundable, bare‐bones fare with none of the extras you have come
to expect. American Airlines has doubled down on its policy of matching LCC discount fares on competing routes in their
hubs aimed at value‐based customers.
The pilot shortage that has affected small carriers and communities over the past few years is growing; Horizon Air,
regional airline for Alaska Air Group, cut its flight schedule this past summer because of a shortage of pilots for its
turboprop planes. The shortage became a crisis in June when Horizon was forced to cancel more than 318 flights. The
airline pre‐emptively pared their schedule for the remainder of 2017. The growing shortage should become more
pronounced with some 18,000 pilots expected to retire at U.S. mainline carriers over the next three years. The pilot
pipeline continues to struggle to produce qualified candidates because of the growing cost of becoming an airline pilot
coupled with the 2013 FAA rule requiring 1,500 hours of flight time before becoming a first officer with a U.S. commercial
airline.
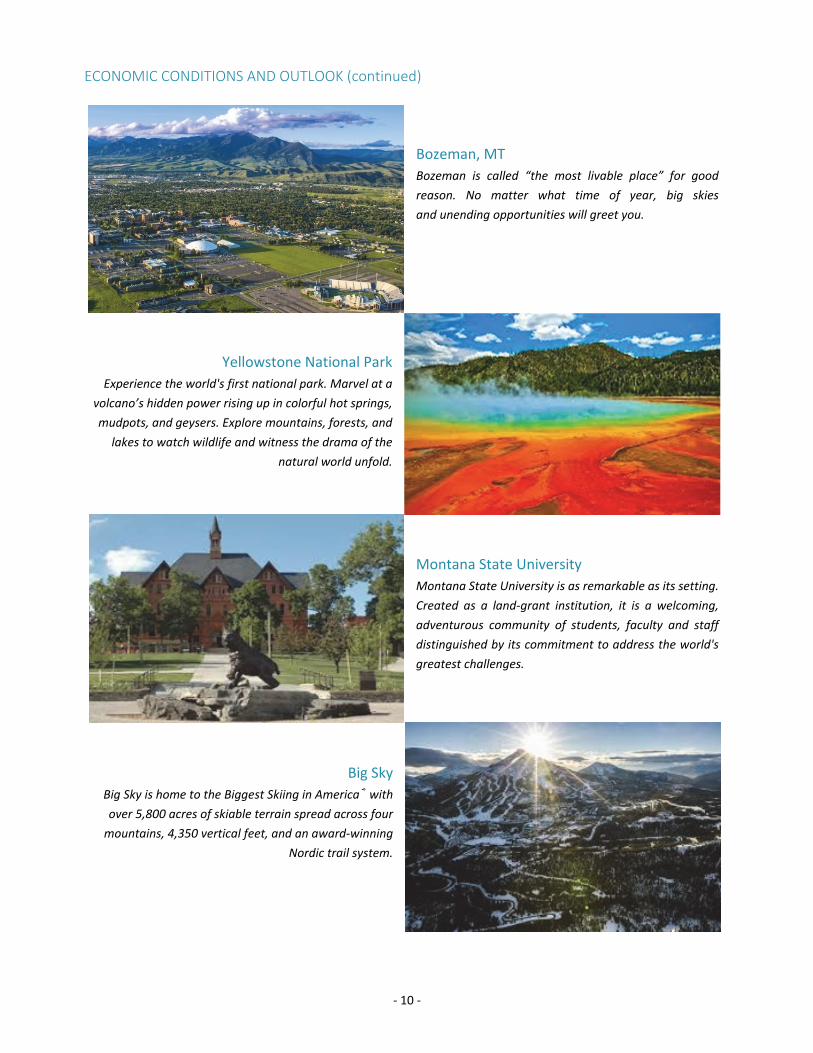
State of the Region Southwest Montana continues to see strong economic growth. Bozeman and Gallatin County remain the fastest growing
city and county in the state (populations over 10,000), while unemployment has remained low at 2.4% in July 2017.
Montana State University has seen significant enrollment growth with 3,939 more students in 2017 compared to 2010.
In addition, both summer and winter tourism have seen strong growth with Big Sky skier visits growing 59% over the
past 7 years, and Yellowstone National Park Fiscal Year visitation surpassing all previous Fiscal Year visitation.
Change Change
2017 2016 2010 '16 to '17 '10 to '17
BZN total passengers 1,148,347 1,060,732 728,048 8.3% 57.7%
Big Sky skier visits 478,000 477,000 300,000 0.2% 59.3%
Yellowstone National Park visits 4,290,689 4,230,927 3,348,087 1.4% 28.2%
Montana State University enrollment 16,703 15,688 12,764 6.5% 30.9%
Bozeman population 45,250 43,405 37,284 4.3% 21.4%
Bozeman unemployment rate 2.4% 2.3% 5.4% 4.3% ‐55.6%
Gallatin County population 104,502 100,739 89,599 3.7% 16.6%
‐ 10 ‐
ECONOMIC CONDITIONS AND OUTLOOK (continued)
Bozeman, MT
Bozeman is called “the most livable place” for good
reason. No matter what time of year, big skies
and unending opportunities will greet you.
Yellowstone National Park
Experience the world's first national park. Marvel at a
volcano’s hidden power rising up in colorful hot springs,
mudpots, and geysers. Explore mountains, forests, and
lakes to watch wildlife and witness the drama of the
natural world unfold.
Montana State University
Montana State University is as remarkable as its setting.
Created as a land‐grant institution, it is a welcoming,
adventurous community of students, faculty and staff
distinguished by its commitment to address the world's
greatest challenges.
Big Sky
Big Sky is home to the Biggest Skiing in America® with
over 5,800 acres of skiable terrain spread across four
mountains, 4,350 vertical feet, and an award‐winning
Nordic trail system.

‐ 11 ‐
AIRPORT HIGHLIGHTS – FISCAL YEAR 2017 For the year, BZN handled 1,148,347 total passengers maintaining its status as Montana’s busiest airport for the fourth
consecutive year. For comparison, Billings is the second busiest airport in Montana at 838,053 passengers for FY 2017.
BZN ended FY 2017 as the 112th busiest airport in the nation, and 8th busiest in the Northwest Region which includes
Colorado, Utah, Wyoming, Montana, Idaho, Oregon and Washington. This compares to 114th busiest in the nation and
8th busiest in the Northwest Region at the end of FY 2016.
Tourism and locally generated traffic continue to contribute nearly equally to the overall increase in passengers.
Significant factors impacting passenger traffic during FY 2017 include the start of year‐round daily service to two
destinations, Chicago (United) and Dallas/Ft. Worth (American). In addition, several other markets saw significant
increases in including Portland (Alaska), San Francisco (United), Salt Lake City (Delta), New York/Newark (United) and
New York/LaGuardia (Delta). Finally, American added summer seasonal Chicago service in June 2017. Continuing into FY
2018, American is expanding service to Dallas/Ft. Worth and adding summer Saturday only service to Los Angeles
summer 2018. In addition, United announced expanded winter ‘17/’18 service from all six hubs served from BZN. On the
flip side, Frontier continues to modify their business model and has paired seasonal Denver service from May‐January to
May‐October. We expect to see about a five to ten percent reduction in passengers in May 2018 while the main runway
is rehabilitated. Daily air service will be maintained throughout the month but construction will limit airline flight
operations between 11:00 p.m. and 12:30 p.m. from April 30 – May 18. Overall, however, the strong local economy and
continued tourism demand are expected to continue the growth trend through the next year.
Air Service BZN currently has year round non‐stop service to eight destinations including Seattle‐Tacoma (Delta/Alaska), Las Vegas
(Allegiant), Phoenix‐Mesa (Allegiant), Salt Lake City (Delta), Denver (United – year round, Frontier – seasonal),
Minneapolis‐St Paul (Delta), Dallas‐Fort Worth (American) and Chicago (United). BZN also has seasonal non‐stop service
to seven additional destinations including Portland (Alaska), San Francisco (United), Los Angeles (Delta/United/American
beginning summer 2018), Houston (United), New York‐LaGuardia (Delta), New York‐Newark (United) and Atlanta (Delta).
Non‐Stop Destinations
‐ 12 ‐
AIRPORT HIGHLIGHTS – FISCAL YEAR 2017 (continued) The following table shows major air traffic activities during the fiscal years ended June 30, 2017 and 2016.
2017 2016 Change
Total enplaned and deplaned passengers 1,148,347 1,060,732 8.3%
Enplaned passengers 573,767 530,903 8.1%
Deplaned passengers 574,580 529,829 8.4%
Aircraft operations 76,943 80,629 ‐4.6%
Available departing seats 675,270 625,036 8.0%
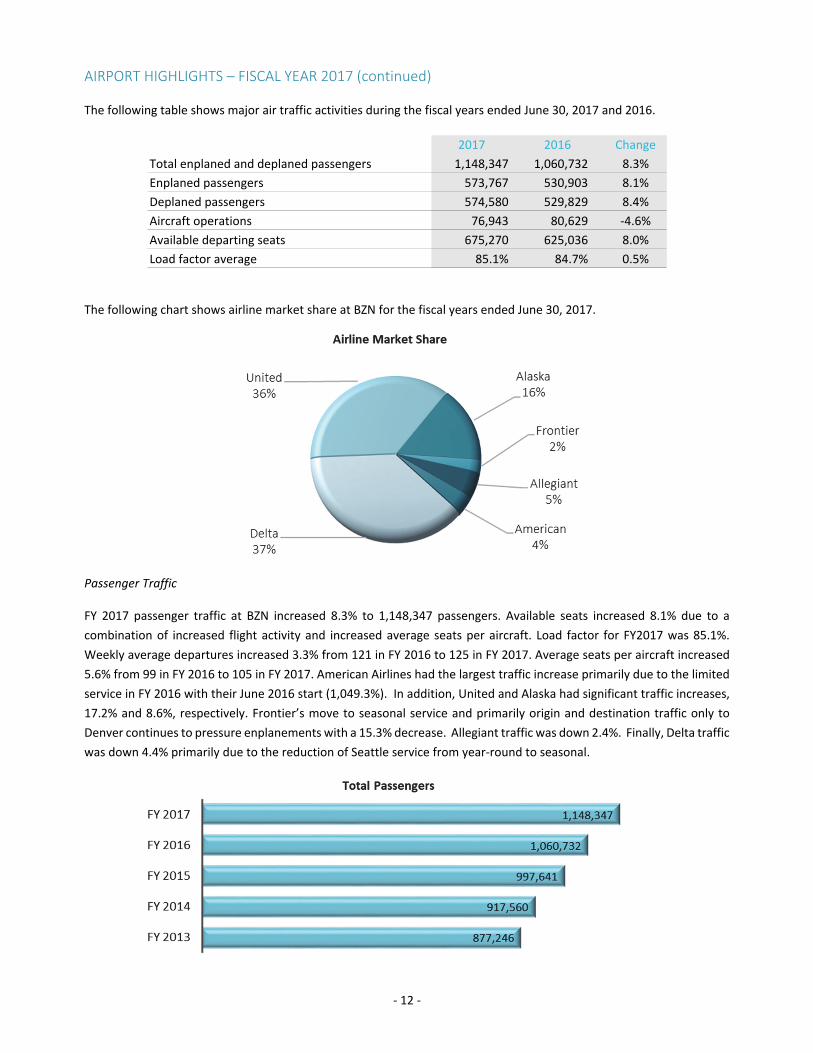
Load factor average 85.1% 84.7% 0.5% The following chart shows airline market share at BZN for the fiscal years ended June 30, 2017.
Passenger Traffic FY 2017 passenger traffic at BZN increased 8.3% to 1,148,347 passengers. Available seats increased 8.1% due to a
combination of increased flight activity and increased average seats per aircraft. Load factor for FY2017 was 85.1%.
Weekly average departures increased 3.3% from 121 in FY 2016 to 125 in FY 2017. Average seats per aircraft increased
5.6% from 99 in FY 2016 to 105 in FY 2017. American Airlines had the largest traffic increase primarily due to the limited
service in FY 2016 with their June 2016 start (1,049.3%). In addition, United and Alaska had significant traffic increases,
17.2% and 8.6%, respectively. Frontier’s move to seasonal service and primarily origin and destination traffic only to
Denver continues to pressure enplanements with a 15.3% decrease. Allegiant traffic was down 2.4%. Finally, Delta traffic
was down 4.4% primarily due to the reduction of Seattle service from year‐round to seasonal.

‐ 13 ‐
AIRPORT HIGHLIGHTS – FISCAL YEAR 2017 (continued) Tower Operations Tower operations (landing or takeoff) decreased 4.6% during FY 2017 primarily due to taxiway construction that
impacted flight school operations. Air Carrier operations increased 7.5% and Air Taxi operations increased 1.0%. General
Aviation Itinerant operations were up 2.1%. Military operations decreased 12.6% but only 43 total operations due to the
minimal military use of BZN. Overall Itinerant operations (Air Carrier, Air Taxi, General Aviation Itinerant and Military)
were up 2.9%. BZN further clarifies Itinerant activity to Airline, Cargo, Corporate and General Aviation Itinerant. Local
general aviation operations were down 16.6%, again attributed to taxiway construction impacting flight school activity.
While the overall decrease was only 4.6%, BZN continued to see peak day operations of over 400 and peak hour
operations that exceeded 60. These peak periods in addition to the mix of aircraft and varying approach speeds results
in many periods where BZN is operating at capacity. This will be rectified in October 2017 when our new parallel paved
runway opens to separate slower piston powered aircraft from the faster jet aircraft.
Cargo Cargo revenues consists of landing fees from FedEx, UPS and the airlines, and ground rent paid by cargo operators for
their facilities. As shown below, total cargo, express and air mail increased 1.8% to 5,402,565 lbs. FedEx moved 2,216,592
lbs. of cargo by air and transferred 1,593,000 lbs. by truck at its airport facility.
2017 2016 Change
FedEx 3,809,592 3,698,000 3.0%
UPS 1,172,146 1,194,412 ‐1.9%
Airlines 420,827 415,195 1.4%
Total 5,402,565 5,307,607 1.8%
Pounds Moved
Customs and Border Protection The United States Customs and Border Protection facility in BZN handled 134 international arrivals during FY 2017,
compared to 119 in FY 2016. Unlike locations at Helena, Great Falls and Kalispell, this location is operated as a user fee
facility with approximately 82% of the operating cost paid for by the international arriving aircraft and the remaining
18% split three ways between the Gallatin Airport Authority, the Yellowstone Club and Signature Flight Support.
‐ 14 ‐
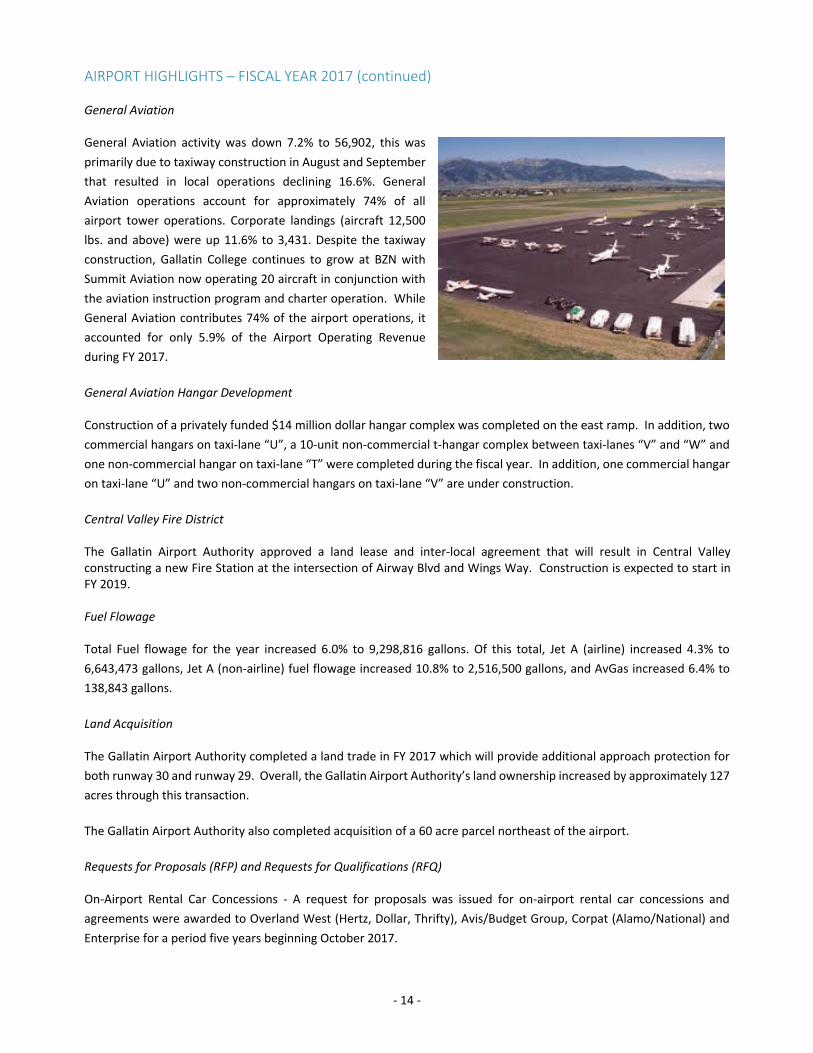
AIRPORT HIGHLIGHTS – FISCAL YEAR 2017 (continued) General Aviation General Aviation activity was down 7.2% to 56,902, this was
primarily due to taxiway construction in August and September
that resulted in local operations declining 16.6%. General
Aviation operations account for approximately 74% of all
airport tower operations. Corporate landings (aircraft 12,500
lbs. and above) were up 11.6% to 3,431. Despite the taxiway
construction, Gallatin College continues to grow at BZN with
Summit Aviation now operating 20 aircraft in conjunction with
the aviation instruction program and charter operation. While
General Aviation contributes 74% of the airport operations, it
accounted for only 5.9% of the Airport Operating Revenue
during FY 2017.
General Aviation Hangar Development Construction of a privately funded $14 million dollar hangar complex was completed on the east ramp. In addition, two
commercial hangars on taxi‐lane “U”, a 10‐unit non‐commercial t‐hangar complex between taxi‐lanes “V” and “W” and
one non‐commercial hangar on taxi‐lane “T” were completed during the fiscal year. In addition, one commercial hangar
on taxi‐lane “U” and two non‐commercial hangars on taxi‐lane “V” are under construction.
Central Valley Fire District The Gallatin Airport Authority approved a land lease and inter‐local agreement that will result in Central Valley constructing a new Fire Station at the intersection of Airway Blvd and Wings Way. Construction is expected to start in FY 2019. Fuel Flowage Total Fuel flowage for the year increased 6.0% to 9,298,816 gallons. Of this total, Jet A (airline) increased 4.3% to
6,643,473 gallons, Jet A (non‐airline) fuel flowage increased 10.8% to 2,516,500 gallons, and AvGas increased 6.4% to
138,843 gallons.
Land Acquisition The Gallatin Airport Authority completed a land trade in FY 2017 which will provide additional approach protection for
both runway 30 and runway 29. Overall, the Gallatin Airport Authority’s land ownership increased by approximately 127
acres through this transaction.
The Gallatin Airport Authority also completed acquisition of a 60 acre parcel northeast of the airport.
Requests for Proposals (RFP) and Requests for Qualifications (RFQ) On‐Airport Rental Car Concessions ‐ A request for proposals was issued for on‐airport rental car concessions and
agreements were awarded to Overland West (Hertz, Dollar, Thrifty), Avis/Budget Group, Corpat (Alamo/National) and
Enterprise for a period five years beginning October 2017.

‐ 15 ‐
AIRPORT HIGHLIGHTS – FISCAL YEAR 2017 (continued) Financial Financially, the Authority depends on our passengers with over 90% of the Authority’s operating revenues generated
from the businesses that utilize the airline terminal building through rents and concession fees. However, we are
dependent upon the airlines providing seats into our market and we compete with every airport in the country for those
seats. While the market is the primary driver of airline decisions, there is one factor that we control, the airline cost of
using our airport. Consequently, it is our philosophy that by maintaining one of the lowest airline costs per passenger in
the industry we help make our market more profitable, which in turn makes us more likely to attract additional airline
seats.
The Authority has diligently controlled the costs passed on to the airlines through strict cost controls, a highly
professional and cross utilized staff, and a fiscally conservative capital improvement program. As a result, airline cost per
enplanement to operate at BZN in FY 2017 declined 4.3% to $2.65.
2017 2016
Airline cost 1,518,773$ 1,467,582$
Enplanements scheduled 571,531 529,481
Cost per enplaned passenger 2.66$ 2.77$ Airline and Concession revenues are variable dependent upon passenger enplanements. These revenues increased from
$14.29 per enplanement in FY 2016 to $14.72 per enplanement in FY 2017. Airline revenues account for $2.65 per
enplanement or 18.0%; rental car and parking concessions account for $10.16 per enplanement or 69.0%; food, beverage
and gift concessions account for $1.78 per enplanement or 12.1%; and ground transportation accounts for $.13 per
enplanement or .9%. In FY 2017, total enplanements of 573,767 generated airline and concession revenues of
$8,444,360; this compares to FY 2016 with 530,903 total enplanements generating $7,688,083.

‐ 16 ‐
CAPITAL AND LONG‐TERM PLANNING The Gallatin Airport Authority has a comprehensive 11‐year Capital Improvement Plan. This plan is designed to
accommodate the future capital needs of BZN within the financial capability of the Authority. Projects in the first five
years of the plan are more defined with the projects in the later six years more fluid due to future unknowns. The Gallatin
Airport Authority invested $11.8 million in Capital Improvements during FY 2017 and over the next five years, the Gallatin
Airport Authority expects to invest over $75 million in capital improvements. A description of FY 2017 projects and the
major projects planned for FY 2018 through FY 2022 follows.
Projects completed during FY 2017
• Main taxiway rehabilitation (Phase I)
• Pay parking lot Southeast expansion
• Taxiway “U” and “V” extensions
Below is a summary of estimated cost and funding for major projects planned for FY 2018 – 2022 followed by a
description of each project.
AIP AIP PFC's and
Project Est. Cost Authority Entitlements Discretionary CFC TSA Grant
Runway 11/29
(paved) construction 6,912,391 691,239 6,221,152 ‐ ‐ ‐
Main taxiway & runway
3/21 pavement rehab 7,528,133 752,814 2,010,257 4,765,062 ‐ ‐
Multi‐use parking
garage 33,070,179 4,960,527 ‐ ‐ 28,109,652 ‐
Main runway 12/30
pavement rehab 6,128,506 612,851 2,753,959 2,761,696 ‐ ‐
Terminal concourse
expansion 22,191,377 2,219,137 7,074,641 ‐ ‐ 12,897,599
Funding
Runway 11‐29 (paved) Construction ‐ FY 2018 Construction of runway 11/29 was started in September 2016
and completed in October 2017. The runway is 5,050’ x 75’ and
constructed to B‐II small aircraft standards. It will serve the
slower, small Aircraft Approach Category A and B aircraft and
gliders with an Airplane Design Group (ADG) II category and
smaller. Small aircraft are those identified as having a
maximum certificated takeoff weight of 12,000 pounds or less.
Aircraft larger and faster aircraft than B‐II small will continue to
utilize the main runway 12/30. The new runway will increase
safety and efficiency of air traffic control at BZN through
separation of smaller and slower aircraft on runway 11/29 from
faster and larger aircraft on the main runway 12/30.

‐ 17 ‐
CAPITAL AND LONG‐TERM PLANNING (continued) Main Taxiway and Runway 3/21 Pavement Rehabilitation ‐ FY 2018 The main taxiway system and crosswind runway 3/21 rehabilitation was completed in September 2017. The estimated
cost of this project is $7,528,133.
Multi‐use Parking Garage ‐ FY 2018 & 2019 The Authority is in the final stages of design for a multi‐use parking garage for rental cars and pay parking. Construction
is anticipated to begin late fall 2017. It is anticipated that approximately 80‐90% of the 1,100 stall four level fully covered
parking garage will be for rental cars and the remaining 10‐20% for pay parking. The rental car portion will be reimbursed
through Customer Facility Charges (CFC) at $3.00 per rental car day on rental car contracts. The pay parking portion will
be funded by the Authority.
Main Runway 12/30 Pavement Rehabilitation ‐ FY 2018 Runway 12/30 was last rehabilitated in 2003. In order to maintain pavement condition, we plan to rehabilitate the main
runway beginning April 30, 2018 with substantial completion by May 18, 2018. The estimated cost of this project is
$6,128,506. Funding for this project will include $2.7 million in FAA Discretionary Funding for this is a high priority project.
Terminal Concourse Expansion ‐ FY 20202022 Continued growth in passenger enplanements, peak hour gate use, and peak hour baggage handling capacity, indicate
there may be a need for a terminal concourse expansion and baggage system improvements within the next four years.
We are in the initial phase of planning and expect to begin design in early 2018. If trends continue, we expect
construction on this project could begin as early as summer 2019 with a completion date by summer 2021. In order to
financially plan for this, we have included an initial budgetary amount of $22,191,377 in our capital budget. This amount
will be refined as we determine the actual need. We anticipate funding for this project will be through internally
generated funds with reimbursement through AIP Entitlements, Passenger Facility Charge (PFC) collection and possibly
a TSA baggage system grant if eligible.
OTHER INFORMATION Independent Audit For the fiscal year ended June 30, 2017, the annual financial statements of the Authority have been audited by Holmes
& Turner, PC, a firm of independent Certified Public Accountants. As part of the annual audit, the auditors perform
procedures in accordance with the Uniform Guidance and the provisions of grant agreements. The auditors also perform
procedures to help ensure the Authority’s compliance with FAA regulations related to the Passenger Facility Charge
program.
The independent auditor’s report on the financial statements is included in the financial section of this report, and the
reports relating to the single audit and the passenger facility charge program are located in the compliance section.
‐ 18 ‐
OTHER INFORMATION (continued)
Internal Controls
The Authority is responsible for establishing and maintaining internal accounting controls designed to ensure that its
assets are protected from loss, theft or misuse, and to ensure that adequate accounting data is compiled to allow for
preparations of financial statements in conformity with GAAP. Internal controls are designed to provide reasonable,
rather than absolute, assurance that these objectives are met. The concept of reasonable assurance recognizes that the
cost of a control should not exceed the benefits likely to be derived from the control and that the control, and the
evaluation of costs and benefits require estimates and judgements by management.
As a recipient of federal and state financial assistance, the Authority is also responsible for ensuring that adequate
internal controls are in place for documenting compliance with applicable laws and regulations related to these
programs. The internal controls are subject to periodic evaluation by management and external independent auditors.
AWARDS
The Government Finance Officers Association of the United States and Canada (GFOA) awarded a Certificate of
Achievement for Excellence in Financial Reporting to the Authority for its comprehensive annual financial report for the
fiscal year ended June 30, 2016.
In order to be awarded a Certificate of Achievement, a government must publish an easily readable and efficiently
organized comprehensive annual financial report. This report must satisfy both generally accepted accounting principles
and applicable legal requirements.
A Certificate of Achievement is valid for a period of one year only. We believe that our current comprehensive annual
financial report continues to meet the Certificate of Achievement Program’s requirements and we are submitting it to
the GFOA to determine its eligibility for another certificate.
ACKNOWLEDGEMENTS
Success in any organization is dependent upon people. We are fortunate to have a dedicated and knowledgeable
Authority Board that understands the business of airports. We also have an exceptional staff of 35 experienced and
customer friendly professionals that keep the airport in top condition, financially sound and prepared for any challenge.
We are proud to serve the flying public and hope that this report will provide valuable information on the status of your
airport. We welcome and value your input on how we can better serve you at Bozeman Yellowstone International
Airport.
Respectfully submitted,
Brian Sprenger, A.A.E. Scott Humphrey, A.A.E. Troy Watling, CPA, CM Airport Director Deputy Airport Director Assistant Director, Finance
Board of Commissioners and Senior Staff
‐ 19 ‐
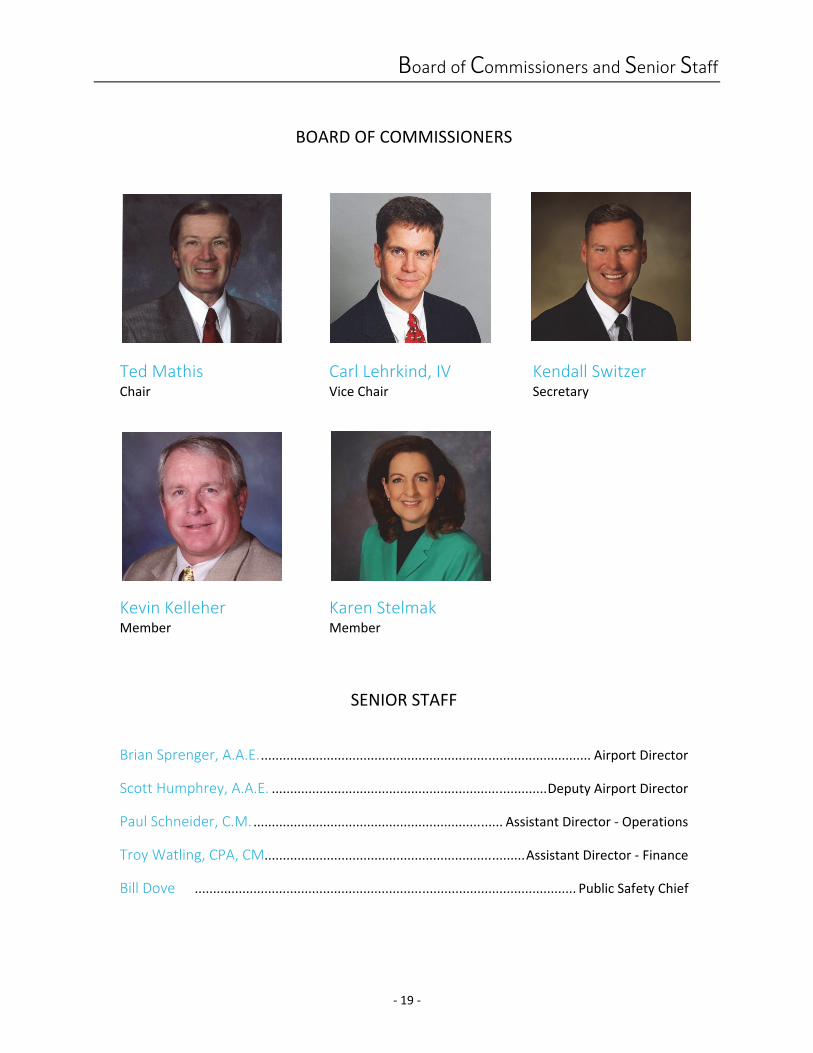
BOARD OF COMMISSIONERS
Ted Mathis Carl Lehrkind, IV Kendall Switzer Chair Vice Chair Secretary
Kevin Kelleher Karen Stelmak Member Member
SENIOR STAFF
Brian Sprenger, A.A.E. .......................................................................................... Airport Director
Scott Humphrey, A.A.E. ........................................................................... Deputy Airport Director
Paul Schneider, C.M. .................................................................... Assistant Director ‐ Operations
Troy Watling, CPA, CM ....................................................................... Assistant Director ‐ Finance
Bill Dove ........................................................................................................ Public Safety Chief

Organizational Chart
‐ 20 ‐
Airport
Operations
& Maintenance
Aircraft Rescue &
Firefighting (ARFF)
Finance &
Accounting
Administration
& Human
Resources
Public
Safety
Assistant Director ‐
Operations
Assistant Director ‐
Finance
Public Safety
Chief
Board of
Commissioners
Airport Director
Deputy Airport
Director
Airport
Development &
Engineering
Audit & Legal
Services

Certificate of Achievement
‐ 21 ‐

‐ 22 ‐
This page was intentionally left blank

‐ 23 ‐
FINANCIAL SECTION ‐ Independent auditor's report
‐ Management’s discussion and analysis
‐ Basic financial statements:
Statement of net position
Statement of revenues, expenses, and changes in net position
Statement of cash flows
Notes to the financial statements
Required supplementary information – pension schedules

‐ 24 ‐
INDEPENDENT AUDITOR'S REPORT
To the Board of Commissioners Gallatin Airport Authority Belgrade, Montana
Report on the Financial Statements We have audited the accompanying financial statements of Gallatin Airport Authority (Authority), as of and for the year ended June 30, 2017, and the related notes to the financial statements, which collectively comprise the Authority’s basic financial statements as listed in the table of contents.
Management’s Responsibility for the Financial Statements Management is responsible for the preparation and fair presentation of these financial statements in accordance with accounting principles generally accepted in the United States of America; this includes the design, implementation, and maintenance of internal control relevant to the preparation and fair presentation of financial statements that are free from material misstatement, whether due to fraud or error.
Auditor’s Responsibility Our responsibility is to express an opinion on these financial statements based on our audit. We conducted our audit in accordance with auditing standards generally accepted in the United States of America and the standards applicable to financial audits contained in Government Auditing Standards, issued by the Comptroller General of the United States. Those standards require that we plan and perform the audit to obtain reasonable assurance about whether the financial statements are free from material misstatement. An audit involves performing procedures to obtain audit evidence about the amounts and disclosures in the financial statements. The procedures selected depend on the auditor’s judgment, including the assessment of the risks of material misstatement of the financial statements, whether due to fraud or error. In making those risk assessments, the auditor considers internal control relevant to the entity’s preparation and fair presentation of the financial statements in order to design audit procedures that are appropriate in the circumstances, but not for the purpose of expressing an opinion on the effectiveness of the entity’s internal control. Accordingly, we express no such opinion. An audit also includes evaluating the appropriateness of accounting policies used and the reasonableness of significant accounting estimates made by management, as well as evaluating the overall presentation of the financial statements. We believe that the audit evidence we have obtained is sufficient and appropriate to provide a basis for our audit opinion.
Opinion In our opinion, the financial statements referred to above present fairly, in all material respects, the financial position of Gallatin Airport Authority as of June 30, 2017 and the respective changes in financial position and cash flows thereof for the year then ended in accordance with accounting principles generally accepted in the United States of America.
holmes & turner A PROFESSIONAL CORPORATION
C E R T I F I E D P U B L I C A C C O U N T A N T S M E MB E R S O F C PA A S S OC I A T E S I N T E R N A T I O N A L , I N C .
1 28 3 N O R T H 1 4 T H S T R E E T , S U I T E 2 0 1 B OZ E M A N , M ON T A N A 5 9 7 1 5 ( 40 6 ) 5 87 -4 265 F A X ( 40 6 ) 5 86 -3 11 1

‐ 25 ‐
October 18, 2017 Gallatin Airport Authority Page two
Other Matters Required Supplementary Information Accounting principles generally accepted in the United States of America require that the management’s discussion and analysis and pension schedules on pages 27-35 and 57-59, respectively, be presented to supplement the basic financial statements. Such information, although not a part of the basic financial statements, is required by the Governmental Accounting Standards Board, who considers it to be an essential part of financial reporting for placing the basic financial statements in an appropriate operational, economic, or historical context. We have applied certain limited procedures to the required supplementary information in accordance with auditing standards generally accepted in the United States of America, which consisted of inquiries of management about the methods of preparing the information and comparing the information for consistency with management’s responses to our inquiries, the basic financial statements, and other knowledge we obtained during our audit of the basic financial statements. We do not express an opinion or provide any assurance on the information because the limited procedures do not provide us with sufficient evidence to express an opinion or provide any assurance. Other information Our audit was conducted for the purpose of forming an opinion on the financial statements that collectively comprise the Gallatin Airport Authority’s basic financial statements. The introductory section and statistical section are presented for purposes of additional analysis and are not a required part of the basic financial statements. The schedule of expenditures of federal awards is presented for purposes of additional analysis as required by Title 2 U.S. Code of Federal Regulations (CFR) Part 200, Uniform Administrative Requirements, Cost Principles, and Audit Requirements for Federal Awards, and is also not a required part of the basic financial statements. The schedule of passenger facility charges collected and expended is required by the Passenger Facility Charge Audit Guide for Public Agencies issued by the Federal Aviation Administration and is not a required part of the financial statements. The schedule of expenditures of federal awards and schedule of passenger facility charges collected and expended are the responsibility of management and were derived from and relate directly to the underlying accounting and other records used to prepare the basic financial statements. Such information has been subjected to the auditing procedures applied in the audit of the basic financial statements and certain additional procedures, including comparing and reconciling such information directly to the underlying accounting and other records used to prepare the basic financial statements or to the basic financial statements themselves, and other additional procedures in accordance with auditing standards generally accepted in the United States of America. In our opinion, schedule of expenditures of federal awards and schedule of passenger facility charges collected and expended are fairly stated in all material respects in relation to the basic financial statements as a whole. The introductory section and statistical section have not been subjected to the auditing procedures applied in the audit of the basic financial statements and, accordingly, we do not express an opinion or provide any assurance on them.
C E R T I F I E D P U B L I C A C C O U N T A N T S
HOLMES & TURNER

‐ 26 ‐
October 18, 2017 Gallatin Airport Authority Page three
Other Reporting Required by Government Auditing Standards In accordance with Government Auditing Standards, we have also issued our report dated October 18, 2017 on our consideration of Gallatin Airport Authority’s internal control over financial reporting and on our tests of its compliance with certain provisions of laws, regulations, contracts, and grant agreements and other matters. The purpose of that report is to describe the scope of our testing of internal control over financial reporting and compliance and the results of that testing, and not to provide an opinion on internal control over financial reporting or on compliance. That report is an integral part of an audit performed in accordance with Government Auditing Standards in considering Gallatin Airport Authority’s internal control over financial reporting and compliance. October 18, 2017
C E R T I F I E D P U B L I C A C C O U N T A N T S
HOLMES & TURNER

Management’s Discussion and Analysis
‐ 27 ‐
The following discussion and analysis provides an overview of the Gallatin Airport Authority’s (Authority) financial
statements for the fiscal year ended June 30, 2017 with selected comparative information for the fiscal year ended June
30, 2016. This discussion and analysis has been prepared by management and should be read in conjunction with the
basic financial statements.
OVERVIEW OF THE FINANCIAL STATEMENTS
The Authority is structured as an enterprise fund and the financial statements are prepared on the accrual basis of
accounting. Therefore, revenues are recognized when earned and expenses are recognized when incurred. Capital assets
are capitalized and depreciated over their useful lives, except for land and assets held for future use. See the notes to
the financial statements for a summary of the Authority’s significant accounting practices and policies.
The Authority’s basic financial statements includes three statements: the Statement of Net Position; the Statement of
Revenues, Expenses, and Changes in Net Position; and the Statement of Cash Flows.
Statement of Net Position ‐ presents information on the Authority’s assets, liabilities, and deferred inflows/outflows
of resources, with the difference reported as net position. Total net position serves as a useful indicator of the
Authority’s financial position and is a measurement of the financial condition of the Authority at a specific point in
time.
Statement of Revenues, Expenses and Changes in Net Position ‐ presents information related to revenue and expense
activity. The difference between revenues and expenses will either increase or decrease total net position. The
resulting ending net position balance is reflected on the Statement of Net Position. The change in net position serves
as a useful indicator of whether the overall financial condition of the Authority has improved or declined during the
year.
Statement of Cash Flows ‐ presents information related to the flows of cash and cash equivalents. Consequently,
only transactions that affect the Airport’s cash and cash equivalent accounts are recorded in this statement. A
reconciliation is included at the bottom of this statement to assist in the understanding of the difference between
operating income and cash flows from operating activities.
The basic financial statements also include the notes to the financial statements that explain some of the information in
the financial statements and provide more detailed data. The notes to the financial statements are followed by required
supplementary information and statistical schedules that further explain and support the information in the basic
financial statements.
Certain fiscal year 2016 balances have been reclassified to conform to the fiscal year 2017 presentation.

‐ 28 ‐
FINANCIAL HIGHLIGHTS
Statement of Net Position The following table represents a condensed summary of the Authority’s statement of net position at June 30, 2017 and
2016:
Dollars in thousands 2017 2016
Current assets 26,305$ 24,648$
Restricted assets ‐ noncurrent 5,846 4,672
Capital assets, net ‐ noncurrent 95,835 86,908
Total assets 127,986 116,228
Deferred outflows of resources 464 160
Current liabilities 3,139 1,643
Noncurrent liabilities 15,257 15,352
Total liabilities 18,396 16,995
Deferred inflows of resources 8 182
Net investment in capital assets 82,435 72,958
Restricted 5,847 4,672
Unrestricted 21,764 21,581
Total net position 110,046$ 99,211$
Dollars in 000's
Total assets were up by 10.1% from FY 2016 to FY 2017. Current assets rose by 6.7% mainly due to the increase in cash
and federal grant receivable. Noncurrent assets increased by 11.0% with the FY 2017 capital additions offset by
depreciation.
Current liabilities increased by 91.1% from FY 2016 to FY 2017. The increase was primarily the result of higher
construction payables at the end of FY 2017.
Noncurrent liabilities decreased by 0.6% from FY 2016 to FY 2017. The decrease resulted from reduction in bond principal
with smaller increase in net pension liability.
Changes in deferred outflows of resources and deferred inflows of resources relate to the Authority’s retirement plan
with State of Montana’s Public Employees’ Retirement System. Refer to note 8 in the notes to the financial statements
for details.
Total net position improved by 11.1% from FY 2016 to FY 2017. A summary of the changes in net position follows.
‐ 29 ‐
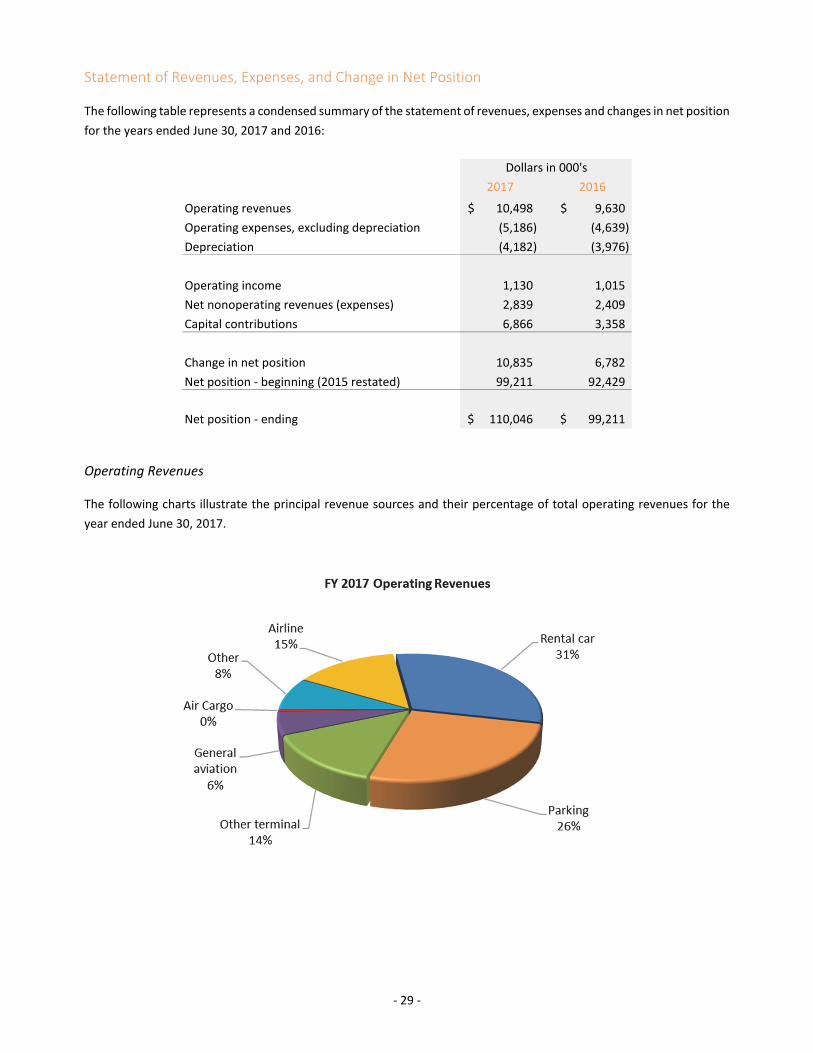
Statement of Revenues, Expenses, and Change in Net Position The following table represents a condensed summary of the statement of revenues, expenses and changes in net position
for the years ended June 30, 2017 and 2016:
Dollars in thousands 2017 2016
Operating revenues 10,498$ 9,630$
Operating expenses, excluding depreciation (5,186) (4,639)
Depreciation (4,182) (3,976)
Operating income 1,130 1,015
Net nonoperating revenues (expenses) 2,839 2,409
Capital contributions 6,866 3,358
Change in net position 10,835 6,782
Net position ‐ beginning (2015 restated) 99,211 92,429
Net position ‐ ending 110,046$ 99,211$
Dollars in 000's
Operating Revenues The following charts illustrate the principal revenue sources and their percentage of total operating revenues for the
year ended June 30, 2017.

‐ 30 ‐
Operating Revenues (continued) The following table shows the operating revenues for the years ended June 30, 2017 and 2016, and the percentage
change.
2017 2016 Change
Airline 1,519$ 1,468$ 3.5%
Rental car 3,218 2,743 17.3%
Parking 2,753 2,590 6.3%
Other terminal 1,466 1,384 5.9%
General aviation 617 570 8.2%
Air Cargo 43 41 4.9%
Other 882 834 5.8%
Total operating revenues 10,498$ 9,630$ 9.0%
Dollars in 000's
Airline revenues rose by 3.5% and consist primarily of landing fees and airline terminal rents. Landing fee revenues
increased by 0.7% to $623,590. Landing fee rates decreased by 3.8% but air carrier landings increased by 7.5. Airline
terminal rent increased by 5.4% to $818,394.
Rental car revenues increased by 17.3% and includes on and off airport concessions fees and rents. The major contributor
was on‐airport rental car concessions which increased by 16.9% to $3,028,365. Transaction days (the number of days a
vehicle is rented) increased by 9.5% to 512,468 days in FY 2017. The average cost‐per‐day of an on‐airport rental car
increased by 9.1% to $58.59. On airport rental agencies pay the Authority the greater of a minimum annual guarantee
or 10% commission fee, plus rent for office space and parking stalls.
Parking revenues were up by 6.3% and consists primarily of parking concessions revenues which increased by 6.2% to
$2,738,044. The parking revenues are net of parking management fees which increased by 8.3% to $379,712 in FY 2017.
The Authority has contracted with Republic Parking to operate the pay parking lot under a five year agreement ending
September 2021.
Other terminal concessions and rents revenues rose by 5.9% and consists primarily of food, beverage and gift shop
concessions fees; advertising; and space rents. The majority of the increase is due to food, beverage, and gift shop
concessions, which increased by 7.4% to $1,020,677 due to passenger traffic and the increase traffic at the second food
and beverage facility in the concourse. The Authority has contracted with Sharbert Enterprises to operate terminal food,
beverage, and gift concessions under a seven year agreement ending May 2022.

‐ 31 ‐
Operating Revenues (continued) General aviation revenues increased by 8.2%. General aviation landing fees increased by 15.1% to $152,283. Fuel flowage
fees increased by 9.8% to $154,902. Tie down fees increased by 1.8% to $38,939. The growth in these areas can be
attributed primarily to increases in general aviation operations.
Air cargo revenues were up slightly with an increase of 4.9%. Other operating revenues increased by 5.8% and consist of revenues from the consolidated rental car facility, the
customs facility, the law enforcement reimbursement program, and other land/building rents. The majority of the
increase is due to activity at the consolidated rental car and customs facilities.
Consolidated rental car facility revenues increased by 9.1% to $401,103. The majority of these revenues is from
the operating portion of the customer facility charges which totaled $384,351 FY 2017. The increase is directly
related to the increase in rental car activity.
Customs facility revenues increased by 8.5% to $136,770 and is due to an increase in international landings
requiring customs services.
Operating Expenses The following charts illustrate the principal operating expenses (excluding depreciation) and their percentage of total
operating expenses for the year ended June 30, 2017.
‐ 32 ‐
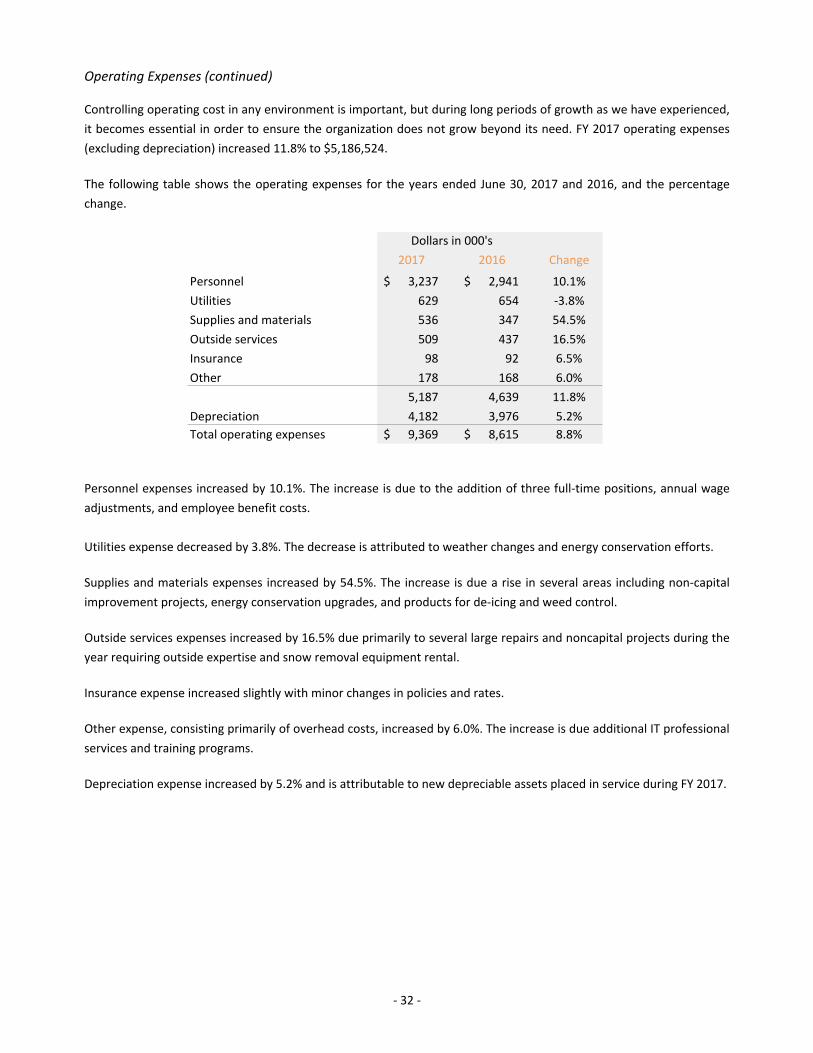
Operating Expenses (continued) Controlling operating cost in any environment is important, but during long periods of growth as we have experienced,
it becomes essential in order to ensure the organization does not grow beyond its need. FY 2017 operating expenses
(excluding depreciation) increased 11.8% to $5,186,524.
The following table shows the operating expenses for the years ended June 30, 2017 and 2016, and the percentage
change.
2017 2016 Change
Personnel 3,237$ 2,941$ 10.1%
Utilities 629 654 ‐3.8%
Supplies and materials 536 347 54.5%
Outside services 509 437 16.5%
Insurance 98 92 6.5%
Other 178 168 6.0%
5,187 4,639 11.8%
Depreciation 4,182 3,976 5.2%
Total operating expenses 9,369$ 8,615$ 8.8%
Dollars in 000's
Personnel expenses increased by 10.1%. The increase is due to the addition of three full‐time positions, annual wage
adjustments, and employee benefit costs.
Utilities expense decreased by 3.8%. The decrease is attributed to weather changes and energy conservation efforts.
Supplies and materials expenses increased by 54.5%. The increase is due a rise in several areas including non‐capital
improvement projects, energy conservation upgrades, and products for de‐icing and weed control.
Outside services expenses increased by 16.5% due primarily to several large repairs and noncapital projects during the
year requiring outside expertise and snow removal equipment rental.
Insurance expense increased slightly with minor changes in policies and rates.
Other expense, consisting primarily of overhead costs, increased by 6.0%. The increase is due additional IT professional
services and training programs.
Depreciation expense increased by 5.2% and is attributable to new depreciable assets placed in service during FY 2017.

‐ 33 ‐
Operating Income (before depreciation) FY 2017 operating income before depreciation was $5,311,414, up 6.4% compared to FY 2016. The increase in operating
expenses of $547,756 was well below the growth in operating revenue of $867,971, as reflected in the chart below.
Nonoperating Revenues and Capital Contributions Nonoperating revenues increased by 10.6%, and consist of passenger facility charges, customer facility charges, interest
income and non‐capital grants.
Passenger facility charges (PFC) revenues increased by 7.0%. The increase is directly attributable to passenger traffic
growth.
Customer facility charges, capital (CFC) revenues increased by 24.7%. The increase is primarily due to rental car activity
and a rate increase from $2 to $3.50 per transaction day instated June 1, 2017.
Interest income decreased by 33.1% primarily due to the consolidated rental car facility investment principal reduction.
Non‐capital grants decreased by 3.9% and consists of funds from the State of Montana related to the Public Employees
Retirement System and pavement preservation. See note 8 in the notes to the financial statements for more information
regarding the Public Employees Retirement System.
Capital contributions increased by 104.4% to $6,865,939 in FY 2017, and consists of Airport Improvement Program (AIP) entitlements and discretionary funds.
Nonoperating Expenses Nonoperating expenses decreased by 2.6%, and consist mainly of bond interest payments.

‐ 34 ‐
Statement of Cash Flows The following table represents a condensed summary of the statement of cash flows for the fiscal years ended June 30,
2017 and 2016:
Dollars in thousands 2017 2016
Cash provided by operating activities 10,849$ 8,794$
Cash used by operating activities (5,134) (4,712)
Cash from operating activities 5,715 4,082
Cash from noncapital financing activities 7 (78) Cash from capital and related financing activities (4,219) 417 Cash from investing activities 62 93
Net increase in cash and cash equivalents 1,565 4,514 Cash and cash equivalents, beginning of year 27,626 23,112
Cash and cash equivalents, end of year 29,191$ 27,626$
Dollars in 000's
Cash and cash equivalents increased 5.7% primarily due to the net cash provided by operations. Net cash used by
noncapital financing activities in FY 2016 related to the Airport’s contribution to the interstate interchange project which
did not occur in FY 2017. Net cash provided by capital and related financing activities includes capital asset acquisitions
and 2009 bond debt service, offset by related funding receipts. Net cash provided by investing activities includes interest
received.
The Authority has been purposeful in building cash reserves in anticipation of several upcoming major capital
improvements that will require significant Authority funding. The Authority intends to maintain $10 million cash on hand
in order to provide for contingencies as well as flexibility in completing projects that are dependent upon FAA funding
and appropriations.
Notes 1 and 2 in the notes to the financial statements provides additional details regarding cash and cash equivalents.
CAPITAL PROJECTS The Authority expended $11,756,284 on capital projects in FY 2017 compared to $4,702,061 in FY 2016. Major capital
projects activity in FY 2017 included parallel runway 11‐29 construction, taxiway pavement rehabilitation, pay parking
lot expansion, parking garage design, and small terminal projects.
Note 4 in the notes to the financial statements and the letter of transmittal provide further details regarding capital asset
activities.
‐ 35 ‐
DEBT ADMINISTRATION The Authority approved the issuance of revenue bonds in 2009 to partially fund the terminal expansion completed in
2011. These bonds are paid first from passenger facility charges (currently $4.50 per enplaned passenger) and second
from other revenues and reserves of the Authority.
Note 7 in the notes to the financial statements describes the bonds in greater detail and includes a summary of the
repayment structure.
REQUEST FOR INFORMATION This financial report is designed to provide all interested parties with a general overview of the Authority’s finances and
to demonstrate the Authority’s accountability for the funds it receives and expends. Questions concerning any of the
information provided in this report or requests for additional information should be addressed to the Airport Director,
850 Gallatin Field Road Suite 6, Belgrade, MT 59714.
Statement of Net Position June 30, 2017
See accompanying notes to financial statements ‐ 36 ‐
Current Assets
Cash and cash equivalents 23,786,440$
Accounts receivable 2,510,098
Prepaid expenses 8,133
26,304,671
Noncurrent Assets
Cash and cash equivalents ‐ restricted 5,405,006
Accounts receivable ‐ restricted 441,999
Nondepreciable capital assets 24,621,553
Depreciable capital assets, net 71,213,268
101,681,826
Total Assets 127,986,497
Deferred Outflow of Resources
Montana Public Employees Retirement System 464,566
Current Liabilities
Accounts payable 2,052,384
Deposits 100,667
Accrued payroll liabilities 332,363
Prepayments ‐ rents 88,693
Current portion of 2009 revenue bonds payable 565,000
3,139,107
Noncurrent Liabilities
Net pension liability 2,422,514
2009 revenue bonds payable, less current portion 12,835,000
15,257,514
Total Liabilities 18,396,621
Deferred Inflow of Resources
Montana Public Employees Retirement System 8,019
Net Position
Net investment in capital assets 82,434,821
Restricted ‐ capital projects and debt service 5,703,974
Restricted ‐ customs 143,031
Unrestricted 21,764,597
Total Net Position 110,046,423$

Statement of Revenues, Expenses, and Changes in Net Position Year Ended June 30, 2017
See accompanying notes to financial statements ‐ 37 ‐
Operating Revenues
Airline 1,518,773$
Rental car concessions 3,217,657
Parking 2,752,978
Other terminal concessions and rents 1,465,824
General aviation 616,881
Air cargo 42,670
Other 883,155
10,497,938
Operating Expenses
Personnel 3,237,477
Utilities 629,222
Supplies and materials 535,315
Outside services 508,542
Insurance 98,209
Other 177,759
5,186,524
Operating income before depreciation 5,311,414
Depreciation expense 4,181,565
Operating Income 1,129,849
Nonoperating Revenues (Expenses)
Passenger facility charges 2,221,502
Customer facility charges 1,095,592
Interest income 62,444
Other nonoperating revenue 51,924
Other nonoperating expenses (350)
Interest expense (591,986)
2,839,126
Capital Contributions
Federal grants 6,865,939
Change in Net Position 10,834,914
Net position, beginning of year 99,211,509
Net Position, End of Year 110,046,423$

Statement of Cash Flows Year Ended June 30, 2017
See accompanying notes to financial statements ‐ 38 ‐
Cash Flows From Operating Activities
Operating cash receipts from customers 10,849,052$
Cash payments to suppliers for goods and services (1,909,839)
Cash payments to employees for services (3,224,637)
5,714,576
Cash Flows From Noncapital Financing Activities
Nonoperating grant receipts 7,000
Cash Flows From Capital and Related Financing Activities
Purchase of capital assets (11,756,284)
Federal grant receipts 5,401,096
Passenger facility charge receipts 2,183,044
Customer facility charge receipts 1,095,592
Principal payment on capital debt (550,000)
Bond interest payments (591,986)
(4,218,538)
Cash Flows from Investing Activities
Interest received 62,444
Net Increaes In Cash and Cash Equivalents 1,565,482
Cash and cash equivalents, beginning of year 27,625,964
Cash and Cash Equivalents, End of Year 29,191,446$
Reconciliation of operating income to
cash flows from operating activities
Operating income 1,129,849$
Adjustments to reconcile operating income to
cash flows from operating activities:
Depreciation 4,181,565
Changes in current assets and liabilities:
Receivables, customers 373,542
Prepaid expenses 27,758
Accounts payable 11,450
Deposits (300)
Prepayments ‐ rents (22,128)
Accrued payroll liabilities 12,840
Cash flows from operating activities 5,714,576$

Notes to Financial Statements Year Ended June 30, 2017
‐ 39 ‐
NOTE 1. SUMMARY OF SIGNIFICANT ACCOUNTING POLICIES The financial statements of the Gallatin Airport Authority (Authority) have been prepared in conformity with accounting
principles generally accepted in the United States of America as applied to governmental units. The Governmental
Accounting Standards Board (GASB) is the accepted standard‐setting body for establishing governmental accounting and
financial reporting principles. The more significant of the Authority’s accounting policies are described below.
Reporting Entity The Gallatin Airport Authority was established by Resolution No. 1553 dated November 22, 1972, of the Board of County
Commissioners of Gallatin County, Montana, pursuant to the statutory authority granted in Title 67, Chapter 11, parts 1‐
3, Montana Code Annotated.
The Authority was established to assume ownership and responsibility for the improvements, equipment and operation
of Gallatin Field, with all powers granted to municipal airport authorities by state law and resolved in Resolution 1553.
The powers and duties of the Authority are vested in the Board of Commissioners consisting of five members appointed
by the Board of County Commissioners of Gallatin County. Pursuant to said Resolution No. 1553, the Authority has
assumed ownership and responsibility for the improvements, equipment and operations of Gallatin Field, and all right,
title and interest of the City of Bozeman, Gallatin County, and the Authority Board has been granted, conveyed, and
transferred to the Authority. The name of the airport known as Gallatin Field was changed to Bozeman Yellowstone
International Airport at Gallatin Field by an act of the Gallatin Airport Authority Board at their regular meeting held
December 8, 2011.
The Authority, governed by its Board of Commissioners and operated by its employees, is an independent political entity
with the authority to contract, own property, incur debt, and generally operate the Airport.
Measurement Focus and Basis of Accounting The term measurement focus is used to denote what is being measured and reported in the Authority’s financial
statements. The Authority operates as an enterprise fund and its financial statements have been prepared using the
economic resources measurement focus. The enterprise fund operates in a manner similar to private business
enterprises, where the intent of the Authority is that the expenses of meeting its organizational purpose be financed or
recovered primarily through user charges.
The term basis of accounting is used to determine when a transaction or event is recognized on the Authority’s financial
statements. The Authority uses the accrual basis of accounting. Non‐exchange revenues, including grants, are reported
when all eligibility requirements have been met. Fees and charges and other exchange revenues are recognized when
earned and expenses are recognized when incurred.
Cash and Cash Equivalents For the purposes of the statement of cash flows, all highly liquid investments (including restricted assets) with an original
maturity of three months or less when purchased are considered to be cash equivalents.

‐ 40 ‐
NOTE 1. SUMMARY OF SIGNIFICANT ACCOUNTING POLICIES (CONTINUED) Investments The Authority is authorized by statute to invest in time and savings deposits with a bank, savings and loan association,
or credit union in the state. In addition, it may also invest in obligations of the United States Government, securities
issued by agencies of the United States, repurchase agreements, and the State Short‐Term Investment Pool (STIP).
Investments are reported at fair value. Fair value is defined as the price that would be received to sell an asset or paid
to transfer a liability in an orderly transaction between market participants at the measurement date. Fair value is
determined annually, and requires the use of valuation techniques, a specific method or combination of methods using
one or more of three approaches: market, cost or income approach.
Inventories Purchases of supplies are recognized as expenses at the time of purchase. Items on hand at year‐end were immaterial. Accounts Receivable Accounts receivable represents unpaid billings to outside parties. Due to the nature of the receivables consisting of
primarily collected user fees and leases, the Authority considers the majority of these receivables as collectible. A
provision for uncollectible receivables in the amount of $6,200 was established for 2017.
Capital Assets The Authority’s capital assets are capitalized at historical cost. Contributions of capital assets are recorded at acquisition
value. The Authority has set the capitalization threshold for reporting capital assets at $5,000. Depreciation of capital
assets is calculated using the straight‐line method with estimated useful lives as follows:
Runways and improvements 5‐20 years
Buildings and equipment 3‐40 years
Intangibles 20 years
Maintenance and repair costs are expensed as incurred. Replacements, which improve or extend the life of a fixed asset,
are capitalized.
Compensated Absences Vested vacation leave is recorded as an expense and liability as the benefits accrue to employees. In accordance with
the provisions of Statement of Financial Accounting Standards No. 43, Accounting for Compensated Absences, no liability
is recorded for non‐vesting accumulating rights to receive sick pay benefits. However, a liability is recognized for that
portion of accumulated sick leave pay benefits that is estimated will be taken when an employee leaves employment.

‐ 41 ‐
NOTE 1. SUMMARY OF SIGNIFICANT ACCOUNTING POLICIES (CONTINUED) Net Pension Liability and Deferred Outflows/Inflows of Resources The Authority recognizes net pension liability for the pension plan in which it participates. Changes in the net pension
liability during the year are recorded as pension expense, or as deferred inflows of resources or deferred outflows of
resources depending on the nature of the change. Those changes in net pension liability that are recorded as deferred
inflows of resources or deferred outflows of resources that arise from changes in actuarial assumptions or other inputs
and differences between expected or actual experience are amortized over the weighted average remaining service life
of all participants in the pension plan and recorded as a component of pension expense beginning with the period in
which they are incurred. Projected earnings on qualified pension plan investment earnings are recognized as a
component of pension expense. Differences between projected and actual investment earnings are reported as deferred
inflows of resources or deferred outflows of resources and amortized as a component of pension expense.
Net Position Net position is divided into three components:
• Net investment in capital assets – consists of the historical cost of capital assets less accumulated depreciation
and less any debt that remains outstanding that was used to finance those assets plus deferred outflows of
resources less deferred inflows of resources related to those assets.
• Restricted net position– consists of assets that are restricted as a result of external constraints imposed by
creditors (such as through debt covenants), grantors, contributors, or laws or regulations of other governments
or constraints imposed by law through constitutional provisions or enabling legislation.
• Unrestricted net position – all other net position is reported in this category.
When an expense is incurred that can be paid using either restricted or unrestricted resources (net position), the
Authority’s policy is to first apply the expense toward restricted resources and then toward unrestricted resources.
Operating Revenues and Expenses Operating revenues include airline, concessions, rents, and other revenues. Concessions and other revenues consist
primarily of rental car, parking, and other ancillary services revenues. Such revenue is generally based on a fixed
percentage of tenant revenues subject to certain minimum monthly fees or a fixed fee schedule. Concessions and other
revenues are recognized when earned.
Operating expenses include personnel costs, utilities, supplies and materials, outside services, other expenses, and
depreciation.
Budget The Authority annually adopts a non‐legally binding budget. Use of Estimates The preparation of the basic financial statements in conformity with accounting principles generally accepted in the United States requires management to make estimates and assumptions that affect certain reported amounts and disclosures. Accordingly, actual results could differ from those estimates.

‐ 42 ‐
NOTE 1. SUMMARY OF SIGNIFICANT ACCOUNTING POLICIES (CONTINUED) New Pronouncements For the year ended June 30, 2017 the Authority adopted GASB No. 82, Pension Issues ‐ an amendment of GASB
Statements No. 67, No. 68, and No. 73. Prior to the issuance of this Statement, Statements 67 and 68 required
presentation of covered employee payroll, which is the payroll of employees that are provided with pensions through
the pension plan, and ratios that use that measure, in schedules of required supplementary information. This Statement
amends Statements 67 and 68 to instead require the presentation of covered payroll, defined as the payroll on which
contributions to a pension plan are based, and ratios that use that measure.
NOTE 2. CASH AND INVESTMENTS The composition of cash and investments on June 30, 2017 was as follows:
Cost Fair Value
Unrestricted
Operating account 13,545,378$ 13,545,378$
Capital account 10,241,062 10,241,062
23,786,440 23,786,440
Restricted
Customs 143,031 143,031
Debt service account 189,898 189,898
PFC reserve account 2,357,925 2,357,925
Renewal and replacement
reserve account (STIP) 250,000 250,000
Operating reserve (STIP) 1,320,032 1,320,032
Debt service reserve account (STIP) 1,144,120 1,144,120
5,405,006 5,405,006
Total cash and cash equivalents 29,191,446$ 29,191,446$ Custodial Credit Risk – Deposits At June 30, 2017, the carrying amount of the Authority’s deposits in local banks was $26,477,294. Account balances are
covered by the Federal Depository Insurance Corporation (FDIC) up to $250,000 per bank, per depositor. The remaining
balances are covered by collateral held by the pledging bank’s agent in the Authority’s name.
Investments at Fair Value The Authority voluntarily participates in the Short Term Investment Program (STIP) administered by the Montana Board
of Investments (MBOI). STIP was created by the State of Montana Board of Investments to allow qualifying funds, per
sections 17‐6‐201, 202 and 204, MCA, to participate in a diversified pool. The carrying amount of this investment as of
June 30, 2017 was $2,714,152. This investment in STIP is considered a cash equivalent.

‐ 43 ‐
NOTE 2. CASH AND INVESTMENTS (CONTINUED) A local government’s STIP ownership is represented by shares, the price of which are fixed at $1.00 per share, and
participants may buy or sell shares with one business days’ notice. STIP administrative expenses are charged daily against
the STIP income, which is distributed on the first calendar day of each month. Shareholders have the option to
automatically reinvest their distribution income in additional shares.
The STIP is not registered with the Securities and Exchange Commission. STIP is not FDIC‐insured or otherwise insured
or guaranteed by the federal government, the State of Montana, the MBOI or any other entity against investment losses,
and there is no guaranteed rate of return on funds invested in STIP shares. The MBOI maintains a reserve fund to offset
possible losses and limit fluctuations in STIP’s valuation.
Information on investments held in the STIP can be found in the Annual Report on the MBOI website at
http://investmentmt.com/AnnualReportsAudits.
Risks Related to STIP Effective June 30, 2005, the State of Montana Board of Investments implemented the provisions of GASB Statement No.
40 – Deposit and Investment Risk Disclosures. The unaudited financial statements as of June 30, 2017 have disclosures
pertaining to STIP’s exposure to credit risk, custodial credit risk, concentration of credit risk, interest rate risk, and legal
and credit risk. Although the STIP investments have been rated by investment security type, STIP, as an external
investment pool, has not been rated.
Security Lending STIP is eligible to participate in securities lending. Securities lending transactions for fiscal year 2017 are disclosed in
STIP’s financial statements.
An unaudited copy of the STIP fiscal year 2017 financial statements is available online at the Montana Board of
Investments’ website.
NOTE 3. ACCOUNTS RECEIVABLE The composition of accounts receivable on June 30, 2017 was as follows:
Unrestricted
Trade accounts receivable, net 874,861$
Grants receivable 1,635,237
2,510,098
Restricted
Passenger facility charges receivable 415,863
Customs receivable 26,136
441,999
Total accounts receivable 2,952,097$

‐ 44 ‐
NOTE 4. CAPITAL ASSETS
The following is a summary of capital asset activity for the year ended June 30, 2017:
June 30, 2016 Additions Reductions June 30, 2017
Nondepreciable capital assets
Land 11,575,099$ 677,741$ ‐$ 12,252,840$
Construction in progress * 5,395,235 6,973,478 ‐ 12,368,713
16,970,334 7,651,219 ‐ 24,621,553
Depreciable capital assets
Runways & improvements 41,914,039 4,222,263 ‐ 46,136,302
Buildings & equipment 75,863,460 1,235,033 (46,406) 77,052,087
Intangibles 460,840 ‐ ‐ 460,840
118,238,339 5,457,296 (46,406) 123,649,229
Accumulated depreciation
Runways & improvements 26,919,409 1,841,895 ‐ 28,761,304
Buildings & equipment 21,227,670 2,316,627 (46,406) 23,497,891
Intangibles 153,724 23,042 ‐ 176,766
48,300,803 4,181,564 (46,406) 52,435,961
Depreciable capital assets, net 69,937,536 1,275,732 ‐ 71,213,268
Total capital assets, net 86,907,870$ 8,926,951$ ‐$ 95,834,821$ * Construction in progress at June 30, 2017 consists mainly of the costs associated with runway 11/29 construction,
taxiway rehabilitation, parking garage design, parking lot expansion, and small terminal projects.
NOTE 5. PREPAYMENTS ‐ RENTS The Authority reports prepaid rents on its statement of net position when revenues have been received but not yet
earned. In subsequent periods, when revenue recognition criteria are met, the liability for prepaid rents is removed from
the statement of net position and the revenue is recognized.
NOTE 6. LONG TERM LIABILITIES The following is a summary of long‐term liabilities activity for the year ended June 30, 2017:
CurrentJune 30, 2016 Additions Reductions June 30, 2017 Portion
Revenue bonds 13,950,000$ ‐$ (550,000)$ 13,400,000$ 565,000$ Net pension liability 1,951,981 470,533 ‐ 2,422,514 ‐
Total long term liabilities 15,901,981$ 470,533$ (550,000)$ 15,822,514$ 565,000$
‐ 45 ‐
NOTE 7. REVENUE BONDS On August 13, 2009, the Authority approved a resolution to issue revenue bonds (PFC supported) in the aggregate
principal amount of up to $16,000,000, pursuant to Montana Code Annotated, Section 67‐11‐303, in order to provide
funds to pay a portion of the costs to expand, improve, construct, reconstruct and equip the airline terminal building;
fund the Debt Service Reserve Account; and pay all or a portion of the costs of issuing the bonds. Maturity dates began
in June 1, 2013, and will end June 1, 2034. Interest rates on the bonds range from 3.0% to 4.7% depending on the maturity
date. The bonds are secured by a first lien upon the net revenues of the Authority, and by a pledge of the passenger
facility charges of the Authority.
Interest is payable semiannually June 1 and December 1. The stated maturity dates, debt service requirements and
related interest rates are as follows:
Principal Interest Interest Principal
Fiscal Year Amount Rate Amount and Interest
2018 565,000$ 3.400% 574,386$ 1,139,386$
2019 585,000 3.500% 555,176 1,140,176
2020 605,000 3.625% 534,701 1,139,701
2021 630,000 3.750% 512,770 1,142,770
2022 650,000 3.850% 489,145 1,139,145
2023‐2027 3,680,000 3.950‐4.000% 2,031,216 5,711,216
2028‐2032 4,555,000 4.000‐4.375% 1,153,237 5,708,237
2033‐2034 2,130,000 4.375‐4.700% 151,340 2,281,340
13,400,000$ 6,001,971$ 19,401,971$
NOTE 8. PUBLIC EMPLOYEES’ RETIREMENT SYSTEM In accordance with GASB Statement 68, Accounting and Financial Reporting for Pensions, employers and the non‐
employer contributing entity are required to recognize and report certain amounts associated with their participation in
the Public Employees' Retirement System (PERS). Employers are required to record and report their proportionate share
of the collective Net Pension Liability, Pension Expense, and Deferred Outflows and Deferred Inflows of resources
associated with pensions.
Net Pension Liability The Total Pension Liability (TPL) minus the Fiduciary Net Position equals the Net Pension Liability (NPL). As GASB
Statement 68 allows, a measurement date of up to 12 months before the employer’s fiscal year‐end can be utilized to
determine the Plan’s TPL. The basis for the TPL as of June 30, 2016, was determined by taking the results of the June 20,
2015, actuarial valuation and applying standard roll forward procedures. The roll forward procedures uses a calculation
that adds the annual normal cost (also called service cost), subtracts the actual benefit payments and refunds for the
plan year, and then applies the expected investment rate of return for the year. The update procedures are in conformity
with Actuarial Standards of Practice issued by the Actuarial Standards Board.
The state of Montana, as the non‐employer contributing entity, paid to the Plan additional contributions that qualify as
special funding. Those employers who received special funding are counties; cities and towns; school districts and high
schools; and other governmental agencies.
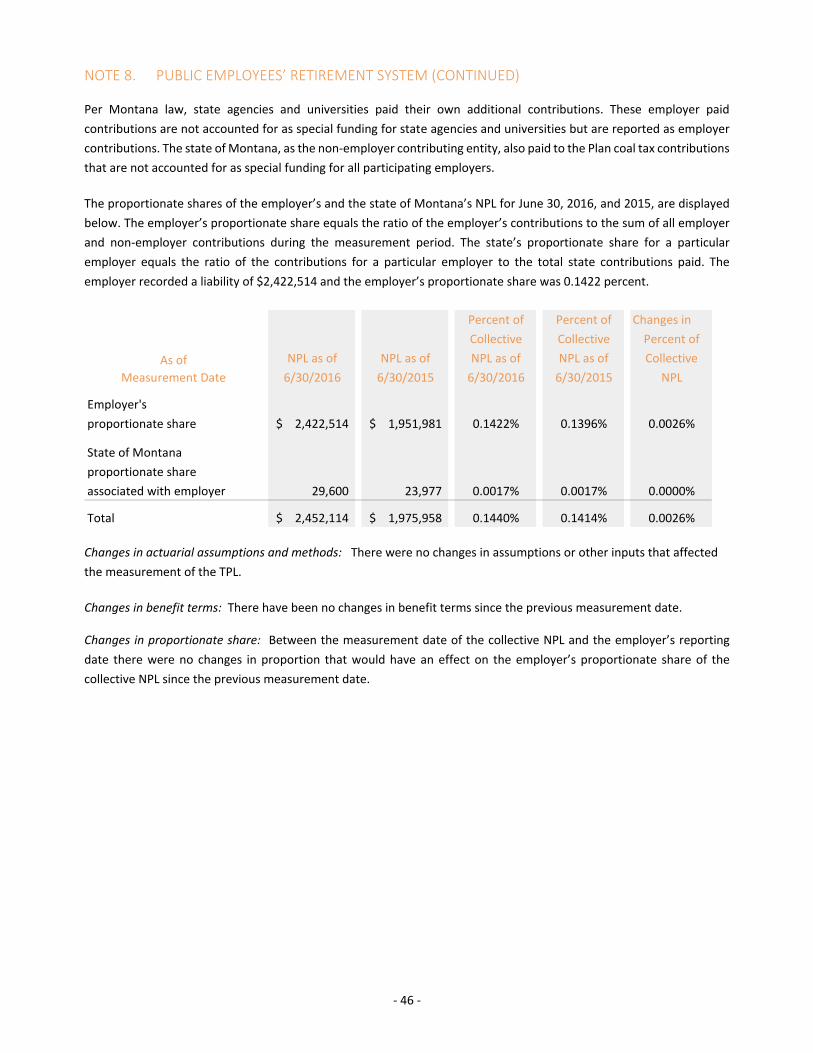
‐ 46 ‐
NOTE 8. PUBLIC EMPLOYEES’ RETIREMENT SYSTEM (CONTINUED) Per Montana law, state agencies and universities paid their own additional contributions. These employer paid
contributions are not accounted for as special funding for state agencies and universities but are reported as employer
contributions. The state of Montana, as the non‐employer contributing entity, also paid to the Plan coal tax contributions
that are not accounted for as special funding for all participating employers.
The proportionate shares of the employer’s and the state of Montana’s NPL for June 30, 2016, and 2015, are displayed
below. The employer’s proportionate share equals the ratio of the employer’s contributions to the sum of all employer
and non‐employer contributions during the measurement period. The state’s proportionate share for a particular
employer equals the ratio of the contributions for a particular employer to the total state contributions paid. The
employer recorded a liability of $2,422,514 and the employer’s proportionate share was 0.1422 percent.
Percent of Percent of Changes in
Collective Collective Percent of
NPL as of NPL as of NPL as of NPL as of Collective
6/30/2016 6/30/2015 6/30/2016 6/30/2015 NPL
Employer's
proportionate share 2,422,514$ 1,951,981$ 0.1422% 0.1396% 0.0026%
State of Montana
proportionate share
associated with employer 29,600 23,977 0.0017% 0.0017% 0.0000%
Total 2,452,114$ 1,975,958$ 0.1440% 0.1414% 0.0026%
As of
Measurement Date
Changes in actuarial assumptions and methods: There were no changes in assumptions or other inputs that affected
the measurement of the TPL.
Changes in benefit terms: There have been no changes in benefit terms since the previous measurement date. Changes in proportionate share: Between the measurement date of the collective NPL and the employer’s reporting
date there were no changes in proportion that would have an effect on the employer’s proportionate share of the
collective NPL since the previous measurement date.
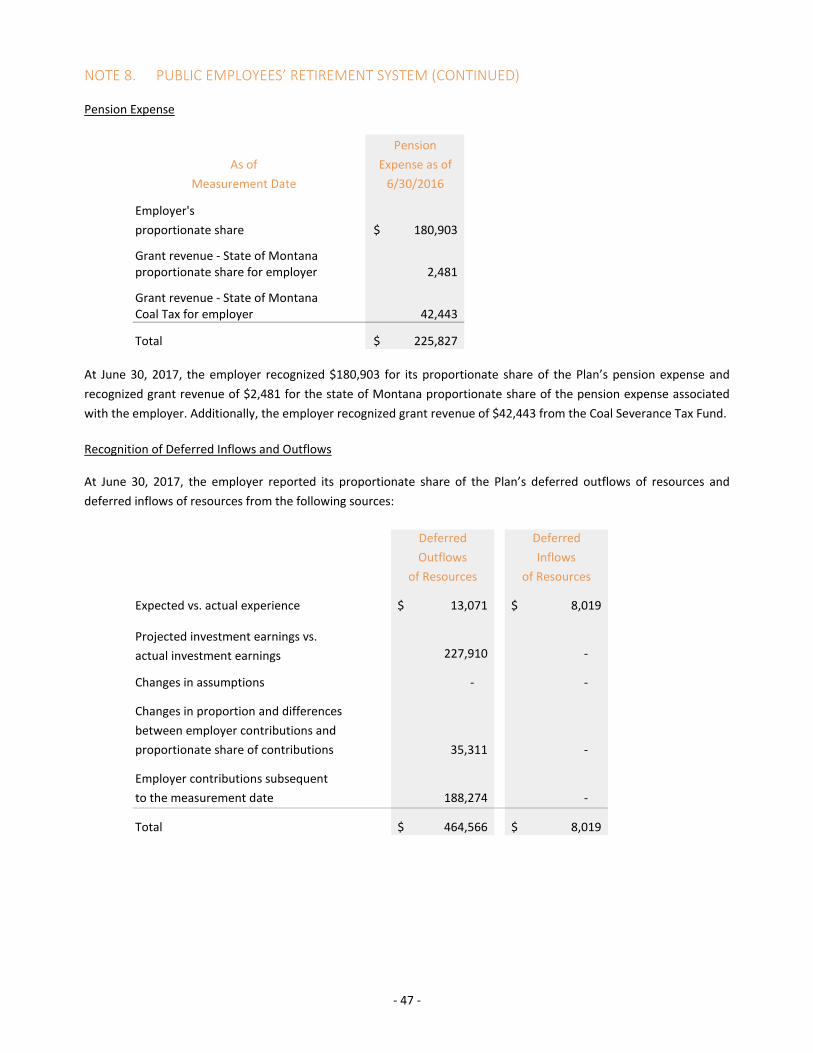
‐ 47 ‐
NOTE 8. PUBLIC EMPLOYEES’ RETIREMENT SYSTEM (CONTINUED) Pension Expense
Pension
As of Expense as of
Measurement Date 6/30/2016
Employer's
proportionate share 180,903$
Grant revenue ‐ State of Montana proportionate share for employer 2,481
Grant revenue ‐ State of MontanaCoal Tax for employer 42,443
Total 225,827$ At June 30, 2017, the employer recognized $180,903 for its proportionate share of the Plan’s pension expense and
recognized grant revenue of $2,481 for the state of Montana proportionate share of the pension expense associated
with the employer. Additionally, the employer recognized grant revenue of $42,443 from the Coal Severance Tax Fund.
Recognition of Deferred Inflows and Outflows At June 30, 2017, the employer reported its proportionate share of the Plan’s deferred outflows of resources and
deferred inflows of resources from the following sources:
Deferred Deferred
Outflows Inflows
of Resources of Resources
Expected vs. actual experience 13,071$ 8,019$
Projected investment earnings vs.
actual investment earnings 227,910 ‐
Changes in assumptions ‐ ‐
Changes in proportion and differences
between employer contributions and
proportionate share of contributions 35,311 ‐
Employer contributions subsequent
to the measurement date 188,274 ‐
Total 464,566$ 8,019$
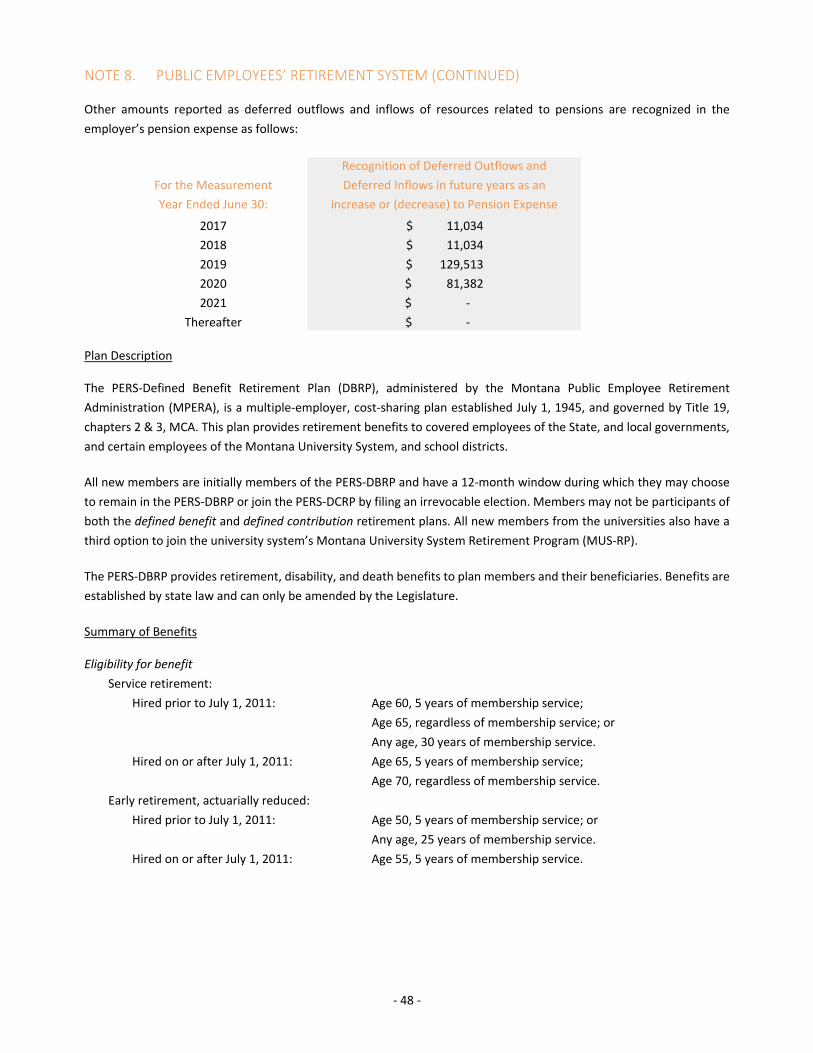
‐ 48 ‐
NOTE 8. PUBLIC EMPLOYEES’ RETIREMENT SYSTEM (CONTINUED) Other amounts reported as deferred outflows and inflows of resources related to pensions are recognized in the
employer’s pension expense as follows:
For the Measurement
Year Ended June 30:
2017 11,034$
2018 11,034$
2019 129,513$
2020 81,382$
2021 ‐$
Thereafter ‐$
Recognition of Deferred Outflows and
Deferred Inflows in future years as an
increase or (decrease) to Pension Expense
Plan Description The PERS‐Defined Benefit Retirement Plan (DBRP), administered by the Montana Public Employee Retirement
Administration (MPERA), is a multiple‐employer, cost‐sharing plan established July 1, 1945, and governed by Title 19,
chapters 2 & 3, MCA. This plan provides retirement benefits to covered employees of the State, and local governments,
and certain employees of the Montana University System, and school districts.
All new members are initially members of the PERS‐DBRP and have a 12‐month window during which they may choose
to remain in the PERS‐DBRP or join the PERS‐DCRP by filing an irrevocable election. Members may not be participants of
both the defined benefit and defined contribution retirement plans. All new members from the universities also have a
third option to join the university system’s Montana University System Retirement Program (MUS‐RP).
The PERS‐DBRP provides retirement, disability, and death benefits to plan members and their beneficiaries. Benefits are
established by state law and can only be amended by the Legislature.
Summary of Benefits Eligibility for benefit
Service retirement:
Hired prior to July 1, 2011: Age 60, 5 years of membership service;
Age 65, regardless of membership service; or
Any age, 30 years of membership service.
Hired on or after July 1, 2011: Age 65, 5 years of membership service;
Age 70, regardless of membership service.
Early retirement, actuarially reduced:
Hired prior to July 1, 2011: Age 50, 5 years of membership service; or
Any age, 25 years of membership service.
Hired on or after July 1, 2011: Age 55, 5 years of membership service.

‐ 49 ‐
NOTE 8. PUBLIC EMPLOYEES’ RETIREMENT SYSTEM (CONTINUED) Vesting
5 years of membership service
Member’s highest average compensation (HAC)
• Hired prior to July 1, 2011 ‐ highest average compensation during any consecutive 36 months;
• Hired on or after July 1, 2011 ‐ highest average compensation during any consecutive 60 months;
Compensation Cap
Hired on or after July 1, 2013 – 110% annual cap on compensation considered as a part of a member’s highest
average compensation.
Monthly benefit formula
Members hired prior to July 1, 2011:
• Less than 25 years of membership service: 1.785% of HAC per year of service credit;
• 25 years of membership service or more: 2% of HAC per year of service credit.
Members hired on or after July 1, 2011:
• Less than 10 years of membership service: 1.5% of HAC per year of service credit;
• 10 years or more, but less than 30 years of membership service: 1.785% of HAC per year of service credit;
• 30 years or more of membership service: 2% of HAC per year of service credit.
Guaranteed Annual Benefit Adjustment (GABA)
After the member has completed 12 full months of retirement, the member’s benefit increases by the applicable
percentage (provided below) each January, inclusive of other adjustments to the member’s benefit.
• 3.0% for members hired prior to July 1, 2007
• 1.5% for members hired between July 1, 2007 and June 30, 2013
• Members hired on or after July 1, 2013:
o 1.5% for each year PERS is funded at or above 90%;
o 1.5% is reduced by 0.1% for each 2% PERS is funded below 90%; and
o 0% whenever the amortization period for PERS is 40 years or more.
Overview of Contributions Members and employer contribution rates are specified by state law and are a percentage of the member’s
compensation. Contributions are deducted from each member’s salary and remitted by participating employers. The
Montana Legislature has the authority to establish and amend contribution rates. Member and employer contribution
rates are shown in the table below.
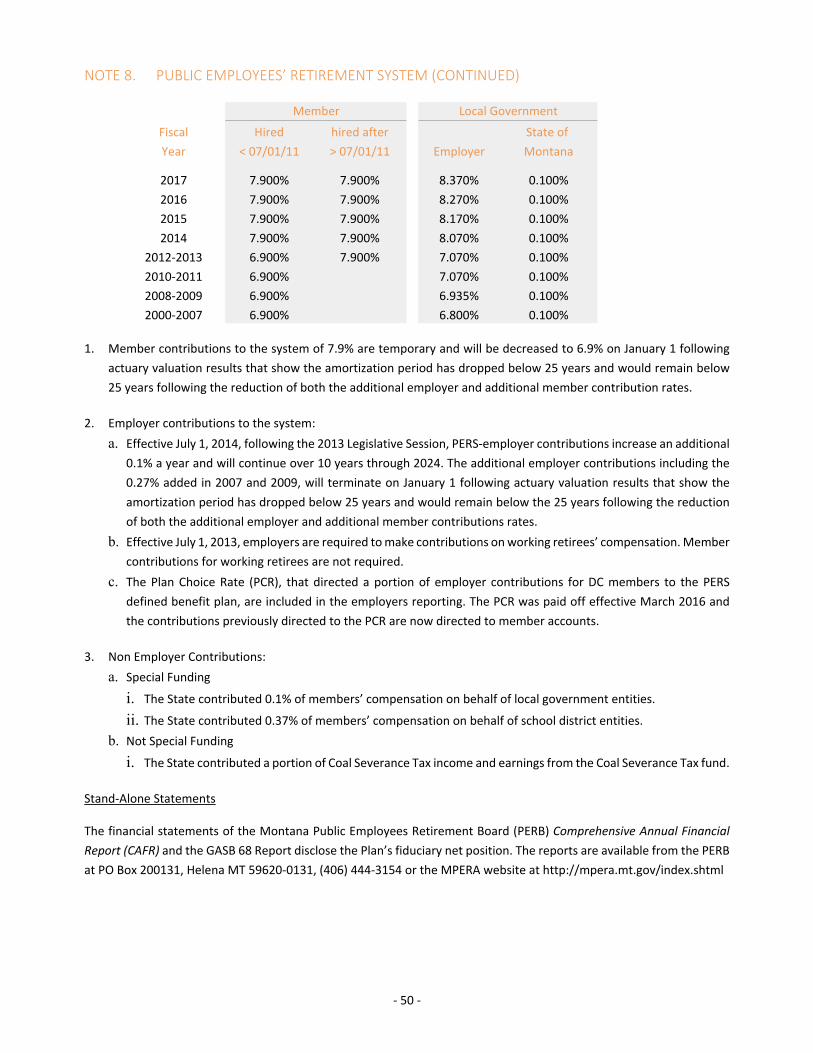
‐ 50 ‐
NOTE 8. PUBLIC EMPLOYEES’ RETIREMENT SYSTEM (CONTINUED)
Fiscal Hired hired after State of
Year < 07/01/11 > 07/01/11 Employer Montana
2017 7.900% 7.900% 8.370% 0.100%
2016 7.900% 7.900% 8.270% 0.100%
2015 7.900% 7.900% 8.170% 0.100%
2014 7.900% 7.900% 8.070% 0.100%
2012‐2013 6.900% 7.900% 7.070% 0.100%
2010‐2011 6.900% 7.070% 0.100%
2008‐2009 6.900% 6.935% 0.100%
2000‐2007 6.900% 6.800% 0.100%
Member Local Government
1. Member contributions to the system of 7.9% are temporary and will be decreased to 6.9% on January 1 following
actuary valuation results that show the amortization period has dropped below 25 years and would remain below
25 years following the reduction of both the additional employer and additional member contribution rates.
2. Employer contributions to the system:
a. Effective July 1, 2014, following the 2013 Legislative Session, PERS‐employer contributions increase an additional
0.1% a year and will continue over 10 years through 2024. The additional employer contributions including the
0.27% added in 2007 and 2009, will terminate on January 1 following actuary valuation results that show the
amortization period has dropped below 25 years and would remain below the 25 years following the reduction
of both the additional employer and additional member contributions rates.
b. Effective July 1, 2013, employers are required to make contributions on working retirees’ compensation. Member
contributions for working retirees are not required.
c. The Plan Choice Rate (PCR), that directed a portion of employer contributions for DC members to the PERS
defined benefit plan, are included in the employers reporting. The PCR was paid off effective March 2016 and
the contributions previously directed to the PCR are now directed to member accounts.
3. Non Employer Contributions:
a. Special Funding
i. The State contributed 0.1% of members’ compensation on behalf of local government entities.
ii. The State contributed 0.37% of members’ compensation on behalf of school district entities.
b. Not Special Funding
i. The State contributed a portion of Coal Severance Tax income and earnings from the Coal Severance Tax fund.
Stand‐Alone Statements The financial statements of the Montana Public Employees Retirement Board (PERB) Comprehensive Annual Financial
Report (CAFR) and the GASB 68 Report disclose the Plan’s fiduciary net position. The reports are available from the PERB
at PO Box 200131, Helena MT 59620‐0131, (406) 444‐3154 or the MPERA website at http://mpera.mt.gov/index.shtml

‐ 51 ‐
NOTE 8. PUBLIC EMPLOYEES’ RETIREMENT SYSTEM (CONTINUED) Actuarial Assumptions The TPL used to calculate the NPL was determined by taking the results of the June 30, 2015, actuarial valuation and
applying standard roll forward procedures to update the TPL to June 30, 2016. There were several significant assumptions
and other inputs used to measure the TPL. The actuarial assumptions used in the June 30, 2016, valuation were based
on the results of the last actuarial experience study, dated June 2010, for the six‐year period July 1, 2003 to June 30,
2009. Among those assumptions were the following:
• Investment return (net of admin expense) 7.75%
• Admin expense as % of payroll 0.27%
• General wage growth * 4.00%
* Includes inflation at 3.00%
• Merit increases 0% to 6%
• Postretirement benefit increases
Guaranteed Annual Benefit Adjustment (GABA)
After the member has completed 12 full months of retirement, the member's benefit increases by the applicable
percentage each January, inclusive of other adjustments to the member's benefit.
o 3% for members hired prior to July 1, 2007
o 1.5% for members hired between July 1, 2007 and June 30, 2013
o Members hired on or after July 1, 2013:
a. 1.5% for each year PERS is funded at or above 90%;
b. 1.5% is reduced by 0.1% for each 2.0% PERS is funded below 90%; and
c. 0% whenever the amortization period for PERS is 40 years or more.
• Mortality assumptions among contributing members, terminated vested members, service retired members
and beneficiaries were based on RP 2000 Combined Employee and Annuitant Mortality Tables projected to 2015
with scale AA.
• Mortality assumptions among Disabled Retirees were based on RP 2000 Combined Employee and Annuitant
Mortality Tables with no projections. No future mortality improvement were assumed.
Discount Rate The discount rate used to measure the TPL was 7.75%. The projection of cash flows used to determine the discount rate
assumed that contributions from participating plan members, employers, and non‐employer contributing entities would
be made based on the Board’s funding policy, which establishes the contractually required rates under the Montana
Code Annotated. The State contributes 0.1% of the salaries paid by local governments and 0.37% paid by school districts.
In addition, the state contributed coal severance tax and interest money from the general fund. The interest was
contributed monthly and the severance tax was contributed quarterly. Based on those assumptions, the Plan’s fiduciary
net position was projected to be adequate to make all the projected future benefit payments of current plan members
through the year 2117. Therefore, the long‐term expected rate of return on pension plan investments was applied to all
periods of projected benefit payments to determine the TPL. A municipal bond rate was not incorporated in the discount
rate.

‐ 52 ‐
NOTE 8. PUBLIC EMPLOYEES’ RETIREMENT SYSTEM (CONTINUED) Target Allocations The long‐term expected return on pension plan assets was reviewed as part of the regular experience study prepared
for the Plan. The experience study, performed for the period of fiscal years 2003 through 2009, was outlined in a report
dated June 2010 and is located on the MPERA website. The long‐term expected rate of return on pension plan
investments was determined by considering information from various sources, including historical rates of return, rate
of return assumptions adopted by similar public sector systems, and by using a building block method in which best‐
estimate ranges of expected future real rates of return (expected returns, net of pension plan investment expense and
inflation) are developed for each major asset class. These ranges were combined to produce the long‐term expected rate
of return by weighting the expected future real rates of return by the target asset allocation percentage and by adding
expected inflation. Best estimates of arithmetic real rates of return for each major asset class included in the target asset
allocation as of June 20, 2016, are summarized below.
Real Rate Long‐Term
Target Asset of Return Expected Real
Asset Class Allocation Arithmetic Basis Rate of Return
Cash equivalents 2.60% 4.00% 0.10%
Domestic equity 36.0% 4.55% 1.64%
Foreign equity 18.0% 6.35% 1.14%
Fixed income 23.4% 1.00% 0.23%
Private equity 12.0% 7.75% 0.93%
Real estate 8.0% 4.00% 0.32%
Total 100.0% 4.37%
Inflation 3.00%
Portfolio return expectation 7.37%
Sensitivity Analysis The sensitivity of the NPL to the discount rate is shown in the table below. A small change in the discount rate can create
a significant change in the liability. The NPL was calculated using the discount rate of 7.75%, as well as what the NPL
would be if it were calculated using a discount rate 1.00% lower or 1.00% higher than the current rate.
1.0% Decrease Current 1.0% IncreaseAs of Measurement Date (6.75%) Discount Rate (8.75%)
Employer's Net Pension Liability 3,515,246$ 2,422,514$ 1,481,232$

‐ 53 ‐
NOTE 8. PUBLIC EMPLOYEES’ RETIREMENT SYSTEM (CONTINUED) Summary of Significant Accounting Policies MPERA prepared financial statements using the accrual basis of accounting. The same accrual basis was used by MPERA
for the purposes of determining the NPL; Deferred Outflows of Resources and Deferred Inflows of Resources related to
pensions; Pension Expense; the Fiduciary Net Position; and, Additions to or Deductions from Fiduciary Net Position.
Member contributions are recognized in the period in which contributions are due. Employer contributions are
recognized when due and the employer has made a formal commitment to provide the contributions. Revenues are
recognized in the accounting period they are earned and become measurable. Benefit payments and refunds are
recognized in the accounting period in which they are due and payable in accordance with the benefit terms. Expenses
are recognized in the period incurred. Investments are reported at fair value. MPERA adhered to all accounting principles
generally accepted by the United States of America. MPERA applied all applicable pronouncements of the Governmental
Accounting Standards Board (GASB).
PERS Disclosure for the Defined Contribution Plan The Authority contributed to the state of Montana Public Employee Retirement System Defined Contribution Retirement
Plan (PERS‐DCRP) for employees that have elected the DCRP. The PERS‐DCRP is administered by the PERB and is reported
as a multiple‐employer plan established July 1, 2002, and governed by Title 19, chapters 2 & 3, MCA.
All new PERS members are initially members of the PERS‐DBRP and have a 12‐month window during which they may
choose to remain in the PERS‐DBRP or join the PERS‐DCRP by filing an irrevocable election. Members may not be
participants of both the defined benefit and defined contribution retirement plans.
Member and employer contribution rates are specified by state law and are a percentage of the member’s
compensation. Contributions are deducted from each member’s salary and remitted by participating employers. The
Montana Legislature has the authority to establish and amend contribution rates.
Benefits are dependent upon eligibility and individual account balances. Participants are vested immediately in their own
contributions and attributable income. Participants are vested after 5 years of membership service for the employer’s
contributions to the individual accounts and the attributable income. Non‐vested contributions are forfeited upon
termination of employment per 19‐3‐2117(5), MCA. Such forfeitures are used to cover the administrative expenses of
the PERS‐DCRP.
At the plan level for the measurement period ended June 30, 2016, the PERS‐DCRP employer did not recognize any net
pension liability or pension expense for the defined contribution plan. Plan level non‐vested forfeitures for the 289
employers that have participants in the PERS‐DCRP totaled $382,656.
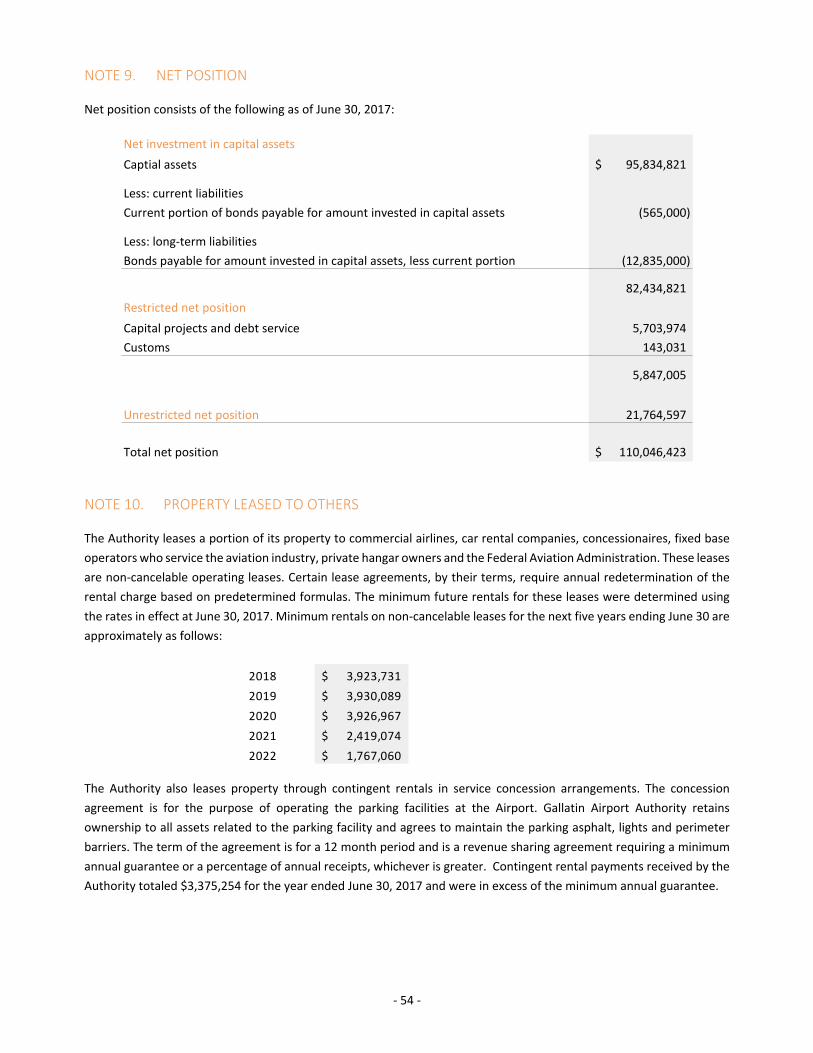
‐ 54 ‐
NOTE 9. NET POSITION Net position consists of the following as of June 30, 2017:
Net investment in capital assets
Captial assets 95,834,821$
Less: current liabilities
Current portion of bonds payable for amount invested in capital assets (565,000)
Less: long‐term liabilities
Bonds payable for amount invested in capital assets, less current portion (12,835,000)
82,434,821
Restricted net position
Capital projects and debt service 5,703,974
Customs 143,031
5,847,005
Unrestricted net position 21,764,597
Total net position 110,046,423$
NOTE 10. PROPERTY LEASED TO OTHERS The Authority leases a portion of its property to commercial airlines, car rental companies, concessionaires, fixed base
operators who service the aviation industry, private hangar owners and the Federal Aviation Administration. These leases
are non‐cancelable operating leases. Certain lease agreements, by their terms, require annual redetermination of the
rental charge based on predetermined formulas. The minimum future rentals for these leases were determined using
the rates in effect at June 30, 2017. Minimum rentals on non‐cancelable leases for the next five years ending June 30 are
approximately as follows:
2018 3,923,731$
2019 3,930,089$
2020 3,926,967$
2021 2,419,074$
2022 1,767,060$ The Authority also leases property through contingent rentals in service concession arrangements. The concession
agreement is for the purpose of operating the parking facilities at the Airport. Gallatin Airport Authority retains
ownership to all assets related to the parking facility and agrees to maintain the parking asphalt, lights and perimeter
barriers. The term of the agreement is for a 12 month period and is a revenue sharing agreement requiring a minimum
annual guarantee or a percentage of annual receipts, whichever is greater. Contingent rental payments received by the
Authority totaled $3,375,254 for the year ended June 30, 2017 and were in excess of the minimum annual guarantee.
‐ 55 ‐
NOTE 11. PASSENGER FACILITY CHARGE PROGRAM In 1990, the United States Congress enacted the Aviation Safety and Capacity Expansion Act (“ASCEA”) of 1990, which
allows public agencies controlling commercial service airports to charge eligible enplaning passengers at the airport a
$1, $2 or $3 passenger facility charge, or PFC. In 2000, the U.S. Congress passed the Aviation Investment and Reform Act
for the 21st Century (“AIR‐21”), which allowed airports to levy a PFC of $4.00 or $4.50 per eligible enplaned passenger.
Gallatin Airport Authority was authorized to impose the PFC beginning August 1, 1993. The Authority will continue to
impose the PFC until "the total net PFC revenues collected plus interest thereon equals the allowable cost of the
approved projects."
Proceeds from PFCs are to be used to finance eligible airport‐related projects that preserve or enhance safety, capacity
or security of the national air transportation system, reduce noise from an airport that is part of such system, or furnish
opportunities for enhanced competition between or among air carriers.
The active PFC approved project during the year ended June 30, 2017 was PFC 09‐05‐C‐00‐BZN. The PFC project No. 09‐
05‐C‐00‐BZN effective July 1, 2011, authorized a charge of $4.50 per enplaned passenger and total project expenditures
of $29,000,000. This project expires March 1, 2029.
NOTE 12. CUSTOMER FACILITY CHARGES Customer facility charges (CFCs) are levied by the Authority pursuant to an agreement with the rental car companies
serving the Authority. The CFC rate was $2.75 per contract rental day through May 31, 2017. The rate was increased to
$4.25 per contract rental day effective June 1, 2017.
NOTE 13. RELATED PARTIES Kevin Kelleher (Board Member) as a member of Sunnyside Storage Condo Association, entered into a 10‐year lease with
the Authority on March 1, 1996. An option for a 10‐year renewal was taken. Lease revenues for the year ended June 30,
2017 were $1,874.
Karen Stelmak (Board Member) and Tom Stelmak entered into a 10‐year lease with the Authority beginning September
1, 1999. An option for a 10‐year renewal was taken. Lease revenues for the year ended June 30, 2017 were $652.
Ted Mathis (Board Member) leases a hangar from the Authority on a month‐to‐month basis. Lease revenues for the year
ended June 30, 2017 were $1,800.
The only amount due to or from any of these related parties as of June 30, 2017 was $105 due from Karen Stelmak.
NOTE 14. CONCENTRATIONS The Gallatin Airport Authority receives a significant portion of its operating revenues from leasing the parking facility.
The revenues from this lease accounted for approximately 26% of operating revenues for the year ended June 30, 2017.

‐ 56 ‐
NOTE 15. COMMITMENT The Authority had entered into an agreement with Gallatin County, City of Belgrade, and Montana Department of
Transportation for the planning and construction of the new Interstate 90 interchange and connector roadways located
in the vicinity of Bozeman Yellowstone International Airport. The Authority had committed funding not‐to‐exceed
$3,000,000 for this project. As of June 30, 2017, this commitment had been substantially met and any remaining liability
has not be determined.
NOTE 16. RISK MANAGEMENT Significant losses for public officials, automobiles, property, and general liability are covered by commercial insurance
policies. There have been no significant reductions in insurance coverage. Insurance coverage for potential losses due to
environmental damages is not available. Therefore, the Authority has no coverage for such potential losses. There have
been no settlements in excess of the insurance coverage in any of the three prior years.
NOTE 17. SUBSEQUENT EVENTS Management has evaluated subsequent events through October 18, 2017, the date on which these financial statements were available to be issued.

Required Supplementary Information – Pension Schedules Year Ended June 30, 2107
‐ 57 ‐
As of Measurement Date 2016 2015 2014
Employer's proportion of the net pension liability 0.1422% 0.1396% 0.1401%
Employer's net pension liability 2,422,514$ 1,951,981$ 1,745,531$
State's Net Pension Liability 29,600$ 23,977$ 21,316$
Total Net Pension Liability 2,452,114$ 1,975,958$ 1,766,847$
Employer's covered payroll 1,703,557$ 1,629,621$ 1,610,223$
Employer's proportionate shareas a percentage as of covered payroll 142.20% 119.78% 111.22%
Plan fiduciary net positionas a percentage Total Pension Liability 74.70% 78.40% 79.90%
As of Most Recent FYE (reporting date) 2017 2016 2015
Contractually required DB contributions 148,936$ 142,393$ 134,287$
Plan Choice Rate required contributions ‐$ 9,383$ 15,244$
Contributions in relation to thecontractually required contributions 148,936$ 151,776$ 149,531$
Contribution deficiency (excess) ‐$ ‐$ ‐$
Employer's covered payroll 1,779,381$ 1,703,557$ 1,629,621$
Contributions as a percentage of covered payroll 8.37% 8.91% 9.18%
* Schedule is intended to show information for 10 years. Additional years will be displayed as they become available.
SCHEDULE OF PROPORTIONATE SHARE OF THE NET PENSION LIABILITY
SCHEDULE OF CONTRIBUTIONS
Notes to the Required Supplementary Information Year Ended June 30, 2107
‐ 58 ‐
CHANGES IN BENEFIT TERMS The following changes to the plan provision were made as identified: 2013 Legislative Changes: House Bill 454 – Permanent Injunction Limits Application of the GABA Reduction passed under HB 454
Guaranteed Annual Benefit Adjustment (GABA)
After the member has completed 12 full months of retirement, the member’s benefit increases by the applicable
percentage (provided below) each January, inclusive of all other adjustments to the member’s benefit.
• 3% for members hired prior to July 1, 2007
• 1.5% for members hired on or after July 1, 2007 and before July 1, 2013
• Members hired on or after July 1, 2013
a. 1.5% each year PERS is funded at or above 90%;
b. 1.5% is reduced by 0.1% for each 2% PERS is funded below 90%; and,
c. 0% whenever the amortization period for PERS is 40 years or more.
2015 Legislative Changes: General revisions – House Bill 101, effective January 1, 2016
Second Retirement Benefit
I. Applies to PERS members who return to active service on or after January 1, 2016. Members who retire before
January 1, 2016, return to PERS‐covered employment, and accumulate less than 2 years of service credit before
retiring again:
• refund of member’s contributions from second employment plus regular interest (currently 0.25%);
• no service credit for second employment;
• start same benefit amount the month following termination; and
• GABA starts again in the January immediately following second retirement.
II. For members who retire before January 1, 2016, return to PERS‐covered employment and accumulate two or
more years of service credit before retiring again:
• members receive a recalculated retirement benefit based on laws in effect at second retirement; and,
• GABA starts in the January after receiving recalculated benefit for 12 months.
III. For members who retire on or after January 1, 2016, return to PERS‐covered employment and accumulate less
than 5 years of service credit before retiring again:
• refund of member’s contributions from second employment plus regular interest (currently 0.25%);
• no service credit for second employment;
• start same benefit amount the month following termination; and,
• GABA starts again in the January immediately following second retirement.

‐ 59 ‐
IV. For members who retire on or after January 1, 2016, return to PERS‐covered employment and accumulate five
or more years of service credit before retire again:
• member receives same retirement benefit as prior to return to service;
• member receives second retirement benefit for second period of service based on laws in effect at
second retirement; and
• GABA starts on both benefits in January after member receives original and new benefit for 12 months.
Revised DC Funding Laws – House Bill 107, effective January 1, 2015
Employer Contributions and the Defined Contribution Plan
The PCR was paid off effective March 2016 and the contributions of 2.37%, .47%, and the 1.0% increase previously
directed to the PCR are now directed to the Defined Contribution member’s account.
CHANGE IN ACTUARIAL ASSUMPTIONS AND METHODS
Method and assumptions used in calculations of actuarially determined contributions The following addition was adopted in 2014 based upon implementation of GASB 68:
• Admin Expense as % of Payroll 0.27%
There were no changes following the 2013 Economic Experience study. The following Actuarial Assumptions were adopted from the June 2010 Experience Study:
• General Wage Growth * 4.00%
* includes inflation at 3.00%
• Merit increase 0% to 6.0%
• Investment rate of return 7.75 percent, net of pension plan investment
expense, and including inflation
• Asset valuation method 4‐year smoothed market
• Actuarial cost method Entry age
• Amortization method Level percentage of pay, open

‐ 60 ‐

‐ 61 ‐
STATISTICAL SECTION
‐ Statistical section introduction
‐ Net position and changes in net positon
‐ Changes in cash and cash equivalents
‐ Operating revenues, airline cost per enplanement,
and airline rates
‐ Debt service, coverages, and ratios
‐ Aircraft operations and total passengers
‐ Enplanements and load factor by air carrier
‐ Budgeted employees by department
‐ Insurance coverage
‐ Airport information
‐ Demographic and economic statistics
‐ Principal employers in region
Statistical Section Introduction
‐ 62 ‐
The Statistical Section presents detailed information as a context for understanding what the information in the financial
statements, note disclosures, and required supplementary information says about the Authority’s overall financial
health. Unless otherwise noted, the information in these schedules is derived from the financial statements for the
relevant year.
Contents Page
Financial Trends ................................................................................................................................................................. 63
These schedules contain trend information to help the reader understand how the
Authority’s financial performance and well‐being have changed over time.
Revenue Capacity .............................................................................................................................................................. 65
This schedule contains information to help the reader assess the Authority’s
significant revenue sources.
Debt Capacity .................................................................................................................................................................... 66
This schedule presents information to help the users understand and asses the
Authority’s outstanding debt and its ability to cover and issue additional debt.
Operating Information ...................................................................................................................................................... 67
These schedules present contextual information about the Authority’s operations and
resources to help users to understand and assess the Authority’s economic condition.
Demographic and Economic Information ......................................................................................................................... 72
These schedules contain information to help users understand the socio‐economic
environment in which the Authority operates.
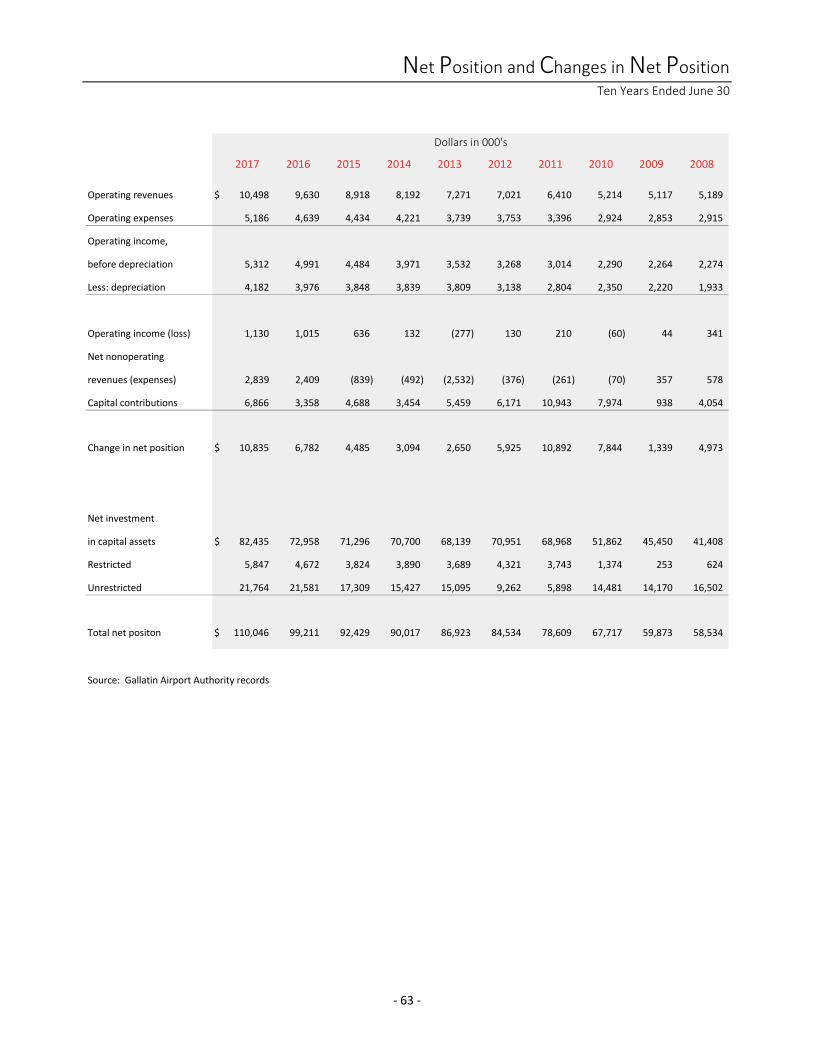
Net Position and Changes in Net Position Ten Years Ended June 30
‐ 63 ‐
2017 2016 2015 2014 2013 2012 2011 2010 2009 2008
Operating revenues $ 10,498 9,630 8,918 8,192 7,271 7,021 6,410 5,214 5,117 5,189
Operating expenses 5,186 4,639 4,434 4,221 3,739 3,753 3,396 2,924 2,853 2,915
Operating income,
before depreciation 5,312 4,991 4,484 3,971 3,532 3,268 3,014 2,290 2,264 2,274
Less: depreciation 4,182 3,976 3,848 3,839 3,809 3,138 2,804 2,350 2,220 1,933
Operating income (loss) 1,130 1,015 636 132 (277) 130 210 (60) 44 341
Net nonoperating
revenues (expenses) 2,839 2,409 (839) (492) (2,532) (376) (261) (70) 357 578
Capital contributions 6,866 3,358 4,688 3,454 5,459 6,171 10,943 7,974 938 4,054
Change in net position $ 10,835 6,782 4,485 3,094 2,650 5,925 10,892 7,844 1,339 4,973
Net investment
in capital assets $ 82,435 72,958 71,296 70,700 68,139 70,951 68,968 51,862 45,450 41,408
Restricted 5,847 4,672 3,824 3,890 3,689 4,321 3,743 1,374 253 624
Unrestricted 21,764 21,581 17,309 15,427 15,095 9,262 5,898 14,481 14,170 16,502
Total net positon $ 110,046 99,211 92,429 90,017 86,923 84,534 78,609 67,717 59,873 58,534
Source: Gallatin Airport Authority records
Dollars in 000's
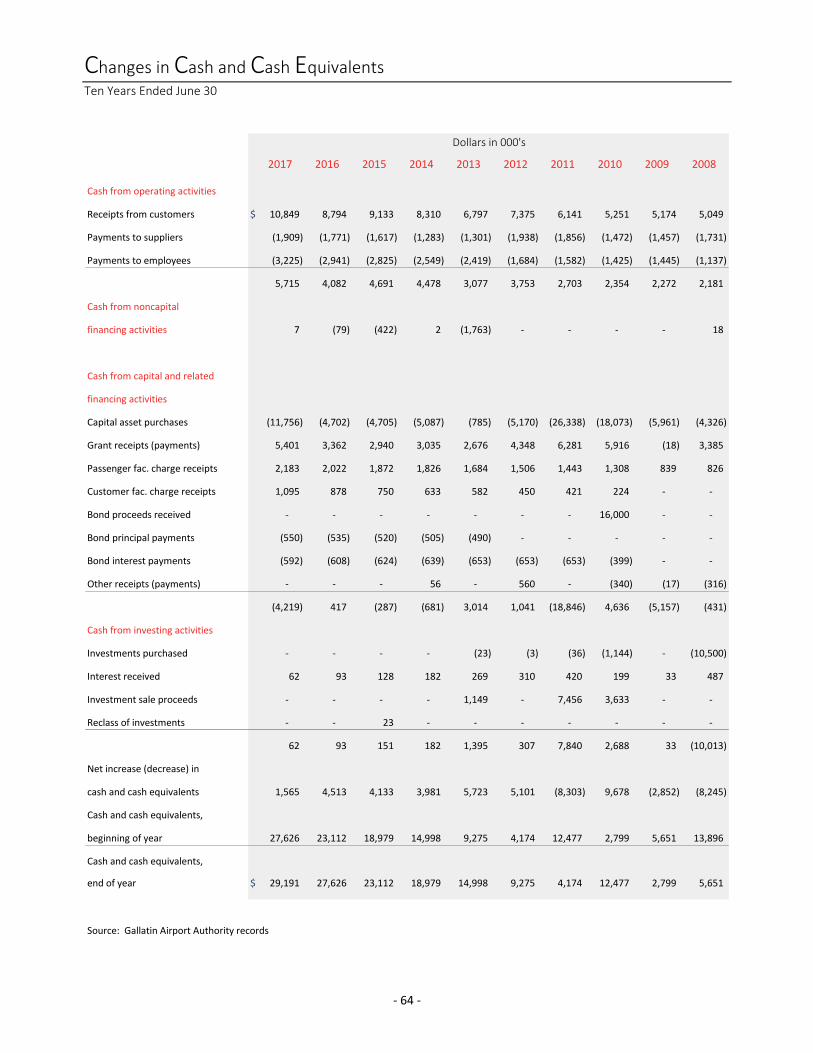
Changes in Cash and Cash Equivalents Ten Years Ended June 30
‐ 64 ‐
2017 2016 2015 2014 2013 2012 2011 2010 2009 2008
Cash from operating activities
Receipts from customers $ 10,849 8,794 9,133 8,310 6,797 7,375 6,141 5,251 5,174 5,049
Payments to suppliers (1,909) (1,771) (1,617) (1,283) (1,301) (1,938) (1,856) (1,472) (1,457) (1,731)
Payments to employees (3,225) (2,941) (2,825) (2,549) (2,419) (1,684) (1,582) (1,425) (1,445) (1,137)
5,715 4,082 4,691 4,478 3,077 3,753 2,703 2,354 2,272 2,181
Cash from noncapital
financing activities 7 (79) (422) 2 (1,763) ‐ ‐ ‐ ‐ 18
Cash from capital and related
financing activities
Capital asset purchases (11,756) (4,702) (4,705) (5,087) (785) (5,170) (26,338) (18,073) (5,961) (4,326)
Grant receipts (payments) 5,401 3,362 2,940 3,035 2,676 4,348 6,281 5,916 (18) 3,385
Passenger fac. charge receipts 2,183 2,022 1,872 1,826 1,684 1,506 1,443 1,308 839 826
Customer fac. charge receipts 1,095 878 750 633 582 450 421 224 ‐ ‐
Bond proceeds received ‐ ‐ ‐ ‐ ‐ ‐ ‐ 16,000 ‐ ‐
Bond principal payments (550) (535) (520) (505) (490) ‐ ‐ ‐ ‐ ‐
Bond interest payments (592) (608) (624) (639) (653) (653) (653) (399) ‐ ‐
Other receipts (payments) ‐ ‐ ‐ 56 ‐ 560 ‐ (340) (17) (316)
(4,219) 417 (287) (681) 3,014 1,041 (18,846) 4,636 (5,157) (431)
Cash from investing activities
Investments purchased ‐ ‐ ‐ ‐ (23) (3) (36) (1,144) ‐ (10,500)
Interest received 62 93 128 182 269 310 420 199 33 487
Investment sale proceeds ‐ ‐ ‐ ‐ 1,149 ‐ 7,456 3,633 ‐ ‐
Reclass of investments ‐ ‐ 23 ‐ ‐ ‐ ‐ ‐ ‐ ‐
62 93 151 182 1,395 307 7,840 2,688 33 (10,013)
Net increase (decrease) in
cash and cash equivalents 1,565 4,513 4,133 3,981 5,723 5,101 (8,303) 9,678 (2,852) (8,245)
Cash and cash equivalents,
beginning of year 27,626 23,112 18,979 14,998 9,275 4,174 12,477 2,799 5,651 13,896
Cash and cash equivalents,
end of year $ 29,191 27,626 23,112 18,979 14,998 9,275 4,174 12,477 2,799 5,651
Source: Gallatin Airport Authority records
Dollars in 000's

Operating Revenues, Airline Cost Per Enplanement, and Airline Rates Ten Years Ended June 30
‐ 65 ‐
2017 2016 2015 2014 2013 2012 2011 2010 2009 2008
Airline Revenues
Landing fees $ 624 619 605 573 571 556 521 466 478 524
Terminal rentals 895 848 853 818 791 788 737 692 719 678
1,519 1,467 1,458 1,391 1,362 1,344 1,258 1,158 1,197 1,202
Non‐airline Revenues
Rental car 3,218 2,743 2,624 2,416 2,095 2,071 1,962 1,574 1,550 1,609
Parking 2,753 2,590 2,396 2,113 1,819 1,674 1,433 1,090 1,107 1,060
Other terminal rents
and concessions 1,465 1,384 1,110 1,030 924 829 626 473 463 472
General aviation 617 570 519 482 462 454 458 437 415 474
Air cargo 43 41 39 38 38 37 37 37 31 29
Other 883 834 772 722 571 612 637 444 353 341
Total operating revenues $ 10,498 9,629 8,918 8,192 7,271 7,021 6,411 5,213 5,116 5,187
Scheduled enplanements 572 529 498 456 439 407 385 364 343 351
Airline cost per enplanement $ 2.66 2.77 2.93 3.05 3.11 3.30 3.27 3.18 3.49 3.42
Airline Rates
Landing fee (per 1,000 lbs.
over 12,500 GLW) $ 1.02 1.06 1.06 1.14 1.11 1.11 1.15 1.12 1.12 1.03
Terminal rents
(per sq. ft. per year):
Finished $ 22.27 22.27 22.27 22.27 22.27 22.27 22.27 21.62 21.06 21.89
Unfinished $ 12.97 12.97 12.97 12.97 12.97 12.97 12.97 12.97 12.97 12.97
Jetway rent (per use) $ 10.00 10.00 10.00 10.00 10.00 10.00 10.00 10.00 10.00 10.00
Source: Gallatin Airport Authority records
Revenues and Enplanements in 000's

Debt Service, Coverages, and Ratios Ten Years Ended June 30
‐ 66 ‐
2017 2016 2015 2014 2013 2012 2011 2010 2009 2008
Outstanding debt
2009 revenue bonds $ 13,400 13,950 14,485 15,005 15,510 16,000 16,000 16,000 ‐ ‐
Enplaned passengers 574 531 500 458 440 408 386 365 343 351
Outstanding debt per
enplaned passenger $ 23.34 26.27 28.97 32.76 35.25 39.22 41.45 43.84 ‐ ‐
Principal $ 550 535 520 505 490 ‐ ‐ ‐ ‐ ‐
Interest 592 608 624 639 653 653 653 399 ‐ ‐
Debt service
2009 revenue bonds $ 1,142 1,143 1,144 1,144 1,143 653 653 399 ‐ ‐
Net revenues available
for debt service $ 8,151 7,400 5,584 5,245 2,713 4,491 4,243 3,518 3,592 3,670
Debt service * 1,142 1,143 1,144 1,144 1,143 653 653 399 ‐ ‐
Debt service coverage $ 7.14 6.47 4.88 4.59 2.37 6.87 6.49 8.81 0.00 0.00
* There was no outstanding debt in fiscal years 2008 and 2009
Source: Gallatin Airport Authority records
Dollars and Enplanements in 000's

Aircraft Operations and Total Passengers Ten Years Ended June 30
‐ 67 ‐
2017 2016 2015 2014 2013 2012 2011 2010 2009 2008
Aircraft Operations
Air carrier 10,735 9,990 10,388 8,642 8,708 7,908 7,587 7,307 7,815 8,261
Air taxi 9,009 8,923 8,336 9,454 9,222 9,470 10,385 9,269 9,189 10,952
GA itinerant 31,108 30,456 30,135 28,178 27,875 28,387 25,828 26,608 27,608 31,931
Military 297 340 220 315 262 285 173 264 255 635
Total itinerant 51,149 49,709 49,079 46,589 46,067 46,050 43,973 43,448 44,867 51,779
GA local 25,794 30,920 30,653 31,893 30,770 36,066 26,050 23,693 30,012 30,478
Total aircraft
operations 76,943 80,629 79,732 78,482 76,837 82,116 70,023 67,141 74,879 82,257
Total Passengers
Enplanements 573,767 530,903 499,977 457,716 440,203 408,199 386,092 365,210 342,714 351,214
Deplanements 574,580 529,829 497,664 459,844 437,043 409,910 385,157 362,838 340,563 351,281
Total passengers 1,148,347 1,060,732 997,641 917,560 877,246 818,109 771,249 728,048 683,277 702,495
Growth 8.3% 6.3% 8.7% 4.6% 7.2% 6.1% 5.9% 6.6% ‐2.7% 4.7%
Source: Gallatin Airport Authority records
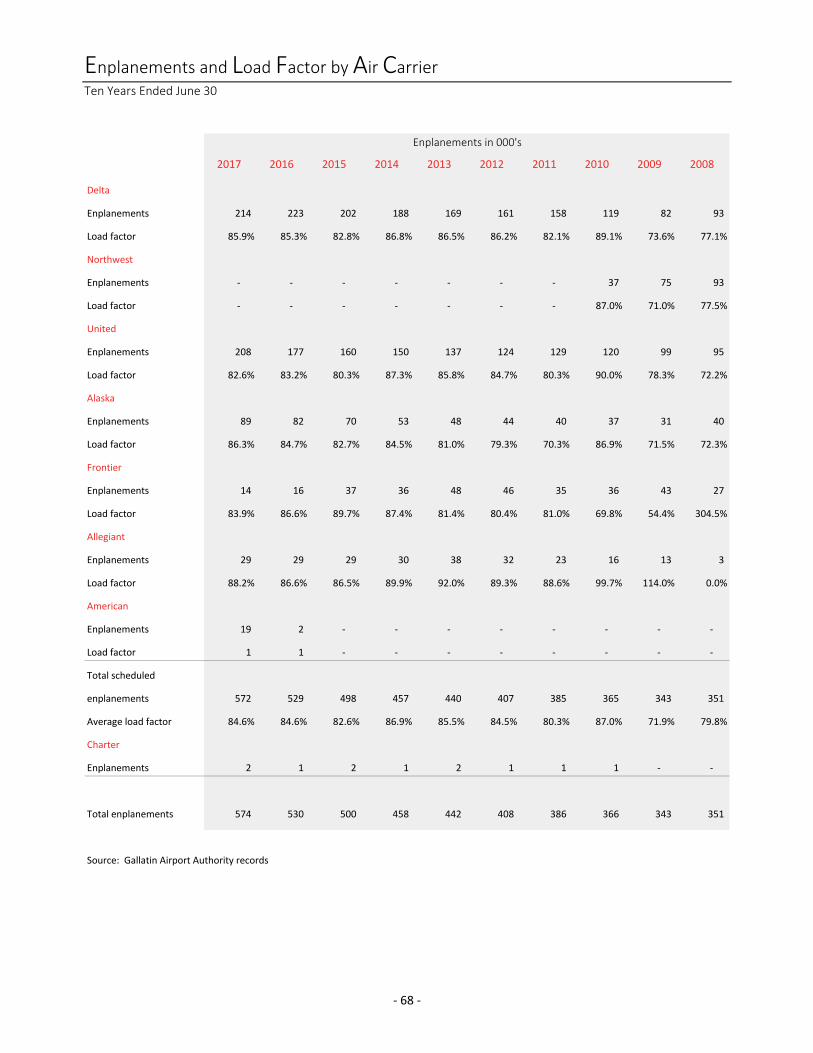
Enplanements and Load Factor by Air Carrier Ten Years Ended June 30
‐ 68 ‐
2017 2016 2015 2014 2013 2012 2011 2010 2009 2008
Delta
Enplanements 214 223 202 188 169 161 158 119 82 93
Load factor 85.9% 85.3% 82.8% 86.8% 86.5% 86.2% 82.1% 89.1% 73.6% 77.1%
Northwest
Enplanements ‐ ‐ ‐ ‐ ‐ ‐ ‐ 37 75 93
Load factor ‐ ‐ ‐ ‐ ‐ ‐ ‐ 87.0% 71.0% 77.5%
United
Enplanements 208 177 160 150 137 124 129 120 99 95
Load factor 82.6% 83.2% 80.3% 87.3% 85.8% 84.7% 80.3% 90.0% 78.3% 72.2%
Alaska
Enplanements 89 82 70 53 48 44 40 37 31 40
Load factor 86.3% 84.7% 82.7% 84.5% 81.0% 79.3% 70.3% 86.9% 71.5% 72.3%
Frontier
Enplanements 14 16 37 36 48 46 35 36 43 27
Load factor 83.9% 86.6% 89.7% 87.4% 81.4% 80.4% 81.0% 69.8% 54.4% 304.5%
Allegiant
Enplanements 29 29 29 30 38 32 23 16 13 3
Load factor 88.2% 86.6% 86.5% 89.9% 92.0% 89.3% 88.6% 99.7% 114.0% 0.0%
American
Enplanements 19 2 ‐ ‐ ‐ ‐ ‐ ‐ ‐ ‐
Load factor 1 1 ‐ ‐ ‐ ‐ ‐ ‐ ‐ ‐
Total scheduled
enplanements 572 529 498 457 440 407 385 365 343 351
Average load factor 84.6% 84.6% 82.6% 86.9% 85.5% 84.5% 80.3% 87.0% 71.9% 79.8%
Charter
Enplanements 2 1 2 1 2 1 1 1 ‐ ‐
Total enplanements 574 530 500 458 442 408 386 366 343 351
Source: Gallatin Airport Authority records
Enplanements in 000's

Budgeted Employees by Department Ten Years Ended June 30
‐ 69 ‐
Airport Building
Maintenance Maintenance Public
& ARFF & Custodial Safety Administration Total
15 8 7 5 35
12 8 7 5 32
12 7 7 5 31
12 7 7 5 31
11 7 7 5 30
11 7 7 5 30
11 7 7 5 30
10 6 6 5 27
10 6 6 4 26
10 6 ‐ 4 20
Source: Gallatin Airport Authority's operating budget records
Year
2017
2016
2015
2014
2008
2013
2012
2011
2010
2009

Insurance Coverage As of June 30, 2017
‐ 70 ‐
Policy Type Insurer Coverage Expiration
Buildings Cincinnati Insurance 67,548,728$ 8/10/2017
Business personal property Cincinnati Insurance 1,137,747$ 8/10/2017
Automobile Cincinnati Insurance 1,000,000$ 8/10/2017
Umbrella Cincinnati Insurance 3,000,000$ 8/10/2017
Mobile equipment Cincinnati Insurance 281,700$ 8/10/2017
Employee theft Cincinnati Insurance 50,000$ 8/10/2017
Employment practices Cincinnati Insurance 1,000,000$ 8/10/2017
Directors & officers Cincinnati Insurance 1,000,000$ 8/10/2017
Aviation Ace Property and Casualty 60,000,000$ 8/10/2017
Law enforcement Allied World 1,000,000$ 8/10/2017
Source: Gallatin Airport Authority records

Airport Information Year Ended June 30, 2017
‐ 71 ‐
Location: 9 miles northwest of Bozeman, MT
Area: Fee title 1,959 acres
Easement controlled 1,334 acres
State lease 93 acres
Total 3,386 acres
Airport code: BZN
Elevation: 4,475'
Runways: 12/30 Paved 8,994' x 150'
03/21 Paved 2,650' x 75'
11/29 Turf 3,197' x 80'
11/29 Paved (U.C.) 5,050' x 75'
Terminal: 205,000 sq. ft.
Terminal apron: 671,150 sq. ft.
Parking spaces: Pay parking Long‐term 1,483
Pay parking short‐term 355
Rental car ‐ ready 275
Rental car ‐ return 332
Total rental car 607
Employee parking 271
Total 3,323
Apron areas: Terminal 755,765 sq. ft.
Old terminal 66,829 sq. ft.
General aviation 621,870 sq. ft.
Tie‐down 125,985 sq. ft.
East ramp 610,385 sq. ft.
Total 2,180,834 sq. ft.
Based aircraft: Sailplane 11
Single engine (piston) 252
Twin engine (piston) 17
Single engine (turboprop) 8
Twin engine (turboprop) 7
Single engine (jet) 4
Multi engine (jet) 38
Helicopter 23
Total 360
Hangars: 193
Fixed based operators: Arlin's Aircraft
Yellowstone Jetcenter
International: U.S. Customs User Fee Facility
Source: Gallatin Airport Authority records

Demographic and Economic Statistics Ten Years Ended June 30
‐ 72 ‐
Year Population
Per Capita
Personal
Income
Personal
Income
(in 000's)
Unemployment
Rate
2017 unavailable unavailable unavailable unavailable
2016 104,502 unavailable unavailable 2.7%
2015 100,739 46,337 4,667,943 2.9%
2014 97,308 42,350 4,120,994 2.9%
2013 94,694 41,137 3,895,427 3.4%
2012 92,604 40,653 3,764,630 4.4%
2011 91,333 38,058 3,475,951 5.1%
2010 89,599 35,477 3,178,704 5.8%
2009 90,343 34,710 3,135,806 6.0%
2008 89,812 36,383 3,267,630 3.6%
Year Population
Per Capita
Personal
Income
Personal
Income
(in 000's)
Unemployment
Rate
2017 unavailable unavailable unavailable 3.9%
2016 1,042,646 42,386 44,193,593 4.2%
2015 1,032,949 41,280 42,640,135 4.1%
2014 1,023,579 39,903 40,843,873 4.7%
2013 1,014,864 38,884 39,461,972 5.4%
2012 1,005,163 39,102 39,303,884 6.1%
2011 997,661 36,959 36,872,553 7.0%
2010 990,575 34,737 34,409,604 7.3%
2009 974,989 33,627 32,785,955 6.9%
2008 968,035 34,912 33,796,038 4.9%
Sources:
Census Bureau
Bureau of Economic Analysis
MONTANA
GALLATIN COUNTY

Principal Employers in Region Year Ended June 30, 2017
‐ 73 ‐
Private Employers
By Class
Number of
Employees
Private Employers
By Class
Number of
Employees
Bozeman Deaconess Hospital 1,000 + Bozeman Deaconess Hospital 1,000 +
Oracle America 250 to 499 Albertson's 250 to 499
Town Pump Convenience Stores 250 to 499 Right Now Technologies 250 to 499
Wal Mart 250 to 499 Wal Mart 250 to 499
Albertson's 100 to 249 Zoot Enterprises 250 to 499
Barnard Construction 100 to 249 Bay Bar and Grill 100 to 249
Best Western Gran Tree Inn 100 to 249 Bozeman Daily Chronicle 100 to 249
Bridger Bowl 100 to 249 Community Food Co‐Op 100 to 249
Community Food Co‐Op 100 to 249 Costco 100 to 249
Costco 100 to 249 JTL Group 100 to 249
First Student 100 to 249 Kenyon Noble Lumber & Hardware 100 to 249
JC Billion 100 to 249 Laidlaw Transit 100 to 249
Kenyon Noble Lumber & Hardware 100 to 249 Martel Construction 100 to 249
Korman Marking Group 100 to 249 McDonalds 100 to 249
Martel Construction 100 to 249 Murdoch's Ranch & Home Supply 100 to 249
McDonalds 100 to 249 On Site Management 100 to 249
Murdoch's Ranch & Home Supply 100 to 249 Ressler Motors 100 to 249
Ressler Motors 100 to 249 Riverside Country Club 100 to 249
Rosauers Super Markets 100 to 249 Simkin Hallin Lumber 100 to 249
Target 100 to 249 Williams Plumbing & Heating 100 to 249
Public Employers
By Class
Number of
Employees
Public Employers
By Class
Number of
Employees
Montana State University 1,000 + Montana State University 1,000 +
School District #7 1,000 + School District #7 1,000 +
City of Bozeman 250 to 499 City of Bozeman 250 to 499
Gallatin County 250 to 499 Gallatin County 250 to 499
* 2016 information is presented for current year and is the most recent available
Region is defined as Gallatin County
Source: Montana Department of Labor & Industry
Current Year * 2008

‐ 74 ‐
Photo courtesy of Summit Aviation

‐ 75 ‐
COMPLIANCE SECTION
‐ Independent auditor’s report on internal control over
financial reporting and on compliance and other matters
based on an audit of financial statements performed in
accordance with Government Auditing Standards
‐ Independent auditor’s report on compliance for each major
program and on internal control over compliance required by
the Uniform Guidance
‐ Schedule of expenditures of federal awards
‐ Schedule of findings and questioned costs
‐ Independent auditor's report on compliance with
requirements that could have a direct and material effect on
the passenger facility charge program and on internal control
over compliance applicable to the passenger facility charge
program
‐ Schedule of passenger facility charge collections, interest and
disbursements

‐ 76 ‐
INDEPENDENT AUDITOR’S REPORT ON INTERNAL CONTROL OVER FINANCIAL REPORTING AND ON COMPLIANCE AND OTHER MATTERS BASED ON AN AUDIT
OF FINANCIAL STATEMENTS PERFORMED IN ACCORDANCE WITH GOVERNMENT AUDITING STANDARDS
To the Board of Commissioners Gallatin Airport Authority Belgrade, Montana We have audited, in accordance with the auditing standards generally accepted in the United States of America and the standards applicable to financial audits contained in Government Auditing Standards issued by the Comptroller General of the United States, the financial statements of Gallatin Airport Authority (Authority), as of and for the year ended June 30, 2017, and the related notes to the financial statements, which collectively comprise Gallatin Airport Authority’s basic financial statements, and have issued our report thereon dated October 18, 2017.
Internal Control over Financial Reporting In planning and performing our audit of the financial statements, we considered the Authority’s internal control over financial reporting (internal control) to determine the audit procedures that are appropriate in the circumstances for the purpose of expressing our opinion on the financial statements, but not for the purpose of expressing an opinion on the effectiveness of the Authority’s internal control. Accordingly, we do not express an opinion on the effectiveness of the Authority’s internal control. A deficiency in internal control exists when the design or operation of a control does not allow management or employees, in the normal course of performing their assigned functions, to prevent, or detect and correct, misstatements on a timely basis. A material weakness is a deficiency, or a combination of deficiencies, in internal control, such that there is a reasonable possibility that a material misstatement of the entity’s financial statements will not be prevented, or detected and corrected on a timely basis. A significant deficiency is a deficiency, or a combination of deficiencies, in internal control that is less severe than a material weakness, yet important enough to merit attention by those charged with governance. Our consideration of internal control was for the limited purpose described in the first paragraph of this section and was not designed to identify all deficiencies in internal control that might be material weaknesses or significant deficiencies. Given these limitations, during our audit we did not identify any deficiencies in internal control that we consider to be material weaknesses. However, material weaknesses may exist that have not been identified.
Compliance and Other Matters As part of obtaining reasonable assurance about whether the Authority’s financial statements are free from material misstatement, we performed tests of its compliance with certain provisions of laws, regulations, contracts, and grant agreements, noncompliance with which could have a direct and material effect on the determination of financial statement amounts. However, providing an opinion on compliance with those provisions was not an objective of our audit, and accordingly, we do not express such an opinion. The results of our tests disclosed no instances of noncompliance or other matters that are required to be reported under Government Auditing Standards.
holmes & turner A PROFESSIONAL CORPORATION
C E R T I F I E D P U B L I C A C C O U N T A N T S M E MB E R S O F C PA A S S OC I A T E S I N T E R N A T I O N A L , I N C .
1 28 3 N O R T H 1 4 T H S T R E E T , S U I T E 2 0 1 B OZ E M A N , M ON T A N A 5 9 7 1 5 ( 40 6 ) 5 87 -4 265 F A X ( 40 6 ) 5 86 -3 11 1

‐ 77 ‐
October 18, 2017 Gallatin Airport Authority Page two
Purpose of this Report The purpose of this report is solely to describe the scope of our testing of internal control and compliance and the results of that testing, and not to provide an opinion on the effectiveness of the entity’s internal control or on compliance. This report is an integral part of an audit performed in accordance with Government Auditing Standards in considering the entity’s internal control and compliance. Accordingly, this communication is not suitable for any other purpose. October 18, 2017
C E R T I F I E D P U B L I C A C C O U N T A N T S
HOLMES & TURNER
‐ 78 ‐
INDEPENDENT AUDITOR’S REPORT ON COMPLIANCE FOR EACH MAJOR PROGRAM AND ON INTERNAL CONTROL
OVER COMPLIANCE REQUIRED BY THE UNIFORM GUIDANCE To the Board of Commissioners Gallatin Airport Authority Belgrade, Montana
Report on Compliance for the Major Federal Program We have audited Gallatin Airport Authority’s (Authority) compliance with the types of compliance requirements described in the OMB Compliance Supplement that could have a direct and material effect on the Authority’s major federal program for the year ended June 30, 2017. The Authority’s major federal program is identified in the summary of auditor's results section of the accompanying schedule of findings and questioned costs.
Management's Responsibility Management is responsible for compliance with federal statutes, regulations, and the terms and conditions of its federal awards applicable to its federal programs.
Auditor's Responsibility Our responsibility is to express an opinion on compliance for the Authority’s major federal program based on our audit of the types of compliance requirements referred to above. We conducted our audit of compliance in accordance with auditing standards generally accepted in the United States of America; the standards applicable to financial audits contained in Government Auditing Standards, issued by the Comptroller General of the United States; and the audit requirements of Title 2 U.S. Code of Federal Regulations (CFR) Part 200, Uniform Administrative Requirements, Cost Principles, and Audit Requirements for Federal Awards (Uniform Guidance). Those standards and the Uniform Guidance require that we plan and perform the audit to obtain reasonable assurance about whether noncompliance with the types of compliance requirements referred to above that could have a direct and material effect on a major federal program occurred. An audit includes examining, on a test basis, evidence about the Authority’s compliance with those requirements and performing such other procedures as we considered necessary in the circumstances. We believe that our audit provides a reasonable basis for our opinion on compliance for the major federal program. However, our audit does not provide a legal determination of the Authority’s compliance.
Opinion on the Major Federal Program In our opinion, the Authority complied, in all material respects, with the types of compliance requirements referred to above that could have a direct and material effect on its major federal program for the year ended June 30, 2017.
holmes & turner A PROFESSIONAL CORPORATION
C E R T I F I E D P U B L I C A C C O U N T A N T S M E MB E R S O F C PA A S S OC I A T E S I N T E R N A T I O N A L , I N C .
1 28 3 N O R T H 1 4 T H S T R E E T , S U I T E 2 0 1 B OZ E M A N , M ON T A N A 5 9 7 1 5 ( 40 6 ) 5 87 -4 265 F A X ( 40 6 ) 5 86 -3 11 1
‐ 79 ‐
October 18, 2017 Gallatin Airport Authority Page two
Report on Internal Control over Compliance Management of the Authority is responsible for establishing and maintaining effective internal control over compliance with the types of compliance requirements referred to above. In planning and performing our audit of compliance, we considered the Authority’s internal control over compliance with the types of requirements that could have a direct and material effect on the major federal program to determine the auditing procedures that are appropriate in the circumstances for the purpose of expressing an opinion on compliance for the major federal program and to test and report on internal control over compliance in accordance with the Uniform Guidance, but not for the purpose of expressing an opinion on the effectiveness of internal control over compliance. Accordingly, we do not express an opinion on the effectiveness of the Authority’s internal control over compliance. A deficiency in internal control over compliance exists when the design or operation of a control over compliance does not allow management or employees, in the normal course of performing their assigned functions, to prevent, or detect and correct, noncompliance with a type of compliance requirement of a federal program on a timely basis. A material weakness in internal control over compliance is a deficiency, or combination of deficiencies, in internal control over compliance, such that there is a reasonable possibility that material noncompliance with a type of compliance requirement of a federal program will not be prevented, or detected and corrected, on a timely basis. A significant deficiency in internal control over compliance is a deficiency, or a combination of deficiencies, in internal control over compliance with a type of compliance requirement of a federal program that is less severe than a material weakness in internal control over compliance, yet important enough to merit attention by those charged with governance. Our consideration of internal control over compliance was for the limited purpose described in the first paragraph of this section and was not designed to identify all deficiencies in internal control over compliance that might be material weaknesses or significant deficiencies. We did not identify any deficiencies in internal control over compliance that we consider to be material weaknesses. However, material weaknesses may exist that have not been identified. The purpose of this report on internal control over compliance is solely to describe the scope of our testing of internal control over compliance and the results of that testing based on the requirements of the Uniform Guidance. Accordingly, this report is not suitable for any other purpose. October 18, 2017
C E R T I F I E D P U B L I C A C C O U N T A N T S
HOLMES & TURNER

Schedule of Expenditures of Federal Awards Year Ended June 30, 2017
‐ 80 ‐
CFDA Federal
Federal Source / Program Number Expenditures
U.S. DEPARTMENT OF TRANSPORTATION
Small Community Air Service Development 20.930 163,742$
Federal Aviation Administration ‐
Airport Improvement Program (AIP)
Project No. 3‐30‐0010‐42 20.106 4,789
Project No. 3‐30‐0010‐44 20.106 800
Project No. 3‐30‐0010‐45 20.106 3,397,182
Project No. 3‐30‐0010‐46 20.106 2,934,703
Project No. 3‐30‐0010‐47 20.106 528,465
Total U.S. Dept. of Transportation 7,029,681$
Total expenditures of federal awards 7,029,681$
Notes to Schedule of Expenditures of Federal Awards
SUMMARY OF SIGNIFICANT ACCOUNTING POLICIES
Basis of Accounting:
This schedule was prepared on the same basis of accounting as the financial statements (see Note 1).
The schedule of expenditures of federal awards for the year ended June 30, 2017 has been subjected to the applicable
compliance testing requirements prescribed by the Uniform Guidance.

Schedule of Findings and Questioned Cost Year Ended June 30, 2017
‐ 81 ‐
I. SUMMARY OF AUDITOR’S RESULTS
Financial Statements Type of audit report issued: Unmodified Internal control over financial reporting:
Significant deficiency disclosed? No
Material weaknesses disclosed? No
Material noncompliance disclosed? No
Federal Awards Type of auditor’s report on compliance for the major federal program: Unmodified Internal control over the major program:
Significant deficiency disclosed? No
Material weaknesses disclosed? No Audit findings that are required to be reported in accordance with 2 CFR Section 200.516(a)? No Identification of major program: Airport Improvement Program (AIP) CFDA 20.106 Dollar threshold to distinguish between Type A and Type B programs: $750,000 Auditee qualifies as a low‐risk auditee? Yes
II. FINANCIAL STATEMENT FINDINGS
None reported
III. FEDERAL AWARDS FINDINGS AND QUESTIONED COSTS
None reported
‐ 82 ‐
INDEPENDENT AUDITOR’S REPORT ON COMPLIANCE WITH REQUIREMENTS THAT COULD HAVE A DIRECT AND MATERIAL EFFECT ON THE PASSENGER
FACILITY CHARGE PROGRAM AND ON INTERNAL CONTROL OVER COMPLIANCE APPLICABLE TO THE PASSENGER FACILITY CHARGE PROGRAM
Board of Commissioners Gallatin Airport Authority Belgrade, Montana
Report on Compliance for the Passenger Facility Charge Program We have audited Gallatin Airport Authority’s (the Authority) compliance with the types of compliance requirements described in the Passenger Facility Charge Audit Guide for Public Agencies, issued by the Federal Aviation Administration (Guide) that could have a direct and material effect on its passenger facility charge (PFC) program for the year ended June 30, 2017.
Management’s Responsibility Management is responsible for compliance with the requirements of laws and regulations applicable to passenger facility charges program.
Auditor’s Responsibility Our responsibility is to express an opinion on compliance for the Authority’s PFC program based on our audit of the types of compliance requirements referred to above. We conducted our audit of compliance in accordance with auditing standards generally accepted in the United States of America; the standards applicable to financial audits contained in Governmental Auditing Standards issued by the Comptroller General of the United States; and the Passenger Facility Charge Audit Guide for Public Agencies. Those standards require that we plan and perform the audit to obtain reasonable assurance about whether noncompliance with the types of compliance requirements referred to above that could have a direct and material effect on the passenger facility charge program occurred. An audit includes examining, on a test basis, evidence about the Authority’s compliance with those requirements and performing such other procedures we considered necessary in the circumstances. We believe that our audit provides a reasonable basis for our opinion on compliance for the PFC program. However, our audit does not provide a legal determination on the Authority’s compliance.
Opinion In our opinion, the Authority complied, in all material respects, with the types of compliance requirements referred to above that could have a direct and material effect on its passenger facility charge program for the year ended June 30, 2017.
holmes & turner A PROFESSIONAL CORPORATION
C E R T I F I E D P U B L I C A C C O U N T A N T S M E MB E R S O F C PA A S S OC I A T E S I N T E R N A T I O N A L , I N C .
1 28 3 N O R T H 1 4 T H S T R E E T , S U I T E 2 0 1 B OZ E M A N , M ON T A N A 5 9 7 1 5 ( 40 6 ) 5 87 -4 265 F A X ( 40 6 ) 5 86 -3 11 1

‐ 83 ‐
October 18, 2017 Gallatin Airport Authority Page two
Report on Internal Control Over Compliance Management of the Authority is responsible for establishing and maintaining effective internal control over compliance with the types of compliance requirements referred to above. In planning and performing our audit, we considered the Authority’s internal control over compliance with the requirements that could have a direct and material effect on its PFC program to determine the auditing procedures that are appropriate in the circumstances for the purpose of expressing our opinion on compliance for the PFC program and to test and report on internal control over compliance in accordance with the Passenger Facility Charge Audit Guide for Public Agencies, but not for the purpose of expressing an opinion on the effectiveness of internal control over compliance. Accordingly, we do not express an opinion on the effectiveness of the Authority’s internal control over compliance. A deficiency in internal control over compliance exists when the design or operation of a control over compliance does not allow management or employees, in the normal course of performing their assigned functions, to prevent, or detect and correct, noncompliance with a type of PFC compliance requirement on a timely basis. A material weakness in internal control over compliance is a deficiency, or combination of deficiencies, in internal control over PFC compliance, such that there is a reasonable possibility that material noncompliance with a type of compliance requirement of the PFC program will not be prevented, or detected and corrected, on a timely basis. A significant deficiency in internal control over PFC compliance is a deficiency, or a combination of deficiencies, in internal control over compliance with a type of compliance requirement of the PFC program that is less severe than a material weakness in internal control over compliance, yet important enough to merit attention by those charged with governance. Our consideration of internal control over compliance was for the limited purpose described in the first paragraph of this section and was not designed to identify all deficiencies that might be material weaknesses or significant deficiencies, and therefore, material weaknesses or significant deficiencies may exist that were not identified. Given these limitations, we did not identify any deficiencies in internal control over compliance that we consider to be material weaknesses. However, material weaknesses may exist that have not been identified.
Purpose of This Report The purpose of this report is solely to describe the scope of our testing of compliance with the results of our testing based on the requirements of the Passenger Facility Charge Audit Guide for Public Agencies. Accordingly, this report is not suitable for any other purpose. October 18, 2017
C E R T I F I E D P U B L I C A C C O U N T A N T S
HOLMES & TURNER

Schedule of Passenger Facility Charge Collections, Interest and Disbursements Year Ended June 30, 2017
‐ 84 ‐
Total TotalJune 30, 2016 1st qtr 2nd qtr 3 qtr 4th qtr June 30, 2017
Collections 21,441,789$ 568,951 580,691 450,645 582,757 23,624,833$
Interest 288,259 473 609 971 1,015 291,327
Disbursements (20,226,351) ‐ (295,993) ‐ (845,993) (21,368,337)
Cash balance 1,503,697$ 569,424$ 285,307$ 451,616$ (262,221)$ 2,547,823$
FY 2017 Activity


LEARN MORE AT WWW.BOZEMANAIRPORT.COM